1. Introduction
Electricity markets are a research and practical topic that has had many applications around the world over the years, entering the fields of distribution, generation, and even transmission with different rules and principles to be applied to each case depending on the final objectives of the application. The two leading groups are the retail [
1] and wholesale electricity market [
2].
Traditionally, the electricity system has been composed of different companies that can do one or more activities related to generation, transmission, distribution, commercialization, and system operations. On the other hand, agencies or governments are in charge of regulating the operations [
3], setting prices, or sometimes monopolizing one or more activities of the electric system. Energy markets decentralize and open the business to investors and consumers to obtain fairer prices, increase performance, clarify transactions, and improve the energy system in technical and economic aspects.
With technology evolving at a fast pace, resulting in more devices that require electricity, it is necessary to implement more advanced equipment in the pursuit of a smart grid capable of adapting to the movable loads, power flows to and from all directions because of distributed generation (DG) [
4], smart metering to allow demand response to and transactions between participants of the electricity market, and software to present data efficiently and quickly [
5,
6].
Approaching generation to loads minimizes the costs of transmission. At the same time, it is necessary to maintain a balance between producers and consumers to establish order and rules and ensure the welfare of all electricity market participants, who all must have correct, up-to-date information to make informed decisions [
7], assuming risks and taking opportunities with all the context that accompanies a market.
A smart grid is a big step towards the implementation of a network over the electricity grid. It makes use of computational intelligence to supervise and manage the system in real time, resulting in a smart grid that interacts with users and is deployable to every smart device [
8] through the use of modern telecommunications technologies and the Internet, considering the necessary cautions against threats and vulnerabilities.
In terms of the economy, the smart grid breaks the monopoly that some companies have over generation or commercialization and also breaks the fact that the electricity market is composed of producers and consumers according to traditional grids, turning them all into participants of the market who can trade with one another [
9,
10,
11].
The usage of different energy sources is, to some extent, changed by the existence of a smart grid because it makes it easier for distributed generation to be implemented on a large scale and operate under secure conditions, bringing benefits to the environment due to emission reduction [
12]. However, at the same time, there is a necessity to deal with the disadvantages of these technologies, such as the need for space and the presence of noise or smell, among others [
13].
New electrical gadgets have caused changes in energy grid equipment, which does not have enough reserve for expansion and changes in control, protection, and administration, in general [
9]. Current loads are no longer those of the past, characterized by static, more predictable utilization, and less harmonic content. Presently, loads are different from the qualities indicated, as shown in instances such as electric automobiles [
5], household and personal equipment, and appliances powered by gasoline before and by electricity now.
Better planning and optimizing of current resources can be done with smart grids, keeping in mind the reduction of costs linked to start-up, shutdown, transmission, and more, with the necessary management, incentives, and regulatory policies to be applied [
14]. However, in contrast, much expenditure is required for the initial construction of smart grids, which can be as big as the capabilities the market desires [
15]; after that, other smaller costs must be taken in for expansion, maintenance, and updating.
Electricity markets have been researched from several points of view, starting from the economics approach [
6,
9,
16,
17], in which the recovery of smart-grid investments is addressed through an electricity market model. Electricity markets have also been researched to merge them with gas and heating markets [
18]. These studies present merely an overview of the energy sector without diving into the detailed field of the electricity market.
From a technical perspective, electricity markets have been studied for distributed generation [
19,
20], where the topic is addressed, taking no consideration of the environment or a transition from conventional generation to distributed generation. There is also the case of [
21,
22] in which demand response is included for the establishment of an electricity market but is only interested in how to charge prices to the consumer and not answering the question of the assignment of energy resources.
In contrast to the above, this research presents an integral approach and a detailed study of the incorporation of an electricity market for a smart microgrid, taking into consideration the environment, economics, and technical issues, including the comparison of different demand-response mechanisms, in a scheme comprising conventional and non-conventional generation, for an analysis made from a complete 24-h period.
In this article, electricity markets with a focus on microgrids (MGs), demand response, generation plants, and carbon dioxide impact are analyzed in
Section 2, the problem is developed and studied in
Section 3, and in
Section 4, a complete analysis is made of the results obtained from simulation. Finally, a conclusion is presented in
Section 5.
2. Electricity Markets and Demand-Response Programs
2.1. Electricity Markets for Microgrids
MGs are among the most appealing alternatives for ongoing research and studies, even when conducted on a smaller scale. Charges and diverse DGs, renewable energy sources, and battery energy storage systems (BESS) are incorporated into MGs. MGs facilitate enhanced energy circulation in distribution networks and diminish transmission line losses. Many academic papers have investigated MGs using various methods, such as the dynamic modeling of linear and nonlinear dynamics, benchmarks, creating more advanced fault-tolerant control systems, and optimization techniques [
23,
24].
Consumers and producers are the key participants in the electrical market. Although participants can be both consumers and producers simultaneously, there are differences in consumers based on the degree to which one or the other they are closer.
For this reason, it is vital to analyze each instance separately. Consumers raise their demand as long as the economic and non-economic benefits acquired surpass the cost of power, resulting in a weak elasticity of electricity demand [
20,
25] as a distinctive market characteristic related to consumer necessities.
People refuse to decrease their life comfort by trying to save tiny quantities of money on electricity bills, which ends up with consumers who, rather than reducing their consumption owing to increasing electricity rates, opt to transfer their demand to hours during which electricity is cheaper [
26].
The electricity market must employ suitable incentives and enough technology across the network to improve and promote the elasticity of the demand side needed for the optimal and manageable operation of the electricity market itself [
27]. This involves a cost–benefit analysis of how much the market wants to invest in these indicated expenses and the goal it intends for its participants.
2.2. Demand-Response Programs
Demand response is a series of actions focused on modifying the energy requirement of users and trying to adapt that pattern to the objectives of the market [
28], which could be reducing pollution, obtaining fairer prices, increasing the usage of a specific type of energy, or even improving network reliability. Economic incentives and punishments are established for electricity usage, which might be adjusted according to the quantity of energy demanded and the hour of the day that energy is demanded, setting higher costs for the hours during which planners wish to lower the demand and vice versa.
One thing that must be kept in mind is that electricity is a tiny elastic market [
29], so demand can be molded up to a point, after which increasing or reducing prices according to the case will cause almost no effect, resulting in a limit for any demand-response program to be established. However, the impacts of one or another demand-response policy are distinct, deriving from the necessity to analyze them to decide the best way to match the aims [
30].
Software estimation must be added to optimize the approach necessary in concordance with energy availability, pollution, and economic conditions, among others [
31]. With these, the optimal alternative to accomplish the goal is selected from among the different possibilities and strategies that may be used in the same situation, which is a massive task without an optimizer or a math processor.
Many demand-response programs have been researched, programmed, and evaluated in this research, beginning with “no-demand response” [
32] in which consumers have no incentives at all, and the demand is precisely specified by the load customers desire to use at any point with no discretion. It is the beginning position from which to proceed to analyze the demand-response strategies and check how helpful they are compared to the initial situation.
One examined demand-response mechanism is establishing a “real-time electricity price” planned by hours to final customers, with this price being high when there is generating scarcity compared to demand and low when generation exceeds demand [
33]. The effect of this strategy is a general displacement of demand from high-demand hours to low-demand hours.
In this case, clients are always informed about current electricity pricing and can take measures accordingly. This method is very organic, meaning it can change demand during different periods of the day because the reduction of demand during peak hours must be satisfied at other hours of the day or night, resulting in the possible creation of new smaller peaks in different periods as people try to adjust their life routines as much as possible. Consequently, these smaller peaks start to generate higher prices than before, and then some people abandon those periods for new, cheaper ones.
The second method studied is called “high-peak prices”, which consists of identifying the demand patterns during the day, locating the peak or peaks to be lowered, and applying a high price to the occurrence hours of that or those peaks, providing at the same time an incentive of lower prices for all off-peak hours [
34]. The difference with the real-time price approach is that high-peak prices focus on reducing demand at specified hours of the day, and no second or third automated steps are done against the production of additional smaller peaks at various other times.
The third strategy is “cheap-at-night prices”, which refers to incentives provided late at night and in the earliest hours of the day, during which historically demand is low [
35]. These incentives cause a reduction in demand during the hours that are not included within the benefiting period, shifting the market to the night. Using this strategy, all electricity usage during the day will be lowered and not simply the peak hours; if it is necessary to focus on peak hours, this method must be supported by a peak-hours policy.
The final method to be analyzed is peak displacement, based on the fact that the central after-dawn peak is the one that needs to be reduced through the application of high rates to that specific peak period and incentives to the hours after the standard end of that peak period, causing a displacement of after-dawn peak, in terms of reducing it and creating an elevation of demand in hours after this peak [
36].
Therefore, using this method, no action is taken over the electricity price of other hours not included within the period evaluated. Still, it might cause a tiny shift of demand during the day, reducing it due to incentives for late-night hours or increasing it due to disincentives during peak hours. However, if correctly applied, these adjustments will only be representative if the rules are focused on peak displacement.
2.3. Generation Plants
Many technologies have been developed through the years for electricity generation to take advantage of all energy sources imaginable, each with its advantages and disadvantages [
37]. In this study, various generation plant types have been included due to being part of the most used and common ones in terms of smart microgrids [
25,
38,
39]. However, any energy generator could be incorporated or replaced in future investigations.
Thermal power plants receive their input energy from many different sources such as combustion gases, steam, or expanding gases, which in turn are obtained from processes that have energy input from fuel oil, natural gas, and coal, among others, all of them with different efficiencies, waste heat, and pollutant byproducts [
40,
41]. The emitted pollutants that are accountable for environmental degradation by burning this generator fuel are represented by (
1).
When talking about prices for thermal power plants, they are determined through a second-order equation in terms of the generator power output (
2).
Equation (
2) is utilized for any other generator form for simulating prices.
These kinds of generators make use of sunlight to produce electricity through the use of photovoltaic modules, also called solar panels, with the possibility of having an additional solar tracking system to give the best orientation possible to the panels towards the Sun to make the best of solar energy [
42]. The equation of the power generated by a photovoltaic plant is represented in the following Equation (
3). Other components are required in a photovoltaic power station, such as a solar inverter, which converts the direct current generated from panels to alternating current necessary to incorporate the panels into the traditional transmission or distribution systems; other components are those required for cabling, mounting, and accessories [
43].
Biomass is a fuel constituting organic elements such as forest trash, waste from food crops, manure, or even explicitly developed energy crops; the equation of the power generated by a biomass generator is represented by the following Equation (
4).
This renewable organic waste is burned to produce steam that runs a turbine to generate electricity [
13]; the waste used is considered carbon neutral and is classified as a renewable energy source because photosynthesis uses carbon dioxide for new crops, making biomass an environmentally friendly use of waste that would otherwise be openly burned, dumped in landfills, or in general not properly discarded [
44].
Battery energy storage power stations: These power stations use groupings of batteries to store energy as required. Batteries are generally charged during low-cost electricity hours and sent during high-cost hours. Batteries offer essential support to adopting renewable energies since they may give stability to the grid, voltage and frequency regulation, reliability, and responsiveness, delivering benefits to the electrical market as important participants [
45].
The battery’s state of charge is modeled over time through (
3).
2.4. Emission of Pollutants to the Atmosphere
Thermal power plants are representatives of conventional polluting generators; for this reason, they must be evaluated from the point of view of contamination produced to investigate and conduct actions in favor of the environment.
The primary byproducts of thermal generating include carbon dioxide, carbon oxide, sulfur oxides, nitrogen oxides, organic gases, coal-powered generators, fly ash, mercury, and other metal traces [
46]. These contaminants are handled or emitted according to the applicable legislation of each country.
The worry is that most of the electricity utilized globally originates from thermal power plants; many are used as baseload power plants, and others as peaking power plants [
47]. Notably, in recent years, many thermal power plants planned to be baseloaded are now functioning as dispatchable production to give room for the variable generation of renewable energy.
The mean efficiency of a thermal power plant is roughly 38%, and up to 60% when in combination with cyclic gas-fired facilities. When running at nominal capacity, thermal power plants can obtain these efficiency figures, dropping those values when the operational point deviates from the nominal [
48,
49].
Emissions lead to global warming, which impacts our planet and the life on it; additional repercussions are acid rain and air pollution. Particular concerns in the case of coal are produced in more significant numbers because, owing to the chemical composition of coal, it is difficult to remove impurities before burning it.
Until recently, it has been impossible to replace a significant number of traditional generation methods because these kinds of plants have advantages over renewable energies in terms of enormous capacity, installation versatility in some places where there is no possibility for renewables on a grand scale, the necessity in some instances of employing these plants for serving to big loads, or as voltage-frequency regulators for critical points of the network, or to provide reliability and availability of electrical energy [
50].
Considering this, it is currently almost impossible to eliminate thermal power plants in a network. Still, with the proper application of electricity markets, some rules can be established for providing a more significant market share to thermal plants that are less pollutant, reducing emissions, encouraging plants to improve their efficiency, and taking measures to minimize contamination produced by their operation.
Establishing a preference for power usage from cleaner sources generates a fair, environmentally friendly competition among plants, which, in their desire to acquire a higher portion of the market, make constructive efforts to lessen their contamination [
13]. The idea is that all plants are paid for in terms of reliability and availability. Still, energy is gradually required, beginning with the less-pollutant plants. In case of absolute necessity, the most contaminated ones are summoned, following a confirmed environmentally friendly ranking.
Top price limits must be established for thermal power plants, which will vary from generator to generator depending on a particular conducted study and periodic audit, to determine their range of contamination and environmental responsibility, making it possible to increase the top limit price if decisive actions in favor of the environment are taken and, on the other hand, reducing the maximum limit price if, over time, no action is taken.
3. Problem Formulation and Methodology
This research addresses the development of an electrical market model with a collection of vital and actual issues that have yet to be explored and combined as the primary objectives for administering hierarchical energy resources to be employed in a smart grid.
Following hierarchical energy resources theory, environmental care is the first subject and primary objective to be considered. Presently, in many cases, the electricity system needs to be respected and conserved as it should be, bringing to the discussion one of the main polluting participants worldwide, namely thermal generators, and in particular those that are the most inefficient and unconcerned about the environment.
The energy market model of this research is generalized and based on a retail model. It guarantees good performance, competition, innovation, and price efficiency. This characteristic will allow it to respond to scenarios, modifying its values in generation and the demand curve according to the scenario to be studied. It provides a globally beneficial approach.
Generators included in the electricity market can make their offers of a certain amount of electricity with a price that an equation could model since generation costs are not linear, thus making this a stock-exchange scenario; on the other hand, consumers pay a differential tariff depending on the price of electricity fixed by the market in accordance with the demand-response mechanism implemented.
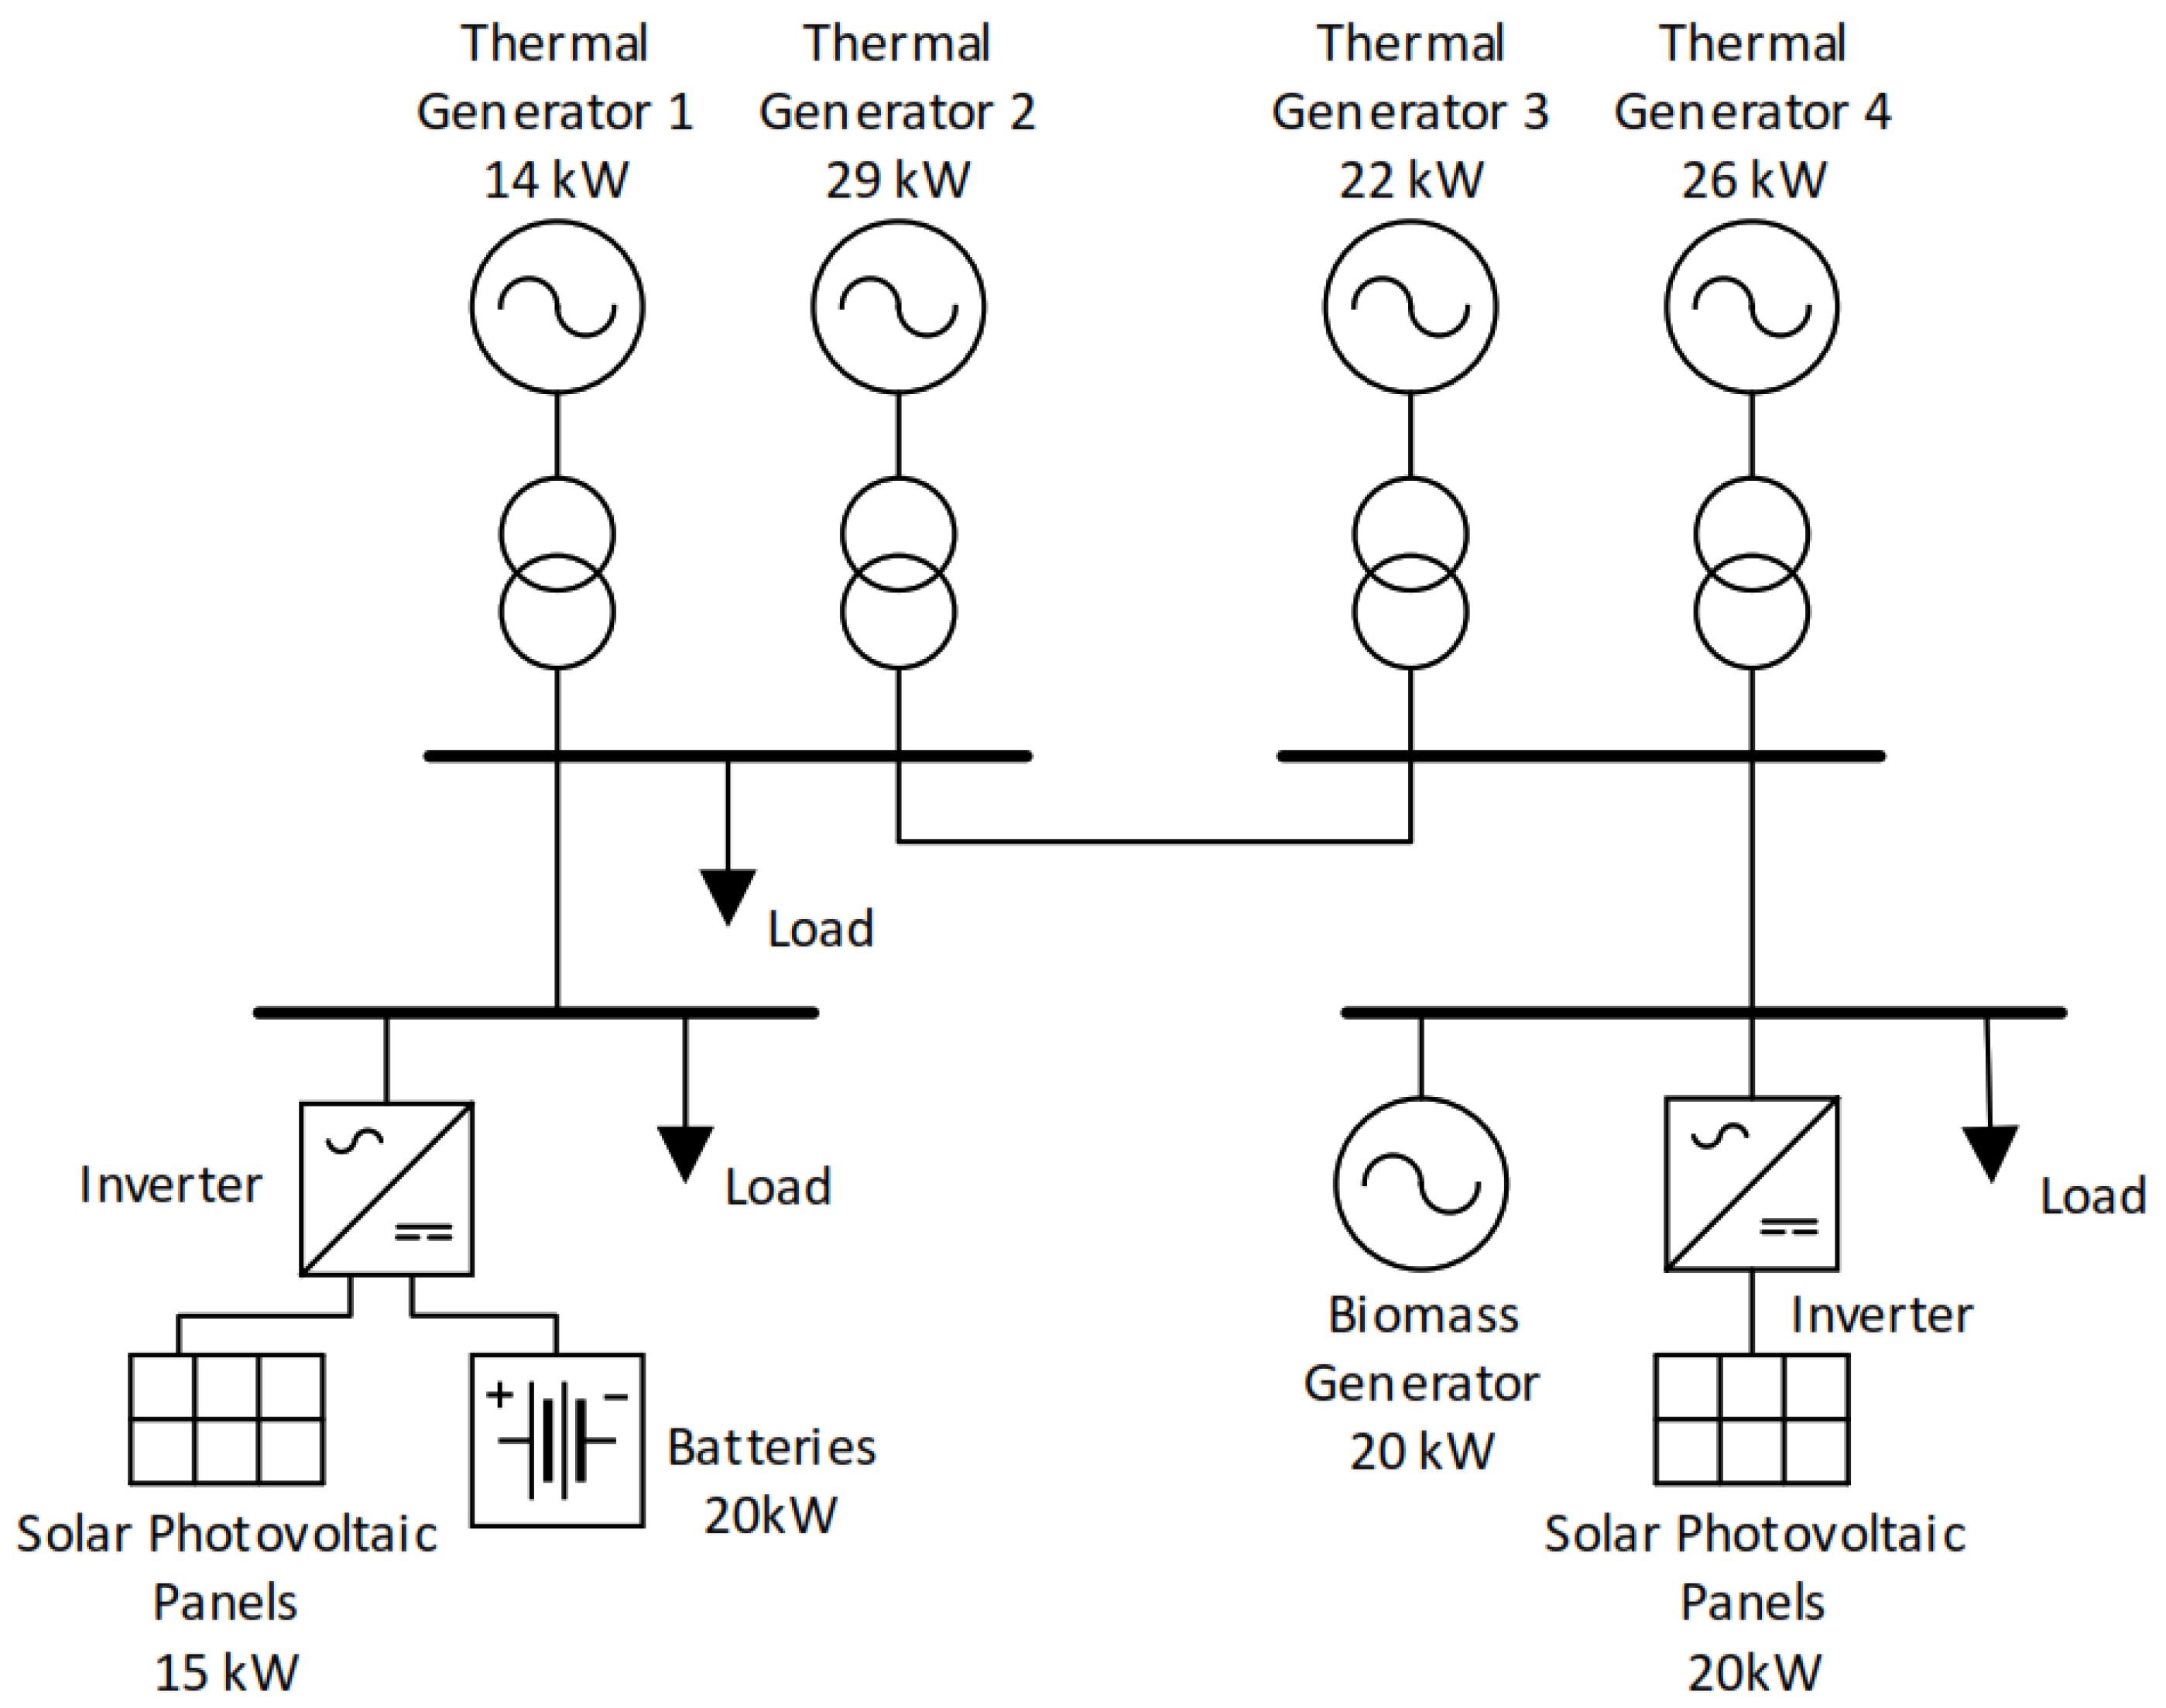
The power market model involves different distributed generation methods such as solar photovoltaic, biomass, and battery energy storage. Conventional generation is also incorporated by utilizing four types of thermal generators, each with its efficiency and cost.
Additional data and constraints for renewable generators are established as, for example, minimum and maximum power to be generated, and in the case of battery energy storage, they are set parameters such as the maximum and minimum state of charge, maximum and minimum rate of charge, and discharge; and power losses for charging and discharging.
Referring to the specific case of conventional thermal generators, the limits of maximum and minimum power to be generated do not refer to the total capacity of that particular generator. Still, it relates to the generation amount that the machine can and is willing to provide to the MG in
Figure 1.
Thermal generators, each with its price characteristics, result in generators that could be cheaper at a specific rate of generation and relatively more expensive at a different rate.
MG is geared to be used in a scheme composed mainly of residential users with a traditional daily demand pattern that includes the primary peak hours of consumption during the early hours of the night. Therefore, a daily demand curve with these features is employed for analysis.
Solar photovoltaic generation takes advantage of the Sun’s radiation during daylight hours, which have been deemed for this work to be from 6:00 to 18:00; outside this period, solar radiation is considered to be zero, so no electricity is gained from this source
Table 1.
The MG studied in this case carries the consideration that biomass is not enough and not worthy of generating electricity at nominal values during an all-day period; a biomass electric generator is designed to operate from 17:00 until 23:00, which is the principal peak in demand. The rest of the time, this generator produces just 10% of its nominal capacity to avoid shutdown. This condition is required because this generator works by burning biomass; consequently, a significant amount of time must be essential to start generation after a shutdown. Therefore, it is necessary to keep this sort of generator open.
Battery energy storage technologies are incorporated into the current inquiry to aid in engaging power availability to demand procurement to save low-cost energy generated during low-demand hours and dispatch it during high-cost hours. There are constraints related to the maximum storage capacity of batteries until which batteries can be charged and no more, but also, on the other hand, minimum storage capacity restriction because a battery cannot be discharged to zero; for this reason, it has been established that the minimum limit of storage capacity represents 40% of the maximum limit.
Smart microgrid demand is simulated through random variables using a normal distribution with the mean and standard deviation provided; the same technique is utilized for acquiring solar radiation patterns and biomass output.
The electricity market model has been built so that distributed and conventional generations engage in the market to fulfill the demand daily with an hourly analysis of demand and generation.
Additionally, demand-response mechanisms are studied and applied separately to the same electricity scenario once all variables have been established; these DR mechanisms are Real-Time Price, High-Peak Price, Cheap at Night, Peak Displacement, and the base case of No Demand Response to compare the different mechanisms among them and concerning the original case of no demand response.
Optimization is performed in the software GAMS, 46.1.0 which uses the imported data from Matlab R2018b. Once the optimization is complete, the results are transmitted back to Matlab for presentation. GAMS performs one optimization for each case of the demand-response mechanism, prioritizing renewable distributed generation to serve the load. After that, it allows participation in thermal generators starting from the most environmentally friendly, with the final objective of reducing the contamination caused by conventional generation to the minimum.
For these reasons, the optimization issue is, in actuality, a minimization, and it is formulated as a quadratically constrained problem due to quadratic equations included for the purpose of establishing pricing for heat generation as shown in Algorithm 1.
Thermal generators are not only paid for the energy they dispatch. They are also paid a fixed price for availability and dependability for the grid. Moreover, they are incentivized for CO
2 emission reduction because they can access a priority dispatch of their energy if they take suitable activities in favor of the environment.
| Algorithm 1 Application of electricity market model to demand-response mechanisms |
- 1:
Initialize: - 2:
Calculate: Record: - 3:
- 4:
Go to Step 3
|
4. Analysis of Results
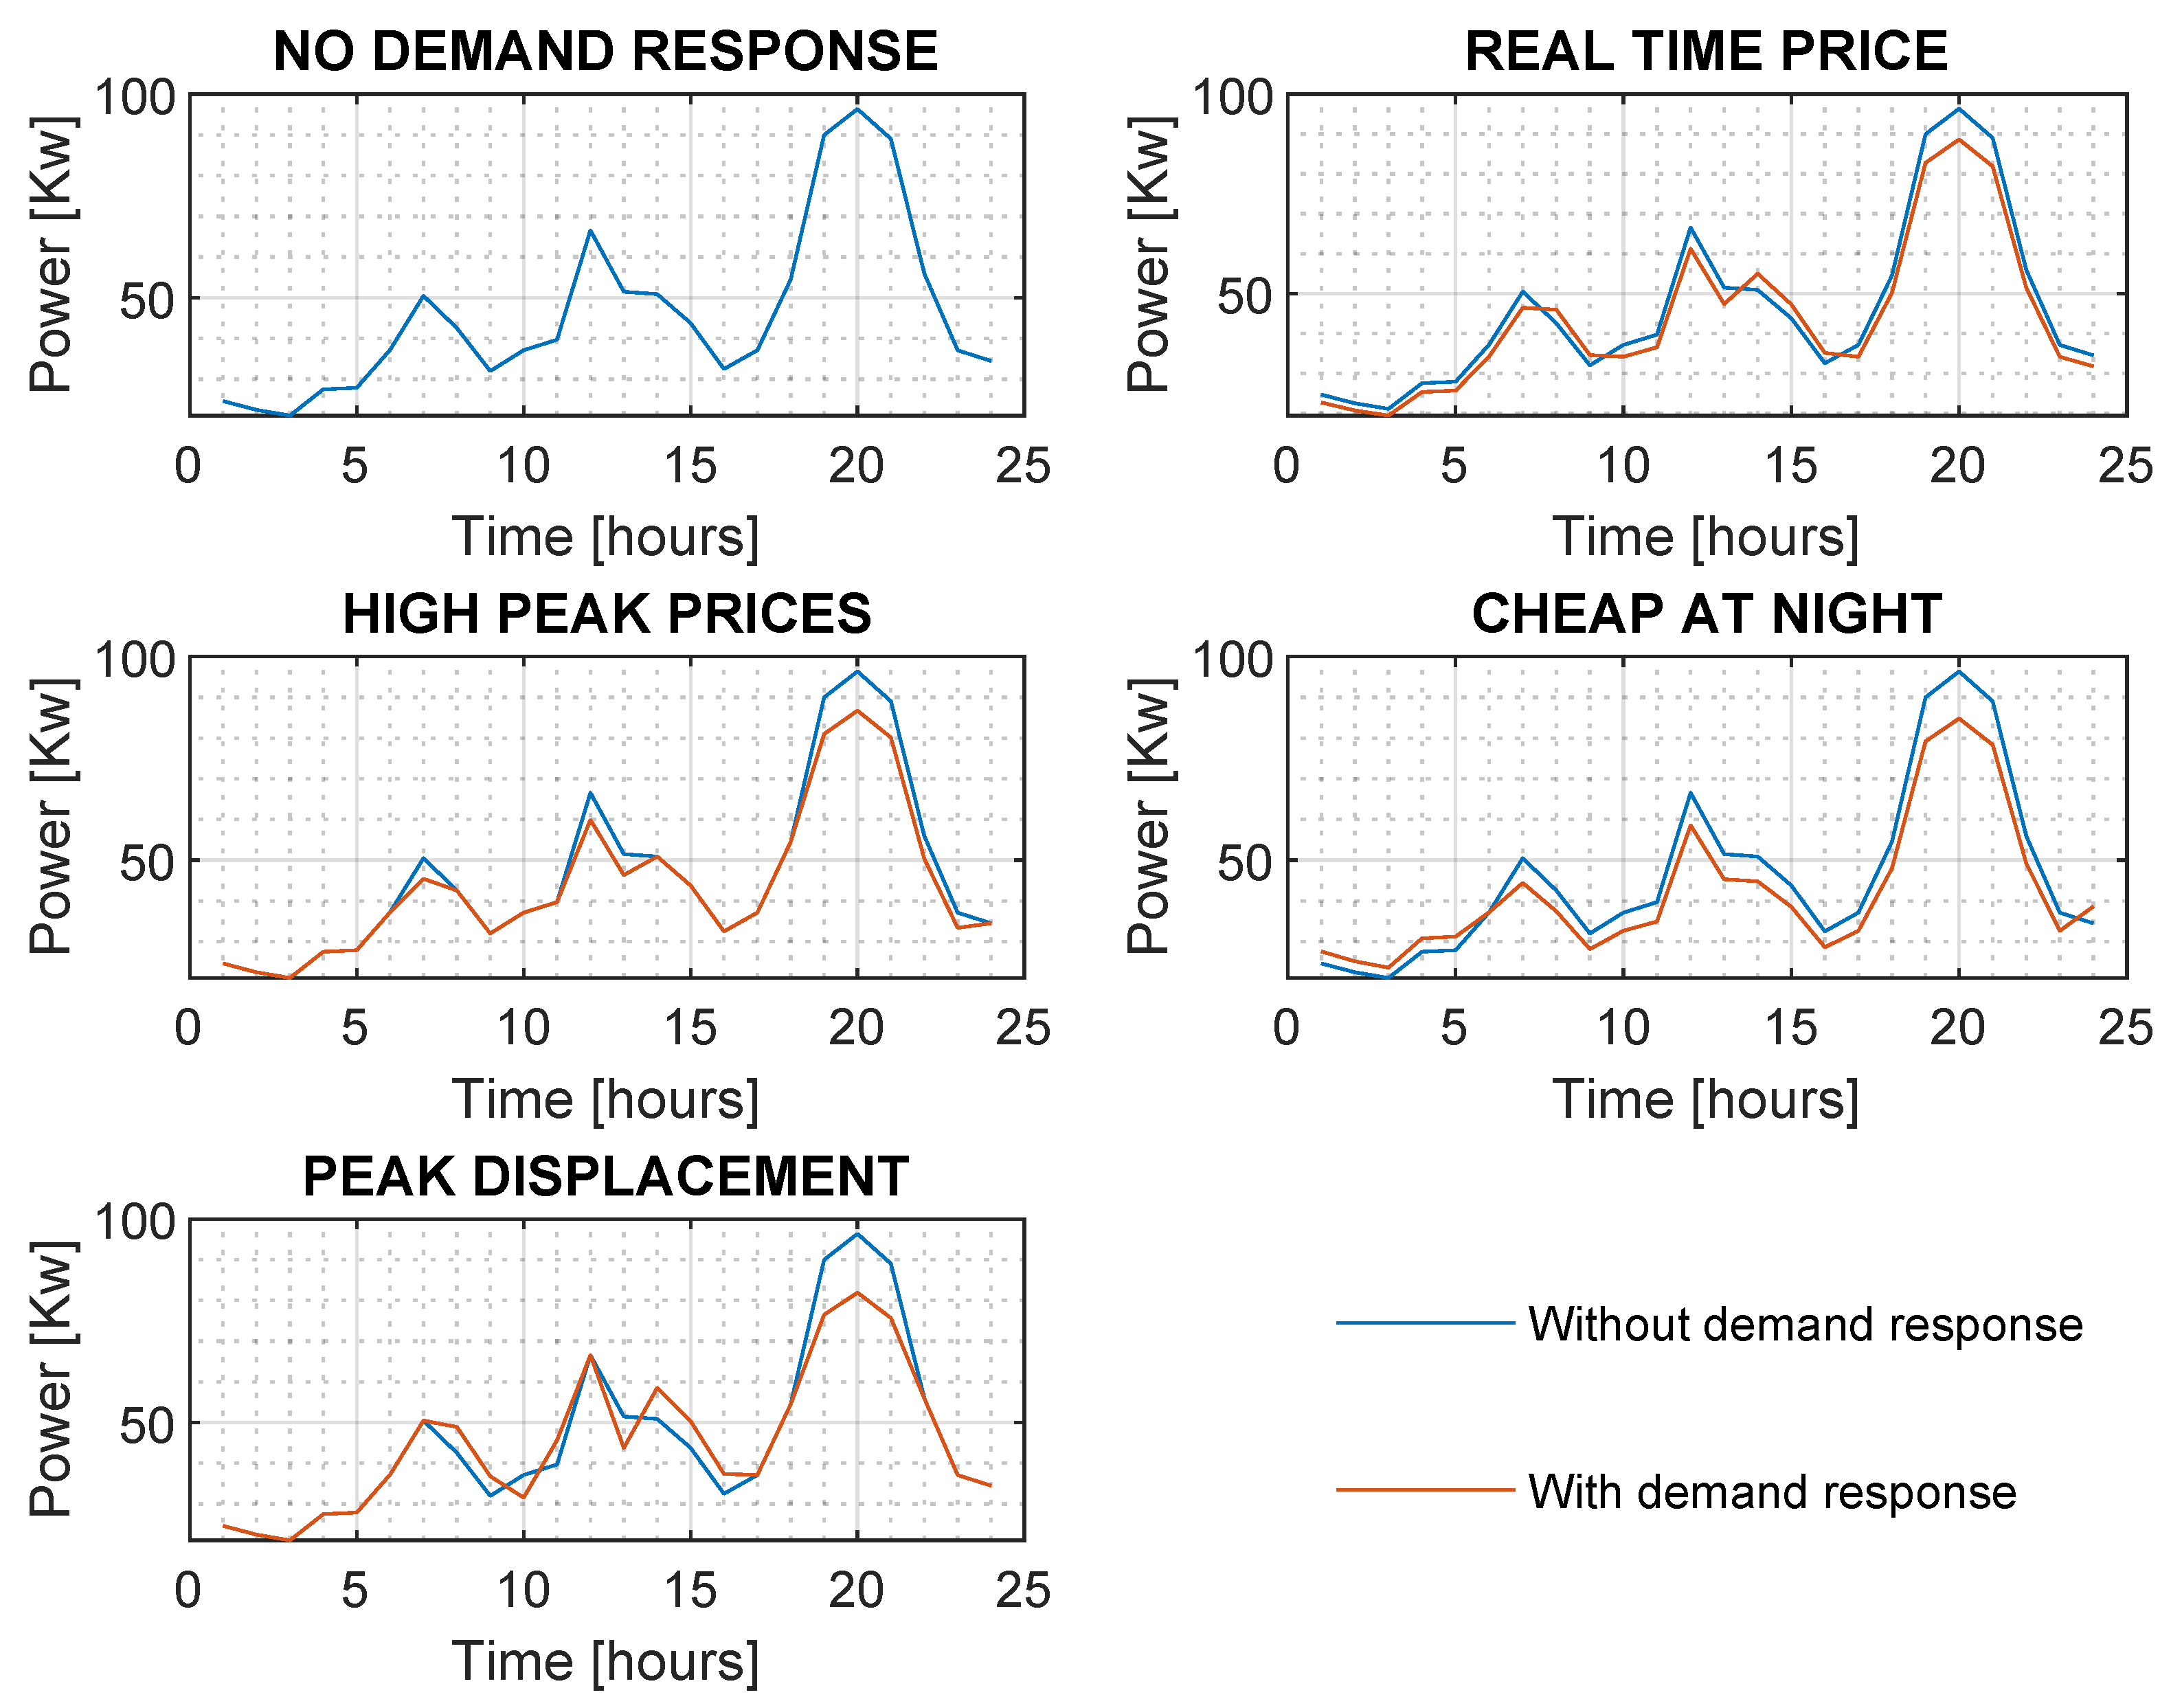
Once the load draw has been conducted in Matlab, using a random normal distribution with its appropriate mean and standard deviation, those data are transmitted to GAMS for optimization. This optimization is completed independently for each demand-response mechanism to decrease environmental pollution. Each demand-response mechanism results from the demand made by consumers, according to the incentives or penalties offered; accordingly, diverse patterns of demand are obtained, represented in
Figure 2.
As shown in
Figure 2, the no-demand response has notorious variances concerning the demand received from all demand-response mechanisms. First, it is known that the no-demand response has the most significant peak throughout after-dawn hours; the other mechanisms have this peak lowered, with high-peak price being the one that has the most considerable reduction. The peak displacement obtained by the high-peak price mechanism may also be noted; in this example, this peak has relocated in part to late at night.
Referring to the last hour of the night and first hours in the morning, it is evident that the no-demand response mechanism has the lowest demand during this period, and this is because this mechanism does not take advantage of reorganizing demand to these hours in which, when using demand-response mechanisms, demand from congested hours is in some way distributed to this traditionally low-demand period. The cheap-at-night policy is the one with the best performance in this regard.
During the rest of the day, not included in the hours indicated above, the no-demand response mechanism has a demand that is in the middle of the findings because of the distinct behavior each mechanism prompts in consumers.
Figure 3 shows how much money is paid each hour to each thermal generator. Thermal Generator 1 is the most environmentally friendly thermal generator and, therefore, has the highest priority of dispatching among thermal generators, followed by Thermal Generators 2, 3, and finally 4, which is the most contaminating one and has the lowest priority of dispatch.
It can be noted that Thermal Generator 4 is only sent when a no-demand response policy is implemented; this is necessary for the significant peak period in which renewables and the other thermal generators are not adequate to meet the demand. In contrast, when any demand-response mechanism is present, it is possible to avoid using Thermal Generator 4 due to demand redistribution.
Thermal Generator 4 and the other thermal generators are paid regardless of whether they do not dispatch because they are paid for availability (
Figure 3). Moreover, they have an extra payment for their generation for reliability due to the inertia they can provide to the system, accompanied by frequency control, voltage control, and the rest of the ancillary services they can accomplish.
The hourly dispatch of all conventional and non-conventional generators can be seen in
Figure 4, accompanied by electricity demand shown on the lower side of the horizontal axis. In this figure, the participation of renewable generators during the day can be noticed, e.g., the case of solar generators, which provide energy during daylight hours, or the case of biomass generators, which are always dispatching. Still, during the peak hours, it reaches generation values close to the nominal. Out of this period, it generates the minimum possible to avoid shutdown.
An essential involvement outcome of optimization of resources available regards battery energy storage and dispatch, which is shown in
Figure 4, where it is depicted that batteries take advantage of the hours in which contaminant energy production is not so much required for their charging, then using this charge to release energy in critical hours when more polluting thermal generators are going to be needed, avoiding their dispatch or at least reducing the energy required from them.
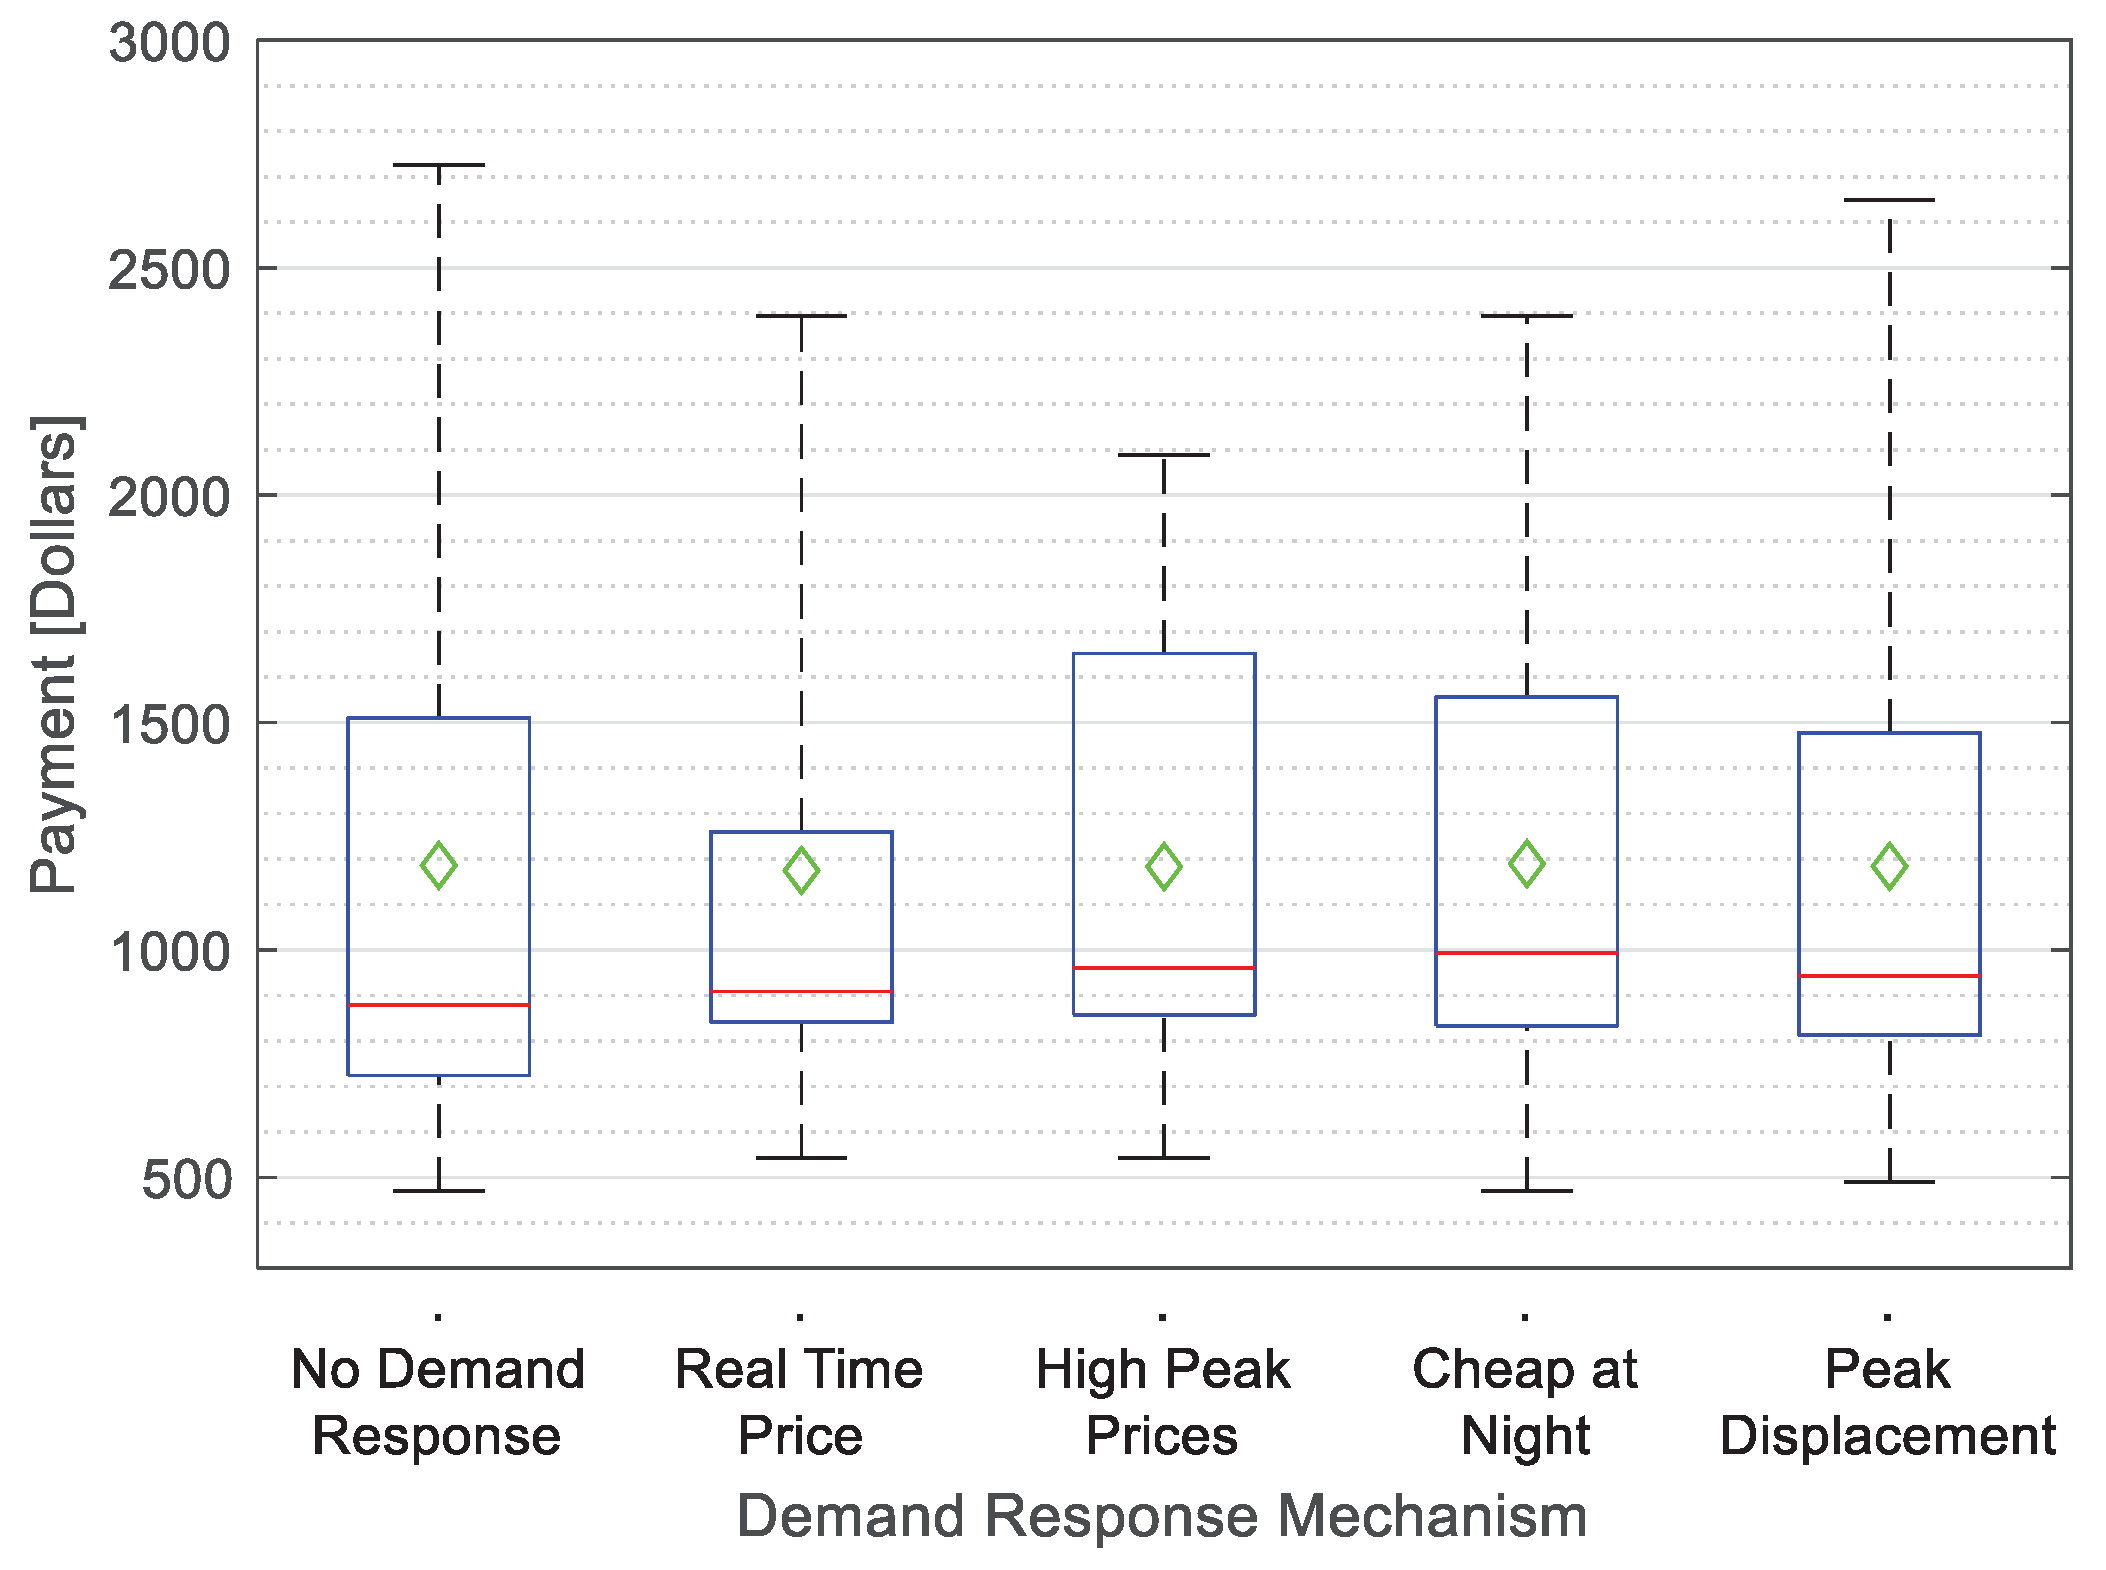
Figure 5 comprises a boxplot of hourly payment for the electricity utilized for each demand-response mechanism during a day, noticing that mean prices to the user are virtually the same for every case, reporting a maximum variation of 1.5% between mean prices of different demand-response methods. At the same time, the variance estimated for each set of costs of DRM indicated in
Figure 5 demonstrates that the no-demand response policy has the highest variance of all, which has a difference of 29.75% in terms of high-peak pricing policy, this being the slightest variance of all.
It can also be seen in
Figure 5 that the hourly prices are distributed according to the demand response technique used, producing, in some cases, upper and lower quartile variations than others indicated in the blue box. This graph shows the different strategies and policies of each DRM that shape the hourly prices during the day in a particular way.
Figure 6 displays each DRM’s thermal generator emissions for one day. As indicated in this graph, the reduction of emissions is considered the first instance of NDR, which is the only one that demands the activation of the worst-polluting thermal generator (Thermal Generator 4) during peak hours. This issue is avoided by adding any DRM, eliminating the substantial amount of extra contamination this generator produces.
During the day, the reductions of contamination for each DRM, which have been obtained as a product of the optimization of the use of energy resources and policies applied, are recorded. They result in a more significant usage of renewable energy through an adequate administration supported by the involvement of consumers due to the right incentives and encouragement offered.
Table 2 shows numerical results for each example of DRM, clearly according to the results achieved by the preceding figures. It is highlighted that the no-demand response has a higher quantity of total thermal emissions, leading to the possibility of applying any DRM in favor of the environment. In economic terms, most DRMs report an advantage of cheaper pricing compared to the no-demand response policy. The cheap-at-night policy is the only one with a higher total electricity price.
5. Conclusions
The electricity market modeled in the current investigation, its optimization, math processing, tables, and graphs of results successfully address the topic and show a possibility of achieving a more sustainable energy market using different policies from which the environment and the public benefit through emission reduction, incentives to public energy patterns of consumption, and incentives to generators to improve their efficiencies at the same time as reducing their emissions.
In terms of the economy, the usage of different demand-response mechanisms has resulted in a decrease of approximately 1.00% in the total daily price of power, which, accumulated over a more extended period, such as a month or a year, might reach a significant absolute value of savings. It is also interesting that the variance of hourly power prices during a day has been reduced by 29.75% in the best scenario utilizing DRM, which decreases the volatility of electricity prices when those values are transferred to the user.
The results of this investigation are a great support to Goal Eleven: Sustainable Cities and Communities, stated by the United Nations with a scope of 2030 for adequate development, paying particular attention to the target of improving air quality and municipal and other waste management, all of which has been directly addressed in the present research. Moreover, through the study of the excellent influence of DRM, it has been demonstrated as a powerful instrument to the public, in general, to contribute to upgrading the well-being of the planet and its inhabitants from the comfort of their homes.
Environmental sustainability through the adequate use of energy and natural resources is one of the main objectives of this investigation, in which it has been proven that a substantial reduction of up to 1.70% in emissions to the atmosphere when the proper policies and decisions are taken for the environment’s well-being. This is an essential contribution to the “Planetary Boundaries”, many of which have already been surpassed with severe consequences to life on Earth. The reasoning, policies, statements, and results provided in this work point to the final objective of communities and humanity as a whole, which is not just capital but our home planet’s sustainability.


