Concept Paper

‘Greening’ an Oil Exporting Country: A Hydrogen, Wind and Gas Turbine Case Study

by
Abdulwahab Rawesat
* and
Pericles Pilidis
*
Thermal Power & Propulsion, SATM, Cranfield University, Bedfordshire MK43 0AL, UK
*
Authors to whom correspondence should be addressed.
Energies 2024, 17(5), 1032; https://doi.org/10.3390/en17051032
Submission received: 8 September 2023 / Revised: 10 January 2024 / Accepted: 12 February 2024 / Published: 22 February 2024
(This article belongs to the Section A: Sustainable Energy)

Abstract

:
In the quest for achieving decarbonisation, it is essential for different sectors of the economy to collaborate and invest significantly. This study presents an innovative approach that merges technological insights with philosophical considerations at a national scale, with the intention of shaping the national policy and practice. The aim of this research is to assist in formulating decarbonisation strategies for intricate economies. Libya, a major oil exporter that can diversify its energy revenue sources, is used as the case study. However, the principles can be applied to develop decarbonisation strategies across the globe. The decarbonisation framework evaluated in this study encompasses wind-based renewable electricity, hydrogen, and gas turbine combined cycles. A comprehensive set of both official and unofficial national data was assembled, integrated, and analysed to conduct this study. The developed analytical model considers a variety of factors, including consumption in different sectors, geographical data, weather patterns, wind potential, and consumption trends, amongst others. When gaps and inconsistencies were encountered, reasonable assumptions and projections were used to bridge them. This model is seen as a valuable foundation for developing replacement scenarios that can realistically guide production and user engagement towards decarbonisation. The aim of this model is to maintain the advantages of the current energy consumption level, assuming a 2% growth rate, and to assess changes in energy consumption in a fully green economy. While some level of speculation is present in the results, important qualitative and quantitative insights emerge, with the key takeaway being the use of hydrogen and the anticipated considerable increase in electricity demand. Two scenarios were evaluated: achieving energy self-sufficiency and replacing current oil exports with hydrogen exports on an energy content basis. This study offers, for the first time, a quantitative perspective on the wind-based infrastructure needs resulting from the evaluation of the two scenarios. In the first scenario, energy requirements were based on replacing fossil fuels with renewable sources. In contrast, the second scenario included maintaining energy exports at levels like the past, substituting oil with hydrogen. The findings clearly demonstrate that this transition will demand great changes and substantial investments. The primary requirements identified are 20,529 or 34,199 km2 of land for wind turbine installations (for self-sufficiency and exports), and 44 single-shaft 600 MW combined-cycle hydrogen-fired gas turbines. This foundational analysis represents the commencement of the research, investment, and political agenda regarding the journey to achieving decarbonisation for a country.

1. Introduction

The urgency, global nature, and necessity for substantial investments in decarbonisation are widely recognised [1,2]. These investments are crucial to preserve the significant progress achieved over the past century in reducing global poverty [3]. Hence, environmental preservation, sustained economic growth, and the wise use of natural resources are inextricably linked. Major investors are already gearing up for this transition [4]. The philosophy of concurrent economic and environmental sustainability, the recognition of the issue’s global nature, and the urgency to engage young talent are paramount [5]. Collaborative efforts spanning multiple sectors in large economic entities can yield significant economies of scale and experiential learning. This necessitates comprehensive and coordinated transition strategies that span across many economic sectors. In this study, a knowledge gap is addressed by introducing a novel technophilosophical approach [6], providing a clear understanding of the challenges and requirements, thereby informing these strategies. A comprehensive and quantitative country-level replacement analysis of this kind has not been previously reported in the public literature.
Libya, a leading oil exporter and the home country of one of the authors, has been selected, here, as a case study for achieving decarbonisation by 2050. A key question for an oil exporter is how to decarbonise and, simultaneously, create energy-based wealth for its citizens and the world. Given its size and the planned replacement of hydrocarbon exports with green energy, Libya is a suitable candidate for such an evaluation, permitting an analysis that is both useful and representative. The volatile political situation in the country posed challenges in selecting a baseline for the study. However, in hopeful anticipation for the country’s journey towards achieving peace and prosperity, national and international data were accessed to estimate future energy demands and daily consumption patterns [7,8,9,10,11,12].

2. Renewable Energy Decarbonisation

Many decarbonisation studies have been carried out. However, no evaluation was performed at a country level or comprised a full replacement of socioeconomic benefits encompassing economic growth considerations in the timeframe of the move away from using fossil fuel energy. The studies found were sometimes for individual populations or economic units, and sometimes regarding generation methods. The focus of the present study is on wind energy alone, but a search is conducted for a range of decarbonisation methods.
Combining solar heat and photovoltaics emerges as a promising avenue for industrial decarbonisation, emphasising an optimal integration for an enhanced performance, cost-effectiveness, and environmental impact [13].
In Italy, the transition to 100% renewable energy presents challenges met by proposals such as utilising energy-dense polysaccharides for storage. High installed capacities of renewable power plants and energy storage systems have become focal points, alongside exploring consumers’ willingness to pay for green energy [14]. Global studies spanning California, Wisconsin, and Germany underscore the significance of a balanced portfolio of zero- and low-carbon resources.
The primary focus is placed on the achievement of cost-effective electricity generation and the reduction in carbon emissions. This includes addressing challenges related to integrating renewable energy into existing systems and understanding the impacts on electricity rates, grid stability, and local industries [15]. Power-to-gas systems play a crucial role in absorbing excess renewable electricity, particularly in Germany, where they capture surplus wind and solar power. The integration of these systems with natural gas grids is deemed essential for the large-scale integration of renewable energy [16]. In the United States, the MARKAL nine-region model analyses various technology options for decarbonising the power sector, emphasizing the technical feasibility of reducing greenhouse gas emissions. Through this analysis, insights are gained into the influence of different policies on the electricity generation mix, emissions, and costs, enabling informed decision making [17,18]. When examining policies for the resilient decarbonisation of the power sector in the United States, a tradeable performance standard and a hybrid clean electricity standard emerge as advocated solutions. These solutions are highlighted for their cost-effectiveness and the urgent need for significant cost reductions in zero- and near-zero-carbon technologies [19]. Strategies for managing variable electricity loads in wind and hydrogen systems take centre stage, particularly in the context of a wind farm in Spain. Comparative analyses that encompass wind–hydrogen systems and battery storage provide valuable insights into addressing the fluctuations in renewable energy production [20]. The importance of heat pumps in decarbonising heating systems is emphasised, with a specific focus on their potential for reducing CO2 emissions in China. The integration of air-source heat pumps into district heating systems and the replacement of urban central heating systems with heat pump heating are proposed as means to achieve sustainable outcomes [21].
In smart cities in China, the role of electrolytic hydrogen in integrating with distributed renewable energy sources is explored. A focal point is the cost-competitiveness of electrolytic hydrogen production using wind power, along with its potential contributions to industrial transformation and sustainable development [22]. Hydrogen, positioned as a versatile energy carrier, takes centre stage in discussions surrounding the decarbonisation of oil-exporting nations, offering solutions to leverage untapped hydrocarbon reserves and stabilise grids in regions with renewable resources [23].
Strategies for decarbonisation and the integration of renewable energy into West African nations are examined through Energy PLAN modelling. The synergy between natural gas and renewable energy sources is emphasized, and the impact of cross-border electricity trading on generation costs and carbon emissions is discussed [24]. The potential for renewable electrolytic hydrogen in Algeria is assessed, with a specific focus on solar photovoltaic and wind resources. Feasibility discussions revolve around the use of solar energy for hydrogen production and the optimisation potential of wind power for electrolysers [25]. Power-to-hydrogen projects in Morocco are scrutinised, simulating hydrogen production from wind and photovoltaic plants. Comparative assessments that consider production rates and costs shed light on the potential of wind-based hybrid energy systems [26]. Studies exploring the intersection of wind energy and hydrogen production in Iran delve into assessing the potential of wind power for electricity and hydrogen generation. Strategic locations for harnessing wind energy and producing hydrogen are proposed to achieve sustainable outcomes [27]. A critical review evaluates the challenges associated with alternative vehicular fuels, including electricity, hydrogen, and biofuels. The discussion centres on the restrictions, such as the scarcity of resources, difficulties associated with infrastructure, and the expenses linked to battery-powered and fuel-cell-powered vehicles. The potential of biofuels is examined, considering the availability of feedstock and the dilemma of food versus fuel [28]. The primary focus is on the decarbonisation potential of sustainable propulsion for road transportation. This exploration encompasses the utilisation of renewable fuels, e-fuels, hydrogen, and electric vehicles to achieve carbon-neutral mobility. Special attention is given to the comprehensive data regarding the techno-economic performance of alternative fuels [29]. In the context of Uzbekistan’s cement industry, the studies concentrate on evaluating the decarbonisation pathways. These routes include carbon capture, storage, and utilisation; the use of alternative fuels; electrification; and the integration of waste heat. Techno-economic assessments are conducted to analyse the performance and cost of various decarbonisation systems, thereby providing valuable insights into the challenges and opportunities for the cement industry [30,31].
Thus, the analysis carried out here stands out because of its holistic approach encompassing national and multi-economic sector coverage. Notwithstanding the assumptions and simplifications, it offers a holistic view of decarbonising a country. The authors highlight that the single-source (wind energy) electrical supply is intended for visualisation purposes. The authors aim to examine the magnitude of the requirements resulting from wind energy decarbonisation. The results are offered for illustration, without a recommendation for this single-source solution. A similar study was conducted by the authors for solar energy [32], and the next step is to combine the two in a single, holistic analysis.

3. Analysis Method

The present analysis can be divided into six steps. The first three steps focus on the process to define energy demand patterns. The final three aim to match the demand and supply. The first step is an evaluation of the energy needs of the country in 2050, assuming a continuation of present trends, with a great emphasis on hydrocarbon fuels. The second step is the evaluation of the energy requirement to provide (via hydrogen and electricity) the same 2050 social and economic benefits using energy sources that do not emit carbon. The third step uses present daily and seasonal consumption patterns to produce the estimated equivalent and decarbonised daily and seasonal consumption patterns for 2050. The year is assumed to consist of four seasons, each represented by 91.25 ‘standard’ days of 24 h. This third step includes adjustments to ensure that the daily and seasonal energy consumption patterns match the annual scenarios of step 2. The fourth step is the collection of information to evaluate the wind energy potential in different geographical areas of the country. The fifth step is the conversion of this energy potential into electrical power and hydrogen from electrolysis using up-to-date equipment information. This includes the performance of wind turbines, electrolysers, storage requirements, global transmission requirements, etc. The sixth step is an iterative process where the (wind energy in this investigation) single-source energy supply is adjusted to meet the energy demand of the country.
Two scenarios were examined. In the first, the energy demand was matched for a critical season, and in the other seasons, some energy (hydrogen in this case) exports were made. In the second scenario, the energy demand included hydrogen exports to replace oil exports on the same basis; in the present analysis, this was 2100 PJ of the hydrogen calorific value.
A holistic and quantitative country-level replacement analysis of this kind has not been found by the authors in the public domain. In hopeful anticipation of the country finding a path to peace and prosperity, national and international data were used to estimate future energy demands and daily consumption patterns.

4. Energy Demand Prediction for Libya in 2050

The premise of the present study was to evaluate the installation of wind farms utilised to their maximum capacity considering wind availability, equipment performance, and operational factors. Wind energy is one of many possible greening alternatives and the objective here was to present a view of the outcomes of this single scenario, not to offer it as the best solution.
The first three steps of the six-step method described in the introduction relate to establishing energy demand patterns. These are outlined here. The first is an evaluation of the energy needs of the country in 2050, assuming a continuation of present trends, with a great emphasis on hydrocarbon fuels. The second step is the evaluation of the energy requirement to provide (via hydrogen and electricity) the same 2050 social and economic benefits using energy sources that do not emit carbon (Table 1). The third step uses present daily and seasonal consumption patterns to produce the equivalent and decarbonised daily and seasonal consumption patterns for 2050. The year is assumed to consist of four seasons, each represented by 91.25 ‘standard’ days of 24 h (Figure 1). This third step includes adjustments to ensure that daily and seasonal energy consumption patterns match the annual scenarios of step 2.
Through the material on the Libyan Oil Industry [35,36] and the publications on the use of renewable energy [37,38,39], It was possible to estimate the Libyan energy demand and daily and seasonal consumption rates. These are shown in Column 1 in Table 1 (2020 scenarios) and Figure 1. From an analysis of the age demographics [40] and the optimism about Libya’s future, a 2% growth rate was observed. This rate considers optimistic assumptions, as the actual growth is inconsistent due to the country’s volatile political situation [41]. As anticipated, there were gaps and inconsistencies in the data. Consequently, an integration process was performed, where judgement and experience were used to establish a 2020 baseline (Column 1 in Table 1) and two 2050 scenarios: one with an extensive use of hydrocarbons (Column 2 in Table 1), the other decarbonised (Columns 6 to 9 in Table 1). Furthermore, this information was presented in various units, so the consumption patterns and sector entries were all converted to PJ and GW for consistency and ease of manipulation. A future risk analysis will be conducted to examine the impacts of these corrections and adjustments. It is expected that this more detailed analysis will slightly alter some quantitative outputs, but it is not anticipated to significantly change the magnitude of the results or the main conclusions.
The daily consumption patterns were integrated to match the total in Table 1; Figure 1 shows these daily and seasonal patterns. These are central to the demand evaluations.
Therefore, for a decarbonised Libya in 2050 (Table 1), without restricting economic growth, the total energy required is 630 PJ of electrical energy, of which 407 PJ would be used directly as electrical energy and the remainder used to produce hydrogen. It is noteworthy that the decarbonisation of a country results in a reduction (from 809 PJ to 630 PJ) in the primary energy and a sizeable increase (from 108 PJ to 630 PJ) in the electrical energy requirement. The main reason for the reduction in primary energy is that a large portion of fossil fuel energy is currently used in thermodynamic cycles with thermal efficiencies ranging from 0.15 to 0.6, which often leads to a substantial waste of thermal energy. This may change in the future as additional hydrogen production requirements are included.

5. Energy Demands and H2CCGTs as the Balancing Mechanism

When transitioning from traditional fossil fuel energy sources to wind energy, it is crucial to ensure the demand is met, even when wind conditions are not optimal. In the current scenario, this issue was addressed using Hydrogen Combined-Cycle Gas Turbines (H2CCGTs), which combust hydrogen using low-NOx combustor designs evaluated in ENABLEH2 (2020). The current state-of-the-art thermal efficiency stands at 62–64% [42] (General Electric 2023; Mitsubishi 2023). By 2050, machinery with an efficiency exceeding 65% is expected to be available. Combined with electrolyser efficiencies surpassing 80%, this can generate an electricity efficiency value of 0.5. Moreover, H2CCGTs generate a substantial stream of thermal energy, which can be beneficially used for various purposes, including desalination. This advantage is not included in this analysis. It is anticipated that these H2CCGTs will be situated near electrolysing stations and use gaseous hydrogen. In this study, the H2CCGTs were assumed to be 600 MW single shaft units delivering an average of 500 MW (accounting for hot days, off-design performance, degradation, and operational availability) with a thermal efficiency of 60%. Thus, in addition to the hydrogen produced for the replacement scenario depicted in Table 1, additional hydrogen needs to be generated for use in these gas turbines. While it can be argued that other energy storage mechanisms can be used in place of H2CCGTs, H2CCGTs are a very suitable alternative for this scenario evaluation and are the only ones considered here. The hydrogen required for these H2CCGTs was additional to the hydrogen demand evaluated in Table 1. Moreover, a 4% hydrogen backup was included to run the H2CCGTs for 2 weeks in case no wind energy was available.
Figure 1 presents the demand curves for this study. The patterns used were based on Libyan operating information [12] and were adjusted to meet the total annual requirement of 406.89 PJ for 2050, as evaluated in Section 3 and shown in Table 1. Altogether, the grid evaluated here needs to deliver:
-
The electricity demand of 406.86 PJ in the daily patterns is shown in Table 1.
-
A total of 1210.7 ktonnes of hydrogen (3.32 k tonnes/day) that require 223.7 PJ annually.
-
Additional hydrogen for H2CCGTs for electricity when wind is not available.
-
A 4% H2 margin (2 weeks of operation) for the H2CCGTs’ peak and non-windy day demand duties.

6. Assessments of Requirements Based on the Summer Season

The basic premise of this investigation is that wind farms will be constructed and operated at full capacity, considering the location and wind characteristics. The Mediterranean coastal areas of Libya, extending for about 2000 km, were selected for this study. The demand patterns represented in Figure 1 were used, representing the year as four equal seasons of 91.25 days each. The first season analysed was summer since it is the ‘pinch’ season where wind energy is at its lowest.
In the six-step method described in the introduction, the fourth step is the collection of information to evaluate the wind energy potential in different geographical areas of the country. The fifth step is the conversion of this energy potential into electrical power and hydrogen from electrolysis using up-to-date equipment information. This includes the performance of wind turbines, electrolysers, storage requirements, global transmission requirements, etc. The sixth step is an iterative process where the (wind energy in this investigation) single-source energy supply is adjusted to meet the energy demand of the country.
To carry out the fourth and fifth steps, geographical wind energy potential information was coupled to the wind turbine performance. The result of the sixth step provided wind farms with a total area of 20,529 km2. To fulfil the electricity needs for this area, the study estimated that 44,436 wind turbines were required, each with a capacity of 4200 kW. To reduce the risks, the efficiency and other factors used were conservative.
A key item is shown in the bottom row of Column 5. This is the daily hydrogen requirement of 3.7 ktonne/day, including the 4% buffer for peaks and long spells of windless days. Column 1 in Table 2 shows the electrical power demand, also shown in Figure 1 for the summer season. Column 2 shows the energy required because of this demand.
When the wind speed is below 3 m/s, the demand is satisfied using the H2CCGTs (Column 14) that consume hydrogen produced through excess energy from the wind turbines during times of wind energy surplus (Column 10). Column 15 shows the number of 600 MW single-shaft H2CCGTs (delivering an effective 500 MW to allow for several operational factors). The largest value in Column 15 indicates the number of these powerplants needed: 44 (arising from the value of 43.56 rounded up). One of the constraints of the evaluation was the hydrogen production of 3699 tonnes/day explained above. The bottom row shows that, for a summer day, 11.24 tonnes of hydrogen are produced; 8.024 of these are consumed by the H2CCGTs to satisfy the demand experienced during the sunless hours and the remainder is the 3693 tonnes/day requirement by the rest of the economy. Column 8 offers a view to estimating the electrolysis capacity and Column 11 offers information helpful for storage requirements. A particular assumption in this study was that the 3693 tonnes of hydrogen needed every day were consumed very quickly. This assumption simplified the calculations, included the availability of this hydrogen for most of the day, and offered a useful numerical buffer for storage requirements.
Figure 2 shows the electrical supply and demand patterns. The dotted line represents the demand. This demand was satisfied when there was no power from the wind for the H2CCGTs. The very large excess of supply over demand was used to electrolyse hydrogen for use in other economic sectors and to produce the hydrogen needed for the night operation of the H2CCGTs.

7. Winter, Spring, and Autumn Seasons

The evaluation of the other seasons follows next. The wind farm was assumed to continue to deliver its maximum output, which became larger because wind speeds were observed to be generally higher in the other three seasons compared with summer. The high wind energy in North Africa is expected to play an important role in generating electric power. For example, the installed capacity of wind energy reached the production values of electricity for Morocco, Egypt, and Tunisia of 610, 787, and 245 MW, respectively, by the end of 2015 [43,44].
Wind power is directly dependent on wind speed. The energy density generated by the wind increases with the increase in the cubic value of the wind speed, which means that it directly affects the cost of producing a unit of electrical energy as illustrated in Appendix A. Wind has increased the amount of electrical energy produced, and thus costs have decreased for energy per kWh. Many regions in Libya are characterised by the availability of wind energy resources that are reasonable and can be used to generate electricity [45].
As for the sites that were chosen, most of them were in the north of the country, where wind speeds exceeding 5 m/s were frequent, and they were considered suitable sites for generating electric power. Wind energy, by its nature, is abundant and its prices are low compared to the latest renewable energy technologies. Table 3 shows the details of the spring season. This season has a lower demand (Figure 1) (this is evident when comparing Columns 3 in Table 2 and Table 3). There is a surplus production of hydrogen that can be exported: 53.16 ktonne/day. According to the daily needs, this is assumed to be removed from storage. Table 4 and Table 5 show the results for the other seasons. The relationship between energy demand and electricity supply is shown in Figure 3a–d in the four seasons throughout the year.
Figure 3a–d illustrates the correlation between energy demand and electricity supply throughout the year. The potential for hydrogen production during periods of surplus energy is demonstrated by directing excess electricity to power the electrolyser, resulting in the generation of hydrogen. In the event of a failure to meet the energy demand from the wind power supply, H2CCGT serves as a backup power station to cover the energy demand. This scenario is evident in Figure 3b during the spring season at 8:00–10:00 and in the fall season, as depicted in Figure 3c between 9:00–11:00 AM. A similar occurrence took place in the summer, spanning from 7:00 AM until 1:00 PM.

8. A View of the Whole National System

An examination of the above information reveals a great deal of useful details to provide foundational knowledge for, among other things, policymaking, and national investments. The size of the wind farm was 20,529 km2; this is shown in Figure 4 with six farms of 2125 km2 each on the coast north of Libyan. The installed nominal output needed was 187 GW, delivering less energy as a result of the maintenance factors.
The number of the H2CCGTs was determined by the maximum requirement (Column 15; summer at 7:00). This number needed to be rounded up to 44 units. The electrolyser requirement was determined by the maximum activity that took place in the winter at 2:00 (Column 8, Table 4), which was 178 GW. The hydrogen storage requirement was determined by the maximum activity taking place in winter at 23:00 (Column 11, Table 4); this was 57,310 tonnes. Similarly, the grid capacity needed was for the winter maximum at 02:00 (Column 4, Table 4) and was 187 GW. Table 6 shows a summary of these requirements with the electrolyser requirement adjusted by an availability factor of 0.95 and the storage and transmission requirements adjusted by an availability factor of 0.9. These factors may seem high, but the predictability, periodicity, and seasonality of wind energy should permit scheduling most of the maintenance when the wind speed is under 3 m/s and in seasons where there is an excess capacity. The current electricity capacity in Libya is 11 GW [11,46] and the transmission grid is of a commensurate size.
The vast increase in the electricity capacity needed for the decarbonisation objective was partly due to the replacement of land transport fossil fuels by electric systems and partly due to the replacement of high-utilisation fossil fuel electricity-generating plants with medium-utilisation renewable systems. The geographic location of the wind farms was chosen to be in the northern region of the country, offering a better speed of wind and a more productive use of wind farms. It is beneficial to locate the hydrogen grid very close to the coast on the premise that seawater will be used for electrolysis. An evaluation is needed to select either direct seawater electrolysis or to desalinate seawater and electrolyse it subsequently.
The use of seawater to produce hydrogen is a necessity given the scarcity (or geographical maldistribution) of fresh water in many parts of the world. The location of electrolysis, H2CCGTs, and storage farms can be placed near the coast to minimise hydrogen transmission inland. So, in this scenario, the electrical grid and hydrogen grid would be distributed throughout the country and would be concentrated near the Mediterranean coast.
The authors proposed that it was logical to group the hydrogen infrastructure in hydrogen farms by the Mediterranean coast to capitalise on economies of scale and integration, thus also reducing hydrogen transmission costs. These hydrogen farms can be located close to the main cities of Tripoli and Benghazi, where an important fraction of the demand is located. These cities also have the largest airports in the country where most of the liquid hydrogen will be used, noting that hydrogen for aviation purposes will comprise 28% of the hydrogen demand (Table 1). These hydrogen farms would comprise electrolysers; if adopted, the desalination plant; H2CCGTs; storage facilities; and, where appropriate, the liquefaction plant. We also reviewed the electrolyser and associated technologies [47,48,49,50,51]. The authors concluded that two hydrogen farms of approximately 270 km2 each would meet the requirements of the demand and the wind energy produced. Figure 4 shows the proposed locations of the hydrogen farms and the wind farms.
In the scenario evaluated here, the premise was that this hydrogen–electrical green grid would meet the summer requirements of the nation. For the rest of the year, the authors proposed that wind farms should be utilised to the maximum. The higher speed of wind experienced during the other three seasons delivers excess electrical energy that was used to produce hydrogen for export purposes. The excess hydrogen produced daily is shown in Column 7 at the bottom of the table for each season. The values are 25,936, 53,616, and 17,381 tonnes for winter, spring, and autumn, respectively. This presents a total of 5.25 Megatonnes of hydrogen each year, which equates to 1061 TJ each year, exported during the three seasons.
North Africa is perceived to have great potential for energy exports [52], green and conventional. In 2021, Libya exported slightly over 1 million barrels/day of crude oil [53]; this was approximately 49 Megatonnes of oil each year with an energy content of 2100 PJ per year. A reasonable ambition would be to retain Libya’s international position as an energy exporter. Then, a similar analysis can be carried out using this method for a scenario where Libya exports 2100 PJ of hydrogen each year. This can be exported by tankers [54] or by pipeline. The corresponding results for this energy export scenario are shown in the lower row in Table 6. This type of analysis can be used for different levels of export to deliver the appropriate quantitative results.
The wind power unit area proposed here was somewhat higher, at 3 MW/km2. It is indicated that the installed capacity is 187 gigawatts, and the maximum generation is 44 gigawatts (in the winter season). This was the result of estimates and margins arising from weather and operating factors referred to in Section 5.
Furthermore, the grid transmission capacity was needed to minimize the impact of curtailment [55]. Curtailment may be needed for maintenance, excess power over demand, and a lack of transmission lines. Additionally, in this investigation, very few instances of excess power over demand were expected given that the basis of the generation system presented here relied on ample excess power to produce hydrogen for internal use and export.
One more detail to highlight is that the total wind electricity generated was much larger than the 630 PJ (407 PJ of the electrical demand plus 223 PJ for hydrogen) required to satisfy the national demand. This was because of the need to produce additional hydrogen for the H2CCGTs and exports. In the two scenarios examined, the total wind electricity values produced were 2420 PJ and 4000 PJ.

9. A Foundation Baseline for Future Policy and R&D Investments

The present study presents the appropriate results for setting national and international research, development, and financial agendas. It offers valuable insights into a single electricity-generation solution and single energy storage approach, wind energy, and H2CCGTs with their necessary ancillary systems. It also provides a quantitative platform for the evaluation of alternatives. This is a very useful baseline for comparing and evaluating alternatives and R&D requirements necessary for the decarbonisation agenda of a country. There are uncertainties and alternatives, described below, that require further analysis. These evaluations will create changes but will not alter the main conclusions. For example, a key R&D issue that arose was how to produce hydrogen. Here, seawater was used as the feedstock to protect scarce freshwater supplies, currently an issue in many parts of the world. Advances are taking place in seawater electrolysis [51]. Another alternative was to produce hydrogen in two steps: first, desalination, followed by the electrolysis of the resulting water stream. Another important source of water is from the combustion products of hydrogen in the H2CCGT exhaust, where suitable cooling and extraction equipment can provide a recirculating system, greatly reducing the need for electrolysis. A techno-economic analysis of the options is needed to make an appropriate selection. The solutions are likely to vary, depending on the features of different geographic locations, and it is likely that, depending on the circumstances, a portfolio approach will be needed. Within this context, there is also a choice to be made of using the right electrolyser from the options available. In the current research, the demand patterns were maintained as constant. Demand management emerges as a viable strategy that can potentially offer cost advantages by shifting the peak consumption times to align more closely with wind energy production, therefore diminishing the need for equipment. If the demand can be transitioned from calm periods to windy periods, from seasons with less wind to those with more, and from still days to breezy ones, this would lessen the necessity for auxiliary power and storage solutions. A managed decrease in the demand is also a feasible approach. For instance, the UK has noticed a 25% decline in the electricity demand from 2003 to 2022 [56].
Every oil-exporting country has a social duty to consider its wealth-generation abilities once the oil demand dwindles as a result of environmental requirements and policies. Libya currently exports about 80% of the oil it produces to Europe [57]. It is logical to expect that these energy exports will continue to be beneficial. Europe is a large energy consumer and is on a clear road to decarbonisation. So, there will be a clear demand for Libya’s energy exports as these become greener. The question then arises: should Libya export liquid hydrogen by ship or gaseous hydrogen by pipeline or electricity to Europe? In the present study, the exported hydrogen was assumed to be gas. However, the likely solution was a mixture of the three. The importance of each of the three opportunities can be made visible following a detailed TERA evaluation of the costs, risks, and benefits of the exporting technologies and markets.
Another area that influences the results is the selection of alternative storage energy alternatives. The technology proposed here, via the use of H2CCGTs, is useful as a baseline, competitive [58], but not the only option. Technologies, such as batteries, pumped storage, compressed-air storage [59], and others, must be considered in the future. Each one of them presents its own technical and economic advantages, disadvantages, and challenges.
Libya possesses various regions with favourable wind speeds for generating electricity, and among these regions, Derna stands out, where a wind farm with a 60-megawatt capacity has been planned. Other areas, like Al-Asaba, Tarhuna, and Al-Maslatah, also experience abundant winds at suitable speeds. This article focused on a study conducted to design a wind farm in the Torhuna region [60,61].
The development of a wind power plant results in a variety of temporary and permanent disturbances, including land occupation by wind turbine pads, access roads, substations, service buildings, and other infrastructure, which physically occupy land areas or create impermeable surfaces [62].
Furthermore, the pace of technology’s progress and improved learning is expected to influence the benefits and economic features differentially. Often, different geographic areas require different solutions, and a portfolio approach can be the outcome.
Given the scale of investments envisaged and the influence of global geographic opportunities, this is an exercise that will require extensive and bespoke TERA (Technoeconomic environment risk analysis) [63] evaluations. Worldwide, there has been a significant surge in the wind power capacity over the past ten years, with a yearly average increase of 22%. By the end of 2015, this figure reached a staggering 432 GW. Most of this capacity—around 73%—was contributed to by just five countries: China, the United States, Germany, India, and Spain [64]. At present, wind turbines can be broadly categorised into two types: onshore and offshore. The former is typically located on land, while the latter is situated in bodies of water, like lakes and seas. Wind turbine designs and operational principles include factors such as orientation and variable foundations.
Wind conditions were assessed based on local, seasonal, and hourly variations, factoring in redundancy measures for maintenance and weather events. Wind turbines can be engineered to generate electricity optimally, altering the demand and supply patterns. The design and operation of wind farms can be enhanced considering the relatively low usage (plus the cyclical nature of the operation) of the capital equipment. Through technological advancements and meticulous maintenance scheduling, significant cost benefits can be realised. Expected improvements in these areas will come from accumulated experience, volume, and technology acquisition.
The design of hydrogen systems in large wind farms or parks is another area receiving, and that will continue to receive, considerable interest. Consolidating hydrogen systems within wind farms or parks will offer economies of scale and experience, resulting in reduced hydrogen transmissions, health and safety investments, operational scale, and cost benefits from experience. The unit costs of hydrogen tanks will become more economical as the capacity increases. In some studies, using both the best–worst method and a hierarchical analytical process, five proposed sites in Libya were evaluated based on the six criteria of fossil fuel dependence.
The standards of safety and quality emerged as the most important, and the city of Derna in the northeast was identified as the best option, followed by the city of Tarhuna in the west of the country, demonstrating the robustness of the model, even when experts’ opinions about standards changed [65]. Another crucial aspect that warrants further exploration is the source of electricity. The choice of wind energy is highly rational in the case of Libya, given its substantial coastal wind resources. However, the capacity requirements for both generation and storage within the system are substantial. Other energy sources will be evaluated. In addition to wind energy, Libya can potentially harness wave energy due to its extensive coastline, and other opportunities that necessitate a detailed Techno-Economic Resource Assessment (TERA).
Realistic assumptions were made regarding the redundancy needed, availability, and other capacity-constraining factors for several inputs. Similarly, ample opportunities exist to explore this issue in terms of the techno-economic performance. As such, this study serves as the foundation for a more detailed techno-economic optimisation that examines the opportunities and options outlined above. It also represents the beginning of cost estimations for the highly expensive transition towards a decarbonised economy.

10. Conclusions

In the current research, we filled a knowledge gap by introducing a unique, quantitative, technophilosophical method. This method provides a statistical perspective on energy requirements and economic growth to inform decarbonisation strategies. No such comprehensive and quantitative country-level replacement analysis has been found in the public domain before. Therefore, the contribution lies in the quantitative visualisation of infrastructure requirements, derived from the evaluation of two scenarios: energy self-sufficiency and matching current oil exports.
The foundational study is presented as a demonstrative example, without making judgments, recommendations, or optimisations. However, several pertinent conclusions surfaced. The first, despite numerous uncertainties and a singular solution examination, was that the cost and infrastructure requirements would be great. A cost estimate will be conducted shortly, but before that, Table 6 illustrates the vast equipment needs; these require a colossal investment. Even though the current investigation was based on singular choices, these were competitive, validating the order of magnitude of the requirements.
While the study was conducted on Libya—a country with abundant wind resources—as its focus, the principles, outcomes, and impacts have global applicability. An important conclusion is that, due to the periodic and seasonal nature of wind speed, the general utilisation of the equipment is in the medium range. This can be mitigated by demand management, the adoption of improved technologies, the execution of advanced maintenance techniques, and other strategies offering beneficial outcomes.
The second key conclusion is the substantial increase in electricity capacity. This is required for decarbonisation, partly due to the replacement of transport fossil fuels with electric and hydrogen systems, and partly due to the replacement of high-utilisation fossil fuel electricity-generating plants with medium-utilisation renewable systems.
The concept of a hydrogen farm warrants detailed scrutiny in the future. It holds the promise of reducing costs, even though the order of magnitude of the overall decarbonising investment is not expected to change significantly. A careful integration of different elements will also yield savings. Moreover, the strict health and safety measures necessary for hydrogen operations will be confined to a small number of specific areas, namely the locations of hydrogen farms within a country. A comprehensive Techno-Economic Resource Assessment (TERA) represents the next stage of this research.
So, notwithstanding the uncertainties of this study, the process of transitioning to more sustainable practices will necessitate a large-scale increase in electrification and vast investments. This foundational analysis can serve as a starting point for research and development, investment planning, and policymaking at the beginning of the road to achieving holistic decarbonisation.

Author Contributions

Conceptualization, A.R. and P.P.; methodology, A.R. and P.P.; investigation, A.R. and P.P.; writing—original draft preparation, A.R.and P.P.; writing—review and editing, A.R. and P.P.; supervision, P.P. and A.R. All authors have read and agreed to the published version of the manuscript.

Funding

This research received no external funding.

Data Availability Statement

No new data were created or analysed in this study. Data sharing does not apply to this article.

Conflicts of Interest

The authors declare no conflicts of interest.

Nomenclature

windFuel calorific value
GJ/T Gigajoules/tonne
H2Hydrogen
H2GTCCHydrogen-fuelled gas turbine combined cycle
kTonneKilotonne = 1000 tonnes
MTsMega tonnes (million tonnes)
MTOEMillion-tonne oil equivalent
NOxNitrogen Oxide
PJsPetajoules = 1015 Joules
PwWind power
R&D Research and Development
TERATechnoeconomic Environmental Risk Analysis
TJ Terajoule = 1012 Joule

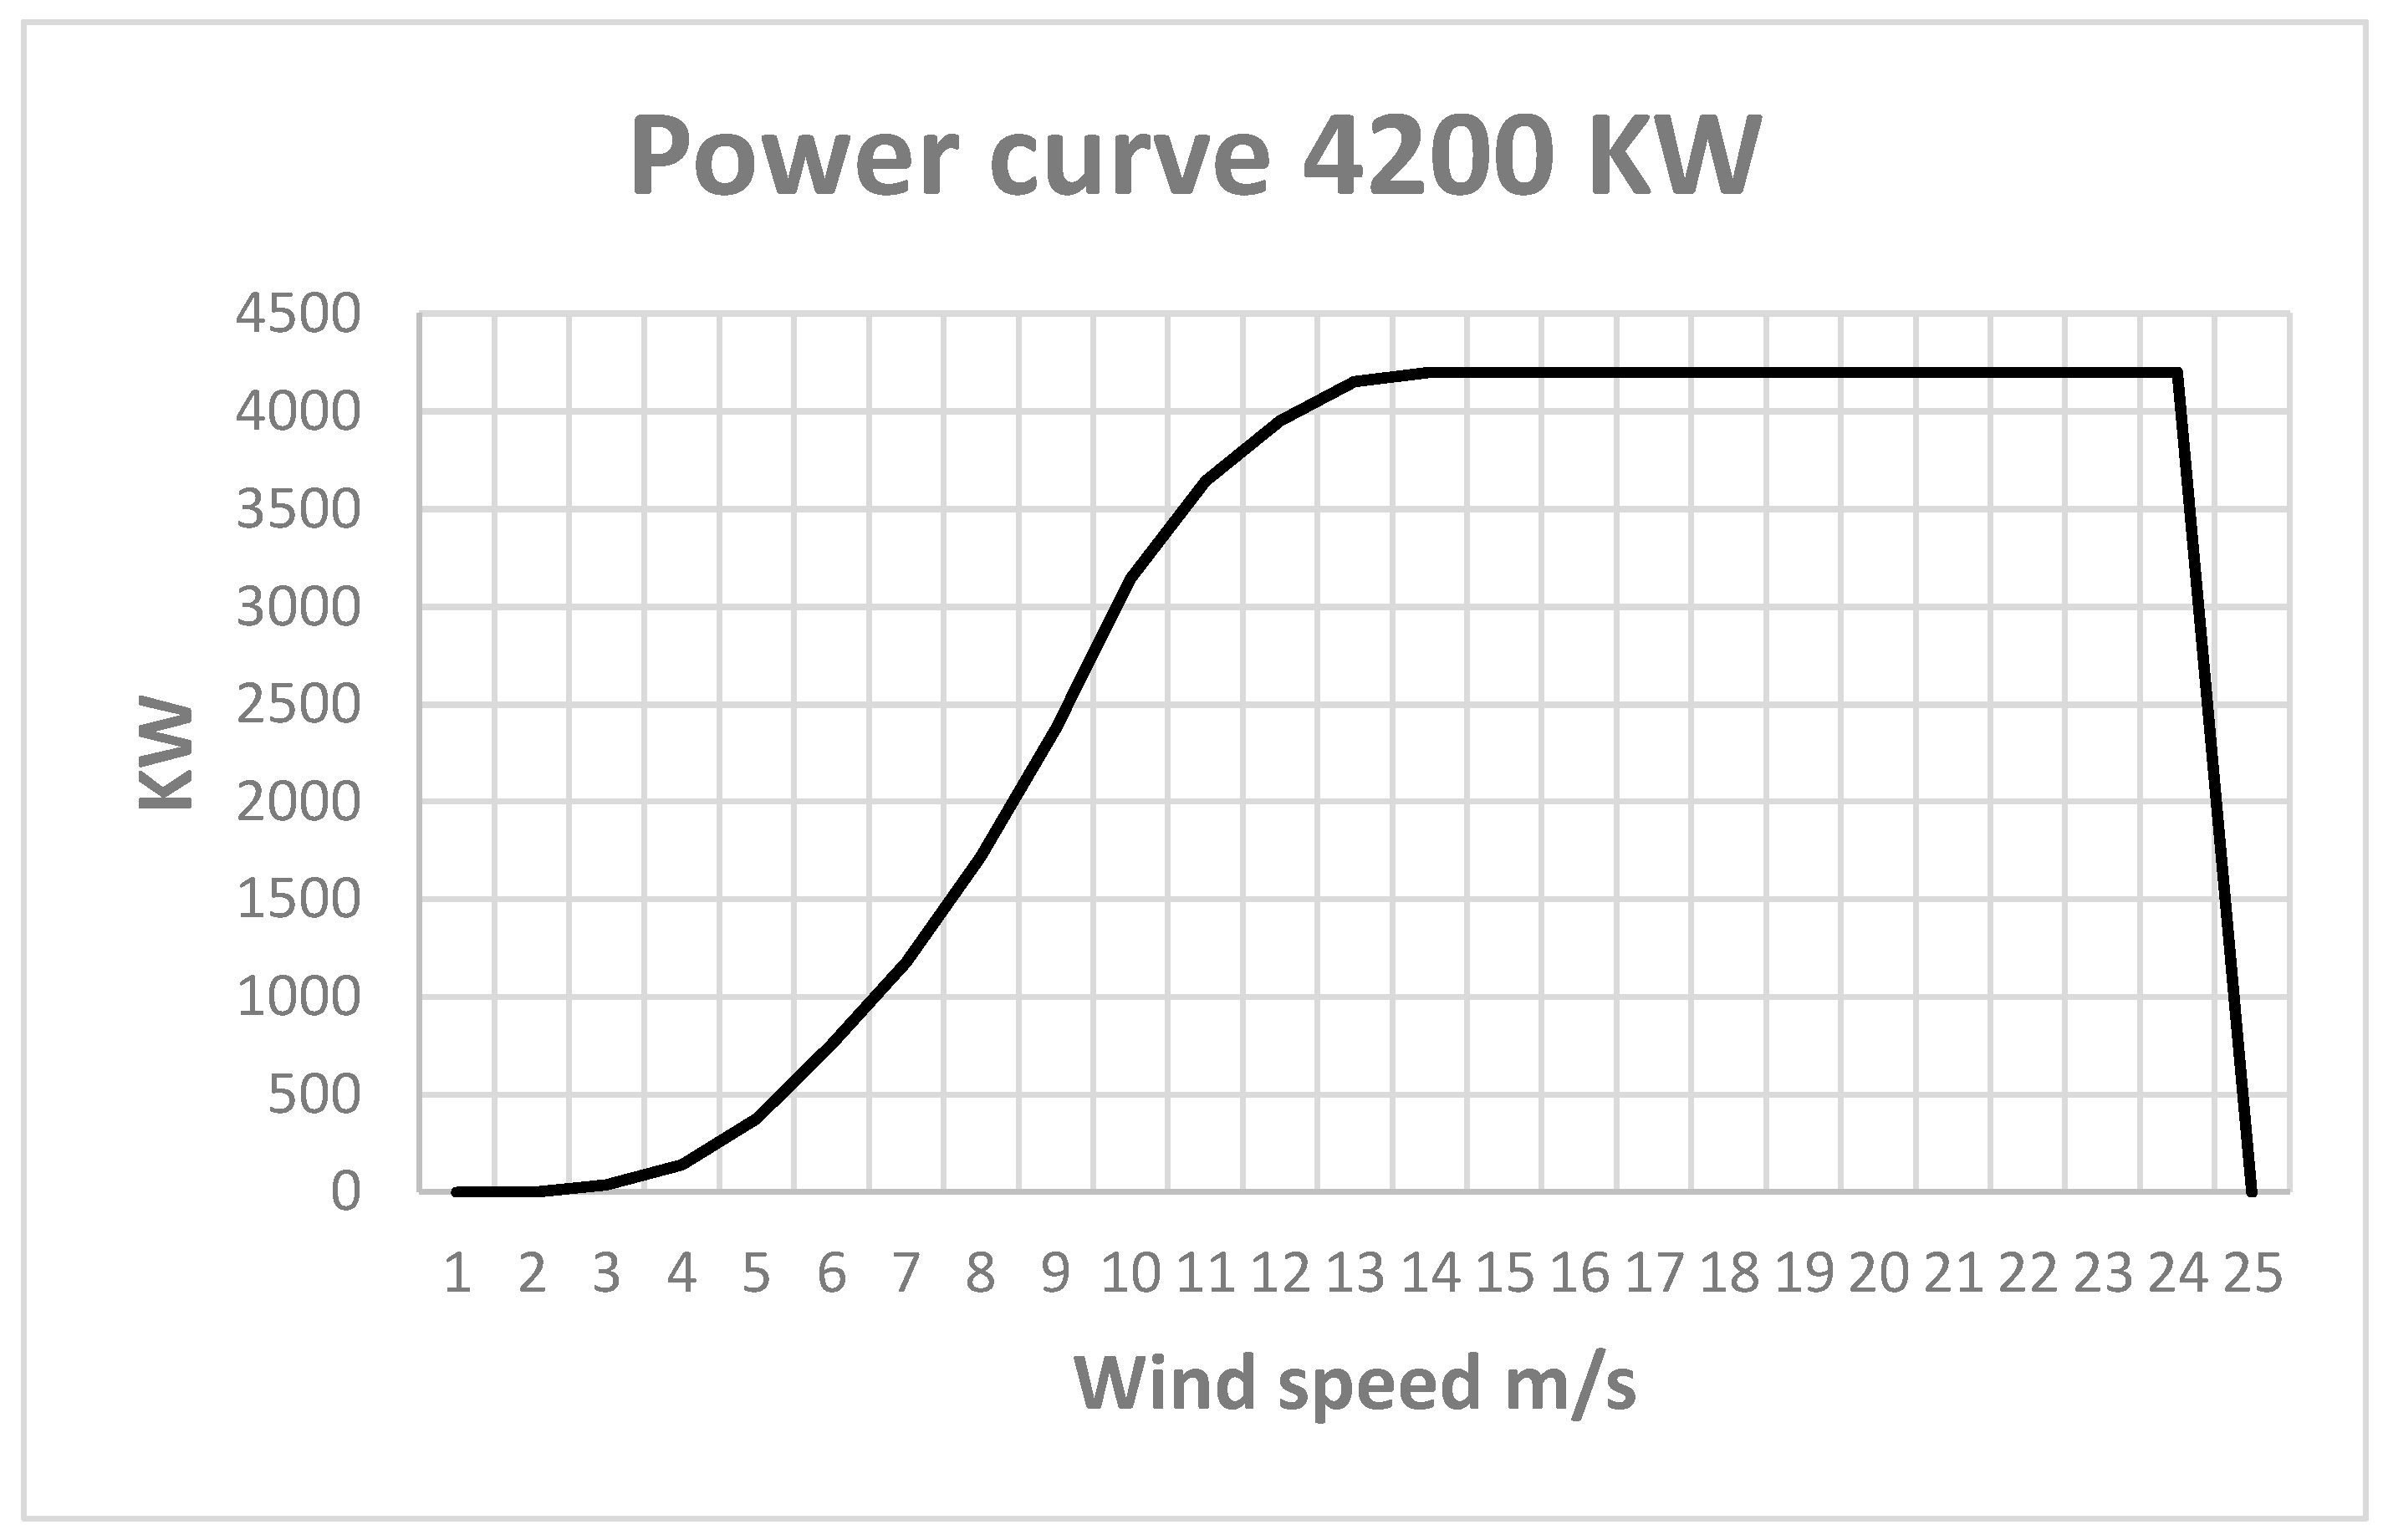
Appendix A. Evaluating Wind Power from Wind Potential

The evaluation of wind energy production (Pwt) hourly by wind generators was calculated considering the rated power output (Pwt-rated). Wind speed determines the optimum operation of wind power in any region. Column 3 shows the wind power density for each hour, which is dependent on the speed of the wind and how this varies during the day and the seasons [66]. The hourly wind energy generated (Pwt) is presented in Equation (A1) [67]. At the same time, the wind turbine’s final actual power output is given by Equation (A2).
P W T o u t = 0 , v o r   v v c o P W T r a t e d v v c i v r v c i v c i v v r P W T r a t e d , v r v v c o
P W T o u t P W T r a t e d v
where:
  • v c i =  Cut-in wind speed.
  • v c o =  Cut-off wind speed.
  • v r =  Rated wind speed.
  • P W T r a t e d =  Wind turbine rated power output.
  • P W T o u t  = Wind turbine final actual power output.
Column 4 in Table 2 (and Table 3, Table 4 and Table 5) shows the power delivered using a wind farm measuring 20,529 km2. Of course, a wind farm only produces electricity when there is wind that starts at a speed of 3 m/s, and it is assumed that, at a speed under that value, there is no useful output. The wind turbine power curve was used to find the power for each wind speed, as displayed in Figure 3. The percentage of hourly wind speed was specified by using the Weibull probability distribution function f(v) given in Equation (A3):
f   ( v ) = k c × ( k c ) k 1 e x p ( k c ) k
where 𝑓 𝑉 is the probability density function, k is the scale factor, c is the shape factor, and v is the wind velocity (m/s).
Figure A1. Power curve of the 4200 kW wind turbine.
Energies 17 01032 g0a1
The Wind Density KW/m2 data in Column 3 of each table, as presented in Table 2, Table 3, Table 4 and Table 5, depicting all four seasons throughout the year were obtained from the Renewables Ninja website [68]. Based on these data, Power curve of 4200 kW wind turbine. The Renewables Ninja website (Ninja) [68] for the year 2022 was used to obtain hourly wind speed data. The analysis mentioned above involved utilising appropriate software to calculate the wind farm’s power output in gigawatts (GWs). The results are presented in Column 4, revealing that wind power is negligible when the wind speed is below 3 m/s. It begins at 3 m/s and progressively increases, reaching nearly 187 GW between 1 a.m. and 8 a.m. (Table 3). As previously discussed, this variation is contingent upon both the wind speed and the turbine’s design specifications.

References

  1. Economist. The Economist Achieving Net-Zero Carbon Emissions Will Be Eye-Wateringly Expensive. 2021. Available online: https://www.economist.com/britain/2021/07/17/achieving-net-zero-carbon-emissions-will-be-eye-wateringly-expensive (accessed on 2 November 2023).
  2. Dray, L.; Schäfer, A.W.; Grobler, C.; Falter, C.; Allroggen, F.; Stettler, M.E.; Barrett, S.R. Cost and emissions pathways towards net-zero climate impacts in aviation. Nat. Clim. Chang. 2022, 12, 956–962. [Google Scholar] [CrossRef]
  3. Rosling, H.; Rosling Rönnlund, A.; Rosling, O. Factfulness: Ten Reasons We’re Wrong about the World—And Why Things Are Better Than You Think; Flatiron Books: New York, NY, USA, 2019. [Google Scholar]
  4. UNPRI. 2021. Available online: https://www.unpri.org/inevitable-policy-response/what-is-the-inevitable-policy-response/4787.article (accessed on 23 September 2021).
  5. Parker, R.J.; Pilidis, P. The light beyond the clouds. Aeronaut. J. 2021, 125, 1467–1468. [Google Scholar] [CrossRef]
  6. Nielsen. The Emerging School of Techno-Philosophy|Grand Strategy The View from Oregon. The View from Oregon’. 2012. Available online: https://geopolicraticus.wordpress.com (accessed on 18 January 2023).
  7. OAPECORG. Arab Energy 10th Conference, Abu Dhabi, United Arab Emirates. 2014. Available online: https://oapecorg.org/media/c48589f8-07e1-4745-b82f-a62ff4085333/558960152/Presentations/%D9%8419 (accessed on 19 March 2022).
  8. USEIA. Energy Information Administration. 2022. Available online: https://www.eia.gov/outlooks/ieo/ (accessed on 8 April 2022).
  9. Global Economy. These 5 Charts Reveal the Global Economic Outlook for 2022. Available online: https://www.worldbank.org/en/country/libya/overview (accessed on 28 January 2022).
  10. Country Economy. 2022. Available online: https://countryeconomy.com/energy-and-/electricity-generation/libya (accessed on 8 October 2022).
  11. Our World in Data. 2022. ‘Libya: Energy Country Profile’. Available online: https://ourworldindata.org/energy/country/libya (accessed on 25 February 2022).
  12. Rawesat, Y.; Salah, S. (Engineers at the General Electricity Company, Tripoli, Libya). Energy Demands and Daily Consumption Patterns in Libya. Private Communication, 2021. [Google Scholar]
  13. Sameti, M.; Syron, E. 100% renewable industrial decarbonization: Optimal integration of solar heat and photovoltaics. Smart Energy 2022, 8, 100087. [Google Scholar] [CrossRef]
  14. Ferrari, L.; Pasini, G.; Desideri, U. Towards a Power Production from 100% Renewables: The Italian Case Study. Energies 2023, 16, 2295. [Google Scholar] [CrossRef]
  15. Brick, S.; Thernstrom, S. Renewables and decarbonization: Studies of California, Wisconsin and Germany. Electr. J. 2016, 29, 6–12. [Google Scholar] [CrossRef]
  16. Simonis, B.; Newborough, M. Sizing and operating power-to-gas systems to absorb excess renewable electricity. Int. J. Hydrogen Energy 2017, 42, 21635–21647. [Google Scholar] [CrossRef]
  17. Victor, N.; Nichols, C.; Zelek, C. The U.S. power sector decarbonization: Investigating technology options with MARKAL nine-region model. Energy Econ. 2018, 73, 410–425. [Google Scholar] [CrossRef]
  18. Bistline, J.E.T.; Blanford, G.J. Value of technology in the U.S. electric power sector: Impacts of full portfolios and technological change on the costs of meeting decarbonization goals. Energy Econ. 2020, 86, 104694. [Google Scholar] [CrossRef]
  19. Stock, J.H.; Stuart, D.N. Robust Decarbonization of the US Power Sector: Policy Options; National Bureau of Economic Research: Cambridge, MA, USA, 2021. [Google Scholar]
  20. Bernal-Agustín, J.L.; Dufo-López, R. Hourly energy management for grid-connected wind-hydrogen systems. Int. J. Hydrogen Energy 2008, 33, 6401–6413. [Google Scholar] [CrossRef]
  21. Yan, H.; Wang, R.; Zhang, C.; Xu, Z.; Hu, B.; Shao, Z. The role of heat pump in heating decarbonization for China carbon neutrality. Carbon. Neutrality 2022, 1, 40. [Google Scholar] [CrossRef]
  22. Wang, J.; An, Q.; Zhao, Y.; Pan, G.; Song, J.; Hu, Q.; Tan, C.W. Role of electrolytic hydrogen in smart city decarbonization in China. Appl. Energy 2023, 336, 120699. [Google Scholar] [CrossRef]
  23. Hjeij, D.; Bicer, Y.; Al-Sada, M.B.S.; Koç, M. Hydrogen export competitiveness index for a sustainable hydrogen economy. Energy Rep. 2023, 9, 5843–5856. [Google Scholar] [CrossRef]
  24. Ishaku, H.P.; Adun, H.; Jazayeri, M.; Kusaf, M. Decarbonisation Strategy for Renewable Energy Integration for Electrification of West African Nations: A Bottom-Up EnergyPLAN Modelling of West African Power Pool Targets. Sustainability 2022, 14, 15933. [Google Scholar] [CrossRef]
  25. Mraoui, A.; Menia, S. Renewable electrolytic hydrogen potential in Algeria. Int. J. Hydrogen Energy 2019, 44, 26863–26873. [Google Scholar] [CrossRef]
  26. Khouya, A. Levelized costs of energy and hydrogen of wind farms and concentrated photovoltaic thermal systems. A case study in Morocco. Int. J. Hydrogen Energy 2020, 45, 31632–31650. [Google Scholar] [CrossRef]
  27. Mostafaeipour, A.; Rezaei, M.; Moftakharzadeh, A.; Qolipour, M.; Salimi, M. Evaluation of hydrogen production by wind energy for agricultural and industrial sectors. Int. J. Hydrogen Energy 2019, 44, 7983–7995. [Google Scholar] [CrossRef]
  28. Sandaka, B.P.; Kumar, J. Alternative vehicular fuels for environmental decarbonization: A critical review of challenges in using electricity, hydrogen, and biofuels as a sustainable vehicular fuel. Chem. Eng. J. Adv. 2023, 14, 100442. [Google Scholar] [CrossRef]
  29. Yu, X.; LeBlanc, S.; Sandhu, N.; Wang, L.; Wang, M.; Zheng, M. Decarbonization potential of future sustainable propulsion—A review of road transportation. Energy Sci. Eng. 2023, 12, 438–455. [Google Scholar] [CrossRef]
  30. Raupova, O.; Kamahara, H.; Goto, N. Assessment of physical economy through economy-wide material flow analysis in developing Uzbekistan. Resour. Conserv. Recycl. 2014, 89, 76–85. [Google Scholar] [CrossRef]
  31. Habert, G.; Miller, S.A.; John, V.M.; Provis, J.L.; Favier, A.; Horvath, A.; Scrivener, K.L. Environmental impacts and decarbonization strategies in the cement and concrete industries. Nat. Rev. Earth Environ. 2020, 1, 559–573. [Google Scholar] [CrossRef]
  32. Rawesat, A.; Mohammed, M.; Impey, S.; Pilidis, P. ‘Greening’ an Oil Exporting Country: A Hydrogen, Solar and Gas Turbine Case Study. J. Energy Sources Part B Econ. Plan. Policy 2023. under review. [Google Scholar] [CrossRef]
  33. Decker, L. Latest Global Trend in Liquid Hydrogen Production HYPER Closing Seminar Brussels. 10 December 2019. Available online: https://www.sintef.no/globalassets/project/hyper/presentations-day-2/day2_1105_decker_liquid-hydrogen-distribution-technology_linde.pdf (accessed on 19 January 2023).
  34. Pantelis, I.; Huete, J.; Nalianda, D.; Jarzębowska, E.; Pilidis, P. Hydrogen Propulsion for Civil Aviation: An Introduction Scenario Pericles Pilidis. Available online: https://www.isabe.org/ (accessed on 11 February 2024).
  35. S&PGlobal. 2023. Available online: https://www.spglobal.com/commodityinsights/en/market-insights/latest-news/oil/072122-libyan-oil-minister-expects-crude-output-to-double-to-12-mil-bd-in-10-days (accessed on 7 April 2023).
  36. OPEC. Monthly Oil Market Report. 2021. Available online: https://www.opec.org/opec_web/en/21.htm (accessed on 2 November 2022).
  37. Ramelli, R.; Shalabiea, O.M.; Saleh, I.; Stenflo, J.O. Prospects of Renewable Energy in Libya. In Proceedings of the International Symposium on Solar Physics and Solar Eclipses (SPSE), Waw an Namos, Libya, 27–29 March 2006. [Google Scholar]
  38. Reksten, A.H.; Thomassen, M.S.; Møller-Holst, S.; Sundseth, K. Projecting the future cost of PEM and alkaline water electrolysers; a CAPEX model including electrolyser plant size and technology development. Int. J. Hydrogen Energy 2022, 47, 38106–38113. [Google Scholar] [CrossRef]
  39. Statista. Statista Libya: Age Dependency Ratio 2010–2021. 2022. Available online: https://www.statista.com/statistics/1234502/age-dependency-ratio-in-libya/ (accessed on 25 November 2022).
  40. Statista Libya. Available online: https://www.statista.com/topics/3885/libya/#topicOverview (accessed on 27 November 2022).
  41. World Bank. World Bank Data. 2023. Available online: https://data.worldbank.org/indicator/NY.GDP.MKTP.KD.ZG?locations=LY (accessed on 7 April 2023).
  42. Siemens. 2023. Available online: https://www.siemens-energy.com/global/en/home/products-services/product/sgt5-9000hl.html (accessed on 20 January 2023).
  43. Mas’ud, A.A.; Wirba, A.V.; Ardila-Rey, J.A.; Albarracín, R.; Muhammad-Sukki, F.; Jaramillo Duque, Á.; Bani, N.A.; Munir, A.B. Wind power potentials in Cameroon and Nigeria: Lessons from South Africa. Energies 2017, 10, 443. [Google Scholar] [CrossRef]
  44. Alkishriwi, N.A.; Sherwali, H.H. Analysis of Wind Energy Conversion Systems in Two Selected Sites in Libya Using Levelized Cost of Electricity (LCOE). In Proceedings of the International Conference on Recent Advances in Electrical Systems, Hammamet, Tunisia, 22–24 December 2017. [Google Scholar]
  45. El-Osta, W.; Kalifa, Y. Prospects of Wind Power Plants in Libya: A Case Study. 2003. Available online: www.elsevier.com/locate/renene (accessed on 11 December 2022).
  46. Planning and Prospects for Renewable Energy Disclaimer about IRENA. 2013. Available online: www.irena.org (accessed on 8 October 2022).
  47. ITM. ITM Power, 7. 100MW Electrolyser. 2017. Available online: https://www.youtube.com/watch?v=eku0GuSKiIc (accessed on 22 November 2022).
  48. H2FUTURE. H2FUTURE Project Site. 2022. Available online: https://www.h2future-project.eu/ (accessed on 7 December 2022).
  49. REFHYNE. REFHYNE Project Site. 2022. Available online: https://refhyne.eu/ (accessed on 13 December 2022).
  50. Herzog, B. Energy Systems/Moglichkeiten von Wasserstoff-Elektrolyseuren in Flexibilitatsmarkten. Technical Report Siemens AG. 2017. Available online: https://scholar.google.com/scholar?q=Herzog%20B.%20M%C3%B6glichkeiten%20von%20Wasserstoff-%20Elektrolyseuren%20in%20Flexibilit%C3%A4tsm%C3%A4rkten%2C%20Tech.%20rep.%2C%20Siemens%20AG%3B%202017.%20https%3A%2F%2Fwww.hslu.ch%2F-%2Fmedia%2Fcampus%2Fcommon%2Ffiles%2Fdokumente%2Fta%2Fenergiewende%2Fe%2Ffachtagungflexibilitaetinderelektrizitaetswirtschaft2017%2F2017051006p2gbrunoherzogv04.pdf%3Fla%3Dde-ch (accessed on 11 February 2024).
  51. Mohammed-Ibrahim, J.; Moussab, H. Recent advances on hydrogen production through seawater electrolysis. Mater. Sci. Energy Technol. 2020, 3, 780–807. [Google Scholar] [CrossRef]
  52. Mohamed, A.M.A.; Al-Habaibeh, A.; Abdo, H.; Elabar, S. Towards exporting renewable energy from MENA region to Europe: An investigation into domestic energy use and householders’ energy behaviour in Libya. Appl. Energy 2015, 146, 247–262. [Google Scholar] [CrossRef]
  53. Libya Crude-Oil-Exports. 2023. Available online: https://www.ceicdata.com/en/indicator/libya/crude-oil-exports (accessed on 20 January 2023).
  54. Alkhaledi, A.N.F.N.R.; Sampath, S.; Pilidis, P. A hydrogen fuelled LH2 tanker ship design. Ships Offshore Struct. 2022, 17, 1555–1564. [Google Scholar] [CrossRef]
  55. Roadnight Taylor. The Independent Specialist Grid Consultancy. 2022. Available online: https://roadnighttaylor.co.uk/ (accessed on 14 April 2023).
  56. BEIS. Department for Business, Education and Skills, UK. 2022. Available online: https://www.gov.uk/government/statistical-data-sets/historical-electricity-data (accessed on 10 April 2023).
  57. OEC. Crude Petroleum in Libya. OEC—The Observatory of Economic Complexity. 2021. Available online: https://oec.world/en/profile/country/lby (accessed on 3 April 2023).
  58. Abudu, K.; Igie, U.; Roumeliotis, I.; Hamilton, R. Impact of gas turbine flexibility improvements on combined cycle gas turbine performance. Appl. Therm. Eng. 2021, 189, 116703. [Google Scholar] [CrossRef]
  59. Igie, U.; Abbondanza, M.; Szymański, A.; Nikolaidis, T. Impact of compressed air energy storage demands on gas turbine performance. Proc. Inst. Mech. Eng. Part. A J. Power Energy 2021, 235, 850–865. [Google Scholar] [CrossRef]
  60. Mrehel, O.G.; Salama, A.G. Energy Generation Potential from Wind Power in the Southern Libyan Regions. In Proceedings of the 2021 IEEE 1st International Maghreb Meeting of the Conference on Sciences and Techniques of Automatic Control and Computer Engineering, MI-STA 2021—Proceedings, Tripoli, Libya, 25–27 May 2021; Institute of Electrical and Electronics Engineers Inc.: Piscataway, NJ, USA, 2021; pp. 548–553. [Google Scholar] [CrossRef]
  61. Kassem, Y.; Çamur, H.; Aateg, R.A.F. Exploring solar and wind energy as a power generation source for solving the electricity crisis in Libya. Energies 2020, 13, 3708. [Google Scholar] [CrossRef]
  62. Kunz, T.H.; Arnett, E.B.; Erickson, W.P.; Hoar, A.R.; Johnson, G.D.; Larkin, R.P.; Strickland, M.D.; Thresher, R.W.; Tuttle, M.D. Ecological impacts of wind energy development on bats: Questions, research needs, and hypotheses. Front. Ecol. Environ. 2007, 5, 315–324. [Google Scholar] [CrossRef]
  63. Nalianda, D.K. Impact of Environmental Taxation Policies on Civil Aviation—A Techno-Economic Environmental Risk Assessment. Ph.D. Thesis, School of Engineering, Cranfield University, Cranfield, UK, 2012. [Google Scholar]
  64. Gwec—Global Wind Report. Annual Market Update 2015. 2015. Available online: www.gwec.net (accessed on 30 May 2023).
  65. Badi, I.; Pamučar, D.; Stević, Ž.; Muhammad, L.J. Wind farm site selection using BWM-AHP-MARCOS method: A case study of Libya. Sci. Afr. 2023, 19, e01511. [Google Scholar] [CrossRef]
  66. Farhan, A.; Hassanpour, A.; Burns, A.; Motlagh, Y.G. Numerical study of effect of winglet planform and airfoil on a horizontal axis wind turbine performance. Renew. Energy 2019, 131, 1255–1273. [Google Scholar] [CrossRef]
  67. Adefarati, T.; Bansal, R.C. Reliability, economic and environmental analysis of a microgrid system in the presence of renewable energy resources. Appl. Energy 2019, 236, 1089–1114. [Google Scholar] [CrossRef]
  68. Ninja. Renewables Ninja. Available online: http://renewables.ninja (accessed on 30 May 2023).
Figure 1. Demand curves for 2050 used in the study.
Energies 17 01032 g001
Figure 2. Electrical supply and demand on a summer day.
Energies 17 01032 g002
Figure 3. Electrical supply, demand, and H2CCGT for the year.
Energies 17 01032 g003
Figure 4. Location of facilities in Libya, courtesy of mapsoftheworld.com, annotated by the authors.
Energies 17 01032 g004
Table 1. Decarbonised Libyan energy consumption for 2050 based on current energy needs. Column 1 shows the present (2020) national energy demands. The multiple rows represent the requirements for different energy sectors and alternative replacements. Column 2 shows the projected hydrocarbon-based energy demand for 2050, assuming the continuation of current trends. On the basis of decarbonising with electricity and hydrogen, Column 4 shows what fraction is to be replaced with each. Using jet fuel as an example, the two rows (3) show that, in the case of jet fuel, the expectation is that 0.15 (higher row 3) of this jet fuel will be replaced by electrical power and 0.85 (lower row 3) of future jet fuel consumption is to be replaced with hydrogen. This arises from the estimation that the smaller aircraft for shorter-range flights will be powered by electrical systems while the larger medium- and long-range aircrafts will use hydrogen for propulsion. This was performed based on efficiency and weight considerations for civil aviation and other economic sectors. In the present analysis, a levelised average value of 30% is used for the thermal efficiency of the gas turbines used for smaller airliners. If electrical power was used, the conversion from electrical power at the source, allowing for heavier weights, transmission losses, and electrical equipment losses, was estimated at 70%. Hence, the electrical power needed to deliver the same propulsive power as 6.6 PJ of fuel energy (Item 3, Column 4) is much lower: 2.85 PJ (Item 3, Column 6). On the other hand, the amount of energy delivered by hydrogen increases. Based on the evaluation by [33], airliners from the first innovation wave would have more voluminous bodies, resulting in higher drag. Column 4 shows the energy requirements. So, the 44.3 PJ of jet fuel (this is the fuel calorific value) needed for a hydrocarbon-based 2050 scenario (row 3, Column 3) would be replaced in a decarbonised scenario as follows: 6.6 PJ by electricity (Column 4, top row 3) and 37.7 PJ by hydrogen (Column 4, lower row 3). Column 5 shows the replacement energy sources (again, for row 3, we have two: electricity and liquid hydrogen). Column 6 shows the direct electrical energy requirement. In the case of jet fuel, the 6.6 PJ of jet fuel will be replaced by 2.85 PJ of electrical energy generated at the source. This lower electrical energy requirement is due to the much higher efficiency of the electrical equipment. This figure includes transmission losses of 30%. Column 7 shows the electrical energy needed to produce the hydrogen that would replace the 37.7 PJ jet fuel calorific value. In this case, 75.36 PJ of electrical energy is needed. This much higher energy requirement is due to the inefficiencies of hydrogen electrolysis, liquefaction, and the lower efficiency of the hydrogen aircraft that could be available in 2050. This lower efficiency of the aircraft is visible in Column 8, where the hydrogen aircraft energy (41.45 PJ) is slightly higher than that of a conventional aircraft (37.7 PJ—Column 4). Column 9 shows the amount of hydrogen needed for the sector and (Column 10) shows the fractional use; in the case of jet fuel replacement, this is 28.53% of the national hydrogen requirement. Similar assessments were performed across the list of items, facilitating the calculation of the electrical and hydrogen requirements. The hydrogen requirements, in turn, led to their respective electrical requirements (Column 7). It was assumed that aviation fuel exclusively requires liquid hydrogen, while all other sectors utilise hydrogen gas. Ref. [34] states that the global liquid production of hydrogen is slightly more than 100 ktonnes p.a., which is about 0.15% of the global hydrogen production, making this approximation reasonably precise for the current analysis. Table 1 (Column 10) shows that 28.5 percent of the produced hydrogen is liquid hydrogen for aviation. This proportion remains constant throughout the study, and the global efficiency of hydrogen production is maintained at 0.65 due to the proportion of the produced hydrogen being liquid. The bottom two rows show the totals.
Libya Energy Panorama in 2050
nColumn12345678910
1ItemCurrent Energy Use PJ 20202050 Energy Demand PJReplacement Factors to DecarboniseNeed to Replace PJReplace withElectricity PJ to Satisfy Direct Electrical DemandElectricity for Hydrogen—PJH2 FCV PJH2 kTonneH2 % of Use
Motor gasoline227.01410.90.8328.7Electricity70.44
2 0.282.2H2 Gas 58.7041.09342.428.28
Diesel for transport165.60299.70.8239.8Electricity85.64
3 0.259.9H2 Gas 71.3749.96416.334.38
Jet fuel24.4944.30.156.6Electricity2.85
4 0.8537.7LH2 75.3641.45345.428.53
Other (marine, etc.)2.875.20.73.6Electricity1.56
5 0.31.6H2 Gas 2.231.5613.01.07
6Liquid fossil fuel for electricity9.660Replaced with wind power for electricity demand
7Gas for electricity337.500.0Replaced with wind power for electricity demand
8Gas: domestic21.6039.1139.1Electricity39.10
Gas: other20.7037.50.726.2Electricity11.24
9 0.311.2H2 Gas 16.0611.2493.77.74
10Wind power0.020.04 0.04Electricity0.04
11Electricity from gas104.83189.7 189.7Electricity189.75
12Electricity from liquid fossil fuel3.466.3 6.3Electricity6.26
Total requirement809.451032.7 406.86223.70145.291210.7100
Total electricity108.32196 Total 2050630.56
Table 2. Analysis for the summer season. This is the ‘pinch’ season when hydrogen exports are negligible. This season represents the closest match between supply and demand, arising from the lowest wind density during the year. Column 1 shows the power demand (Figure 1). Column 2 shows the energy demand for the hour (column 1 × 3600). Column 3 shows the averaged wind density at all the locations. Column 4 shows the resulting wind power. Column 5 shows the wind energy produced in the hour (column 4 × 3600). Column 6 indicates the covariance between the supply and demand. If this balance is positive, it will be used to produce hydrogen, and Columns 7–11 provide details of the hydrogen production. It is worth noting that Column 11 explains the hydrogen storage starting at 2 p.m. It continues until 5 a.m., and then the stored hydrogen is used to cover the deficit resulting from wind energy from 6 a.m. to 1 p.m. To meet the demand if the value in Column 6 is negative, for the energy deficit, H2CCGTs are published (Column 14), with Columns 12 and 13 identifying the hydrogen consumed in terms of the energy and mass within the H2CCGTs. Finally, Column 15 shows the number of 600 MW H2CCGTs deployed at a 500 MW capacity, considering factors such as degradation, height, and ambient conditions needed to correct the power deficit.
Column123456789101112131415
Summer
Hour
Power Demand GWEnergy Demand for the Hour TJWind Density KW/m2Wind Power Produced GWWind Energy Produced for the Hour TJSupply–Demand TJWind Energy for H2—TJElectrical Power for H2—GWH2 Energy TJ of FCVTonnes of H2
Produced
Tonnes of H2 in StorageH2CCGT Fuel Energy Needed TJTonnes of H2
Consumed
H2 CCGT GWNo 600 MW Single-Shaft GTs Need
00:0010.6138.2092041.23148.44110.24110.2430.6271.65597.129647.080000
01:008.3930.2193241.77150.38120.17120.1733.3878.11650.9310,298.010000
02:007.7928.0389340.04144.14116.11116.1132.2575.47628.9310,926.940000
03:008.4030.2582436.93132.95102.70102.7028.5366.75556.2911,483.220000
04:0010.6538.3559426.6095.7757.4257.4215.9537.32311.0011,794.220000
05:0014.5452.3540418.1165.2112.8612.863.578.3669.6711,863.890000
06:0018.4666.4525211.2740.58−25.86−25.86−7.18−16.81−140.0811,723.810000
07:0023.2283.601114.9817.93−65.67000010,562.71139.331161.1018.2436.57
08:0021.7878.41000−78.4100009473.64130.691089.0721.7844
09:0021.1676.17000−76.1700008415.72126.951057.9221.1642.32
10:0019.7871.20000−71.2000007426.86118.66988.8719.7839.55
11:0016.8360.59000−60.5900006585.29100.99841.5716.8333.66
12:0018.6467.10000−67.1000005653.41111.83931.8818.6437.28
13:0020.6374.281215.4119.48−54.7900004621.80123.791031.6115.2230.53
14:0018.6767.2065829.49106.1638.9638.9610.8225.33211.05211.050000
15:0017.2362.01135260.61218.20156.19156.1943.39101.52846.011057.060000
16:0017.6863.64197988.68319.26255.62255.6271.01166.161384.632441.690000
17:0018.5066.582308103.44372.38305.79305.7984.94198.771656.394098.070000
18:0018.2065.54196888.21317.54252.01252.0170.00163.811365.055463.120000
19:0017.2462.05137961.83222.59160.54160.5444.59104.35869.606332.720000
20:0016.9961.15108648.67175.21114.07114.0731.6974.14617.866950.580000
21:0015.4355.56103046.17166.23110.66110.6630.7471.93599.437550.020000
22:0014.2551.31110549.53178.30126.99126.9935.2782.54687.848237.850000
00:2312.5345.11120954.18195.04149.93149.9341.6597.45812.109049.960000
Total 1395.34 3085.80 2164.40 1406.8611,723.81 852.247102.0200
H2
Produced K-tonnes
11,723.81H2 for CCGT7102.02Other H23693H2 exports5 Wind farm20,529
km2
Table 3. Analysis for the spring season; the comments for Table 2 apply.
Column123456789101112131415
Spring
Hour
Power Demand GWEnergy Demand for the Hour TJWind Density KW/m2Wind Power Produced GWWind Energy Produced for the Hour TJSupply–Demand TJWind Energy for H2—TJElectrical Power for H2 GWH2 Energy TJ of FCVTonnes of H2
Produced
Tonnes of H2 in StorageH2CCGT Fuel Energy Needed TJTonnes of H2
Consumed
H2 CCGT GW
No 600 MW Single-Shaft GTs Need
00:004.2115.16115051183.92168.76168.7646.88110914.11914.110000
01:003.3812.16169775271.50259.35259.3572.041691404.792318.900000
02:003.1311.272258100361.22349.95349.9597.212271895.564214.470000
03:003.2311.622242100358.63347.01347.0196.392261879.666094.130000
04:004.5416.34206192329.75313.41313.4187.062041697.637791.750000
05:005.8621.09174277278.71257.62257.6271.561671395.429187.170000
06:008.9132.07190184304.11272.04272.0475.571771473.5710,660.740000
07:0010.2036.712344104374.98338.28338.2893.972201832.3312,493.070000
08:009.8535.462649118423.79388.33388.33107.872522103.4414,596.510000
09:009.3833.782752122440.18406.41406.41112.892642201.3816,797.890000
10:008.7231.392809125449.37417.97417.97116.102722264.0219,061.910000
11:007.5227.092824125451.72424.63424.63117.952762300.1021,362.010000
12:008.0128.832807125449.06420.22420.22116.732732276.2123,638.220000
13:008.8932.012759123441.32409.31409.31113.702662217.1125,855.330000
14:008.0328.90210193336.17307.27307.2785.352001664.3827,519.710000
15:006.8624.70145665232.89208.19208.1957.831351127.6828,647.390000
16:007.3326.39105847169.18142.79142.7939.6693773.4329,420.820000
17:007.6727.6068931110.2982.6982.6922.9754447.8829,868.700000
18:007.6027.3566830106.7979.4379.4322.0652430.2730,298.960000
19:007.0525.373611657.7232.3432.348.9821175.2030,474.160000
20:007.0925.51000−25.52−25.5200030,119.7442.53354.427.0914.18
21:006.5523.56000−23.57−23.5700029,792.4239.28327.326.5513.09
22:005.8320.99000−21.00−21.0000029,500.7735.00291.655.8311.67
00:234.9917.972621241.9523.9723.976.6616129.8529,630.620000
Total 593.36 6173.25 5649.97 367.4830,604.02 117973.396
H2
produced
K-tonnes
30,604.02H2 for CCGT973.396Other H23693H2 exports25,936.9 Wind farm20,529
km2
Table 4. Analysis for the winter season; the comments for Table 2 apply.
Column123456789101112131415
Winter
Hour
Power Demand GWEnergy Demand for the Hour TJWind Density KW/m2Wind Power Produced GWWind Energy Produced for the Hour TJSupply–Demand TJWind Energy for H2—TJElectrical Power for H2 GWH2 Energy TJ of FCVTonnes of H2
Produced
Tonnes of H2 in StorageH2CCGT Fuel Energy Needed TJTonnes of H2
Consumed
H2 CCGT GWNo 600 MW Single-Shaft GTs Need
00:0010.9939.574180185.74668.66629.10629.10174.75408.913407.613407.610000
01:008.8131.724200186.63671.87640.15640.15177.82416.103467.496875.090000
02:008.1929.484200186.63671.87642.39642.39178.44417.553479.6010,354.690000
03:008.5230.664200186.63671.87641.21641.21178.11416.783473.2113,827.900000
04:0011.8742.724200186.63671.87629.15629.15174.76408.953407.8817,235.780000
05:0015.5555.994200186.63671.87615.88615.88171.08400.323336.0220,571.810000
06:0023.3784.124200186.63671.87587.75587.75163.26382.043183.6423,755.450000
07:0026.5695.634200186.63671.87576.25576.25160.07374.563121.3326,876.780000
08:0025.7192.544200186.63671.87579.33579.33160.92376.563138.0230,014.810000
09:0024.6588.744146184.21663.16574.42574.42159.56373.373111.4333,126.240000
10:0022.9082.443823169.86611.51529.07529.07146.96343.892865.7935,992.020000
11:0019.4069.843407151.37544.95475.11475.11131.97308.822573.4938,565.510000
12:0020.6674.393199142.16511.78437.39437.39121.50284.302369.1940,934.700000
13:0023.2183.543093137.43494.73411.19411.19114.22267.272227.2843,161.990000
14:0020.9575.432916129.59466.53391.11391.11108.64254.222118.4945,280.480000
15:0018.1465.312717120.74434.68369.37369.37102.60240.092000.7347,281.210000
16:0019.1368.872569114.17411.01342.14342.1495.04222.391853.2649,134.470000
17:0019.7771.182361104.91377.67306.49306.4985.14199.221660.1550,794.610000
18:0019.5970.52207192.04331.35260.83260.8372.45169.541412.8252,207.430000
19:0018.3265.96178279.18285.03219.07219.0760.85142.401186.6553,394.080000
20:0018.3866.16158070.20252.73186.58186.5851.83121.271010.6254,404.700000
21:0017.1361.67140562.44224.78163.11163.1145.31106.02883.5055,288.190000
22:0015.3055.07136560.67218.40163.34163.3445.37106.17884.7456,172.930000
00:2313.0346.91160671.35256.85209.94209.9458.32136.461137.2057,3100000
Total 1548.49 12,129 10,580 687757,310 00
H2
produced
K-tonnes
57,310H2 for CCGT0Other H23693H2 exports53,616.4 Wind farm20,529
km2
Table 5. Analysis for the autumn season; the comments for Table 2 apply.
Column123456789101112131415
Autumn
Hour
Power Demand GWEnergy Demand for the Hour TJWind Density KW/m2Wind Power Produced GWWind Energy Produced for the Hour TJSupply–Demand TJWind Energy for H2—TJElectrical Power for H2 GWH2 Energy TJ of FCVTonnes of H2
Produced
Tonnes of H2 in StorageH2CCGT Fuel Energy Needed TJTonnes of H2
Consumed
H2 CCGT GWNo 600 MW Single-Shaft GTs Need
00:006.5423.562537112.72405.81382.25382.25106.18248.462070.532070.530000
01:005.2518.892421107.59387.33368.44368.44102.35239.491995.734066.260000
02:004.8817.56211193.80337.67320.12320.1288.92208.081733.985800.240000
03:005.0718.26173677.13277.68259.42259.4272.06168.621405.187205.420000
04:007.0725.44143963.94230.17204.73204.7356.87133.081108.978314.390000
05:009.2633.33118552.67189.63156.29156.2943.42101.59846.609160.990000
06:0013.9150.0874433.08119.0768.9968.9919.1644.84373.699534.680000
07:0015.8156.9348121.3977.0020.0720.075.5713.05108.719643.390000
08:0015.3055.1038116.9160.885.795.791.613.7631.349674.730000
09:0014.6852.8428812.8146.12−6.7200008940.9188.06733.831.873.73
10:0013.6349.0824010.6638.36−10.7200008259.2281.80681.682.985.96
11:0011.5541.5825811.4841.32−0.2500007681.7469.30577.480.070.14
12:0012.3044.2934915.5055.8111.5311.533.207.4962.437744.170000
13:0013.8149.7352923.5084.6134.8834.889.6922.67188.927933.100000
14:0012.4744.9085337.90136.4491.5491.5425.4359.50495.828428.910000
15:0010.8038.88152867.91244.46205.58205.5857.11133.631113.569542.470000
16:0011.3941.00215795.83344.98303.97303.9784.44197.581646.5111,188.980000
17:0011.7742.38215695.80344.87302.49302.4984.02196.621638.4712,827.450000
18:0011.6641.99198688.25317.69275.70275.7076.58179.201493.3714,320.810000
19:0010.9139.27190684.68304.85265.58265.5873.77172.631438.5715,759.390000
20:0010.9439.38183981.73294.22254.84254.8470.79165.651380.3917,139.770000
21:0010.2036.71178779.41285.87249.15249.1569.21161.951349.5818,489.350000
22:009.1132.78172276.53275.51242.73242.7367.42157.771314.7819,804.130000
00:237.7627.93164072.89262.42234.49234.4965.14152.421270.1621,074.300000
Total 921.89 5162.77 4258.58 2768.0723,067.29 293.191992.992
H2
produced
K-tonnes
23,067.29H2 for CCGT1992.99Other H23693H2 exports17,381 Wind farm20,529
km2
Table 6. National requirements—two scenarios: meeting the summer demands and using wind farms to their full capacities and exporting yearly 2100 PJ of hydrogen using wind farms to their full capacities.
ScenarioWind Farm GWWind Farm km2600 MW of H2
CCGTS
Electrolysis GWStorage of H2
Tonnes
Transmission GWHydrogen Export PJ
Self-sufficient18720,5294417575,3101971061
Export 2100 PJ of H231134,19944303101,0543272100
Disclaimer/Publisher’s Note: The statements, opinions and data contained in all publications are solely those of the individual author(s) and contributor(s) and not of MDPI and/or the editor(s). MDPI and/or the editor(s) disclaim responsibility for any injury to people or property resulting from any ideas, methods, instructions or products referred to in the content.

