Article

Optimal Trading Volume of Electricity and Capacity of Energy Storage System for Electric Vehicle Charging Station Integrated with Photovoltaic Generator

1
Smart Robot Convergence Application Research Center, Pukyong National University, Busan 48513, Republic of Korea
2
Department of Intelligent Robot Engineering, Pukyong National University, Busan 48513, Republic of Korea
3
Department of AI Electrical Engineering, Pai Chai University, Daejeon 35345, Republic of Korea
4
Department of Control and Instrumentation Engineering, Pukyong National University, Busan 48513, Republic of Korea
*
Authors to whom correspondence should be addressed.
Energies 2024, 17(4), 936; https://doi.org/10.3390/en17040936
Submission received: 14 January 2024 / Revised: 4 February 2024 / Accepted: 14 February 2024 / Published: 17 February 2024
(This article belongs to the Special Issue Advances in Research and Practice of Smart Electric Power Systems)

Abstract

:
As penetration of EVs in the transportation sector is increasing, the demand for the mandatory installation of charging infrastructure also is increasing. In addition, renewable energy and energy storage systems (ESSs) are being reviewed for use in electric vehicle charging stations (EVCSs). In this paper, we present an optimal electricity trading volume and an optimal installation capacity of ESSs to maximize the daily profit of the EVCSs equipped with solar power generation when the EVCSs are licensed to sell energy to the power supplier during a specific time period. By formulating and solving the optimization problem of the EVCSs, this paper analyzes validation results for the different useful lives of ESSs, the peak power of a PV generator, and weather conditions at the Yangjae Solar Station and the Suseo Station public parking lot, Seoul, Republic of Korea. Furthermore, this paper validates that the daily expected profit of EVCSs with the proposed method outperforms the profit of conventional EVCSs which do not utilize ESSs.

1. Introduction

In response to the escalating rate of carbon emissions, there has been a global effort to encourage reduction in the utilization of fossil fuels [1]. Since the Paris Agreement, many efforts have been made worldwide to transition to renewable energy. Carbon dioxide emission rates in the transportation sector are increasing faster than overall carbon dioxide emission rates, so an electric vehicle (EV) distribution policy has been implemented to reduce carbon dioxide emissions [2,3]. For instance, the Republic of Korea established the fourth Basic Plan for EVs jointly with related ministries to reduce carbon dioxide emissions in the transportation sector by 24% until 2030 [4]. When it comes to the global market, the global sales of electric cars exceeded 10 million in 2022, which is anticipated to grow by 35%, reaching approximately 14 million by the end of 2023 [5]. With increased production volumes and reduced battery costs, EVs are projected to be cost-competitive with conventional vehicles in the next ten years [6]. Therefore, as the penetration of EVs in the transportation sector increases, the demand for installing charging infrastructure also needs to be met.
Research related to selecting the location of electric vehicle charging stations (EVCSs) has been conducted to set an efficient budget for the installation of EVCSs [7]. Optimal locations of EV fast-charging stations were proposed to minimize the social cost related to both the transportation and the distribution network [8]. The number of chargers in each station and the increasing EV penetration ratio was considered to optimize EVCS locations [9]. Power line conditioning capability was considered to optimize EVCS locations [10].
The research for EVCS operation also has been performed based on the given location of EVCSs. A dispatch strategy of EVCSs was proposed to minimize operation costs and maximize power consumption flexibility [11]. A charging scheduling strategy of EVCSs considering the autonomous valet parking system was proposed in [12]. A real-time decision-making strategy for aggregation in parking lots was proposed to manage PEV charging, considering the state of charging (SoC) and departure time [13]. Management of recharge scheduling was performed to maximize the profit of the individual parking lots considering a realistic vehicular mobility/parking pattern of EVs [14]. As the number of EVCSs increases, increasing power demand may deteriorate the stability of the power distribution network [15]. In this case, utilization of the energy storage system (ESS) can ensure the safety and stability of the grid system and power quality [16,17]. A study is presented of a network of charging stations equipped with the ESS and an allocation scheme concerning power and customer routes to analyze the economic scenario [18]. A framework is proposed to optimize the offering/bidding strategy of an ensemble of charging stations coupled with ESSs [19]. However, in Refs. [18,19], renewable energy systems such as a photovoltaic (PV) generator are not considered. So, it is difficult to analyze the EVCS operating strategy combined with the PV generator. The EVCS operating strategy is proposed combined with a small PV generator which buys solar photovoltaic power at home and charges the purchased electricity to the EV [20]. A charging and discharging decision-making strategy is proposed for a virtual energy hub system which contains an electric bus charging station, a PV generator, and an ESS [21]. However, the ESS capacities in Refs. [20,21] are not optimized to consider the installation and maintenance cost of the EVCS.
An approach to determine the optimal size of the ESS for efficient utilization of a fast-charging station is proposed in [22]. The capacity of the ESS is optimized by assuming that the ESS stores electrical energy during off-peak hours and returns the stored energy during peak hours to consider the stability of the grid network. A method is presented that determines the size of the ESS considering the average waiting time of EVs arriving at the fast-charging station [23]. Cost minimization, peak shaving, and resilience enhancement are considered to optimize the ESS capacity of a fast-charging station [24]. However, these research studies do not consider the utilization of renewable energy systems such as the PV generator, so it is difficult to analyze the optimal capacity for the EVCS which utilizes a PV generator. An optimal renewable energy generation system for an EV charging station is analyzed by considering the station’s actual load profile, carbon emissions, and economic evaluation for a specific location in the Republic of Korea [25]. Although Ref. [26] presents an optimized charging/discharging operation planning by accounting for the PV and the ESS for EV charging stations, this research does not consider the utilization of EVCS surplus energy for enhancing grid stability at peak load hours.
Recently, the renewable energy-linked electric vehicle charging service applied by the Seoul Energy Corporation, Jeju Electric Vehicle Service, and LG Energy Solution consortium received approval from the Ministry of Trade, Industry and Energy. As a result, it became possible to operate the EVCSs linked to renewable energy, albeit to a limited extent, and EVCSs with a PV generator were installed and operated at Yangjae Station and Suseo Station in Seoul. If the ESS of the EVCS can store energy from the PV generator and from purchasing during the off-peak hours, the grid’s stability during peak load hours can be enhanced once the EVCS is licensed to sell energy to the power supplier.
With these facts in mind, in this paper, we present an optimal electricity trading volume and an optimal installation capacity of the ESS to maximize the daily revenue of the EVCS equipped with solar power generation when the EVCS is licensed to sell energy to the power supplier during a specific time period. The contributions of this paper can be summarized as follows:
  • This paper presents a linear function to represent the daily cost of the EVCS by considering both the installation capacity of the ESS and the electricity trading volume with both the EV charging customers and the power supplier.
  • This paper presents new constraints for optimizing the EVCS operating strategy in the case that the EVCS can sell the energy to the power supplier that has to manage the burden of power demand management at peak load hours.
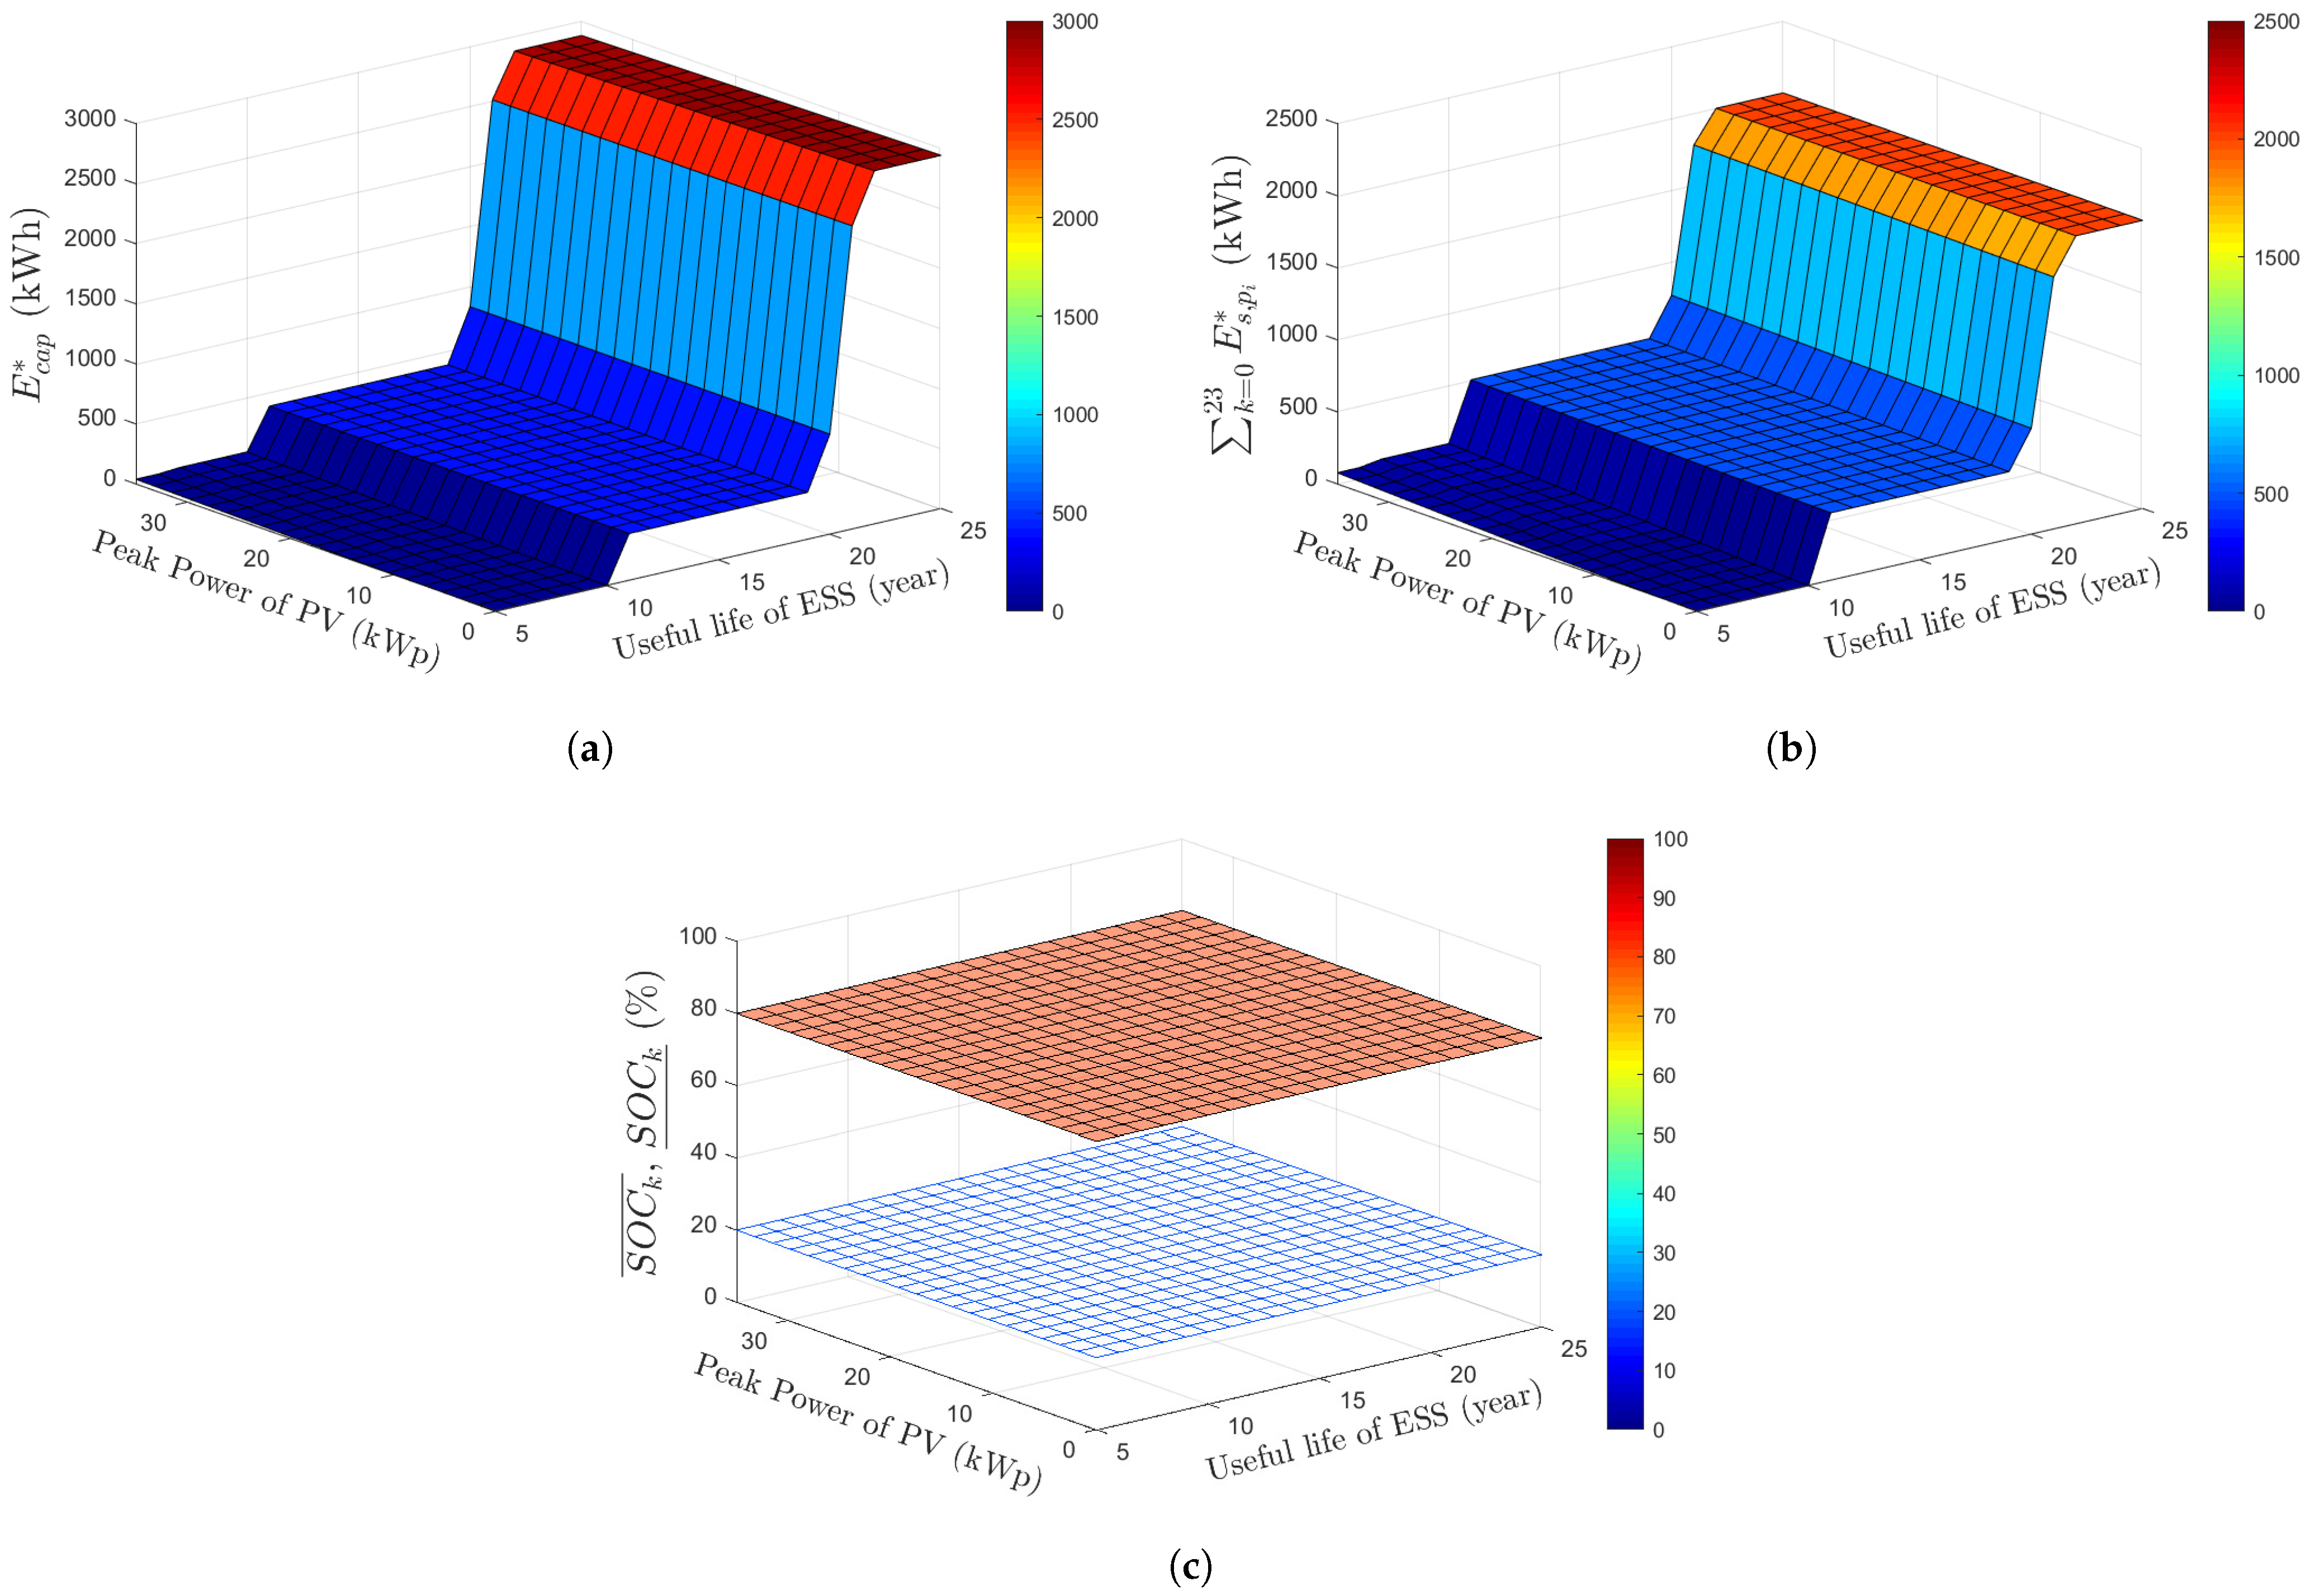
  • This paper presents validation results of an optimized solution using linear programming that guarantees a global minimum of EVCS operating costs for various simulation conditions, such as different peak powers of the PV generator, the useful life of the ESS, weather conditions, and EVCS locations.
  • This paper presents comparative studies of the daily profits of each EVCS operating strategy between the proposed method and the EVCS operating strategy that does not utilize the ESS and shows the proposed method’s qualitative outperformance.
The remainder of this paper is organized as follows. Section 2 describes the optimization problem of the EVCS operating strategy equipped with solar power generation when the EVCS is licensed to sell energy to the power supplier during a specific time. In Section 3, we present the various validation results of the proposed optimal EVCS operating strategy for sunny and cloudy weather conditions at the Yangjae Solar Station and the Suseo Station public parking lot, Seoul, Republic of Korea by changing the peak power of the PV generator and the useful life of the ESS. Furthermore, this paper presents comparative studies of the daily expected profit between the proposed method and the EVCS operating strategy, which does not utilize the ESS. By comparing the daily profit of each EVCS operating strategy, this paper shows that the profit of the proposed method outperforms the method that does not utilize the ESS in the normal useful life of the ESS.

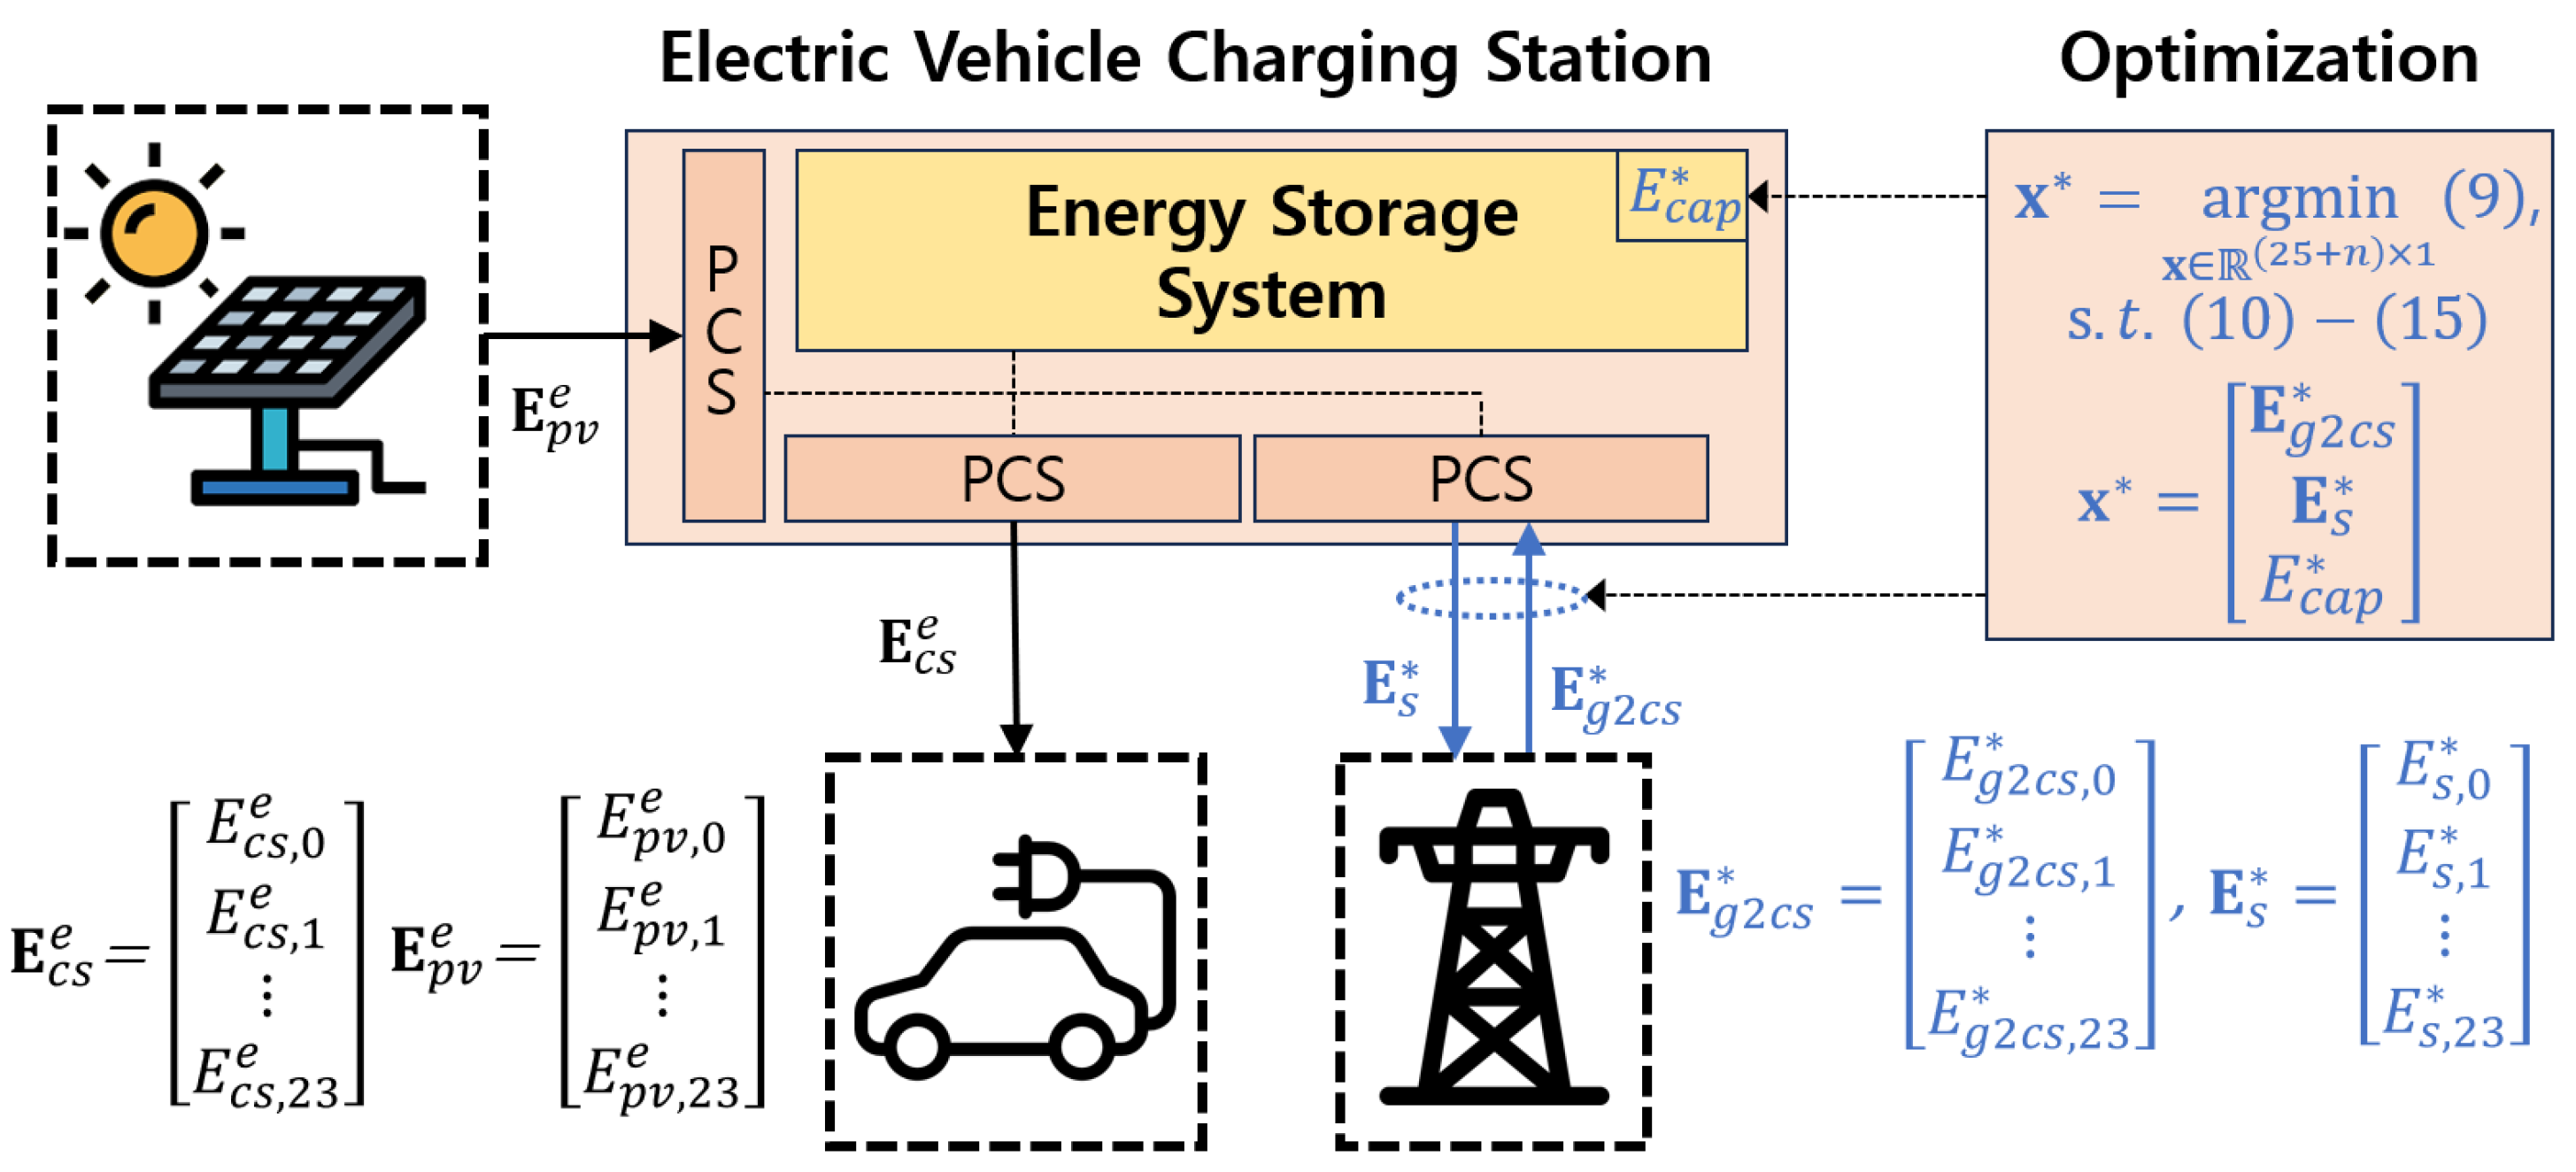
2. Optimization Problem of Electric Vehicle Charging Station

To formulate the optimization problem for the EVCS, let us describe EVCS operating conditions. The EVCS obtains PV energy, which is proportional to the intensity of sunlight and the peak power of the PV generator. Furthermore, the EVCS operator controls the charging status of the ESS to stay between the minimum state of charge (SoC), S o C min , and the maximum SoC, S o C max , to maximize the efficiency of the ESS. Let us define N as the useful life of the ESS and α as the difference between the total installation/maintenance cost of the ESS and the residual value of the ESS after N years. Based on straight-line depreciation, the total installation and maintenance cost of the ESS can be converted to daily cost factor c e s s (KRW/kWh) as
c e s s = α 365 × N .
Let us define a set of integer numbers { 0 , 1 , , n } as [ 0 : n ] . Let us define hourly energy demand expectation sold in the EVCS as E c s , k e , k [ 0 : 23 ] (kWh) and hourly energy supply expectation from the PV generator as E p v , k e , k [ 0 : 23 ] (kWh). Then, we can represent vector forms of them as
E c s e = E c s , 0 e E c s , 1 e E c s , 23 e , E p v e = E p v , 0 e E p v , 1 e E p v , 23 e ,
where E c s e and E p v e R 24 × 1 . The difference between E c s e and E p v e can be defined as
E n e e d e = E n e e d , 0 e E n e e d , 1 e E n e e d , 23 e = E c s e E p v e .
In the case of E n e e d , k e > 0 , k [ 0 : 23 ] , the energy from the PV generator of the EVCS is not sufficient to serve electric vehicle (EV) charging customers at time k (h), so the shortage of energy E n e e d , k e > 0 must be filled by two options below:
  • Energy purchasing from a power supplier.
  • Energy stored in the ESS.
In the case of E n e e d , k e < 0 , k [ 0 : 23 ] , the energy from the PV generator remains after serving energy to the EV charging customers at time k, so surplus energy E n e e d , k e < 0 must be utilized as one of two options below:
  • Energy selling to the power supplier.
  • Energy saving to the ESS.
There exist electricity purchasing costs from power supplier c g , k , k [ 0 : 23 ] , categorized by base load, intermediate load, and peak load hours. Furthermore, there exist system marginal prices (SMP) c s , k , k [ 0 : 23 ] . The vector forms of c s , k and c g , k are
c g = c g , 0 c g , 1 c g , 23 , c s = c s , 0 c s , 1 c s , 23 ,
where c g , c s R 24 × 1 . In the Republic of Korea’s electricity market, the power supplier announces the SMP on an hourly basis a day in advance, and peak load hours are set quarterly. These peak load hours and hours with high SMP indicate the time with a high burden of power demand management for the power supplier [27]. Let us define h s , i , i [ 1 : n s ] as the integer hour number which indicates an ith maximum value of c s , k , k [ 0 : 23 ] , where n s is the integer number. Let us define h p , j , j [ 1 : n p ] as the integer hour number which indicates a peak load hour, where n p is the integer indicating the number of peak load hours. Then, we can represent a set of h s , i and a set of h p , j as
h s = { h s , 1 , h s , 2 , , h s , n s } , h p = { h p , 1 , h p , 2 , , h p , n p } .
This paper considers that the EVCS can sell its surplus energy from the PV generator and the ESS to the power supplier to alleviate the burden of power demand management. Therefore, this paper assumes that there exist constraints for energy selling time, such as
Assumption 1.
The EVCS can sell the energy obtained from both ESS and PV generation only within permitted hours p [ 1 : n ] ,
p [ 1 : n ] = { p 1 , p 2 , , p n } = h p h s ,
where n is determined by the n s and n p of (4). And n s and n p are determined by the Electric Utility Law.
Based on these considerations, we present a cost function and inequality/equality constraints to determine the optimal amount of electricity trading volume and the optimal installation capacity of the ESS to maximize the profit of the EVCS operator utilizing the PV generator. Let us define the amount of the purchasing energy of each hour from the power supplier as E g 2 c s , k , k [ 0 : 23 ] , and a vector form is represented as
E g 2 c s = E g 2 c s , 0 E g 2 c s , 1 E g 2 c s , 23 ,
where E g 2 c s R 24 × 1 . A vector form of selling energy and the SMP can be represented as
E s , p = E s , p 1 E s , p 2 E s , p n , c s , p = c s , p 1 c s , p 2 c s , p n .
Based on these notations, we can define cost function J to represent the daily profit of the EVCS operator by summing the purchasing cost of electricity from the power supplier, the daily converted installation/maintenance cost of the ESS, and the selling price to the power supplier as
J = c g T E g 2 c s c s , p E s , p + c e s s E c a p ,
where E c a p is the installation capacity of the ESS. Cost function J of (8) can be represented as a linear form:
J = F x ,
where
F = c g , 0 c g , 1 c g , 22 c g , 23 c s , p 1 c s , p n c e s s ,
and defining decision variable vector x R ( 24 + n + 1 ) × 1 of an optimization problem as
x = E g 2 c s , 0 E g 2 c s , 1 E g 2 c s , 23 E s , p 1 E s , p n E c a p T .
Each element of decision variables has constraints that the variables are equal to or greater than 0; it is possible to consider that E g 2 c s , k k [ 0 : 23 ] , E s , i i p [ 1 : n ] and E c a p flow in one direction. These energy flows are realized by a power conversion system (PCS), and due to the hardware specification of PCS, we need to consider power transmission limits. Let us define the power transmission limits of the PCS as p p c s m a x . By considering above conditions, inequalities of E g 2 c s , k , E s , p i and E c a p can be obtained as
0 E g 2 c s , k < P p c s max , k [ 0 : 23 ] 0 E s , i < P p c s max , i p [ 1 : n ] .
We consider that the EVCS can sell the surplus energy stored in the ESS to the power supplier at specific times in p [ 1 : n ] . Therefore, an installation capacity of the ESS must be larger than the amount of the selling energy, E s , k , such as
E s , i < E c a p , i p [ 1 : n ] .
When the charging status of the ESS at time k is S o C k , k [ 0 : 23 ] , S o C k is related to energy flow among the PV generator, ESS, EVCS, and power supplier at the previous time step, k 1 . Therefore, relationship equations among E g 2 c s , k k [ 0 : 23 ] , E s , p i i [ 1 : n ] , E c a p and S o C k can be represented as
E c a p S o C k + 1 = E c a p S o C k + i = 0 k E g 2 c s , i E n e e d , i e k [ 0 : 22 ] / p [ 1 : n ] E c a p S o C k + i = 0 k E g 2 c s , i E n e e d , i e E s , k k p [ 1 : n ] .
Furthermore, we can derive inequalities to consider S o C k conditions such as
E c a p S o C min E c a p S o C k E c a p S o C max , k [ 0 : 23 ]
where S o C min , S o C max and S o C 0 are given parameters. To guarantee that the ESS discharges its stored energy at the end of day, let us define an equality constraint of S o C 23 as
E c a p S o C 23 = E c a p S o C 0 + k = 0 22 E g 2 c s , k E n e e d , k e k = 0 22 E s , k = E c a p S o C m i n .
To ensure that the EVCS operator only purchases energy for E c s , k of (2) during p [ 1 : n ] of (5), let us define equality constraints of E g 2 c s , k as
E g 2 c s , i = E c s , i , i p [ 1 : n ] .
Finally, we can obtain the optimal trading volume of electricity for the EVCS operator and the capacity of the ESS by solving the following optimization formulation:
x * = arg min x ( 24 + n + 1 ) F x subject to ( 10 ) ( 15 )
where
x * = E g 2 c s , 0 * E g 2 c s , 1 * E g 2 c s , 23 * E s , p 1 * E s , p n * E c a p * T ,
and Figure 1 shows the schematic of the proposed method. The following section describes the validation results of the proposed optimization problem and the solution of (16) for various EVCS operating scenarios.

3. Validation Results

This section presents validation results of the proposed optimization-based EVCS operating strategy (16), such as the optimal trading volume of electricity for the EVCS and the optimal installation capacity of the ESS. Two simulation dates were selected to validate the optimal EVCS operating strategy for both sunny and cloudy weather conditions (9 March 2023 for cloudy weather conditions in Seoul, Republic of Korea, and 23 March 2023 for sunny weather conditions in Seoul). Furthermore, two locations were selected to compare the profit variation of the proposed optimized EVCS operating strategy according to the different E c s e , with the same E p v e condition (the Yangjae Solar Station and the Suseo Station public parking lot, Seoul). Optimal electricity trading volume and ESS installation capacity were obtained by solving optimization Formulation (16) with a linear programming solver in MATLAB Optimization Toolbox (“linprog” function). All simulations of this paper used a dual simplex algorithm as an optimization solver, a maximum iteration as 10 × ( n e q + n i n e q + n x ) , where n e q is the number of equality, n i n e q is the number of inequality, and n x is the number of the decision variable. The constraint tolerance was set to have 10 4 . The average solution-solving time for various simulation environments was 0.567 s for a 12th-gen Intel CPU (i7-12700F 2.10 GHz).
Considering the resell price of the battery after the useful life of the ESS, α of (1) was set to 700,000 (KRW/kWh), and various simulations were performed by changing the useful life of the ESS. p p c s m a x was set as 250 (kW) by considering the specification of the commercial PCS product. Simulation data of E c s e , c s , c g , and the intensity of sunlight per hour were obtained from a public data portal website [28,29,30,31]. E p v e was estimated based on the sunlight intensity and the peak power of PV used in each simulation. n p of (4) was automatically determined according to c g , which changes quarterly from the power supplier in the Republic of Korea, and in the case of March 2023, n p equaled to six. This paper set n s of (4) to guarantee the n of (5) to be eight. Based on these simulation environments, we validated the solution of optimization Problem (16) in the case of
  • Yangjae Solar Station on 9 March 2023, cloudy weather condition,
  • Yangjae Solar Station on 21 March 2023, sunny weather condition,
  • Suseo Station public parking lot on 9 March 2023, cloudy weather condition,
  • Suseo Station public parking lot on 21 March 2023, sunny weather condition.
To show the effectiveness of the proposed method, we analyzed the daily profit of the EVCS between the proposed EVCS operating strategy and the conventional EVCS operating strategy which does not utilize ESS and optimization.

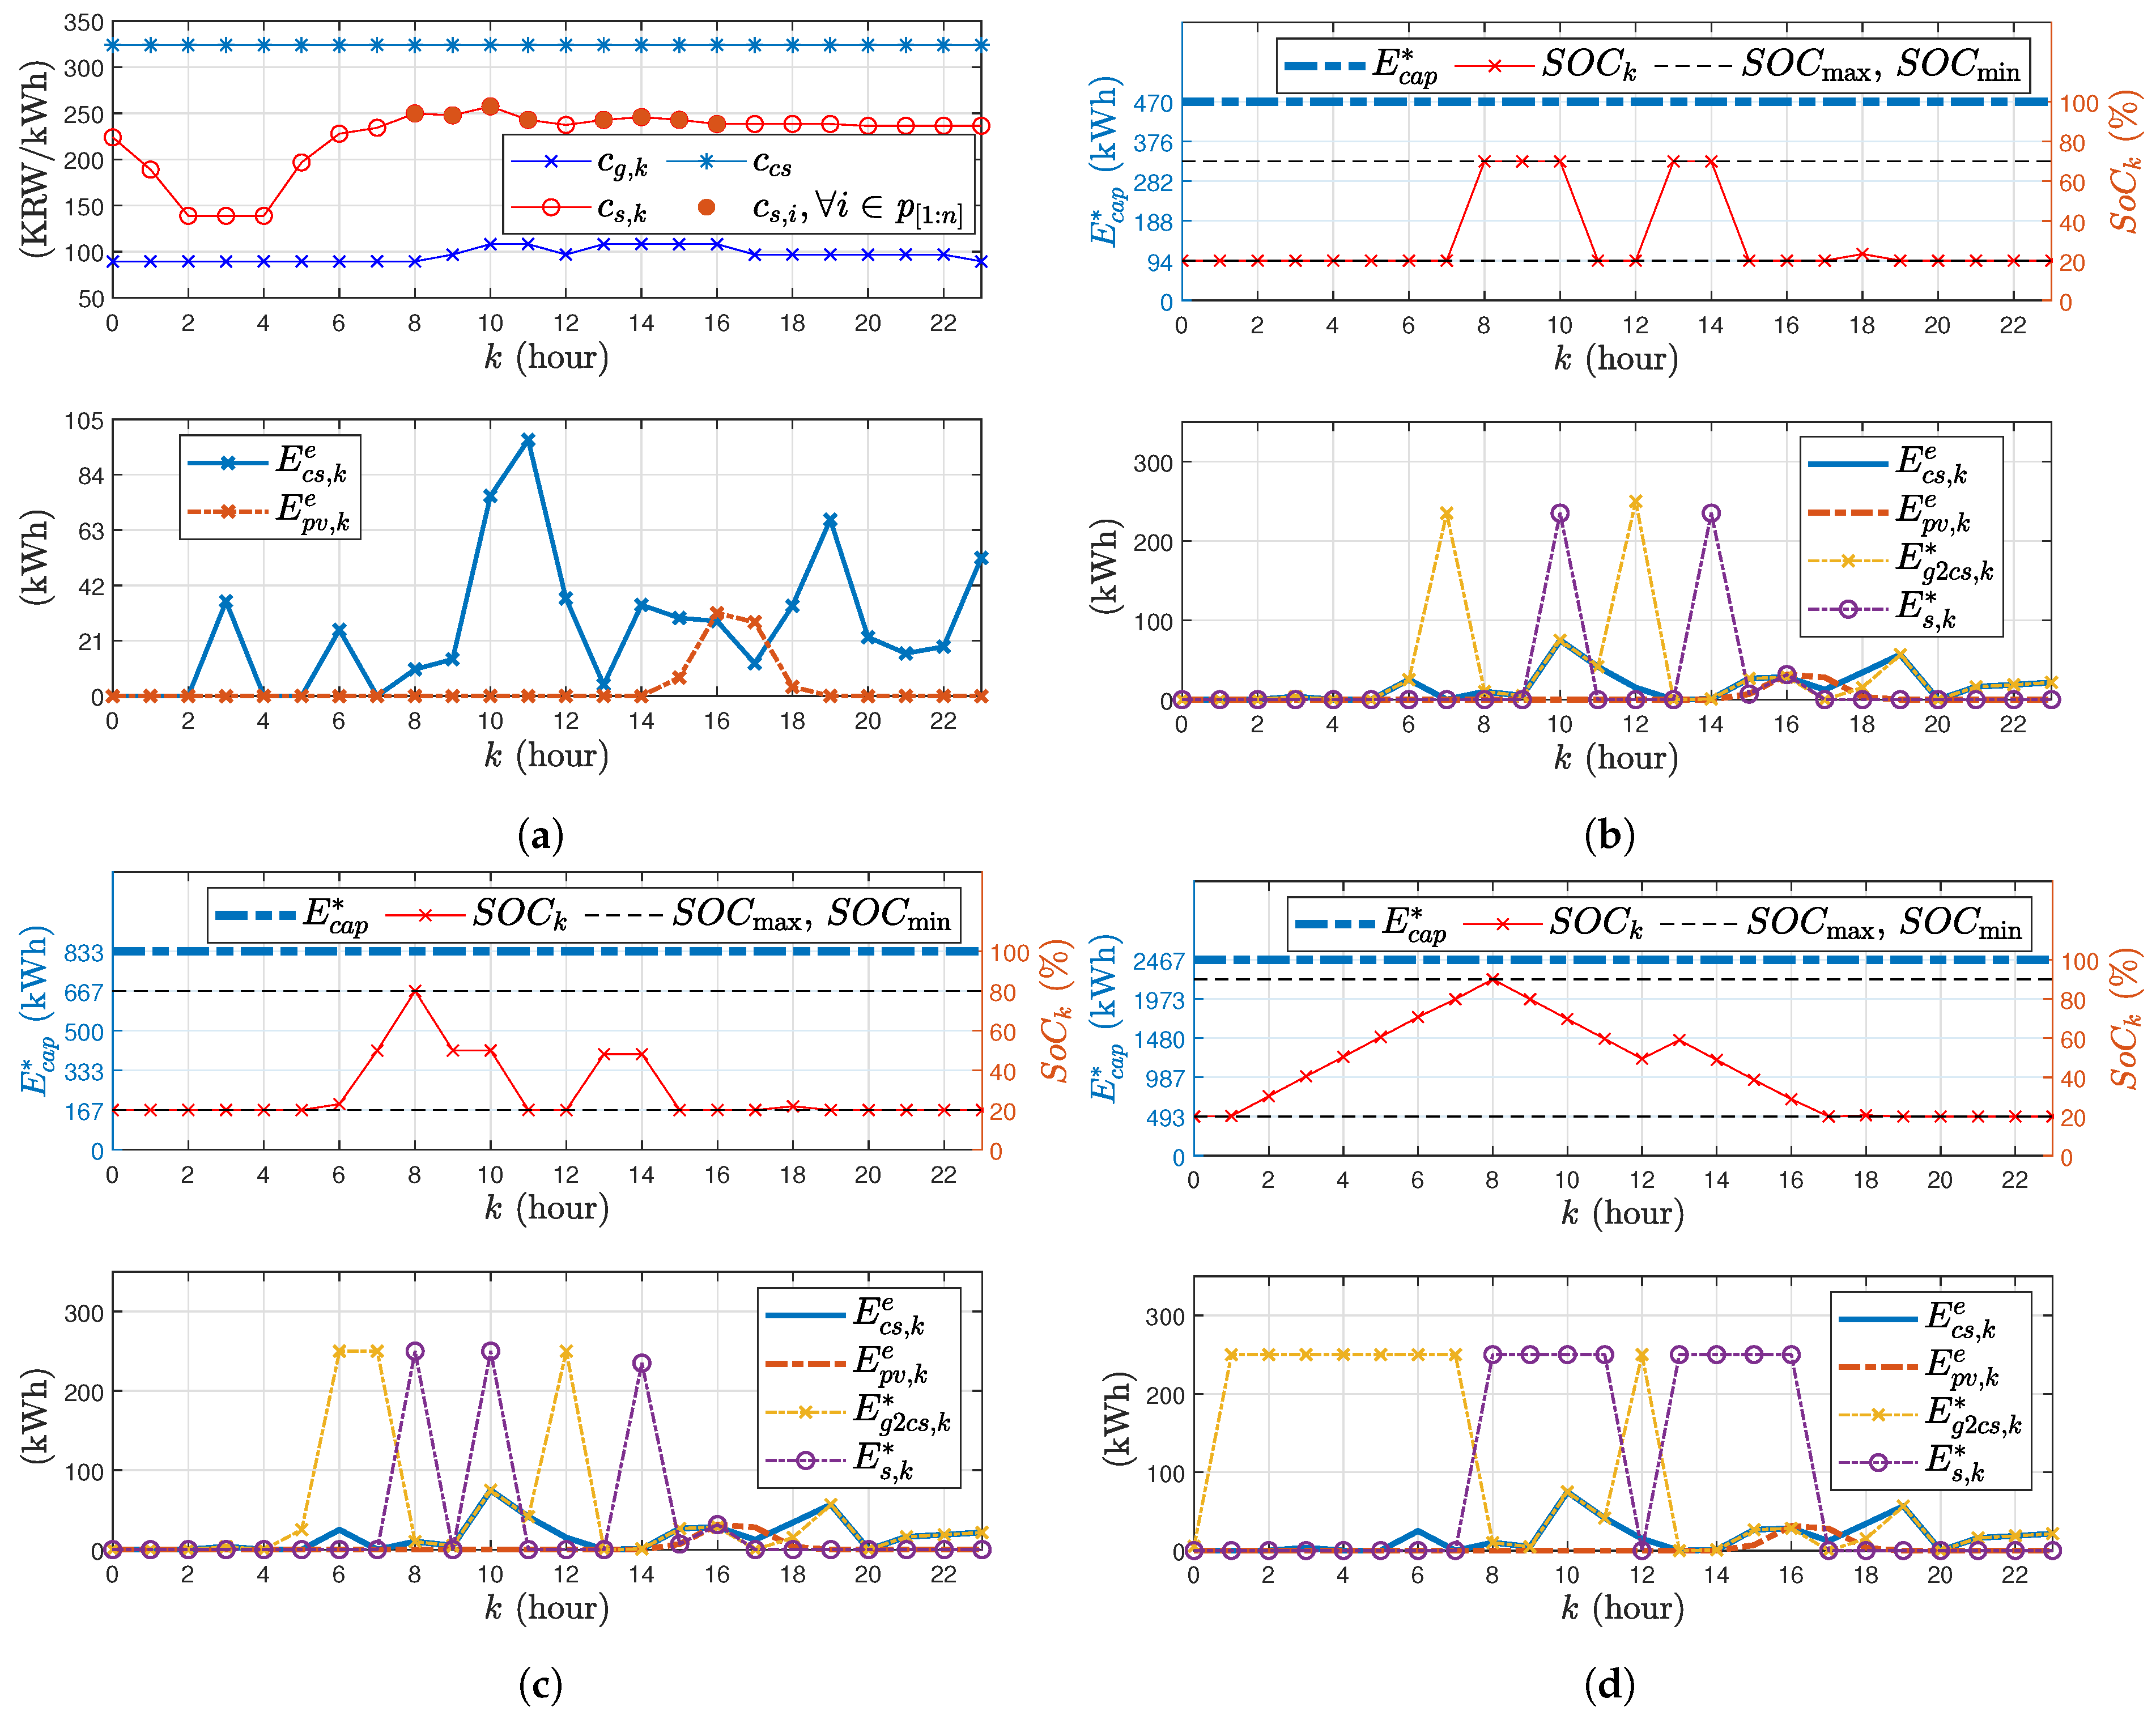
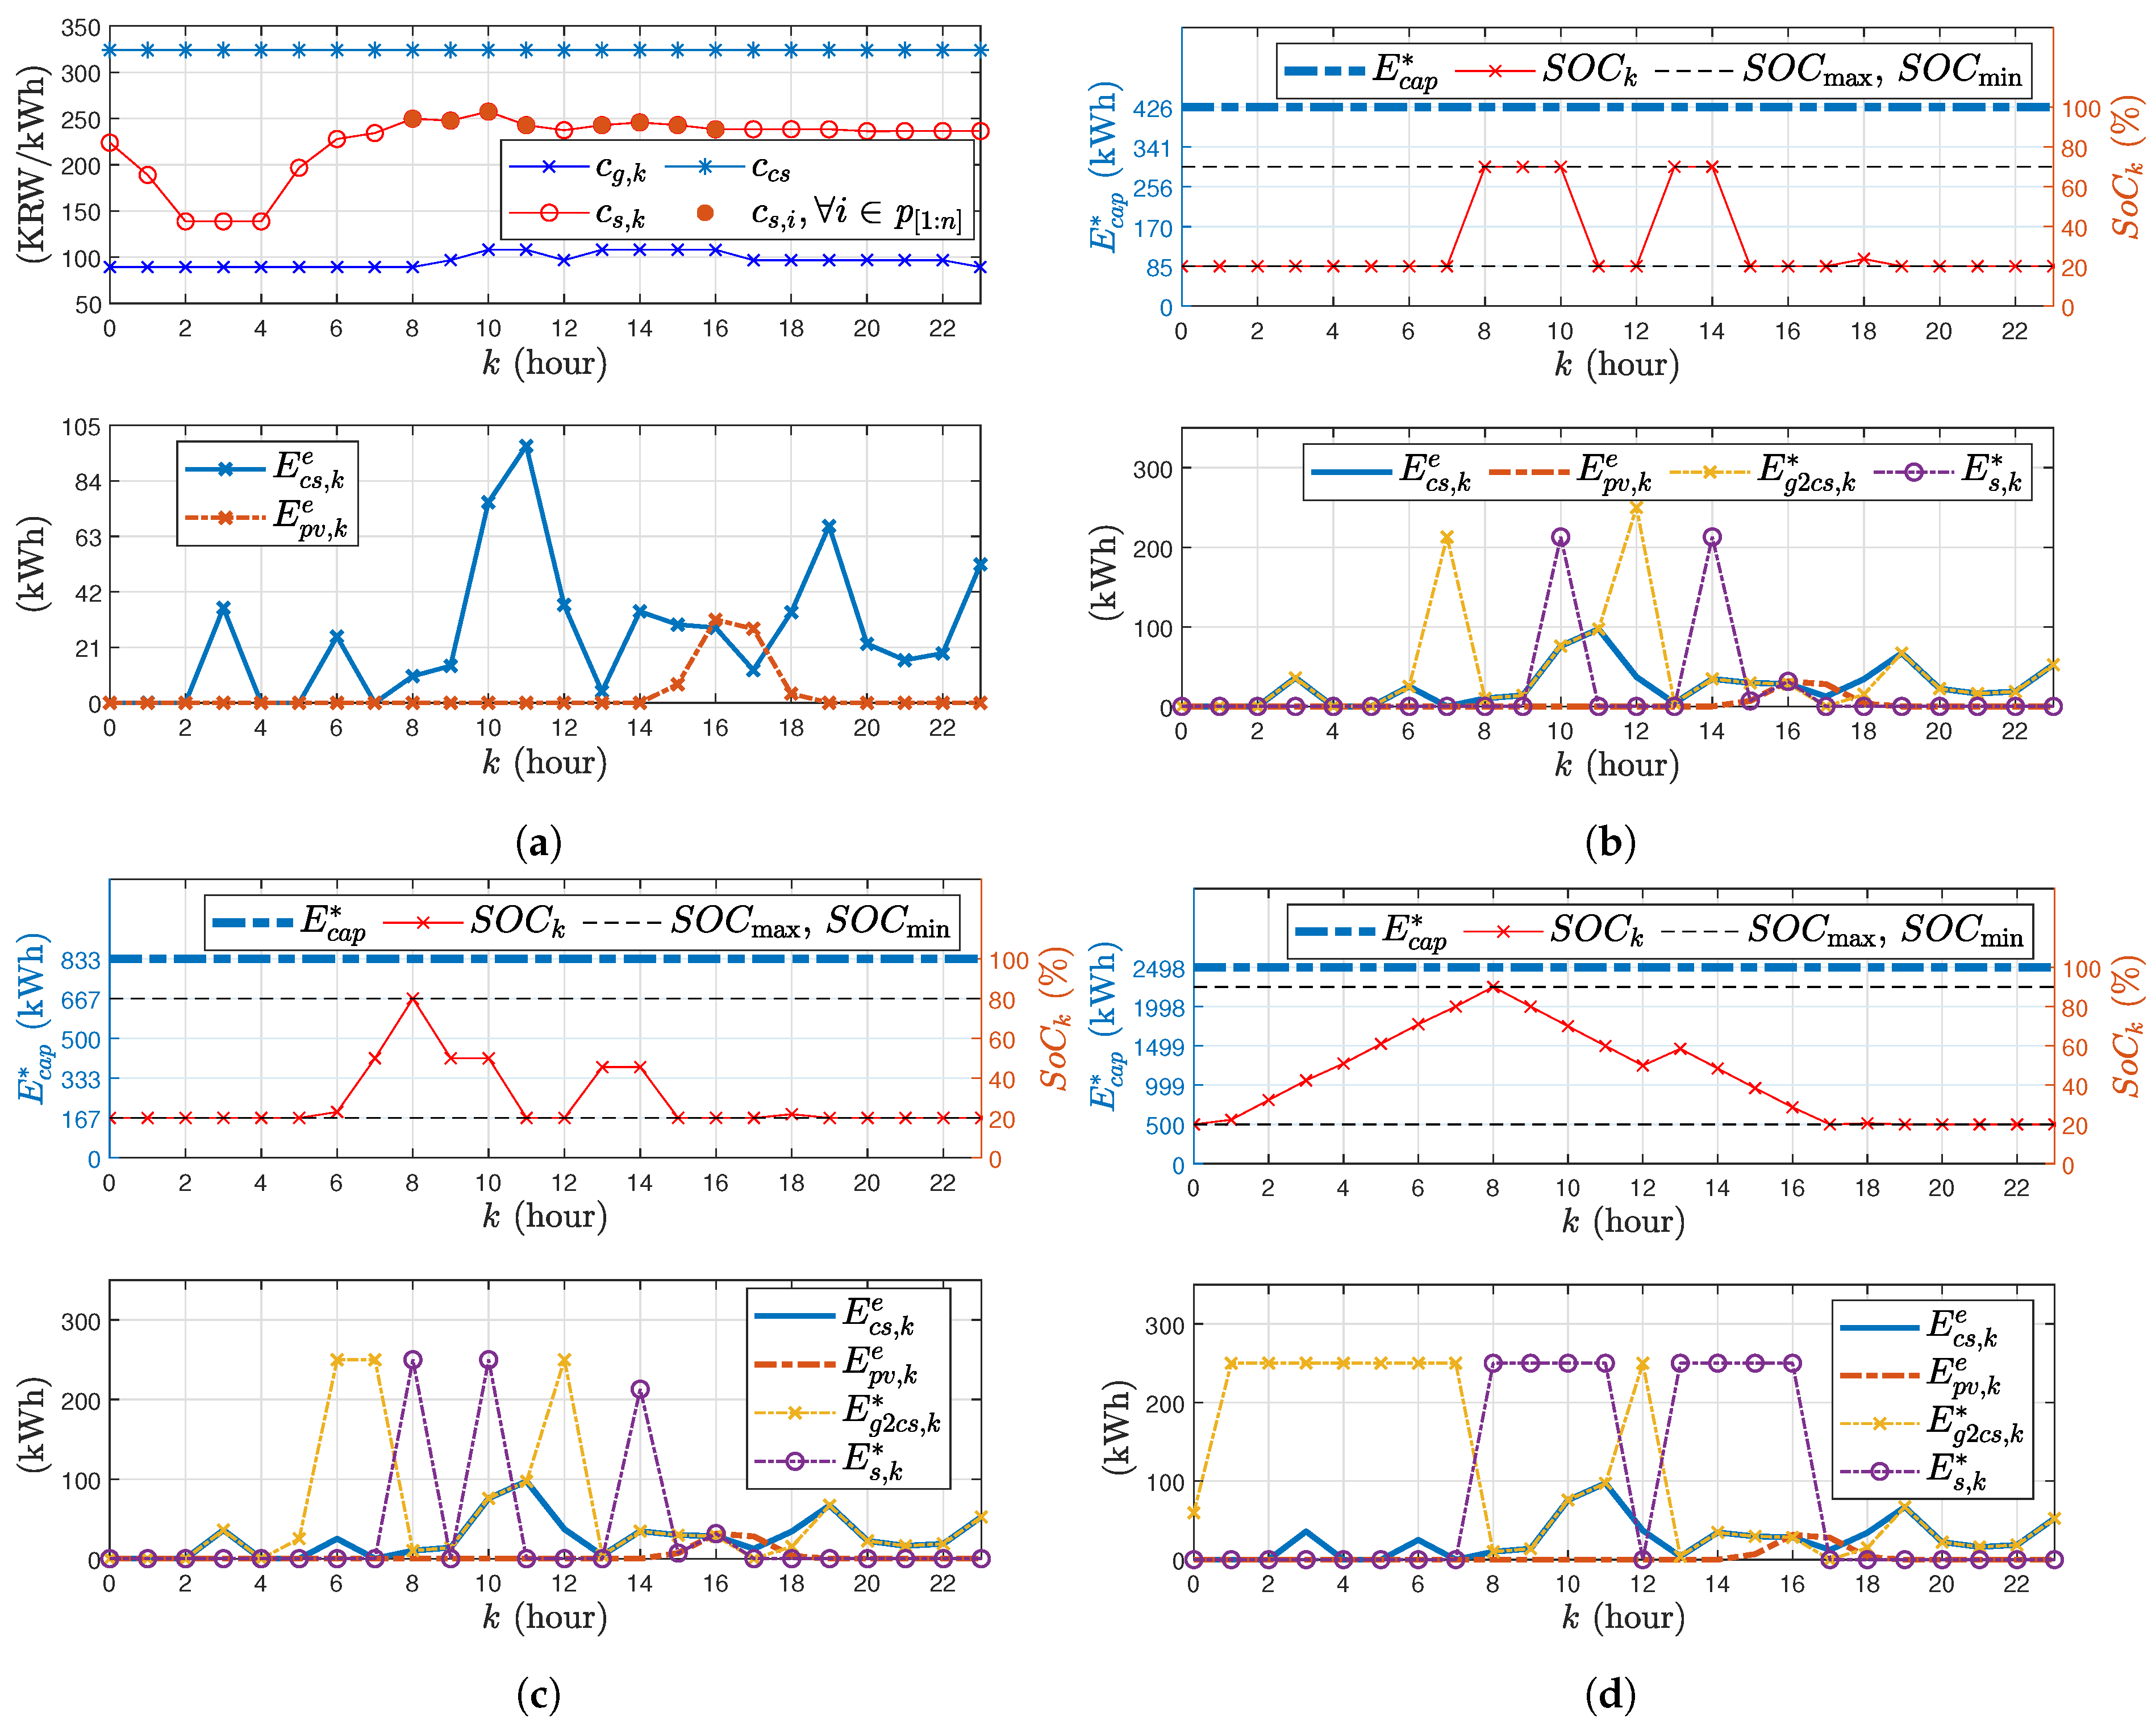
3.1. Validation Result at Yangjae Solar Station on 9 March 2023, Cloudy Weather Condition

Figure 2 shows the test results of the proposed optimization-based EVCS operating strategy at the Yangjae Solar Station in Seoul. The simulation day was set for 9 March 2023, which had cloudy weather conditions. The upper graph of Figure 2a shows the simulation environment such as electricity costs per hour given by the power supplier, c g , the SMP per hour, c s , k , and the electricity price sold to the electricity vehicle charging customer, c c s . The y-axis values of the filled red circle show c s , i , i p [ 1 : n ] , and the x-axis values show electricity selling hours permitted to the EVCS. We can verify that the number of total permitted selling hours is eight, and these selected selling hours contain peak load hours { 10 , 11 , 13 , 14 , 15 , 16 } and two additional hours { 8 , 9 } , which indicate large values among c g , k , k = [ 0 : 23 ] . The lower graph of Figure 2a shows E c s e and E p v e . In this case, we set the peak power of the PV generator at 35 (kWp) and the useful life of the ESS at twenty years. The upper graph of Figure 2b–d shows the obtained optimized ESS capacity and its S o C for the different S o C min and S o C max conditions. The blue dashed line indicates the obtained optimal ESS capacity, and the black dashed line indicates S o C min and S o C max that the value of S o C for each hour must not exceed; alternatively, it should fall short of these boundaries. The red line indicates the S o C of the ESS for each hour, S o C k . As we set inequality Constraint (13), the simulation result shows that S o C k does not exceed or fall short of these boundaries. Furthermore, S o C 0 and S o C 23 hold equality Constraints (14). The lower graph of Figure 2b–d shows E g 2 c s , k * , E s , k * for the different S o C min and S o C max conditions. The yellow line indicates E g 2 c s , k * , and we can analyze that the EVCS decides to store energy by purchasing it from the power supplier among k [ 0 : 23 ] / p [ 1 : n ] . The purple line indicates E s , k * and we can analyze that the EVCS decides to sell energy of the ESS among k p [ 1 : n ] . As S o C max increases from Figure 2b–d, E c a p * tends to be a large value, and the EVCS can store more energy. Therefore, we observe that the frequency of the selling and storing energy are increasing but do not exceed P p c s max .
Figure 3 shows the simulation results related to the solution of optimization Problem (16) for each peak power of the PV generator and useful life of ESS, such as E c a p * , k = 0 23 E s , k * and S o C k . From these results, we can confirm whether the solution satisfies the equality and inequality constraints for various useful lives of ESS and PV generator capacities. The z-axis of Figure 3a indicates the selected optimal ESS capacity E c a p * , and we observed that E c a p * has a tendency to increase as the useful life of the ESS increases. Considering that J in (8) contains the daily cost of the ESS c e s s E c a p , and c e s s has a tendency to be small as the useful life of the ESS increases, we can analyze that the graph of E c a p * is reasonable. The z-axis of Figure 3b shows the total amount of the optimal selling energy from the EVCS for each peak power of the PV generator and the useful life of the ESS. We observed that k = 0 23 E s , k * has a tendency to increase as the useful life of the ESS increases. E c a p * is increasing according to the useful life of the ESS, as shown in Figure 3a. Therefore, we can determine that the proposed EVCS operating strategy decides to sell more energy stored in the ESS as the ESS capacity is increasing, obeying the rule of (10) that the PCS of the ESS does not exceed P p c s max = 250 (kWh). Figure 3c shows the biggest value of S o C k , k [ 0 : 23 ] , S o C k ¯ , and the smallest value of S o C k , k [ 0 : 23 ] , S o C k ̲ , for each peak power of the PV generator and useful life of the ESS, such as
S o C k ¯ = max k [ 0 : 23 ] S o C k , S o C k ̲ = min k [ 0 : 23 ] S o C k .
This validation result shows that the inequality constraints of (13) satisfy all tests.

3.2. Validation Result, Yangjae Solar Station, 21 March 2023, Sunny Weather Condition

Figure 4 shows the simulation results of the proposed optimization-based EVCS operating strategy at the Yangjae electric vehicle charging station located in Seoul. The simulation day was set for 21 March 2023, which had a sunny weather condition.
The upper graph of Figure 4a shows the test environment such as c g , c s , k , and c c s . The y-axis values of the filled red circle show c s , i i p [ 1 : n ] , and the x-axis values show electricity selling hours permitted to the EVCS. We can verify that the number of total permitted selling hours is eight, and these selected selling hours contain peak load hours { 10 , 11 , 13 , 14 , 15 , 16 } and two additional hours { 9 , 18 } , which indicate large values among c g , k , k = [ 0 : 23 ] . The lower graph of Figure 4a shows E c s e and E p v e . Compared to the cloudy weather condition, E p v e of Figure 4a has maximum peak power during daylight hours. In this case, we set the peak power of the PV generator at 35 (kWp) and the useful life of the ESS at twenty years. The upper graph of Figure 4b–d shows the obtained optimized ESS capacity and its S o C for the different S o C min and S o C max conditions. The blue dashed line indicates the obtained optimal ESS capacity, and the black dashed line indicates S o C min and S o C max for this test. The red line indicates the S o C of the ESS for each hour, S o C k . As we set inequality Constraint (13), the simulation result shows that S o C k does not exceed or fall short of these boundaries. Furthermore, S o C 0 and S o C 23 hold equality Constraints (14). The lower graph of Figure 4b–d shows E g 2 c s , k * , E s , k * for the different S o C min and S o C max conditions. The yellow line indicates E g 2 c s , k * , and we can analyze that the EVCS decides to store energy by purchasing it from the power supplier among k [ 0 : 23 ] / p [ 1 : n ] . The purple line indicates E s , k * , and we can determine that the EVCS decides to sell the energy of the ESS among k p [ 1 : n ] . As S o C max increases from Figure 4b–d, E c a p * tend to be a large value, and the EVCS can store more energy. Therefore, we observed that the frequencies of the selling and storing energy are increasing, but they do not exceed P p c s max .
Figure 5 shows the results related to the solution of optimization Problem (16), such as E c a p * , k = 0 23 E s , k * , S o C k ¯ and S o C k ̲ of (17) for each peak power of the PV generator and useful life of the ESS. These results confirm whether the solution satisfies the equality and inequality constraints for various simulation conditions, such as the useful life of the ESS and different PV generator capacities. The z-axis of Figure 5a indicates the selected optimal ESS capacity, E c a p * , and we observed that E c a p * has a tendency to increase as the useful life of the ESS increases. Since cost J in (8) contains the daily cost of the ESS such as c e s s E c a p , and c e s s is small as the useful life of the ESS increases, we can determine that this tendency of E c a p * is reasonable. The z-axis of Figure 5b shows a sum of the optimal amount of selling energy from the EVCS, k = 0 23 E s , k * , for each peak power of the PV generator and useful life of the ESS. We observed that k = 0 23 E s , k * has a tendency to increase as the useful life of the ESS increases. Furthermore, we observed that the tendency of k = 0 23 E s , k * is similar to that of the graph of E c a p * , and we can determine that more energy can be stored and sold to the grid as E c a p * increases. The maximum value of k = 0 23 E s , k * is 1500 (kWh), and it shows that the optimization obeys inequality Rule (10) since n of (7) was set to be six, and P p c s max was set to be 250 (kWh). Figure 5c shows S o C k ¯ and S o C k ̲ of (17), and the result shows that the inequality constraints of (13) are satisfactory for all tests.

3.3. Validation Result, Suseo Station Public Parking Lot, 9 March 2023, Cloudy Weather Condition

Figure 6 shows simulation results of the proposed optimization-based EVCS operating strategy at the Suseo solar station in Seoul. The simulation day was set for 9 March 2023, which had a cloudy weather condition. The upper graph of Figure 6a shows the simulation environment such as c g , c s , k and c c s . The y-axis values of the filled red circle show c s , i , i p [ 1 : n ] , and the x-axis values show electricity selling hours permitted to the EVCS. We can verify that the number of total permitted selling hours is eight, and these selected selling hours contain peak load hours { 10 , 11 , 13 , 14 , 15 , 16 } and two additional hours { 8 , 9 } , which indicate large values among c g , k , k = [ 0 : 23 ] . The lower graph of Figure 6b shows E c s e and E p v e . In this case, we set the peak power of the PV generator at 35 (kWp) and the useful life of the ESS at twenty years. The upper graph of Figure 6b–d shows E c a p * and S o C k for the different S o C min and S o C max conditions. The blue dashed line indicates E c a p * , and the black dashed line indicates S o C min and S o C max . The red line indicates S o C k . As we set inequality Constraint (13), the simulation result shows that S o C does not exceed or fall short of these boundaries. Furthermore, S o C 0 and S o C 23 hold equality Constraints (14). The lower graph of Figure 6b–d shows E g 2 c s , k * , E s , k * for the different S o C min and S o C max conditions. The yellow line indicates E g 2 c s , k * , and we can determine that the EVCS decides to store energy by purchasing it from the power supplier among k [ 0 : 23 ] / p [ 1 : n ] . The purple line indicates E s , k * , and we can determine that the EVCS decides to sell the energy of the ESS among k p [ 1 : n ] . As S o C max increases from Figure 6b–d, E c a p * tends to be a large value, and the EVCS can store more energy. Therefore, we observed that the frequencies of the selling and storing energy are increasing, but they do not exceed P p c s max .
Figure 7 shows the results related to the solution of optimization Problem (16), such as E c a p * , k = 0 23 E s , k * , S o C k ¯ and S o C k ̲ of (17) for each peak power of the PV generator and useful life of the ESS. The z-axis of Figure 7a indicates E c a p * , and we observed that E c a p * has a tendency to increase as the useful life of the ESS increases. Since J in (8) contains the daily cost of the ESS such as c e s s E c a p , and c e s s is small as the useful life of the ESS increases, we can determine that this tendency of E c a p * is reasonable. The z-axis of Figure 7b shows a total amount of optimal selling energy from the EVCS, k = 0 23 E s , k * , for each peak power of the PV generator and useful life of the ESS. We observed that k = 0 23 E s , k * has a tendency to increase as the useful life of the ESS increases. Furthermore, we observed that the tendency of k = 0 23 E s , k * is similar to that of the graph of E c a p * , and we can determine that more energy can be stored and sold to the grid as E c a p * increases. Figure 7c shows S o C k ¯ and S o C k ̲ of (17) for each peak power of the PV generator and useful life of the ESS. This validation result shows that the inequality constraints of (13) satisfy all simulations.

3.4. Validation Result, Suseo Solar Station, 21 March 2023, Sunny Weather Condition

Figure 8 shows the simulation results of the proposed optimization-based EVCS operating strategy at the Suseo electric vehicle charging station. The simulation day was set for 21 March 2023, which had a sunny weather condition.
The upper graph of Figure 8a shows the simulation environment such as c g , c s , k , and c c s . The y-axis values of the filled red circle show c s , i , i p [ 1 : n ] , and the x-axis values show electricity selling hours permitted to the EVCS. We can verify that the number of total permitted selling hours is eight, and these selected selling hours contain peak load hours { 10 , 11 , 13 , 14 , 15 , 16 } and two additional hours { 9 , 18 } , which indicate large values among c g , k , k = [ 0 : 23 ] . The lower graph of Figure 8a shows E c s e and E p v e . In this case, we set the peak power of the PV generator at 35 (kWp) and the useful life of the ESS at twenty years. Compared to the cloudy weather condition, the E p v e of Figure 8a has maximum peak power during daylight hours. The upper graph of Figure 8b–d shows E c a p * and S O C k for the different S o C min and S o C max conditions. The blue dashed line indicates the obtained optimal ESS capacity, and the black dashed line indicates S o C min and S o C max , and the red line indicates S o C k . As we set inequality Constraint (13), the simulation result shows that S o C k , k [ 0 : 23 ] does not exceed or fall short of these boundaries. Furthermore, S o C 0 and S o C 23 hold equality Constraints (14). The lower graph of Figure 8b–d shows E g 2 c s , k * , E s , k * for the different S o C min and S o C max conditions. The yellow line indicates E g 2 c s , k * , and we can determine that the EVCS decides to store energy by purchasing it from the power supplier among k [ 0 : 23 ] / p [ 1 : n ] . The purple line indicates E s , k * , and we can determine that the EVCS decides to sell the energy of the ESS among k p [ 1 : n ] . As the S o C max increases from Figure 8b–d, E c a p * tends to be a large value, and the EVCS can store more energy. Therefore, we observed that the frequencies of the selling and storing energy are increasing, but they do not exceed P p c s max .
Figure 9 shows the results related to the solution of optimization Problem (16), such as E c a p * , k = 0 23 E s , k * and the S o C for each peak power of the PV generator and useful life of the ESS. From these results, we can confirm whether the solution satisfies the equality and inequality constraints for various simulation conditions, such as the useful life of the ESS and different PV generator capacities. The z-axis of Figure 9a indicates the selected optimal ESS capacity, E c a p * , and we observed that E c a p * has a tendency to increase as the useful life of the ESS increases. Since cost J in (8) contains the daily cost of the ESS such as c e s s E c a p , and c e s s is small as the useful life of the ESS increases, we can determine that this tendency of E c a p * is reasonable. The z-axis of Figure 9b shows a sum of the optimal amount of selling energy from the EVCS, k = 0 23 E s , k * , for each peak power of the PV generator and useful life of the ESS. We observed that k = 0 23 E s , k * has a tendency to increase as the useful life of the ESS increases. Furthermore, we observed that the tendency of k = 0 23 E s , k * is similar to that of the graph of E c a p * , and we can determine that more energy can be stored and sold to the grid as E c a p * increases. The maximum value of k = 0 23 E s , k * is 1500 (kWh), and it shows that the optimization obeys the inequality rule (10) since n of (7) was set to be six, and P p c s max was set to be 250 (kWh). Figure 9c shows S o C k ̲ and S o C k ¯ of (17) for each peak power of the PV generator and useful life of ESS. This validation result shows that the inequality constraints of (13) satisfy all simulations.

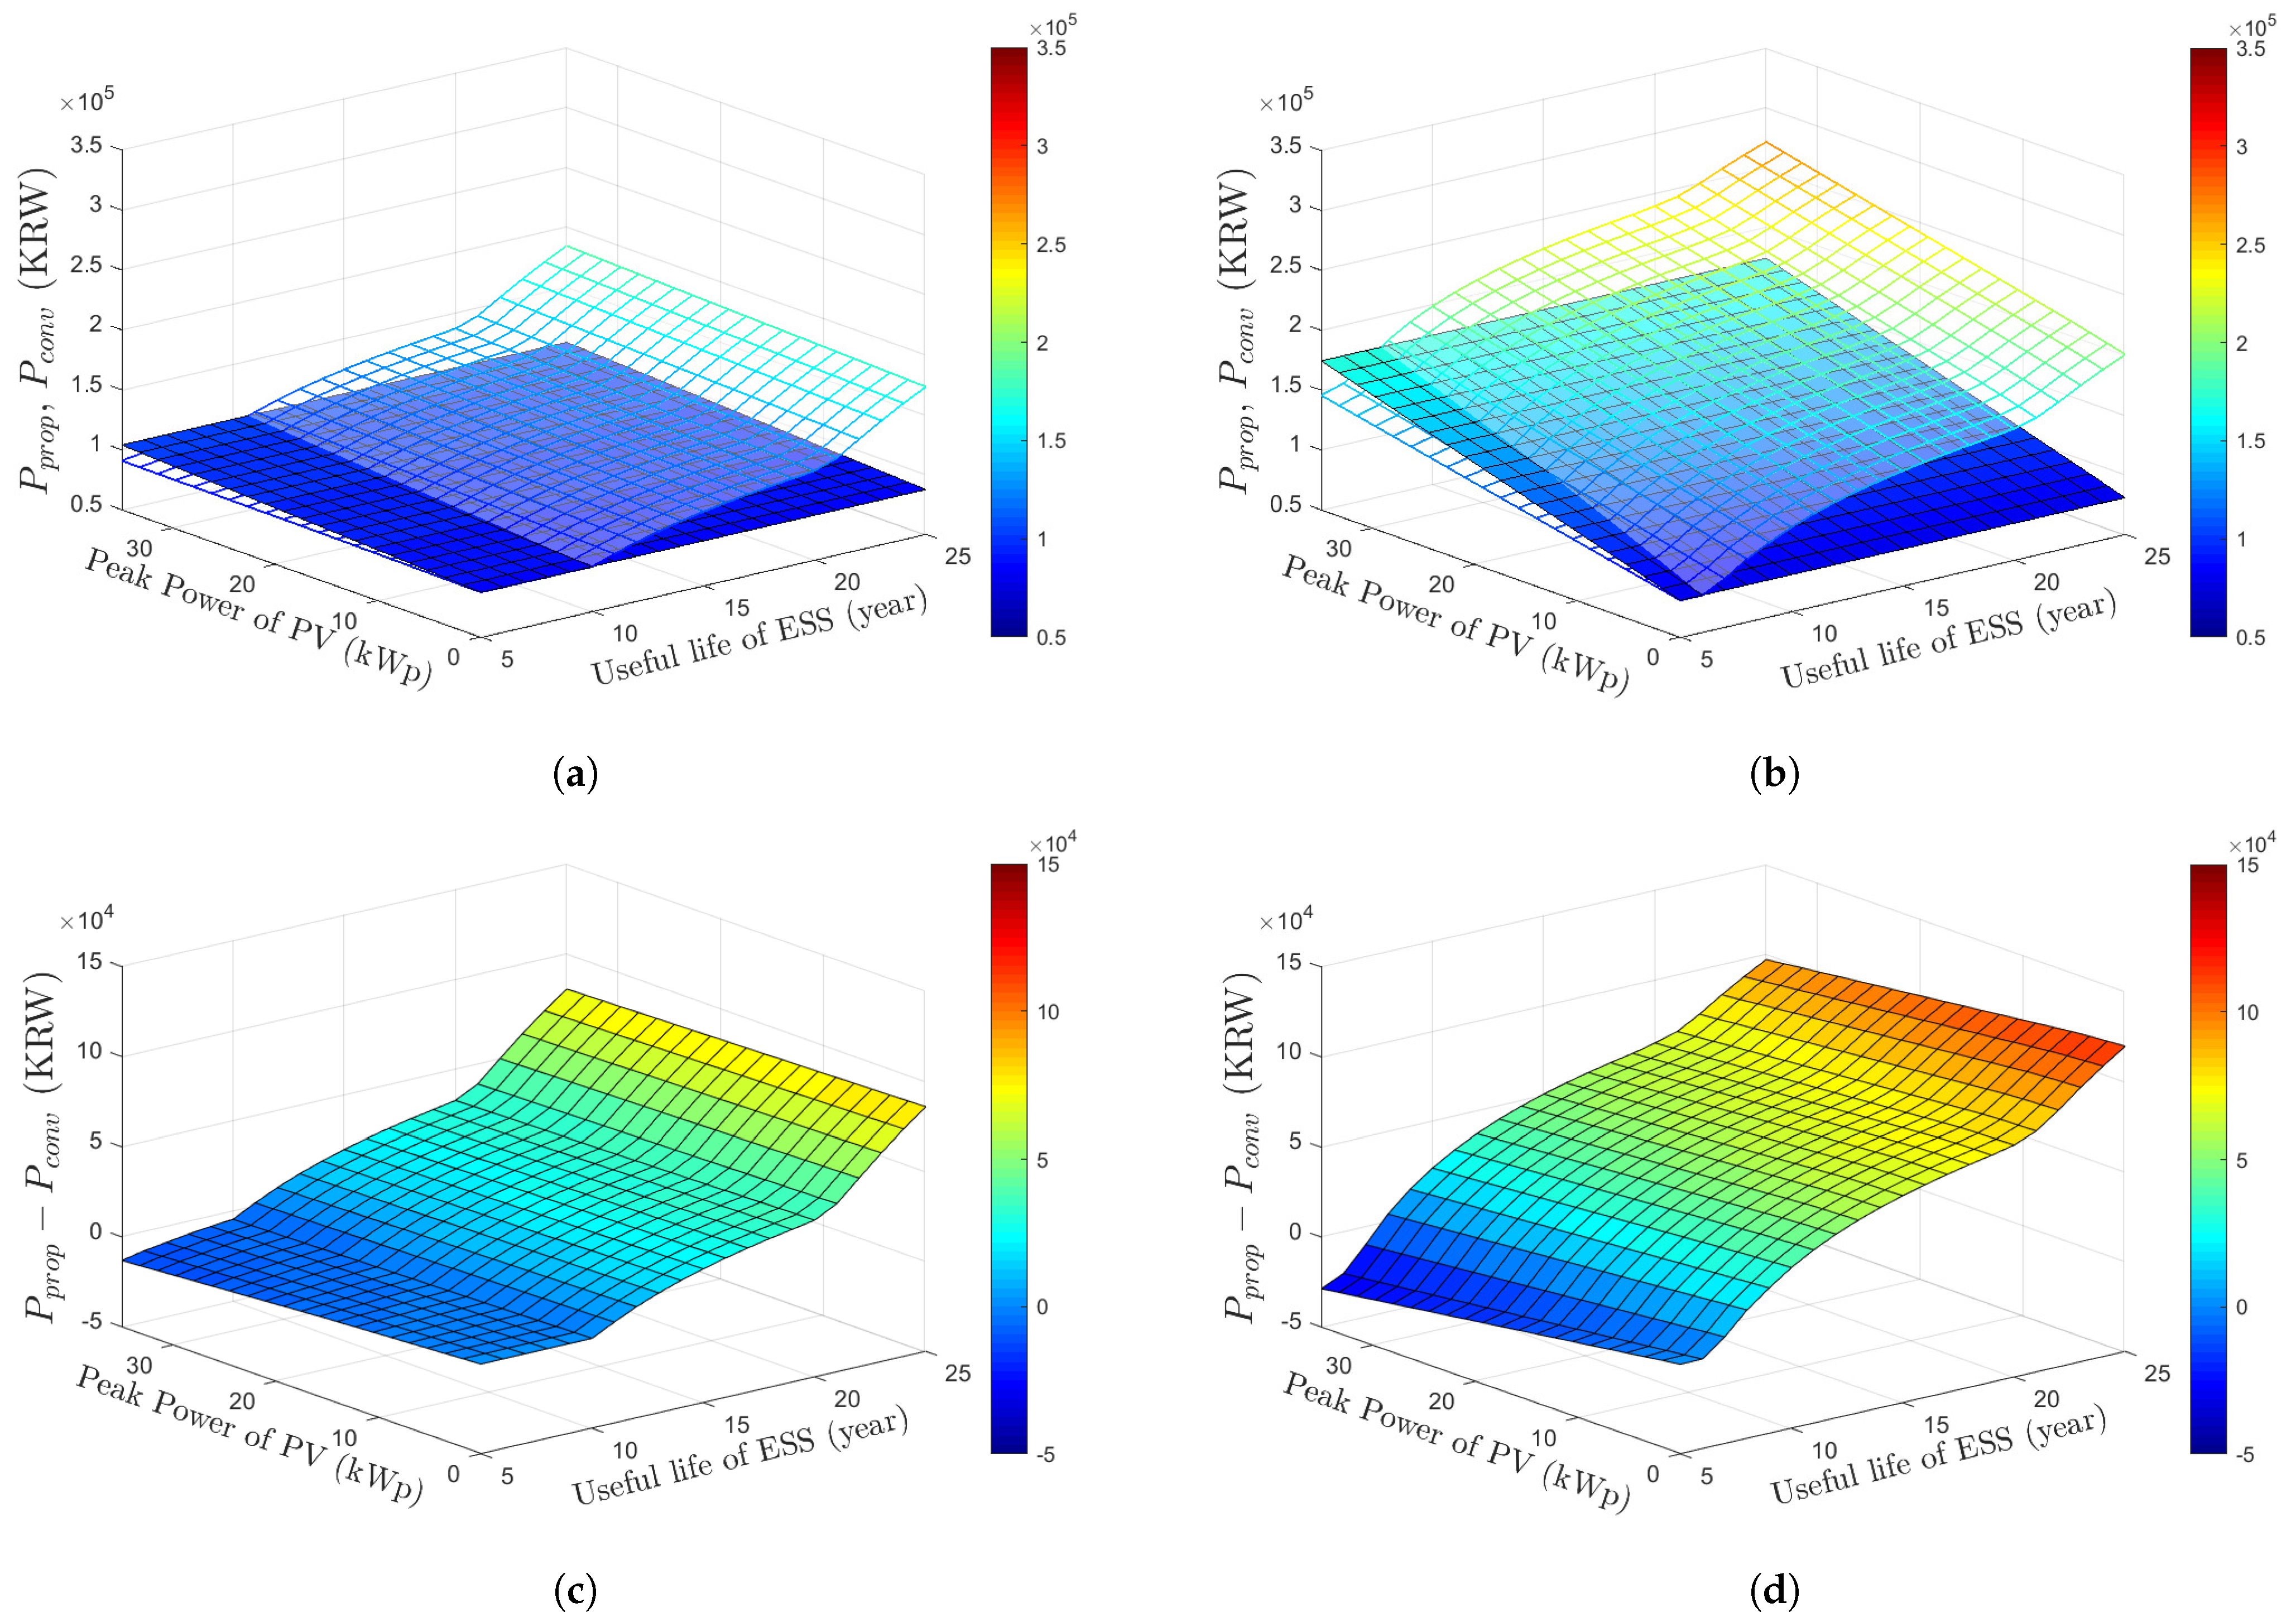
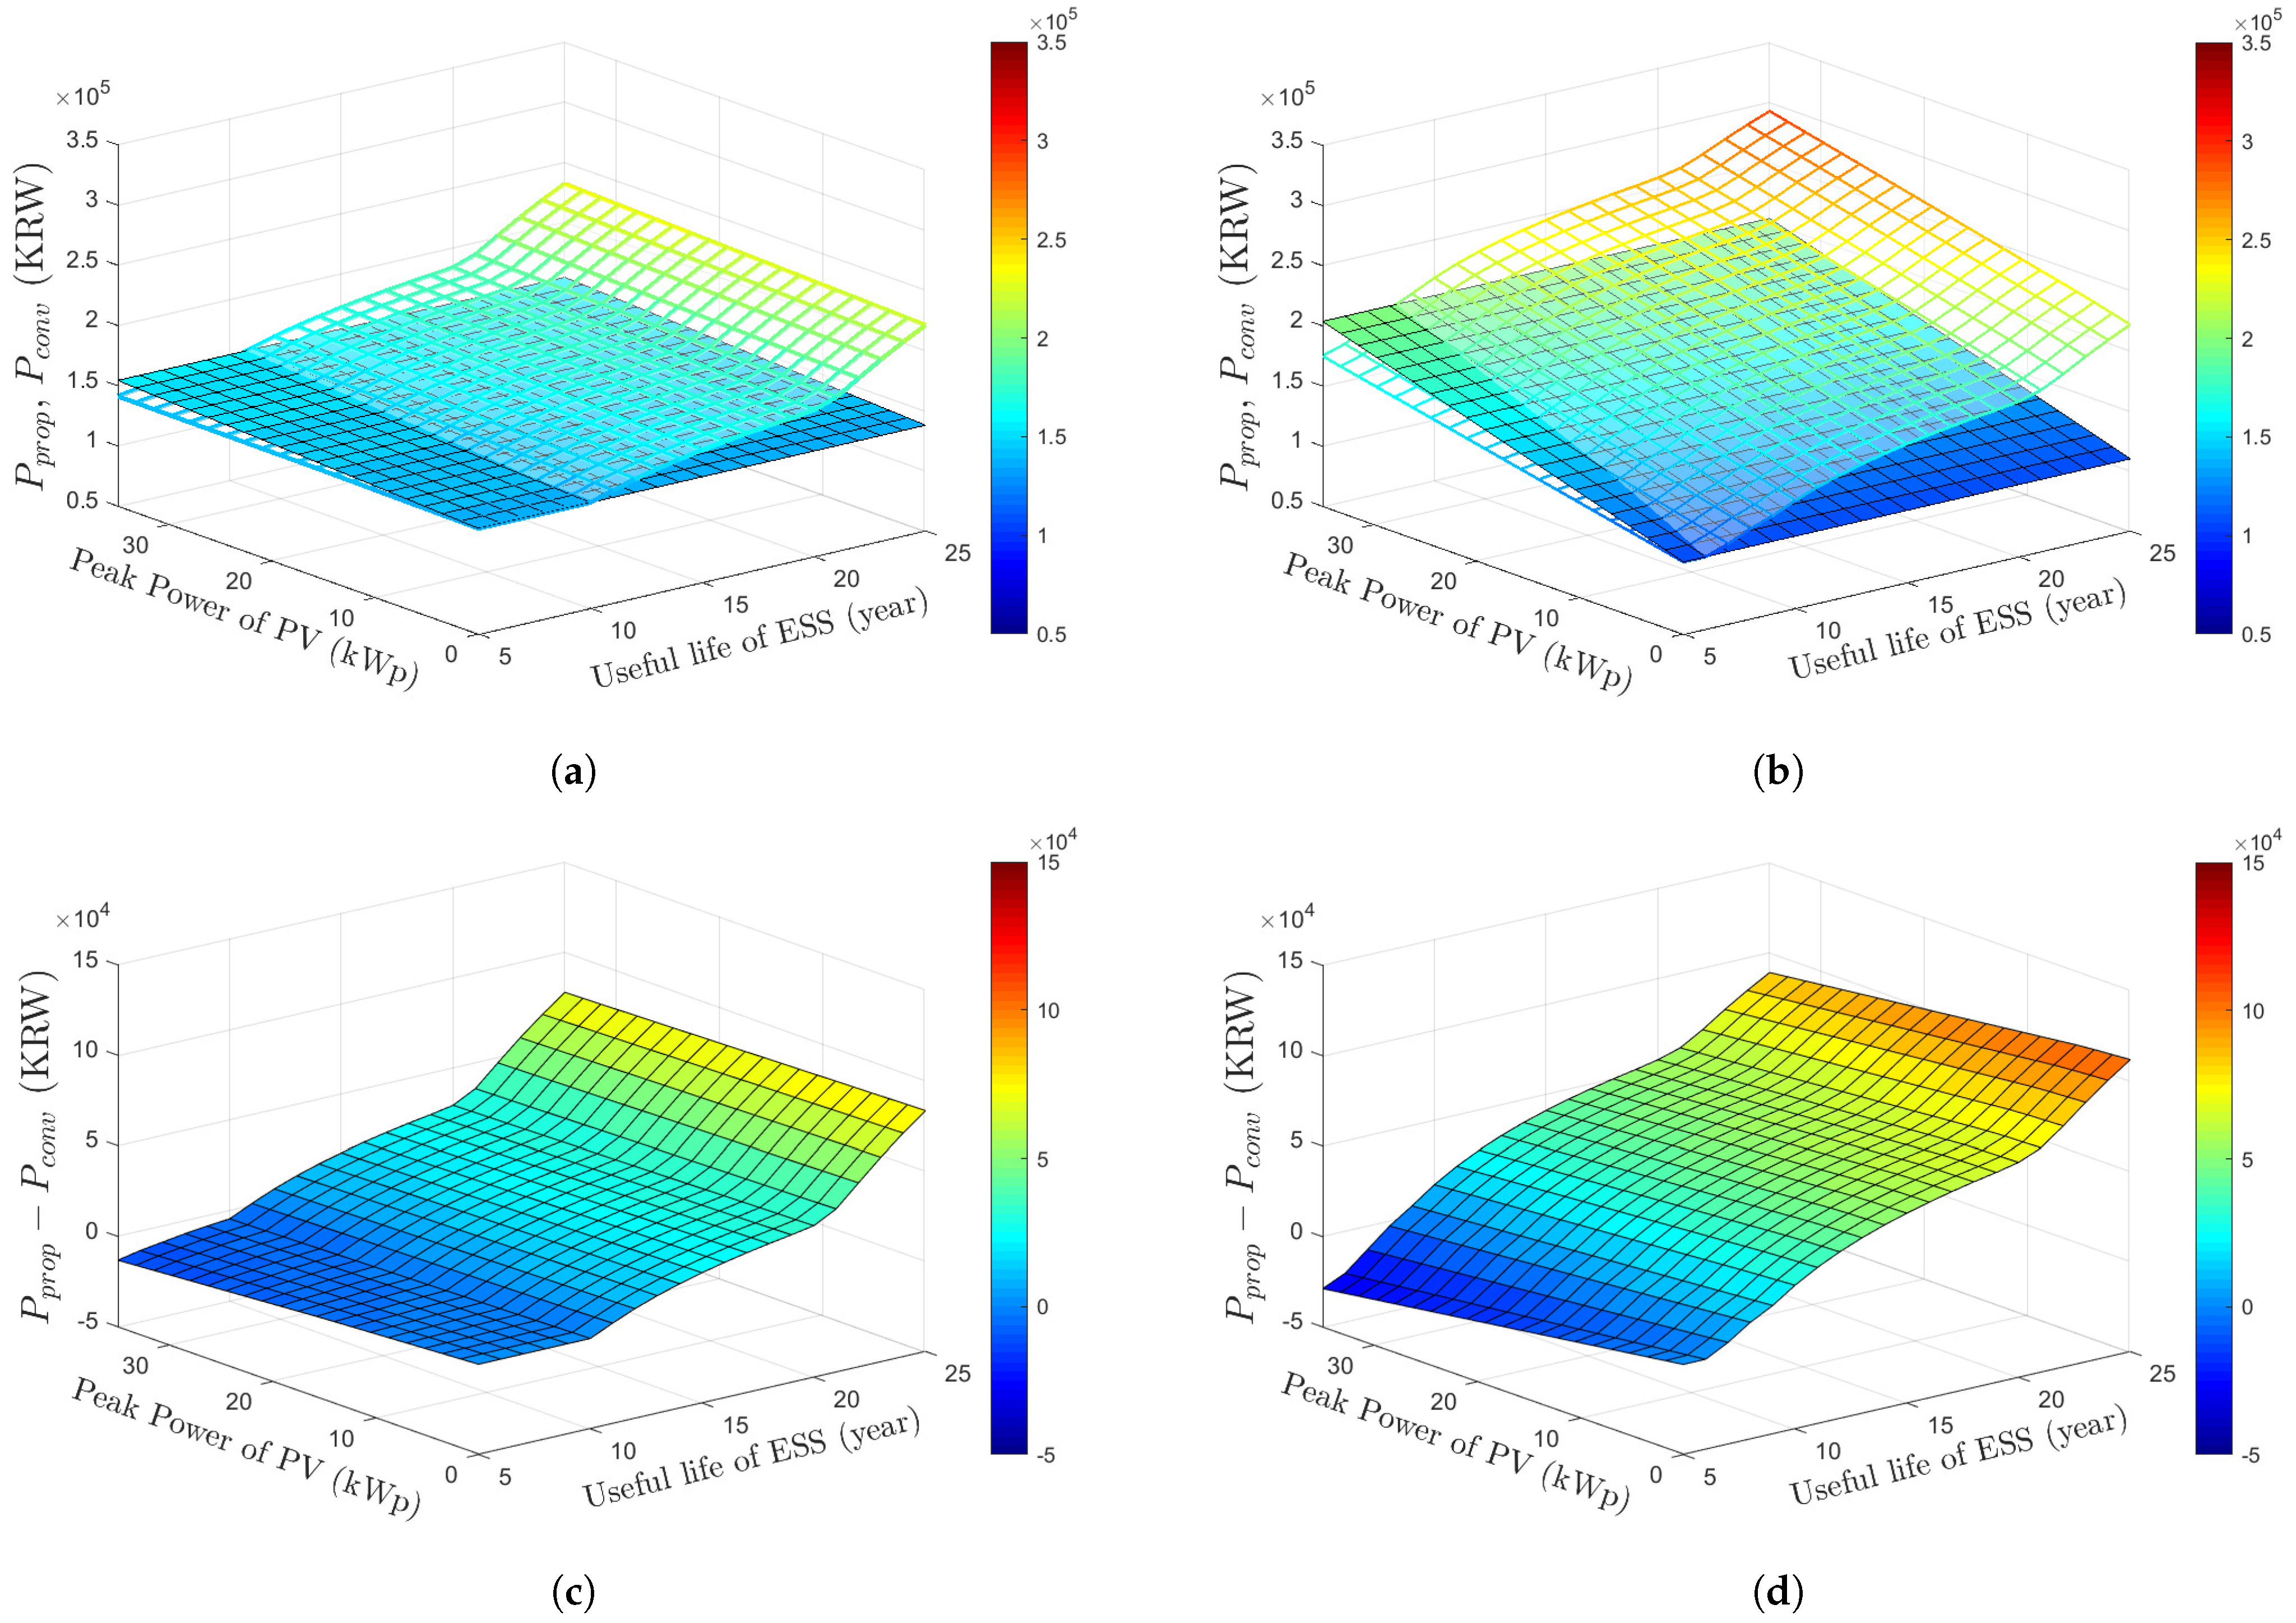
3.5. Comparative Studies of the Proposed Optimized EVCS Operating Strategy with the Conventional EVCS Operation

In this subsection, we present a comparative study between the proposed optimization-based EVCS operating strategy and the conventional EVCS operating strategy without using optimization. This paper sets the conventional EVCS operating strategy as follows: (1) The conventional EVCS operator utilizes the same amount of the peak power of the PV generator as the proposed optimization-based EVCS operator. (2) To minimize the installation and maintenance cost of the ESS, the conventional EVCS operator does not utilize the ESS, so the generated PV energy E p v , k , k [ 0 : 23 ] is directly sold to the grid:
E s , k = E p v , k , k [ 0 : 23 ] .
(3) The conventional EVCS operator covers E c s , k , k [ 0 : 23 ] by purchasing the electricity from the grid:
E g 2 c s , k = E c s , k , k [ 0 : 23 ] .
Based on these conventional EVCS operating conditions, we can set the evaluation factor of each EVCS daily profit as described below.
  • Daily profit of the conventional EVCS operating strategy:
    P c o n v = k = 0 23 c g , k E g 2 c s , k cost   of   grid   energy + k = 0 23 c s , k E s , k revenue   of   PV   energy + k = 0 23 c c s E c s , k revenue   of   EV   charging ,
    where c c s is the selling price of EV charging (KRW/kWh).
  • Daily profit of the proposed optimization-based EVCS operator:
    P p r o p = { J   of   ( 9 ) } + { revenue   of   EV   charging } = c e s s E c a p daily   cost   of   ESS k = 0 23 c g , k E g 2 c s , k + i = 1 n c s , p i E s , p i + k = 0 23 c c s E c s , k .
Figure 10 shows the comparison of the daily EVCS profits of P c o n v and P p r o p at the Yangjae Solar Station. The z-axis of Figure 10a indicates the daily profit of each EVCS operator on 9 March 2023, which is a cloudy weather condition, and the unit is KRW. The colored surfaced graph indicates P p r o p , and the meshed graph indicates P c o n v . Meshed graph P c o n v proportionally increases according to the peak power of the PV generator with a low slope rate. Considering that the weather condition of this simulation is cloudy, the presence of a low slope rate for the peak power is a reasonable result for P c o n v . Compared to P c o n v , the profit of the proposed optimization-based EVCS operating strategy tends to improve according to the useful life of the ESS. From Figure 3a, we determined that the optimal capacity of the ESS is increasing as the ESS cost is cheap. As a result, the total amount of E s , k , k [ 0 : 23 ] for the comparison EVCS operator also increases, which means that more revenue can be earned from the selling energy among the peak load hours. Therefore, it is a reasonable simulation result that the difference between P c o n v and P p r o p is increasing according to the increase in useful life of the ESS. The z-axis of Figure 10c indicates P p r o p P c o n v KRW, and this result shows that the average profit of P p r o p is higher than that of P c o n v . It can be determined that the profit of the proposed method outperforms the profits of the EVCS operator, which does not utilize the ESS and the optimization in this simulation environment.
The z-axis of Figure 10b indicates the expected daily profit of each EVCS operator on 21 March 2023, which is a sunny weather condition, and the unit is KRW. The colored surfaced graph indicates P p r o p , and the meshed graph indicates P c o n v . Meshed graph P c o n v proportionally increases according to the peak power of the PV generator with a low slope rate. Considering that the weather condition of this simulation is sunny, the presence of a larger slope rate than that in the cloudy weather condition for the peak power is a reasonable result for P c o n v . Compared to P c o n v , the profit of the proposed optimization-based EVCS operating strategy tends to improve according to the useful life of the ESS, but does not seem to be as linear as the P p r o f of Figure 10a. The proposed optimization-based EVCS operating strategy has the maximum selling energy by (10) and (7). And Figure 5b shows that k = 0 23 E s , k of the proposed method reaches the maximum total selling energy. Therefore, it is reasonable that the slope of P p r o p for useful life of the ESS can be slightly different from that of the graph of the cloudy simulation condition. The z-axis of Figure 10d indicates P p r o p P c o n v KRW, and this result shows that the average profit of P p r o p is higher than that of P c o n v . It can be determined that the profit of the proposed method outperforms the profits of the EVCS operator, which does not utilize the ESS and the optimization in this simulation environment.
Figure 11 shows the comparison of the daily EVCS profits of P c o n v and P p r o p at the Suseo station public parking lot. The z-axis of Figure 11a indicates the expected daily profit of each EVCS operator on 9 March 2023 at the Suseo station public parking lot, which is cloudy weather condition, and the unit is KRW. The colored surfaced graph indicates P p r o p , and the meshed graph indicates P c o n v . Meshed graph P c o n v proportionally increases according to the peak power of the PV generator with a low slope rate. Considering that the weather condition of this simulation is cloudy, the presence of a low slope rate for the peak power is a reasonable result for P c o n v . Compared to P c o n v , the profit of the proposed optimization-based EVCS operating strategy tends to improve according to the exchange period of the ESS. From Figure 3a, we determined that the optimal capacity of the ESS is increasing as the ESS cost is cheap. As a result, the total amount of E s , k , k [ 0 : 23 ] for the comparison EVCS operator increases, which means that more revenue can be earned from the selling energy at peak load hours. Therefore, it is a reasonable simulation result that the difference between P c o n v and P p r o p is increasing according to the increase in useful life of the ESS. The z-axis of Figure 11c indicates P p r o p P c o n v (KRW), and this result shows that the average profit of P p r o p is higher than that of P c o n v . It can be determined that the profit of the proposed method outperforms the profits of the EVCS operator, which does not utilize the ESS and the optimization in this simulation environment.
The z-axis of Figure 11b indicates the expected daily profit of each EVCS operator on 21 March 2023, which is sunny weather condition, and the unit is KRW. The colored surfaced graph indicates P p r o p , and the meshed graph indicates P c o n v . Meshed graph P c o n v proportionally increases according to the peak power of the PV generator with a low slope rate. Considering that the weather condition of this simulation is sunny, the presence of a higher slope rate than that of the cloudy weather condition for the peak power is a reasonable result for P c o n v . Compared to P c o n v , the profit of the proposed optimization-based EVCS operating strategy tends to improve according to the exchange period of the ESS but does not seem to be as linear as the P p r o f of Figure 11a. The proposed optimization-based EVCS operating strategy has the maximum selling energy by (10) and (7). And Figure 9b shows that k = 0 23 E s , k of the proposed method reaches the maximum total selling energy. Therefore, it is reasonable that the slope of P p r o p for the useful life of the ESS can be slightly different from the graph of the cloudy simulation condition. The z-axis of Figure 11d indicates P p r o p P c o n v (KRW), and this result shows that the average profit of P p r o p is higher than that of P c o n v . It can be determined that the profit of the proposed method outperforms the profits of the EVCS operator, which does not utilize the ESS and the optimization in this simulation environment.

4. Conclusions

This paper presented an optimal electricity trading volume and an optimal installation capacity of an energy storage system (ESS) to maximize the daily profit of an electric vehicle charging station (EVCS) which has a photovoltaic generator. To reduce power load on peak hours, this paper utilized the ESS to store both the energy from the PV generator and the energy purchased from the grid in base and intermediate load hours. Based on these EVCS conditions, this paper formulated selecting the optimal capacity of ESS and the optimal trading volume of electricity as an optimization problem. Furthermore, this paper presented the equality and inequality constraints to operate an optimal EVCS operating strategy. This paper showed the validation results of the proposed optimal EVCS operating strategy for sunny and cloudy weather conditions at the Yangjae Solar Station and the Suseo Station public parking lot, Seoul, Republic of Korea. These simulations confirmed that the proposed optimization problem can be solved by obeying the equality and inequality constraints. Furthermore, this paper presented comparative studies between the proposed method and the conventional EVCS operating strategy, which does not utilize the ESS. By comparing the daily profit of each EVCS operating strategy, this paper confirmed that the profit of the proposed method outperforms that of the conventional method, which has more profit for the ordinary useful life of the ESS.

Author Contributions

Conceptualization, methodology, visualization, software and writing—original draft preparation, Y.W.J.; validation, supervision, writing—review and editing, Y.W.J., K.-C.L., C.K. and W.Y.C. All authors have read and agreed to the published version of the manuscript.

Funding

This work was supported by the National Research Foundation (NRF), South Korea, under project BK21 FOUR (Smart Robot Convergence and Application Education Research Center) and the Pukyong National University Research Fund in 2023 (No. 202303690001).

Data Availability Statement

Data is contained within the link in [32].

Conflicts of Interest

The authors declare no conflict of interest.

References

  1. Kwon, S.; Gil, H.; Baek, S.; Kim, H. Optimal Solution for a Renewable-Energy-Generation System at a Private Educational Institute in South Korea. Energies 2022, 15, 9430. [Google Scholar] [CrossRef]
  2. Bodansky, D. The Paris climate change agreement: A new hope? Am. J. Int. Law 2016, 110, 288–319. [Google Scholar] [CrossRef]
  3. Un-Noor, F.; Padmanaban, S.; Mihet-Popa, L.; Mollah, M.N.; Hossain, E. A comprehensive study of key electric vehicle (EV) components, technologies, challenges, impacts, and future direction of development. Energies 2017, 10, 1217. [Google Scholar] [CrossRef]
  4. Joint Ministries, The 4th Master Plan for Eco-Friendly Vehicles (2021–2025). Available online: https://eiec.kdi.re.kr/policy/callDownload.do?num=210895&filenum=3 (accessed on 2 February 2024).
  5. Global EV Outlook 2023, IEA, Paris. Available online: https://www.iea.org/reports/global-ev-outlook-2023 (accessed on 25 December 2023).
  6. Hall, D.; Lutsey, N. Emerging Best Practices for Electric Vehicle Charging Infrastructure; The International Council on Clean Transportation (ICCT): Washington, DC, USA, 2017; Volume 54. [Google Scholar]
  7. Ahmad, F.; Iqbal, A.; Ashraf, I.; Marzband, M.; Khan, I. Optimal location of electric vehicle charging station and its impact on distribution network: A review. Energy Rep. 2022, 8, 2314–2333. [Google Scholar] [CrossRef]
  8. Zhang, H.; Moura, S.J.; Hu, Z.; Song, Y. PEV fast-charging station siting and sizing on coupled transportation and power networks. IEEE Trans. Smart Grid 2016, 9, 2595–2605. [Google Scholar] [CrossRef]
  9. Zhang, Y.; Chen, J.; Cai, L.; Pan, J. Expanding EV charging networks considering transportation pattern and power supply limit. IEEE Trans. Smart Grid 2019, 10, 6332–6342. [Google Scholar] [CrossRef]
  10. Hashemian, S.N.; Latify, M.A.; Yousefi, G.R. PEV fast-charging station sizing and placement in coupled transportation-distribution networks considering power line conditioning capability. IEEE Trans. Smart Grid 2020, 11, 4773–4783. [Google Scholar] [CrossRef]
  11. Diaz-Londono, C.; Colangelo, L.; Ruiz, F.; Patino, D.; Novara, C.; Chicco, G. Optimal strategy to exploit the flexibility of an electric vehicle charging station. Energies 2019, 12, 3834. [Google Scholar] [CrossRef]
  12. Timpner, J.; Wolf, L. Design and Evaluation of Charging Station Scheduling Strategies for Electric Vehicles. IEEE Trans. Intell. Transp. Syst. 2014, 15, 579–588. [Google Scholar] [CrossRef]
  13. Shamsdin, S.H.; Seifi, A.; Rostami-Shahrbabaki, M.; Rahrovi, B. Plug-in Electric Vehicle Optimization and Management Charging in a Smart Parking Lot. In Proceedings of the 2019 IEEE Texas Power and Energy Conference (TPEC), College Station, TX, USA, 7–8 February 2019; pp. 1–7. [Google Scholar] [CrossRef]
  14. Kuran, M.Ş.; Viana, A.C.; Iannone, L.; Kofman, D.; Mermoud, G.; Vasseur, J.P. A smart parking lot management system for scheduling the recharging of electric vehicles. IEEE Trans. Smart Grid 2015, 6, 2942–2953. [Google Scholar] [CrossRef]
  15. Deb, S.; Kalita, K.; Mahanta, P. Review of impact of electric vehicle charging station on the power grid. In Proceedings of the 2017 International Conference on Technological Advancements in Power and Energy (TAP Energy), Kollam, India, 21–23 December 2017; pp. 1–6. [Google Scholar]
  16. Shuai, Z.; Sun, Y.; Shen, Z.J.; Tian, W.; Tu, C.; Li, Y.; Yin, X. Microgrid stability: Classification and a review. Renew. Sustain. Energy Rev. 2016, 58, 167–179. [Google Scholar] [CrossRef]
  17. Kaur, A.; Kaushal, J.; Basak, P. A review on microgrid central controller. Renew. Sustain. Energy Rev. 2016, 55, 338–345. [Google Scholar] [CrossRef]
  18. Bayram, I.S.; Michailidis, G.; Devetsikiotis, M.; Granelli, F. Electric power allocation in a network of fast charging stations. IEEE J. Sel. Areas Commun. 2013, 31, 1235–1246. [Google Scholar] [CrossRef]
  19. Sarker, M.R.; Pandžić, H.; Sun, K.; Ortega-Vazquez, M.A. Optimal operation of aggregated electric vehicle charging stations coupled with energy storage. IET Gener. Transm. Distrib. 2018, 12, 1127–1136. [Google Scholar] [CrossRef]
  20. Susowake, Y.; Yongyi, H.; Senjyu, T.; Howlader, A.M.; Mandal, P. Optimum operation plan for multiple existing EV charging stations. In Proceedings of the 2018 IEEE PES Asia-Pacific Power and Energy Engineering Conference (APPEEC), Kota Kinabalu, Malaysia, 7–10 October 2018; pp. 611–615. [Google Scholar]
  21. Zahedmanesh, A.; Muttaqi, K.M.; Sutanto, D. A cooperative energy management in a virtual energy hub of an electric transportation system powered by PV generation and energy storage. IEEE Trans. Transp. Electrif. 2021, 7, 1123–1133. [Google Scholar] [CrossRef]
  22. Negarestani, S.; Fotuhi-Firuzabad, M.; Rastegar, M.; Rajabi-Ghahnavieh, A. Optimal sizing of storage system in a fast charging station for plug-in hybrid electric vehicles. IEEE Trans. Transp. Electrif. 2016, 2, 443–453. [Google Scholar] [CrossRef]
  23. Bryden, T.S.; Hilton, G.; Dimitrov, B.; de León, C.P.; Cruden, A. Rating a stationary energy storage system within a fast electric vehicle charging station considering user waiting times. IEEE Trans. Transp. Electrif. 2019, 5, 879–889. [Google Scholar] [CrossRef]
  24. Hussain, A.; Bui, V.H.; Kim, H.M. Optimal sizing of battery energy storage system in a fast EV charging station considering power outages. IEEE Trans. Transp. Electrif. 2020, 6, 453–463. [Google Scholar] [CrossRef]
  25. Ihm, J.; Amghar, B.; Chun, S.; Park, H. Optimum Design of an Electric Vehicle Charging Station Using a Renewable Power Generation System in South Korea. Sustainability 2023, 15, 9931. [Google Scholar] [CrossRef]
  26. Nishimwe, H.L.F.; Yoon, S.G. Combined optimal planning and operation of a fast EV-charging station integrated with solar PV and ESS. Energies 2021, 14, 3152. [Google Scholar] [CrossRef]
  27. Korea Power Exchange (KPX), Electricity Market Operation Rules. Available online: https://www.kpx.or.kr/board.es?mid=a11002010000&bid=0030&act=view&list_no=71450 (accessed on 2 February 2024).
  28. Korea Meteorological Administration Weather Data Service, Charging Capacity of Electric Vehicle Charging Stations. Available online: https://www.data.go.kr/data/15098661/fileData.do (accessed on 25 December 2023).
  29. Public Data Portal, Intensity of Sunlight. Available online: https://data.kma.go.kr/data/grnd/selectAsosRltmList.do?pgmNo=36 (accessed on 25 December 2023).
  30. Electric Power Statistics Information System, Hourly SMP. Available online: https://epsis.kpx.or.kr/epsisnew/selectEkmaSmpShdGrid.do?menuId=040202&locale=eng (accessed on 25 December 2023).
  31. Korea Electric Power Corperation, Electric Rates Table. Available online: https://cyber.kepco.co.kr/ckepco/front/jsp/CY/E/E/CYEEHP00203.jsp (accessed on 25 December 2023).
  32. Validation Results and Plotting Code. Available online: https://github.com/YongWooJeong/energies-17-00936.git (accessed on 25 December 2023).
Figure 1. Schematic of the proposed method.
Energies 17 00936 g001
Figure 2. Validation of the optimization solution at the Yangjae Solar Station on 9 March 2023, cloudy weather condition: (a) c g , k , c s , k , c c s , E c s , k e and E p v , k e (b) E c a p * , E g 2 c s , k * , E s , k * and 20% < S o C k < 70% (c) E g 2 c s , k * , E s , k * , E c a p * and 20% < S o C k < 80% (d) E g 2 c s , k * , E s , k * , E c a p * and 20% < S o C k < 90%.
Energies 17 00936 g002
Figure 3. Analysis of E c a p * , k = 0 23 E s , k * , k = 0 23 E g 2 c s , k * and S o C for each peak power of the PV generator and useful life of the ESS, the Yangjae Solar Station on 9 March 2023, cloudy weather condition: (a) Optimal capacity of the ESS, E c a p * (b) Total amount of optimized selling energy, k = 0 23 E s , k * (c) Maximum and minimum values among S o C k , k [ 0 : 23 ] .
Energies 17 00936 g003
Figure 4. Validation of the optimization solution at the Yangjae Solar Station on 21 March 2023, sunny weather condition: (a) c g , k , c s , k , c c s , E c s , k e and E p v , k e (b) E g 2 c s , k * , E s , k * , E c a p * and 20% < S o C k < 70% (c) E g 2 c s , k * , E s , k * , E c a p * and 20% < S o C k < 80% (d) E g 2 c s , k * , E s , k * , E c a p * and 20% < S o C k < 90%.
Energies 17 00936 g004
Figure 5. Analysis of E c a p * , k = 0 23 E s , k * , k = 0 23 E g 2 c s , k * and S o C for each peak power of the PV generator and useful life of the ESS, the Yangjae Solar Station on 21 March 2023, cloudy weather condition: (a) Optimal capacity of the ESS, E c a p * (b) Total amount of optimized selling energy, k = 0 23 E s , k * (c) Maximum and minimum values among S o C k , k [ 0 : 23 ] .
Energies 17 00936 g005
Figure 6. Validation of the optimization solution at the Suseo Solar Station on 9 March 2023, cloudy weather condition: (a) c g , k , c s , k , c c s , E c s , k e and E p v , k e (b) E g 2 c s , k * , E s , k * , E c a p * and 20% < S o C k < 70% (c) E g 2 c s , k * , E s , k * , E c a p * and 20% < S o C k < 80% (d) E g 2 c s , k * , E s , k * , E c a p * and 20% < S o C k < 90%.
Energies 17 00936 g006
Figure 7. Analysis of E c a p * , k = 0 23 E s , k * , k = 0 23 E g 2 c s , k * and S o C for each peak power of the PV generator and useful life of the ESS, the Suseo Station public parking lot on 9 March 2023, cloudy weather condition: (a) Optimal capacity of the ESS, E c a p * (b) Total amount of optimized selling energy, k = 0 23 E s , k * (c) Maximum and minimum values among S o C k , k [ 0 : 23 ] .
Energies 17 00936 g007
Figure 8. Validation of the optimization solution at the Suseo Solar Station on 21 March 2023, sunny weather condition: (a) c g , k , c s , k , c c s , E c s , k e and E p v , k e (b) E g 2 c s , k * , E s , k * , E c a p * and 20% < S o C k < 70% (c) E g 2 c s , k * , E s , k * , E c a p * and 20% < S o C k < 80% (d) E g 2 c s , k * , E s , k * , E c a p * and 20% < S o C k < 90%.
Energies 17 00936 g008
Figure 9. Analysis of E c a p * , k = 0 23 E s , k * , k = 0 23 E g 2 c s , k * and S o C for each peak power of the PV generator and useful life of the ESS, the Suseo Station public parking lot on 9 March 2023, cloudy weather condition: (a) Optimal capacity of the ESS, E c a p * (b) Total amount of optimized selling energy, k = 0 23 E s , k * (c) Maximum and minimum values among S o C k , k [ 0 : 23 ] .
Energies 17 00936 g009
Figure 10. Comparative study of the daily EVCS profit for various weather conditions, 9 March 2023 and 21 March 2023 at the Yangjae Solar Station: (a,b) Surfaced graph indicates P c o n v , and meshed graph indicates P p r o p (c,d) Surfaced graph indicates the profit difference between P p r o p and P c o n v (a) P c o n v and P p r o p on 9 March 2023, Yangjae (b) P c o n v and P p r o p on 21 March 2023. (c) P p r o p P c o n v on 9 March 2023, Yangjae (d) P p r o p P c o n v on 21 March 2023.
Energies 17 00936 g010
Figure 11. Comparative study of the daily EVCS profit for various weather conditions, 9 March 2023 and 21 March 2023 at the Suseo station public parking lot: (a,b) Surfaced graph indicates P c o n v , and meshed graph indicates P p r o p . (c,d) Surfaced graph indicates the profit difference between P p r o p and P c o n v . (a) P c o n v and P p r o p on 9 March 2023, Suseo. (b) P c o n v and P p r o p on 21 March 2023, Suseo. (c) P p r o p P c o n v on 9 March 2023, Suseo. (d) P p r o p P c o n v on 21 March 2023, Suseo.
Energies 17 00936 g011
Disclaimer/Publisher’s Note: The statements, opinions and data contained in all publications are solely those of the individual author(s) and contributor(s) and not of MDPI and/or the editor(s). MDPI and/or the editor(s) disclaim responsibility for any injury to people or property resulting from any ideas, methods, instructions or products referred to in the content.

