Abstract
The electric power system is rapidly transforming to address the urgent need for decarbonization and combat climate change. Integration of renewable energy sources into the power grid is accelerating, creating new challenges such as intermittency and uncertainty. To address these challenges, this paper proposes a new design of automatic generation control (AGC) ancillary service cost allocation based on the causer-pays rule. The proposed design treats reserves as inventory and aims to minimize them by allocating costs among consumers based on the causative factors for AGC operation. Two cost-allocation methods based on the causer-pays principle are introduced. The first method distributes costs according to the changes in loads causing ancillary service operation, while the second method considers opportunity costs. The case study on the IEEE 39 Bus System demonstrates that the proposed methods incentivize consumers to minimize volatility, resulting in reduced reserve requirements for system operation. In particular, the opportunity cost-based approach encourages loads and variable renewable energy (VRE) to actively reduce volatility, resulting in more efficient power system operation. In conclusion, the novel AGC ancillary service cost allocation methods offer a promising strategy for minimizing spinning reserves, increasing the power system’s efficiency, and incentivizing consumers to actively participate in frequency regulation for a more sustainable and reliable electricity market.
1. Introduction
The electric power industry is experiencing a rapid transformation driven by the pressing need to decarbonize and mitigate the impact of climate change. Ambitious renewable energy targets set by various countries further underscore the urgency of this transformation [1,2]. For instance, the European Union has increased its binding 2030 renewable energy target from 27% in 2014 to 32% in June 2018 [3]. This shift towards renewable energy sources introduces novel challenges, such as intermittency and uncertainty, which were not prevalent with traditional generators [4,5,6]. Particularly, the significant challenge lies in coping with increased forecasting uncertainty as the share of renewable energy in the grid rises, leading to higher supply unpredictability [7]. Real-time balancing emerges as a critical aspect of the power system, gaining ever more importance as renewable energy integration progresses. While bolstering reserves is a commonly employed method to enhance real-time balancing capabilities, it comes with the trade-off of increased inefficiencies within the power system. Moreover, securing additional reserve power from conventional sources becomes increasingly difficult as their share diminishes. Exploring alternative solutions, such as harnessing new power system facilities like Energy Storage Systems (ESS), is a viable option but may entail substantial costs [8,9,10]. Consequently, addressing these challenges necessitates innovative approaches in the electric power industry, akin to the transformations witnessed in other industries.
The automotive industry has already experienced similar changes to the electric power industry, known as the Toyota production system (TPS). Since its inception, TPS has had a profound effect on the worldwide manufacturing industry [11,12]. TPS’s primary principle is cost reduction through the elimination of wastes, which includes overproduction, inventory, motion, defects, over-processing, waiting, and transport. While the TPS concept is not new, it is still being utilized in a variety of industries [13,14,15], and the TPS principle can be applied to the electric power industry. When TPS is applied to the electric power industry, reserve equates to inventory, one of the seven TPS wastes, and efficient power system operation is only achievable when inventory is minimized. The electricity market must be redesigned in order to reduce reserve capacity in the future electrical grid with growing volatility.
Ancillary service markets play a critical role in ensuring grid stability and reliability within the electric power industry. Real-time variations in load demand affect system frequency, influencing operational security. The system utilizes primary and secondary control loops: primary control averts rapid frequency shifts, and secondary control (Automatic Generation Control, AGC) aims to normalize frequency by minimizing steady-state error, managing tie-line power flow, and controlling overshoot and settling time [16]. While variations may exist among power system operators, settlement for AGC ancillary service typically occurs for both the capacity of the AGC and the actual response amount utilized for frequency regulation in most electricity markets [17].
Presently, these markets operate under various frameworks, encompassing mandatory participation, market-based mechanisms, and hybrid models that combine elements of both approaches. While market-based procurement mechanisms for ancillary services have gained traction in select developed markets, they remain relatively novel in the broader landscape of power system operation. Market procurement approaches for ancillary services are primarily characterized by two distinct methods [18]. The first method involves a cost-based pricing mechanism that leverages auctions and bidding as the principal means of procurement. The second approach, known as market-based pricing, is designed to incentivize efficient bidding and balance the service requirements effectively. However, despite their merits, both of these approaches encounter significant challenges in the context of incentivizing a reduction in ancillary service requirements.
In the current market paradigms, neither the mandatory nor the market-based approach inherently fosters a strong incentive for reducing ancillary service needs. Costs resulting from fluctuations in the system are allocated based on the proportion of electricity used by consumers, irrespective of the level of variability. Consequently, individuals who cause fluctuations lack any reason to reduce volatility, resulting in the overall system’s volatility remaining unchanged and operational efficiency declining. As the power system undergoes a transformative shift, characterized by an increasing penetration of renewable energy sources and distributed generation, it becomes imperative to address volatility management effectively [19,20]. Consequently, novel strategies and mechanisms are required to empower stakeholders, both suppliers, and consumers, to actively participate in minimizing system volatility.
Previous cost-allocation research has been conducted in other disciplines [21,22]. Several methodologies for cost allocation of water supply were compared in [23], including proportional allocation, cooperative game theory and separable cost-remaining benefits. A rule for allocating common runway construction costs in the aviation industry was proposed in [24]. The proposed role determines the optimal runway length and landing fees using game theory and linear programming and allocates costs using the Shapley value and nucleolus. Cost allocating for primary frequency response, a type of ancillary service, has been researched in power systems [25,26,27,28]. In order to avoid the cross-subsidies that can occur with proportional allocation, ref. [26] proposes a nucleolus-based method for the allocation of frequency-containment ancillary service costs. On the other hand, relatively little research has been conducted on cost allocation for AGC, another type of ancillary service [29]. Traditionally, AGC capacity is settled a day in advance, and AGC dispatch is not characterized by economic signals [30,31]. However, with the rapid deployment of renewable energy and the need for real-time flexible balancing resources, both AGC capacity and dispatch are changing to take economic signals into account [32].
In today’s electricity market, the cost of AGC ancillary service (AAS) is treated as an uplift, and the cost paid by each consumer is usually determined by dividing the overall cost by the number of consumers or in proportion to their electricity consumption [33]. However, this approach creates an issue as the cost remains fixed regardless of the volatility or the amount of AAS induced. Consequently, some consumers end up paying more than the quantity of AAS they actually use, while others pay less [34]. For instance, a load characterized by low volatility but high power consumption pays more AAS costs compared to a load with high volatility but low power consumption. Furthermore, even if individual consumers try to reduce their AAS usage, the advantages to consumers are minimal, leading to a situation where they might abandon their attempts to decrease AAS usage, and thus, there is no reduction in the reserve required for power system operation.
This study presented the future AAS market design aimed at improving the efficiency of system operation through the reduction of system volatility and reserve capacity. To achieve a reduction in reserve capacity and load variability within this proposed market design, two methods based on the “causer-pays” principle are proposed to allocate the utilization term among the AAS cost to customers.
The first method distributes AAS costs based on the amount of load change that triggers the AAS operation. The second method considers opportunity costs when distributing AAS costs.
By implementing the proposed cost-allocating methods based on the “causer-pays” principle, the unfairness of the present uplift method can be improved. With this new approach, the causer of AAS requirements would have an incentive to voluntarily minimize AAS usage by making use of Energy Storage Systems (ESS) and adopting demand response strategies. As a result, the amount of reserve capacity required to operate the power system can be reduced, leading to an overall cost reduction by eliminating inefficiencies within the system. The major contributions of this paper are summarized as follows:
- The new design of AGC ancillary service cost allocation based on the causer-pays rule;
- A method of allocating costs proportionately to the amount of AAS caused (variation-based method);
- A method for costs and revenue allocation based on the opportunity cost and interaction between loads (opportunity cost-based method);
- Consider both load and variable renewable energy (VRE) while allocating AAS costs.
2. Ancillary Service Pricing Methods
AGC ancillary service, which is primarily provided by power plants, include frequency adjustment, securing adequate reserve power, reactive power control, and black start [35]. These services are required to maintain the stability and quality of the power system. Frequency regulation, reserve, and black start services are all compensated separately in the present electricity market. However, correctly determining the contribution of auxiliary service provided by each generator and compensating accordingly is technically extremely challenging. As a result, in the past, regardless of actual contribution, the compensation mechanism for ancillary services was designed in a relatively advantageous structure for generators with large capacity and power generation.
The cost of AAS that the electricity customers pay to the ISO is determined as the sum of the cost paid by the ISO to the AGC ancillary service supplier (AASS) and the cost used by ISO to provide the AAS. As previously stated, it is divided into an availability term that is unrelated to service usage and a utilization term that is related to service usage linearly. In the current electricity market, where AAS costs are treated as uplift, the cost paid by individual customers is equal to the total cost divided by the number of customers or proportional to the amount of electricity consumed. The availability term is synonymous with a fixed cost associated with supplying reliable power, and it would be reasonable to treat it as an uplift. However, treating the utilization term as an uplift is unreasonable, as the cost is set regardless of the amount of AAS caused amount by each customer. In other words, some customers pay more than the amount of AAS they cause, while others pay less. As a result, because there is no direct benefit to the customer who reduces the AAS by reducing the volatility, the consumer will neglect the effort to minimize the volatility, resulting in no reduction in the reserve capacity for system operation.
In this section, we present two methods for allocating the utilization term among AAS costs to customers based on the causer-pays principle, assuming the following system conditions.
- Electricity generation is not based on load prediction but on the actual traded amount. In other words, it is possible to know the planned power generation and consumption by time of all generators and loads.
- All generators and loads use a smart meter to record electricity generation and consumption in real time.
The proposed methods begin with a simple system to demonstrate the principle, then expand to a more complex system with multiple loads and AASSs.
2.1. Simple System
A simple system with two loads and one AASS is employed for principal analysis. Load 1 represents a growing load in this system, while Load 2 represents a decreasing load. Figure 1 shows the event in which Load 1 exceeds the contracted load demand. The initial power generation of AASS is 0. As Load 1 increases, as shown in Figure 1a, AASS increases the output, as shown in Figure 1b.

Figure 1.
Load 1 demand increase event: (a) Load 1 change in simple system; (b) AGC change in simple system.
As a result, ISO is responsible for paying AASS the cost calculated in (1), and Load 1, which caused the fluctuation, must pay ISO the same cost.
where is the total utilization cost, which ISO pays to all AASSs, is the utilization cost function for positive P, is the deviation of the actual demand compared to the scheduled demand of load I, and is the line loss increase function due to the ΔP. The next example illustrates what happens when the Load 2 demand decreases, as illustrated in Figure 2a. As the Load 2 demand decreases, AASS output decreases, as shown in Figure 2b.
CISO, AASSs = fup (ΔPload 1 + L(ΔPload 1))

Figure 2.
Load 2 demand increase event: (a) Load 2 change in simple system; (b) AGC change in simple system.
At this point, ISO must pay AASS for the cost of (2), and Load 2 must pay ISO for the same amount.
where is the utilization cost function for negative P. Finally, if the above two events occur concurrently, ISO must pay AASS the cost of (3).
2.1.1. Variation-Based Method (Method 1)
The first proposed method is to simply allocate the utilization term proportionately to the AAS causers. In this method, there are three possible cases as follows.
where is the change in the output power of AASS for AAS. In case 1, Load 1 is the cause of AAS, which raises the demand, and so Load 1 must bear the cost of what ISO pays to AASS.
where is the utilization cost that load i pays to ISO. On the other hand, in Case 2, the AAS is caused by Load 2 with decreasing demand, and so Load 2 must pay the cost of what ISO pays to AASS.
Case 1: ΔPAASS > 0
Case 2: ΔPAASS < 0
Case 3: ΔPAASS = 0
In case 3, since there are no causers of AAS, loads do not have to pay any costs.
2.1.2. Opportunity Cost-Based Method (Method 2)
Method 2 takes into account the interaction between loads and opportunity costs. Interaction between loads refers to whether the volatility of individual loads offsets or increases each other’s volatility, and opportunity cost refers to the AAS cost that changes resulting from the interaction between loads. The following five cases can be considered.
Case 1: ΔPAASS > 0, ΔPload 2 < 0
Case 2: ΔPAASS > 0, ΔPload 2 = 0
Case 3: ΔPAASS < 0, ΔPload 1 > 0
Case 4: ΔPAASS < 0, ΔPload 1 = 0
Case 5: ΔPAASS = 0
As shown in Figure 3, ΔPAASS > 0 and ΔPload 2 < 0 in case 1. Because Load 1 uses more power than the contract amount, Load 1 must pay the cost of (1) to ISO. On the other hand, Load 2 must pay the cost of (2) because it uses less power than the contract amount.

Figure 3.
Loads 1 and 2 demand change events: (a) Changes of loads in simple system; (b) AGC change in simple system.
At the same time, ISO must pay AASS for the increased power and receive this cost from Load 1, which caused the increase in net demand. This cost is calculated as:
In this case, the cost to be paid by the loads, calculated as the sum of (1) and (2), is more than (10), which is the cost ISO pays to the AASS. This is because Load 2 absorbs the increase in Load 1, reducing the system’s overall supply imbalance. In this case, Load 1 must pay for the amount absorbed by Load 2, and Load 2 must pay for the amount absorbed by Load 1. The cost to be paid between loads can be calculated by considering the opportunity cost. If only Load 1 fluctuates, Load 1 must pay (1) to ISO. However, (10) is paid to ISO, not (1), which means that Load 1 must pay the difference to Load 2, and opportunity cost, which Load 1 pays to Load 2 is calculated as:
If only Load 2 fluctuates, Load 2 must compensate ISO for the cost of (2). However, because no payment is made to ISO in this case, Load 2 is required to pay Load 1 the cost :
As a result, the costs each load has to pay to the ISO are represented as follows:
In actual system operation, ΔPlaod 1, ΔPload 2 and in (11)–(14) are given from system operational data, not calculated values. Therefore, only L(ΔPload 1) and L(ΔPload 2) need to be determined in order to calculate (13) and (14). Figure 4 shows the IEEE 39 bus system, and Figure 5 shows the change in L(ΔPload 2) according to the ΔPload 2 in the IEEE 39 bus system [36].
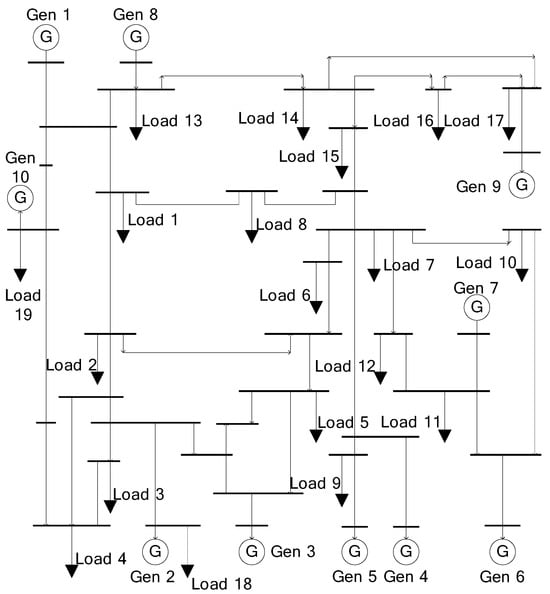
Figure 4.
IEEE 39 bus system.
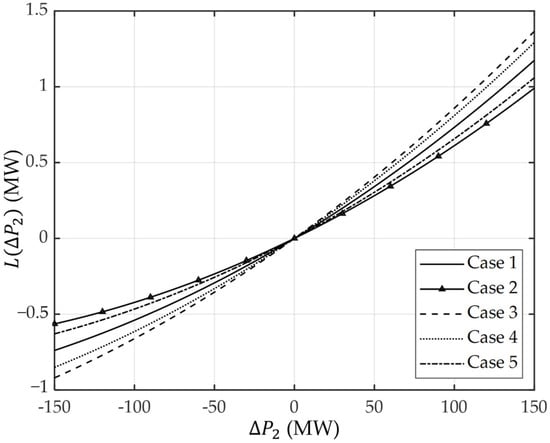
Figure 5.
Transmission loss and Load 2 in IEEE 39 bus system. Case 1: Initial State(IS), which is the same as IEEE 39 bus system data; Case 2: PLoad 9 = 600 MW; Case 3: PLoad 9 = 760 MW; Case 4: PGen 6 = 600 MW, Case 5: PGen 6 =700 MW.
As shown in Figure 5, L(ΔPload 2) is nonlinear with ΔPload 2 and is extremely difficult to represent accurately in a equation due to its dependence on power supply and load. However, L(ΔPload 2) is negligible in comparison to ΔPload 2. Therefore, if L(ΔPload 1) and L(ΔPload 2) are ignored, and can be rewritten as follows based on (11)–(14):
Case 2 is a situation in which ΔPAASS > 0 and ΔPload 2 = 0. Since ΔPload 2 = 0, Load 2 is exempt from paying ISO, and and are calculated as follows:
In Case 3, ΔPAASS < 0 and ΔPload 1 > 0. The same as the steps in case 1, and are calculated as follows:
In Case 4, ΔPAASS < 0 and ΔPload 1 = 0, in contrast to Case 2, where and are calculated as follows:
ΔPAASS = 0 in case 5, where and are represented as follows:
2.2. Complex System with Multiple Loads and AASSs
In a complex system with m loads and n AASSs, the cost loads needed to pay to ISO can be determined using the methods used in the simple system. To apply the proposed methods to a complex system, loads are classified into three categories as follows:
Consider group 1 as Load 1 and group 2 as Load 2 in the simple system, and the cost that each group must pay to ISO is determined using either method 1 or method 2.
where is a deviation of actual power compared to the scheduled power of group j. Because group 3 has no fluctuations, there is no expense to pay ISO. The system average price is applied to fup(P)and fdown(P) for the cost calculation. The cost of the group’s payment to the ISO is spread proportionately among the group’s loads based on AAS usage.
2.3. Considering Variable Resources
The share of energy resources with variable output, such as PV and wind turbines, will increase in future power systems. Due to the uncertain output of such resources, they are forced to rely on the AGC ancillary service. Therefore, variable resources should also be paid to the ISO for the use of AAS. Variable resources are taken into account, and the cost of AAS calculation methods must be modified. To consider variable resources in the allocation of AAS costs, loads and variable resources are classified into three groups as follows:
where is a deviation of actual output power compared to the scheduled output power of generator k. Group 1 and group 2 are treated as Load 1 and Load 2 of the simple system, respectively, and the cost of each group to pay ISO is calculated using the selected method. The variable generators are considered to be a negative load.
The AAS cost to be paid by each group to ISO is distributed among the loads and variable resources belonging to the group as follows:
where is utilization cost, which generator k pays to ISO.
3. Case Study
3.1. System Configuration
The proposed methods were tested and compared to the existing method on the IEEE 39 Bus System in Figure 4 by using MATLAB R2020a. The simulation time in the case study is an hour divided by 10 s intervals. There are 10 generators in the power system for the case study, Gen 1 and Gen 5 are VRE. VREs, like loads, share the cost for AAS. Table 1 shows the scheduled power generation of each generator, and the scheduled and actual power generation of Gen 1 and Gen 5 are shown in Figure 6. Scheduled load and generation refer to power contracts entered into by ISO with consumers or power plants.

Table 1.
Scheduled power generation.
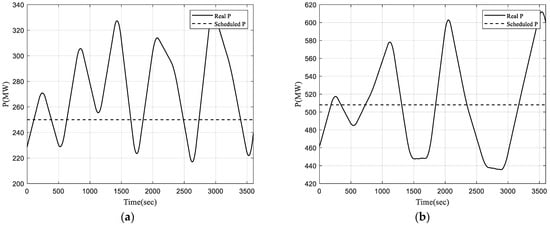
Figure 6.
Actual and scheduled power generation: (a) Gen 1; (b) Gen 5.
There are four AAASs in the case study system: Gen 2, Gen 3, Gen 8 and Gen 10. The utilization cost function of each generator is shown in Table 2. The settlement period of the AAS is 5 min and all AASSs have the same participation factor.

Table 2.
Utilization cost function.
There are 19 loads in the IEEE 39 bus system, and each load has a DC offset that is randomly proportional to the contract value at 5 min intervals. For instance, Figure 7a shows the pattern for Load 4, while Figure 7b shows the pattern of total load in the system. The real load has a step-like pattern, as it is measured as an average value over a 5 min interval. Table 3 shows the scheduled value of each load, whereas Table 4 shows the randomness of the DC offset.
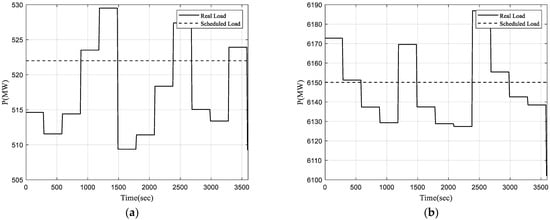
Figure 7.
Actual and scheduled load: (a) Load 4; (b) total load.

Table 3.
Scheduled load.

Table 4.
Randomness(R) of each load.
The ASS provided by the entire AASSs in the case study is shown in Figure 8a, and Figure 8b shows the actual generation of Gen 10, one of the AASSs. Due to the identical participation factor, the shape of the generation of the entire AASSs is identical to the shape of the generation of Gen 10.
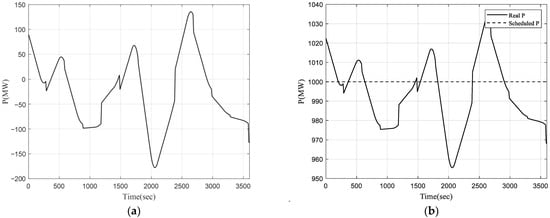
Figure 8.
Total AAS production of AASSs and power generation of Gen 10: (a) total AAS production; (b) actual and scheduled power generation of Gen 10.
The that ISO must pay to each AASS as a consequence of simulation for one hour is shown in Table 5.

Table 5.
Utilization cost for each AASS.
The uplift method used in the case study distributes the in proportion to the contract amount, and the cost to be paid by each AAS consumer to ISO is calculated as follows:
where and are scheduled output power of generator k and load i. Table 6 summarizes the results of calculation for AAS consumers to pay to ISO based on different allocation methods. Negative numbers in bold indicate that consumers do not pay ISO, but instead receive incentives.

Table 6.
AAS costs for each load and VRE.
3.2. Result Comparison between Uplift and Method 1
Figure 9 compares the allocation of costs for each method. In the current uplift method that is proportional to the amount of power, Load 2 (500 MW), Load 4 (522 MW), Load 9 (680 MW), and Load 19 (1104 MW) with large contract power and Gen 5 (508 MW), a large-capacity renewable energy generation, pay relatively high costs regardless of variability. Of particular note are Load 2 and Gen 5. Table 7 shows the cost comparison of Load 2 and Gen 5.
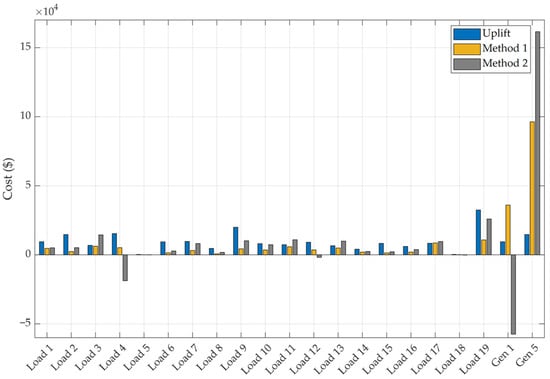
Figure 9.
Cost comparison between proposed methods and uplift.

Table 7.
Comparison of costs between VRE and load according to method.
In general, the uncertainty of renewable energy is greater than the uncertainty of the load. Regardless of uncertainty, renewable energy and the load with the same contract amount pay the same AAS cost, and the load endures a portion of the AAS cost of the renewable energy source. For instance, Load 2 is less volatile than VRE Gen 5, but the contract capacities are comparable at 500 MW and 508 MW, so the uplift method incurs comparable costs. Therefore, the AAS cost of Load 2 can be regarded as excessive under the current uplift method, and there is no reason to invest in Gen 5 to reduce volatility.
On the other hand, when Method 1 results are compared to uplift results, the of loads decreases but the of renewable energy increases. This is because renewable energy output changed significantly in comparison to load. As shown in Table 8, in the case of Load 1 (322 MW) and Load 6 (320 MW) with similar capacities, Load 1 (randomness 3.46%) pays more than Load 6 (randomness 1.95%) with low variability. The issue of low-volatility loads shouldering the expenses of high-variability loads has been resolved. When Method 1 is used, the load and renewable energy sources will attempt to lessen the fluctuation by using energy storage or demand response, resulting in a decrease in AAS. Therefore, the reserve required for power system operation is reduced.

Table 8.
Comparison of costs based on randomness differences.
3.3. Result Comparison between Method 1 and Method 2
Method 2 takes opportunity cost and volatility’s impact on the system into account, as compared to Method 1. The principal difference between Methods 1 and 2 is that some consumers, such as Load 4 and Generation 1, receive costs but do not pay to ISO. This is because fluctuations in load and generator output have a beneficial influence on grid frequency regulation. When Method 1 is used, Load 4 and Load 11 pay a similar cost, but the cost is drastically different when Method 2 is used. In summary, variation-based Method 1 eliminated large-capacity consumers’ unreasonable uplift costs. Method 2, which uses opportunity cost, allocates costs more precisely by considering volatility and system impact and providing incentives when load and VRE benefit the system.
Table 9 shows the cost for each method of loads 4 and 11. Load 4 and Load 11 have comparable quantities of change, but because the contract capacity for Load 4 is large, the uplift method resulted in unfairly high costs. Method 1 solved this problem by charging a cost based on volatility and having loads 4 and 11 pay similar costs. Method 2 reflects whether the changes in Load 4 and Load 11 had a positive or negative impact on the system; therefore, the costs of Load 4 and Load 11 are substantially different from one another. Figure 10a shows the normalized values of ΔPload 4 and AAS, while Figure 10b shows the normalized values of ΔPload 11 and AAS. When AAS is positive, it indicates that the load has increased relative to the schedule; therefore, a decrease in load has a positive impact on the system. When AAS is negative, however, it has a positive impact on the system as the load increases. Load 4 frequently functions in the opposite direction of AAS (positive effect), while Load 11 frequently operates in the same direction as AAS (negative effect), as shown in Figure 10. To clarify this, Table 10 compares the positive and negative effects time of the two loads. For Load 4, demand changed in the opposite direction of total load change and AAS operation 51.5 percent of the time, thus offsetting the required amount of AAS. On the other hand, Load 11 fluctuated in the same direction as AAS for 58.8% of the time, necessitating more AAS. As a consequence, the amount of change in loads 4 and 11 was similar, but Load 4 changed in a direction that was beneficial to the system and was eligible for incentives from ISO, whereas Load 11 changed in an unfavorable direction and incurred additional costs.

Table 9.
Comparison of costs between Load 4 and Load 11.
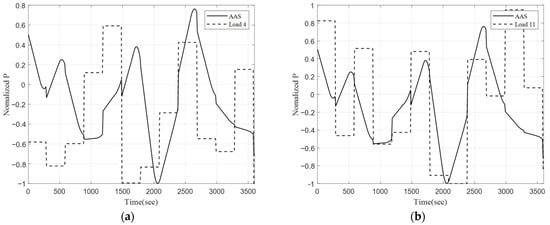
Figure 10.
Normalized ΔPload and AAS: (a) Load 4; (b) Load 11.

Table 10.
Positive time and negative time of Load 4 and Load 11.
Methods 1 and 2, which impose the AAS cost on volatility causers, have the potential to lower reserve. Specifically, when ISO provides AAS information to consumers in the electricity market using Method 2, the cost varies significantly based on whether the consumer has a positive or negative impact on the system. Therefore, loads and VREs will try to affect the supply–demand balance of the grid in a way that is profitable.
4. Conclusions
In this paper, we have presented a novel AAS market design with the aim of enhancing the operational efficiency of future power systems with high volatility and uncertainty. Our proposed market design addresses the pressing need to minimize spinning reserve and its associated waste in the future electricity market. The two methods presented allocate AAS costs to those causing volatility and provide incentives to participants who have a positive impact on the system, thereby encouraging loads and VRE to actively participate in reducing volatility.
To achieve this, we introduced two methods for allocating AAS costs among the causers. The variation-based method proportionally allocates costs based on the variation of each load and VRE that caused AAS, whereas the opportunity cost-based method incentivizes load and VRE to actively engage in frequency regulation by allocating costs or incentives depending on their positive or negative impact on power system volatility.
Our case study results demonstrate the significant variability in costs borne by loads and VREs under the two proposed methods compared to the traditional uplift approach. Method 1, based on variation, eradicated the unreasonable costs incurred by large-capacity consumers under the current uplift method. Method 2, which is based on opportunity cost, is an extension of method 1 that allocates costs more precisely by taking into account not only the volatility but also the impact of the fluctuation on the system and provides incentives when load and VRE contribute positively to the system. The opportunity cost-based method is more precise than the volatility-based method, can avoid cross-subsidies, and can motivate market participants to engage in active behavior. Therefore, for cost-effective and reliable system operation, the opportunity cost-based method is preferable to the variation-based method. The cost of volatility and incentives for positive impact will serve as motivating factors for VREs and loads to control volatility on their own through solutions such as ESS or demand response, and improve the efficiency of the entire system.
By embracing a market design that incentivizes participants to reduce volatility, our research overcomes the limitations of the existing ASS market. We firmly believe that our proposed market design will lead to efficient power system operation, creating a more sustainable and resilient electricity market as we transition into a future dominated by renewable energy sources. As the electric power industry undergoes rapid transformation, the implementation of our innovative market design offers a promising solution for enhancing grid stability, reducing costs, and fostering a collaborative and dynamic energy landscape.
Author Contributions
Conceptualization, S.K. and P.-I.H.; methodology, S.K.; software, J.S.; validation, J.S.; formal analysis, S.K. and P.-I.H.; investigation, J.S.; resources, P.-I.H.; writing—original draft preparation, S.K. and P.-I.H.; writing—review and editing, J.S.; supervision, J.S.; funding acquisition, J.S. All authors have read and agreed to the published version of the manuscript.
Funding
This work was supported by the National Research Foundation of Korea (NRF) grant funded by the Korea government (MSIT) (No. 2022R1F1A1074449).
Data Availability Statement
The data presented in this study are available on request from the corresponding author. The data are not publicly available due to sensitive real operation data.
Conflicts of Interest
The authors declare no conflict of interest.
Nomenclature
| subscript for load | |
| subscript for group | |
| subscript for generator | |
| Total utilization cost, which ISO pays to all AASSs | |
| Utilization cost, which ISO pays to generator k | |
| Utilization cost, which generator k pays to ISO | |
| Utilization cost, which group j pays to ISO | |
| Utilization cost, which load i pays to ISO | |
| Opportunity cost, which load n pays to load m | |
| Change in the output power of AASS for AAS (MW) | |
| Deviation of actual output power compared to scheduled output power of generator k (MW) | |
| Deviation of actual power compared to scheduled power of group j (MW) | |
| Deviation of actual demand compared to scheduled demand of load i (MW) | |
| Utilization cost function for negative P | |
| Utilization cost function for positive P | |
| Line loss increase function due to the ΔP (MW) | |
| Scheduled output power of generator k (MW) | |
| Scheduled demand of load i (MW) |
References
- Puertas, R.; Marti, L. Renewable energy production capacity and consumption in Europe. Sci. Total Environ. 2022, 853, 158592. [Google Scholar] [CrossRef] [PubMed]
- Azarpour, A.; Mohammadzadeh, O.; Rezaei, N.; Zendehboudi, S. Current status and future prospects of renewable and sustainable energy in North America: Progress and challenges. Energy Convers. Manag. 2022, 269, 115945. [Google Scholar] [CrossRef]
- Gielen, D.; Boshell, F.; Saygin, D.; Bazilian, M.D.; Wagner, N.; Gorini, R. The role of renewable energy in the global energy transformation. Energy Strategy Rev. 2019, 24, 38–50. [Google Scholar] [CrossRef]
- Elavarasan, R.M.; Shafiullah, G.; Padmanaban, S.; Kumar, N.M.; Annam, A.; Vetrichelvan, A.M.; Mihet-Popa, L.; Holm-Nielsen, J.B. A comprehensive review on renewable energy development, challenges, and policies of leading Indian states with an international perspective. IEEE Access 2020, 8, 74432–74457. [Google Scholar] [CrossRef]
- Suh, J.; Hwang, S.; Jang, G. Development of a transmission and distribution integrated monitoring and analysis system for high distributed generation penetration. Energies 2017, 10, 1282. [Google Scholar] [CrossRef]
- Suh, J.; Yoon, D.-H.; Cho, Y.-S.; Jang, G. Flexible frequency operation strategy of power system with high renewable penetration. IEEE Trans. Sustain. Energy 2016, 8, 192–199. [Google Scholar] [CrossRef]
- Zakaria, A.; Ismail, F.B.; Lipu, M.H.; Hannan, M.A. Uncertainty models for stochastic optimization in renewable energy applications. Renew. Energy 2020, 145, 1543–1571. [Google Scholar] [CrossRef]
- Mongird, K.; Viswanathan, V.; Alam, J.; Vartanian, C.; Sprenkle, V.; Baxter, R. 2020 Grid Energy Storage Technology Cost and Performance Assessment; United States Dept. Energy, Pacific Northwest Nat. Lab.: Richland, WA, USA, 2020. [Google Scholar]
- Ma, Y.; Hu, Z.; Song, Y. Hour-ahead optimization strategy for shared energy storage of renewable energy power stations to provide frequency regulation service. IEEE Trans. Sustain. Energy 2022, 13, 2331–2342. [Google Scholar] [CrossRef]
- Gonçalves, A.; Cavalcanti, G.O.; Feitosa, M.A.; Dias Filho, R.F.; Pereira, A.C.; Jatobá, E.B.; de Melo Filho, J.B.; Marinho, M.H.; Converti, A.; Gómez-Malagón, L.A. Optimal Sizing of a Photovoltaic/Battery Energy Storage System to Supply Electric Substation Auxiliary Systems under Contingency. Energies 2023, 16, 5165. [Google Scholar] [CrossRef]
- Lander, E.; Liker, J.K. The Toyota Production System and art: Making highly customized and creative products the Toyota way. Int. J. Prod. Res. 2007, 45, 3681–3698. [Google Scholar] [CrossRef]
- Liker, J.K.; Morgan, J.M. The Toyota way in services: The case of lean product development. Acad. Manag. Perspect. 2006, 20, 5–20. [Google Scholar] [CrossRef]
- Mrugalska, B.; Wyrwicka, M.K. Towards lean production in industry 4.0. Procedia Eng. 2017, 182, 466–473. [Google Scholar] [CrossRef]
- Widodo, S.M.; Astanti, R.D.; Ai, T.J.; Samadhi, T.A. Seven-waste framework of waste identification and elimination for computer-based administrative work. TQM J. 2021, 33, 773–803. [Google Scholar] [CrossRef]
- Dickson, E.W.; Singh, S.; Cheung, D.S.; Wyatt, C.C.; Nugent, A.S. Application of lean manufacturing techniques in the emergency department. J. Emerg. Med. 2009, 37, 177–182. [Google Scholar] [CrossRef] [PubMed]
- Wang, J.; Pang, X.; Gao, S.; Zhao, Y.; Cui, S. Assessment of automatic generation control performance of power generation units based on amplitude changes. Int. J. Electr. Power Energy Syst. 2019, 108, 19–30. [Google Scholar] [CrossRef]
- Zhou, Z.; Levin, T.; Conzelmann, G. Survey of US Ancillary Services Markets; Argonne National Lab. (ANL): Argonne, IL, USA, 2016. [Google Scholar]
- Agostini, C.A.; Armijo, F.A.; Silva, C.; Nasirov, S. The role of frequency regulation remuneration schemes in an energy matrix with high penetration of renewable energy. Renew. Energy 2021, 171, 1097–1114. [Google Scholar] [CrossRef]
- Banshwar, A.; Sharma, N.K.; Sood, Y.R.; Shrivastava, R. Renewable energy sources as a new participant in ancillary service markets. Energy Strategy Rev. 2017, 18, 106–120. [Google Scholar] [CrossRef]
- Banshwar, A.; Sharma, N.K.; Sood, Y.R.; Shrivastava, R. An international experience of technical and economic aspects of ancillary services in deregulated power industry: Lessons for emerging BRIC electricity markets. Renew. Sustain. Energy Rev. 2018, 90, 774–801. [Google Scholar] [CrossRef]
- Lemaire, J. An application of game theory: Cost allocation. ASTIN Bull. J. IAA 1984, 14, 61–81. [Google Scholar] [CrossRef]
- Miller, B.L.; Buckman, A. Cost allocation and opportunity costs. Manag. Sci. 1987, 33, 626–639. [Google Scholar] [CrossRef]
- Young, H.P.; Okada, N.; Hashimoto, T. Cost allocation in water resources development. Water Resour. Res. 1982, 18, 463–475. [Google Scholar] [CrossRef]
- Littlechild, S.C.; Thompson, G. Aircraft landing fees: A game theory approach. Bell J. Econ. 1977, 8, 186–204. [Google Scholar] [CrossRef]
- Badesa, L.; Teng, F.; Strbac, G. Pricing inertia and frequency response with diverse dynamics in a mixed-integer second-order cone programming formulation. Appl. Energy 2020, 260, 114334. [Google Scholar] [CrossRef]
- Papadogiannis, K.; Hatziargyriou, N. Optimal allocation of primary reserve services in energy markets. IEEE Trans. Power Syst. 2004, 19, 652–659. [Google Scholar] [CrossRef]
- Badesa, L.; Matamala, C.; Zhou, Y.; Strbac, G. Assigning Shadow Prices to Synthetic Inertia and Frequency Response Reserves From Renewable Energy Sources. IEEE Trans. Sustain. Energy 2022, 14, 12–26. [Google Scholar] [CrossRef]
- Matamala, C.; Badesa, L.; Moreno, R.; Strbac, G. Cost Allocation for Inertia and Frequency Response Ancillary Services. arXiv 2023, arXiv:.06706. [Google Scholar]
- Wang, J.-J.; Li, W.-D.; Zhao, W.-L.; Zhao, Y.-L. A Novel Strategy for Allocation Cost of Automatic Generation Control in Electricity Market Environment. In Proceedings of the 2nd International Conference on Signal Processing Systems, Xi’an, China, 17–19 November 2010; IEEE: Piscataway, NJ, USA, 2010; pp. V3-237–V3-240. [Google Scholar]
- Lin, W.-M.; Yang, C.-Y.; Tsai, M.-T.; Wang, Y.-H. Unit Commitment with Ancillary Services in a Day-Ahead Power Market. Appl. Sci. 2021, 11, 5454. [Google Scholar] [CrossRef]
- Xu, B.; Dvorkin, Y.; Kirschen, D.S.; Silva-Monroy, C.A.; Watson, J.-P. A Comparison of Policies on the Participation of Storage in US Frequency Regulation Markets. In Proceedings of the 2016 IEEE Power and Energy Society General Meeting (PESGM), Boston, MA, USA, 17–21 July 2016; IEEE: Piscataway, NJ, USA, 2016; pp. 1–5. [Google Scholar]
- Zhang, G.; McCalley, J.; Wang, Q. An AGC dynamics-constrained economic dispatch model. IEEE Trans. Power Syst. 2019, 34, 3931–3940. [Google Scholar] [CrossRef]
- Goudarzi, H.; Rayati, M.; Sheikhi, A.; Ranjbar, A.M. A clearing mechanism for joint energy and ancillary services in non-convex markets considering high penetration of renewable energy sources. Int. J. Electr. Power Energy Syst. 2021, 129, 106817. [Google Scholar] [CrossRef]
- Patton, D.B.; LeeVanSchaick, P.; Chen, J. 2021 Assessment of the ISO New England Electricity Markets; ISO New England: Holyoke, MA, USA, 2022. [Google Scholar]
- Kirby, B. Ancillary Services: Technical and Commercial Insights; Wartsila: Helsinki, Finland, 2007. [Google Scholar]
- Athay, T.; Podmore, R.; Virmani, S. A practical method for the direct analysis of transient stability. IEEE Trans. Power Appar. 1979, PAS-98, 573–584. [Google Scholar] [CrossRef]
Disclaimer/Publisher’s Note: The statements, opinions and data contained in all publications are solely those of the individual author(s) and contributor(s) and not of MDPI and/or the editor(s). MDPI and/or the editor(s) disclaim responsibility for any injury to people or property resulting from any ideas, methods, instructions or products referred to in the content. |
© 2023 by the authors. Licensee MDPI, Basel, Switzerland. This article is an open access article distributed under the terms and conditions of the Creative Commons Attribution (CC BY) license (https://creativecommons.org/licenses/by/4.0/).