Article

Experimental Investigation on Knock Characteristics from Pre-Chamber Gas Engine Fueled by Hydrogen

Faculty of Civil and Transport Engineering, Poznan University of Technology, 60-965 Poznan, Poland
*
Author to whom correspondence should be addressed.
Energies 2024, 17(4), 937; https://doi.org/10.3390/en17040937
Submission received: 31 January 2024 / Revised: 15 February 2024 / Accepted: 16 February 2024 / Published: 17 February 2024
(This article belongs to the Special Issue Internal Combustion Engine: Research and Application—2nd Edition)

Abstract

:
Hydrogen-fueled engines require large values of the excess air ratio in order to achieve high thermal efficiency. A low value of this coefficient promotes knocking combustion. This paper analyzes the conditions for the occurrence of knocking combustion in an engine with a turbulent jet ignition (TJI) system with a passive pre-chamber. A single-cylinder engine equipped with a TJI system was running with an air-to-fuel equivalence ratio λ in the range of 1.25–2.00, and the center of combustion (CoC) was regulated in the range of 2–14 deg aTDC (top dead center). Such process conditions made it possible to fully analyze the ascension of knock combustion until its disappearance with the increase in lambda and CoC. Measures of knock in the form of maximum amplitude pressure oscillation (MAPO) and integral modulus of pressure oscillation (IMPO) were used. The absolute values of these indices were pointed out, which can provide the basis for the definition of knock combustion. Based on our own work, the MAPO index > 1 bar was defined, determining the occurrence of knocking (without indicating its quality). In addition, taking into account MAPO, it was concluded that IMPO > 0.13 bar·deg is the quantity responsible for knocking combustion.

1. Introduction

Modern automotive engine engineering focuses not only on efficiency and performance but also on minimizing the negative environmental impact of vehicles. One of the improper phenomena accompanying the combustion process in the engine cylinder that has raised concerns among engineers and environmentalists is the phenomenon of knock combustion. Contrary to its name, the origin of which is the characteristic sound accompanying this phenomenon, knock combustion is not only undesirable, but also abnormal. Studies of knock combustion often focus on its onset, which is determined by the chemical kinetics governing auto-ignition as pressure and temperature rise in the unburned air–fuel mixture during the engine cycle. Complex chemical, such as the composition of the fuel mixture [1,2], and physical relationships influence the formation of this phenomenon, making its control a key aspect in improving engine design [3].
Importantly, knock combustion not only poses a challenge to engineers working on engine efficiency and durability but is also associated with negative environmental impacts [4]. Increased exhaust emissions introduce additional burdens on the atmosphere and also pose a threat to human life and health [5].

1.1. Knock Combustion in Conventional Internal Combustion Engines

Simulation studies of methanol combustion under knocking conditions with different exhaust gas recirculation (EGR) involvement were conducted by Li et al. [6] The results show that the introduction of EGR into the combustion chamber can reduce the intensity of knocking combustion and delay the time of occurrence of knocking combustion. Without EGR, the inlet side of the combustion chamber is most susceptible to knock combustion. As the EGR rate increases, the exhaust side of the combustion chamber is most susceptible to knock combustion.
Wei et al. [7] conducted research on an engine fueled by n-butanol with recirculated exhaust gas. The research work was conducted on a Ricardo E6 engine (injection into the intake port) at n = 1500 rpm and under stoichiometric combustion conditions. The proportion of EGR varied from 0 to 8%. The results of the study show that EGR can reduce the intensity of knock combustion and delay the time of onset of knock combustion due to its cooling and diluting effect. It was observed that at a low EGR level of 3%, the intensity of knock combustion of n-butanol is significantly reduced, while the combustion pressure has a slight change.
In a study by Liu et al. [8], the same engine (turbulent jet ignition, TJI) was fueled with kerosene using a dual spark plug ignition system. Implemented pre-chamber jet ignition (PJI) can improve the heat release rate, accelerate the combustion phase, and improve the stability of kerosene combustion, but it can also worsen the intensity of knock combustion without adjusting the ignition timing.

1.2. Gasoline-Fueled Knock Combustion Tests in Pre-Chamber Systems

In a pre-chamber ignition system, multiple turbulent flame jets from a pre-chamber burn the main combustion chamber mixture in a much shorter duration compared to an otherwise slow-burning lean mixture with a conventional spark ignition (SI) system [9]. The shorter burn duration leads to a reduction in the end-gas residence time at elevated pressure and temperature and hence has the potential to reduce engine knock.
Palakunnummal et al. [10] conducted research on a gasoline-fueled engine equipped with a pre-chamber. Their analysis of high-pass filtered pressure signals indicates significantly higher values of pre-chamber pressure than in the main chamber. This is true for both engine speeds analyzed (n = 6000 rpm and 7500 rpm) at λ = 1.2 and 1.4.
Similar research on the pre-chamber system of a gasoline-fueled engine was conducted by Corrigan et al. [11]. They used a passive combustion chamber with a volume of less than 3% of the main chamber. Such pre-chamber sizes are referred to as a “small pre-chamber” based on the classification presented by Toulson et al. [9]. A 35 MPa direct-injection fuel injector is mounted laterally on the intake side. Maximum amplitude pressure oscillation (MAPO) values in retarded conditions were found to be significantly higher for the pre-chamber combustion in comparison to the conventional spark ignition engine.
Other optical tests with a pre-chamber system [12] were conducted in a modified constant-volume gasoline engine using a passive combustion chamber. A pre-chamber with several variations in the number of flow-hole diameters was used: 4 × 1.2 mm; 4 × 1.4 mm; 4 × 1.6 mm; 6 × 1.2 mm and 10 × 1.0 mm. It was observed that PC combustion demonstrates the potential to mitigate knock or extend the knock limit due to its rapid burn rate and reduced end gas residence time. It was observed that PC combustion exhibited fewer intense knock cycles compared to SI, indicating an advantage in suppressing knock intensity, particularly in severe outlier cycles. It was also observed that both SI and PC knock locations were primarily observed as end gas knock near the chamber liner, where the unburned air–fuel mixture undergoes high pressure and temperature trajectories.
Currently, there are many methods for determining knock combustion. These involve spectral data [13,14,15] or combustion pressure filtering [16,17,18]. The evaluation of knock intensity is mostly dependent on cylinder change, and the evaluation indicators for knock mainly include MAPO, IMPO, and maximum pressure rise rate (MPRR) [16,19,20,21,22,23].
In knock research, the most widely used evaluation index is MAPO [16]. It displays the impact intensity generated by knock:
MAPO = 1 N 1 N max ST ,   ST + W p ˜
where the N represents the calculated cycle number, the p is the filter pressure in the cylinder, dα represents the crank angle at knock occurrence, ST is spark timing and W is the duration of knock combustion. The larger MAPO is, the greater are the tendency and intensity of knock. IMPO is a way to represent the energy contained in the high frequency oscillations of the cylinder pressure signal, which occurs due to knock:
IMPO = 1 N ST ST + W max ST ,   ST + W p ˜ d α
There is currently no clear MAPO value indicating knocking combustion. The threshold level closely depends on engine features [16]. The limiting magnitude was defined very differently: Thomas et al. [24] used a MAPO level of 0.9 bar. Szwaja and Naber [25] set the knock limit at 1 bar. The same value is used by many authors in their studies [26,27]. Aramburu et al. [28] used a knock limit of MAPO = 4 bar in their study of a six-cylinder engine with a displacement of 5883 cm3. The same MAPO limit was used by Pla et al. [29], even though the displacement of the direct-injection engine was only 1300 cm3. For engines with larger cylinder capacity (5 dm3/cyl.), the MAPO value was increased to 5 bar [30]. In another case, this value depended on the size of the filter. Puzinauskas [31] distinguished two ranges: 4–9 kHz, in which case the MAPO limit is 0.15 bar, and at 4–12 kHz the MAPO limit is 0.23 bar. Shi et al. [32] made an attempt to relate MAPO to peak mean luminosity, obtaining a magnitude of fit R-squared curve-fitting of 0.67. This indicated that the MAPO follows a moderate exponential relationship with the peak mean flame luminosity, and higher knock strength brings a higher peak of mean flame intensity. As demonstrated by that study, there are many publications that assume the occurrence of knock when MAPO > 1 bar. In the paper, no distinction was made between the forms of light or strong knock. The maximum MAPO values obtained in the study do not indicate the occurrence of strong knock. For this reason, the study was limited only to the determination of the knocking threshold with the omission of quality determination.

1.3. Characteristics of Hydrogen Combustion

Hydrogen is one of the cleanest fuels in terms of emissions (no COx or soot) combined with a high gravimetric energy density compared to other fuels [33]. The amount of energy released during hydrogen combustion (LHV: 120 MJ/kg) is about two and a half times the heat of combustion of typical hydrocarbon fuels (gasoline: 45 MJ/kg or methane: 50 MJ/kg). The disadvantage of using hydrogen is its low volumetric density. The flash point is also extremely low (−253 °C), resulting in high flammability among various fuels. The range of 4–75% H2 content in air allows ignition and explosiveness at normal temperature. The octane number with respect to lean mixtures is also very favorable (130). In internal combustion engines, hydrogen delivery technology is divided into indirect injection and direct injection. Indirect injection causes pre-ignition, knock and backfiring issues due to lower ignition energy and quenching distance of H2 [34]. Direct injection, pressure-boosted H2 benefits from increased engine performance ratings and reduced exhaust emissions [35]. The use of hydrogen (as a single fuel) under highly diluted conditions results in reduced knocking combustion and low nitrogen oxide emissions, while increasing engine performance and efficiency [36,37,38].
The objectives of this research were:
  • to determine the conditions of knocking combustion in the TJI system in the main chamber and the pre-chamber taking into account the variation of the excess air ratio and the center of combustion locations;
  • to obtain numerical indices of knock combustion, especially in terms of IMPO index;
  • to make a comparison of knock combustion indices: MAPO and IMPO in both combustion chambers.

2. Methodology of the Research Work

2.1. Test Stand

Analyses of the combustion process were conducted on a single-cylinder AVL 5804 research engine, equipped with a two-stage combustion system—TJI. The current tests used a passive combustion chamber (fuel was supplied only to the intake manifold, which reached the main combustion chamber). No fuel was supplied to the chamber; it was only the site of ignition initiation of the charge near the spark plug electrodes. The burning charge outflow from the pre-chamber reached the cylinder volume, causing surface ignition of the main mixture (Figure 1). The 510 cm3 engine was fueled with hydrogen at 7 bar pressure. The engine was loaded with an AMKASYN asynchronous electric machine. The technical data of the test stand are shown in Table 1.

2.2. Measuring Equipment

The fuel mass flow rate was measured with a Micro Motion ELITE CMFS010M (by Emerson) flowmeter using the Coriolis principle. This type of flowmeter allows it to be used for methane as well as hydrogen without calibration, unlike thermal flowmeters. Control of the PFI fuel system was performed through a controller manufactured by Mechatronika by setting a constant start of fuel injection at the angle of α = 240 deg bTDC (top dead center). The air mass was measured with a Sensycon Sensyflow thermal mass flow meter from ABB. The engine’s air and hydrogen supply lines were equipped with vessels to compensate the pressure pulsations. The throttle and ignition were controlled using an open Engine Management Unit—EMU Black by Ecumaster. The ignition system in the chamber (passive pre-chamber) consisted in the Beru pencil coil and the M10 spark plug. The coil control enabled setting both the coil charging time (tch = 3 ms) and the ignition timing. The excess air ratio was measured with an LSU 4.9 lambda sensor and an LCP80 controller. Analyses of the combustion process were carried out using an 8-channel AVL IndiSmart data acquisition system, which was used to measure cylinder pressure in the main chamber (P_MC), pre-chamber (P_PC), main chamber fuel injection time (t_MC), and ignition waveform (Ign). Using a data acquisition equipment, 100 engine cycles were recorded for each point. Pressure sensors were used in both combustion chambers (in the main chamber: AVL GH14D and in the pre-chamber: Kistler M3.5). Engine operating parameters were recorded with a resolution of 0.1 deg CA. In addition, pressure and temperature sensors were used in the intake and exhaust systems, the data of which are shown in Table 2.
The combustion chamber was equipped with a 6-holes pre-chamber capacity of 2.29 cm3. This value accounted for 0.45% of the total engine stroke volume (at BDC) and 6.6% of the capacity (at TDC).

3. Results of the Engine Tests

3.1. Overall Test Results

The combustion process was analyzed at different values of λ and varying center of combustion (CoC) settings (as shown in the methodology of the research work). Examples of pressure values in the main chamber and in the pre-chamber are shown in Figure 2. It can be seen that the initiation of the combustion process in the pre-chamber (blue line) is close to TDC (Figure 2a). Subsequently, flames from the pre-chamber ignite the air–fuel mixture in the main chamber. Significant pressure fluctuations indicative of knock combustion were observed in the main chamber. A full analysis of the operating point λ = 1.25 at varying values of CoC is shown in Figure 2b. The occurrence of knock combustion at any value of CoC is evident. Even a large ignition delay (CoC = 14 deg aTDC) indicates the existence of knock combustion. This means that there is such an excess air ratio that even a significant ignition delay (associated with CoC delay) does not lead to the end of knocking.

3.2. MAPO Analysis

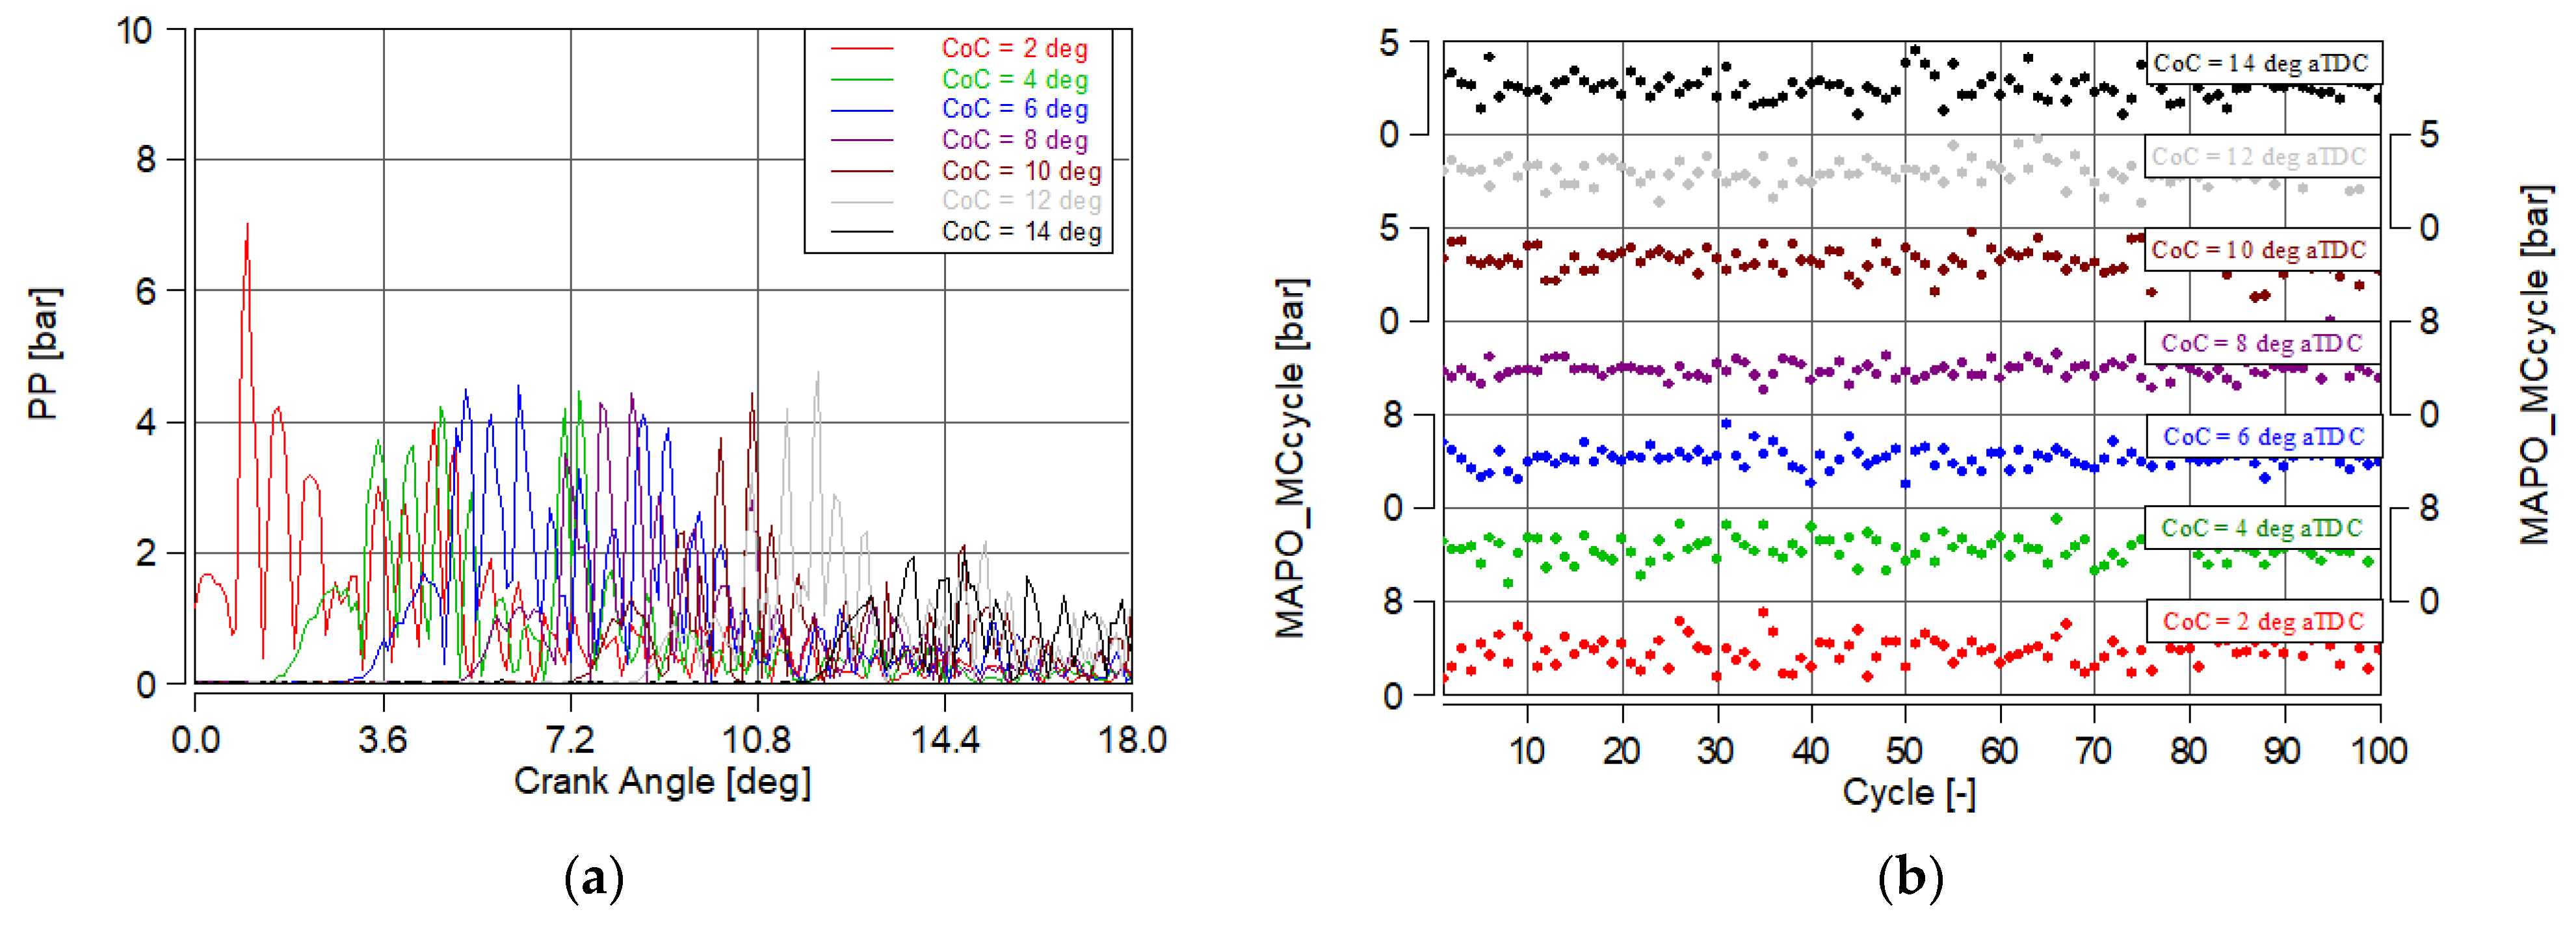
In order to obtain the MAPO magnitude, a digital filtering process was performed on the cylinder pressure signal (at f = 4–20 kHz, in the angular range of 0–70 deg with a pressure signal resolution of Δα = 0.1 deg). The selected frequency range is the most characteristic of knock combustion. The selection of a high-pass filter removes the slow-variable component with large amplitude. The results of the high-pass filter were used for further analysis. For each measurement cycle (out of 100 recorded cycles), the PP (peak pressure) value was determined (Figure 3a).
Analyses were performed in the angle range of 0 to 18 deg aTDC. They show that the maximum pressure values move toward later angles with ignition delay (i.e., CoC delay). The maximum PP values fall in the range of 1 to 12 deg aTDC. Further angle analysis was not needed.
PP results for each combustion cycle at λ = 1.25 and at CoC = var are shown in Figure 3b.
The data shown in Figure 3 indicate that the largest change values (in the range of 1–8 bar) appeared at λ = 1.25 and with CoC in the range of 2–6 deg aTDC. In the range of later CoC, the maximum change values reach 5 bar. Such values indicate the existence of knock combustion in the range of whole CoC changes at the smallest analyzed value of excess air ratio.
In the following section, a full MAPO_MC analysis (for the main chamber) was performed for each engine cycle at λ = var and CoC = var (Figure 4). It can be seen from Figure 4 that increasing charge depletion promotes a reduction in knock combustion. In addition, in the range of each value of λ, increasing the value of CoC also reduces the maximum oscillation of combustion pressure. It can be concluded that a temporary increase in charge depletion may be preferable to an ignition delay (or CoC) when burning hydrogen lean mixtures during knocking. From Figure 4, it can be seen that reducing knock by reducing the excess air ratio is much more effective than delaying ignition (or CoC).
Significantly lower values of oscillations were recorded during analyses of combustion pressure in the pre-chamber (Figure 5). The study used a passive pre-chamber, so the amount of fuel in the chamber was not adjusted. It was only derived from the global λ value obtained by injecting fuel into the intake port. In the case of MAPO in the pre-chamber, a limitation of the pressure oscillation with respect to the main chamber was obtained. The absolute maximum values of MAPO_PC relative to MAPO_MC were more than doubled in the range λ < 1.5. At higher values of λ, these changes were smaller, and at λ = 2.00 the maximum values were the same.
As mentioned earlier, the works [25,26,27] assumed that the MAPO limits indicating the occurrence of knock are MAPO > 1 bar. Taking into account the above conclusions, in the current research, it can be easily determined that correct and abnormal (with knocking combustion) cycles appeared in the pre-chamber (passive) under all conditions. However, it can be assumed that at λ > 1.50 and high CoC values, knocking combustion in the pre-chamber almost did not occur. At values of λ > 1.8, knock combustion was practically non-existent. This is indicated by the absence of single cycles with pressure oscillations above 1 bar in the pre-chamber. Analysis of the same conditions in the main chamber (MC) indicates the absence of knock combustion only at λ = 2.00.
Due to the easy determination of the MAPO value indicating knocking combustion, further work was done to determine the limiting IMPO value.

3.3. IMPO Analysis

IMPO analysis was carried out in a window of 0 to 20 deg aTDC with a resolution of 0.1 deg. This analysis was carried out based on Equation (2). It has a completely similar course to MAPO. What is different—due to integration—are the index values. The IMPO index in the conducted studies ranges from zero (in the absence of tapping) to about 1.5 bar-deg with pronounced tapping. As λ increases, the indicator takes on smaller values (similar to MAPO) (Figure 6).
Similar changes were noted when determining IMPO in the pre-chamber (IMPO_PC) (Figure 7). In this case, the maximum values were also much smaller (the same as for MAPO in the pre-chamber). The minimum values were zero, but the maximum values reached 0.4 bar-deg.

3.4. Comparison of MAPO and IMPO Indicators

Since the MAPO and IMPO indices were determined for each combustion chamber, a separate comparison of these indices was made for the preliminary and main chambers.
MAPO and IMPO indicators were averaged for 100 engine cycles. They will be presented in this form in the following section.
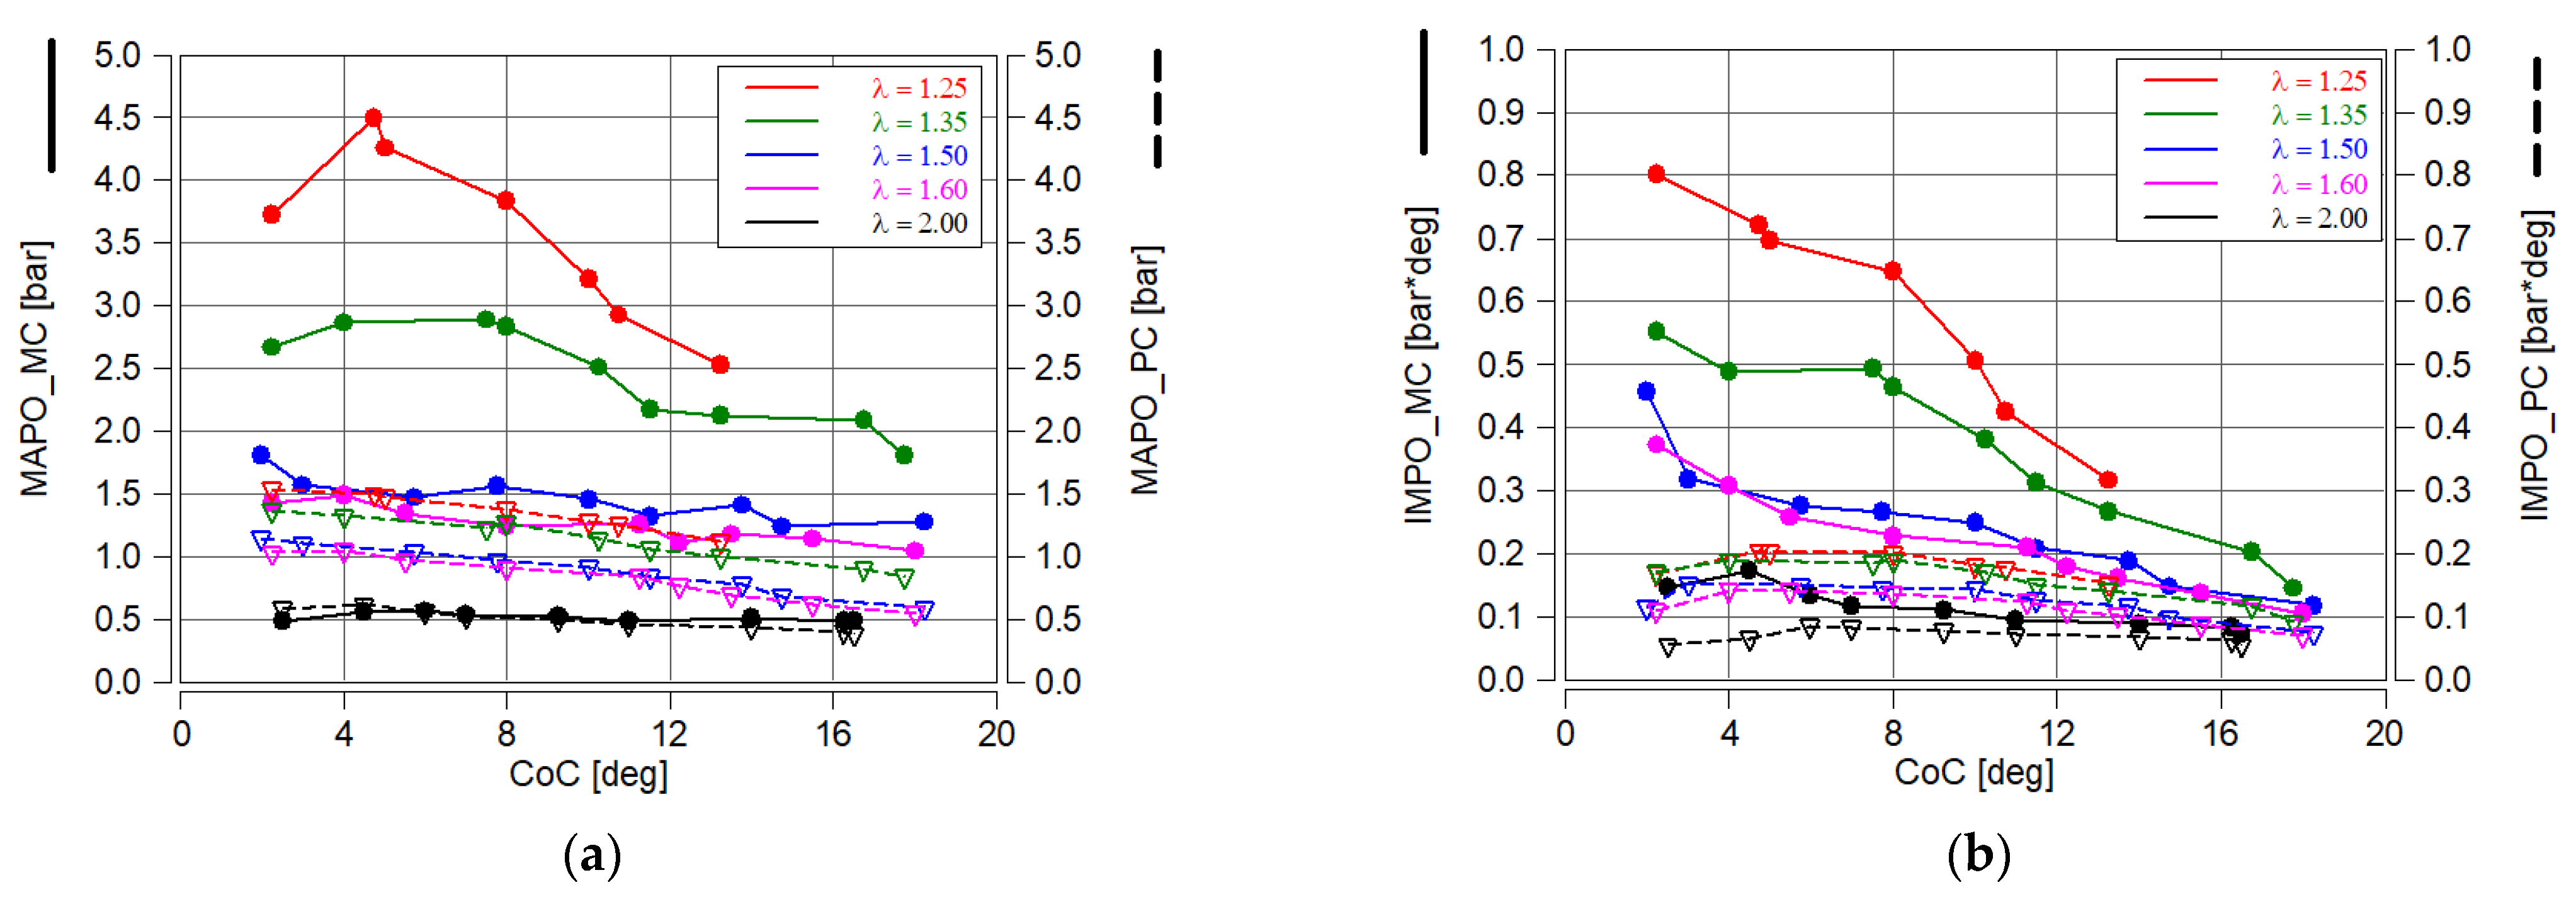
Analysis of the MAPO index for both combustion chambers (Figure 8a) shows significantly higher values in the main chamber than in the preliminary chamber. The largest MAPO of 4.5 was recorded at CoC = 4 deg aTDC. After a similar CoC, the largest values were recorded at λ = 1.35. When increasing the excess air ratio, the MAPO index obtained almost constant values with a tendency to decrease slightly with increasing CoC. At λ = 2.00, the MAPO value remained constant at MAPO = 0.5 bar (indicating the absence of knock combustion).
Analysis of MAPO in the pre-chamber (passive chamber) indicates much smaller differences in this indicator. The maximum MAPO value at λ = 1.25 was 1.5 bar (which then decreased to about 1.0 bar). A similar trend of decreasing MAPO values is observed when increasing λ.
Analysis of IMPO indicates that its highest values (IMPO = 0.8 bar·deg) in the main chamber were obtained at λ = 1.25 and at CoC = 4 deg aTDC (Figure 8b). Other IMPO values at smaller λ also indicate the highest values of this index at CoC = 2 deg aTDC. The IMPO index decreased (almost linearly) with increasing CoC (regardless of λ). The maximum values of MAPO were more than five times higher than IMPO. The absolute values are strongly dependent on the angular window of averaging the values of both indices. The trend of changes in both indices makes IMPO more dependent on CoC than MAPO (which at large values λ does not depend on CoC). Small values of IMPO in the pre-chamber cause the tendency of their changes to depend on λ and not on CoC—similar to MAPO.
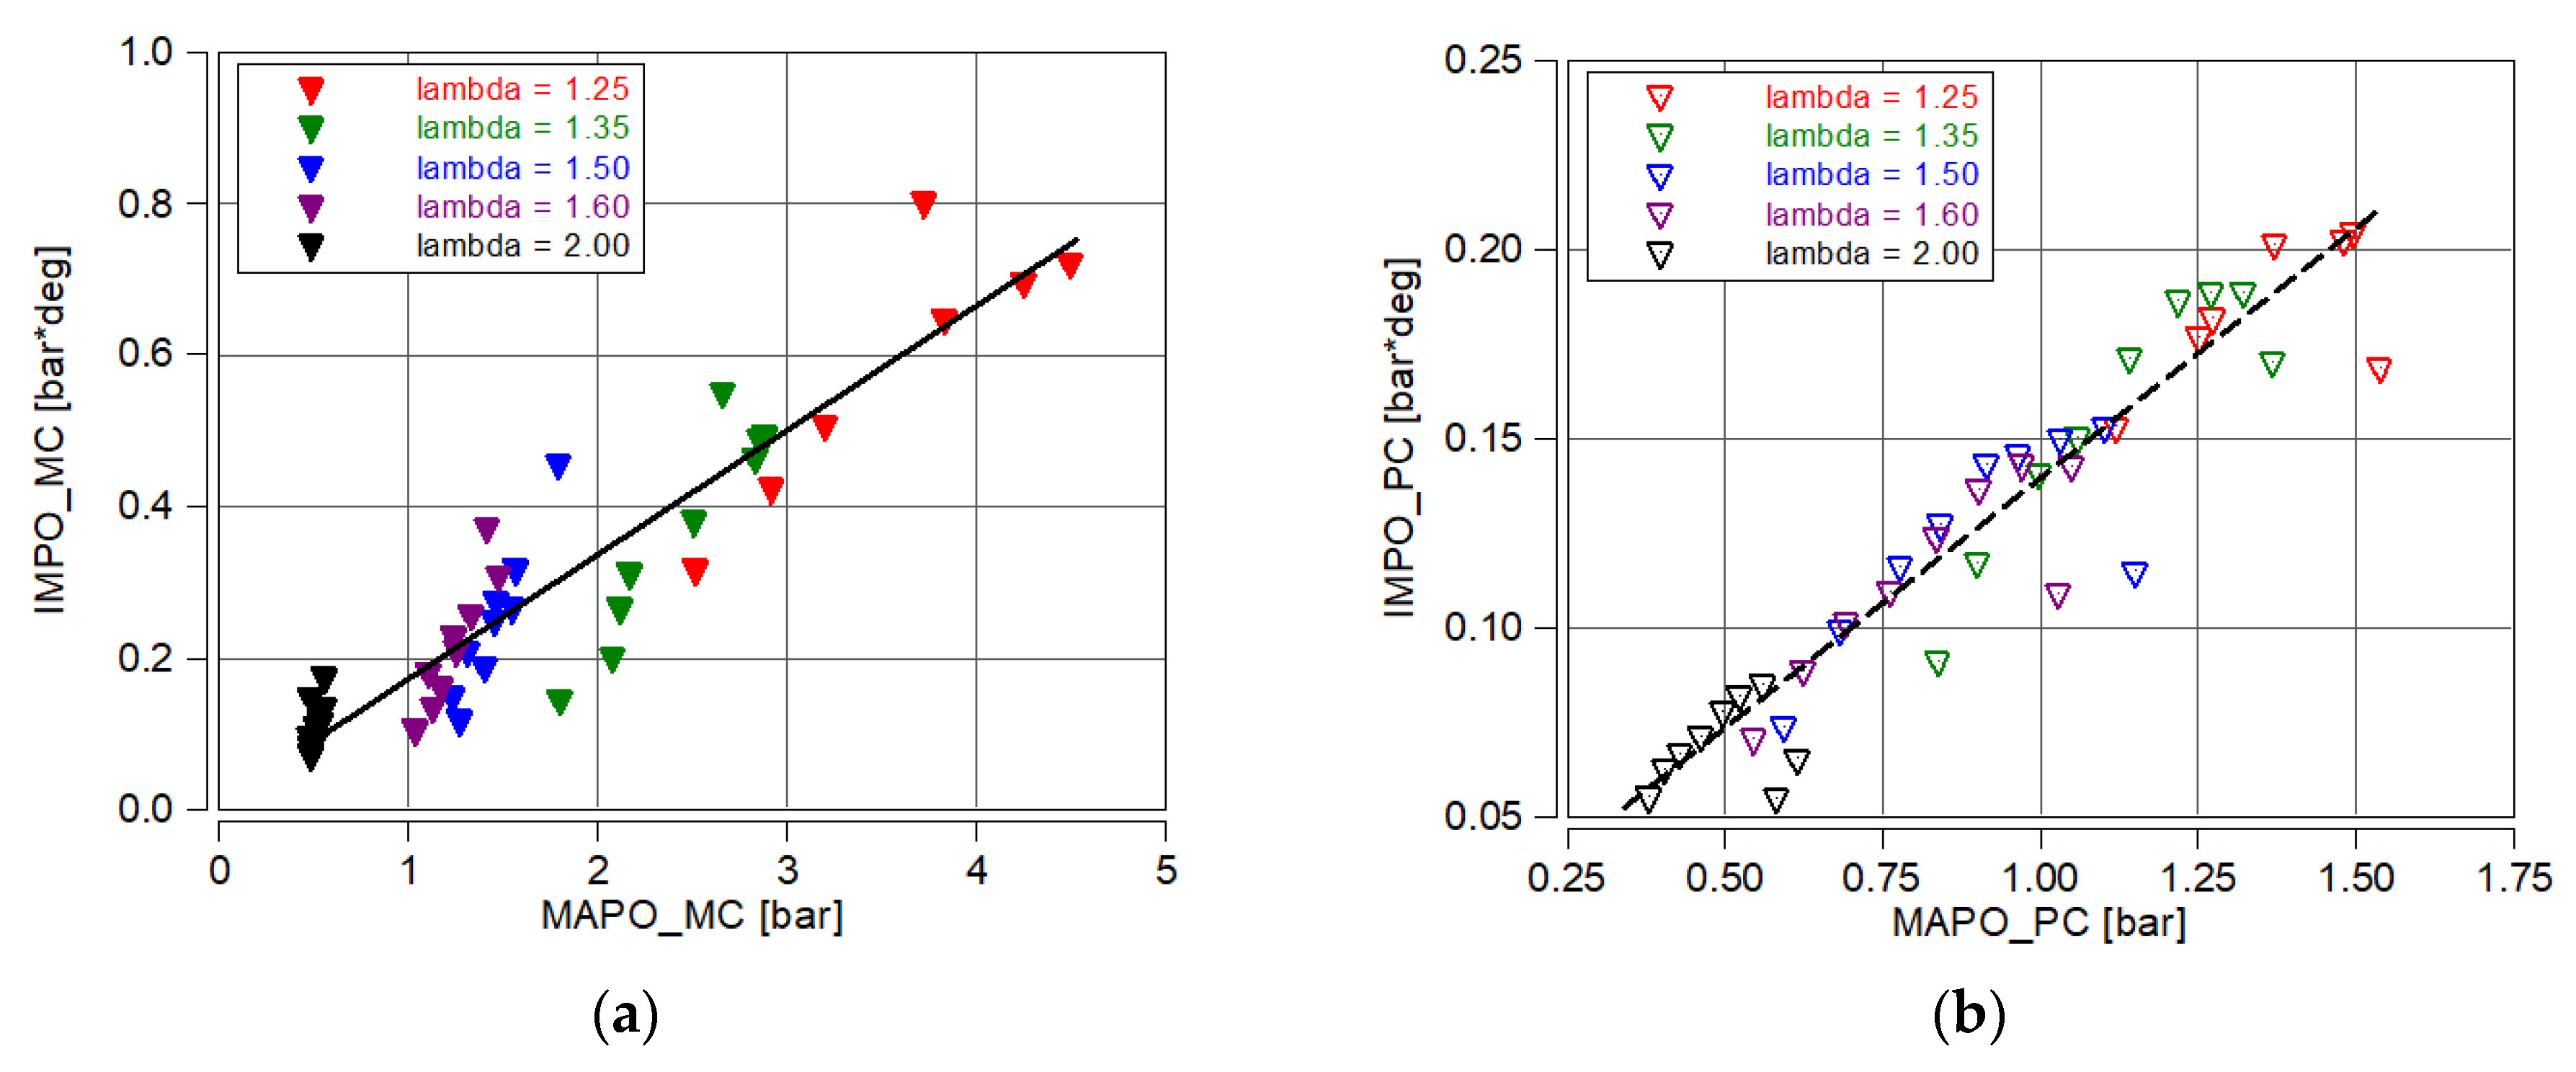
Although the trends of changes in the MAPO and IMPO indices are different, it was decided to juxtapose them in a way that would allow them to be evaluated. For the main chamber, the scales of both data in the main chamber were selected so that their values could be compared (Figure 9a). The scales were selected so that the ratio MAPO/IMPO = 5. With such a comparison, it turns out that both indices can be compared. A five-times gain in MAPO indicates that the indicator values have similar trends. Despite sometimes different values at CoC = 2 deg aTDC (and different λ), it turns out that the subsequent course of change is similar. In most cases, MAPO values are larger than IMPO (after scaling). As λ increases, the two waveforms become closer. Also, with regard to the pre-chamber, the scale was chosen so that the two indicators could be compared (Figure 9b). Similar trends in the changes of the two indicators were obtained: their trends overlap.
A comparative analysis of the MAPO and IMPO indices indicates that there is some relationship between the two indices (Figure 10). In terms of the main chamber, the equation IMPO_MC = 0.1657·MAPO was obtained (Figure 10a), with a value of the coefficient of determination R2 = 0.863. Although the data for the pre-chamber appear linear, the value of R2 is 0.827 (Figure 10b). This means an even smaller value of the coefficient of determination. Taking the above into account, it is not absolutely possible to conclude a high correlation between the two indicators.
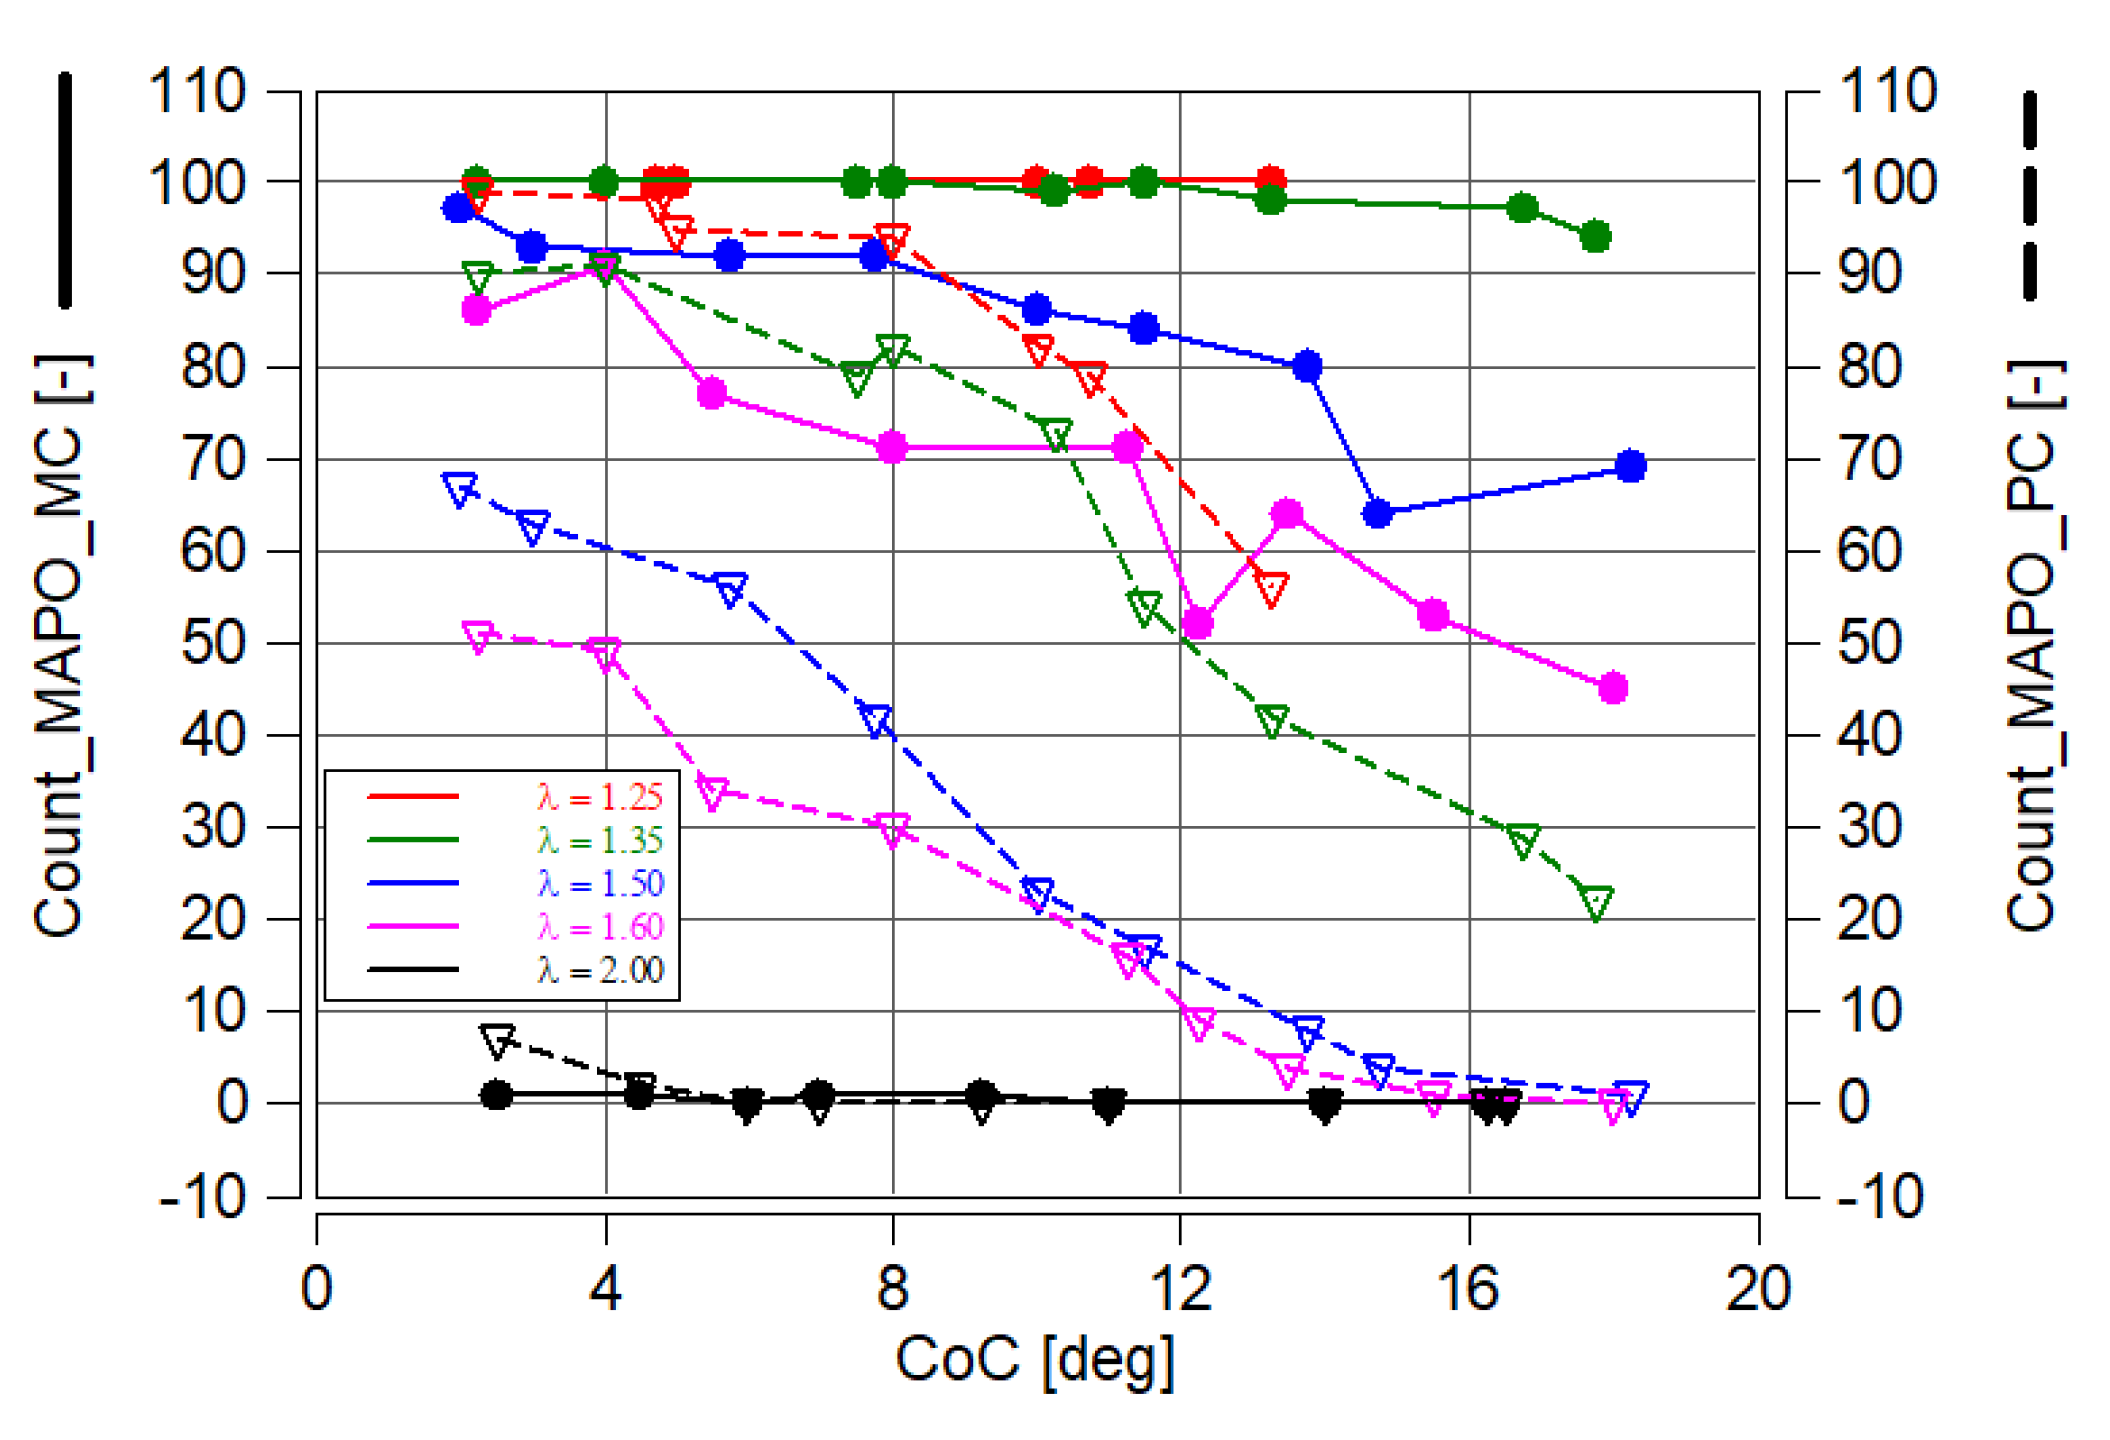
MAPO limits were mostly adopted at 0.1 MPa. Therefore, the number of cycles subject to knocking combustion (such cycles at which MAPO > 1 bar) was determined for each engine operating point. With 100 measurement cycles, the percentages correspond to the absolute number of cycles.
The analysis performed in the AVL Concerto system shows that at a low value of the excess air ratio (λ < 1.5), the number of knock combustion cycles in the main chamber is almost 100% (Figure 11). At λ = 1.35 and CoC > 12 deg aTDC, the value drops slightly and reaches 95%. At λ = 1.5, the highest number of knock combustion cycles occurs at CoC = 2 deg aTDC Count_MAPO_MC = 97%. At λ = 1.6, the number of knock combustion cycles range from 86% (CoC = 2 deg aTDC) to 44% (at CoC = 18 deg aTDC). Minimal numbers of knock combustion cycles were recorded at λ = 2.0; they were only 1% at several operating points, regardless of the CoC value.
For the pre-chamber, the number of knock combustion cycles was never 100% (at λ = 1.25 and CoC, the value was 99%). At CoC = 18 deg aTDC, the number of these cycles was 56%. At each higher value of λ the number of knock combustion cycles was lower.
At λ = 1.5 and λ = 1.6, the number of knock combustion cycles in the pre-chamber was about 40% less than in the main chamber and decreased with increasing CoC. At λ = 2.0 in the pre-chamber, only at CoC = 2 and 4 deg aTDC was the number of knock cycles higher than in the main chamber. At higher CoCs, no knock was recorded in the pre-chamber in any engine cycle analyzed.

3.5. Determination of IMPO Limits

Since there is no limiting IMPO, we decided to determine this value in a way that corresponds to the MAPO value.
The relationship between MAPO and IMPO in the main chamber, shown above in Figure 9a, indicates that the waveforms of these quantities are similar, but their values are different due to the way they are calculated—as confirmed by Equations (1) and (2).
Given the known MAPO limit value (1 bar), the number of cycles subject to knocking combustion was determined (shown previously in Figure 11). The authors assumed that the IMPO limit value should be such that the number of cycles determining knock combustion in the main chamber should be similar. The study was conducted only for the main chamber, as the number of knock combustion cycles was much higher than in the pre-chamber.
Having at our disposal five values of the excess air ratio and a number of CoC quantities, we created a map to determine the number of knock combustion cycles. Based on this map (Figure 12a), it was concluded that the sought-after number of cycles determined by IMPO would be similar. Knowing the number of MAPO cycles, a function defined by the sum of the squares of the difference of MAPO and IMPO cycles was created, which was subject to minimization. In this way, the limit value of IMPO was determined, which allows for a similar number of cycles.
This function was implemented for all measurement data (5 variables—λ × 9 variables—CoC) in the form of:
k = 0 n C MAPO k C IMPO k 2 min
where C is the number of cycles subject to knock combustion.
Figure 12a summarizes the known values of the number of cycles subject to knock combustion. Black boxes indicate the absence of measured data. Figure 12b shows the results of minimizing the function for which the minimum of the sum of squares of Equation (3) was obtained. This analysis was carried out in MS Excel 2010 using the Solver module. At IMPO = 0.13 bar·deg, the differences in the number of knock combustion cycles shown in Figure 12c were obtained. It shows that the highest similarity was obtained with a high value of λ and all values of CoC. As λ increases, the deviations from the setpoint become larger.
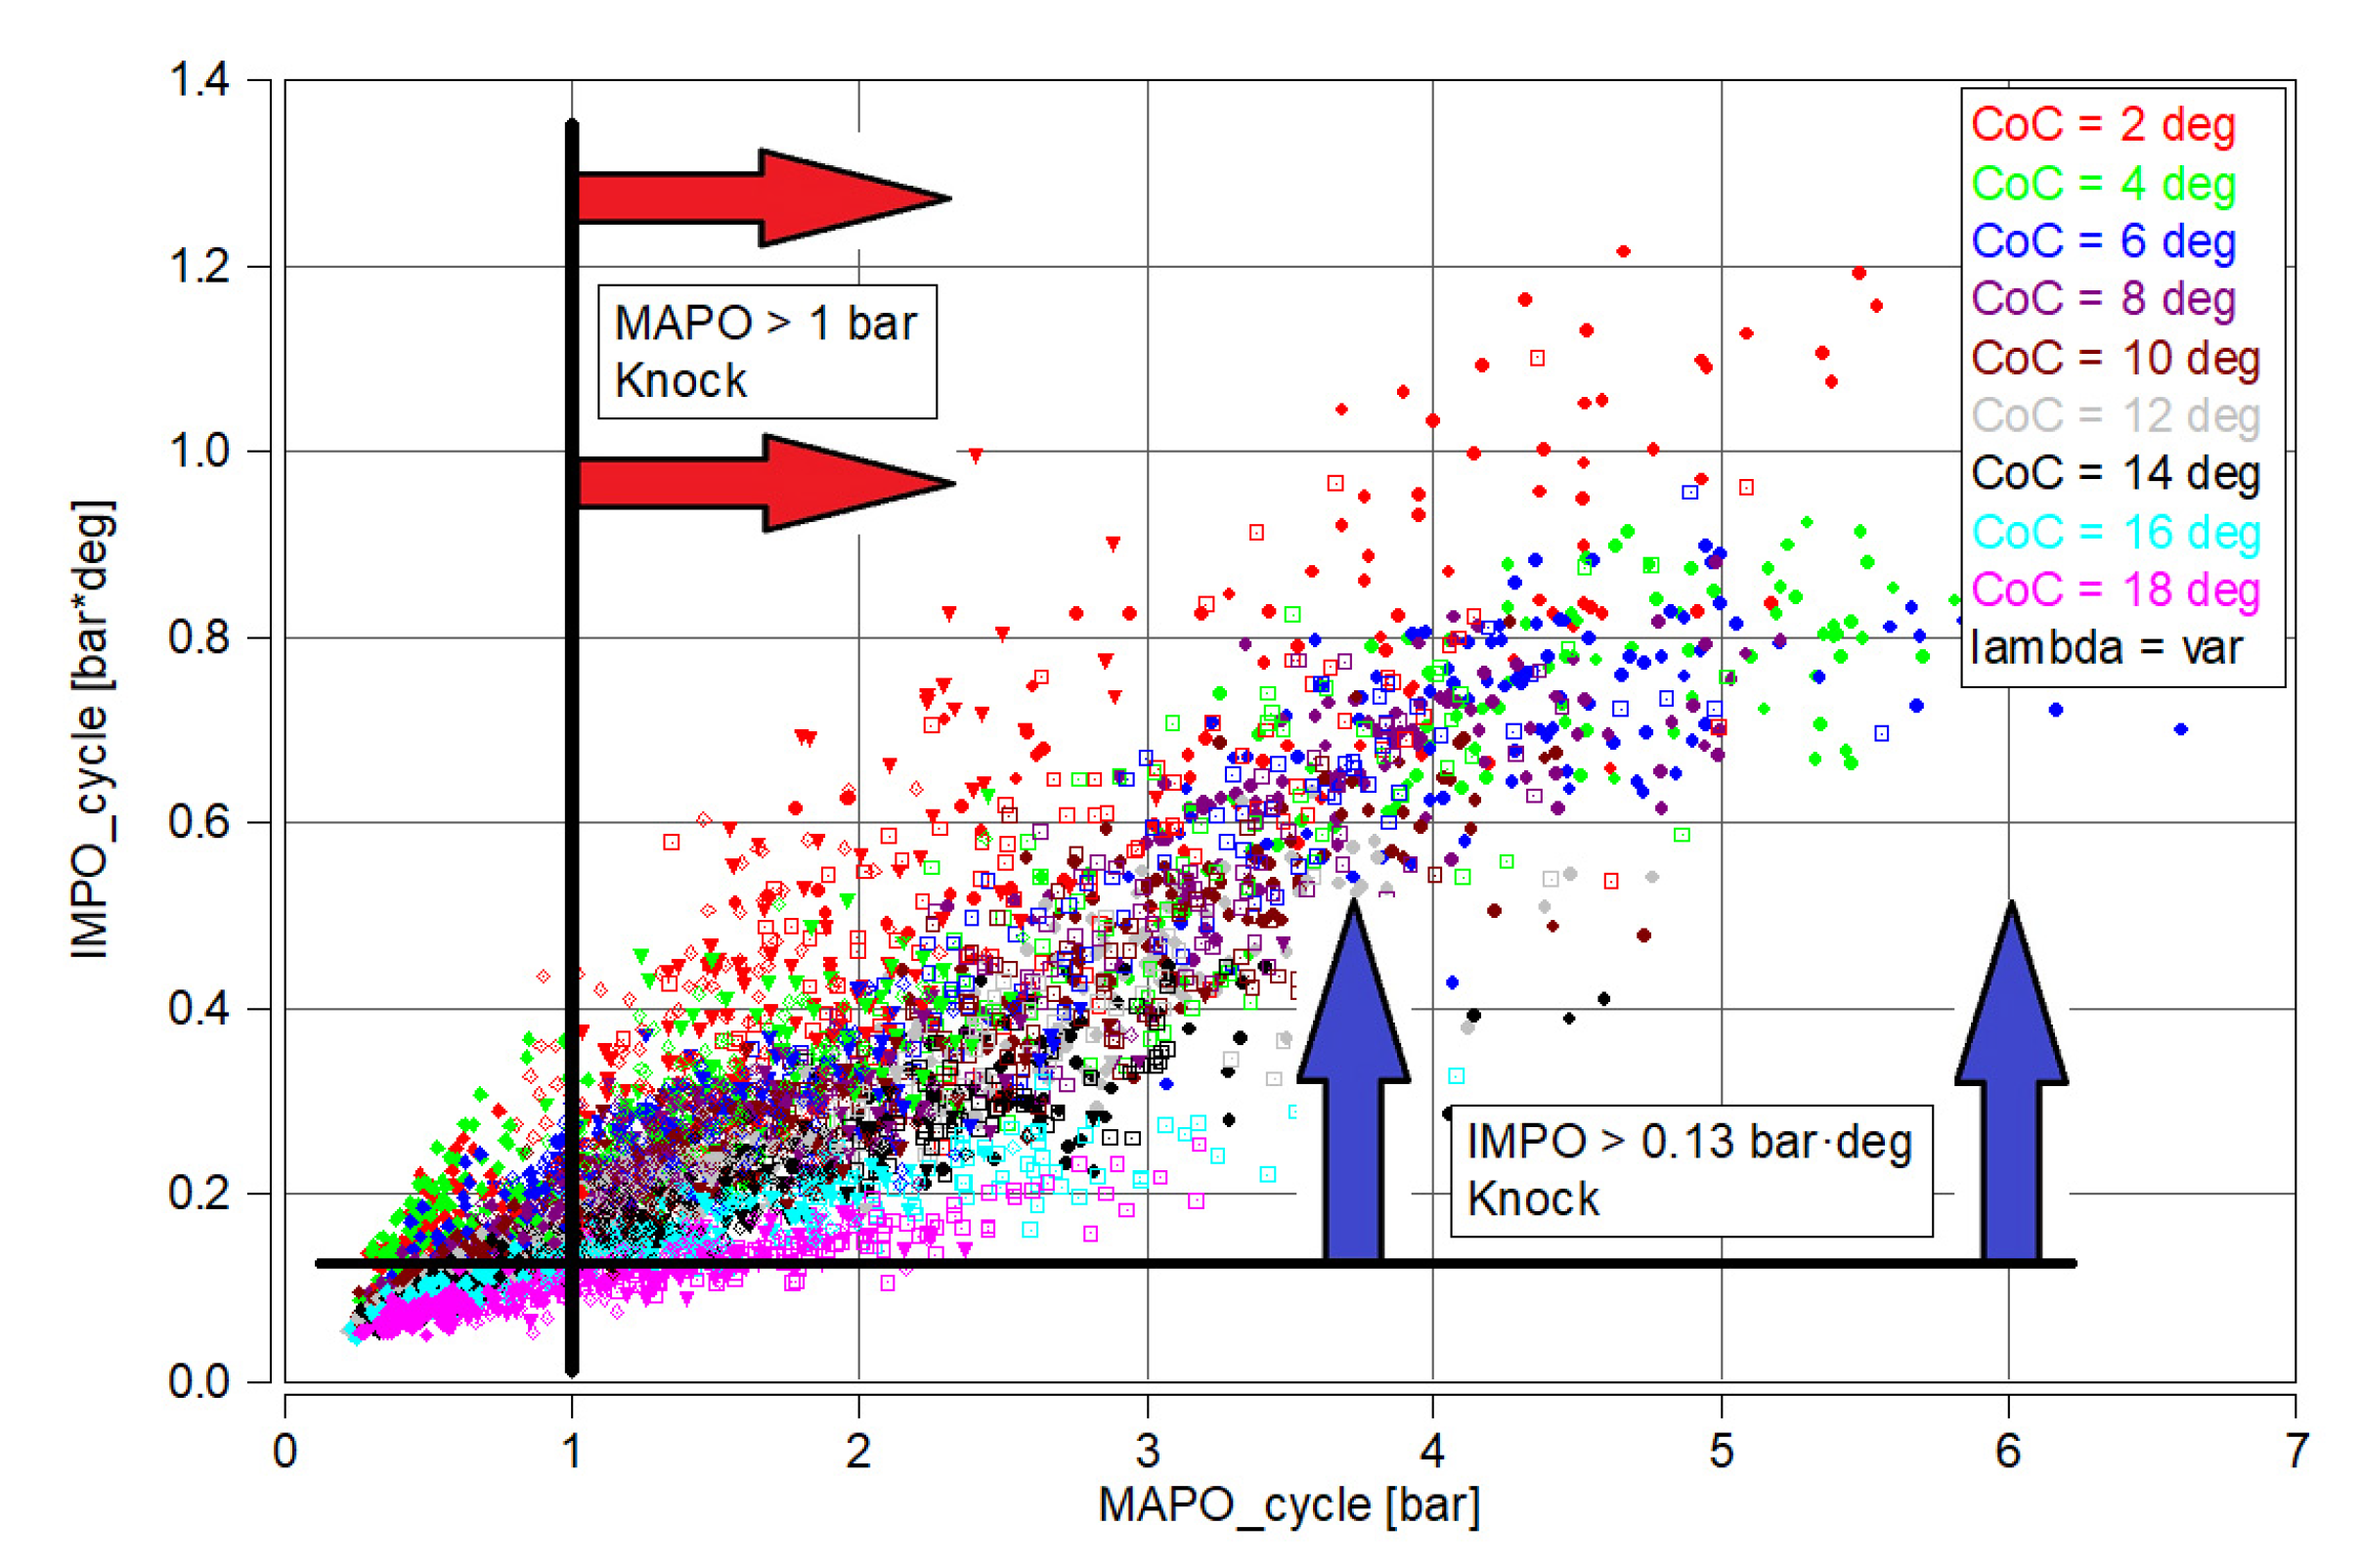
The IMPO value determined in this way enabled the construction of the MAPO_cycle = f(IMPO_cycle) relationship for all test points (Figure 13). The results of the analyses in Figure 13 were divided into four zones:
  • MAPO_cycle > 1 and IMPO_cycle > 0.13 → 65.72% of research points
  • MAPO_cycle > 1 and IMPO_cycle ≤ 0.13 → 3.09% of research points
  • MAPO_cycle < 1 and IMPO_cycle > 0.13 → 7.33% of research points
  • MAPO_cycle < 1 and IMPO_cycle ≤ 0.13 → 23.86% of research points
The above division shows several correlations:
  • knock combustion analysis conducted only with MAPO > 1 bar indicates an overestimation of the number of knock combustion cycles by more than 3% (takes into account point 2 of the above breakdown);
  • knock combustion analysis conducted only with consideration of IMPO > 0.13 bar-deg indicates an overestimation of the number of knock combustion cycles by more than 7% (takes into account point 3 of the above breakdown);
  • consideration of simultaneous MAPO and IMPO indicates the possibility of effectively reducing cycles involving knock combustion underestimated by MAPO or IMPO separately.
With IMPO set, a determination of the number of cycles involving knocking combustion based on this index (IMPO > 0.13 bar·deg) was made (Figure 14). The number of cycles in the range of small values of the excess air ratio (λ = 1.25–1.35) is similar to the number based on MAPO. However, the IMPO indicator is much more sensitive, as the number of knock combustion cycles in the range λ = 1.65–2.00 is significantly higher in the main chamber. The common denominator of the MAPO indicator is also the fact that in the primary chamber the number of detected cycles including knock combustion is almost always zero.

4. Conclusions

The knock combustion analysis made it possible to determine the MAPO and IMPO limits. Detailed conclusions on these quantities are presented below:
  • At small values of the excess air ratio λ, significant ignition delay (associated with significant CoC delay) does not lead to the disappearance of knock. This means that the elimination of knock combustion under certain conditions must be associated additionally with an increase in the excess air ratio.
  • When burning hydrogen lean mixtures during knock, it may be advisable to temporarily increase charge depletion than to delay ignition (or CoC). Analyses show (Figure 4) a much higher efficiency of knock reduction by reducing the excess air ratio than by delaying ignition (or CoC).
  • Analysis of IMPO indicates that its highest values (IMPO = 0.8 bar·deg) in the main chamber were obtained at λ = 1.25 and at CoC = 4 deg aTDC. The maximum values of MAPO are more than five times higher than IMPO. The trend of changes in both indices makes IMPO more dependent on CoC than MAPO (which at high values λ does not depend on CoC).
  • The indication of the absolute values of MAPO and IMPO indicators makes it possible to fully analyze knock combustion and at the same time reduce the number of this combustion.

Author Contributions

Conceptualization, I.P., F.S. and K.S.; methodology, I.P., F.S. and K.S.; software, I.P. and F.S.; validation, I.P. and F.S.; formal analysis, I.P., F.S. and K.S.; investigation, I.P., F.S. and K.S.; resources, I.P. and F.S.; data curation, I.P. and F.S.; writing—original draft preparation, I.P. and F.S.; writing—review and editing, I.P., F.S. and K.S.; visualization, I.P. and F.S.; supervision, I.P. and F.S.; project administration, I.P. and F.S.; funding acquisition, I.P. and F.S. All authors have read and agreed to the published version of the manuscript.

Funding

This research was funded by Poznan University of Technology grant number 0415/SIGR/7286.

Data Availability Statement

The data presented in this study are available on request from the corresponding author.

Conflicts of Interest

The authors declare no conflicts of interest.

Abbreviations

BDCbottom dead center
CoCcenter of combustion
EGRexhaust gas recirculation
EMelectromagnetic
ffrequency
IMPOintegral modulus of pressure oscillation
MAPOmaximum amplitude pressure oscillation
MCmain chamber
MPRR maximum pressure rise rate
nengine speed
Ppressure
PCpre-chamber
PFIport fuel injection
PJI pre-chamber jet ignition
PPpeak pressure
STspark timing
ttime
TDCtop dead center
TJIturbulent jet ignition
λair excess ratio

References

  1. Gracz, W.; Marcinkowski, D.; Golimowski, W.; Szwajca, F.; Strzelczyk, M.; Wasilewski, J.; Krzaczek, P. Multifaceted comparison efficiency and emission characteristics of multi-fuel power generator fueled by different fuels and biofuels. Energies 2021, 14, 3388. [Google Scholar] [CrossRef]
  2. Stępień, Z.; Żak, G.; Markowski, J.; Wojtasik, M. Investigation into the impact of the composition of ethanol fuel deposit control additives on their effectiveness. Energies 2021, 14, 604. [Google Scholar] [CrossRef]
  3. Zadrąg, R.; Kniaziewicz, T. Evaluation of the engine technical condition based on criterial analysis of exhaust emission indicators. Transp. Res. Proc. 2019, 40, 940–948. [Google Scholar] [CrossRef]
  4. Kalghatgi, G.; Algunaibet, I.; Morganti, K. On knock intensity and superknock in SI engines. SAE Int. J. Engines 2017, 10, 1051–1063. [Google Scholar] [CrossRef]
  5. Venkatraman, G.; Giribabu, N.; Mohan, P.S.; Muttiah, B.; Govindarajan, V.K.; Alagiri, M.; Rahman, P.S.A.; Karsani, S.A. Environmental impact and human health effects of polycyclic aromatic hydrocarbons and remedial strategies: A detailed review. Chemosphere 2024, 351, 141227. [Google Scholar] [CrossRef] [PubMed]
  6. Li, X.; Zhen, X.; Wang, Y.; Liu, D.; Tian, Z. The knock study of high compression ratio SI engine fueled with methanol in combination with different EGR rates. Fuel 2019, 257, 116098. [Google Scholar] [CrossRef]
  7. Wei, H.; Feng, D.; Pan, J.; Shao, A.; Pan, M. Knock characteristics of SI engine fueled with n-butanol in combination with different EGR rate. Energy 2017, 118, 190–196. [Google Scholar] [CrossRef]
  8. Liu, F.; Zhou, L.; Hua, J.; Liu, C.; Wei, H. Effects of pre-chamber jet ignition on knock and combustion characteristics in a spark ignition engine fueled with kerosene. Fuel 2021, 293, 120278. [Google Scholar] [CrossRef]
  9. Toulson, E.; Schock, H.; Attard, W. A review of pre-chamber initiated jet ignition combustion systems. In SAE Technical; SAE International: Warrendale, PA, USA, 2010. [Google Scholar] [CrossRef]
  10. Palakunnummal, M.; Sahu, P.; Ellis, M.; Nazha, M. A cylinder pressure-based knock detection method for pre-chamber ignition gasoline engine. SAE Int. J. Engines 2021, 14, 405–417. [Google Scholar] [CrossRef]
  11. Corrigan, D.J.; Di Blasio, G.; Ianniello, R.; Silvestri, N.; Breda, S.; Fontanesi, S.; Beatrice, C. Engine knock detection methods for spark ignition and prechamber combustion systems in a high-performance gasoline direct injection engine. SAE Int. J. Engines 2022, 15, 883–897. [Google Scholar] [CrossRef]
  12. Lee, D.; Yu, X.; Baur, A.; Qiao, L. Visualization and statistical analysis of passive pre-chamber knock in a constant-volume optical engine. SAE Int. J. Engines 2024, 17, 1–18. [Google Scholar] [CrossRef]
  13. Horner, T. Knock detection using spectral analysis techniques on a Texas Instruments TMS320 DSP. In SAE Technical; SAE International: Warrendale, PA, USA, 1996. [Google Scholar] [CrossRef]
  14. Cavina, N.; Corti, E.; Minelli, G.; Moro, D.; Solieri, L. Knock indexes normalization methodologies. In SAE Technical; SAE International: Warrendale, PA, USA, 2006. [Google Scholar] [CrossRef]
  15. Ponte, S.; Andrade, J.M.; Vazquez, C.; Ferreiro, B.; Cobas, C.; Perez, A.; Rey, M.; Vales, C.; Pellitero, J.; Santacruz, B.; et al. Modeling the natural gas knocking behaviour using gas-phase infrared spectra and multivariate calibration. J. Nat. Gas Sci. Eng. 2021, 90, 103944. [Google Scholar] [CrossRef]
  16. Brecq, G.; Bellettre, J.; Tazerout, M. A new indicator for knock detection in gas SI engines. Int. J. Therm. Sci. 2003, 42, 523–532. [Google Scholar] [CrossRef]
  17. Hudson, C.; Gao, X.; Stone, R. Knock measurement for fuel evaluation in spark ignition engines. Fuel 2001, 80, 395–407. [Google Scholar] [CrossRef]
  18. Xiaofeng, G.; Stone, R.; Hudson, C.; Bradbury, I. The detection and quantification of knock in spark ignition engines. In SAE Technical; SAE International: Warrendale, PA, USA, 1993. [Google Scholar] [CrossRef]
  19. Chun, K.M.; Heywood, J.B. Characterization of knock in a spark-ignition engine. In SAE Technical; SAE International: Warrendale, PA, USA, 1989. [Google Scholar] [CrossRef]
  20. Benson, G.; Fletcher, E.A.; Murphy, T.E.; Scherrer, H.C. Knock (detonation) control by engine combustion chamber shape. In SAE Technical; SAE International: Warrendale, PA, USA, 1983. [Google Scholar] [CrossRef]
  21. Leppard, W.R. Individual-cylinder knock occurrence and intensity in multicylinder engines. In SAE Technical; SAE International: Warrendale, PA, USA, 1982. [Google Scholar] [CrossRef]
  22. Pan, M.; Wei, H.; Feng, D. Effects of exhaust gas recirculation on knock intensity of a downsized gasoline spark ignition engine. J. Energy Res Technol. 2019, 141, 011101. [Google Scholar] [CrossRef]
  23. Zhou, L.; Kang, R.; Wie, H.; Feng, D.; Hua, J.; Pan, J.; Chen, R. Experimental analysis of superknock occurrence based on a spark ignition engine with high compression ratio. Energy 2018, 165, 68–75. [Google Scholar] [CrossRef]
  24. Thomas, J.R.; Clarke, D.P.; Collins, J.M.; Sakonji, T.; Ikeda, K.; Shoji, F.; Furushima, K. A test to evaluate the influences of natural gas composition and knock intensity. Trans. ASME J. ICE 1994, 22. [Google Scholar]
  25. Szwaja, S.; Naber, J.D. Dual nature of hydrogen combustion knock. Int. J. Hydrogen Energy 2013, 38, 12489–12496. [Google Scholar] [CrossRef]
  26. Wang, K.; Zhang, Z.; Sun, B.; Zhang, S.; Lai, F.; Ma, N.; Ju, X.; Luo, Q.; Bao, L.-Z. Experimental investigation of the working boundary limited by abnormal combustion and the combustion characteristics of a turbocharged direct injection hydrogen engine. Energy Convers. Manag. 2024, 299, 117861. [Google Scholar] [CrossRef]
  27. Sun, J.; Zhang, X.; Tang, Q.; Wang, Y.; Li, Y. Knock recognition of knock sensor signal based on wavelet transform and variational mode decomposition algorithm. Energy Convers. Manag. 2023, 287, 117062. [Google Scholar] [CrossRef]
  28. Aramburu, A.; Guido, C.; Bares, P.; Pla, B.; Napolitano, P.; Beatrice, C. Knock detection in spark ignited heavy duty engines: An application of machine learning techniques with various knock sensor locations. Measurement 2024, 224, 113860. [Google Scholar] [CrossRef]
  29. Pla, B.; Bares, P.; Jimenez, I.; Guardiola, C. Increasing knock detection sensitivity by combining knock sensor signal with a control oriented combustion model. Mech. Syst. Signal Process. 2022, 168, 108665. [Google Scholar] [CrossRef]
  30. Güdden, A.; Pischinger, S.; Geiger, J.; Heuser, B.; Müther, M. An experimental study on methanol as a fuel in large bore high speed engine applications—Port fuel injected spark ignited combustion. Fuel 2021, 303, 121292. [Google Scholar] [CrossRef]
  31. Puzinauskas, P.V. Examination of methods used to characterize engine knock. In SAE Technical; SAE International: Warrendale, PA, USA, 1992. [Google Scholar] [CrossRef]
  32. Shi, H.; Tang, Q.; Uddeen, K.; Magnotti, G.; Turner, J. Optical diagnostics and multi-point pressure sensing on the knocking combustion with multiple spark ignition. Combust. Flame 2022, 236, 111802. [Google Scholar] [CrossRef]
  33. Nazir, H.; Muthuswamy, N.; Louis, C.; Jose, S.; Prakash, J.; Buan, M.E.M.; Flox, C.; Chavan, S.; Shi, X.; Kauranen, P.; et al. Is the H2 economy realizable in the foreseeable future? Part III: H2 usage technologies, applications, and challenges and opportunities. Int. J. Hydrogen Energy 2020, 45, 28217–28239. [Google Scholar] [CrossRef]
  34. Gurz, M.; Baltacioglu, E.; Hames, Y.; Kaya, K. The meeting of hydrogen and automotive: A review. Int. J. Hydrogen Energy 2017, 42, 23334–23346. [Google Scholar] [CrossRef]
  35. Yip, H.L.; Srna, A.; Yuen, A.C.Y.; Kook, S.; Taylor, R.A.; Yeoh, G.H.; Medwell, P.R.; Chan, Q.N. A review of hydrogen direct injection for internal combustion engines: Towards carbon-free combustion. Appl. Sci. 2019, 9, 4842. [Google Scholar] [CrossRef]
  36. Bao, L.; Sun, B.; Luo, Q. Experimental investigation of the achieving methods and the working characteristics of a near-zero NOx emission turbocharged direct-injection hydrogen engine. Fuel 2022, 319, 123746. [Google Scholar] [CrossRef]
  37. Barış, O.; Güler, İ.; Yaşgül, A. The effect of different charging concepts on hydrogen fuelled internal combustion engines. Fuel 2023, 343, 127983. [Google Scholar] [CrossRef]
  38. Molina, S.; Novella, R.; Gomez-Soriano, J.; Olcina-Girona, M. Impact of medium-pressure direct injection in a spark-ignition engine fueled by hydrogen. Fuel 2024, 360, 30618. [Google Scholar] [CrossRef]
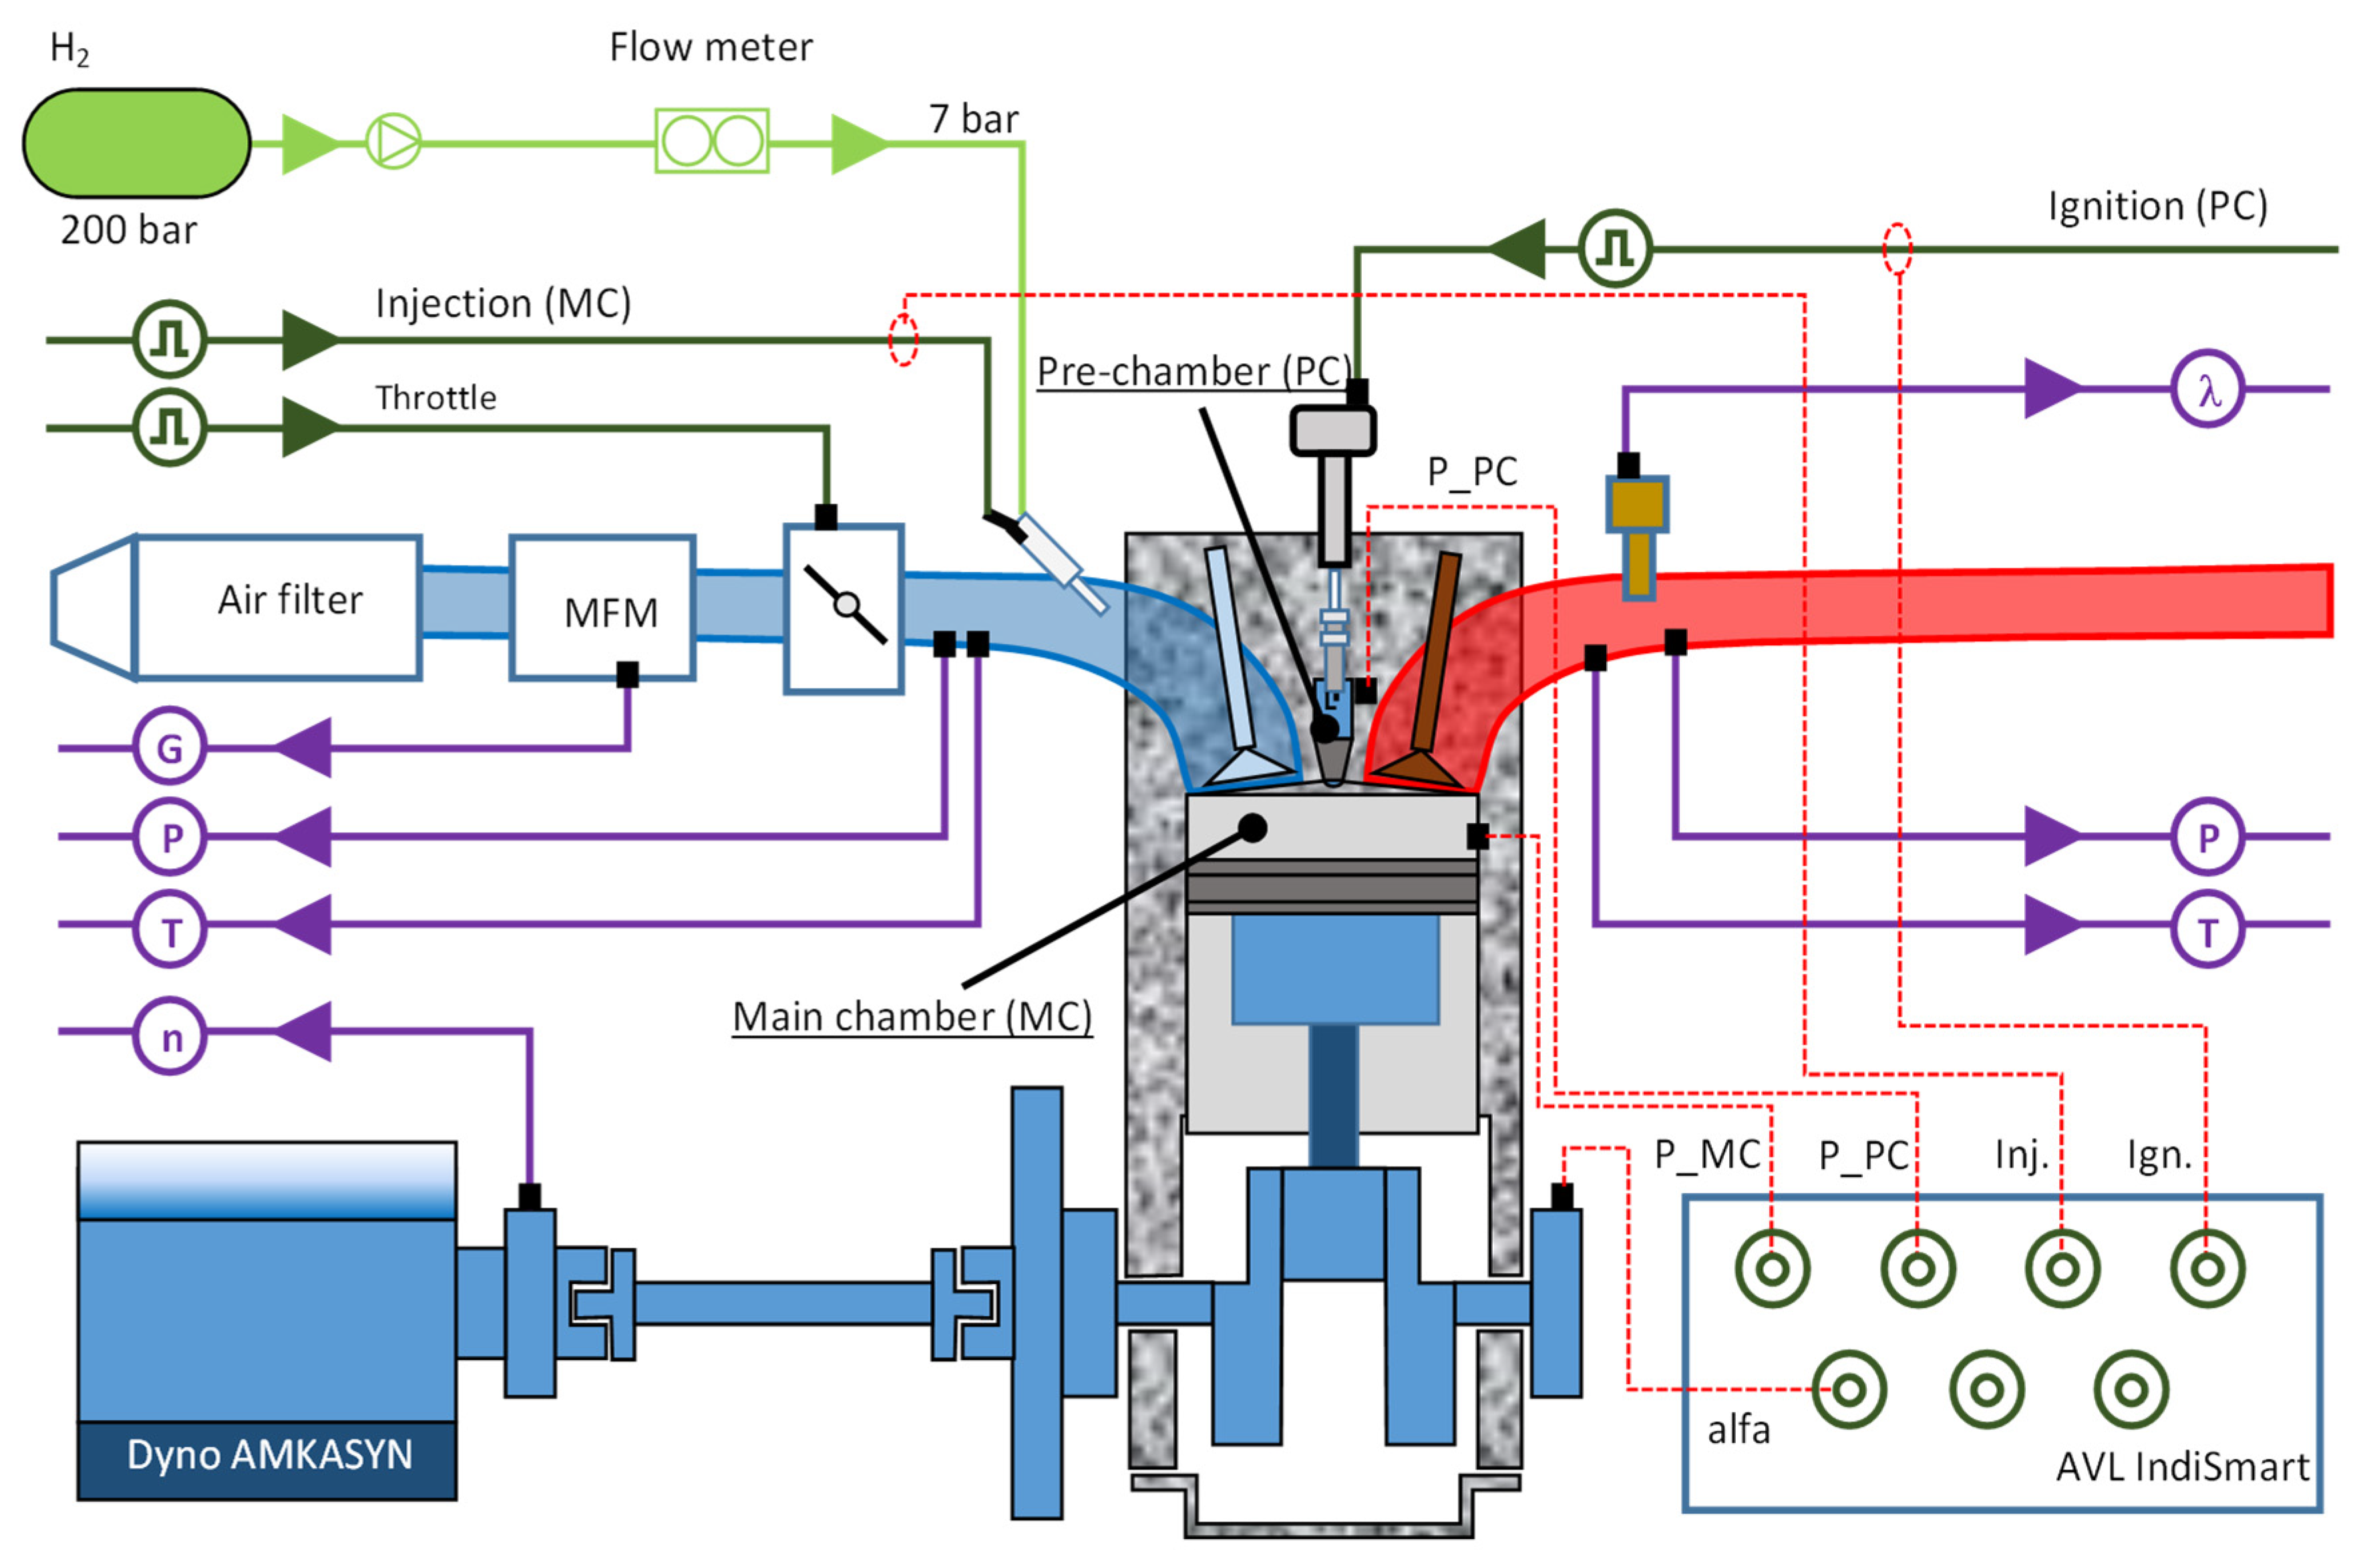
Figure 1. Schematic of the measurement system analysis for the two-stage combustion system with the AVL 5804 engine and the apparatus for engine indication (green color: gas flow; dark green: electric control signal; red: signal to acquisition; violet: output signal).
Energies 17 00937 g001
Figure 2. Example of combustion pressure waveform: (a) in both preliminary and main chambers; (b) in the main chamber at different combustion center values (n = 1500 rpm; λ = 1.25).
Energies 17 00937 g002
Figure 3. Determination of MAPO for a single-combustion cycle: (a) determination of absolute pressure values (PP) for a single-combustion cycle at different CoC values; (b) results of determination of the maximum for each cycle (MAPO_cycle) at different CoC (value of excess air factor λ = 1.25).
Energies 17 00937 g003
Figure 4. Maximum absolute values of combustion pressure in the main chamber (MAPO_MCcycle) for different values of CoC and different values of excess air ratio (color consistent with CoC from Figure 3b).
Energies 17 00937 g004
Figure 5. Maximum absolute values of combustion pressure in the pre-chamber (MAPO_PCcycle) for different values of CoC and different values of excess air ratio (color consistent with CoC from Figure 3b).
Energies 17 00937 g005
Figure 6. IMPO_MCcycle values for different CoC values and different excess air ratio values (color consistent with CoC from Figure 3b).
Energies 17 00937 g006
Figure 7. IMPO_PCcycle values for different CoC values and different excess air ratio values (color consistent with CoC from Figure 3b).
Energies 17 00937 g007
Figure 8. Analysis of indicators in terms of two combustion chambers: (a) MAPO_MC vs. MAPO_PC; (b) IMPO_MC vs IMPO_PC (solid line: main chamber; dashed line: pre-chamber).
Energies 17 00937 g008
Figure 9. MAPO and IMPO for different combustion chambers: (a) for the main chamber; (b) for the pre-chamber (solid line: main chamber; dashed line: pre-chamber).
Energies 17 00937 g009
Figure 10. MAPO and IMPO analysis: (a) MAPO vs. IMPO in main chamber and (b) MAPO vs. IMPO in pre-chamber.
Energies 17 00937 g010
Figure 11. Count rates of knock combustion after adopting MAPO limits (solid line: main chamber; dashed line: pre-chamber).
Energies 17 00937 g011
Figure 12. Results of tapping combustion cycle count analysis: (a) MAPO; (b) IMPO with IMPO result > 0.13 bar deg; (c) results of minimizing the function defined by Equation (3).
Energies 17 00937 g012
Figure 13. Relative analysis of MAPO vs. IMPO with determination of tapping limits for each indicator (open markers refer to pre-chamber).
Energies 17 00937 g013
Figure 14. Count rates of knock combustion after adoption of IMPO limit (solid line: main chamber; dashed line: pre-chamber).
Energies 17 00937 g014
Table 1. Technical data of the single-cylinder test engine used.
ParameterUnitValue
Engine1-cyl., 4-valve, SI, TJI
Fuel typehydrogen
Fuel pressurebar7 bar
Displacementdm30.5107
Bore × strokemm85 × 90
Compression ratio15.5
FuelingPFI (EM injectors);
passive pre-chamber
Air systemnaturally-aspirated
DynoAMKASYN
AVL AMK DW13-170
Table 2. Technical data of the test equipment and sensors used.
ParameterNameValue
Indicating systemAVL IndiSmart8-canal, 0.5 deg CA;
crank angle AVL 365C
Pressure sensor (MC)AVL GH14D0–25 MPa
Pressure sensor (PC)Kistler M3.5 6081 AQ220–25 MPa
Air flow meterABB SensyFlow0–720 kg/h; error < ±0.8%
Injection controlMechatronika0–20 ms; ±0.1 ms
Methane, hydrogen flowmeterMicro Motion ELITE CMFS010M Coriolis Meter0.1–2 kg/h; accuracy ±0.25%
Lambda probeBosch LSU 4.90.7 to 12.5
ThrottleBosch ETB 32 mm±1 deg
Disclaimer/Publisher’s Note: The statements, opinions and data contained in all publications are solely those of the individual author(s) and contributor(s) and not of MDPI and/or the editor(s). MDPI and/or the editor(s) disclaim responsibility for any injury to people or property resulting from any ideas, methods, instructions or products referred to in the content.