Abstract
High-energy ball milling was applied to produce nanocrystalline MgH2-FeTi powder composites. In order to achieve a remarkable synergetic effect between the two materials, the amount of the FeTi catalyst was chosen to be 40 wt.%, 50 wt.% and 60 wt.%. The morphology and microstructure of the as-milled powders were characterized by scanning electron microscopy and X-ray diffraction, respectively. The evaluation of the diffraction profiles by the Convolutional Multiple Whole Profile fitting algorithm provided a detailed microstructural characterization of the coherently scattering α-MgH2 crystallites. Differential scanning calorimetry experiments revealed two overlapping endotherms corresponding to the dehydrogenation of metastable γ-MgH2 and stable α-MgH2 hydrides. Isothermal hydrogen-sorption experiments were carried out in a Sieverts-type apparatus. It was established that the MgH2-40 wt.% FeTi powder is capable of absorbing 5.8 wt.% hydrogen, while extraordinary absorption kinetics were observed for the MgH2-50 wt.% FeTi alloy, i.e., 3.3 wt.% H2 is absorbed after 100 s.
1. Introduction
Renewable energy sources can serve as potential alternatives to traditional fossil-based fuels; nevertheless, the majority of current energy sources are still non-renewable, resulting in severe environmental damage through exhaustive CO2 emission [1]. The integration of novel clean energy sources into the existing energy supply system is still restricted due to their dependence on weather conditions, in particular for solar and wind energy [2]. Intensive research considers that in the 21st century, hydrogen, as a secondary energy carrier, can be a potential solution for these problems with its merits of abundance, extremely high energy density per mass (120–140 MJ/kg), environmental friendliness and harmless reactions when applied in fuel cells [3]. Trains and trams are principally suitable for incorporating hydrogen fuel cells, since there is no need to build up an extensive refueling infrastructure [4,5]. Nonetheless, a hydrogen-storage system has to meet different needs in order to be effectively applied in regular use [6]; for example, it should possess high gravimetric and volumetric hydrogen density, satisfactory absorption and desorption rates at reasonable temperatures and pressure ranges and a reliable operational cycle life [7]. In the last decades, several solutions have been developed to store hydrogen, including traditional technologies, i.e., high-pressure tanks and storage in the liquid state [8]. Although special composite high-pressure containers can operate up to 70 MPa hydrogen pressure [9] and are already being utilized in different vehicular systems [5], the size and geometry of these vessels still imply a limitation for widespread commercial applications. Liquid-state hydrogen storage can mitigate this issue; however, a considerable amount of energy is required to cool hydrogen to 21 K, and the unavoidable boil-off of H2 at this temperature makes this technology non-effective in most cases [3]. Lately, extensive research has been aiming to realize effective hydrogen storage in the solid state with sufficient hydrogen density [10,11,12]. Among the vast group of different materials, metal hydrides have significant potential for hydrogen storage as they possess a relatively large hydrogen-storage capacity and notable reversibility [11,13,14].
Magnesium and its hydride are among the most investigated systems because of their excellent absorption capacity (7.6 wt.%, or 2600 Wh/kg), low mass density, low cost, high abundance on Earth and non-toxicity [15,16,17,18,19,20,21]. However, the practical application of commercial magnesium is limited due to its poor thermodynamics, sluggish kinetics and high hydrogenation enthalpy [22]. In order to overcome these bottlenecks, different nanostructuring techniques have been utilized recently to improve the kinetics performance and temperature of the hydrogen sorption of magnesium-based systems [18,20,23,24]. Nanostructured materials processed by top-down techniques usually possess a large specific surface area with an average crystallite size in the order of 10–100 nm [25]. The increased amount of grain boundaries per unit volume can promote hydrogen diffusion into the interior of the Mg nanocrystals [26,27,28]. One of the most frequently used methods to prepare nanostructured hydrogen-storage materials is high-energy ball milling (HEBM) [29] based on severe plastic deformation (SPD), which can drastically improve sorption kinetics due to the increased volume fraction of grain boundaries. Besides grain boundaries, the large density of lattice defects created by HEBM can further enhance hydrogen sorption due to the enhanced diffusion length of hydrogen [30,31,32]. In addition, the dehydrogenation kinetics, H-sorption temperature and cyclic life of MgH2 can further be improved by different catalyst additives [33,34], including transition metals, e.g., Ni [35,36,37], Fe [38,39,40] or Ti [41,42], transition metal oxides [43,44,45,46] and carbon-based materials [45,47]. The catalytic effect of these additives results in the considerable reduction in hydride-formation enthalpy via an easier hydrogen-molecule dissociation at the surface [18].
Fe-Ti compounds or solid solutions have gained noticeable attention as nanocrystalline Mg–FeTi composites are reported to have an outstanding hydrogenation performance [48,49,50,51,52,53,54,55]. For example, the kinetics of the MgH2-35 wt.% FeTi1.2 composite at elevated temperatures is appropriately fast, and their longer ball-milling time promotes an increase in the H-sorption rate [49]. The temperature for the onset of desorption could be reduced to 175 °C after adding 15 wt.% FeTi to MgH2 [50]. The activation of the milled Mg–FeTi powder can be achieved by additional milling under hydrogen. The hydrogen absorption capacity of the activated powders decreased with increasing FeTi content [51]. When activated Fe2Ti intermetallic powder was mixed with MgH2 and subjected to HEBM, it was found that at the lowest temperature, coupled with a 6.9 wt.% H-storage capacity, there exists an optimal milling time (3 h) for desorption to occur [52]. Reasonable room temperature kinetics could be achieved in the Mg–TiFe0.92Mn0.08 system if the transition metal additives reached at least 50 wt.%. At the same time, hydrogenation rate was rapid for different amounts of catalyst additive (20, 35 and 50 wt.%) at elevated temperatures of up to 350 °C [53]. High-FeTi-containing MgH2 (FeTi content: 40 wt.%, 50 wt.% and 60 wt.%) exhibits detectable hydrogen-storage capacity and kinetics even at room temperature; for example, the MgH2-40 wt.% FeTi alloy milled for 36 h is capable of absorbing 3 wt.% of H2 in 1 h [54]. The effect of the milling conditions on the hydrogen sorption properties of the same composite was investigated in detail [55]. This showed that better dispersion and nanocrystallization of the FeTi catalyst can be achieved when a protective media (such as wet milling) is applied, which can significantly increase the hydrogen capacity of this composite [55].
Several investigations have pointed out that the Fe-Ti system is capable of absorbing and desorbing hydrogen [56,57]; however, the Fe-Ti alloys must be activated at relatively high temperatures (400–450 °C) [56]. Nevertheless, the activation of hydrogenation of Fe-Ti is positively influenced when the alloy is subjected to SPD by different processing routes, such as HEBM, high-pressure torsion and groove or cold rolling via the formation of cracks and subgrain boundaries [58,59,60,61].
Upscaling hydrogen-storing materials to industrial quantities is still a technological challenge; however, several solutions have already been realized to date. An industrial-scale hydrogen reservoir of 72 m2 loaded with 400 kg of Fe-Ti alloy was constructed and tested for H2 sorption [62]. It was pointed out in another research study that industrial vessels filled with several hundred kg of FeTi- or Mg-based alloys can operate in the temperature range of 100–400 °C with a hydrogen capacity of 2–15 kg [63]. Operational upscaling of MgH2-based composite production was implemented recently at McPhy Energy [64]. As a main step of production, powders were processed in an industrial ball mill with a yield of 20 kg per batch, equivalent to an annual amount of 27 tons.
As a continuation of the work described in [52], an increased amount of activated Fe-Ti powder (40 wt.%, 50 wt.% and 60 wt.%) was ball-milled with MgH2 in the present study in order to induce a synergetic effect between the catalyst and the hydride on their overall hydrogenation kinetics. The work also demonstrates in detail the effect of the catalyst amount on the microstructure, morphology and hydrogenation/dehydrogenation performance of MgH2.
2. Materials and Methods
2.1. Sample Preparation
As the first step of a two-stage synthesis route, nanocrystalline FeTi powders were synthesized and activated by high-energy ball milling of elemental Fe and Ti powders (purity 99.9%) in a 1:1 stoichiometric ratio in a stainless steel vial (volume: 65 mL) containing 10 stainless steel balls (1/4 in.) using a SPEX 8000M Mixer Mill, SPEX, Metuchen, NJ, USA; operating at 1425 RPM. Based on our previous studies, the pre-milling time was chosen as 10 h to achieve good homogeneity of the catalyst powders [52,65]. As a second step, the FeTi catalyst (at 40 wt.%, 50. wt.% and 60 wt.%) was further co-milled with MgH2 powder (90 wt.% MgH2, remainder Mg; Sigma-Aldrich, St. Louis, MO, USA; CAS number: 7693-27-8) for 3 h to obtain 1 g of MgH2-FeTi composite mixtures, applying a ball-to-powder mass ratio of 10:1. Hereafter, these composite blends will be denoted as MgH2-40 wt.% FeTi, MgH2-50 wt.% FeTi and MgH2-60 wt.% FeTi, respectively. The entire powder synthesis was carried out under Ar atmosphere. The milling procedure was interrupted after each hour and the vial was rotated by 90 deg along its symmetrical axis in order to minimize powder sticking onto the inner surfaces of the vial.
2.2. Microstructural Characterization
2.2.1. Scanning Electron Microscopy
Morphology studies of the HEBM MgH2-FeTi powders were carried out on an FEI QUANTA 3D dual-beam scanning electron microscope (SEM) using back-scattered electron (BSE) and secondary electron (SE) regimes. Quantitative compositional variations have been investigated by energy-dispersive X-ray spectroscopy (EDS) analysis with a relative accuracy of 1%.
2.2.2. X-ray Diffraction
The microstructure of the MgH2-FeTi powder composites was investigated by X-ray powder diffraction (XRD). All measurements were carried out on a Rigaku SmartLab diffractometer in a Bragg–Brentano geometry using Cu-Kα radiation. The data were collected in the range 2θ = 20°–75° with a step size of Δ(2θ) = 0.01°. For detailed microstructural analysis, the recorded XRD patterns were evaluated by the Convolutional Multiple Whole Profile (CMWP) fitting analysis [66]. In this method, the whole measured diffraction pattern is directly fit using the sum of theoretically constructed profile functions, background and measured instrumental profiles [67]. These profile functions are generated for each diffraction peak of each crystalline phase as the inverse Fourier transform of the product of the size and strain Fourier coefficients. In this model, it is assumed that the individual coherent-scattering domains, i.e., the crystallites, follow a lognormal size distribution:
where σ and m are the variance and median of the lognormal size distribution, respectively. With the available data of σ and m, the area average size can be given as
At the same time, the size of the volume averages can also be determined:
Details of the model can be found elsewhere [66,67], and its application to different hydrogen-storage materials has been widely described [28,30,37,52,65,68].
2.3. Thermal Characterization
Linear-heating scans were performed on a power-compensated Perkin Elmer Differential Scanning Calorimeter (DSC) at a heating rate of 40 Kmin−1. Measurements were carried out under high-purity Ar flux. The MgH2-FeTi powders were placed in Al sample holders. Temperature and enthalpy were calibrated by the melting of pure In and Al.
2.4. Hydrogen-Storage Experiments
The hydrogen-storage performance of the HEBM MgH2-FeTi powders was investigated by a home-made Sieverts-type apparatus. Isothermal absorption and desorption kinetic measurements were performed at 573 K, with an initial hydrogen pressure of 1 MPa and 10 kPa, respectively. The actual measurements were carried out after a full hydrogenation–dehydrogenation activation cycle. For each experiment, ~100 mg of powder was applied.
3. Results and Discussion
Characterization of the As-Milled Powders
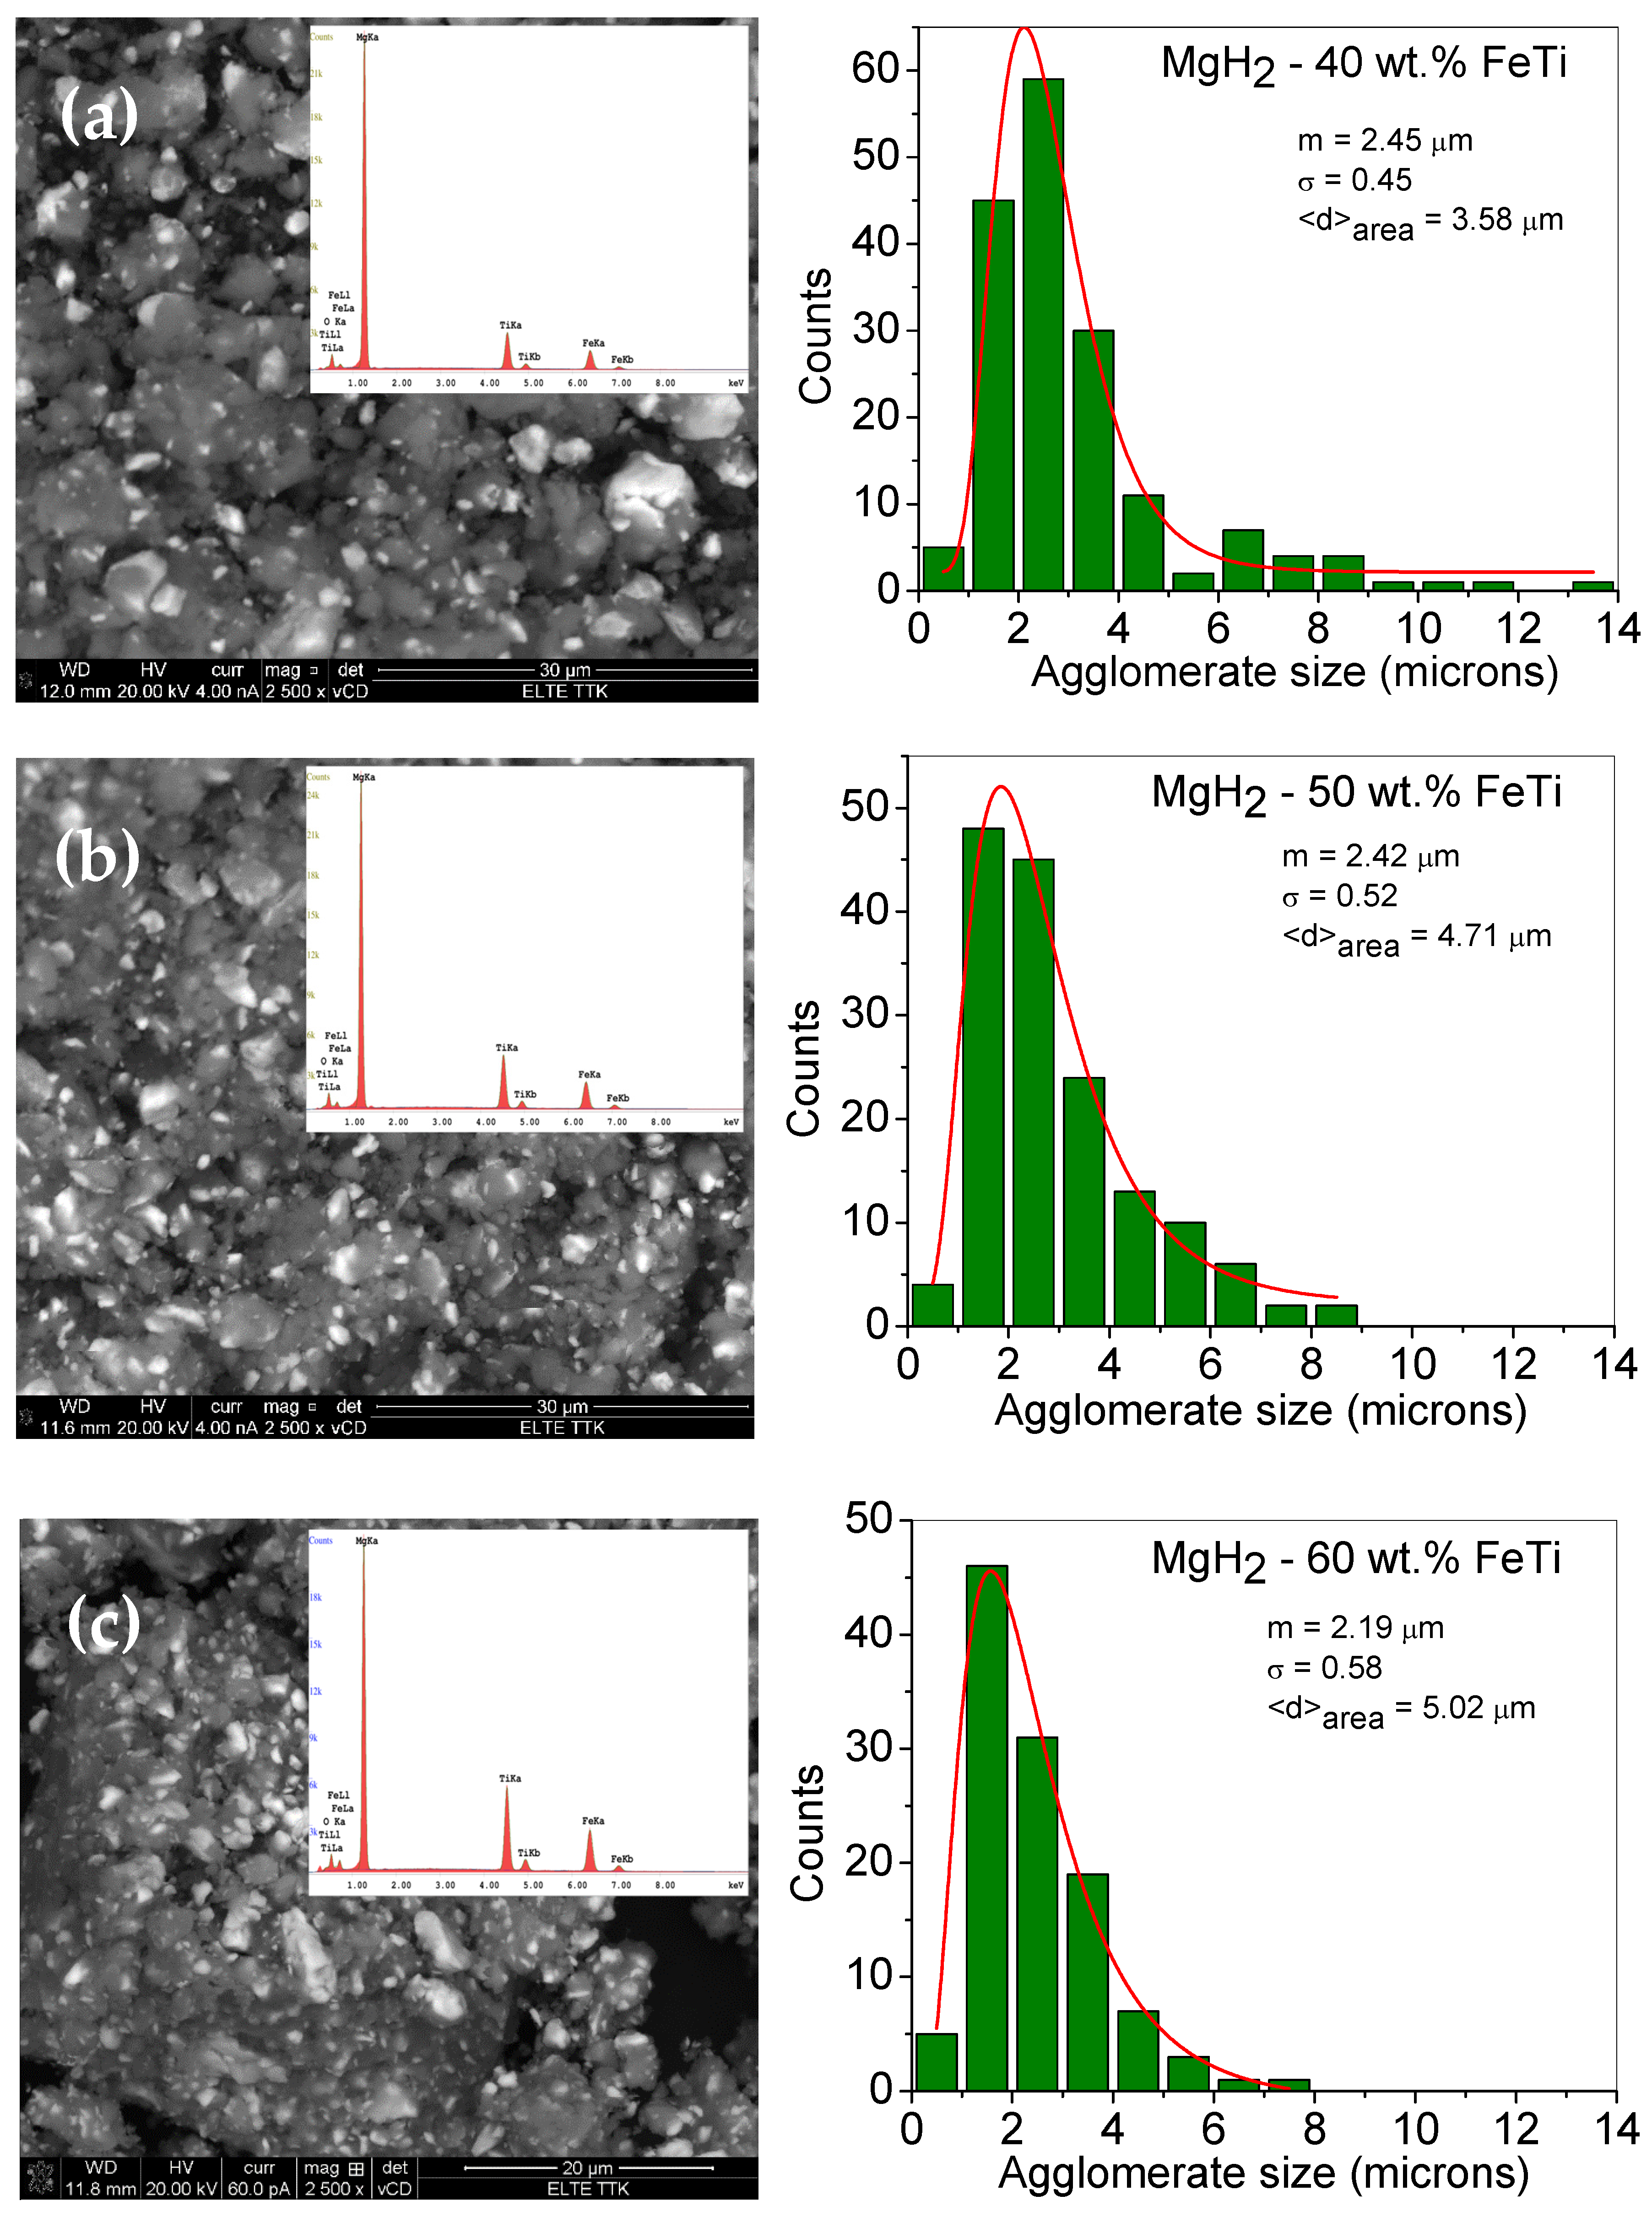
As one can observe from the low-magnification BSE images, the as-milled MgH2-FeTi composites are dominated by powder agglomerates and some debris (Figure 1). The individual powder particles are usually surrounded by flat surfaces, which were formed by powder-to-ball and powder-to-vial collisions during the milling process, when the relatively soft hydride particles were pressed onto the internal walls of the stainless steel vial. In addition, some of these particles are also characterized by sharp edges and cracks, which are the consequences of SPD occurring during the HEBM. The brighter areas observed for all powder composites correspond to the FeTi particles that are evenly and homogeneously distributed after milling for 3 h with MgH2. As evident from the images, the catalyst agglomerates are considerably smaller than the MgH2 ones. During the intensive plastic deformation, the relatively hard FeTi particles of higher mass density were embedded in the soft hydride agglomerates, which led to the formation of the observed matrix (MgH2)-reinforcement particle (FeTi) composite structure.

Figure 1.
Low-magnification SEM images of the ball-milled (a) M gH2-40 wt.% FeTi (b) MgH2-50 wt.% FeTi and (c) MgH2-60 wt.% FeTi composite powders. The insets show the corresponding EDS spectra. The right-hand side images present the particle size histograms with a fitted lognormal-distribution function.
Quantitative analysis of the MgH2 agglomerate sizes was obtained from the SEM BSE images by measuring the individual length through their geometrical center in the same direction for all particles. Presented in Figure 1, the obtained particle size histograms can satisfactorily be fitted by a lognormal-distribution function that has a maximum of around 2 microns for all the composites. This value is in agreement with other Mg/MgH2 powders milled with metal or metal oxide catalysts [32,52]. Similar values have been obtained for other MgH2-FeTi composites processed in the planetary mill for up to 36 h of milling time [54].
The fitted lognormal particle-size-distribution functions can provide the median (mSEM) and variance (σSEM) as well as the area-averaged particle size (⟨d⟩area). As observed on the histograms, the ⟨d⟩area values slightly increase with increasing FeTi content, ranging from 3.58 μm to 5.02 μm for the MgH2-40 wt.% FeTi and MgH2-60 wt.% FeTi powders, respectively.
In our opinion, this dependency on the FeTi content may be explained by the increased amount of mechanical contact between the pre-milled FeTi particles and MgH2 aggregates during the co-milling step. For the MgH2-40 wt.% FeTi sample, the MgH2 agglomerates were predominantly formed around the individual FeTi particles (Figure 1a); however, in the MgH2-60 wt.% FeTi composite, the MgH2 particles tended to aggregate around the FeTi ones (Figure 1c). This behavior is also supported by the variation in the MgH2-particle size distribution. Namely, the smallest value (σSEM = 0.45) for the MgH2-40 wt.% FeTi composite corresponds to a relatively sharper and more homogeneous distribution, while the value of σSEM = 0.58 for MgH2-60 wt.% FeTi describes a wider distribution.
The corresponding EDS spectra, shown as insets in Figure 1, provide quantitative information on the composition of the different composites. The obtained values for Mg, Ti and Fe are listed in Table 1. As one can observe, the Fe:Ti concentration ratio is in perfect agreement with the 1:1 nominal value; nevertheless, the overall FeTi catalyst concentration is lower than the nominal value for all the composites (31.9 at.% for MgH2-40 wt.% FeTi, 38.5 at.% for MgH2-50 wt.% FeTi and 46.7 at.% for MgH2-60 wt.% FeTi). Similar features have been obtained for MgH2 mixed with significantly lower FeTi content [52]. The discrepancy between the nominal and experimental values is related to the considerably different mechanical properties of the MgH2 and FeTi powders, i.e., the FeTi particles can stick and/or adhere more easily to the internal walls and edges of the milling vial.

Table 1.
Elemental content of the MgH2-FeTi composites obtained from the EDS analysis.
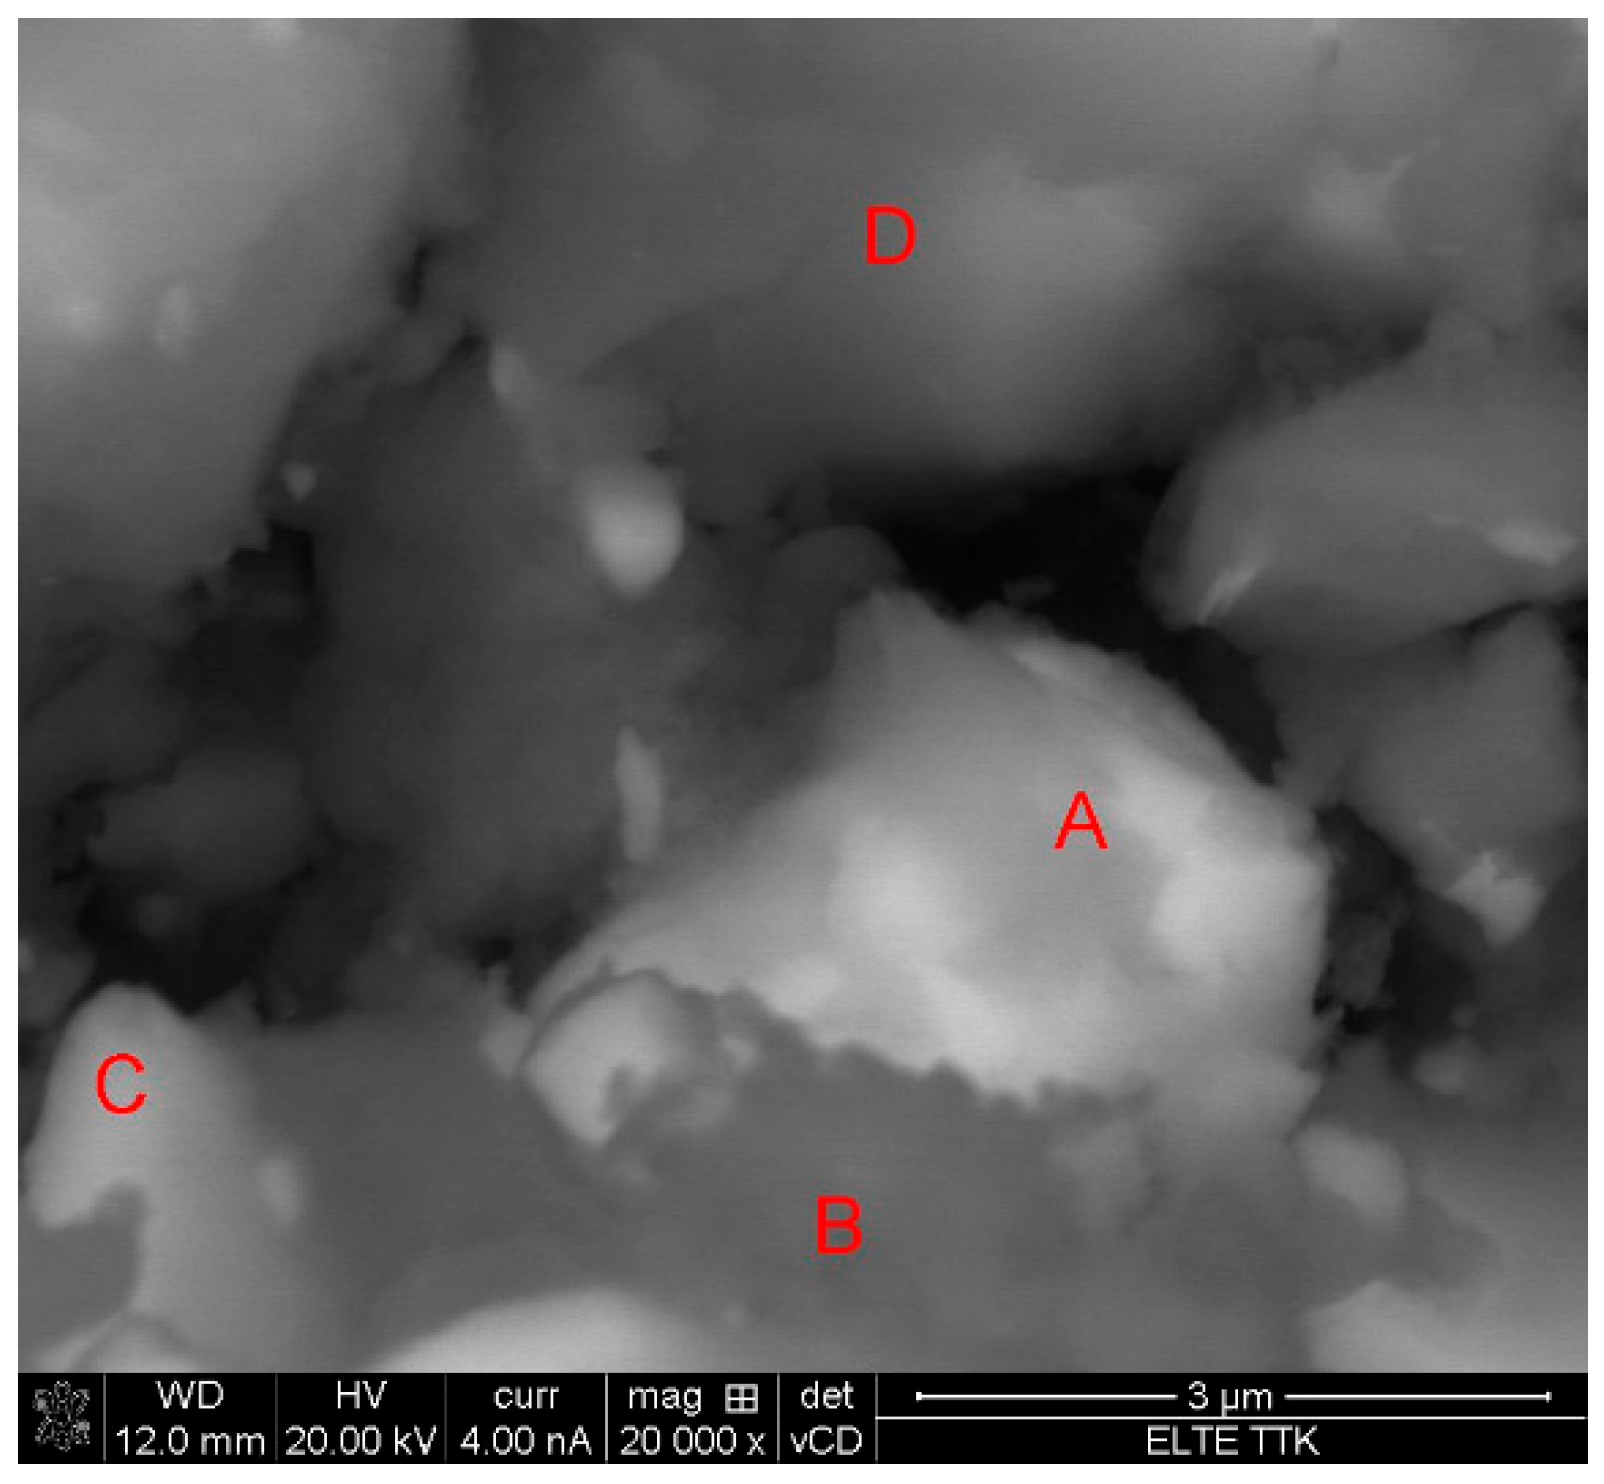
A high-resolution image of the MgH2-40 wt.% FeTi sample captured around an FeTi particle (denoted by A) reveals that MgH2 agglomerates and plates or layers with different thicknesses adhere to the surface of the catalyst (Figure 2).
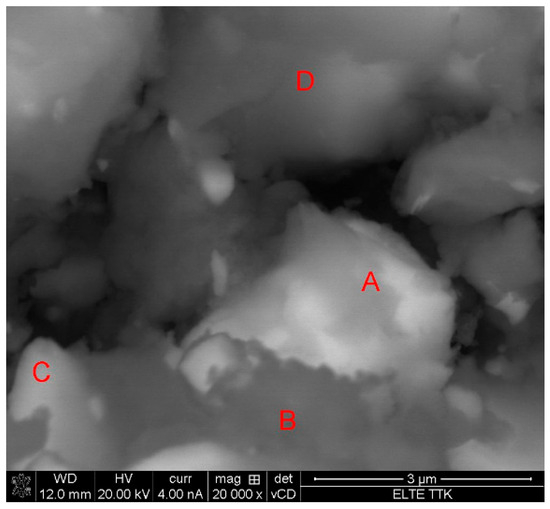
Figure 2.
High-resolution SEM image of an FeTi particle in the MgH2-40 wt.% FeTi sample.
Supplementary point-like EDS analysis revealed significant compositional differences between the brighter and darker spots. As listed in Table 2, heavier Fe and Ti elements mostly dominate the brighter areas (particle A), while the darkest region (denoted by B) is enriched in Mg, corresponding to a MgH2 agglomerate or layer surrounding the catalyst particle. Regions C and D exhibit intermediate concentrations, presumably due to the overlapping of FeTi and MgH2 particles within the range of the electron penetration depth.
Table 2.
Compositional variation in the vicinity of an FeTi particle for the MgH2-40 wt.% FeTi composite. A, B, C and D denote different particles or regions in Figure 2.
The XRD patterns of the milled MgH2-FeTi powder composites are presented in Figure 3. As one can observe from the diffractograms, each powder exhibits the reflections of tetragonal α-MgH2; however, the high-pressure metastable γ-MgH2 phase is also present as a minor component. All peaks are broader, which is indicative of extensive crystallite size reduction [32]. It is also noted that peak intensities significantly decrease in height with increasing FeTi content, and, at the same time, no Bragg peaks of any Fe-Ti phase are visible, which could correspond to a solid state amorphization of the catalyst, as can be confirmed by the broad halo developed at around 2θ = 42 deg [69]. In addition, a reflection centered at 2θ = 44 deg is present for all the powders, corresponding to the formation of some MgO.
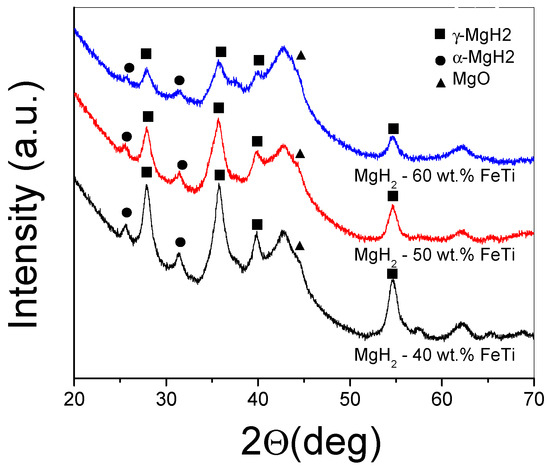
Figure 3.
XRD patterns of the ball-milled MgH2-FeTi composite powders.
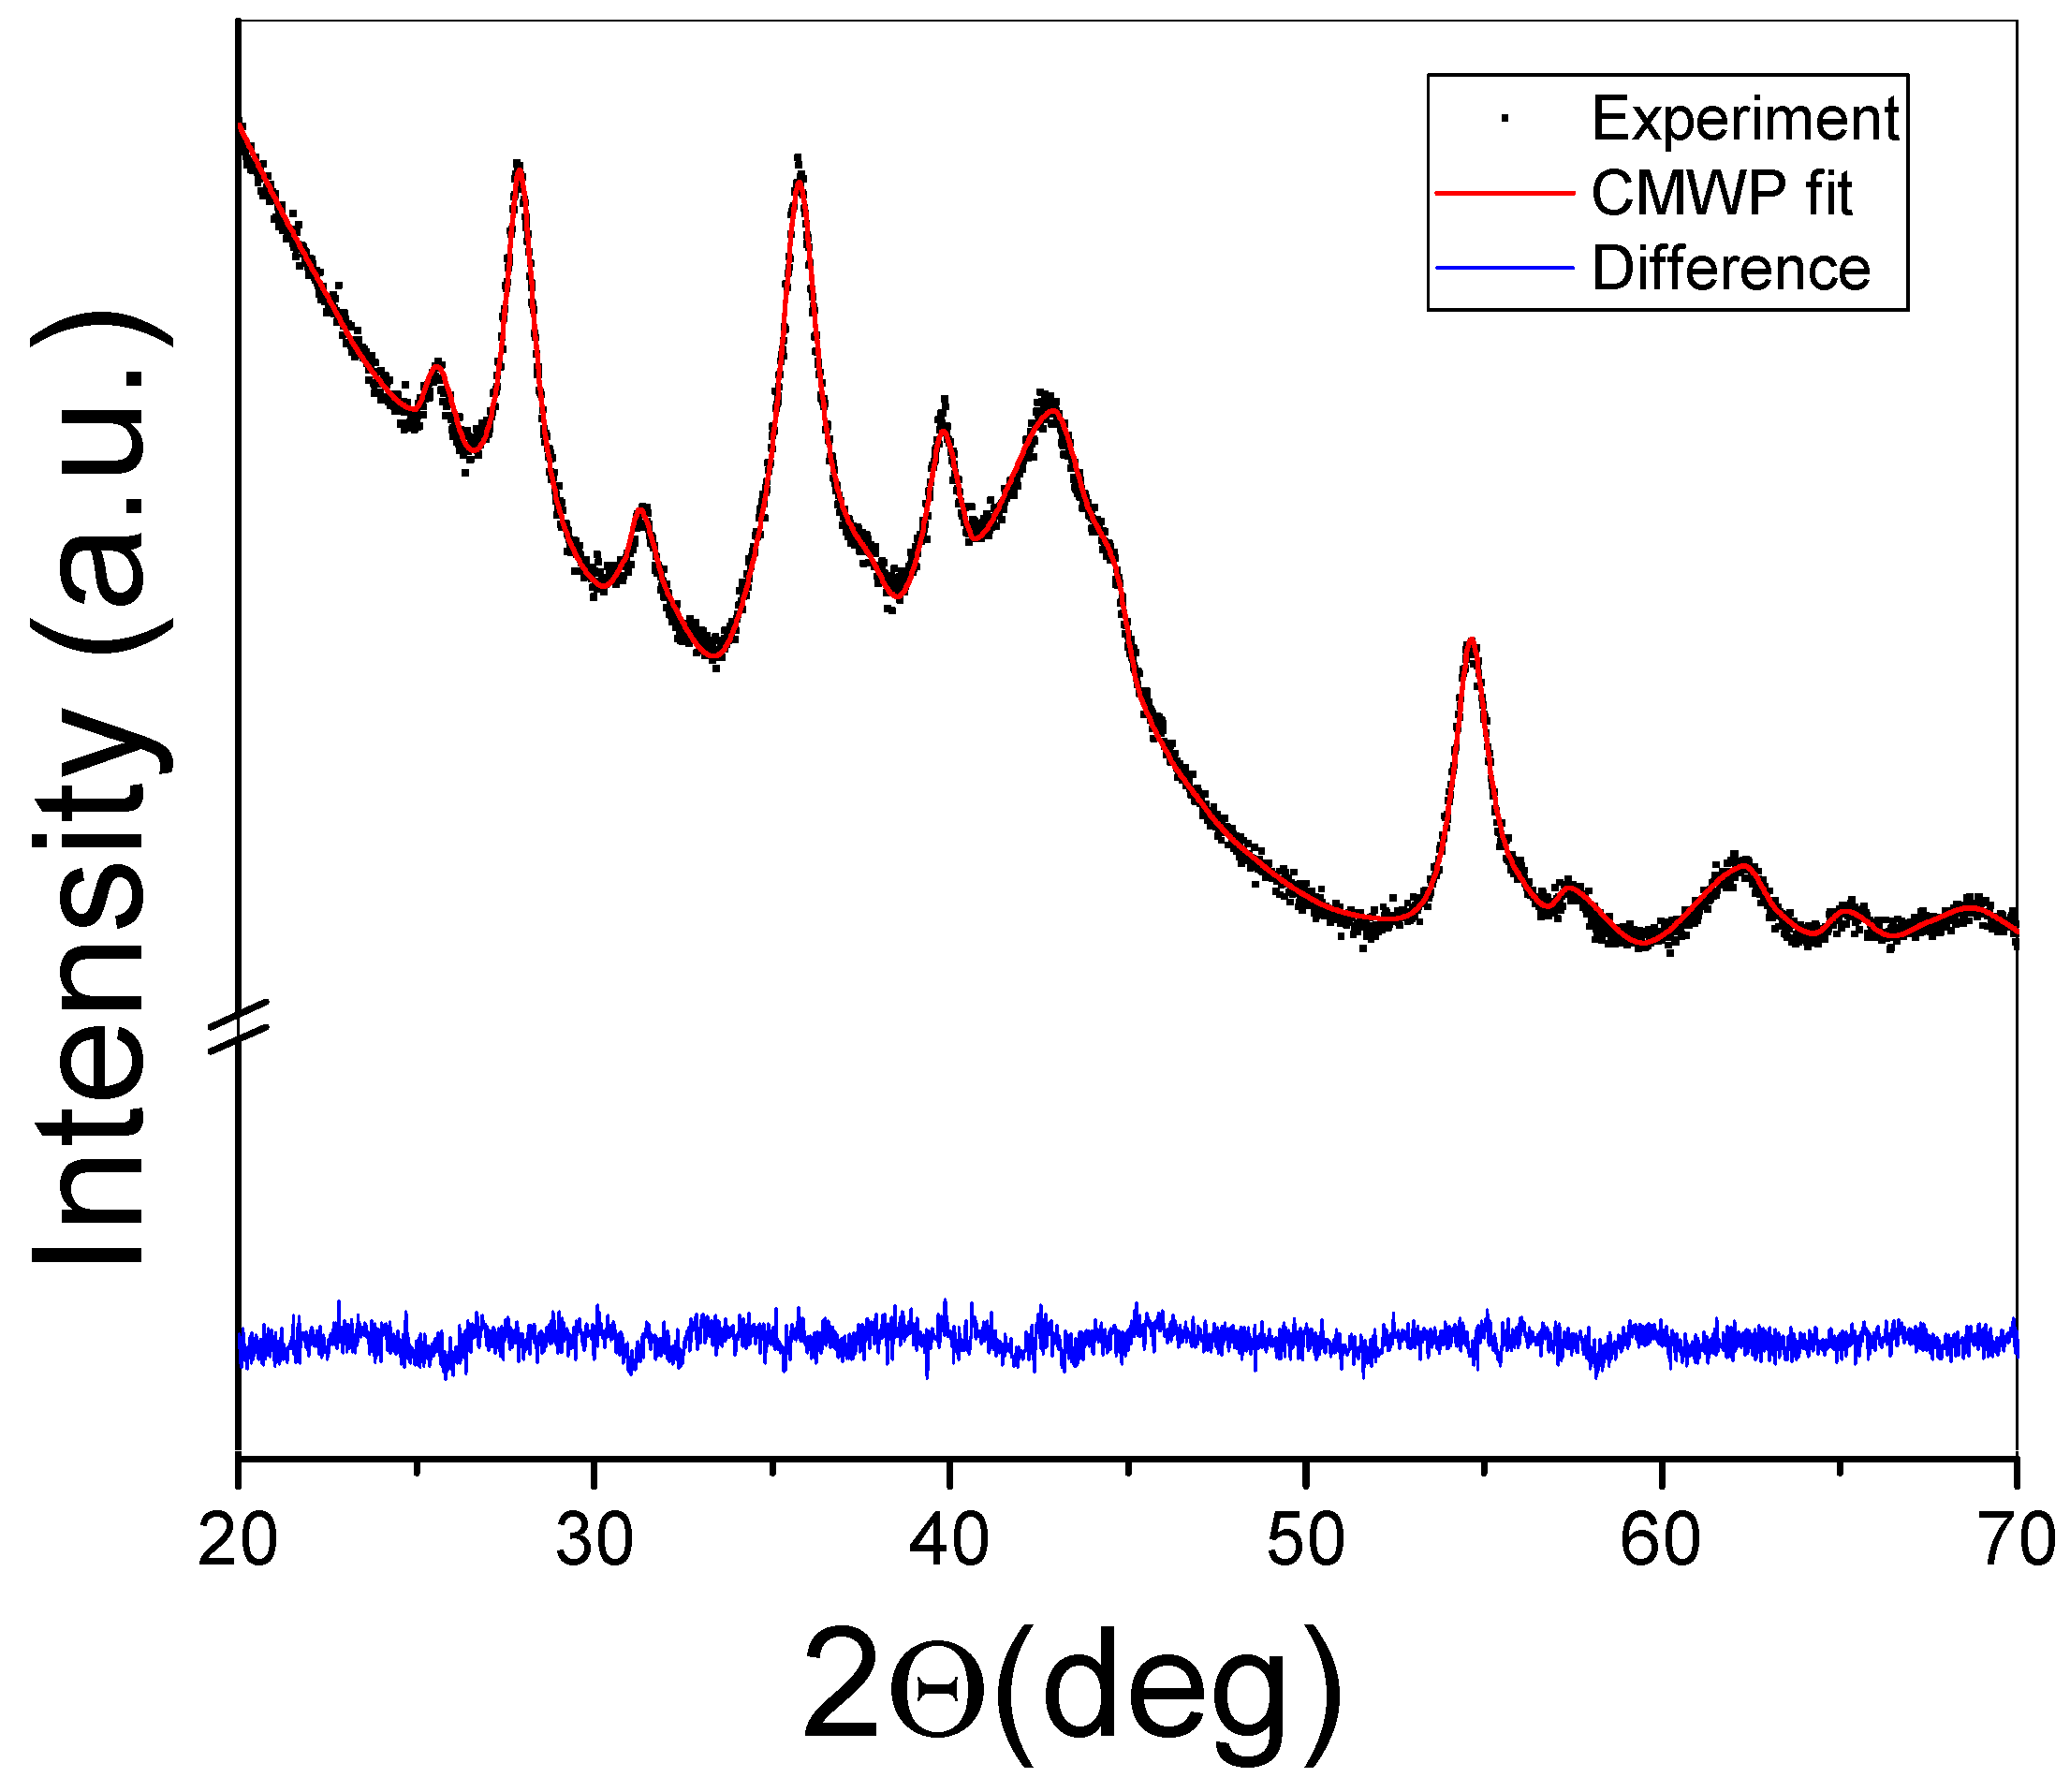
A typical attempt at applying the CMWP algorithm on a measured XRD profile can be seen in Figure 4. Apart from the fitted profile, the difference plot is also presented for the MgH2-40 wt.% FeTi composite. It is clear from the image that the numerical algorithm satisfactorily converged after ~100 iteration steps and that the analysis can serve as a useful tool to characterize the microstructure of HEBM Mg-based hydrogen-storage alloys in detail [28,30,37,52,65,68].
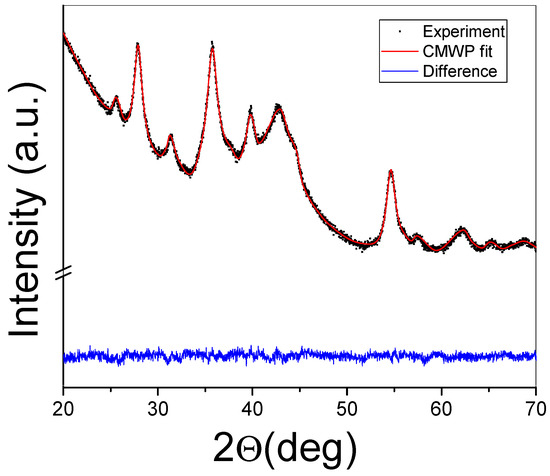
Figure 4.
XRD profile of the MgH2-40 wt.% FeTi powder fitted by the CMWP algorithm. The difference between the measured diffraction pattern and the fit are also presented.
The microstructural parameters, such as the median (mCMWP) and variance (σCMWP), of the coherently scattering α-MgH2 crystallites obtained from the CMWP analysis are listed in Table 3. As can be seen, for the high-FeTi-containing MgH2-60 wt.% FeTi alloy, the mCMWP value is larger by a factor of ~2 compared with the other two composites, while the σCMWP value is about half that of the other two alloys. The smaller σCMWP value corresponds to a more homogeneous nanostructure. It is noted that on a micron scale, the powder-particle size distribution obtained from SEM images exhibits the highest σ value (see Figure 1); therefore, it is concluded that different mechanisms take place on these two length scales. As was described above, the individual MgH2 powder particles tend to agglomerate in the vicinity of the FeTi particles at a higher catalyst content. At the same time, the entire volume of these micron-scale MgH2 particles is attrited by the formation of coherently scattering nanocrystals that are separated by large-angle grain boundaries. Apparently, this process is more effective in the presence of a higher FeTi content.
Table 3.
Microstructural parameters for the main α-MgH2 phase obtained from CMWP analysis for the different MgH2-FeTi powder composites.
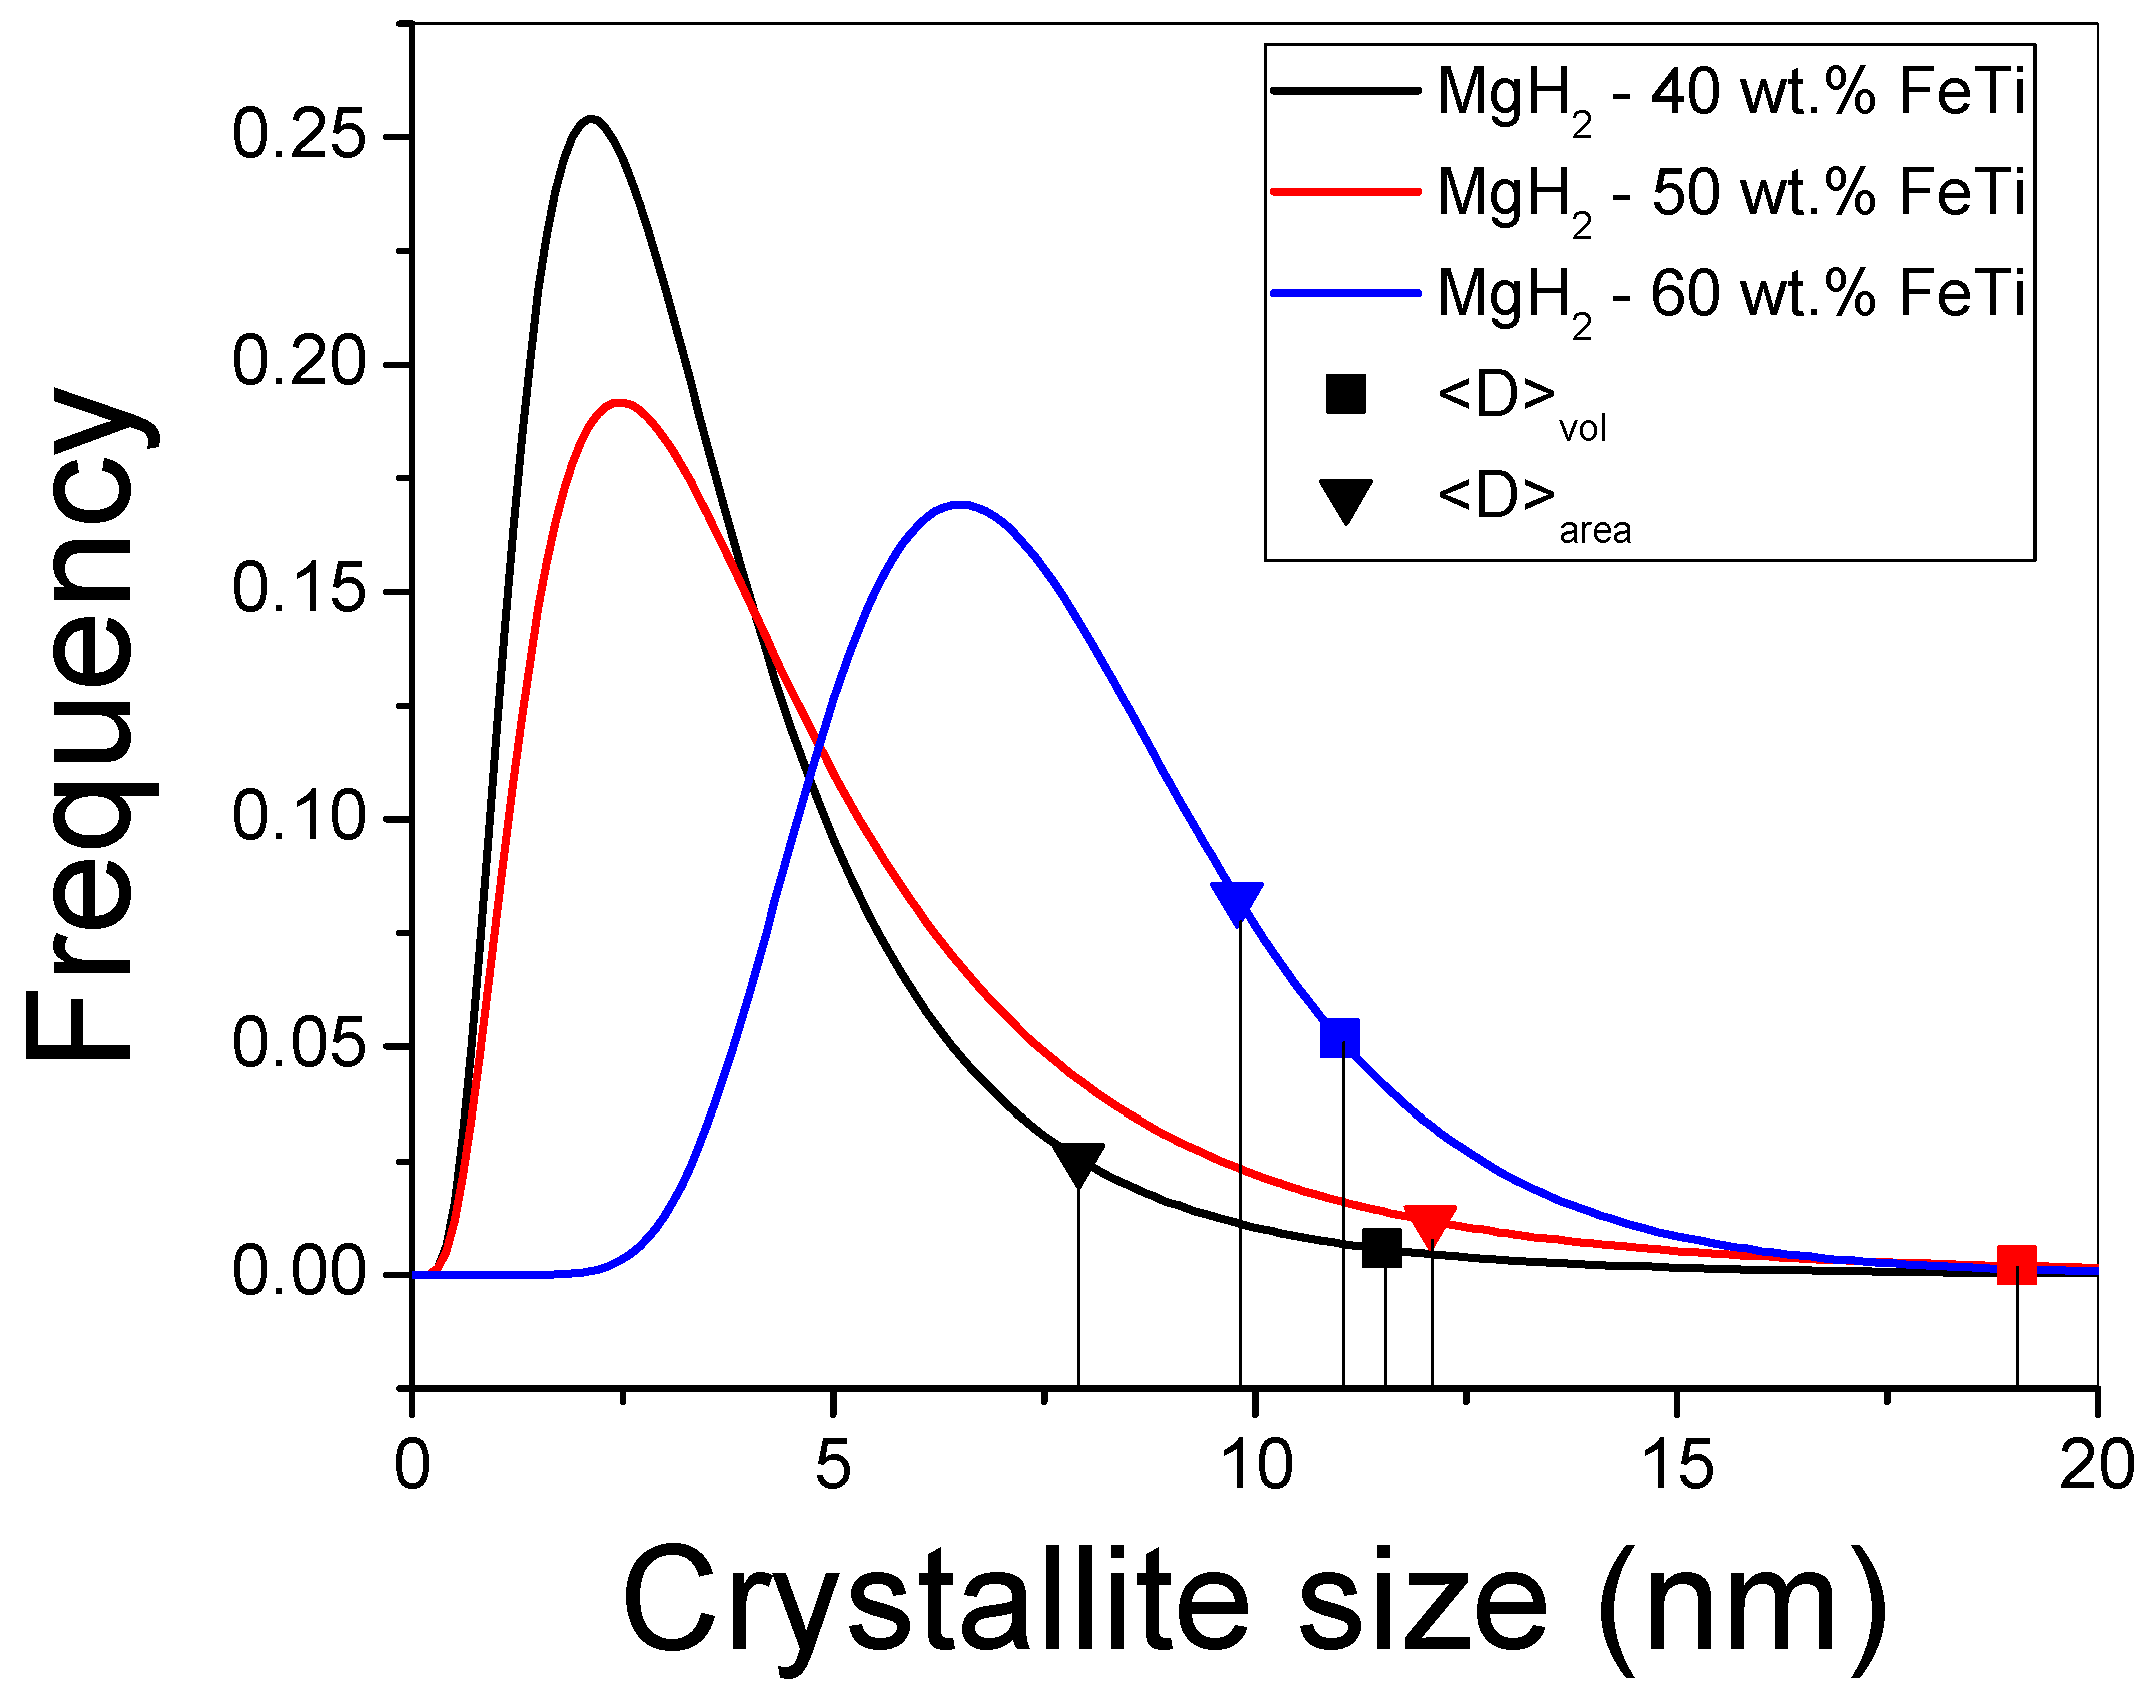
By applying mCMWP and σCMWP via Equation (1), the G(x) lognormal size-distribution functions can be constructed for all the composites (see Figure 5). Due to the largest mCMWP value being for the MgH2-60 wt.% FeTi alloy, its histogram is shifted toward higher values, and its maximum occurs at around 7 nm. The corresponding ⟨D⟩area area-averaged particle size and ⟨D⟩vol volume-averaged crystallite sizes were also determined (see Equations (2) and (3)); these values are also listed in Table 3 and represented by symbols in Figure 4. In accordance with the broad Bragg peaks observed in Figure 3, all the characteristic values are in the nanometric range (8–19 nm), which correspond to an intensive nanocrystallization during the HEBM process and are in agreement with other MgH2-based hydrogen-storage alloys processed by HEBM [30,32,52]. In particular, a 9 nm final crystallite size of MgH2 was achieved after prolonged milling time (24 h) [55], confirming our previous statement that there exists an optimal milling time for achieving the best overall microstructure from the point of view of hydrogenation performance [52,65,68]. As a consequence of the nanocrystallization process, the relative volume fraction of the grain boundaries inside the individual powder particles increases significantly, and these grain boundaries, with distorted atomic bonds and smaller atomic density [29], can act as fast diffusion channels for hydrogen. In a recent research study, it was determined that FeTi catalyst powder particles can not only induce the nanostructural refinement of MgH2 via HEBM, but they can also promote the abundant formation of lattice defects like dislocations [52]. These lattice defects can further enhance the hydrogen kinetic performance of MgH2 [28,30].
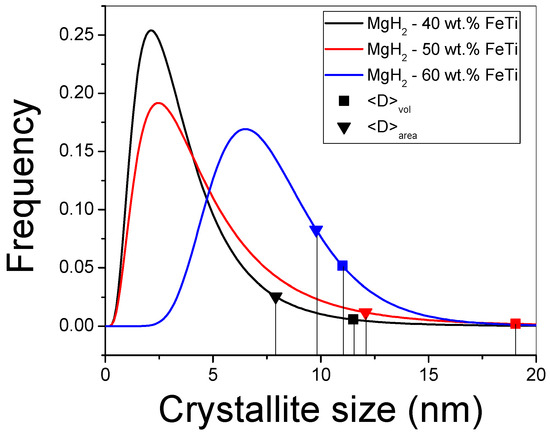
Figure 5.
Lognormal size-distribution functions for the milled MgH2-FeTi powders.
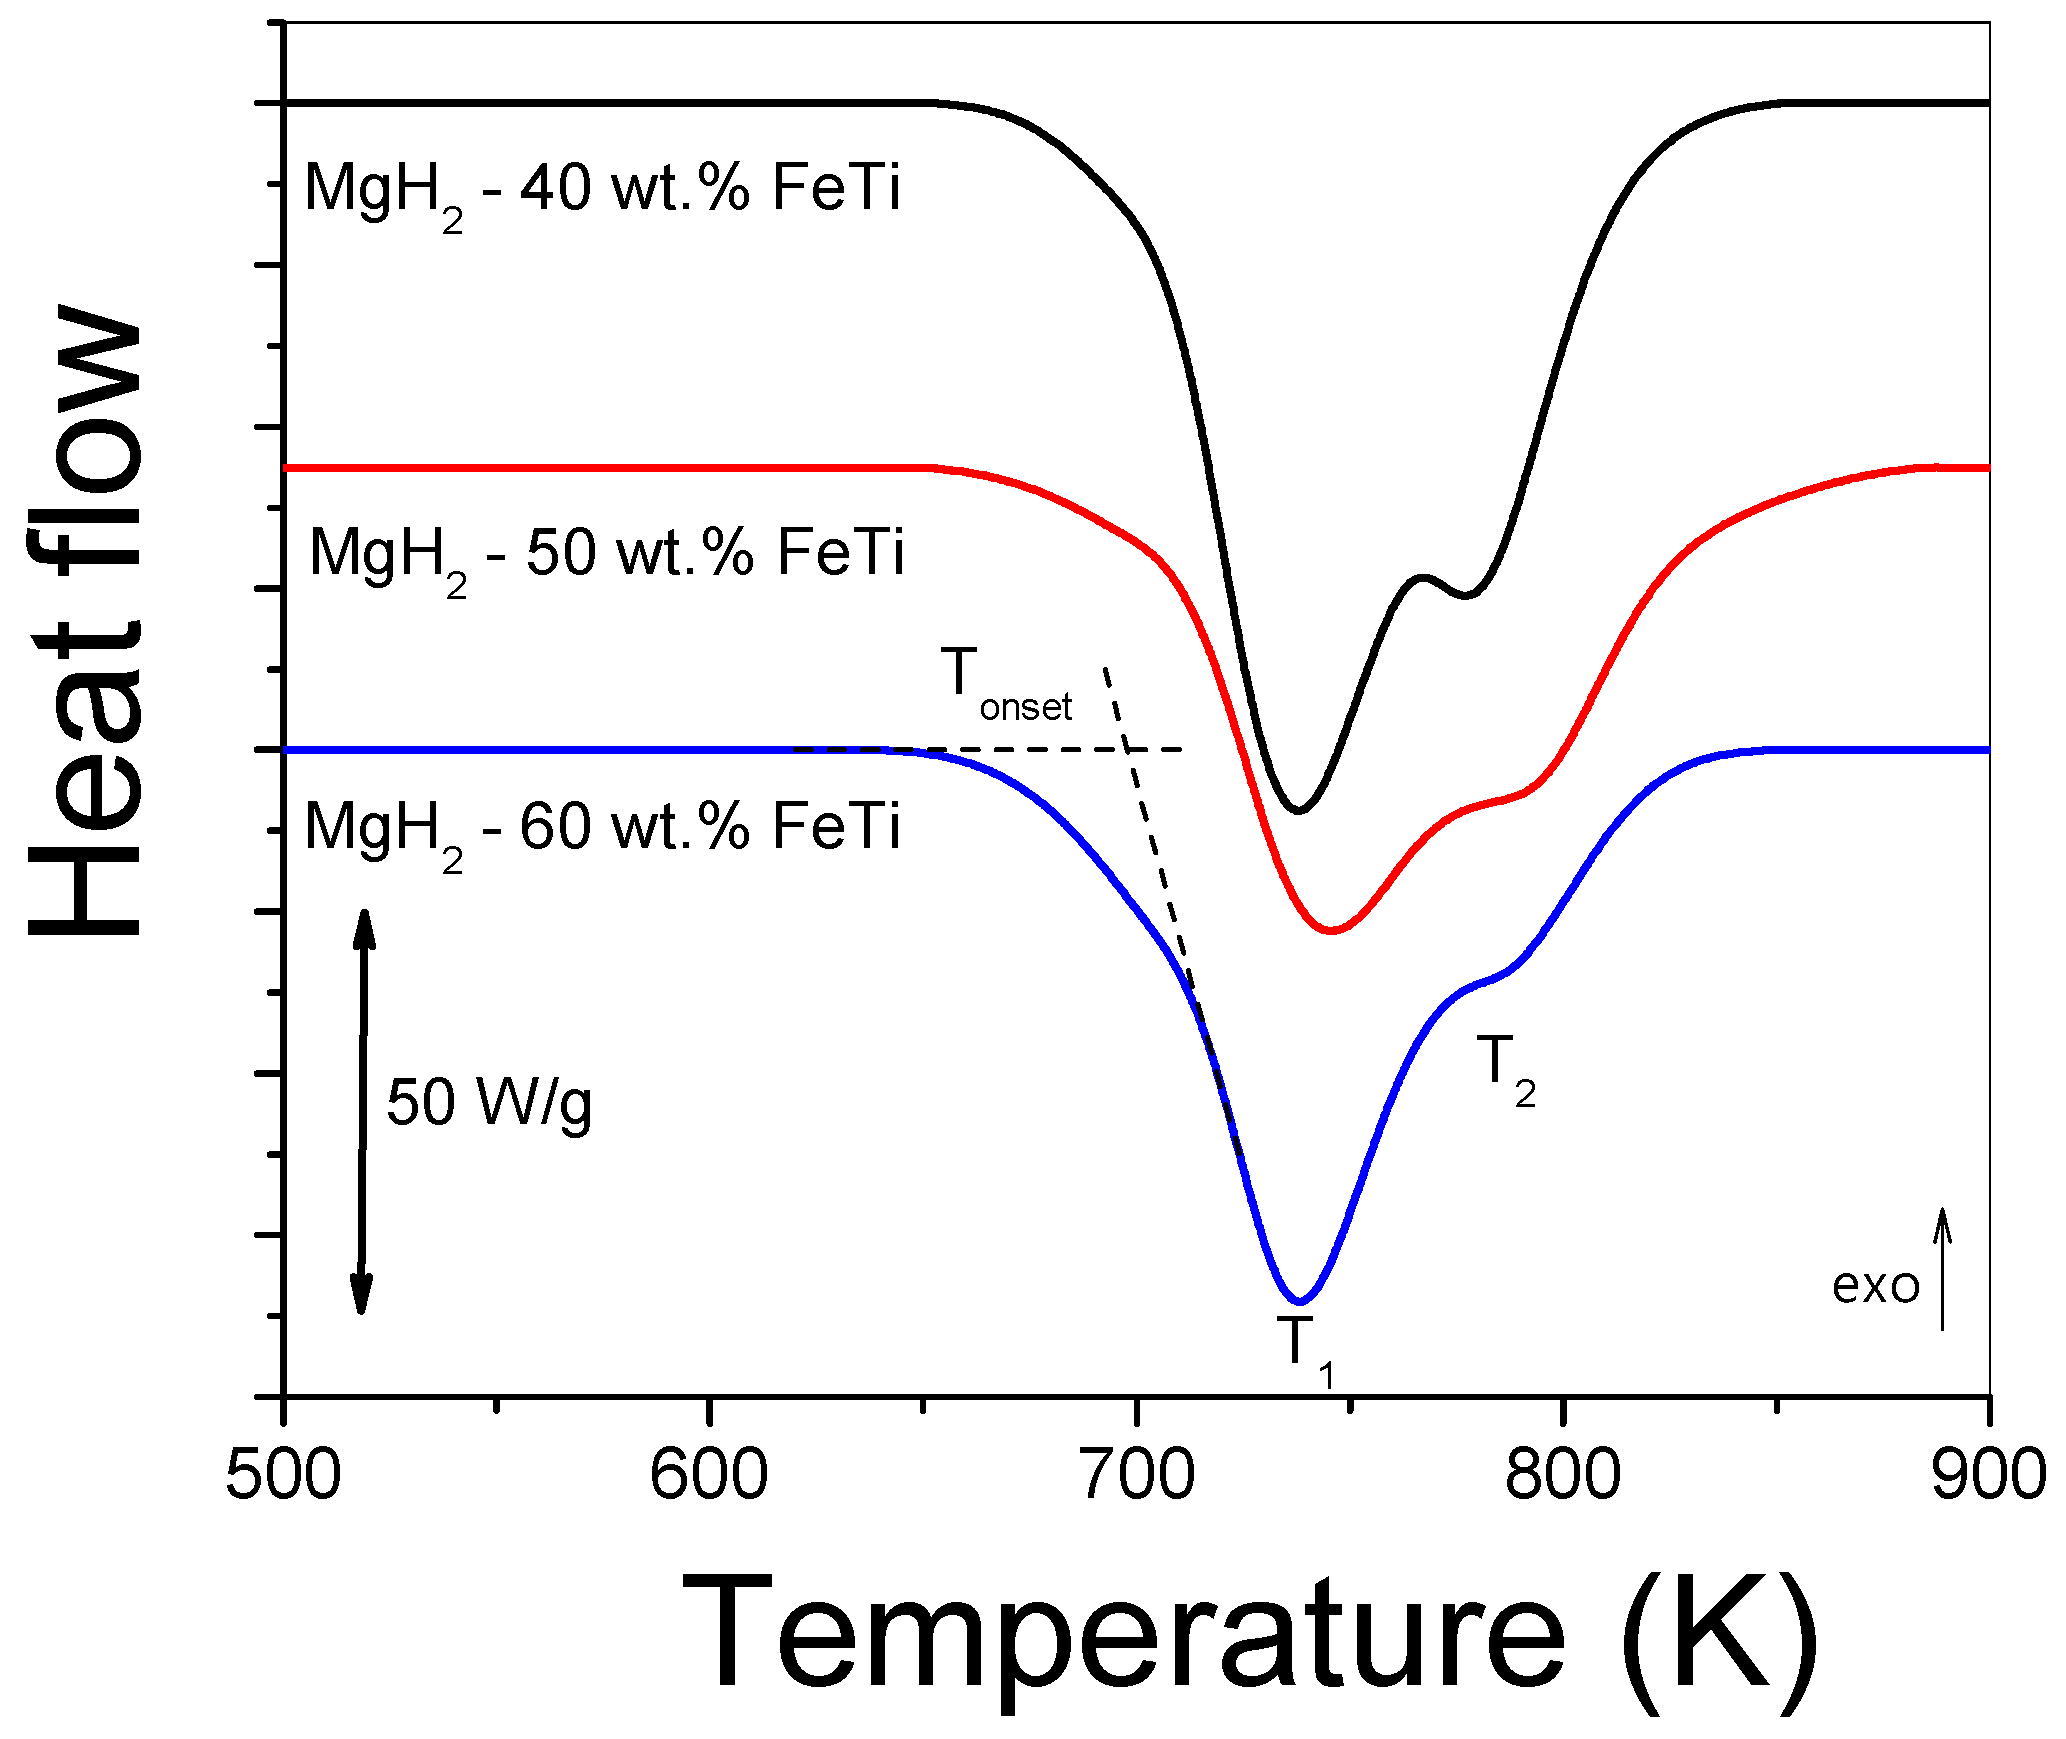
Figure 6 presents the continuous-heating DSC scans obtained at 40 Kmin−1 for the MgH2-FeTi composites. In general, each thermogram exhibits an overlapping two-step endothermic reaction, which corresponds to the dehydrogenation of the metastable γ-MgH2, stable α-MgH2 and hydrides at T1 and T2 temperatures, respectively. This feature was also confirmed previously by a temperature-dependent XRD study on the dehydrogenation of MgH2 [52]. The notably lower T1 temperature characterizing the γ-MgH2 → Mg + H2 reaction is attributed to the weaker Mg-H bond in the high-pressure hydride phase [52]. The Tonset onset temperature of the first reaction as well as the T1 and T2 peak maxima are listed in Table 4. As one can observe, the variation in these characteristic temperatures has only a slight FeTi-content dependence; however, the overlap between the two reactions is more significant for the MgH2-60 wt.% FeTi composite. The lowest Tonset and T1 temperatures of this alloy assumes that it has the lowest dehydrogenation stability among all the powders, most probably due to the enhanced synergetic effect between MgH2 and FeTi. The total dehydrogenation enthalpy release of MgH2 (∆Htot) clearly shows a decreasing tendency with increasing FeTi content (see Table 4).
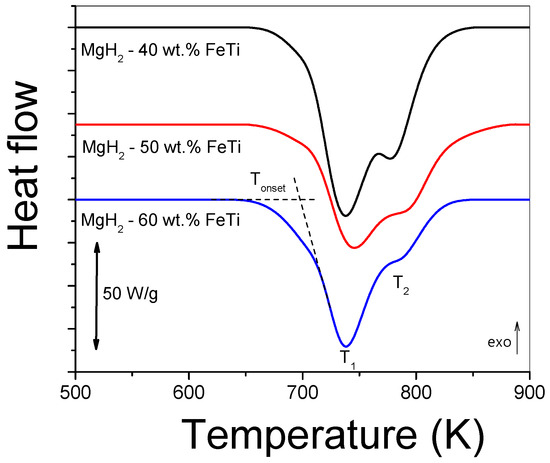
Figure 6.
Linear-heating DSC scans for MgH2-FeTi powders obtained at 40 Kmin−1.
Table 4.
Characteristic temperatures (Tonset, T1, T2) and total dehydrogenation enthalpy (∆Htot) obtained from linear-heating DSC scans for the MgH2-FeTi powders.
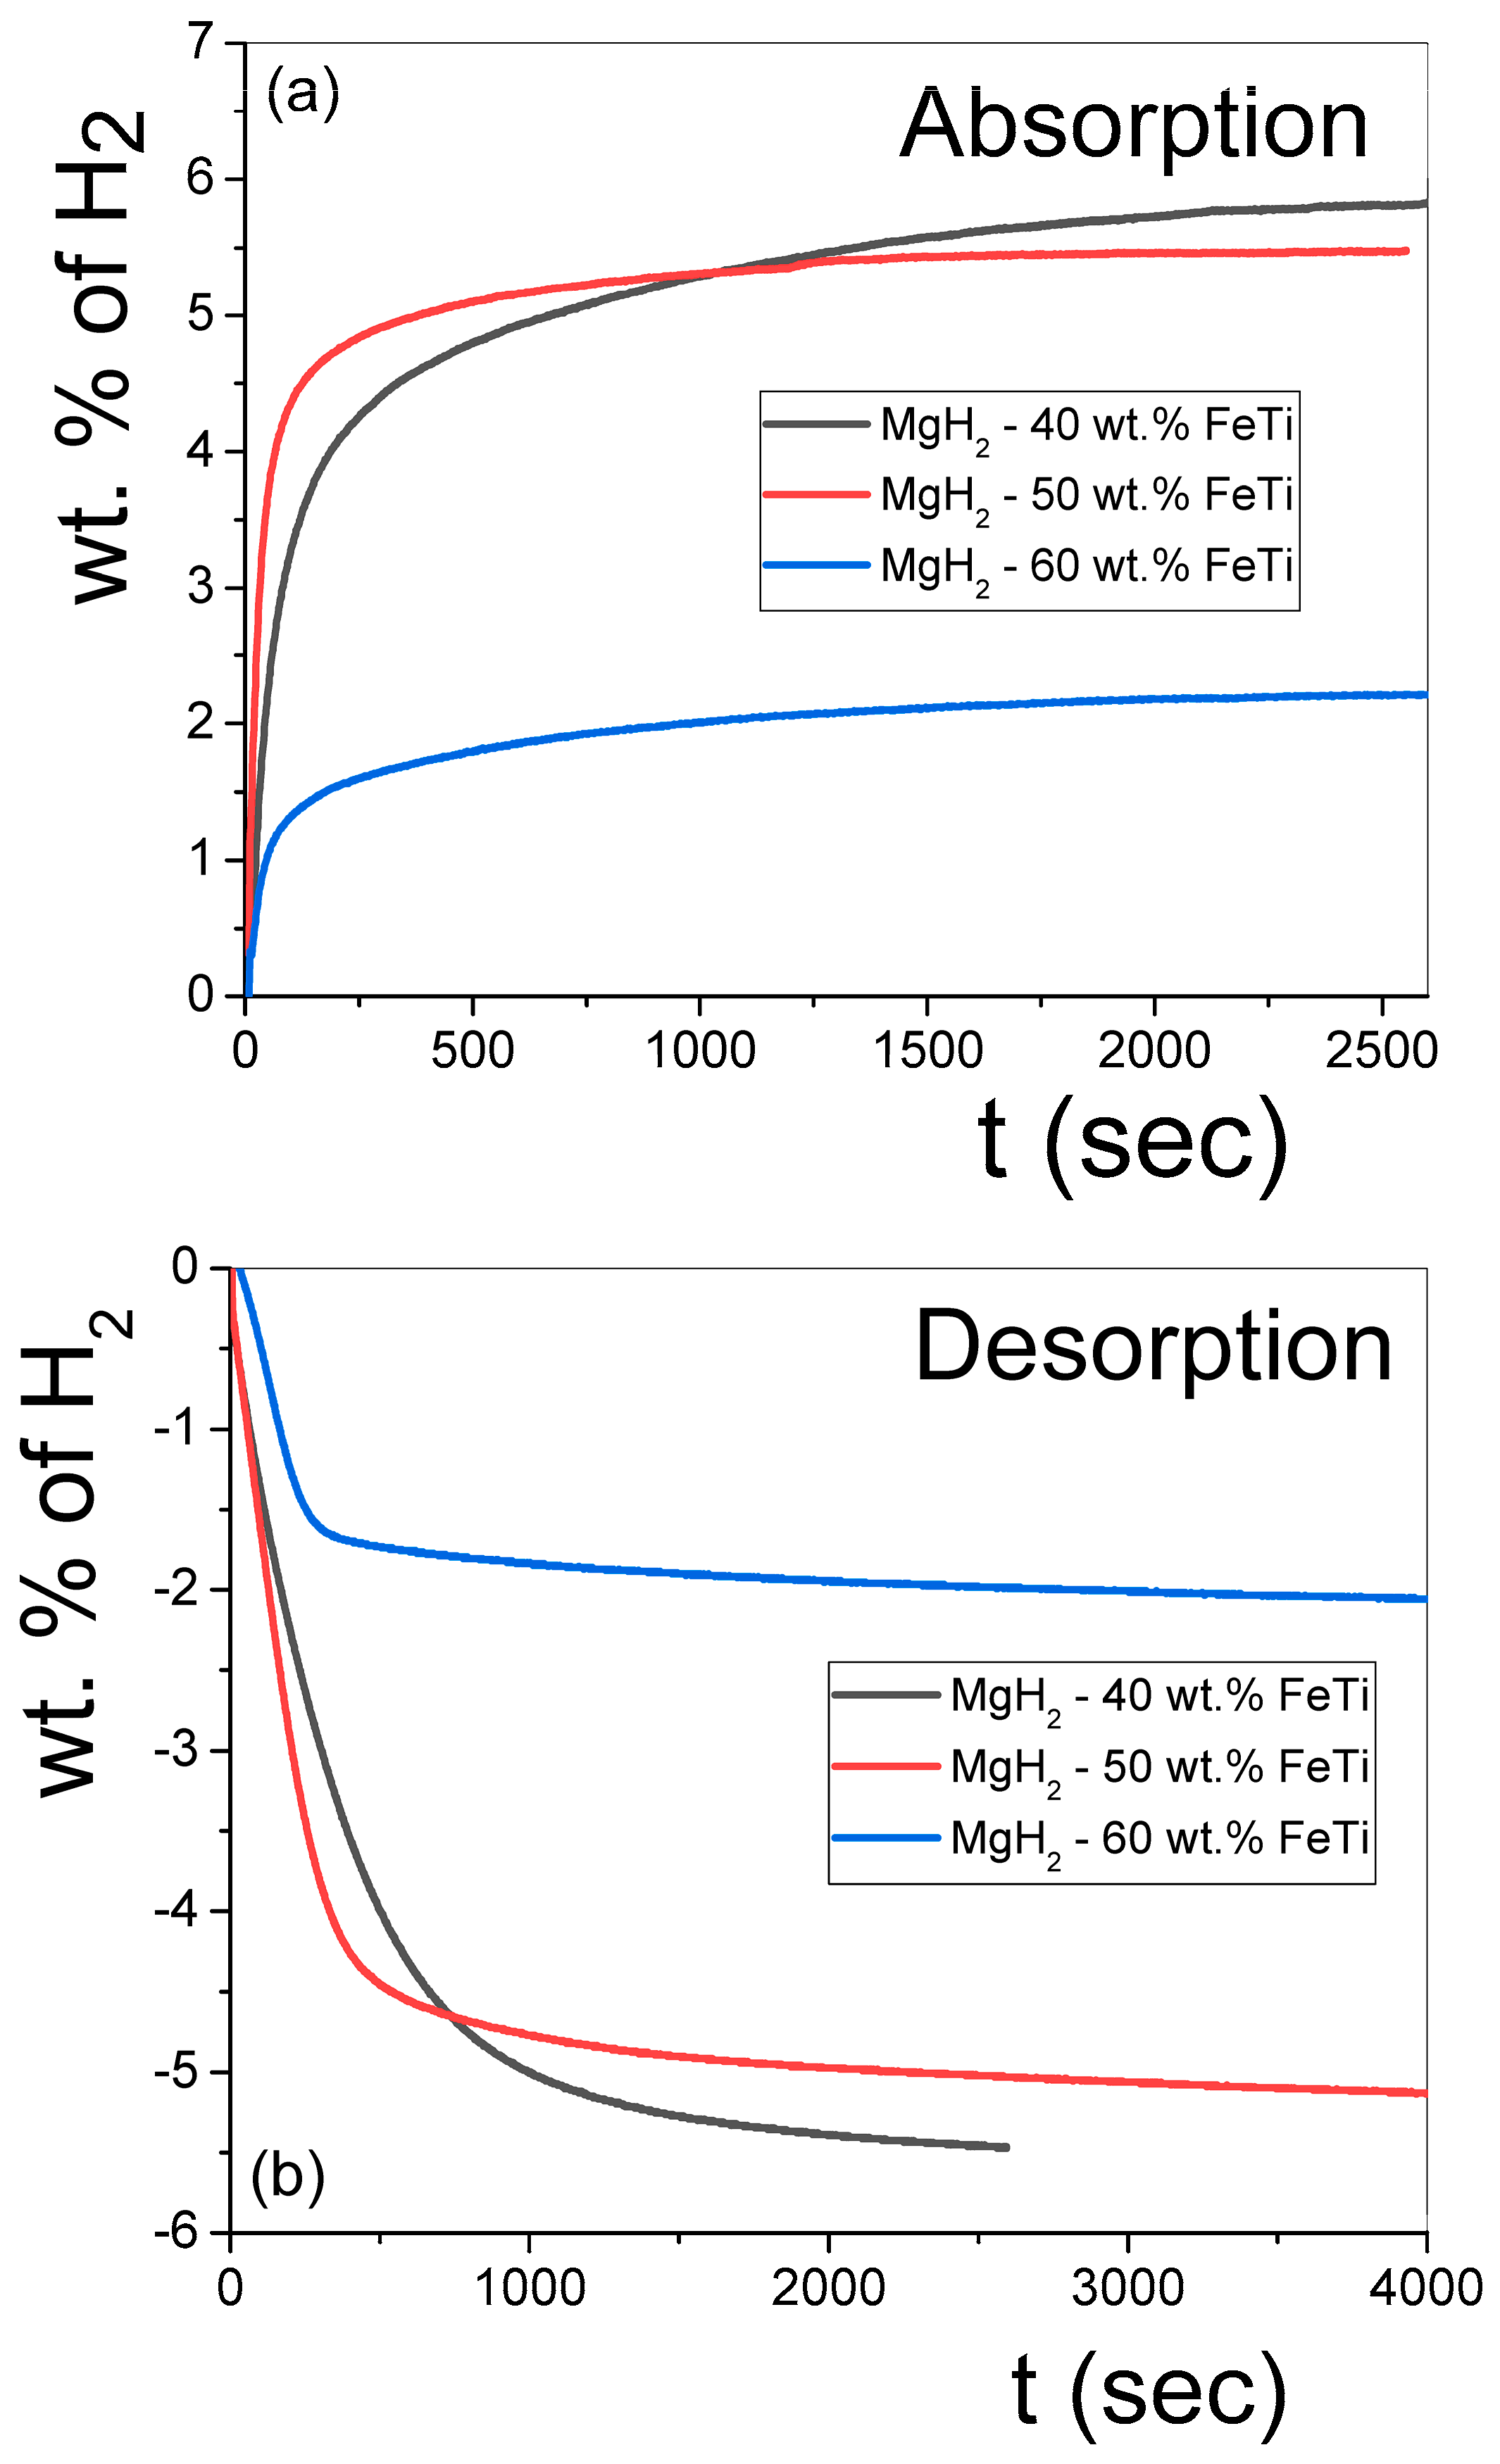
The isothermal hydrogen absorption and desorption kinetic measurements of the MgH2-FeTi powders are presented in Figure 7. As noted from Figure 7a, all the composites can absorb a significant amount of H2 in a very short time, corresponding to excellent kinetics in this system. According to Table 5, the largest capacity (5.8 wt.% H2) is achieved for the lowest FeTi-containing composite (MgH2-40 wt.% FeTi). Mixing 40 wt.% pre-milled FeTi with MgH2 should decrease the theoretical capacity of Mg (7.6 wt.% H2) down to 5.4 wt.%; therefore, it is evident that the FeTi catalyst also participates in hydrogen absorption. These capacity values are significantly higher than those obtained for the MgH2 nanocrystalline powder that had been subjected to HEBM with FeTi for 25 h [48]. In addition, the finding that 3.3 wt.% H2 is absorbed in the first 100 s of hydrogenation confirms the excellent kinetics of this material, which confirms that a synergetic effect clearly develops between MgH2 and FeTi. Noteworthily, when only 10 wt.% FeTi was mixed with MgH2, a similar amount of hydrogen was absorbed only after several hundred seconds [52]. Another important feature of the dehydrogenation experiments is that the MgH2-50 wt.% FeTi powder possesses the best absorption rate by far at shorter times (4.3 wt.% absorbed H2 after 100 s). Our values indicate a considerably better kinetic performance than that observed for the MgH2 + (FeTi)0.92Mn0.08 composite (3 wt.% after 500 s at T = 573 K) [51]. As also inferred from Figure 7a and Table 5, the capacity and kinetics of the MgH2-60 wt.% FeTi composite are evidently the worst, which is a consequence of the smaller theoretical capacity of the FeTi solid solution and/or amorphous phase with respect to Mg. Figure 7b confirms that the hydrogen desorption was complete for all powders, similarly to the dehydrogenation during the continuous DSC experiments (see Figure 6). In general, the amount of released hydrogen was slightly low for all samples; e.g., it was 5.5 wt.% in the case of the MgH2-40 wt.% FeTi sample, see also Table 5. Despite the exceptional absorption kinetics of this alloy, its dehydrogenation performance is also somewhat poorer, releasing 2.8 wt.% H2 in 120 s. It is also apparent from Figure 7 and Table 5 that the highest FeTi content results in the poorest overall sorption characteristics, most probably due to the highest average powder particle size (see Figure 1). The larger agglomerate size on the micron scale clearly corresponds to fewer free surfaces per unit volume; therefore, the overall hydrogen penetration and diffusion are less favored in this powder. Another feature that might be responsible for the poorest hydrogenation kinetic performance of the MgH2-60 wt.% FeTi composite occurs at the nanoscale. As determined from the CWMP analysis (see Table 3), the σCMWP variance value of the coherent-scattering nanocrystals is the smallest among all the powders. These nanocrystals, therefore, are relatively similar in size and, henceforward, their grain boundaries at the contact surfaces do not possess a very different overall microstructure. In contrast, the other two powders exhibit a larger variance and an inhomogeneous crystal size distribution, so the grain boundaries among these different nanocrystallites can cover a wider structural diversity, which can also be responsible for their better hydrogenation kinetics.
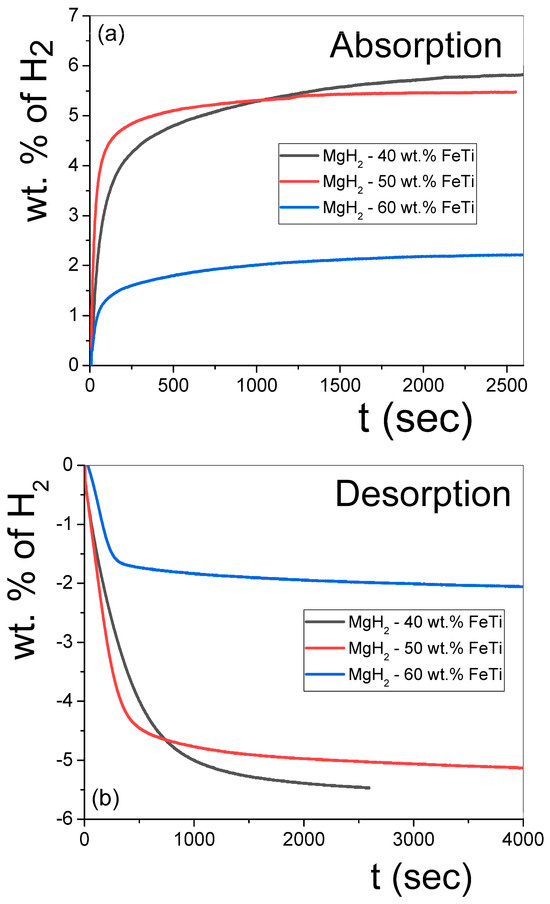
Figure 7.
Hydrogenation (a) and dehydrogenation (b) curves obtained for the MgH2-FeTi composites.
Table 5.
Hydrogenation and dehydrogenation data obtained from the sorption measurements.
In order to reveal the underlying mechanism of hydrogen sorption of the MgH2-FeTi composites, the measured kinetic absorption and desorption curves were normalized to their maximum capacity. Thereafter, these absorption and desorption normalized functions were fitted with different model functions available in the literature. Accordingly, the kinetic data can satisfactorily be fitted by the Johnson–Mehl–Avrami (JMA) function:
where k is a temperature-dependent reaction constant and n relates to the growth dimensionality of a nucleating phase [70]. This model assumes that the nucleation of the new phase occurs randomly and homogeneously over the entire volume of the material. For better visualization, Equation (4) can be transformed into the following equation:
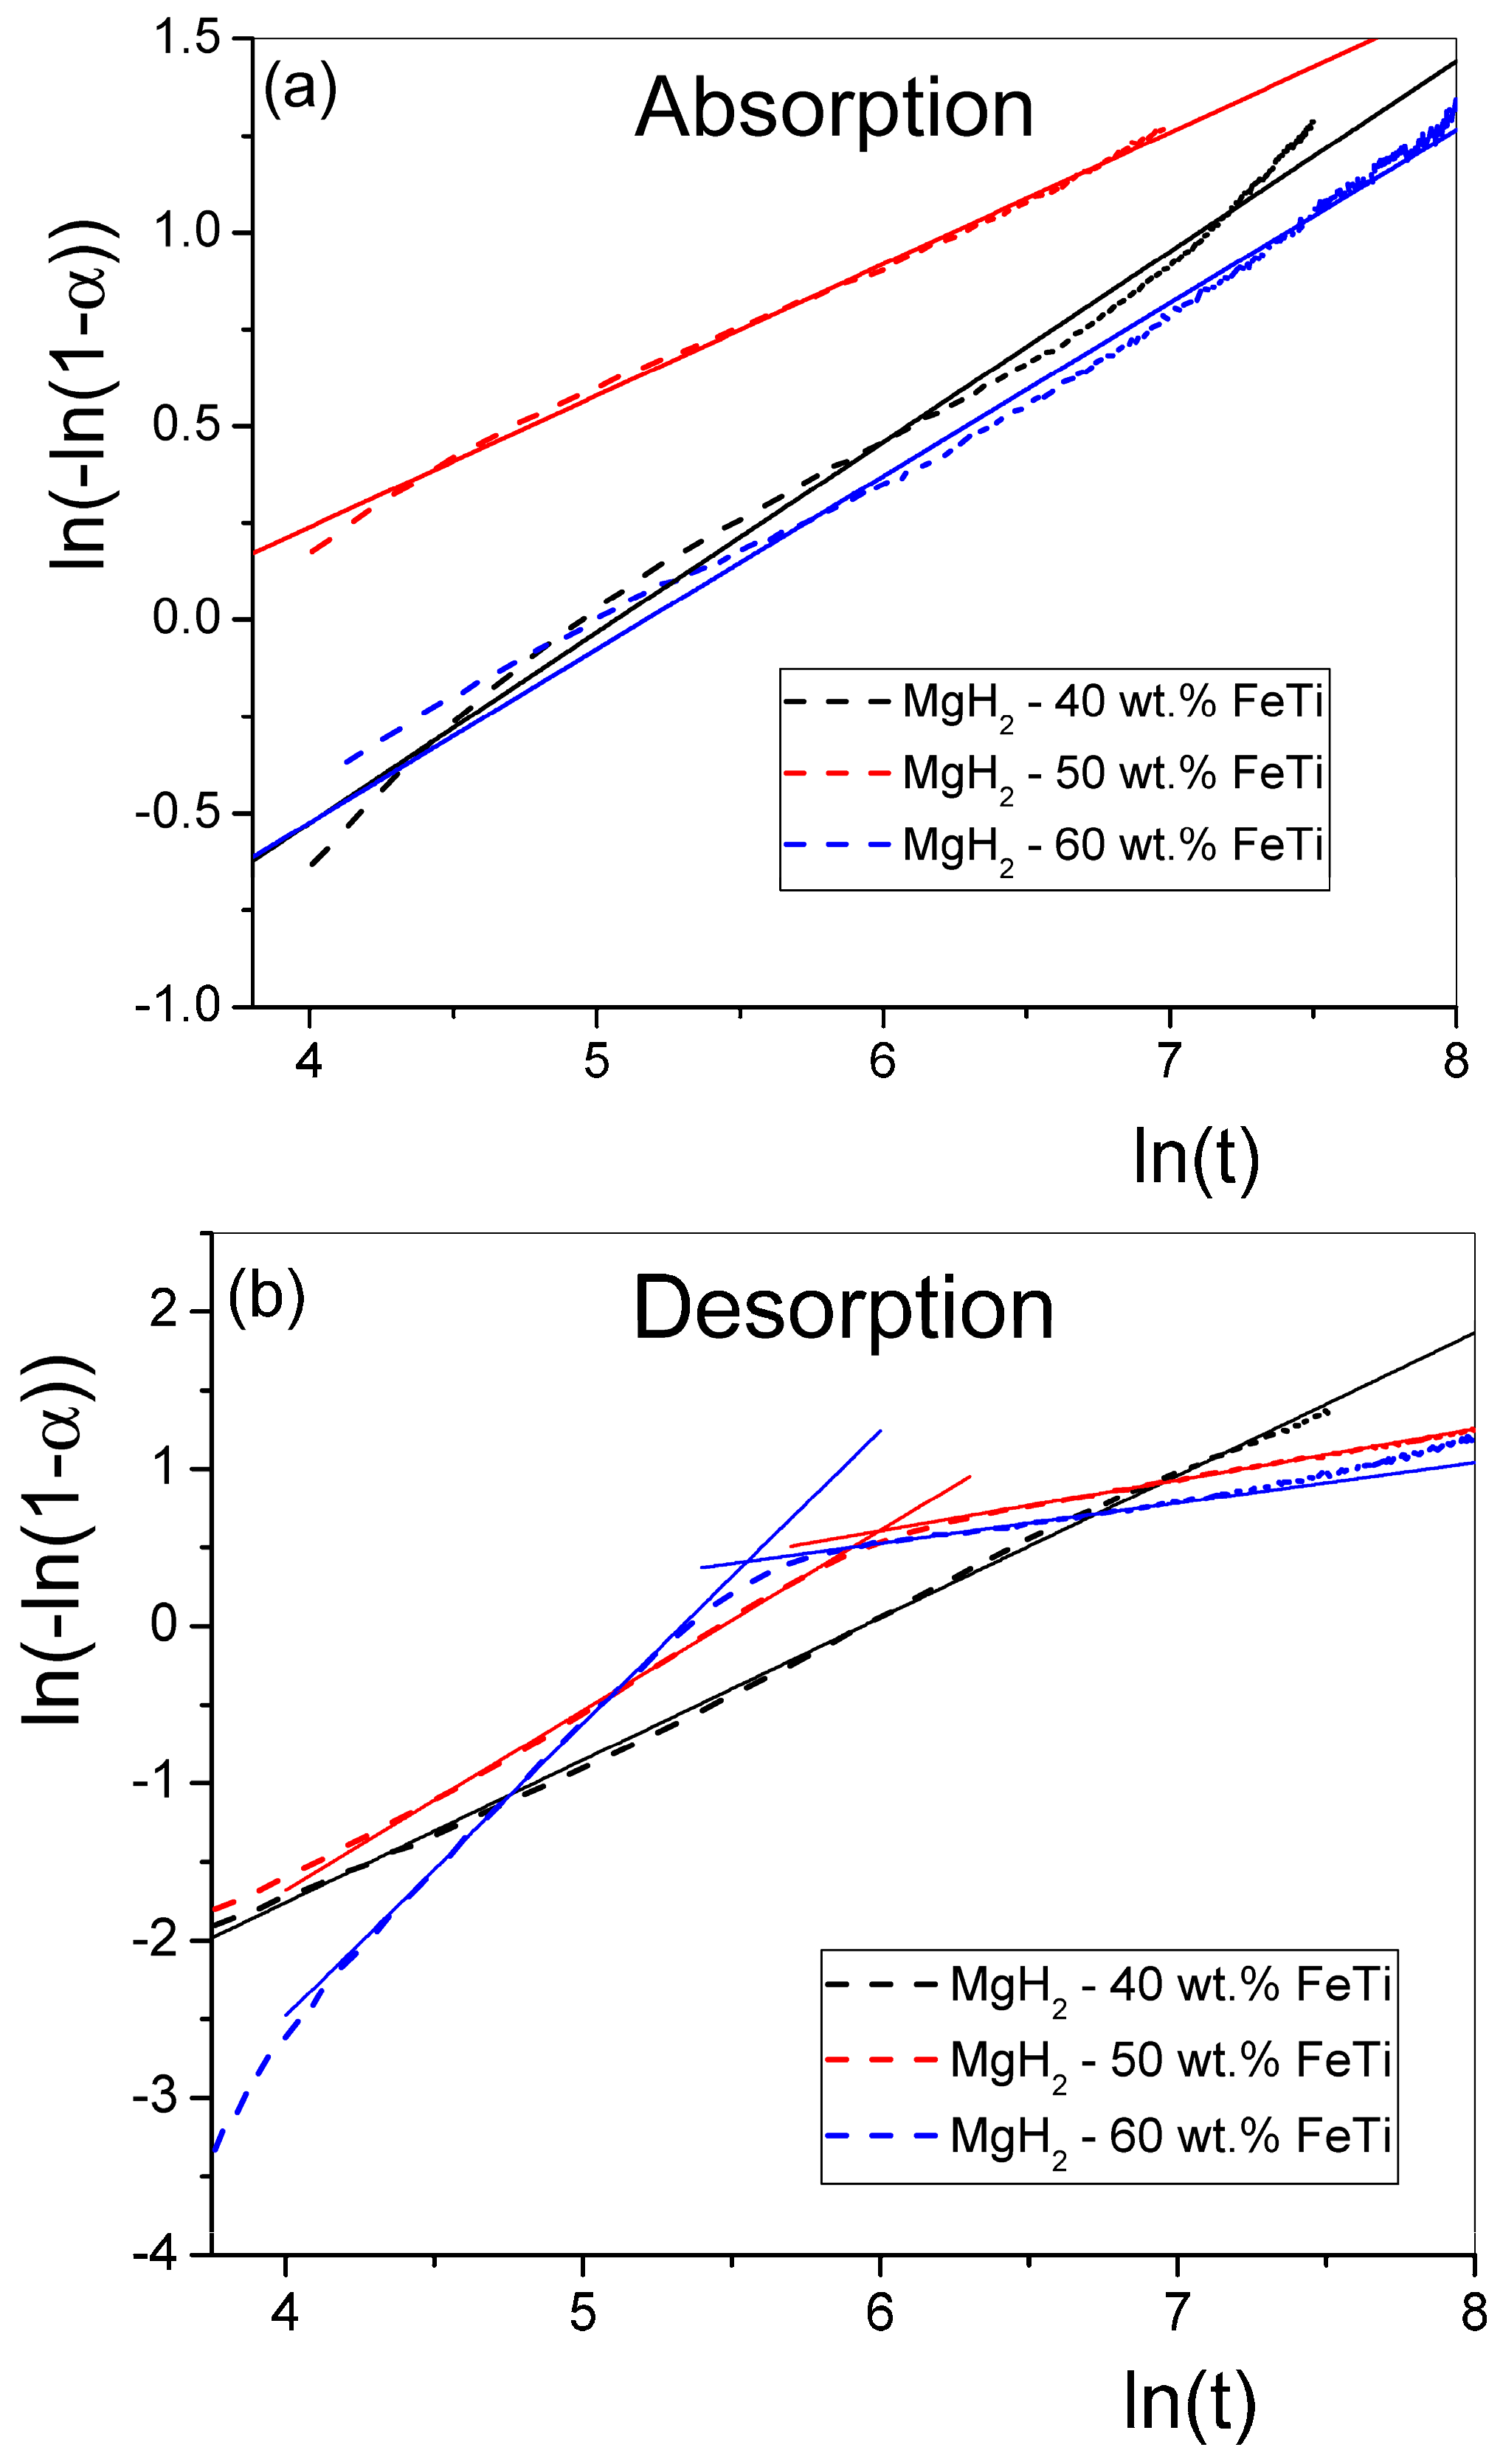
By fitting the term as a function of with a straight line, the slope of the fitted line determines the value n, while its intercept with the ordinate provides the value for k. Figure 8 presents such fitted straight lines for all the MgH2-FeTi powders. Generally, the -transformed absorption functions follow well the linear relationship for all powders (Figure 8a); therefore, the entire hydrogenation process can satisfactorily be described by a single n exponent. These fitted values are listed in Table 6.
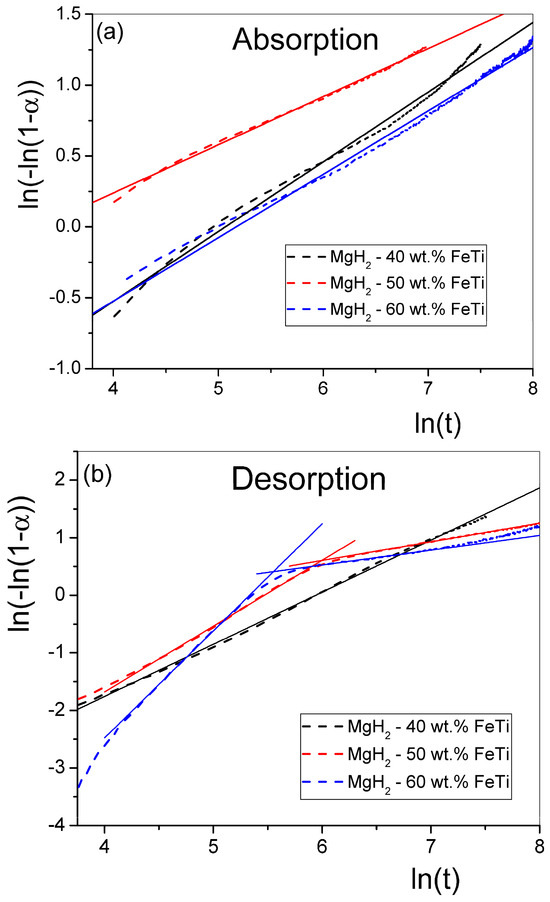
Figure 8.
Double-logarithm JMA plots for the (a) absorption and (b) desorption of the MgH2-FeTi powders. Solid lines represent the linear fits.
Table 6.
Hydrogen absorption and desorption exponents obtained from the JMA fits of the normalized kinetic curves.
The transformed dehydrogenation functions for the MgH2-40 wt.% FeTi sample obeys a linear relationship (Figure 8b); however, a significant deviance from the straight line is observed for the MgH2-50 wt.% FeTi and MgH2-60 wt.% FeTi composites, in correlation with an extensive change in the shape of the desorption curves at t = 300 s (see Figure 7b). This feature assumes that there is a variation in the dehydrogenation mechanism as a function of time.
As listed in Table 6, the n parameter describing absorption is in the range of n~0.3–0.5, with only a slight difference occurring with varying catalyst content. These values are in accordance with those obtained for the sorption of MgH2 catalyzed by a much smaller amount (10 wt.%) of nanocrystalline FeTi [52], indicating that the H-sorption mechanism of Mg/MgH2 is very similar for all cases, irrespective of the relative abundance of FeTi particles to the MgH2 ones. These anomalously low n values describing a JMA-type transformation correspond to a specific type of diffusion-controlled phase growth in which precipitates of the nucleating phase (MgH2 for absorption and Mg for desorption) commence near lattice defects (vacancies and dislocation or grain boundaries) [70], which are abundantly generated by SPD during the HEBM process. The desorption of MgH2-40 wt.% FeTi exhibits a single JMA exponent (n = 0.95) that corresponds to a combination of several overlapping processes, including diffusion-controlled growth with a decreasing nucleation rate and nucleation in the vicinity of lattice defects [70]. The double-logarithm JMA plots for the other two alloys do not show a linear tendency; both curves exhibit two linear segments, corresponding to a significant variation in the dehydrogenation mechanism as a function of time.
4. Conclusions
In this research, HEBM was used to produce nanocrystalline MgH2-FeTi powder composites, with the amount of FeTi catalyst chosen as 40 wt.%, 50 wt.% and 60 wt.%. The Fe:Ti atomic ratio was set to 1:1. Scanning electron microscopy revealed that FeTi catalyst particles are evenly and homogeneously dispersed among the hydride agglomerates after 3 h of milling. Quantitative analysis of the SEM images confirmed that the particle-size histograms follow a lognormal distribution with an average particle-size ⟨d⟩area of ~5 μm.
XRD analysis demonstrated that the milled powder composites are abundant in tetragonal α-MgH2; however, minor levels of the high-pressure γ-MgH2 phase are also present. At the same time, a possible solid-state amorphization of the FeTi catalyst can take place. The evaluation of the diffraction profiles by the CMWP fitting algorithm provided microstructural parameters, such as the median (mCMWP) and variance (σCMWP) of the coherently scattering α-MgH2 crystallites. For each composite, the ⟨D⟩area area-averaged and ⟨D⟩vol volume-averaged crystallite sizes were in the nanometric range (8–19 nm).
The DSC experiments revealed a two-step dehydrogenation process for all the alloys. The lowest Tonset and T1 temperatures corresponding to the MgH2-60 wt.% FeTi composite assumes that this alloy has the lowest dehydrogenation stability.
The isothermal hydrogen sorption experiments showed that all the composites can absorb a significant amount of H2 in a very short time. The best overall hydrogenation performance was obtained for the MgH2-40 wt.% FeTi powder, with a maximum of 5.8 wt.% absorbed hydrogen. In addition, extraordinary absorption kinetics were observed for the MgH2-50 wt.% FeTi alloy, i.e., 4.3 wt.% H2 was absorbed during the first 100 s, indicating that a remarkable synergetic effect between the hydride and the catalyst had developed. It was also established that all the hydrogenation processes can be described as a JMA-type of sorption. The anomalously low JMA exponent suggests that these kinetics can be interpreted as a specific type of diffusion-controlled phase growth when precipitates of the nucleating phase commence near lattice defects.
Author Contributions
Powder processing, scanning electron microscopy, CMWP analysis, data processing, R.P.; hydrogen kinetic measurements, T.S.; X-ray diffraction, P.N.; calorimetry, scanning electron microscopy, writing, editing, Á.R. All authors have read and agreed to the published version of the manuscript.
Funding
This research was financially supported partly by the International Visegrad Fund (project V4-Japan Joint Research Program, Ref. JP3936) and the National Research, Development and Innovation Office (Contract No.: 2019-2.1.7-ERA-NET-2021-00030). R.P. is grateful to the Tempus organization for providing a Stipendium Hungaricum Ph.D. scholarship. This research was financially supported partly by the New National Excellence Program (UNKP-23-3-II-ELTE-123) of the Ministry for Culture and Innovation from the National Research, Development and Innovation Fund. Thanks are due to the European Union’s NextGenerationEU for the National Recovery and Resilience Plan of the Republic of Bulgaria, project No. BG-RRP-2.004-0008.
Data Availability Statement
Data available on request.
Conflicts of Interest
The authors declare no conflicts of interest. The funders had no role in the design of the study; in the collection, analyses, or interpretation of data; in the writing of the manuscript; or in the decision to publish the results.
References
- International Energy Agency. Key World Energy Statistics. 2020. Available online: https://www.iea.org/reports/key-world-energy-statistics-2020 (accessed on 15 January 2024).
- Jackson, R.B.; Friedlingstein, P. Persistent fossil fuel growth threatens the Paris Agreement and planetary health. Environ. Res. Lett. 2019, 14, 12001. [Google Scholar] [CrossRef]
- Abdalla, A.M.; Hossain, S.; Nisfindy, O.B.; Azad, A.T.; Dawood, M.; Azad, A.K. Hydrogen Production, Storage, Transportation and Key Challenges with Applications: A Review. Energy Convers. Manag. 2018, 165, 602–627. [Google Scholar] [CrossRef]
- Zhang, L.; Jia, C.; Bai, F.; Wang, W.; An, S.; Zhao, K.; Li, Z.; Li, J.; Sun, H. A Comprehensive Review of the Promising Clean Energy Carrier: Hydrogen Production, Transportation, Storage, and Utilization (HPTSU) Technologies. Fuel 2024, 355, 129455. [Google Scholar] [CrossRef]
- Nazir, H.; Muthuswamy, N.; Louis, C.; Jose, S.; Prakash, J.; Buan, M.E.M.; Flox, C.; Chavan, S.; Shi, X.; Kauranen, P.; et al. Is the H2 Economy Realizable in the Foreseeable Future? Part III: H2 Usage Technologies, Applications, and Challenges and Opportunities. Int. J. Hydrogen Energy 2020, 45, 28217–28239. [Google Scholar] [CrossRef] [PubMed]
- US DOE Target Explanation Document: Onboard Hydrogen Storage for Light-Duty Fuel Cell Vehicles. Available online: https://www.energy.gov/eere/fuelcells/doe-technical-targets-onboard-hydrogen-storage-light-duty-vehicles (accessed on 15 January 2024).
- Hirscher, M.; Yartys, V.A.; Baricco, M.; Bellosta von Colbe, J.; Blanchard, D.; Bowman, R.C.; Broom, D.P.; Buckley, C.E.; Chang, F.; Chen, P.; et al. Materials for hydrogen-based energy storage—Past, recent progress and future outlook. J. Alloys Compd. 2020, 827, 153548. [Google Scholar] [CrossRef]
- Muthukumar, P.; Kumar, A.; Afzal, M.; Bhogilla, S.; Sharma, P.; Parida, A.; Jana, S.; Kumar, E.A.; Pai, R.K.; Jain, I.P. Review on Large-Scale Hydrogen Storage Systems for Better Sustainability. Int. J. Hydrogen Energy 2023, 48, 33223–33259. [Google Scholar] [CrossRef]
- Moradi, R.; Groth, K.M. Hydrogen Storage and Delivery: Review of the State of the Art Technologies and Risk and Reliability Analysis. Int. J. Hydrogen Energy 2019, 44, 12254–12269. [Google Scholar] [CrossRef]
- Schlabach, L.; Zuttel, A. Hydrogen-Storage Materials for Mobile Applications. Nature 2001, 414, 353–358. [Google Scholar] [CrossRef] [PubMed]
- von Colbe, J.B.; Ares, J.-R.; Barale, J.; Baricco, M.; Buckley, C.; Capurso, G.; Gallandat, N.; Grant, D.M.; Guzik, M.N.; Jacob, I.; et al. Application of hydrides in hydrogen storage and compression: Achievements, outlook and perspectives. Int. J. Hydrogen Energy 2019, 44, 7780–7808. [Google Scholar] [CrossRef]
- Lin, H.-J.; Lu, Y.-S.; Zhang, L.-T.; Liu, H.-Z.; Edalati, K.; Révész, Á. Recent Advances in Metastable Alloys for Hydrogen Storage: A Review. Rare Met. 2022, 41, 1797–1817. [Google Scholar] [CrossRef]
- Drawer, C.; Lange, J.; Kaltschmitt, M. Metal Hydrides for Hydrogen Storage—Identification and Evaluation of Stationary and Transportation Applications. J. Energy Storage 2024, 77, 109988. [Google Scholar] [CrossRef]
- Klopčič, N.; Grimmer, I.; Winkler, F.; Sartory, M.; Trattner, A. A Review on Metal Hydride Materials for Hydrogen Storage. J. Energy Storage 2023, 72, 108456. [Google Scholar] [CrossRef]
- Crivello, J.-C.; Dam, B.; Denys, R.V.; Dornheim, M.; Grant, D.M.; Huot, J.; Jensen, T.R.; de Jongh, P.; Latroche, M.; Milanese, C.; et al. Review of Magnesium Hydride-Based Materials: Development and Optimisation. Appl. Phys. A 2016, 122, 97. [Google Scholar] [CrossRef]
- Li, Q.; Lu, Y.; Luo, Q.; Yang, X.; Yang, Y.; Tan, J.; Dong, Z.; Dang, J.; Li, J.; Chen, Y.; et al. Thermodynamics and Kinetics of Hydriding and Dehydriding Reactions in Mg-Based Hydrogen Storage Materials. J. Magnes. Alloys 2021, 9, 1922–1941. [Google Scholar] [CrossRef]
- Li, Q.; Peng, X.; Pan, F. Magnesium-Based Materials for Energy Conversion and Storage. J. Magnes. Alloys 2021, 9, 2223–2224. [Google Scholar] [CrossRef]
- Révész, Á.; Gajdics, M. Improved H-Storage Performance of Novel Mg-Based Nanocomposites Prepared by High-Energy Ball Milling: A Review. Energies 2021, 14, 6400. [Google Scholar] [CrossRef]
- Aguey-Zinsou, K.-F.; Ares-Fernández, J.-R. Hydrogen in Magnesium: New Perspectives toward Functional Stores. Energy Environ. Sci. 2010, 3, 526–543. [Google Scholar] [CrossRef]
- Pasquini, L. The Effects of Nanostructure on the Hydrogen Sorption Properties of Magnesium-Based Metallic Compounds: A Review. Crystals 2018, 8, 106. [Google Scholar] [CrossRef]
- Gupta, A.; Faisal, M. Magnesium Based Multi-Metallic Hybrids with Soot for Hydrogen Storage. Int. J. Hydrogen Energy 2024, 53, 93–104. [Google Scholar] [CrossRef]
- Zhu, M.; Lu, Y.; Ouyang, L.; Wang, H. Thermodynamic Tuning of Mg-Based Hydrogen Storage Alloys: A Review. Materials 2013, 6, 4654–4674. [Google Scholar] [CrossRef] [PubMed]
- Song, J.; She, J.; Chen, D.; Pan, F. Latest Research Advances on Magnesium and Magnesium Alloys Worldwide. J. Magnes. Alloys 2020, 8, 1–41. [Google Scholar] [CrossRef]
- Edalati, K.; Akiba, E.; Botta, W.J.; Estrin, Y.; Floriano, R.; Fruchart, D.; Grosdidier, T.; Horita, Z.; Huot, J.; Li, H.W.; et al. Impact of Severe Plastic Deformation on Kinetics and Thermodynamics of Hydrogen Storage in Magnesium and Its Alloys. J. Mater. Sci. Technol. 2023, 146, 221–239. [Google Scholar] [CrossRef]
- Edalati, K.; Bachmaier, A.; Beloshenko, V.A.; Beygelzimer, Y.; Blank, V.D.; Botta, W.J.; Bryła, K.; Čížek, J.; Divinski, S.; Enikeev, N.A.; et al. Nanomaterials by Severe Plastic Deformation: Review of Historical Developments and Recent Advances. Mater. Res. Lett. 2022, 10, 163–256. [Google Scholar] [CrossRef]
- Polanski, M.; Bystrzycki, J.; Plocinski, T. The effect of milling conditions on microstructure and hydrogen absorption/desorption properties of magnesium hydride (MgH2) without and with Cr2O3 nanoparticles. Int. J. Hydrogen Energy 2008, 33, 1859–1867. [Google Scholar] [CrossRef]
- Sadhasivam, T.; Kim, H.-T.; Jung, S.; Roh, S.-H.; Park, J.-H.; Jung, H.-Y. Dimensional effects of nanostructured Mg/MgH2 for hydrogen storage applications. Renew. Sustain. Energy Rev. 2017, 72, 523–534. [Google Scholar] [CrossRef]
- Fátay, D.; Spassov, T.; Delchev, P.; Ribárik, G.; Révész, Á. Microstructural development in nanocrystalline MgH2 during H-absorption/desorption cycling. Int. J. Hydrogen Energy 2007, 32, 2914–2919. [Google Scholar] [CrossRef]
- Suryanarayana, C. Mechanical alloying and milling. Prog. Mater. Sci. 2001, 46, 1–184. [Google Scholar] [CrossRef]
- Révész, Á.; Fátay, D. Microstructural evolution of ball-milled MgH2 during a complete dehydrogenation–hydrogenation cycle. J. Power Sources 2010, 195, 6997–7002. [Google Scholar] [CrossRef]
- Novakovic, J.G.; Novakovic, N.; Kurko, S.; Govedarovic, S.M.; Pantic, T.; Mamula, B.P.; Batalovic, K.; Radakovic, J.; Rmus, J.; Shelyapina, M.; et al. Influence of defects on the stability and hydrogen-sorption behavior of Mg-based hydrides. Chem. Phys. Chem. 2019, 20, 1216–1247. [Google Scholar] [CrossRef]
- Révész, Á.; Kánya, Z.; Verebélyi, T.; Szabó, P.J.; Zhilyaev, A.P.; Sapssov, T. The effect of high-pressure torsion on the microstructure and hydrogen absorption kinetics of ball-milled Mg70Ni30. J. Alloys Compd. 2010, 504, 83–88. [Google Scholar] [CrossRef]
- Yang, Y.; Zhang, X.; Zhang, L.; Zhang, W.; Liu, H.; Huang, Z.; Yang, L.; Gu, C.; Sun, W.; Gao, M.; et al. Recent Advances in Catalyst-Modified Mg-Based Hydrogen Storage Materials. J. Mater. Sci. Technol. 2023, 163, 182–211. [Google Scholar] [CrossRef]
- Shang, Y.; Pistidda, C.; Gizer, G.; Klassen, T.; Dornheim, M. Mg-Based Materials for Hydrogen Storage. J. Magnes. Alloys 2021, 9, 1837–1860. [Google Scholar] [CrossRef]
- Khan, D.; Zou, J.; Zeng, X.; Ding, W. Hydrogen storage properties of nanocrystalline Mg2Ni prepared from compressed 2MgH2–Ni powder. Int. J. Hydrogen Energy 2018, 43, 22391–22400. [Google Scholar] [CrossRef]
- Zhang, Q.; Zang, L.; Huang, Y.; Gao, P.; Jiao, L.; Yuan, H.; Wang, Y. Improved hydrogen storage properties of MgH2 with Ni-based compounds. Int. J. Hydrogen Energy 2017, 42, 24247–24255. [Google Scholar] [CrossRef]
- Révész, Á.; Gajdics, M.; Spassov, T. Microstructural evolution of ball-milled Mg–Ni powder during hydrogen sorption. Int. J. Hydrogen Energy 2013, 38, 8342–8349. [Google Scholar] [CrossRef]
- Antiqueira, F.J.; Leiva, D.R.; Zepon, G.; de Cunha, B.F.R.F.; Figueroa, S.J.A.; Botta, W.J. Fast Hydrogen Absorption/Desorption Kinetics in Reactive Milled Mg-8 Mol% Fe Nanocomposites. Int. J. Hydrogen Energy 2020, 45, 12408–12418. [Google Scholar] [CrossRef]
- Wan, H.; Fang, D.; Zhou, S.; Yang, X.; Dai, Y.; Ran, L.; Chen, Y.; Pan, F. Enhanced Dehydrogenation Properties and Mechanism Analysis of MgH2 Solid Solution Containing Fe Nano-Catalyst. Int. J. Hydrogen Energy 2023, 48, 34180–34191. [Google Scholar] [CrossRef]
- Song, M.; Zhang, L.; Yao, Z.; Zheng, J.; Shang, D.; Chen, L.; Li, H. Unraveling the Degradation Mechanism in Hydrogen Storage Property of Fe Nanocatalysts Modified MgH2. Inorg. Chem. Front. 2022, 9, 3874–3884. [Google Scholar] [CrossRef]
- Malahayati; Nurmalita; Ismail; Machmud, M.N.; Jalil, Z. Sorption Behavior of MgH2-Ti for Hydrogen Storage Material Prepared by High Pressure Milling. J. Phys. Conf. Ser. 2021, 1882, 012005. [Google Scholar] [CrossRef]
- Shahi, R.; Tiwari, A.; Shaz, M.; Srivastava, O.N. Studies on de/Rehydrogenation Characteristics of Nanocrystalline MgH2 Co-Catalyzed with Ti, Fe and Ni. Int. J. Hydrogen Energy 2013, 38, 2778–2784. [Google Scholar] [CrossRef]
- Yun, H.; Wang, H.; Bai, J.; Wang, X.; Dai, X.; Hou, X.; Xu, Y. Activation and Hydrogen Storage Properties of Mg-Based Composites Synthesized by Catalytic Mechanochemical Hydrogenation Strategy. Int. J. Hydrogen Energy 2024, 50, 1025–1039. [Google Scholar] [CrossRef]
- Barkhordarian, G.; Klassen, T.; Bormann, R. Fast hydrogen sorption kinetics of nanocrystalline Mg using Nb2O5 as catalyst. Scr. Mater. 2003, 49, 213–217. [Google Scholar] [CrossRef]
- Gajdics, M.; Spassov, T.; Kis, V.K.; Schafler, E.; Révész, Á. Microstructural and Morphological Investigations on Mg-Nb2O5-CNT Nanocomposites Processed by High-Pressure Torsion for Hydrogen Storage Applications. Int. J. Hydrogen Energy 2020, 45, 7917–7928. [Google Scholar] [CrossRef]
- Song, M.Y.; Kwon, I.H.; Kwon, S.N.; Park, C.G.; Park, H.R.; Bae, J.-S. Preparation of hydrogen-storage alloy Mg–10wt% Fe2O3 under various milling conditions. Int. J. Hydrogen Energy 2006, 31, 43–47. [Google Scholar] [CrossRef]
- Campos, R.B.V.; Camargo, S.A.S., Jr.; Brum, M.C.; Dos Santos, D.S. Hydrogen uptake enhancement by the use of a magnesium hydride and carbon nanotubes mixture. Mater. Res. 2017, 20, 85–88. [Google Scholar] [CrossRef]
- Varin, R.; Zaranski, Z.; Czujko, T.; Polanski, M.; Wronski, Z. The Composites of Magnesium Hydride and Iron-Titanium Intermetallic. Int. J. Hydrogen Energy 2011, 36, 1177. [Google Scholar] [CrossRef]
- Guoxian, L.; Erde, W.; Shoushi, F. Hydrogen absorption and desorption characteristics of mechanically milled Mg-35wt.% FeTi1.2 powders. J. Alloys Compd. 1995, 223, 111–114. [Google Scholar] [CrossRef]
- Lu, X.; Zhang, L.; Yu, H.; Lu, Z.; He, J.; Zheng, J.; Wu, F.; Chen, L. Achieving Superior Hydrogen Storage Properties of MgH2 by the Effect of TiFe and Carbon Nanotubes. Chem. Eng. J. 2021, 422, 130101. [Google Scholar] [CrossRef]
- Vijay, R.; Sundaresan, R.; Maiya, M.P.; Murthy, S.; Fu, Y.; Klein, H.-P.; Groll, M. Characterisation of Mg–x Wt.% FeTi (x = 5–30) and Mg–40wt.% FeTiMn Hydrogen Absorbing Materials Prepared by Mechanical Alloying. J. Alloys Compd. 2004, 384, 283–295. [Google Scholar] [CrossRef]
- Révész, Á.; Paramonov, R.; Spassov, T.; Gajdics, M. Microstructure and Hydrogen Storage Performance of Ball-Milled MgH2 Catalyzed by FeTi. Energies 2023, 16, 1061. [Google Scholar] [CrossRef]
- Kondo, T.; Shindo, K.; Sakurai, Y. Dependence of hydrogen storage characteristics of Mg–TiFe0.92Mn0.08 composite on amount of TiFe0.92Mn0.08. J. Alloys Compd. 2005, 404, 511–514. [Google Scholar] [CrossRef]
- Neto, R.M.L.; de Araújo Silva, R.; Floriano, R.; Coutinho, G.C.S.; Falcão, R.B.; Leiva, D.R.; Botta Filho, W.J. Synthesis by High-Energy Ball Milling of MgH2-TiFe Composites for Hydrogen Storage. Mater. Sci. Forum 2017, 899, 13–18. [Google Scholar] [CrossRef]
- Silva, R.; Lean Neto, R.L.; Leiva, D.R.; Ishikawa; Kiminami, C.S.; Jorge, A.M., Jr.; Botta, W.J. Room temperature hydrogen absorption by Mg and Mg TiFe nanocomposites processed by high-energy ball milling. Int. J. Hydrogen Energy 2018, 43, 12251–12259. [Google Scholar] [CrossRef]
- Liu, H.; Zhang, J.; Sun, P.; Zhou, C.; Liu, Y.; Fang, Z.Z. An Overview of TiFe Alloys for Hydrogen Storage: Structure, Processes, Properties, and Applications. J. Energy Storage 2023, 68, 107772. [Google Scholar] [CrossRef]
- Shang, H.; Sheng, P.; Li, J.; Zhang, W.; Zhang, X.; Guo, S.; Li, Y.; Zhang, Y. Characteristics of Hydrogen Storage of As-Milled TiFe-Based Alloys. Int. J. Hydrogen Energy 2023, 50, 190–200. [Google Scholar] [CrossRef]
- Falcão, R.B.; Dammann, E.D.; Rocha, C.J.; Durazzo, M.; Ichikawa, R.U.; Martinez, L.G.; Botta, W.J.; Neto, R.M.L. An alternative route to produce easily activated nanocrystalline TiFe powder. Int. J. Hydrogen Energy 2018, 43, 16107–16116. [Google Scholar] [CrossRef]
- Edalati, K.; Matsuda, J.; Arita, M.; Daio, T.; Akiba, E.; Horita, Z. Mechanism of activation of TiFe intermetallics for hydrogen storage by severe plastic deformation using high-pressure torsion. Appl. Phys. Lett. 2013, 103, 143902. [Google Scholar] [CrossRef]
- Oliveira, V.B.; Beatrice, C.A.G.; Neto, R.M.L.; Silva, W.B.; Pessan, L.A.; Botta, W.J.; Leiva, D.R. Hydrogen Absorption/Desorption Behavior of a Cold-Rolled TiFe Intermetallic Compound. Mater. Res. 2021, 24, e20210204. [Google Scholar] [CrossRef]
- Edalati, K.; Matsuda, J.; Yanagida, A.; Akiba, E.; Horita, Z. Activation of TiFe for hydrogen storage by plastic deformation using groove rolling and high-pressure torsion: Similarities and differences. Int. J. Hydrogen Energy 2014, 39, 15589–15594. [Google Scholar] [CrossRef]
- Sandrock, G.; Suda, S.; Schlapbach, L. Applications. In Hydrogen in Intermetallic Compunds II; Topics in Applied Physics; Schlapbach, L., Ed.; Springer: Berlin/Heidelberg, Germany, 1992; Volume 67, pp. 197–258. [Google Scholar] [CrossRef]
- Guinet, P.; Perroud, P.; Rebiere, J. Technological aspects and characteristics of industrial hydride reservoirs. Int. J. Hydrogen Energy 1980, 5, 609–618. [Google Scholar] [CrossRef]
- Fruchart, D.; Jehan, M.; Skryabina, N.; de Rango, P. Hydrogen Solid State Storage on MgH2 Compacts for Mass Applications. Metals 2023, 13, 992. [Google Scholar] [CrossRef]
- Gajdics, M.; Spassov, T.; Kovács Kis, V.; Béke, F.; Novák, Z.; Schafler, E.; Révész, Á. Microstructural Investigation of Nanocrystalline Hydrogen-Storing Mg-Titanate Nanotube Composites Processed by High-Pressure Torsion. Energies 2020, 13, 563. [Google Scholar] [CrossRef]
- Ribárik, G.; Jóni, B.; Ungár, T. Global optimum of microstructure parameters in the CMWP line-profile-analysis method by combining Marquardt-Levenberg and Monte-Carlo procedures. J. Mater. Sci. Technol. 2019, 35, 1508–1514. [Google Scholar] [CrossRef]
- Ribárik, G.; Gubicza, J.; Ungár, T. Correlation between strength and microstructure of ball-milled Al–Mg alloys determined by X-ray diffraction. Mater. Sci. Eng. A 2004, 387, 343–347. [Google Scholar] [CrossRef]
- Révész, Á.; Spassov, T.; Kis, V.; Schafler, E.; Gajdics, M. The Influence of Preparation Conditions on the Hydrogen Sorption of Mg-Nb2O5-CNT Produced by Ball Milling and Subsequent High-Pressure Torsion. J. Nanosci. Nanotechnol. 2020, 20, 4587–4590. [Google Scholar] [CrossRef] [PubMed]
- Haraki, T.; Oishi, K.; Uchida, H.; Miyamoto, Y.; Abe, M.; Kokaji, T.; Uchida, S. Properties of Hydrogen Absorption by Nano-Structured FeTi Alloys. Int. J. Mater. Res. 2008, 99, 507–512. [Google Scholar] [CrossRef]
- Christian, J.W. The Theory of Transformations in Metals and Alloys; Pergamon: Oxford, UK, 1975. [Google Scholar]

Disclaimer/Publisher’s Note: The statements, opinions and data contained in all publications are solely those of the individual author(s) and contributor(s) and not of MDPI and/or the editor(s). MDPI and/or the editor(s) disclaim responsibility for any injury to people or property resulting from any ideas, methods, instructions or products referred to in the content. |
© 2024 by the authors. Licensee MDPI, Basel, Switzerland. This article is an open access article distributed under the terms and conditions of the Creative Commons Attribution (CC BY) license (https://creativecommons.org/licenses/by/4.0/).