Article

Energy Transition: Semi-Automatic BIM Tool Approach for Elevating Sustainability in the Maputo Natural History Museum

Department of Astronautical, Electrical and Energy Engineering (DIAEE), Sapienza University of Rome, 00184 Roma, Italy
*
Author to whom correspondence should be addressed.
Energies 2024, 17(4), 775; https://doi.org/10.3390/en17040775
Submission received: 25 December 2023 / Revised: 27 January 2024 / Accepted: 2 February 2024 / Published: 6 February 2024
(This article belongs to the Section B: Energy and Environment)

Abstract

:
Mozambique is experiencing the consequences of a severe energy crisis with economic and social impacts. Its strict dependence on hydroelectric sources is being severely tested by recent droughts that have drastically reduced water levels in dams. However, Mozambique is addressing energy poverty by exploring renewable energy sources thanks to investments in the sector by the European Union. The research concerns an energy analysis profile of the country and the penetration of renewable energy, presenting an energy upgrading scope through a semi-automatic calculation methodology in a Building Information Modeling (BIM) environment. The building under study, located in Maputo, is the Natural History Museum, which plays an important role in biodiversity conservation. Therefore, this paper proposes a BIM methodology for sizing an environmental control system tailored to serve the museum. The proposed system replaces the previous one and includes a photovoltaic system that not only meets the museum’s load but also supplies electricity to the surrounding area. Energy production from renewable sources with a surplus of 30% has been achieved. The proposed digital methodology has identified a maximum gap of 1.5% between the dimensions of the BIM duct and those of a traditional plant design, meeting ASHRAE requirements for environmental control.

1. Introduction

Mozambique, like other countries in southeastern Africa, is facing an energy crisis that has a significant impact on the economy and population [1]. The country’s needs rely on hydropower plants to generate electricity [2], but recent droughts [3] have led to reduced water levels in dams, which, in turn, cause power shortages. The situation has been exacerbated by natural disasters such as Cyclone Idai and Cyclone Kenneth [4], which have damaged energy infrastructure and further reduced the country’s electricity supply. Moreover, the energy crisis is exacerbated by a combination of factors, including population growth, urbanization, and increased industrialization, which have led to a surge in energy demand.
The energy crisis in Mozambique is having far-reaching consequences. Many companies have had to reduce working hours or close down altogether due to the lack of electricity. This has led to job losses and reduced economic growth. In addition, schools and hospitals are struggling to provide essential services due to the lack of reliable electricity. To address the energy crisis, Mozambique is exploring alternative energy sources such as solar, wind, and natural gas [5].
The country has significant potential for solar and wind energy due to the abundance of sunshine that characterizes the African climate context [6]. Mozambique has also recently discovered significant natural gas reserves off its coast [7], which could potentially provide a reliable source of energy in the future. However, the development of these alternative energy sources presents the following challenges:
-
The initial investment required for solar and wind power can be significant, and Mozambique may not have the financial resources to invest in these technologies on a large scale;
-
Natural gas extraction can be expensive and have negative environmental impacts if not managed properly.
Despite these challenges, Mozambique needs to find a solution to address its energy challenge if it is to achieve its economic and social development goals. Investing in renewable energy sources and improving energy infrastructure will not only provide a more reliable source of electricity but will also have long-term environmental and economic benefits. The international community has an important role to play in supporting Mozambique’s efforts to achieve sustainable development.
The European Union (EU) is actively involved in supporting Mozambique by providing financial assistance through programs such as SE4All [8]. It also contributes technical assistance and expertise to help the country develop its renewable energy sector. For example, to develop Mozambique’s National Energy Strategy, the EU supported the development of a renewable energy law that would help attract private investment in the sector (EFSD+) [9]. Investment in renewable energy will also create jobs by stimulating economic growth and increasing the security of available energy, reducing Mozambique’s dependence on fossil fuel imports. In addition, renewable energy can provide access to electricity to currently unserved rural communities, thereby contributing to poverty reduction and social development.
According to Farula et al. [10], a transition to renewable energy sources is essential for achieving a sustainable society by 2050. Buildings can be utilized as a potential source of energy flexibility because the use of these sources can affect the stability of existing electricity grids. M. Kong et al. [11] proposed the use of building energy payback time (BD-EPBT) as an indicator to assess the energy transition of buildings with renewable energy systems. It is concluded that current policies are insufficient, and it is essential to reduce the overall energy consumption and facilitate the installation of renewable energy systems. X. Yang et al. [12] presented a dynamic model for constructing life cycle analyses that connects dynamic material flow analyses with building energy modeling. This highlights that the potential substitution of 80% of electricity from the public grid for appliances and lighting is possible by installing photovoltaic systems on the roofs of 50% of renovated buildings and all new constructions.
The literature review reveals a clear lack of benchmarks for the adoption of BIM strategies and methodologies to assess the impact of energy redevelopment (and the use of renewable energy) in countries experiencing deep energy poverty, but it is even more difficult to find studies that address the different aspects of energy redevelopment simultaneously. This paper attempts to contribute to filling in this gap by conducting the following:
-
Introducing a framework that implements a semi-automated BIM methodology for the energy retrofitting of existing buildings;
-
Simulating renewable energy systems from an energy district perspective;
-
Providing a tool that addresses the different aspects related to the digitization of the built environment.

1.1. Southeastern African Climate

Maputo, the capital of Mozambique, has a tropical Savanna climate. The city is located on the coast of the Indian Ocean and is influenced by warm currents from the Mozambique Channel [13]. The climate is characterized by two distinct seasons, a wet season and a dry season (Figure 1a):
-
The wet season runs from October to March, with the peak rainfall occurring between January and March. During this period, the city is subject to heavy rain and thunderstorms. The average monthly rainfall during the wet season ranges from 100 mm in October to 200 mm in January (Figure 1b). Heavy rainfall during this period can cause flooding, which can cause damage to infrastructure and disrupt transportation.
-
The dry season runs from April to September. In this time, the city experiences little or no precipitation. The average monthly rainfall during the dry season is less than 20 mm. The dry season is characterized by warm and sunny days, with average temperatures ranging from 25 °C to 30 °C.
The country’s location near the coast means that the city experiences high levels of humidity throughout the year, with relative humidity ranging from 60% to 80%(Figure 2). The city is also subject to strong winds, especially during the dry season. These winds can cause dust storms and make the weather seem much warmer than the actual temperature (Figure 1c).
Climate change is expected to have a significant impact on Maputo’s environment in the coming decades [14]. Rising temperatures, changes in rainfall patterns (Figure 1d), and rising sea levels are forecasted to exacerbate the city’s current vulnerabilities to flooding, coastal erosion and extreme weather events. Adaptation measures, such as improved drainage systems, coastal protection, and early warning systems for floods and storms, will be critical to the city’s resilience in the face of climate change [15,16].
Figure 1. (a) Monthly temperature trends; (b) Monthly precipitation and min–max temperature trends; (c) Monthly wind analysis; (d) Rainfall trends in recent decades. Source: Copernicus [17].
Energies 17 00775 g001
Figure 2. Monthly moisture trends. Source: Copernicus.
Energies 17 00775 g002
However, with the growing awareness of the negative impact of fossil fuels on the environment and the need to switch to renewable energy sources, there has been a growing interest in renewable energy in Maputo.
Tackling energy poverty requires investment in the energy sector, particularly in decentralized and off-grid solutions, as well as policies and strategies that promote renewable energy and energy efficiency. R. J. Chilundo suggested a photovoltaic water pumping system (PVWPS) to increase access to energy for irrigating horticultural crops, because 80% of the population depends on agriculture, but only 5% of the cultivated area is irrigated. The work showed that it is also possible to obtain an energy surplus dependent on the dynamism of water demand, which can possibly be redirected to cover electrical needs [18]. Thus, ensuring access to modern energy services for all citizens is essential to achieve sustainable development and improve the quality of life for all citizens [19].

1.2. Penetration of Renewable Energy

In recent years, efforts have been made to increase the penetration of renewable energy in Maputo. One of the key factors in this trend has been the Mozambican government’s commitment to promote renewable energy as a means of achieving sustainable development goals. The government has set a target of achieving a 50% renewable energy penetration by 2030, which has led to the implementation of several policies and initiatives to promote renewable energy development in the country [20].
Renewable energy planning in Maputo can be assessed based on several factors, including the availability of renewable energy resources, the capacity and infrastructure for energy generation and distribution, the level of investment in dedicated projects, and the adoption of renewable energy-powered technologies by households and businesses [21]. In these terms, the country has significant potential for solar power generation. Its location near the equator allows it to receive high levels of solar radiation throughout the year. However, the development of renewable energy infrastructure is slow and significant investments are needed to fully exploit these resources.
The current utilization of renewable energy in Maputo is relatively low. In fact, according to Mozambique’s Ministry of Energy and Mineral Resources, only 4% of the country’s energy mix comes from renewable sources [22]. As illustrated in Table 1 and Table 2, the report includes sources such as hydropower, solar, wind, and biomass. Most of the energy is still derived from fossil fuels, such as coal, oil, and gas.
In spite of these statistics, Maputo’s geographical location provides it an important energy potential from solar and wind sources [19].

1.3. Description of Upgrading Project

This is the backdrop for the Maputo Natural History Museum’s energy upgrading project, which is part of the “Recursos, Inovação e Desenvolvimento para as áreas de conservação—RINO” program funded by the Italian Agency for Development Cooperation [23]. The objective of the intervention is to improve the thermo-hygrometric comfort of users, indoor air quality, and proper conservation of museum artifacts through the accurate and specific ventilation of the same. Air quality, humidity, and ventilation control is planned through an outdoor all-air system involving the installation of an Air Handling Unit (AHU) on the roof powered by a Heat Pump and extraction towers (Figure 3).
The distribution of the mechanical equipment consists of a system of ducts passing through the ceiling using appropriately oriented diffusers that will feed air with certain characteristics into the exhibition rooms. In addition, autonomous split systems capable of regulating appropriate temperature values will be installed for the proper preservation of the cultural goods inside the museum’s storage rooms.
In order to ensure the proper functioning of the entire air conditioning and air exchange system, a dedicated electrical panel will be installed, which includes the redoing of the entire existing electrical cable distribution. Obviously, being in a context where continuous access to electricity is not guaranteed, it is a forced decision to install a photovoltaic system capable of meeting the energy needs of the museum complex and if possible, of the neighboring buildings.

2. Materials and Methods

The Maputo Natural History Museum (MMNH) is an important institution for the study and conservation of biodiversity in Mozambique. Its collections provide valuable information on the region’s fauna and flora, and its educational programs and guided tours help to increase public awareness and understanding of the natural world. The museum’s collections include specimens of mammals, birds, reptiles, fish, insects, and plants, many of which are unique to Mozambique and the surrounding region.
These collections are essential to the study of species diversity, distribution, and ecology and provide important baseline data for monitoring changes in the environment and the impact of human activities on biodiversity [24].
One of the museum’s most impressive exhibits is the 14 m long humpback whale skeleton, which serves as a reminder of the importance of marine ecosystems and the need for conservation efforts to protect these habitats. The live snake exhibit offers visitors the opportunity to see some of the country’s most fascinating reptiles up close, while the reproduction of a dinosaur egg nest offers a glimpse into Mozambique’s prehistoric past.
In addition to its collections and exhibits, the museum plays a crucial role in research and conservation efforts in Mozambique. Its staff work closely with local communities and conservation organizations to identify and address threats to biodiversity and to develop strategies for sustainable resource management and conservation.
Overall, the Maputo Museum of Natural History is a valuable resource for scientists, educators, and the public, and is an important institution for promoting the conservation and sustainable use of biodiversity in Mozambique and elsewhere. The museum is housed in a historic building constructed in the early 1900s as the headquarters of the Portuguese colonial administration in Mozambique.
The building was later used as a military hospital and barracks before being converted into a museum in 1960. To date, thanks to the “RINO” program described above [20], the building is undergoing energy upgrading that can both improve its environmental performance and optimize its asset conservation through an ad hoc air control setting.

2.1. Calculation Methodology

Indoor air quality (IAQ) refers to the indoor air that is breathed in confined environments, such as dwellings and public and private offices [25,26].
Industrial-type environments do not fall under the definition of confined environments because the indoor air quality is closely related to the type of production activity carried out and is subject to specific elective controls.
Indoor air comes from the outdoor atmospheric air and enters the confined spaces through ventilation (natural and/or artificial). In enclosed or semi-enclosed environments, oxygen in the (indoor) air is gradually consumed, while through human respiration and transpiration certain components are introduced into the air, including the following:
-
Water vapor;
-
Carbon dioxide (CO2);
-
Various organic substances.
In the absence of appropriate ventilation, the indoor air quality tends to be altered as a result of the presence and accumulation of pollutants: substances with characteristics that change the normal composition or physical state of the air and alter its healthfulness [27,28]. With ventilation, it is possible to renew the stale air of a room, replacing it with cleaner air and diluting the concentration of harmful substances produced by internal sources; it is also possible to eliminate excess water vapor. Room ventilation thus plays an important role in ensuring good indoor air quality, and relative humidity (or hygrometric degree) provides useful indications of the ventilation of a room [29].
In buildings characterized by natural ventilation, outside air penetrates through existing openings in the building envelope, such as joints or cracks in walls, gaps around window frames (infiltration), and through the opening of doors and windows. Outside air can be introduced into an enclosed space through mechanical (or forced) ventilation systems that can also perform the function of heating or cooling the indoor air, depending on the season (thermal ventilation systems [30]).
Air in civilian confined spaces should have a content of contaminants of biological, physical, and chemical origin that is sufficiently low and such that there is negligible risk to the health and safety of occupants from the point of view of perception.
Currently, the ASHRAE (2013a) definition prevails, which considers indoor air quality to be acceptable when it contains no known contaminants in harmful concentrations and for which a substantial majority of those exposed (80% or more) do not express dissatisfaction [31].
Comfort conditions are represented by the set of physical and environmental parameters that lead to human well-being. Thermohydrometric wellness is defined as per regulations: the mental condition of thermal satisfaction with respect to the microclimate, understood as the complex of climatic parameters of a confined environment capable of influencing thermal exchanges between the subject and the environment [32].
The design of plant systems aims to achieve comfort conditions. The feeling of comfort differs from subject to subject and depends on factors such as metabolism, temperature, clothing, age, and the activity being performed. Some are measurable environmental parameters, and some are personal factors that cannot be quantified.
Despite the large number of parameters that can influence it, the basis of the thermal sensation of the human body is the temperature of the internal organs, which in healthy individuals is around 37 °C, with a variation of about half a degree centigrade.
In fact, given the need to maintain a constant internal temperature, the hypothalamus activates the thermoregulation system, which is essentially of two types: vasomotor and behavioral [33,34].
Depending on the hot or cold environment, the hypothalamus performs the dilation or constriction of blood vessels to increase or decrease blood flow to the periphery. If this is not enough, the hypothalamus will switch to behavioral thermoregulation: sweating and reduced physical activity or shivering and huddled body position.
The human body is a thermodynamic system that exchanges heat and work with the external environment.
The following equation describes the heat balance between the human body and the environment:
S = M − W − E − Cresp − (R + C),
where
-
“S” is the change in the internal energy of the human body in a unit of time (potence acquired or surrendered);
-
“M” is the power generated through metabolic activity;
-
“W” is the mechanical power exchanged between the human body and the environment;
-
“E” is the heat power lost via evaporation through the skin;
-
“Cresp” is the heat power transferred to the environment in respiration as sensible heat;
-
“C” is the heat power exchanged via convection;
-
“R” is the heat power exchanged via radiation.
From the brief analysis of the different terms of the heat balance on the human body, the following four physical parameters of the environment contribute to the determination of the thermal state of the human body:
-
Air temperature, “Ta”;
-
Air velocity, “va”;
-
Mean radiant temperature, “Tmr”;
-
Hygrometric degree or relative humidity, Φ;
and two quantities related to the subject are as follows:
-
Activity performed, i.e., energy metabolism, “M”;
-
Clothing thermal resistance, “Icl”.
The set of these six variables is generally called the thermal environment. The liking of environmental conditions can be expressed by the average value of a rating carried out on a sample of people and based on a thermal sensation scale.
Based on statistical analysis and experiments, it was possible to identify the expression of the PMV (Predicted Mean Vote) index, which is an index for assessing an individual’s state of well-being and takes into account subjective and environmental variables [35,36]:
PMV = (0.303 × e−0.036M + 0.028) × [(M − W − E − Cresp − (R + C)]
The PMV index is based on the sensation of hot and cold experienced by an individual proportional to the difference between the proportion of energy generated within the human body that is dissipated into the environment as heat energy, and the heat energy that the individual would dissipate if they were in a heat-neutral condition. This is an average value and therefore implies individual variability.
In many circumstances, it may be more useful, for the purpose of guiding design and management choices, to know the percentage of dissatisfaction associated with a given environmental condition. Based on experiments conducted, the relationship linking the Predicted Percentage of Dissatisfied (PPD) to the mean predicted PMV grade was identified [37,38] to be as follows:
PPD = 100 − 95 × e − (0.03353 PMV4 + 0.2179 PMV2)
A dissatisfied person is defined as a person who, while staying in a given environment, expresses a sensation rating and a thermal sensation rating of ±2 or more (hot, very hot, cold, very cold). The PMV and PPD indices express thermal comfort for the human body as a whole. However, thermal dissatisfaction can also be caused by thermal discomfort of one part of the body. The main causes that cause local discomfort are as follows:
-
Vertical temperature gradients.
-
Excessively high or low temperature floors.
-
Radiant temperature asymmetries.
-
Air currents.
To ensure the right level of indoor air quality, alongside interventions to contain emissions or remove pollutants at the source, it is necessary to proceed with dilution interventions carried out by ventilating the rooms themselves with outside air.
The introduction of outside air into the building may be achieved by means of openings in the building itself that let air in and out naturally (natural ventilation), or by means of plant systems that force air in or out (mechanical ventilation or forced ventilation); it may also be achieved by appropriately integrating natural and mechanical ventilation modes (hybrid ventilation).
The calculation of the outdoor air flow rate required [39] to dilute pollutants and ensure proper air quality can be performed in two ways:
-
The indoor air quality procedure involves determining the air flow rate as a function of the concentration of pollutants inside the room; this procedure, referred to as a performance method, indicates what the acceptable levels of pollutants are and does not refer to air treatments.
-
The ventilation rate procedure suggests an air volume flow rate as a function of the intended use of the rooms and a destination-specific pollution indicator (people, in most cases, or surface area or volume); the UNI 10339 standard, currently in force, refers to this calculation methodology, which is also referred to as a prescriptive method [40].
While the performance approach makes it possible to simulate more accurately the conditions of a hypothetical environment, it also presents difficulties and indeterminacies that often complicate its application; pollutants are not always easily identifiable or are produced uniformly and consistently in the environment, and often, not all of the outdoor air introduced participates in the complete dilution of these substances.
It should be remembered that the resulting values of the prescriptive calculation represent minimum values, below which they are not allowed to fall, and that, in general, the flow rates calculated by the performance method are higher than those calculated by the prescriptive method, any value in between the two calculated values may be chosen.
The prescriptive method was used to calculate the ventilation air flow rate for the building under study. The prescriptive calculation method requires certain constraints to be met regarding air flow rate, filtration, and air movement. Depending on the intended use, the outdoor air flow rate must be greater than or equal to the established minimum value related to the number of people and the floor area or volume of the room.
For some rooms, it is stipulated that there should be air extraction and not air intake, in order to maintain such rooms in depression compared to neighboring rooms. The minimum air flow rate established, depending on the indications, will therefore be obtained using the following equation:
(qae = qae,p × np) − (qae = qae,A × A) − (qae = qae,V × V),
where
-
qae,p is the air flow rate per person;
-
np is the number of people, calculated from the crowding index;
-
qae,A is the air flow rate per unit area;
-
A is the floor area of the room;
-
V is the volume of the room;
-
qae,V is the air flow rate per unit volume.
The mass flow rate of air, making the necessary unit conversions and considering the volume mass (r) of air, is expressed as follows:
Gae = qae × r
No building is completely impermeable to outside air. Due to pressure differences between the inside and the outside, there is always infiltration of outside air through openings, even through small ones in the building envelope such as the following:
-
Joints in the building envelope.
-
Holes or cracks in walls for the passage of systems.
-
Openings to cavities.
-
Poorly sealed fixtures.
The air mass flow rate can be estimated as a first approximation by assuming a number of hourly changes using an infiltration equal to 0.5 h−1 for buildings such as old fixtures, as in the case under study.
Recalling that the number n of hourly changes represents the ratio of the volume of air renewed in one hour to the volume of the room under consideration, the infiltration mass flow rate can be calculated with the following expression:
Ginf = n × V/3600 × r
where r is the density of air, equal to 1.2 kg/m3.
For the proper distribution of a fluid through a conduit, it is necessary to determine the size of the conduit and the characteristics of the equipment required to establish the motion of the fluid. The input data for such sizing are the flow rate of air or water that must flow through a generic duct section.
Q = v × A
With the same flow rate to be distributed, the relationship shows that duct section A is inversely proportional to the fluid velocity v and vice versa. The design of an adequate distribution network consists of the following four steps:
-
Determine the geometry of the network and its place in the building.
-
Determine the flow rate for each circuit section with respect to the proper distribution of the flow rate in the different rooms.
-
Determine the size of the section in each section.
-
Choose the circulation fan.
To determine the geometry of the distribution network and its position in the building, it is necessary to create a single-line diagram in such a way that the actual physical positions of the main elements inside and outside the rooms are highlighted.

2.2. Semi-Automatic BIM Methodology

The relentless advance of technology continues to drive change and innovation in the construction industry. The increasing digitization of this sector offers the opportunity to completely revolutionize the design and management of construction through advanced digital methods and tools [41]. BIM within Architecture, Engineering, Construction, and Operations (AECO) has been developing since the early 2000s and is considered a key technology for the development of the industry [41].
Recently, BIM has achieved increasing relevance in architectural design practices worldwide, providing a digital platform for information sharing [42]. This platform facilitates both the automatic extraction of parameters and the exchange of data between the modeling software and the simulation software. The use of BIM saves designers from the laborious task of manually entering parameters and converting data formats, thus improving the automation of, for example, HVAC design calculations [43].
Odeh et al. [44] explored some of the practical issues that arise while importing BIM model data into a building energy modeling (BEM) tool. They concluded that gbXML may not capture all the essential data required for building energy analyses. The need to make the AECO sector more environmentally friendly makes it necessary to increase efficiency through modern construction methods (MMCs) using advanced off-site prefabrication systems associated with BIM [45,46]. These technologies allow the digitization of the entire construction process, providing better control over the entire product lifecycle [47]. These modern approaches make it possible to plan construction more efficiently and reduce the time required for on-site installations. This also contributes to minimizing the impact on the daily lives of the building’s occupants. The aim is to achieve a leaner, more sustainable, and less invasive construction process. Xu F. et al. [48] used BIM as an integral part of building an energy consumption optimization model. The research by Maauane et al. [49] used the sequential search optimization technique together with BIM to improve the energy performance of prototype buildings in different climate zones in North Africa. The approach proposes a new code for the building sector, taking into account different climate zones and building types.
The use of BIM as an advanced information management methodology has been rapidly adopted and has become a key cornerstone in the design, construction, and maintenance of buildings [50,51]. Its progressive adoption has been driven by its ability to integrate with emerging technologies such as augmented or virtual reality, implementation with IoT devices, and Geographic Information System (GIS) systems [52,53,54].
In agreement with Munoz-La Rivera et al. [55], the current shortcomings in structural engineering companies (SECs) that hinder their processes and interactions, reduce productivity, and lack collaborative and interconnected processes have been identified. Bentelli et al. [56] reviewed the literature on BIM and the role of embedded carbon in early designs, with the aim of informing practice and policy for decarbonization through BIM to achieve wider environmental goals.
For this purpose, Autodesk Revit BIM software [57] was used to automate the design calculations, and Microsoft Excel [58] was used to verify and compare the methodology for the created conduit sections. This method is described below.
The building under consideration currently lacks any ventilation systems or technical designs from the year of construction [59].
The air conditioning system interventions consist of the following installations: an Air Handling Unit, a Heat Pump, a split system, aeraulic distribution channels, pipes for connecting the Heat Pump and Air Treatment Unit, and extraction towers.
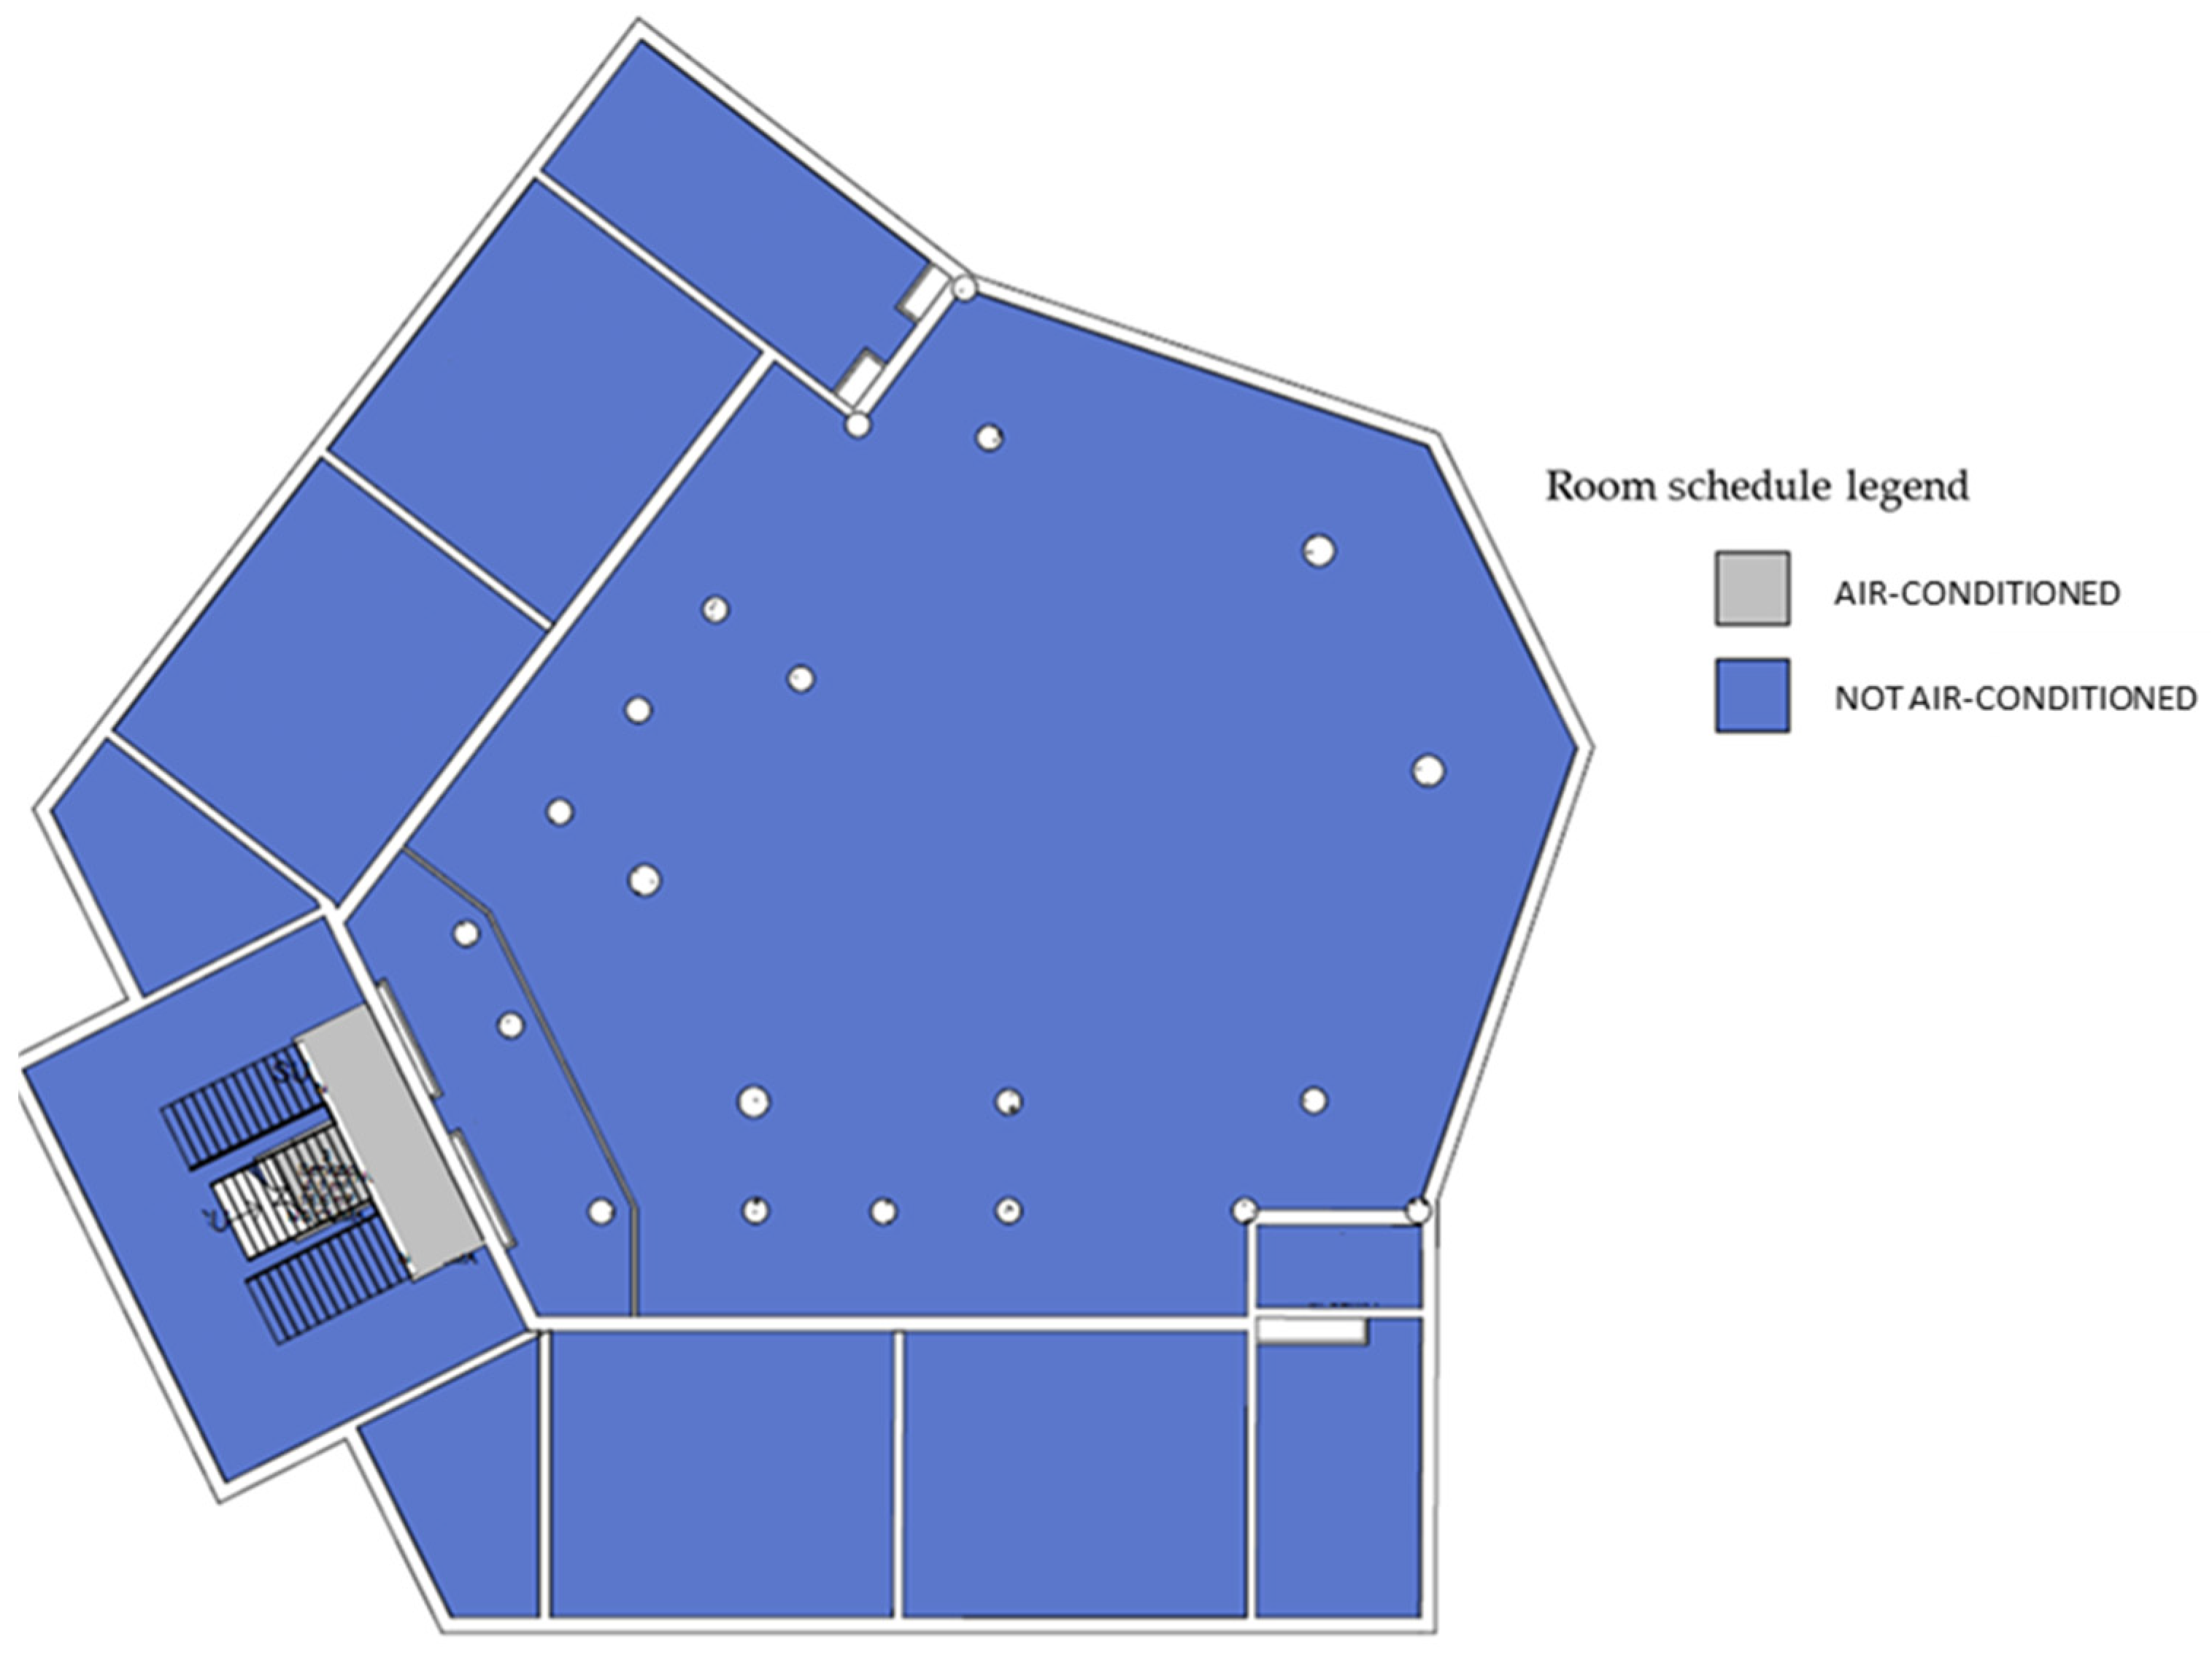
In order to calculate and design the air conditioning system for the museum, it is necessary to know the spaces inside, their altitude, and their specific dimensions, such as surface area, height, and net volume, which divides them according to whether they need to be air-conditioned or not (Table 3, Figure 4).
The section dimensions were calculated using Autodesk Revit, which adheres to the international ASHRAE parameters and confirmed with Equation (7) in Excel. The software’s appropriate usage steps are outlined as follows:
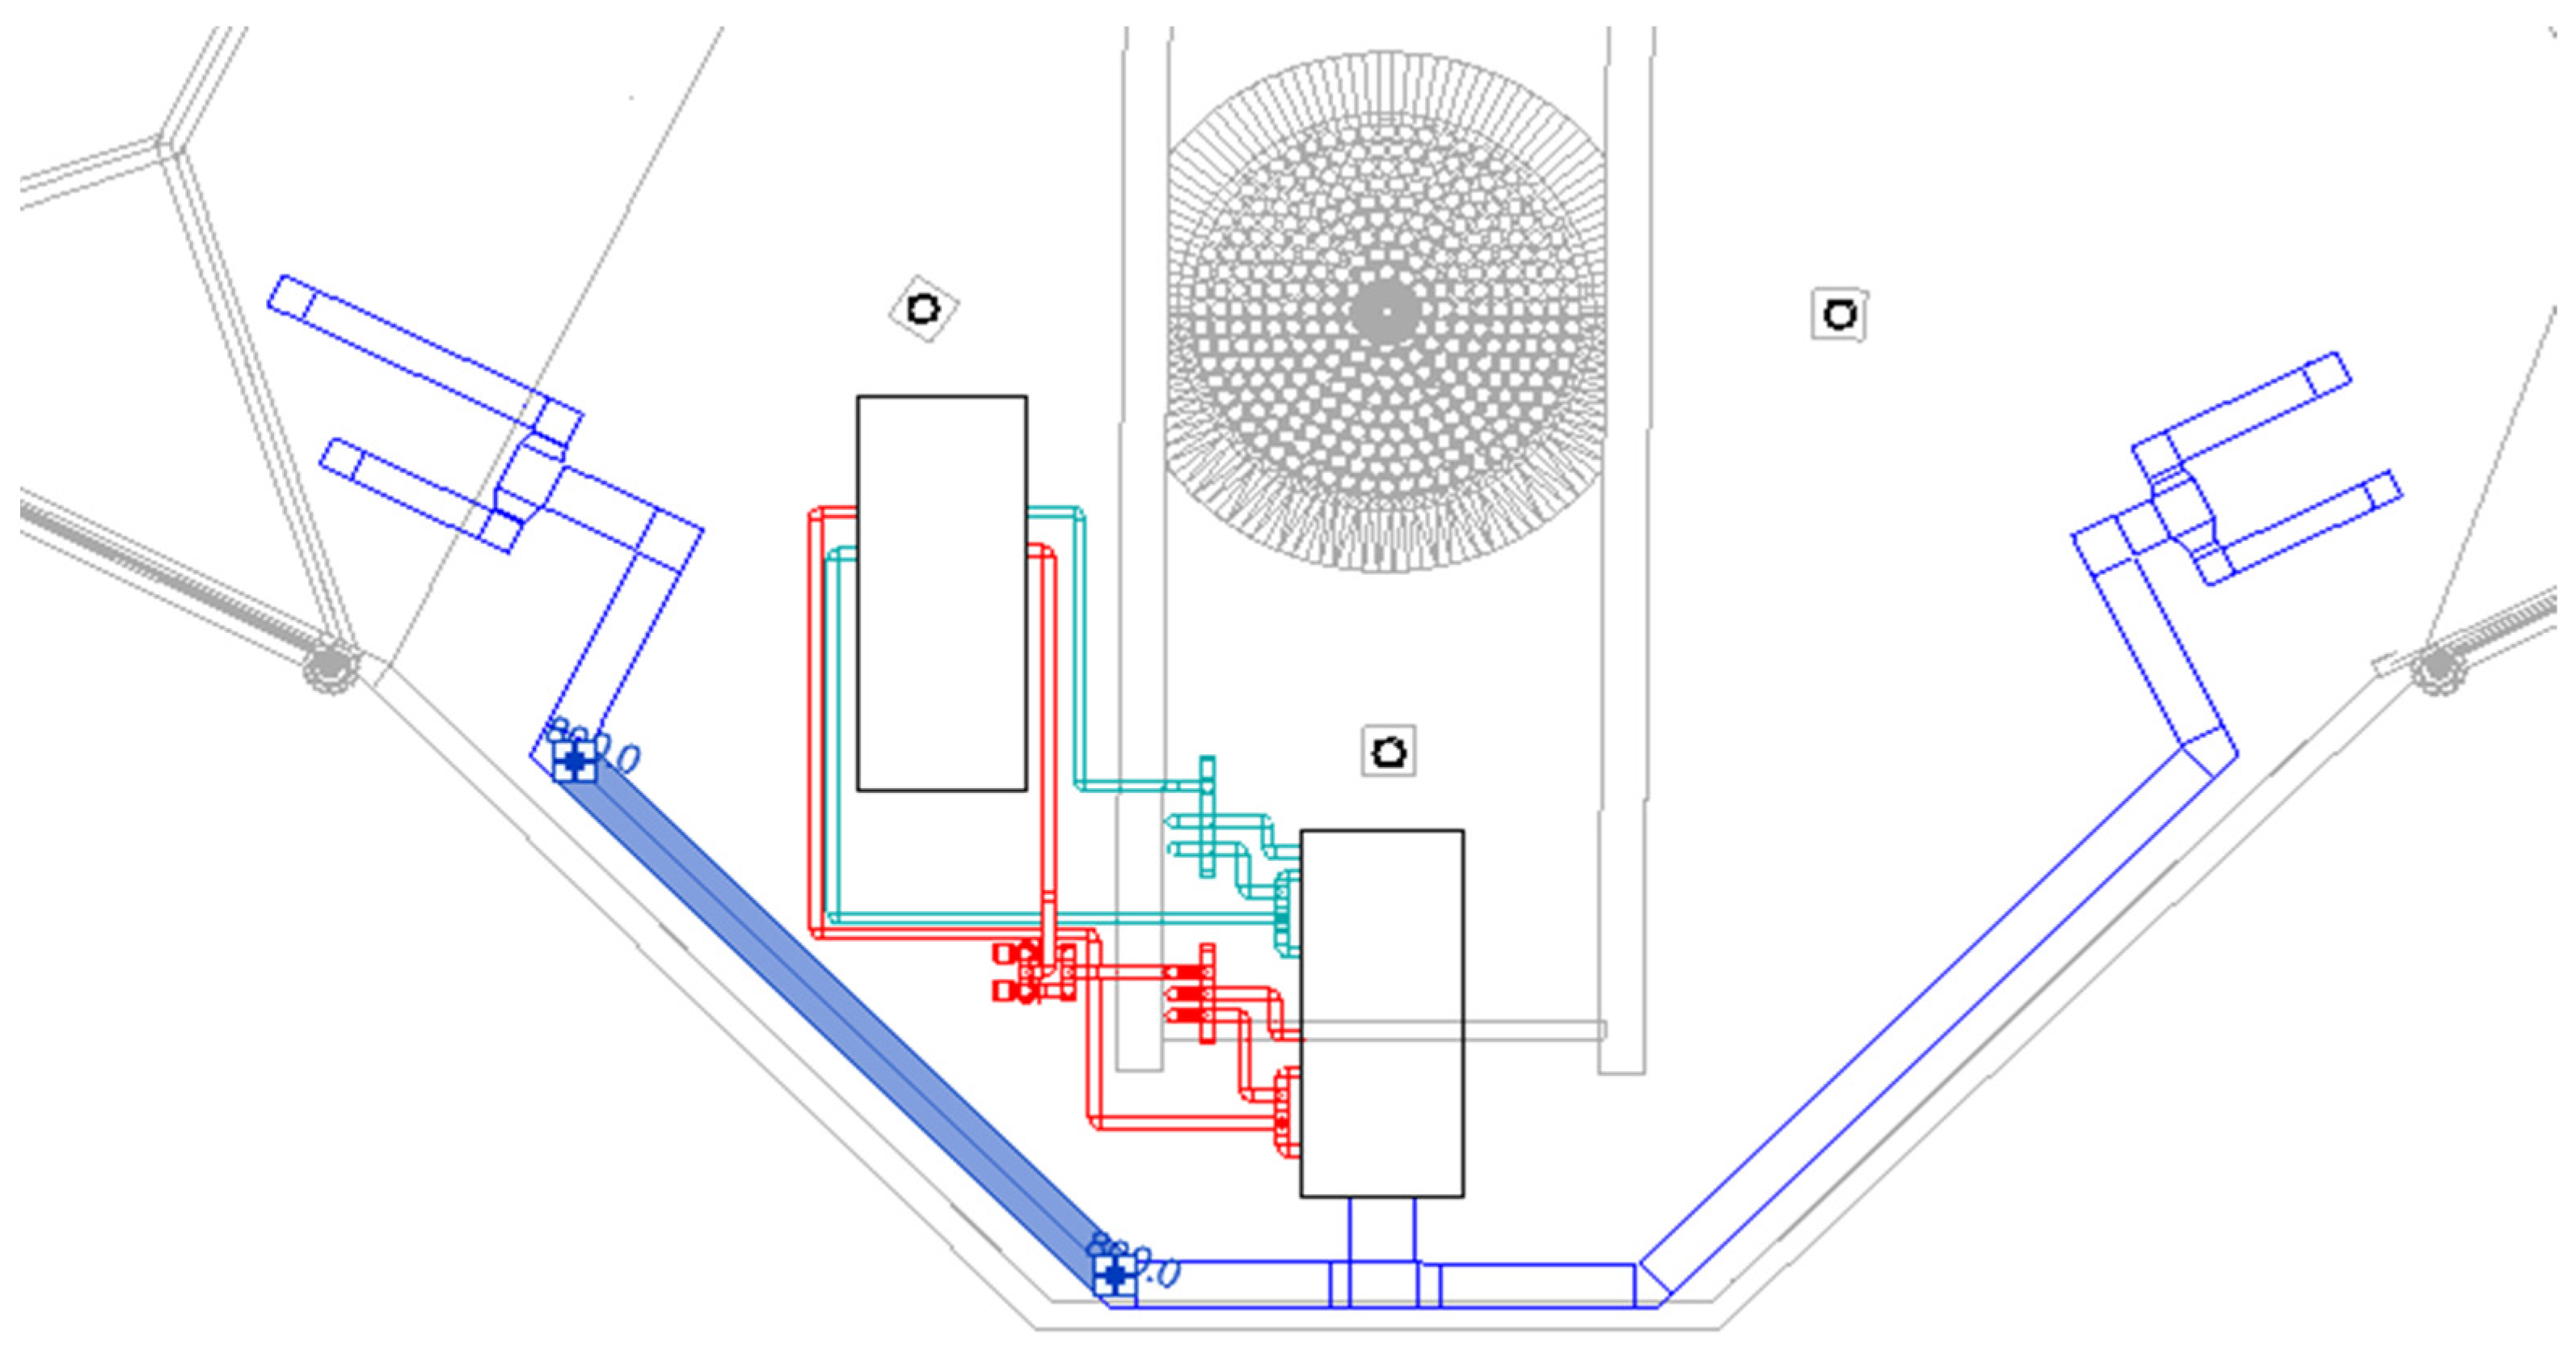
  • Graphic modeling of the pipeline section to be dimensioned (Figure 5).
  • Select “Pipe/Conduit sizing” from the multifunction toolbar.
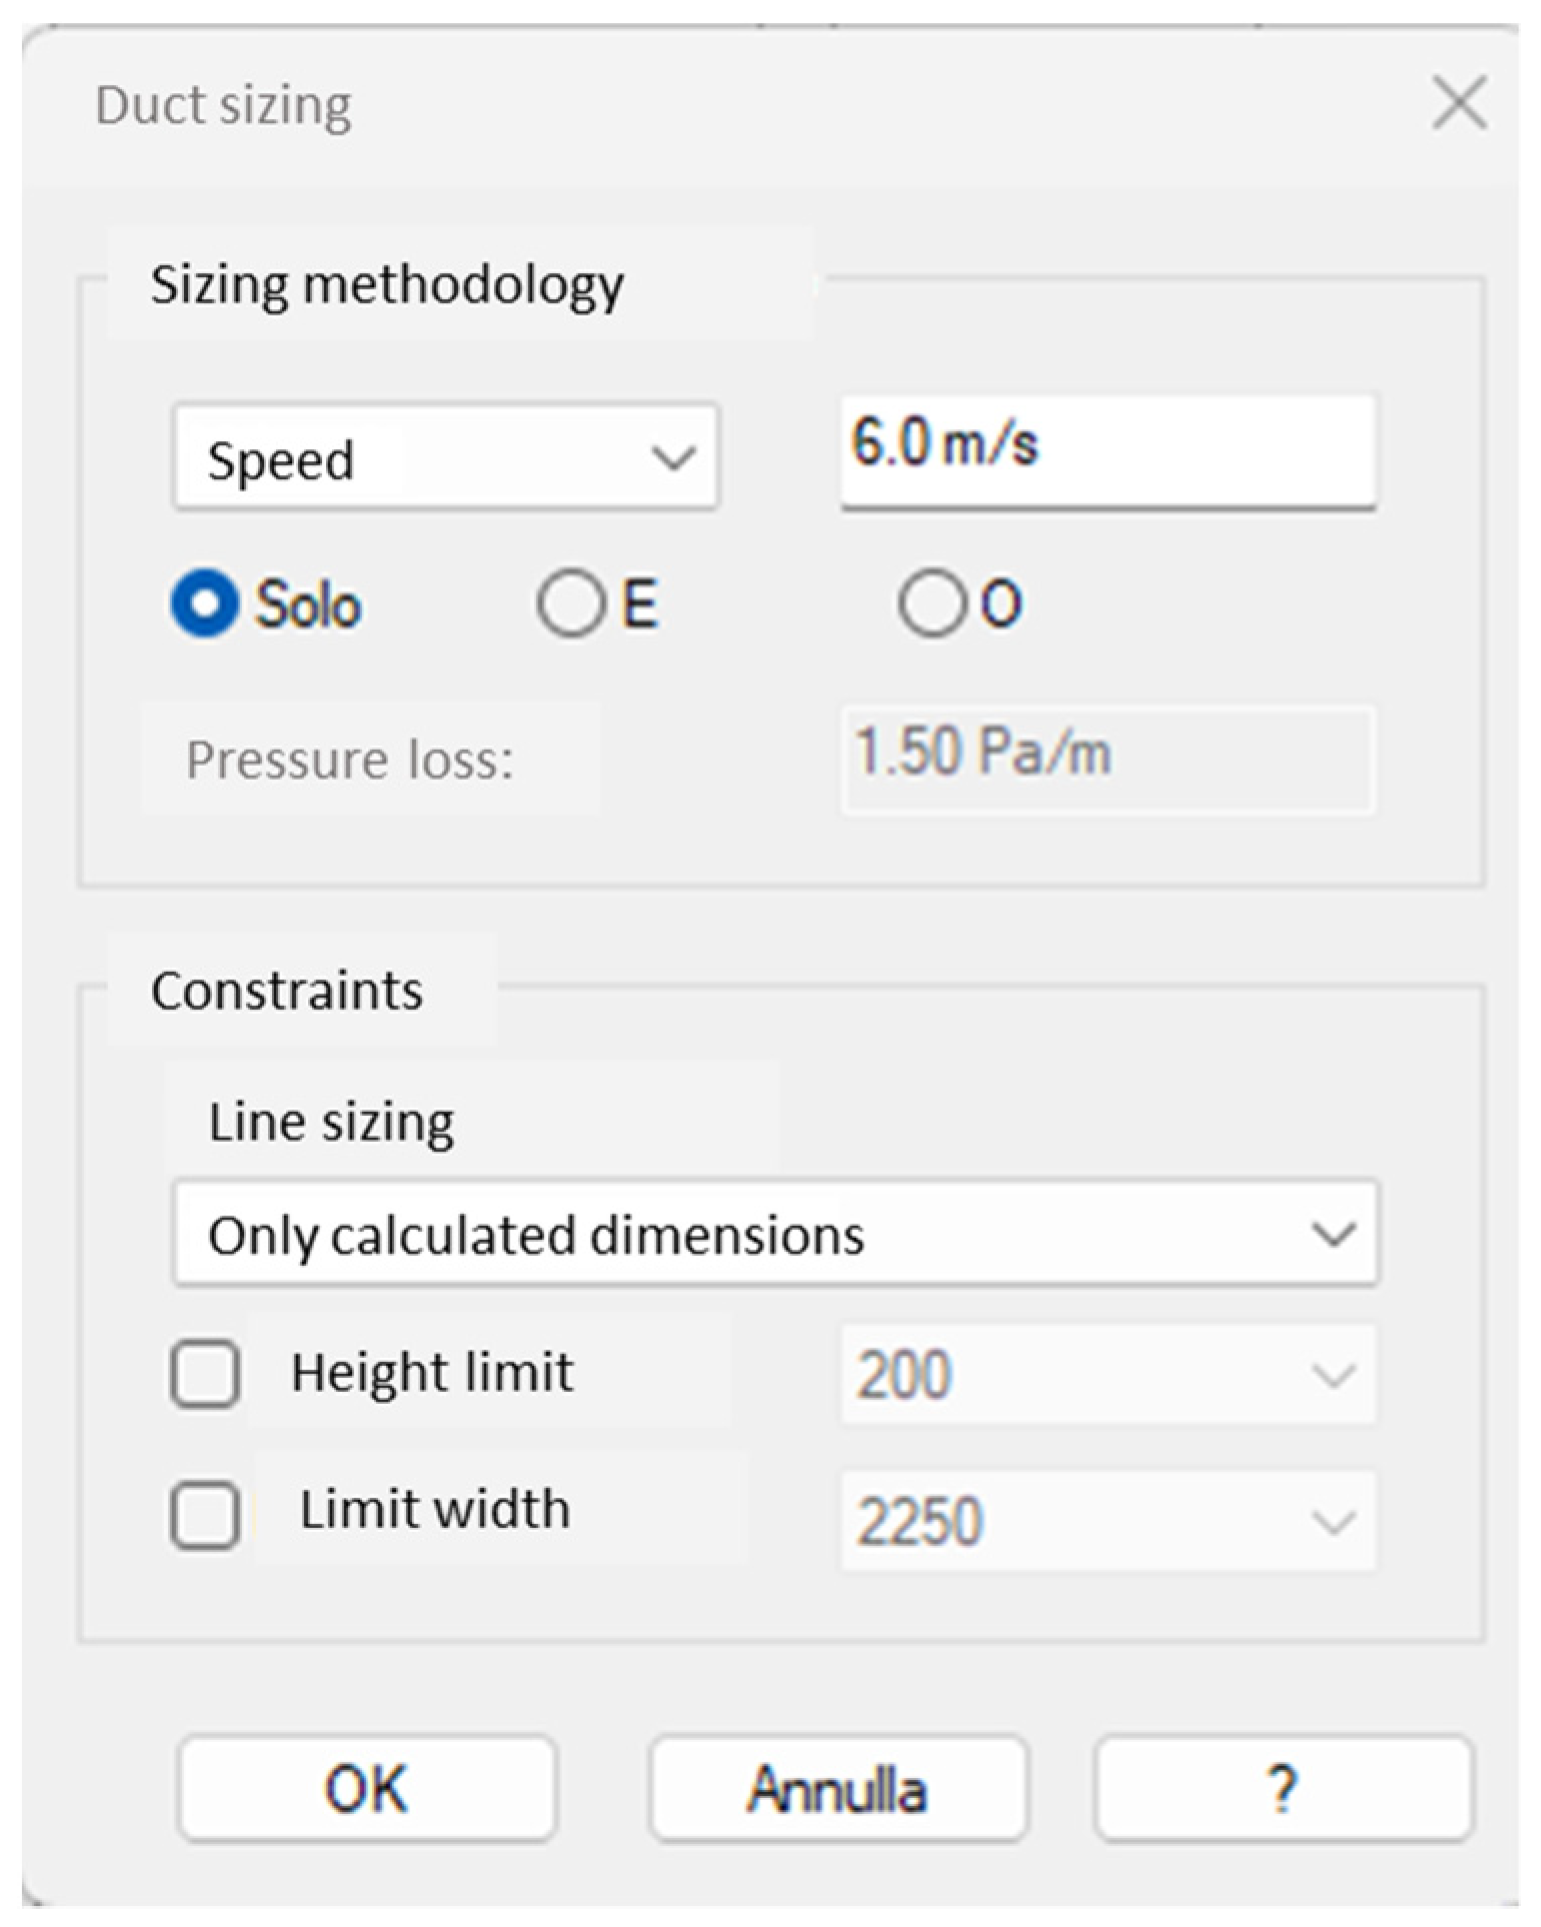
  • Input data settings (Figure 6).
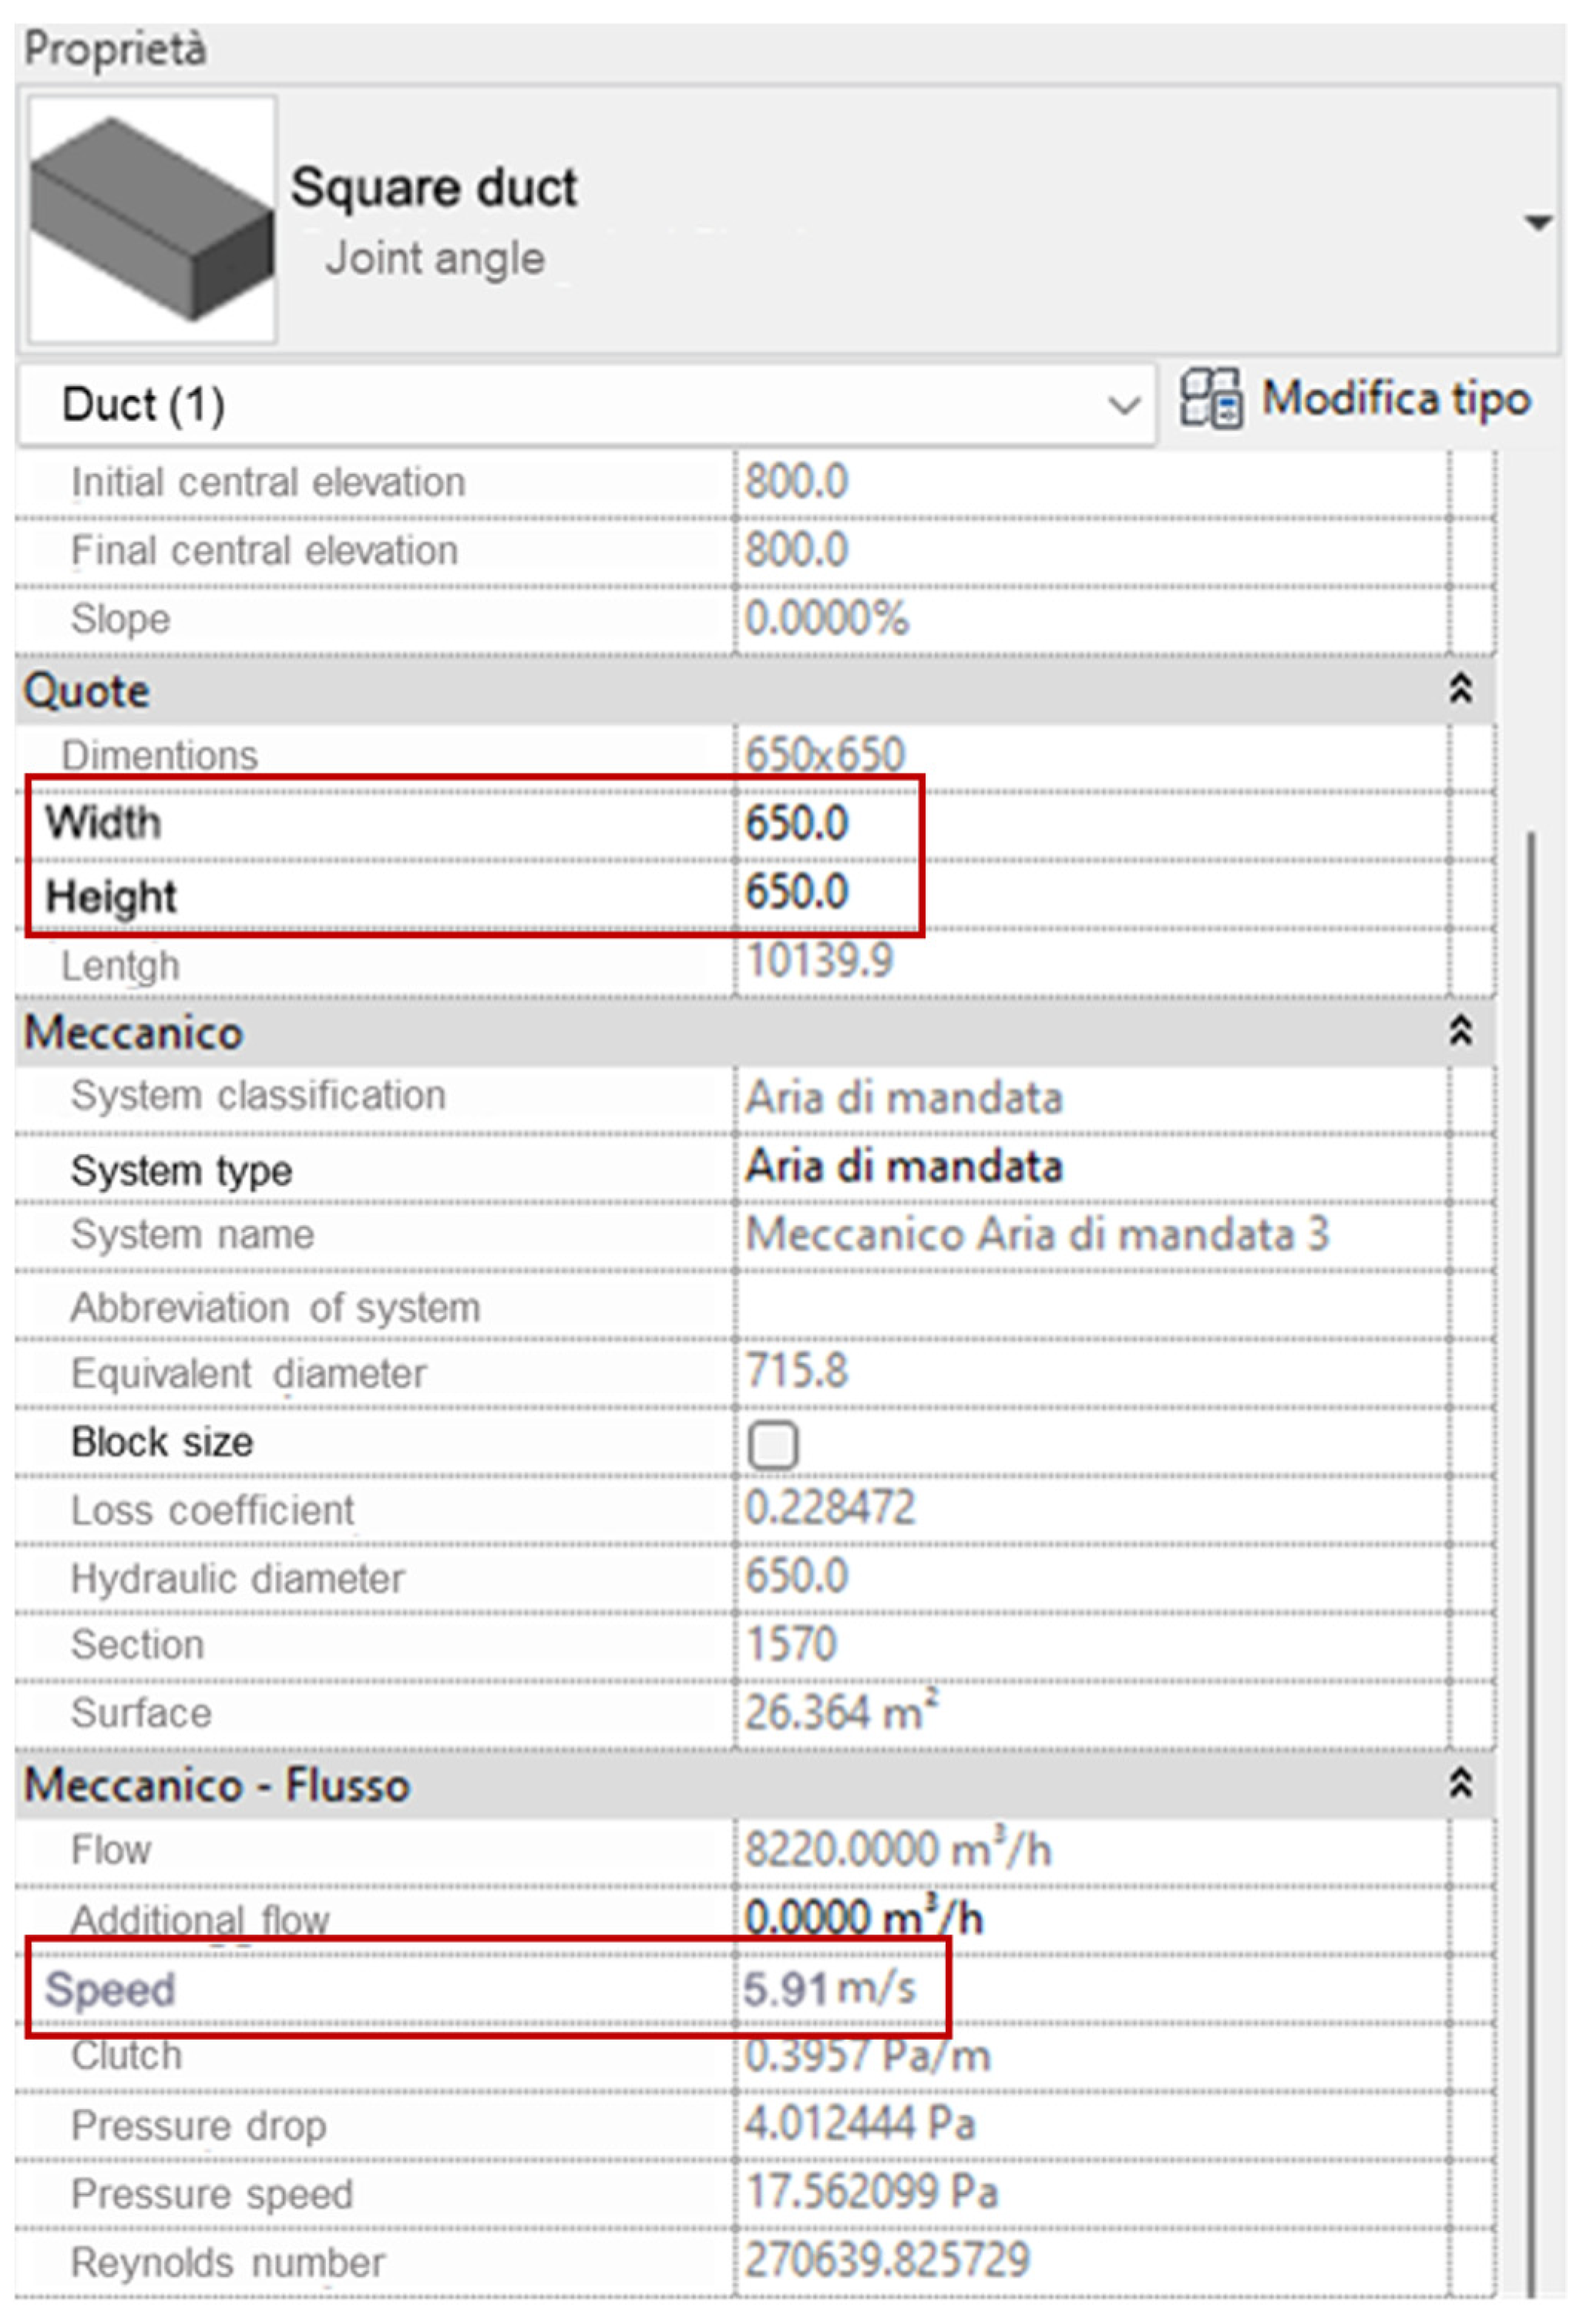
  • Read the results in the properties browser (Figure 7).
Therefore, by setting the segment of the duct, the BIM software is able to semi-automatically calculate the duct dimensions within the ASHRAE limits.

3. Results

The distribution network sizing of air, composed of ducts, was carried out using Autodesk Revit software, as previously described. For further verification, the application of Equation (7) was observed.
The calculation of the air distribution network included the sizing of the following four types of ducts:
-
Square duct;
-
Rectangular duct of the first type;
-
Rectangular duct of the second type.
This distinction was necessary due to the architectural and binding difficulties in establishing the presence or absence of a false ceiling, as well as allowing for greater flexibility and choice in the type of duct to be adopted. The following table (Table 4) presents results on the sizing of the distribution path located on the roof and the path that will need to be installed in the ceiling of the first floor, in order to compare the outcomes of the methodology proposed in this study with those obtained through the traditional method.
The software is based on the ASHRAE standards, which means that the solutions resulting from the program calculation are also lower by 1.5% than the traditional calculations, both in terms of dimensions and air velocity.
Indeed, the achieved velocity is 5.91 m/s compared to 6.00 m/s, which ensures the necessary performance to guarantee the proper quality of air.
Figure 7 refers to the channel section identified as 1–2, which has dimensions of 645.5 × 645.5 mm, resembling a square duct. The Autodesk Revit software recommends dimensions of 650 × 650 mm, which are also square.
After analyzing the dimensional data of a traditional design and BIM software, the following was discovered:
  • The maximum validation error for the ventilation duct dimensions within the mechanical system is 1.26%.
  • For the ventilation flow velocity, the maximum validation error is 1.5%.
Both quantities meet the necessary condition for thermo-hygrometric comfort despite the noted difference (Table 4).
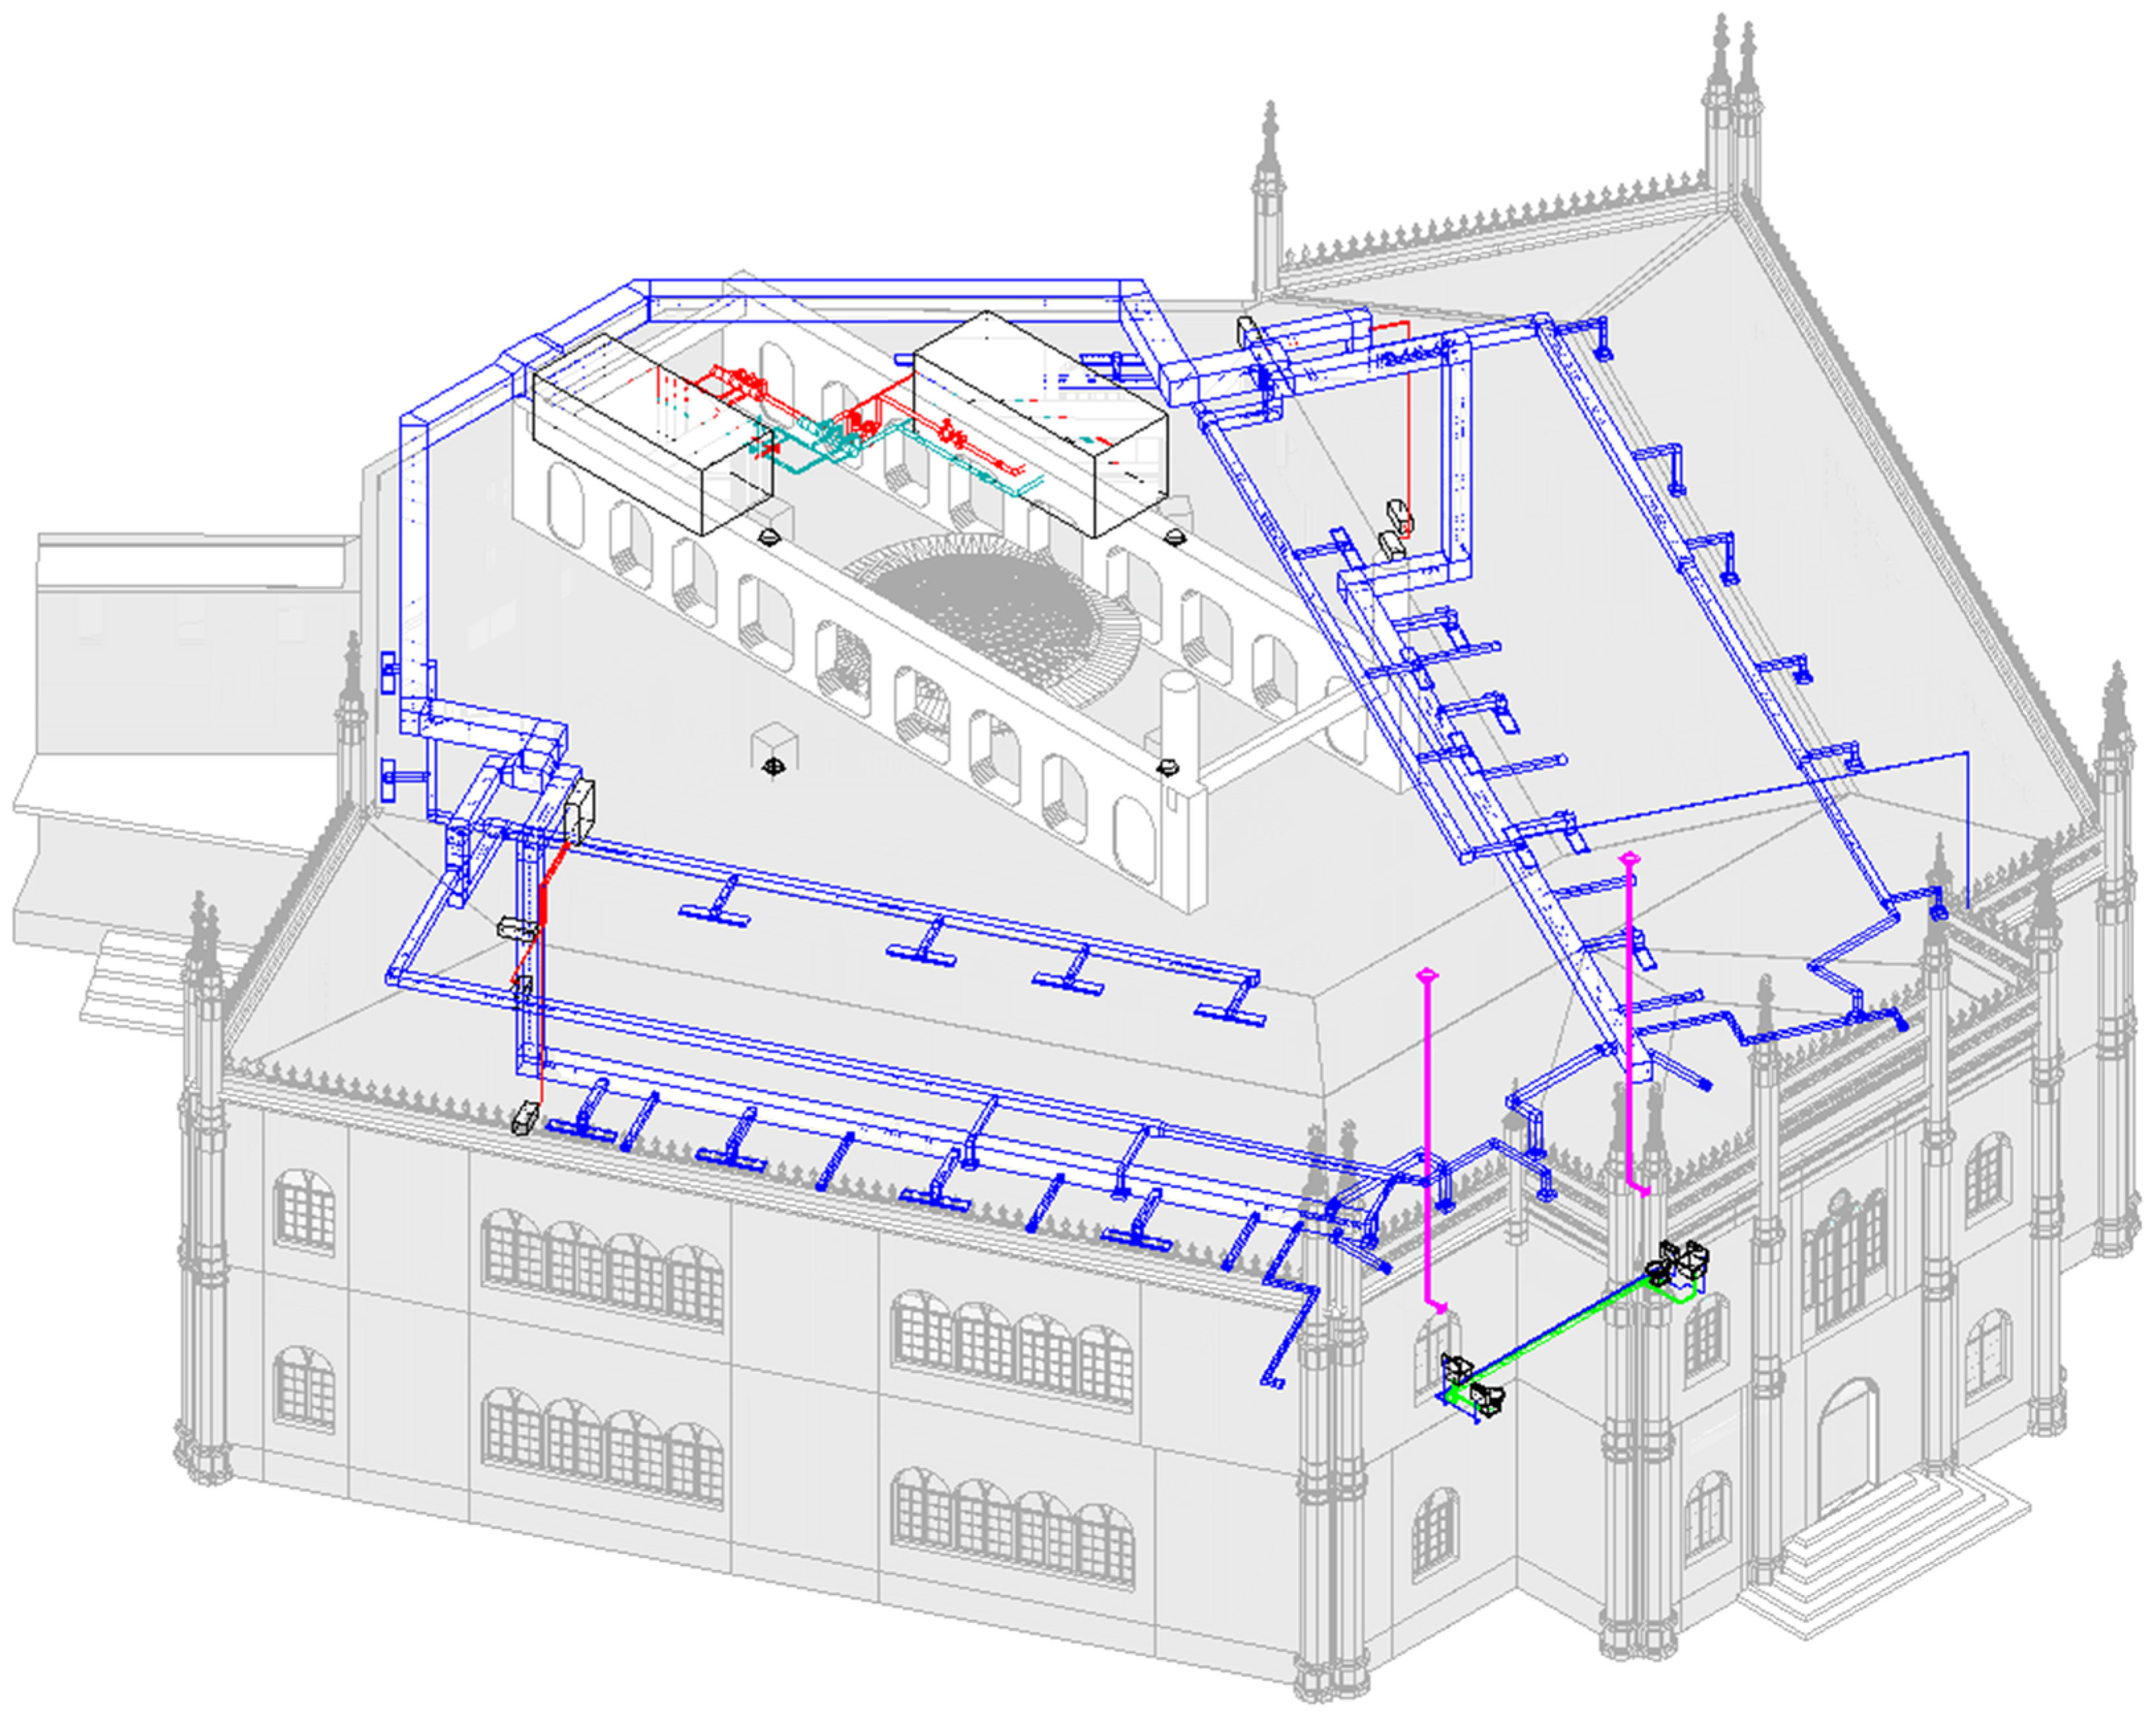
For each segment shown in Table 4, BIM modeling was performed, as illustrated in Figure 8 for the mechanical system only and in Figure 9 with the integration of the architectural model.

PV System Design in BIM Environment

In order to make the building self-sufficient, it was necessary to implement a renewable energy system. Considering the climate zone and annual characteristic temperatures, a rooftop photovoltaic system was chosen.
The BIM SolariusPV [60] software was employed for the design and evaluation of self-consumption. Starting from the solar diagram (Figure 10), the software enables the user to input surrounding buildings or other elements to consider the actual shading that the building experiences. In this case, as the building is the tallest in the neighborhood, the insertion operation was skipped to have a solar chart without any interference [61].
The next stage focuses on the spatial characteristics of photovoltaic modules, including installation space, height, inclination, rotation relative to the sun, and Azimuth angle. This process allows for both manual data entry and the option to choose the solution that can perceive the greatest solar radiation based on an equal surface area.
This demonstrates the potential of BIM software for various applications. In this study, we assessed the automatic option for determining the maximum number of installable modules using BIM software, considering the available surface area as well as the necessary maintenance space around the modules and their arrangement in series or parallel. Once all system settings were configured and actual solar radiation were taken into account through the model’s geolocation, it was possible to accurately evaluate the annual production of electrical energy (Figure 11).
To address the issues of energy poverty and renewable energy penetration previously discussed in the country, it was decided to oversize the facility so that nearby homes can benefit from a greater amount of electric energy. The photovoltaic system produces a total of 84,844.14 kWh of electricity compared to an annual consumption of 59,390.9 kWh, which corresponds to an oversizing of 30%.

4. Discussion

Mozambique is presently experiencing a severe energy crisis that holds substantial economic and social implications. The country significantly depends on hydropower plants for electricity generation. However, recent droughts and natural disasters have caused power shortages. Urbanization, increasing industrialization, and a growing population have consequently led to a rise in energy demand. As a measure to alleviate this energy crisis, Mozambique is researching alternative energy sources, particularly natural gas, solar, and wind power.
The development of solar and wind power as renewable energy sources offers great promise for Mozambique given the abundance of sunshine and wind resources. Moreover, the discovery of substantial reserves of natural gas presents a potential solution to the country’s energy needs. Nevertheless, critical issues need addressing, such as the initial investment demand for renewable energy and the environmental impact resulting from natural gas extraction.
It is apparent that Mozambique needs to address its energy challenge to attain economic and social development targets. Investing in renewable energy and enhancing energy infrastructure can offer a dependable electricity source, in addition to providing substantial environmental and economic advantages. Organizations, such as the European Union, from the international community play a vital role in supporting Mozambique’s journey to achieve sustainable development.
This article proposes a novel approach to address energy poverty in countries affected by climate change. The semi-automated BIM methodology for the energy retrofitting of existing buildings, especially when integrated into an energy district, is an effective solution for improving energy efficiency and promoting the adoption of renewable energy. The focus on building energy modeling and plant sizing using semi-automatic BIM tools is an important step toward a more comprehensive and integrated approach. This type of methodology can facilitate the dynamic design of plants, ensuring better resource management and more efficient use of renewable energy.
The use of BIM enabled a tailored environmental control system to be designed for the museum, replacing the previous system. The new system includes a photovoltaic plant that not only meets the museum’s energy needs, but also generates a surplus of electricity. The total production of renewable energy exceeds the museum’s consumption by 30%, which is a significant increase, especially in view of neighboring buildings with energy shortages. However, the original objective of creating a smart grid was not finalized at this stage of the study. This was a limitation of the research, probably due to the lack of a suitable infrastructure to support it. Certainly, the development and creation of a smart grid to serve this area seems essential and a possible future development of this work. Initially, the project envisaged sizing the photovoltaic system to meet the museum’s energy needs only. However, an in-depth analysis of the energy situation in Mozambique, and Maputo in particular, suggested a revision of the strategy to maximize the use of the available roof area for positioning the photovoltaic modules, thus generating a surplus of energy. Considering the total absence of electricity for several hours of the day in the area surrounding the museum, the surplus contribution of the photovoltaic system is significant, which, as previously mentioned, would be even more effective in the presence of a smart grid serving it.
Moreover, the proposed method showed considerable accuracy, with a maximum error of 1.5% between BIM duct dimensions and those calculated using a traditional method. This level of accuracy meets the requirements of the ASHRAE standards for environmental control. The BIM methodology not only optimized the museum’s energy efficiency, but also made a significant contribution to the generation and distribution of renewable energy in the surrounding area, thereby addressing the issues of energy shortage.
The lack of integration between BIM methodologies and renewable energy in the existing literature highlights a gap that this paper seeked to fill. The proposed holistic and synergic approach can help bridge this gap by improving the understanding and application of BIM technologies in relation to dynamic plant designs and renewable energy integration. Furthermore, the implementations of these methods in the context of energy poverty could lead to significant social and economic benefits, improving the sustainability of communities and contributing to the fight against climate change.
The increasing use of digital methodologies [45] and renewable energy for urban energy efficiency represents a promising prospect for progress toward broader sustainability for the country. The will to pursue sustainable and efficient development certainly goes hand in hand with the interoperability between projects and systems, facilitated by the adoption of common standards. The involvement of local stakeholders, communities, and public authorities in the implementation process of the BIM methodology seems to be an established strategy. Working with these stakeholders can help to overcome any cultural, social, or infrastructural problems and ensure that the solutions proposed are appropriate and responsive to specific territorial needs. The education and training of stakeholders is crucial to ensure the successful adoption of BIM methods for energy retrofitting. A clear understanding of the benefits of these innovative practices can encourage greater community involvement and conscious support from local institutions.
Nevertheless, analyzing the financial implications and assessing the economic sustainability of digital and energy transitions are key elements. Exploring alternative financing models, identifying government incentives, and developing support programs can encourage large-scale adoption, especially in contexts where financial resources are a challenge. Cultural, social, economic, and financial aspects, along with stakeholder interest and involvement, can facilitate a successful transition to a country model that prioritizes sustainability and energy efficiency.
The digital innovation and energy transition sector can create resources for the world of work. The potential positive impact of the above paradigms on employment in Mozambique is based on several relevant factors. Foremost, the innovation process requires the development of specific capabilities of the local workforce through education and training programs. The training of qualified workers needed to move in this direction could meet the growing demand for specialists in digital design, renewable energy generation systems, and energy management. The second issue of particular importance is that digitalization can lead to the creation of new industries and companies or the transformation of existing ones into Industry 4.0. The involvement of government authorities plays a crucial role. Incentives and targeted public policies can stimulate the growth of specific sectors, encourage investment, and attract resources [8,9]. The involvement of public institutions can also promote the adoption of innovative and sustainable practices.
The social and economic dimensions of the energy transition are equally significant. Renewable energy production can improve social and economic conditions by reducing dependence on traditional energy sources and promote community access to energy. In order to finance energy retrofits, especially in a context such as this one with a massive presence of social and low-income housing, innovative financial mechanisms could be tested that involve key stakeholders in identifying, sharing, and implementing solutions and best practices for energy retrofitting of buildings. Possible project topics include the following:
-
Digital technologies and projects that use digital solutions to help housing residents reduce their energy consumption;
-
Behavioral change projects that target vulnerable consumers and offer energy advice to support them in lowering energy bills;
-
Financing projects that explore and test innovative financing models to support energy efficiency renovations in housing;
-
Best practices that support projects aimed at disseminating best practices in the field of the energy retrofitting of social housing.
This set of initiatives has already been applied at the European scale and has led to several research studies investigating the causes and consequences of energy poverty, its prevalence, and the measures taken at the European and national level to alleviate it [61,62]. However, it is important to underline that the economic sustainability of these initiatives may have limitations, i.e., the financial aspect of the digital and energy transition is highly critical. It is essential to explore innovative financial approaches, identify forms of incentives from government institutions, and formulate support initiatives, including at the international level. Although the prospects are promising, it is imperative to mitigate possible economic barriers in order to ensure an effective energy transition and bold digital innovation for the sustainable development of the country.

5. Conclusions

The application of Building Information Modeling (BIM) has been deemed indispensable in numerous areas of energy management and sustainability in Mozambique, as evidenced in the revitalization project of the energy facilities of the Maputo Natural History Museum. One such area of benefit is the refinement of air distribution configurations. BIM facilitated the exact measurement of the air delivery system in the museum, resulting in the rationalization of duct sizes and air flow rates, thereby guaranteeing comfortable ambient conditions for users. The study findings demonstrate that the BIM software accurately calculated the dimensions in compliance with ASHRAE prerequisites, reducing design mistakes. Moreover, the BIM approach outperformed traditional methods by producing more efficient and precise air distribution solutions.
In addition to this, a solar power system was installed on the museum’s roof to enhance energy efficiency and sustainability. BIM software was instrumental in determining the maximum capacity of photovoltaic modules that could be installed, based on available area and shading factors. An accurate simulation of actual solar radiation enabled the precise calculation of the annual electricity production. Furthermore, BIM modeling facilitated system oversizing to benefit neighboring residential buildings.
The utilization of BIM has significantly increased the efficiency and precision of design and evaluation procedures in both cases. This innovation has established itself as a critical partner in tackling energy and environmental challenges in Mozambique, thereby promoting the more sustainable and optimized management of energy resources.
The incorporation of digital data, simulations, and 3D visualizations has considerably enhanced comprehension and communication in the design phase. This enables more productive collaboration between different professionals involved in the process. Moreover, adopting BIM and digital methodologies can assist in evaluating plant performance and sustainability, leading to reduced energy consumption and environmental impact.
Furthermore, it is important to highlight that the digital BIM model is a valuable tool for design and planning as well as long-term facility management [63]. It enables the documentation and tracking of changes, thereby simplifying maintenance, upgrades, and updates to installations over time. Access to a complete digital plant logbook with detailed information on components, materials, and systems further streamlines maintenance and corrective actions. Looking ahead, BIM holds the potential for unprecedented advancements. When combined with artificial intelligence, it offers the promise of self-learning systems for efficiently managing energy consumption and plant performance. Such systems will analyze both real-time and historical data to accurately predict abnormal activity and present recommendations to enhance productivity and sustainability. The synergy of BIM and AI signifies a noteworthy advancement toward intelligent and sustainable plant engineering.

Author Contributions

Conceptualization, G.P. and F.M.; methodology, G.P. and F.M.; software, G.P. and F.M.; validation, G.P. and F.M.; formal analysis, G.P. and F.M.; investigation, G.P. and F.M.; resources, G.P. and F.M.; data curation, G.P. and F.M.; writing—original draft preparation, F.M.; writing—review and editing, G.P. and F.M.; visualization, G.P. and F.M.; supervision, G.P.; project administration, G.P. and F.M. All authors have read and agreed to the published version of the manuscript.

Funding

This research received no external funding.

Data Availability Statement

Data are contained within the article.

Conflicts of Interest

The authors declare no conflicts of interest.

References

  1. Pereira, R.M.; Cardoso, F.L.; Esteves, A.M. The Mozambican Energy Crisis: Economic and Political Implications. Sustainability 2021, 78, 102123. [Google Scholar]
  2. Salite, D.; Kirshner, J.; Cotton, M.; Howe, L.; Cuamba, B.; Feijó, J.; Macome, A.Z. Electricity access in Mozambique: A critical policy analysis of investment, service reliability and social sustainability. Energy Res. Soc. Sci. 2021, 78, 102123. [Google Scholar] [CrossRef]
  3. Ayugi, B.; Eresanya, E.O.; Onyango, A.O.; Ogou, F.K.; Okoro, E.C.; Okoye, C.O.; Anoruo, C.M.; Dike, V.N.; Ashiru, O.R.; Daramola, M.T.; et al. Review of Meteorological Drought in Africa: Historical Trends, Impacts, Mitigation Measures, and Prospects. Pure Appl. Geophys. 2022, 179, 1365–1386. [Google Scholar] [CrossRef] [PubMed]
  4. Muhala, V.; Chicombo, T.F.; Macate, I.E.; Guimarães-Costa, A.; Gundana, H.; Malichocho, C.; Hasimuna, O.J.; Remédio, A.; Maulu, S.; Cuamba, L.; et al. Climate Change in Fisheries and Aquaculture: Analysis of the Impact Caused by Idai and Kenneth Cyclones in Mozambique. Front. Sustain. Food Syst. 2021, 5, 714187. [Google Scholar] [CrossRef]
  5. Chicombo, A.F.F.; Musango, J.K. Towards a theoretical framework for gendered energy transition at the urban household level: A case of Mozambique. Renew. Sustain. Energy Rev. 2022, 157, 112029. [Google Scholar] [CrossRef]
  6. Mulugetta, Y.; Sokona, Y.; Trotter, P.A.; Fankhauser, S.; Omukuti, J.; Croxatto, L.S.; Steffen, B.; Tesfamichael, M.; Abraham, E.; Adam, J.-P.; et al. Africa needs context-relevant evidence to shape its clean energy future. Nat. Energy 2022, 7, 1015–1022. [Google Scholar] [CrossRef]
  7. Clark, S.; van Niekerk, J.; Petrie, J.; McGregor, C. The role of natural gas in facilitating the transition to renewable electricity generation in South Africa. J. Energy S. Afr. 2022, 33, 22–35. [Google Scholar] [CrossRef]
  8. SE4ALL. Home Page. Available online: https://capacity4dev.europa.eu/projects/european-union-energy-initiative-euei_en (accessed on 31 March 2023).
  9. European Fund for Sustainable Development Plus. Home Page. Available online: https://international-partnerships.ec.europa.eu/funding-and-technical-assistance/funding-instruments/opernic-fund-sustainable-development-plus-efsd_en (accessed on 28 February 2023).
  10. Airò Farulla, G.; Tumminia, G.; Sergi, F.; Aloisio, D.; Cellura, M.; Antonucci, V.; Ferraro, M. A Review of Key Performance Indicators for Building Flexibility Quantification to Support the Clean Energy Transition. Energies 2021, 14, 5676. [Google Scholar] [CrossRef]
  11. Minjin, K.; Taehoon, H.; Changyoon, J.; Hyuna, K.; Minhyun, L. Development of building driven-energy payback time for energy transition of building with renewable energy systems. Appl. Energy 2020, 271, 115162. [Google Scholar] [CrossRef]
  12. Yang, X.; Hu, M.; Tukker, A.; Zhang, C.; Huo, T.; Steubing, B. A bottom-up dynamic building stock model for residential energy transition: A case study for The Netherlands. Appl. Energy 2022, 306, 118060. [Google Scholar] [CrossRef]
  13. Samour, A.; Moyo, D.; Tursoy, T. Renewable energy, banking sector development, and carbon dioxide emissions nexus: A path toward sustainable development in South Africa. Renew. Energy 2022, 193, 1032–1040. [Google Scholar] [CrossRef]
  14. Mucova, S.A.R.; Azeiteiro, U.M.; Vinuesa, A.G.; Filho, W.L.; Pereira, M.J.V. Addressing Rural Community’s Risk Perceptions, Vulnerability, and Adaptation Strategies to Climate Change in Mozambique, Africa; World Sustainability Series; Springer: Cham, Switzerland, 2021; pp. 283–309. [Google Scholar] [CrossRef]
  15. Copernicus. Home Page. Available online: https://www.copernicus.eu/en (accessed on 28 October 2023).
  16. Bhattacharyya, S.C.; Palit, D. A critical review of literature on the nexus between central grid and off-grid solutions for expanding access to electricity in Sub-Saharan Africa and South Asia. Renew. Sustain. Energy Rev. 2021, 141, 110792. [Google Scholar] [CrossRef]
  17. Uamusse, M.M.; Tussupova, K.; Persson, K.M. Climate Change Effects on Hydropower in Mozambique. Appl. Sci. 2020, 10, 4842. [Google Scholar] [CrossRef]
  18. Chilundo, R.J.; Neves, D.; Mahanjane, U.S. Photovoltaic water pumping systems for horticultural crops irrigation: Advancements and opportunities towards a green energy strategy for Mozambique. Sustain. Energy Technol. Assess. 2019, 33, 61–68. [Google Scholar] [CrossRef]
  19. Maria, R.; Savelli, E.; Di Baldassarre, G.; Biza, A.; Messori, G. Unprecedented droughts are expected to exacerbate urban inequalities in Southern Africa. Nat. Clim. Chang. 2023, 13, 98. [Google Scholar]
  20. United Nations: 2030 Goals. Home Page. Available online: https://sdgs.un.org/goals (accessed on 2 April 2023).
  21. de Almeida, A.; Quaresma, N.; Biosse, E. The role of energy efficiency and renewable energies to accelerate sustainable energy access—A perspective case study of Mozambique. Energy Effic. 2022, 15, 1–13. [Google Scholar] [CrossRef]
  22. Energy Statistical Report 2020–2021; Ministry of Mining Resources and Energy Department Planning and Cooperation of the Republic of Mozambique: Maputo, Mozambique, 2021.
  23. Mozambique Ministry. Home Page. Available online: https://www.mctes.gov.mz/nivagara-destaca-promocao-da-pesquisa-sobre-preservacao-do-meio-ambiente-e-proteccao-da-biodiversidade/ (accessed on 15 August 2023).
  24. Dana, G.; Kapuscinski, A.; Donaldson, J. Integrating diverse scientific and practitioner knowledge in ecological risk analysis: A case study of biodiversity risk assessment in South Africa. J. Environ. Manag. 2012, 98, 134–146. [Google Scholar] [CrossRef]
  25. Sharif-Askari, H.; Abu-Hijleh, B. Review of museums’ indoor environment conditions studies and guidelines and their impact on the museums’ artifacts and energy consumption. Build. Environ. 2018, 143, 186–195. [Google Scholar] [CrossRef]
  26. Wang, Z.; Calautit, J.; Tien, P.W.; Wei, S.; Zhang, W.; Wu, Y.; Xia, L. An occupant-centric control strategy for indoor thermal comfort, air quality and energy management. Energy Build. 2023, 285, 112899. [Google Scholar] [CrossRef]
  27. Zhang, W.; Wu, W.; Norford, L.; Li, N.; Malkawi, A. Model predictive control of short-term winter natural ventilation in a smart building using machine learning algorithms. J. Build. Eng. 2023, 73, 106602. [Google Scholar] [CrossRef]
  28. Fan, X.; Li, X. Performance comparison analysis for different single-zone natural ventilation building indoor temperature prediction method combined thermal mass. Energy 2022, 255, 124518. [Google Scholar] [CrossRef]
  29. Li, C.; Chen, Y. A multi-factor optimization method based on thermal comfort for building energy performance with natural ventilation. Energy Build. 2023, 285, 112893. [Google Scholar] [CrossRef]
  30. Salvati, A.; Kolokotroni, M. Urban microclimate and climate change impact on the thermal performance and ventilation of multi-family residential buildings. Energy Build. 2023, 294, 113224. [Google Scholar] [CrossRef]
  31. ASHRAE. Home Page. Available online: https://www.ashrae.org/ (accessed on 15 September 2023).
  32. Alonso, J.D.; Bernardos, A.; Regidor-Ros, J.L.; Máñez, R.M.; Bosch-Roig, P. Innovative use of essential oil cold diffusion system for improving air quality on indoor cultural heritage spaces. Int. Biodeterior. Biodegrad. 2021, 162, 105251. [Google Scholar]
  33. Li, Z.; Meng, Q.; Wei, Y.; Zhang, L.; Sun, Z.; Lei, Y.; Yang, L.; Yan, X. Dynamic room temperature setpoints of air-conditioning demand response based on heat balance equations with thermal comfort model as constraint: On-site experiment and simulation. J. Build. Eng. 2023, 65, 105798. [Google Scholar] [CrossRef]
  34. Costa, V.A.F. Volume balance equation, availability analysis and the fundamental relation in the thermodynamics for the heat transfer man. Int. J. Heat Mass Transf. 2008, 51, 2871–2876. [Google Scholar] [CrossRef]
  35. Alfano, F.R.D.A.; Palella, B.I.; Riccio, G. Notes on the Calculation of the PMV Index by Means of Apps. Energy Procedia 2016, 101, 249–256. [Google Scholar] [CrossRef]
  36. Xu, Z.; Hu, G.; Spanos, C.J.; Schiavon, S. PMV-based event-triggered mechanism for building energy management under uncertainties. Energy Build. 2017, 152, 73–85. [Google Scholar] [CrossRef]
  37. dos Reis, A.S.; Vaquero, P.; Dias, M.F.; Tavares, A. Passive Discomfort Index as an alternative to Predicted Mean Vote and Predicted Percentage of Dissatisfied to assess occupant’s thermal discomfort in dwellings. Energy Rep. 2022, 8, 956–965. [Google Scholar] [CrossRef]
  38. Yan, S.; Liu, N.; Wang, W.; Han, S.; Zhang, J. An adaptive predicted percentage dissatisfied model based on the air-conditioner turning-on behaviors in the residential buildings of China. Build. Environ. 2021, 191, 107571. [Google Scholar] [CrossRef]
  39. Liang, S.; Wang, H.; Gao, X.; Tian, X.; Zhu, H.; Hu, S.; Lin, C. Experimental study on the operating performance of the air source heat pump (ASHP) with variable outdoor airflow rate under the standard frosting condition. Energy Built Environ. 2023. [Google Scholar] [CrossRef]
  40. UNI 10339; Impianti Aeraulici al Fini di Benessere. Ente Italiano di Normazione: Roma, Italy, 1995.
  41. Ghaffarianhoseini, A.; Tookey, J.; Ghaffarianhoseini, A.; Naismith, N.; Azhar, S.; Efimova, O.; Raahemifar, K. Building Information Modelling (BIM) uptake: Clear benefits, understanding its implementation, risks and challenges. Renew. Sustain. Energy Rev. 2017, 75, 1046–1053. [Google Scholar] [CrossRef]
  42. Tang, X.; Zhang, J.; Liang, R. The design of heating, ventilation, and air conditioning systems based on building information modeling: A review from the perspective of automatic and intelligent methods. J. Build. Eng. 2024, 82, 108200. [Google Scholar] [CrossRef]
  43. Maglad, A.M.; Houda, M.; Alrowais, R.; Khan, A.M.; Jameel, M.; Rehman, S.K.U.; Khan, H.; Javed, M.F.; Rehman, M.F. Bim-based energy analysis and optimization using insight 360 (case study). Case Stud. Constr. Mater. 2023, 18, e01755. [Google Scholar] [CrossRef]
  44. Odeh, K.; de Wilde, P. BIM to BEM: An Investigation of Practical Interoperability Challenges When Working with Revit and Designbuilder. In Proceedings of the EG-ICE 2020 Workshop on Intelligent Computing in Engineering, Online, 1–4 July 2020; pp. 73–82. Available online: https://www.scopus.com/inward/record.uri?eid=2-s2.0-85091017688&partnerID=40&md5=4efc3531eb16866ce10bc2774a372ace (accessed on 10 September 2023).
  45. Cumo, F. Innovation for the Digitization Process of the AECO Sector. In Technological Imagination in the Green and Digital Transition, Proceedings of the CONF.ITECH 2022, Rome, Italy, 30 June–2 July 2022; The Urban Book Series; Springer: Cham, Switzerland, 2023. [Google Scholar] [CrossRef]
  46. Cumo, F.; Giustini, F.; Pennacchia, E.; Romeo, C. The “D2P” Approach: Digitalisation, Production and Performance in the Standardised Sustainable Deep Renovation of Buildings. Energies 2022, 15, 6689. [Google Scholar] [CrossRef]
  47. Kasimir, F.; Alexander, H.; André, B. BIM4EarlyLCA: An interactive visualization approach for early design support based on uncertain LCA results using open BIM. Dev. Built Environ. 2023, 16, 100263. [Google Scholar] [CrossRef]
  48. Xu, F.; Liu, Q. Building energy consumption optimization method based on convolutional neural network and BIM. Alex. Eng. J. 2023, 77, 407–417. [Google Scholar] [CrossRef]
  49. Mohamed, M.; Mohammed, C.; Smail, Z.; Goran, K.; Salaheddine, A.; Hassan, Z. Cost-effective design of energy efficiency measures in the building sector in North Africa using Building Information Modeling. Energy Build. 2023, 294, 113283. [Google Scholar] [CrossRef]
  50. Muzi, F.; Marzo, R.; Nardi, F. Digital Information Management in the Built Environment: Data-Driven Approaches for Building Process Optimization. In Technological Imagination in the Green and Digital Transition, Proceedings of the CONF.ITECH 2022, Rome, Italy, 30 June–2 July 2022; The Urban Book Series; Springer: Cham, Switzerland, 2023. [Google Scholar] [CrossRef]
  51. Chen, B.; Jiang, S.; Qi, L.; Su, Y.; Mao, Y.; Wang, M.; Cha, H.S. Design and Implementation of Quantity Calculation Method Based on BIM Data. Sustainability 2022, 14, 7797. [Google Scholar] [CrossRef]
  52. Piras, G.; Agostinelli, S.; Muzi, F. Digital Twin Framework for Built Environment: A Review of Key Enablers. Energies 2024, 17, 436. [Google Scholar] [CrossRef]
  53. Lamagna, M.; Groppi, D.; Nezhad, M.M.; Piras, G. A Comprehensive Review on Digital Twins for Smart Energy Management System. Int. J. Energy Prod. Manag. 2021, 6, 323–334. [Google Scholar] [CrossRef]
  54. Wang, H.; Pan, Y.; Luo, X. Integration of BIM and GIS in sustainable built environment: A review and bibliometric analysis. Autom. Constr. 2019, 103, 41–52. [Google Scholar] [CrossRef]
  55. Muñoz-La Rivera, F.; Vielma, J.C.; Herrera, R.F.; Carvallo, J. Methodology for Building Information Modeling (BIM) Implementation in Structural Engineering Companies (SECs). Adv. Civ. Eng. 2019, 2019, 8452461. [Google Scholar] [CrossRef]
  56. Banteli, A.; Stevenson, V.E. building information modelling (bim) as an enabler for whole-building embodied energy and carbon calculation in early-stage building design. WIT Trans. Built Environ. 2017, 169, 89–100. [Google Scholar] [CrossRef]
  57. Autodesk Revit. Home Page. Available online: https://www.autodesk.it/products/revit/overview?term=1-YEAR&tab=subscription (accessed on 15 October 2023).
  58. Microsoft Excel. Home Page. Available online: https://www.microsoft.com/it-it/microsoft-365/excel (accessed on 18 October 2023).
  59. Yang, R.J.; Imalka, S.T.; Wijeratne, W.P.; Amarasinghe, G.; Weerasinghe, N.; Jayakumari, S.D.S.; Zhao, H.; Wang, Z.; Gunarathna, C.; Perrie, J.; et al. Digitalizing building integrated photovoltaic (BIPV) conceptual design: A framework and an example platform. Build. Environ. 2023, 243, 110675. [Google Scholar] [CrossRef]
  60. Solarius, P.V. Home Page. Available online: https://www.acca.it/software-fotovoltaico (accessed on 1 October 2023).
  61. Energy Poverty in European Union Home Page. Available online: https://energy.ec.europa.eu/topics/markets-and-consumers/energy-consumer-rights/energy-poverty_en#eu-projects-to-fight-energy-poverty (accessed on 10 August 2023).
  62. Cumo, F.; Maurelli, P.; Pennacchia, E.; Rosa, F. Urban Renewable Energy Communities and Energy Poverty: A proactive approach to energy transition with Sun4All project. In Proceedings of the 20th World Wind Energy Conference & Exhibition (WWEC 2022), Rimini, Italy, 28–30 June 2022; IOP Conference Series: Earth and Environmental Science. IOP: Bristol, UK, 2022; Volume 1073. [Google Scholar]
  63. Agostinelli, S.; Cumo, F.; Marzo, R.; Muzi, F. Digital construction strategy for project management optimization in a building renovation site: Machine learning and big data analysis. In Proceedings of the Conference ISIC 2022, Guimaraes, Portugal, 7–9 September 2022. [Google Scholar] [CrossRef]
Figure 3. Planimetric representation of the location of the new equipment.
Energies 17 00775 g003
Figure 4. Autodesk Revit, ground floor areas legend.
Energies 17 00775 g004
Figure 5. Autodesk Revit modeling environment.
Energies 17 00775 g005
Figure 6. Autodesk Revit input data settings.
Energies 17 00775 g006
Figure 7. Autodesk Revit results property. Highlighted in the red box, size and speed of a duct sized by the software.
Energies 17 00775 g007
Figure 8. MEP model in BIM environment.
Energies 17 00775 g008
Figure 9. MEP integrated into the architectural model in BIM environment.
Energies 17 00775 g009
Figure 10. Solar diagram in SolariusPV.
Energies 17 00775 g010
Figure 11. Total energy produced by the system.
Energies 17 00775 g011
Table 1. Main electricity indicators.
Indicators202020212020–2021 [%]
Installed power [MW]296529650
Available power [MW]245725142.3
Generation [MWh]18,770,80418,62,829−0.6
Imports [MWh]8,099,5738,129,2150.4
Exports [MWh]11,469,14711,188,426−2.4
Consumers [n°]2,279,3312,588,58813.6
Access [%]38.942.43.5
Table 2. Installed capacity of power plants by type of source [MW].
Installed PowerAvailable Power%
2020202120202021
Total2965296524572514100
Hydropower219221922192219287.19
Thermal73273222328111.18
Gas4544541751756.96
Diesel8282--
Biogas7171-57
HFO12512548481.91
Solar424242421.67
Table 3. Room areas: ground floor and first floor.
IDDesignation of UseLevelSurface [m2]Height [m]Volume [m3]
1HallGround Floor42.923.50150.22
4TicketingGround Floor22.893.5080.12
5Temporary expositionGround Floor67.423.50235.97
6Temporary expositionGround Floor67.103.50234.85
7DepositGround Floor42.023.50147.07
Central roomGround Floor571.283.501999.48
8BTransectGround Floor38.253.50133.88
9DepositGround Floor9.343.5032.69
10DepositGround Floor31.653.50110.78
11Expositive roomGround Floor67.273.50235.45
12Expositive roomGround Floor67.353.50235.73
13BookshopGround Floor23.373.5081.80
14HallFirst Floor65.473.50229.15
15BarFirst Floor23.703.5082.95
16Expositive roomFirst Floor67.493.50236.22
17DepositFirst Floor68.453.50239.58
18Lecture roomFirst Floor42.843.50149.94
19GalleryFirst Floor65.503.50229.25
20Expositive roomFirst Floor31.773.50111.20
21Expositive roomFirst Floor69.263.50242.41
22Expositive roomFirst Floor67.943.50237.79
23RestaurantFirst Floor24.233.5084.81
Table 4. Validation of duct sizes in the BIM model.
Duct IDSpeed (v)Software SpeedErrorRectangular DuctSquare DuctSoftware Square DuctError
m3/hm3/h[%]W [mm]H [mm]W = H [mm]W = H [mm][%]
06.005.911.5527.051581.14912.99150.233
0–16.005.911.5527.051581.14912.99150.233
16.005.911.5372.681118.03645.56500.698
1–26.005.911.5372.681118.03645.56500.698
26.005.911.5372.681118.03645.56500.698
2–36.005.911.5372.681118.03645.56500.698
36.005.911.5263.52790.57456.44600.781
3–46.005.911.5263.52790.57456.44600.781
46.005.911.5186.34559.02322.73250.698
4–56.005.911.5186.34559.02322.73250.698
56.005.911.5186.34559.02322.73250.698
5–66.005.911.5186.34559.02322.73250.698
66.005.911.5186.34559.02322.73250.698
6–74.004.000228.22684.65395.33950.000
74.004.000228.22684.65395.33950.000
7–82.001.981.0322.75968.25559.05600.176
8–B12.001.981.092.52277.55160.21600.000
B12.001.981.092.52277.55160.21600.000
8–B22.001.981.092.52277.55160.21600.000
B22.001.981.092.52277.55160.21600.000
8–92.001.981.0295.04885.11511.05150.779
92.001.981.0295.04885.11511.05150.779
9–B12.001.981.082.67248.01143.21451.266
B12.001.981.082.67248.01143.21451.266
9–B22.001.981.082.67248.01143.21451.266
B22.001.981.082.67248.01143.21451.266
9–102.001.981.0244.36733.07423.24250.416
102.001.981.0244.36733.07423.24250.416
10–B12.001.981.082.87248.60143.51451.025
B12.001.981.082.87248.60143.51451.025
10–B22.001.981.082.87248.60143.51451.025
B22.001.981.082.87248.60143.51451.025
10–112.001.981.0152.15456.44263.52650.560
112.001.981.0152.15456.44263.52650.560
11–124.004.000107.58322.75186.31900.355
122.001.981.0152.15456.44263.52650.560
11–B12.001.981.048.28144.8583.6850.441
B12.001.981.048.28144.8583.6850.441
11–B22.001.981.048.28144.8583.6850.441
B22.001.981.048.28144.8583.6850.441
Disclaimer/Publisher’s Note: The statements, opinions and data contained in all publications are solely those of the individual author(s) and contributor(s) and not of MDPI and/or the editor(s). MDPI and/or the editor(s) disclaim responsibility for any injury to people or property resulting from any ideas, methods, instructions or products referred to in the content.