Article

Multi-Factor Controlling Diversity of the Ordovician Hydrocarbon Phase in the Tazhong I Block, Tarim Basin, NW China

1
Research Institute of Petroleum Exploration and Development, PetroChina, Beijing 100083, China
2
Key Laboratory of Gas Reservoir Formation and Development, CNPC, Langfang 065007, China
3
Institute of Geology, Chinese Academy of Geological Sciences, Beijing 100037, China
4
SinoProbe Laboratory, Chinese Academy of Geological Sciences, Beijing 100094, China
5
Oil and Gas Development Department, Tarim Oilfield Company, PetroChina, Krola 841000, China
*
Author to whom correspondence should be addressed.
Energies 2024, 17(3), 723; https://doi.org/10.3390/en17030723
Submission received: 28 December 2023 / Revised: 24 January 2024 / Accepted: 29 January 2024 / Published: 2 February 2024
(This article belongs to the Section H: Geo-Energy)

Abstract

:
The distribution characteristics and main controlling factors of hydrocarbon phases in deep strata from petroliferous basins are important for the evaluation of oil–gas resources and decision-making regarding exploration. The distribution characteristics and controlling factors of the Ordovician hydrocarbon phases are systematically analyzed in the Tazhong I block, Tarim Basin, NW China. The results show that the Ordovician reservoirs in the Tazhong I block are characterized as multi-phase reservoirs with a lateral co-existence of condensates, normal oil reservoirs, and heavy oil reservoirs. From east to west, gas-rich in the fault belt and oil-rich in the platform area are presented. Meanwhile, there are regular variations in the geochemical characteristics of the Ordovician hydrocarbon, showing decreasing trends in the gas/oil ratio (GOR), wax contents, dryness coefficients, methane contents, and methane carbonate isotope values (δ13C1) and an increasing trend in oil densities. Because the same Cambrian–Lower Ordovician source for the Ordovician hydrocarbon is observed in the Tazhong I block, the regular variations in the hydrocarbon phases and geochemical characteristics can be interpreted as records of gas invasion, biodegradation, multi-stage filling, thermal cracking, and thermochemical sulfate reduction (TSR) rather than controlled by the source rock organofacies. This indicated that different kinds of secondary processes for a diversity of the hydrocarbon phase can appear in one region. Our re-construction of the Ordovician hydrocarbon accumulation model in the Tazhong I block encourages future exploration to target gas reservoirs in the fault belt and oil reservoirs in the platform area.

1. Introduction

With the increasing development of petroleum exploration, deep and super-deep hydrocarbon accumulations have become the exploration targets [1,2]. Investigations worldwide have shown that a co-existence of multi-phase hydrocarbons is widespread in the deep formations of a basin, including crude oil, gas condensate, gas, etc. [3].
Hydrocarbon-generating materials and secondary geochemical processes during hydrocarbon accumulation are the main factors for the transformation of hydrocarbon properties and the diversity of hydrocarbon phases in a basin [4,5,6,7,8,9,10]. The secondary geochemical processes include the biodegradation, gas invasion, water/gas washing, thermochemical sulfate reduction (TSR), and thermal cracking of oil. Among them, biodegradation mainly refers to the degradation and destruction of crude oils by anaerobic organisms such as bacteria [11,12]. As anaerobic organisms generally lose their activity above 80 °C, the biodegradation often occurs in environments with shallow reservoir burial and lower temperatures. The essence of biodegradation, always accompanying a water/gas washing to change the phase of hydrocarbon, is to alter the physical properties of crude oils and their composition of molecular compounds, resulting in an increase in the crude oil density and wax content. Gas invasion mainly occurs in areas with multiple stages of hydrocarbon filling and/or migration with large amounts of natural gas [13,14]. Although there are differences in various definitions, such as evaporation fractionation, gas invasion, and migration fractionation, they all describe the changes in compositions and phases of the hydrocarbon after the invasion of natural gas into the reservoirs. TSR is a complex reaction between hydrocarbons and sulfates in formations with a high temperature [15,16]. Crude oil and natural gas require a temperature higher than 120 °C and 140 °C for TSR to occur, respectively [15,16]. TSR can produce a large amount of acidic gases, such as hydrogen sulfide (H2S) and carbon dioxide (CO2). Under high-temperature conditions, crude oils experience thermal stress transformation, and the heavy components gradually break down into light components, ultimately forming a large amount of methane and dry asphalt [17,18,19]. When the GOR exceeds a critical value during crude oil cracking, it will cause the gradual disappearance of the oil phase and cause a phase transition. Oil-cracking gases can form primary reservoirs of natural gases and can also invade previous oil reservoirs and change their hydrocarbon phase [20].
The deep strata in the Tarim Basin are enriched with hydrocarbon resources, and more and more types of hydrocarbon phases have been discovered [21,22]. For example, the Tazhong I block with a co-existence of the oils and condensates in the Ordovician is a typically anatomical region for investigating the formation mechanism of multi-phase reservoirs. According to previous studies of certain oil and condensate reservoirs in the Tarim Basin, there are not only biodegradable heavy oil reservoirs but also secondary condensate reservoirs controlled by the gas invasion and fractionation, as well as high hydrogen sulfide condensate reservoirs controlled by TSR and gas reservoirs controlled by thermal cracking [3,23,24]. For example, condensates and oil reservoirs are distributed separately in the Lower and Upper Carboniferous strata of the Tazhong 4 Oilfield, which is related to the natural gas filling during the Himalayan period (Oligocene–Miocene post-collision processes) and the alteration of oil reservoirs accumulated during the late Hercynian [25,26]. However, a target investigation of the formation mechanism of Ordovician multi-phase reservoirs in the term of the Tazhong I block is needed. Global exploration practices have shown that, in different basins or different regions within the same basin, one or two types of the secondary processes mentioned above are often dominant for the diversity of the hydrocarbon phases, while the occurrence of different kinds of secondary processes in one region or one oil/gas field is very rare [27]. Are the Ordovician multi-phase reservoirs in the Tazhong I block effected by a dominant factor or most of the secondary processes mentioned above?
For the up-mentioned reasons, this paper starts from the latest outcome of hydrocarbon geochemical data and regional geological background, and makes use of hydrocarbon properties and compositions to study the factors controlling a diversity of the Ordovician hydrocarbon phases and build a hydrocarbon accumulation model in the Tazhong I block, Tarim Basin, NW China.

2. Geological Setting

The Tazhong I block is located in the eastern part of the Tazhong Uplift, Tarim Basin, NW China (Figure 1), which had experienced multiple tectonic movements [28,29,30,31]. At the end of the Early Ordovician, the activity of the Tazhong I fault was intense, and the Tazhong Uplift started to form, suffering from erosion. By the early stage of the Late Ordovician, the Tazhong Uplift began to receive a sedimentation, and the Lianglatage Formation deposited. It was followed by a large-scale marine invasion and a deposition of the Sangtamu Formation mudstones. In the end of the Late Ordovician, an intensely tectonic uplift and erosion occurred and led to an erosion of the Sangtamu Formation. At the end of the Silurian, under an action of compressive stress, the Tazhong Uplift further uplifted and solidified, and the Silurian strata experienced a strong erosion [1,32]. In the subsequent tectonic movements, the Tazhong Uplift was mainly manifested as overall settlement and tilting, still maintaining a nose-shaped trend of low in the west and high in the east. The tectonic activity during the entire Hercynian period was relatively weak to this day with only locally developed faults. These tectonic activities led to a two-fault system in the Tazhong I block: NW-trending thrust faults and NE-trending strike-slip faults (Figure 1). The former is dominated by the Tazhong No. I fault, while the latter, from north to south, are the Tazhong 82 shear strike-slip fault and the Tazhong 24 fault. Meanwhile, the Tazhong I block can be divided into the Tazhong No. 1 fault belt and the northern platform (Figure 1).
The Paleozoic strata in the Tazhong I block are relatively complete with thick carbonate deposits developed on the basement of the Precambrian [22]. Exploration and development show that the Ordovician hydrocarbon phases in the Tazhong I block are relatively complex with a co-existence of condensates, normal oils, and heavy oils. The burial depths of most hydrocarbon reservoirs range from 6000 to 7500 m (Figure 1). The main layers for hydrocarbon production in the Tazhong I block are the Ordovician Lianglitage Formation and Yingshan Formation (Figure 2), although some wells have obtained hydrocarbon production from the Cambrian carbonate rocks and Silurian–Carboniferous sandstones. The Ordovician Lianglitage Formation has dense reef and shoal reservoirs, while large fractures are developed near the fault area. The Yingshan Formation has large unconformity surfaces, and its reservoirs are mainly karst fracture cave systems. The caprocks in the study area mainly consist of thick mudstones from the Upper Ordovician Sangtamu Formation and limestones from the Liang3–5 section of the Lianglitage Formation (Figure 2). The Tazhong Uplift has developed three stages of hydrocarbon inclusions, indicating three stages of oil and gas filling, namely the late Caledonian, late Hercynian, and Himalayan periods (Figure 2) [28,31,32,33,34].

3. Sampling and Methods

3.1. Sample Collection

To investigate the accumulation of the Ordovician hydrocarbon, all hydrocarbon production data and oil and gas composition data were provided by the Tarim Oilfield Company, PetroChina, Xinjiang, China. Some natural gas samples were collected from the Ordovician reservoirs. The samples were pure gases collected directly from the wellheads or separators in the fields. Double-ended, stainless-steel bottles (10 cm diameter and approximately 10,000 cm3 volume) equipped with shut-off valves with a maximum pressure of 22.5 MPa were used to collect the gas samples. The pressure inside the container was kept higher than atmosphere. After the collection of gas samples, the bottle was immersed into a water bath for leakage testing.

3.2. Stable Carbon Isotope Measurements of Natural Gases

Stable carbon isotope values of the gas samples were measured on a Thermo Delta V Advantage instrument interfaced with an HP 5890II gas chromatograph. The gas chromatograph was equipped with a Poraplot Q capillary column (30 m × 0.32 mm), and helium was used as the carrier gas. The gas components were separated on the gas chromatograph in a stream of helium, converted into CO2 in a combustion interface, and then injected into the mass spectrometer. The samples were injected at an initial temperature of 50 °C (held for 3 min) after which the oven was heated to 190 °C at a rate of 15 °C/min and held at that temperature for 15 min. The gas samples were analyzed in triplicates, and the stable carbon isotope data are expressed in the delta notation in permil (‰) relative to VPDB (Vienna Pee Dee Belemnite, δ13CVPDB = 0‰). Analytical precision is estimated to be ±0.1‰.

4. Characteristics and Distribution of the Ordovician Hydrocarbon

4.1. GOR

The GOR of the Ordovician hydrocarbon reservoirs in the Tazhong I block show an overall trend of high in the fault belt and low in the northern platform, and their values are related to the type of oil and condensate reservoirs (Figure 3). The GOR of the oil reservoirs, volatile-oil reservoirs, and condensates are less than 300 m3/m3, between 300 m3/m3 and 550 m3/m3, and over 550 m3/m3, respectively. In particular, the oil density of heavy oil reservoirs is larger than 0.90 g/cm3. The gas condensate reservoirs are mainly concentrated near the Tazhong No. 1 fault belt, and the oil reservoirs are mainly developed in the northern platform. The average GOR of the Ordovician reservoirs near the Tazhong No. 1 fault belt is 2940 m3/m3; individual values even reach more than 20,000 m3/m3. For example, the GOR of wells A83 and A261 are 24,161 m3/m3 and 8568 m3/m3, respectively. The GOR in the north platform range from 0 to 420 m3/m3. For example, the GOR in wells A161 and B434 are 190 m3/m3 and 20 m3/m3, respectively, which are relatively low. From the perspective of plane distribution, the reservoirs from the intersection of the strike slip fault and thrust fault (A83 and A24 well areas) have relatively high GOR (Figure 3).

4.2. Oil Properties

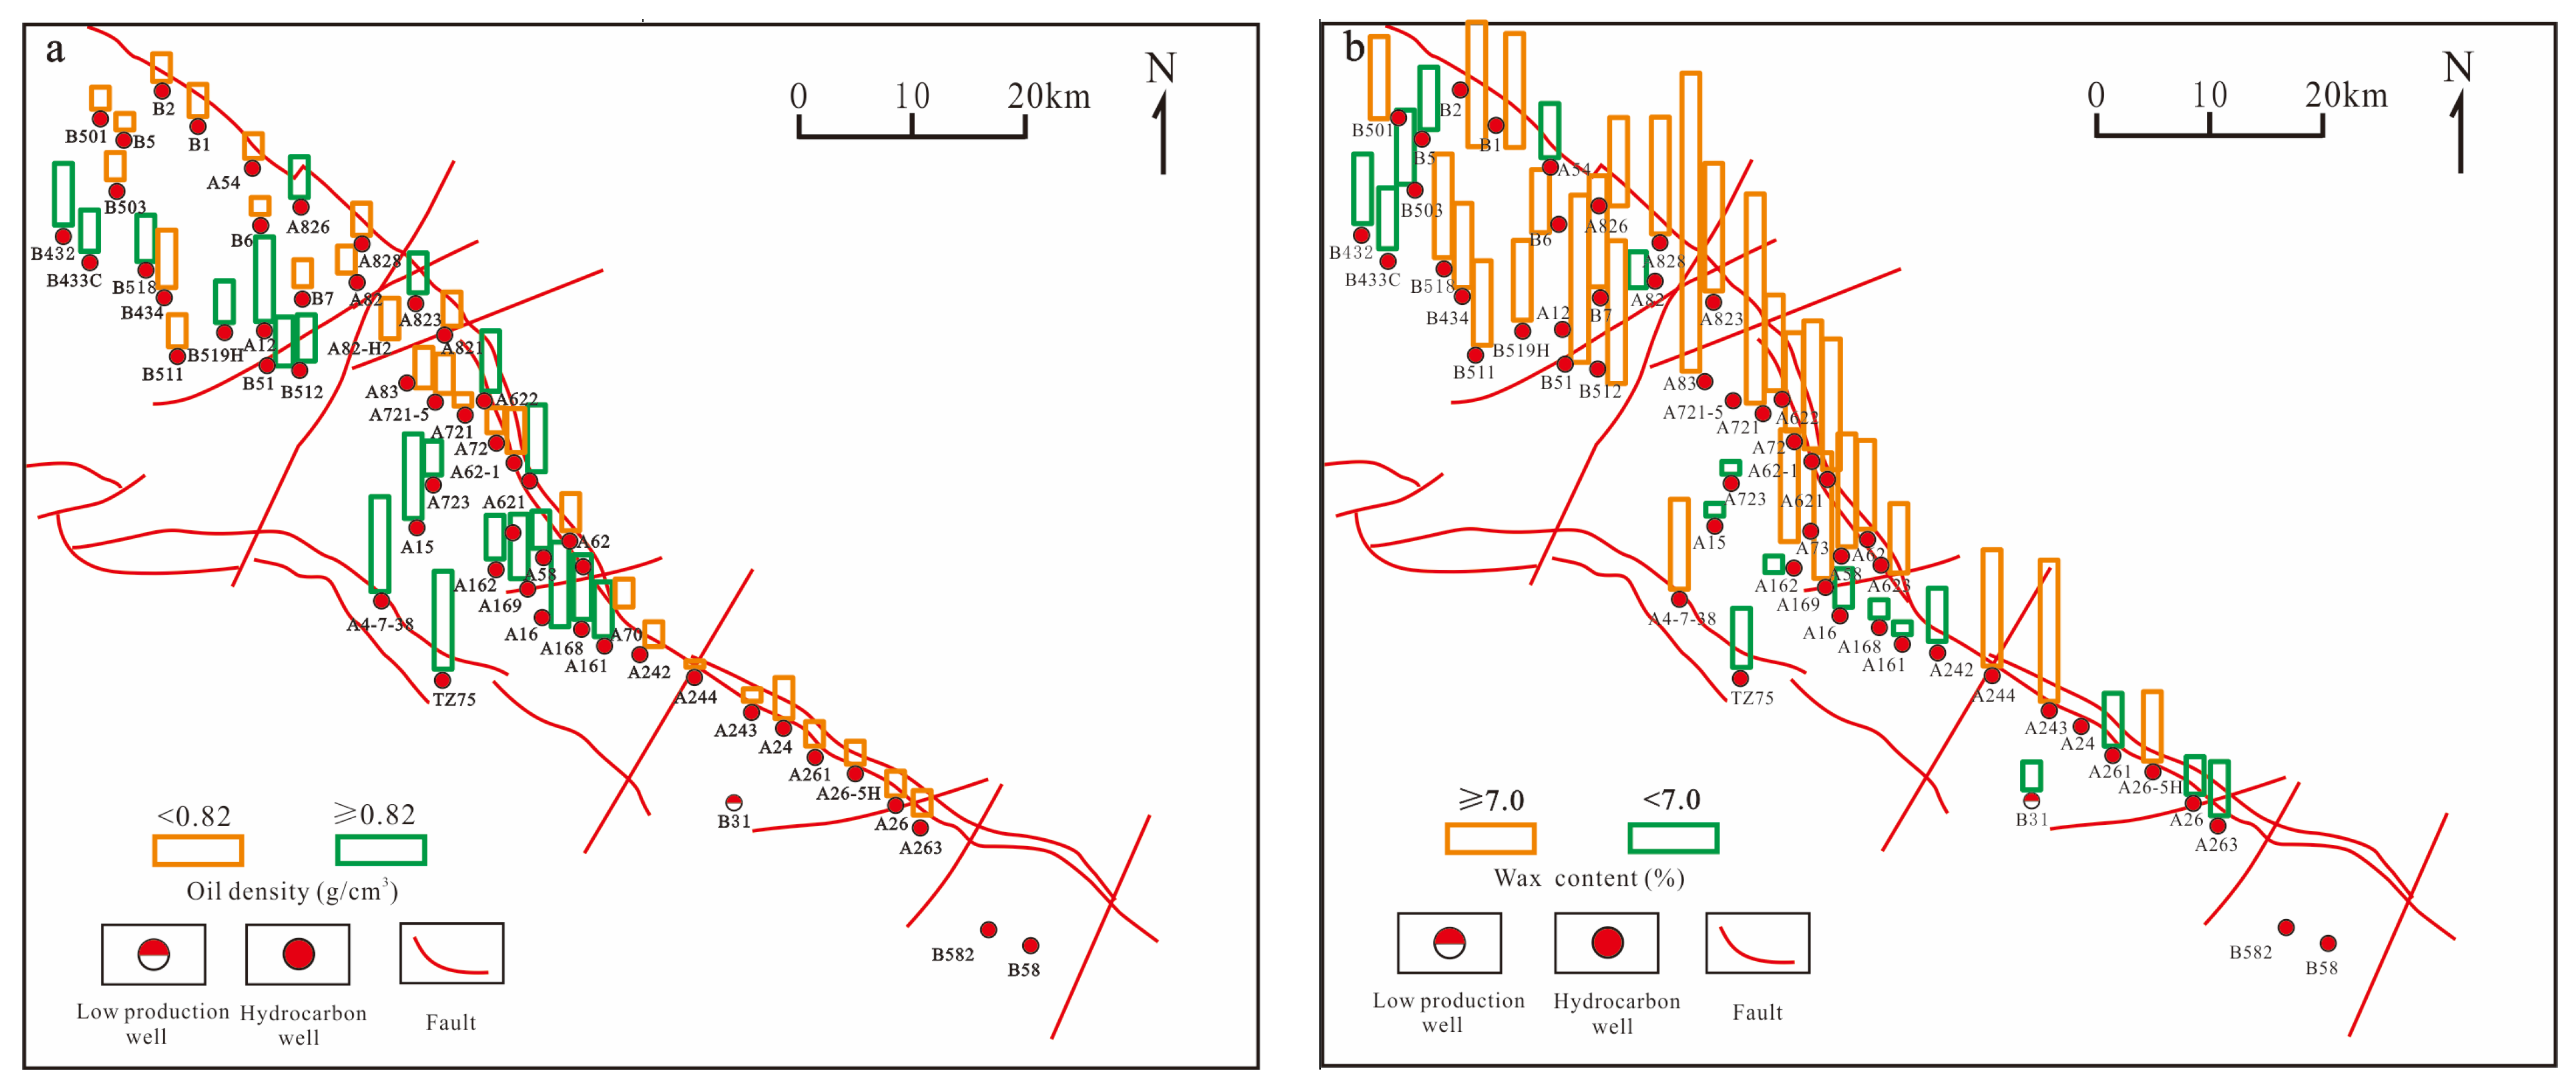
The densities of the crude oils at 20 °C in the Ordovician condensates of the Tazhong I block range from 0.76 g/cm3 to 0.84 g/cm3 with a mean of 0.81 g/cm3, and the oil viscosities at 50 °C range from 0.75 m Pa·s to 5.48 mPa·s. The sulfur contents range from 0.01% to 0.51%, and the wax contents range from 3.1% to 17.4% (Figure 4). The oil densities at 20 °C in the Ordovician oil reservoirs range from 0.82 g/cm3 to 0.98 g/cm3 with a mean of 0.87 g/cm3. The oil viscosities at 50 °C range from 2.41 mPa·s to 29.13 mPa·s. The sulfur contents range from 0.01% to 2.02%, and the wax contents range from 1.07% to 13.8% (Figure 4). The planar distribution of oil properties shows that the oil densities show a trend of high in the northern platform and low in the Tazhong No. 1 fault belt, while the wax contents show a trend of low in the northern platform and high in the Tazhong No. 1 fault belt. In particular, the crude oils from the intersection of the strike slip fault zones and tear thrust faults have a relatively low crude oil density, viscosity, and sulfur content, while they have high wax contents, which are characteristics of condensates (Figure 4).

4.3. Gas Compositions

The dry coefficients and hydrogen sulfide (H2S) contents of the Ordovician gases in the Tazhong I block are characterized as high in the fault belt and low in the northern platform, and their values were associated with the type of hydrocarbon reservoirs (Figure 5). The methane contents of the gases in the condensates are in a range of 54.4%~96.0%, the dry coefficients of the gases range from 0.81 to 0.99, and the H2S contents range from 8 ppm to 56,200 ppm. The methane contents in the oil reservoirs range from 48.9% to 88.8%, the dry coefficients range from 0.76 to 0.96, and the H2S contents range from 7 ppm to 21,400 ppm. Comparative studies have shown that natural gases in condensate reservoirs have dry gas characteristics, while the dry coefficients in oil reservoirs are relatively low. For example, along the direction from the Tazhong No. 1 fault belt (well B2) to the northern platform (well B5-B503-B433C), the dry coefficients of the gases decrease from 0.97 to 0.94, 0.90, and 0.77, respectively. From the perspective of plane distribution, the natural gases from the intersection of the strike slip fault and thrust fault (A83) have relatively high dry coefficients (Figure 5).

4.4. Hydrocarbon Phases

The fluid PVT phase simulation is an important method for identifying the hydrocarbon phase. Two typical hydrocarbon wells (A82 and B432) were selected for the PVT experiments, and the results showed that there was a co-existence of condensate reservoirs and oil reservoirs in the Ordovician of the Tazhong I block (Figure 6). Combining the physical properties of crude oils and natural gases, it can be observed that different phases of hydrocarbon are exhibited in the Tazhong I block, reflecting complex genetic relationships. Notably, the oil densities show that heavy oil reservoirs are distributed in the Tazhong 15 and 16 reservoirs (Figure 4).

5. Factors Controlling the Diversity of the Ordovician Hydrocarbon Phase

5.1. Origin of Hydrocarbon

The type and maturity of the source rock are important factors controlling the hydrocarbon phases. It is generally believed that humic-type kerogen (type III) is mainly gas generating, sapropelic-type kerogen (type I) is mainly oil generating, and transitional-type kerogen (type II) is associated with both oil and gas [7,9]. Meanwhile, as the degree of thermal evolution and maturity of the hydrocarbon source rocks increase, the GOR gradually increases, and the hydrocarbon phase transits from liquid to gas [7,9].
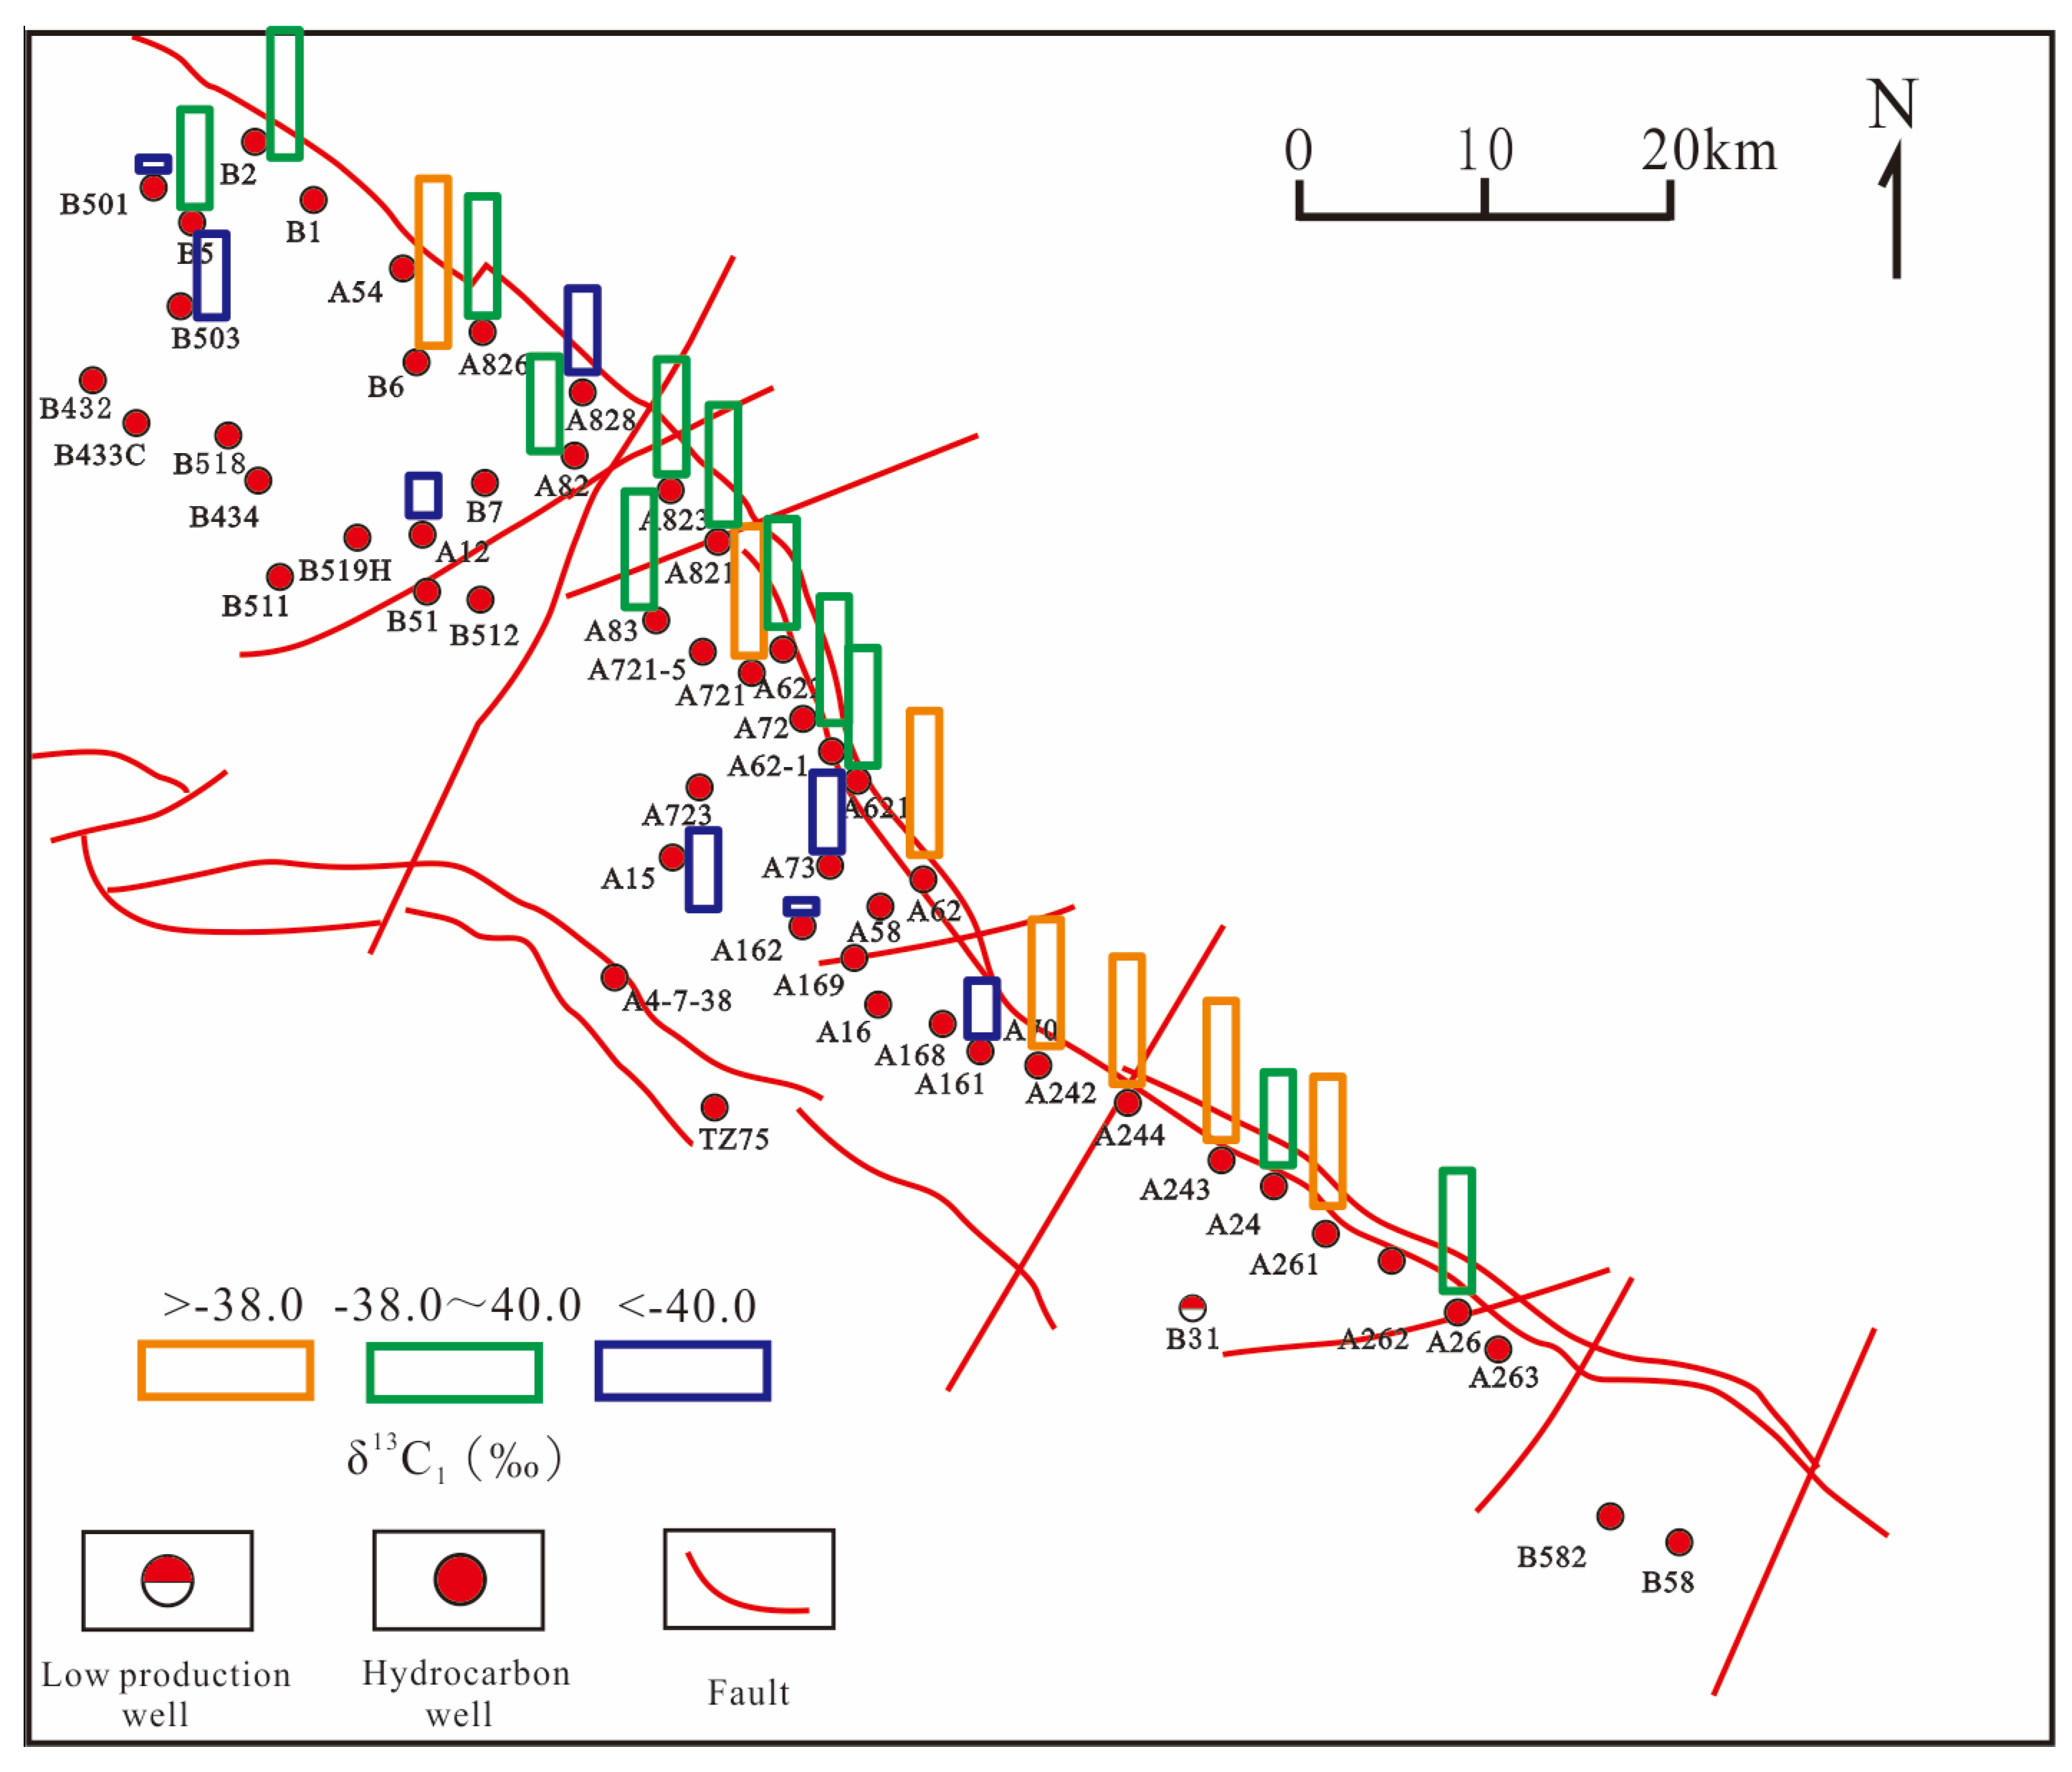
The origin of Ordovician hydrocarbons in the Tarim Basin, whether they come from Cambrian–Lower Ordovician source rocks or Middle–Upper Ordovician source rocks, has a long-term debate [23,35,36,37,38,39,40,41,42]. Recently, by systematically summarizing and comparing the research history of the hydrocarbon source in the Tarim Basin and combining with the new simulation experiment data and exploration knowledge, it is found that the difference of thermal evolution between hydrocarbon source rocks and various secondary processes are the key reasons leading to the previous controversy of oil-source correlation results [43,44]. Meanwhile, a new indicator for oil-source correlation was established based on combination of the aromatic isoprene, sulfur isotopes, and individual carbon isotopes, revealing that the Ordovician oils in the Tarim Basin are mainly from the Cambrian–Lower Ordovician source rocks [43,44]. The confirmation of the origin of Ordovician natural gases in the Tarim Basin is mostly based on the dryness coefficients and methane carbon isotopes (δ13C1). It is known that wet gases with small δ13C1 values originate from the Middle–Upper Ordovician sources, while dry gases with large δ13C1 values originate from the Cambrian–Lower Ordovician sources [41,45]. The dry coefficients of the Ordovician gases in the Tazhong I block are generally high with over 70% of samples having a dry coefficient greater than 0.9, and the highest reaches 0.99, indicating that the Ordovician gases were characterized as a high maturity or over maturity. Meanwhile, the δ13C1 values of the Ordovician gases have a range of −49.1‰~−34.8‰ with an average of 39.3‰ (Figure 7). According to the relationship between the δ13C1 value of the gas and Ro values, the Ro values for most of the Ordovician gases range from 1.3% to 2.2%, indicating that their source rocks have high maturity. Previous studies on the hydrocarbon generation history have shown that the Cambrian–Lower Ordovician source rocks reached their peak of hydrocarbon generation in the late Ordovician period with an organic matter maturity of approximately 2.0% in the late Hercynian period. Currently, the organic matter maturity is higher than 2.0%, while the Middle–Upper Ordovician source rocks began to generate hydrocarbons in the late Permian and are now at a peak of oil generation. Therefore, the maturity of Ordovician natural gas in the Tazhong I block does not match the maturity of Middle–Upper Ordovician source rocks, indicating that it may mainly come from Cambrian–Lower Ordovician source rocks.
Due to the fact that both oil and gas in the study area originated from the Cambrian–Lower Ordovician source rocks, the controlling of hydrocarbon phases by source rocks is mainly manifested by the controlling of the source rock maturity. Research has shown that, as the depth increases, the degree of thermal evolution of source rocks continues to increase, showing a gradual decrease in the generation and expulsion of low mature liquid petroleum and an increase in the generation of hydrocarbon gas with a high maturity [46,47]. High molecules with weight substances gradually transform into small molecules, and oils evolve towards high volatility [46,47]. Briefly, the degree of thermal evolution of source rocks in the study area controls the differential charging of oil and gas in different phases during different hydrocarbon expulsion periods, resulting in multiple stages of differential charging of oil and gas (see details in the following section).

5.2. Multi-Stage Filling of Hydrocarbon

The Ordovician oil and gas in the Tazhong I block mainly originated from the Cambrian–Lower Ordovician source rocks, which are widely distributed in the basin. The maturity of the source rocks varies greatly due to thermal action and tectonic activity, and multi-stage hydrocarbon generation and expulsion have taken place [28,31,33,34]. The multi-stage hydrocarbon generation and expulsion in the Tazhong I block feature multi-stage filling and multi-stage hydrocarbon accumulation: (1) late Caledonian period, (2) late Hercynian period, and (3) Himalayan period (Figure 2). The first two stages were dominated by an oil filling, while the Himalayan period was dominated by a natural gas filling [45,48]. Multi-stage hydrocarbon generation and expulsion as well as multi-stage hydrocarbon filling and accumulation are the basis of the distribution of Ordovician multi-phase hydrocarbon in the Tazhong I block. Hydrocarbon filling in the later stage often alters the early reservoirs, causing the hydrocarbon phases to be extremely complex.

5.3. Hydrocarbon Biodegradation

In geological history, multi-stage tectonic movements occurred in the Tazhong I block (Figure 2), in which the study area experienced intense S-N trending compressive stress during the late Caledonian–early Hercynian, and the strata were subjected to intense uplift and denudation. As a result, most of the Sangtamu mudstone caprocks in the northwest were denuded [1,32]. The high intensity of tectonic activity in this period destroyed the hydrocarbon reservoirs formed in the late Caledonian, and the crude oils in traps moved upward to the surface and were subjected to secondary alteration such as biodegradation, forming heavy oils or asphalts. The oil density in some areas was even higher than 0.95 g/cm3 with sulfur contents of over 1.6% (Figure 4). For example, the oil densities of the crude oils from the Well A15 and Well A16 are 0.97 g/cm3 and 0.98 g/cm3, respectively. Meanwhile, the biomarker characteristics of some Ordovician heavy oil in the study area showed unresolved complex mixtures (UCM), unrecognizable peaks, and unknown bulges, which can be observed in the saturated and aromatic hydrocarbon total ion flow map (Figure 8). Furthermore, there are complete 25-norhopane series compounds, indicating that these crude oil samples suffered a high degree of biodegradation [49,50,51].

5.4. Crude Oil Cracking

The Ordovician natural gas in the Tazhong I block mainly consists of dry gas. Methane is dominant, and the contents of the methane are generally greater than 90.0%. The dry coefficients of the gases are mainly higher than 0.92 (Figure 5), and the δ13C1 values of the vast majority of natural gases focus on −38.0‰ to −40.0‰, showing similar characteristics to oil-cracking gas, i.e., high methane contents and large carbon isotope values. Figure 9 displays the Ln(C1/C2)–Ln(C2/C3) diagram that is used to characterize the natural gases [52]. The Ordovician natural gases in the Tazhong I block are located close to or within the area of oil-cracking gases, indicating their origin of secondary cracking of crude oil (Figure 9). In addition, diamantine, as a series of compounds with a diamond carbon matrix, has strong thermal stability in crude oils [53]. The degree of thermal evolution and oil cracking can be quantitatively evaluated with diamantine [53,54]. The commonly used parameters are the methyl diamantane index (MDI) and the dimethyl diamantine index (DMDI-1). The test of diamantane concentrations of 12 Ordovician condensate oil samples in the Tazhong I block shows that the range of MDI is 0.40 to 0.62, and that of DMDI-1 is 0.32 to 0.65. According to the relationship between the diamantane index and vitrinite reflectance, the corresponding maturity parameter Ro of the Ordovician oil samples in the Tazhong I block is mainly distributed between 1.0% and 1.7%, which is in a range of maturity–high maturity. Combined with the simulation results of hydrocarbon generation, when Ro > 1.6%, oil-cracking gas dominates, indicating that the Ordovician crude oils in the Tazhong I block feature oil-cracking properties. The extensive formation of Ordovician oil-cracking gas in the study area is closely associated to TSR [55,56]. TSR with active sulfate has been confirmed in a previous study [20]. Compared with oil cracking by geothermal temperature rising alone, TSR can significantly reduce the thermal stability of oils and the threshold temperature for oil cracking [57,58]. The start-up temperature for crude oil cracking with TSR is generally 30 to 60 °C lower than that of crude oil cracking alone [59]. The high H2S content in the Tazhong I block is the evidence of the TSR.

5.5. Gas Invasion

The Tazhong I block has the necessary geological conditions for gas invasion: (1) primary hydrocarbon reservoirs; (2) a generation of large quantities of natural gas in the late period; and (3) channels for natural gas invasion and a favorable area for natural gas accumulation. As mentioned above, large-scale oil reservoirs formed in the late Caledonian and late Hercynian periods, and gas filling dominated in the Himalayan period. Multistage oil and gas filling provided the basis for the occurrence of gas invasion. At the same time, faults were developed in the Tazhong I block, especially the No. I fault belt, which connected the Ordovician reservoirs and the Cambrian source rocks to provide a channel for the Himalayan gas migration and invasion.
In reservoirs where gas invasion occurred, dynamic and repeated gas charging can result in regular variations in the hydrocarbon properties and compositions. The effects include increases in the GOR, dry coefficient, wax content, and carbon isotope values and a decrease in oil density [7,60]. In addition to the obviously regular distribution of GOR and oil density of the Ordovician reservoirs as mentioned above (Figure 3 and Figure 4), the wax contents of crude oils and the dry coefficients in the target formation show an obvious high-value anomaly near the Tazhong No. 1 fault belt (Figure 4). While the high-value anomaly far from the fault belt gradually weakens, i.e., from east to west, the wax contents of the crude oils and dry coefficients show a decreasing tread (Figure 4 and Figure 5). In addition, geochemical parameters, such as the carbon isotope of the gases, are commonly used to identify and evaluate the intensity of gas invasion. As the intensity of the gas-washing fractionation increases, δ13C1 values gradually increase [61]. According to the distribution of δ13C1 values of the Ordovician gases in the Tazhong I block, the δ13C1 values in the gas condensate reservoirs, which near the Tazhong No. 1 fault belt are larger, and the maturity of gases in the gas condensate reservoirs is higher than that in the oil reservoirs from the northern platform (Figure 7). For example, the δ13C1 values of the Ordovician gases in the Wells A62 and A621 near the Tazhong No. 1 fault belt are −37.1‰ and −38.5‰, respectively, while those of Ordovician gases distributed in the northern platform are relatively low, such as A73 (−40.7‰) and A162 (−49.1‰). These distribution differences of hydrocarbon compositions and δ13C1 values indicate the gas invasion occurred in the Tazhong I block: gases migrated vertically through the Tazhong I fault belt, took priority to accumulate in the Ordovician reservoirs, and then orderly invaded in the early hydrocarbon reservoirs from the fault belt to the northern platform along their lateral migration ways. Due to the difference in gas invasion intensity, the gas invasion intensity increases with closing to the Tazhong No. 1 fault belt, and predominantly gas condensate reservoirs with relatively abnormal hydrocarbon properties are distributed.

6. Formation of the Ordovician Hydrocarbon Reservoirs with Multi-Phases

The formation of the multi-phase hydrocarbon reservoirs in the Ordovician of the Tazhong I block is not only affected by biodegradation but also controlled by multi-stage oil–gas filling, oil cracking, TSR, and gas invasion, which feature complex distribution characteristics of being “gas-rich in a fault belt and oil-rich in a platform area” (Figure 1 and Figure 10).
During the late Caledonian period, thick mudstone in the Upper Ordovician Sangtamu Formation deposited, and the source rocks of the Cambrian–Lower Ordovician matured rapidly and began to generate and expulse hydrocarbons in large quantities. Hydrocarbons migrated upwards into the Ordovician reservoirs, forming the first stage of the oil reservoirs (Figure 10a). The reservoir temperature and pressure at this period were relatively low, and predominantly, the liquid reservoirs were enriched. During the late Caledonian–early Hercynian, the Tazhong I block experienced strong tectonic evolvements, the whole stratum was uplifted and denuded, and the early Ordovician reservoirs were generally subjected to secondary alteration such as biodegradation (Figure 10b). In particular, the A16 and A15 reservoirs in the structural high positions suffered from severe caprock erosion and strong oil degradation, resulting in heavy oil with high density and high sulfur content (Figure 4).
Late Hercynian was another important hydrocarbon accumulation period in the Tazhong I block. Cambrian–Lower Ordovician source rocks were buried deep again and entered another hydrocarbon-generating stage. Oils filled into the Ordovician reservoirs, and most of the heavy oils or asphalts degraded by microorganisms in the early stage were changed into normal reservoirs (Figure 10c); currently, these residual heavy reservoirs are distributed locally in the study area (Figure 10c). At this time, the formation temperature was still within the critical temperature with the predominantly volatile oil or normal oil reservoirs.
Since the Himalayan period, strata in the Tazhong I block have rapidly subsided, and the very thick Cenozoic strata covered the middle and lower sedimentary assemblages, which accelerated hydrocarbon generation and gas generation from oil cracking. Highly mature oil-cracking gas and primary natural gas from the Cambrian–Lower Ordovician source rocks were injected from bottom to top through the Tazhong No. 1 fault and then into the Yingshan and Lianglitage reservoirs of the Ordovician (Figure 10d). Gas invasion and alteration were carried out for the early oil reservoirs in the two-target formation, and finally, condensate reservoirs were formed near the fault belt. Furthermore, as the distance from the fault belt increased, the migration distance of natural gas gradually increased, the gas invasion intensity gradually decreased, and the gas condensate reservoir gradually transited to oil reservoirs (Figure 10d).
According to the distribution characteristics and formation mechanism of the Ordovician multi-phase reservoirs in the Tazhong I block, it proposed future exploration to target gas reservoirs in the fault belt and oil reservoirs in the northern platform.

7. Conclusions

The Ordovician reservoirs in the Tazhong I block, Tarim Basin, are characterized by multi-phase reservoirs with a co-existences of condensates, normal oil reservoirs, and heavy oil reservoirs. From east to west, the distribution characteristics of ‘gas-rich in a fault belt and oil-rich in a platform area’ are presented. Particularly, there are regular variations in the geochemical characteristics of the Ordovician hydrocarbon, showing a decreasing trend in GOR, wax contents, dryness coefficients, methane contents and methane carbonate isotope values, as well as an increasing trend in oil densities. Because the same Cambrian–Lower Ordovician source for the hydrocarbon is observed in the Tazhong I block, the regular variations in the hydrocarbon phases and geochemical characteristics can be interpreted as records of gas invasion, biodegradation, multi-stage filling, oil cracking, and TSR rather than controlled by the source rock organofacies. This indicated that different kinds of secondary processes for diversity of the hydrocarbon phases can appear in one region. Our re-construction of the Ordovician hydrocarbon accumulation model in the Tazhong I block proposes future exploration to target gas reservoirs in the fault belt and oil reservoirs in the platform area.

Author Contributions

Methodology, C.W., Q.B., and S.C.; software, Q.B. and S.C.; formal analysis, H.X. and Q.B.; investigation, J.L. and C.Z.; writing—original draft preparation, Y.W. and W.S.; visualization, J.L. and C.Z.; supervision, J.L.; project administration, Y.W. and W.S.; funding acquisition, Y.W. and W.S. All authors have read and agreed to the published version of the manuscript.

Funding

This study was funded by PetroChina Science and Technology Projects (2021DJ0603), the Basic scientific research from Chinese Academy of Geological Sciences (JB2322).

Data Availability Statement

The original contributions presented in this study are included in the article; further inquiries can be directed to the corresponding author.

Conflicts of Interest

Authors Yifeng Wang and Jian Li were employed by the CNPC. Author Chen Zhang was employed by the Oil and Gas Development Department, Tarim Oilfield Company, PetroChina. The remaining authors declare that the research was conducted in the absence of any commercial or financial relationships that could be construed as a potential conflict of interest.

References

  1. Lan, X.D.; Lv, X.X.; Zhu, Y.M. The geometry and origin of strike–slip faults cutting the Tazhong low rise megaanticline (central uplift, Tarim Basin, China) and their control on hydrocarbon distribution in carbonate reservoirs. J. Nat. Gas Sci. Eng. 2015, 22, 633–645. [Google Scholar] [CrossRef]
  2. Zhu, G.Y.; Yang, H.J.; Su, J.; He, K.; Han, J.F.; Gu, L.J.; Zhu, Y.F.; Zhang, B.T. True exploration potential of marine oils in the Tarim basin. Acta Petrol. Sin. 2012, 28, 1333–1347. (In Chinese) [Google Scholar]
  3. Zhang, Z.Y.; Zhu, G.Y.; Zhang, Y.J.; Han, J.F.; Li, T.T.; Wang, E.Z. The origin and accumulation of multi–phase reservoirs in the east Tabei uplift, Tarim Basin, China. Mar. Pet. Geol. 2018, 98, 533–553. [Google Scholar] [CrossRef]
  4. Chung, H.M.; Gormly, J.R.; Squires, R.M. Origin of gaseous hydrocarbons in subsurface environments: Theoretical considerations of carbon isotope distribution. Chem. Geol. 1988, 71, 97–103. [Google Scholar] [CrossRef]
  5. Dai, J.X.; Qi, H.F.; Song, Y.; Guang, D.S. Gas compositions from coal measure, types of carbon isotopes and their formation and implication. Sci. China Ser. B 1986, 16, 1317–1326. [Google Scholar]
  6. Guo, L.; Xiao, X.; Tian, H.; Song, Z. Distinguishing gases derived from oil cracking and kerogen maturation: Insights from laboratory pyrolysis experiments. Org. Geochem. 2009, 40, 1074–1084. [Google Scholar]
  7. Prinzhofer, A.; Huc, A.Y. Genetic and post–genetic molecular and isotopic fractionations in natural gases. Chem. Geol. 1995, 126, 281–290. [Google Scholar] [CrossRef]
  8. Scott, A.R.; Kaiser, W.R.; Ayers, W.B.J. Thermogenic and secondary biogenic gases, San Juan Basin, Colorado and New Mexico implications for coal bed gas producibility. AAPG Bull. 1994, 78, 1186–1209. [Google Scholar]
  9. Schoell, M. Genetic characterization of natural gases. AAPG Bull. 1983, 67, 2225–2238. [Google Scholar]
  10. Huang, D.F.; Liu, B.Q.; Wang, T.D. Genetic type and maturity of Lower Paleozoic marine hydrocarbon gases in the eastern Tarim Basin. Chem. Geol. 1999, 162, 65–77. [Google Scholar] [CrossRef]
  11. Masterson, W.D.; Dzou, L.I.P.; Holba, A.G.; Fincannon, A.L.; Ellis, L. Evidence for biodegradation and evaporative fractionation in West Sak, Kuparuk and Prudhoe Bay field areas, North Slope, Alaska. Org. Geochem. 2001, 32, 411–442. [Google Scholar] [CrossRef]
  12. Matyasik, I.; Steczko, A.; Philp, R.P. Biodegradation and migrational fractionation of oil from the Eastern Carpathians, Poland. Org. Geochem. 2000, 31, 1509–1523. [Google Scholar] [CrossRef]
  13. Thompson, K.F.M. Gas–condensate migration and oil fractionation in deltaic systems. Mar. Pet. Geol. 1988, 5, 237–246. [Google Scholar] [CrossRef]
  14. Losh, L.; Cathles, L.; Meulbroek, P. Gas–washing of oil along a regional transect, offshore Louisiana. Org. Geochem. 2002, 33, 655–664. [Google Scholar] [CrossRef]
  15. Zhu, G.Y.; Zhang, B.T.; Yang, H.J. Secondary alteration to ancient oil reservoirs by late gas filling in the Tazhong area, Tarim Basin. J. Pet. Sci. Eng. 2014, 122, 240–256. [Google Scholar] [CrossRef]
  16. Wei, Z.B.; Mankiewicz, P.J. Natural Occurrence of Higher Thiadiamondoids and Diamondoidthiols in a Deep Petroleum Reservoirin the Mobile Bay Gas Field. Org. Geochem. 2011, 42, 121–133. [Google Scholar] [CrossRef]
  17. Pan, C.C.; Jiang, L.L.; Liu, J.Z. The effects of calcite and montmorillonite on oil cracking in confined pyrolysis experiments. Org. Geochem. 2010, 41, 611–626. [Google Scholar] [CrossRef]
  18. Pan, C.C.; Jiang, L.L.; Liu, J.Z. The effects of pyrobitumen on oil cracking in confined pyrolysis experiments. Org. Geochem. 2012, 45, 29–47. [Google Scholar] [CrossRef]
  19. Price, L.C. Thermal stability of hydrocarbons in nature: Limits, evidence, characteristics, and possible controls. Geochim. Cosmochim. Acta 1993, 57, 3261–3280. [Google Scholar] [CrossRef]
  20. Tsuzuki, N.; Takeda, N.; Suzuki, M. The kinetic modeling of oil cracking by hydrothermal pyrolysis experiments. Int. J. Coal Geol. 1999, 39, 227–250. [Google Scholar] [CrossRef]
  21. Wang, Y.Y.; Chen, J.F.; Pang, X.Q.; Zhang, B.S.; Chen, Z.Y.; Zhang, G.Q.; Luo, G.P.; He, L.W. Origin of deep sour natural gas in the Ordovician carbonate reservoir of the Tazhong Uplift, Tarim Basin, northwest China: Insights from gas geochemistry and formation water. Mar. Pet. Geol. 2018, 91, 532–549. [Google Scholar] [CrossRef]
  22. Shen, W.B.; Chen, J.F.; Wang, Y.Y.; Zhang, K.; Chen, Z.Y.; Luo, G.P.; Fu, X. The origin, migration and accumulation of the Ordovician gas in the Tazhong III region, Tarim Basin, NW China. Mar. Pet. Geol. 2019, 101, 55–77. [Google Scholar] [CrossRef]
  23. Li, S.M.; Amrani, A.; Pang, X.Q. Origin and quantitative source assessment of deep oils in the Tazhong Uplift, Tarim Basin. Org. Geochem. 2015, 78, 1–22. [Google Scholar] [CrossRef]
  24. Zhu, G.Y.; Zhang, Z.Y.; Zhou, X.X. The Complexity, Secondary Geochemical Process, Genetic Mechanism and Distribution Prediction of Deep marine Oil and Gas in the Tarim Basin, China. Earth-Sci. Rev. 2019, 198, 102930. [Google Scholar] [CrossRef]
  25. Xiao, X.L.; Sun, Y.G.; Mao, S.Y. Geochemical characterization of light hydrocarbons and its controlling factors in Carboniferous crude oils from the TZ4 Oilfield, Tarim Basin, NW China. Acta Pet. Sin. 2011, 32, 206–211. (In Chinese) [Google Scholar]
  26. Jiang, Z.X.; Yang, J.; Pang, X.Q. Property differences and genetic mechanisms of hydrocarbon in each oil unit of the Carboniferous in Tazhong–4 oilfield. Oil Gas Geol. 2008, 29, 159–166. (In Chinese) [Google Scholar]
  27. Zhu, G.Y.; Li, J.F.; Zhang, Z.Y. Origin of deep oil and gas phase state diversity and evaluation of secondary geochemical intensity—A case study of marine oil and gas in Tarim Basin. Earth Sci. 2021. Available online: https://kns.cnki.net/kcms/detail/42.1874.P.20211108.1622.004.html (accessed on 9 November 2021). (In Chinese).
  28. Wu, F.F.; Zhu, G.Y.; Zhang, S.C.; Jin, Q.; Han, J.F.; Chen, Z.W.; Meng, S.C. Ordovician Hydrocarbon Accumulation and Main Controlling Factors in the Western Margin of Tazhong No.1 Slope 2 Break Zone, Tarim Basin. Geol. Rev. 2010, 56, 339–348. (In Chinese) [Google Scholar]
  29. Wu, G.H.; Cheng, L.F.; Liu, Y.K.; Wang, H.; Qu, T.L.; Gao, L. Strike–slip fault systems of the Cambrian–Ordovician and its oil–controlling effect in Tarim Basin. Xinjiang Pet. Geol. 2011, 32, 239–243. (In Chinese) [Google Scholar]
  30. Li, C.X.; Wang, X.F.; Li, B.L. Paleozoic fault systems of the Tazhong Uplift, Tarim Basin, China. Mar. Pet. Geol. 2013, 39, 48–58. [Google Scholar] [CrossRef]
  31. Han, J.F.; Zhang, H.Z.; Yu, H.F.; Ji, Y.G.; Sun, C.G.; Han, J.; Dong, R.X. Hydrocarbon accumulation characteristic and exploration on large marine carbonate condensate field in Tazhong Uplift. Acta Petrol. Sin. 2012, 28, 769–782. (In Chinese) [Google Scholar]
  32. Zhang, Z.P.; Wang, Y.; Yun, J.B.; Zhou, B.; Zhao, Z.H.; Zheng, M.L. Control of faults at different evolution stages on hydrocarbon accumulation in Tazhong Uplift, the Tarim Basin. Oil Gas Geol. 2009, 30, 316–323. (In Chinese) [Google Scholar]
  33. Han, J.F.; Mei, L.F.; Yang, H.J.; Wu, G.H.; Xu, Z.M.; Zhu, G.Y. The study of hydrocarbon origin, transport and accumulation in Tazhong uplift, Tarim basin. Nat. Gas Geosci. 2007, 18, 426–435. (In Chinese) [Google Scholar]
  34. Huang, H.P.; Zhang, S.C.; Su, J. Palaeozoic oil–source correlation in the Tarim Basin, NW China: A review. Org. Geochem. 2016, 94, 32–46. [Google Scholar] [CrossRef]
  35. Liang, D.G.; Zhang, S.C.; Zhang, B.M. Marine oil generation in China from the perspective of Tarim Basin. Earth Sci. Front. 2000, 7, 534–547. [Google Scholar]
  36. Tian, H.; Xiao, X.M.; Wilkins, R.W.T. An experimental comparison of gas generation from three oil fractions: Implications for the chemical and stable carbon isotopic signatures of oil cracking gas. Org. Geochem. 2012, 46, 96–112. [Google Scholar] [CrossRef]
  37. Zhu, G.Y.; Yang, H.J.; Zhu, Y.F. Study on petroleum geological characteristics and accumulation of carbonate reservoirs in Halahatang Area, Tarim Basin. Acta Petrol. Sin. 2011, 27, 827–844. [Google Scholar]
  38. He, D.X.; Li, B.C.; Hu, J.J. Geochemical characteristics of H2S–bearing natural gas from Halahatang sag. J. China Univ. Pet. (Ed. Nat. Sci.) 2022, 46, 44–52. [Google Scholar]
  39. Fang, R.H.; Wang, T.G.; Li, M.J.; Xiao, Z.Y.; Zhang, B.S.; Huang, S.Y.; Shi, S.B.; Wang, D.W.; Deng, W.L. Dibenzothiophenes and benzo[b] naphthothiophenes, molecular markers for tracing oil filling pathways in the carbonate reservoir of the Tarim Basin, NW China. Org. Geochem. 2016, 91, 68–80. [Google Scholar] [CrossRef]
  40. Sun, Y.G.; Xu, S.P.; Lu, H. Source facies of the Paleozoic petroleum systems in the Tabei uplift, Tarim Basin, NW China, implications from aryl isoprenoids in crude oils. Org. Geochem. 2003, 34, 629–634. [Google Scholar] [CrossRef]
  41. Wang, T.G.; Song, D.F.; Li, M.J. Natural gas source and deep gas exploration potential of the Ordovician Yingshan Formation in the Shunnan–Gucheng region, Tarim Basin. Oil Gas Geol. 2014, 35, 753–762. [Google Scholar]
  42. Cai, C.F.; Zhang, C.M.; Worden, R.H. Application of sulfur and carbon isotopes to oil–source rock correlation: A case study from the Tazhong area, Tarim Basin, China. Org. Geochem. 2015, 83–84, 140–152. [Google Scholar] [CrossRef]
  43. Zhu, G.Y.; Chen, F.R.; Wang, M. Discovery of the lower Cambrian high–quality source rocks and deep oil and gas exploration potential in the Tarim Basin, China. AAPG Bull. 2018, 102, 2123–2151. [Google Scholar] [CrossRef]
  44. Li, F.; Zhu, G.Y.; Lv, X.X.; Zhang, Z.Y.; Wu, Z.H.; Xue, N.; He, T.; Wang, R. The disputes on the source of Paleozoic marine oil and the determination of the Cambrian system as the main source rocks in Tarim Basin. Acta Pet. Sin. 2021, 42, 1417–1436. [Google Scholar]
  45. Chen, J.F.; Xu, Y.C.; Huang, D.F. Geochemical characteristics and origin of natural gas in the Eastern Tarim Basin (I). Acta Sedimentol. Sin. 2000, 18, 606–610. [Google Scholar]
  46. Pang, X.Q.; Jiang, Z.X.; Li, J.Q.; Zhou, R.N. Geological thresholds in the process of forming oil and gas reservoir and their functions of controlling petroleum. J. Univ. Pet. China (Ed. Nat. Sci.) 2000, 24, 53–57. [Google Scholar]
  47. Pang, X.Q. Quantitative Simulation of the Geological Process; Petroleum Industry Press: Beijing, China, 2003; pp. 286–321. [Google Scholar]
  48. Hanson, A.D.; Zhang, S.; Moldowan, J.M. Molecular organic geochemistry of the Tarim Basin, northwest China. Am. Assoc. Pet. Geol. Bull. 2000, 84, 1109–1128. [Google Scholar]
  49. Li, P.C.; Chen, G.H.Q.; Meng, R.Y.; Tan, M.; Hao, J.L.; Tang, C.Y.; Long, L.P.; Zhang, Y. Geochemistry of Ordovician natural gas and its origin and distribution in central Tarim basin, China. Nat. Gas Geosci. 2010, 21, 321–330. (In Chinese) [Google Scholar]
  50. Li, S.M.; Pang, X.Q.; Yang, H.J.; Gu, Q.Y.; Han, J.F.; Li, M. Analysis of characterize and type of the crude oil. Earth Sci. (J. China Univ. Geosci.) 2008, 5, 635–642. [Google Scholar]
  51. Li, S.M.; Zhang, B.S.; Zhang, H.Z.; Sheng, S.Z.; Zhao, M. Geochemical Characteristics and Affecting Factors of the Unusually High Dibenzothiophenes Oils in the Tazhong Uplift. Geoscience 2011, 25, 1108–1120. [Google Scholar]
  52. Behar, F.; Ungerer, P.; Kressmann, S. Thermal evolution of crude oils in sedimentary basins, Experimental simulation in a confined system and kinetic modeling. Rev. L’inst. Fr. Pet. 1991, 46, 151–181. [Google Scholar] [CrossRef]
  53. Dahl, J.E.; Moldowan, J.M.; Peters, K.E.; Claypool, G.E.; Rooney, M.A.; Michael, G.E.; Mello, M.R.; Kohnen, M.L. Diamondoid hydrocarbon as indicators of natural oil cracking. Nature 1999, 399, 54–57. [Google Scholar] [CrossRef]
  54. Chen, J.H.; Fu, J.M.; Sheng, G.Y.; Liu, D.H.; Zhang, J.J. Diamondoid hydrocarbon ratios: Novel maturity indices for highly mature oils. Org. Geochem. 1996, 3/4, 179–190. [Google Scholar] [CrossRef]
  55. Cai, C.F.; Li, K.K.; Ma, A.L.; Zhang, C.M.; Xu, Z.M.; Worden, R.H.; Wu, G.H.; Zhang, B.S.; Chen, L.X. Distinguishing Cambrian from Upper Ordovician source rocks: Evidence from sulfur isotopes and biomarkers in the Tarim Basin. Org. Geochem. 2009, 40, 755–768. [Google Scholar] [CrossRef]
  56. Cai, C.F.; Zhang, C.M.; Cai, L.L.; Wu, G.H.; Jiang, L.; Xu, Z.M.; Li, K.K.; Ma, A.L.; Chen, L.X. Origins of Palaeozoic oils in the Tarim Basin: Evidence from sulfur isotopes and biomarkers. Chem. Geol. 2009, 268, 197–210. [Google Scholar] [CrossRef]
  57. Hill, R.J.; Tang, Y.C.; Kaplan, I.R. Insights into oil cracking based on laboratory experiments. Org. Geochem. 2003, 34, 1651–1672. [Google Scholar] [CrossRef]
  58. Cross, M.M.; Manning, D.A.C.; Bottrell, S.H. Thermochemical sulphate reduction (TSR): Experimental determination of reaction kinetics and implications of the observed reaction rates for petroleum reservoirs. Org. Geochem. 2004, 35, 393–404. [Google Scholar] [CrossRef]
  59. Zhao, W.Z.; Wang, Z.Y.; Zhang, S.C.; Wang, H.J.; Wang, Y.P. Oil cracking gas is an important pathway for efficient gas generation in marine gas source stoves. Chin. Sci. Bull. 2006, 51, 589–595. [Google Scholar]
  60. Smith, J.E.; Erdman, J.G.; Morris, D.A. Migration, accumulation and retention of petroleum in the earth. In Proceedings of the 8th World Petroluem Congress, Moscow, Russia, 13–19 June 1971; pp. 13–26. [Google Scholar]
  61. Kolaczkowska, E.; Slougui, N.E.; Watt, D.S. Thermodynamic stability of vorious alkylated, dealkylated, and rearranged 17α- and 17β- hopnae isomers using molecular mechanics calculations. Org. Geochem. 1990, 4, 1033–1038. [Google Scholar] [CrossRef]
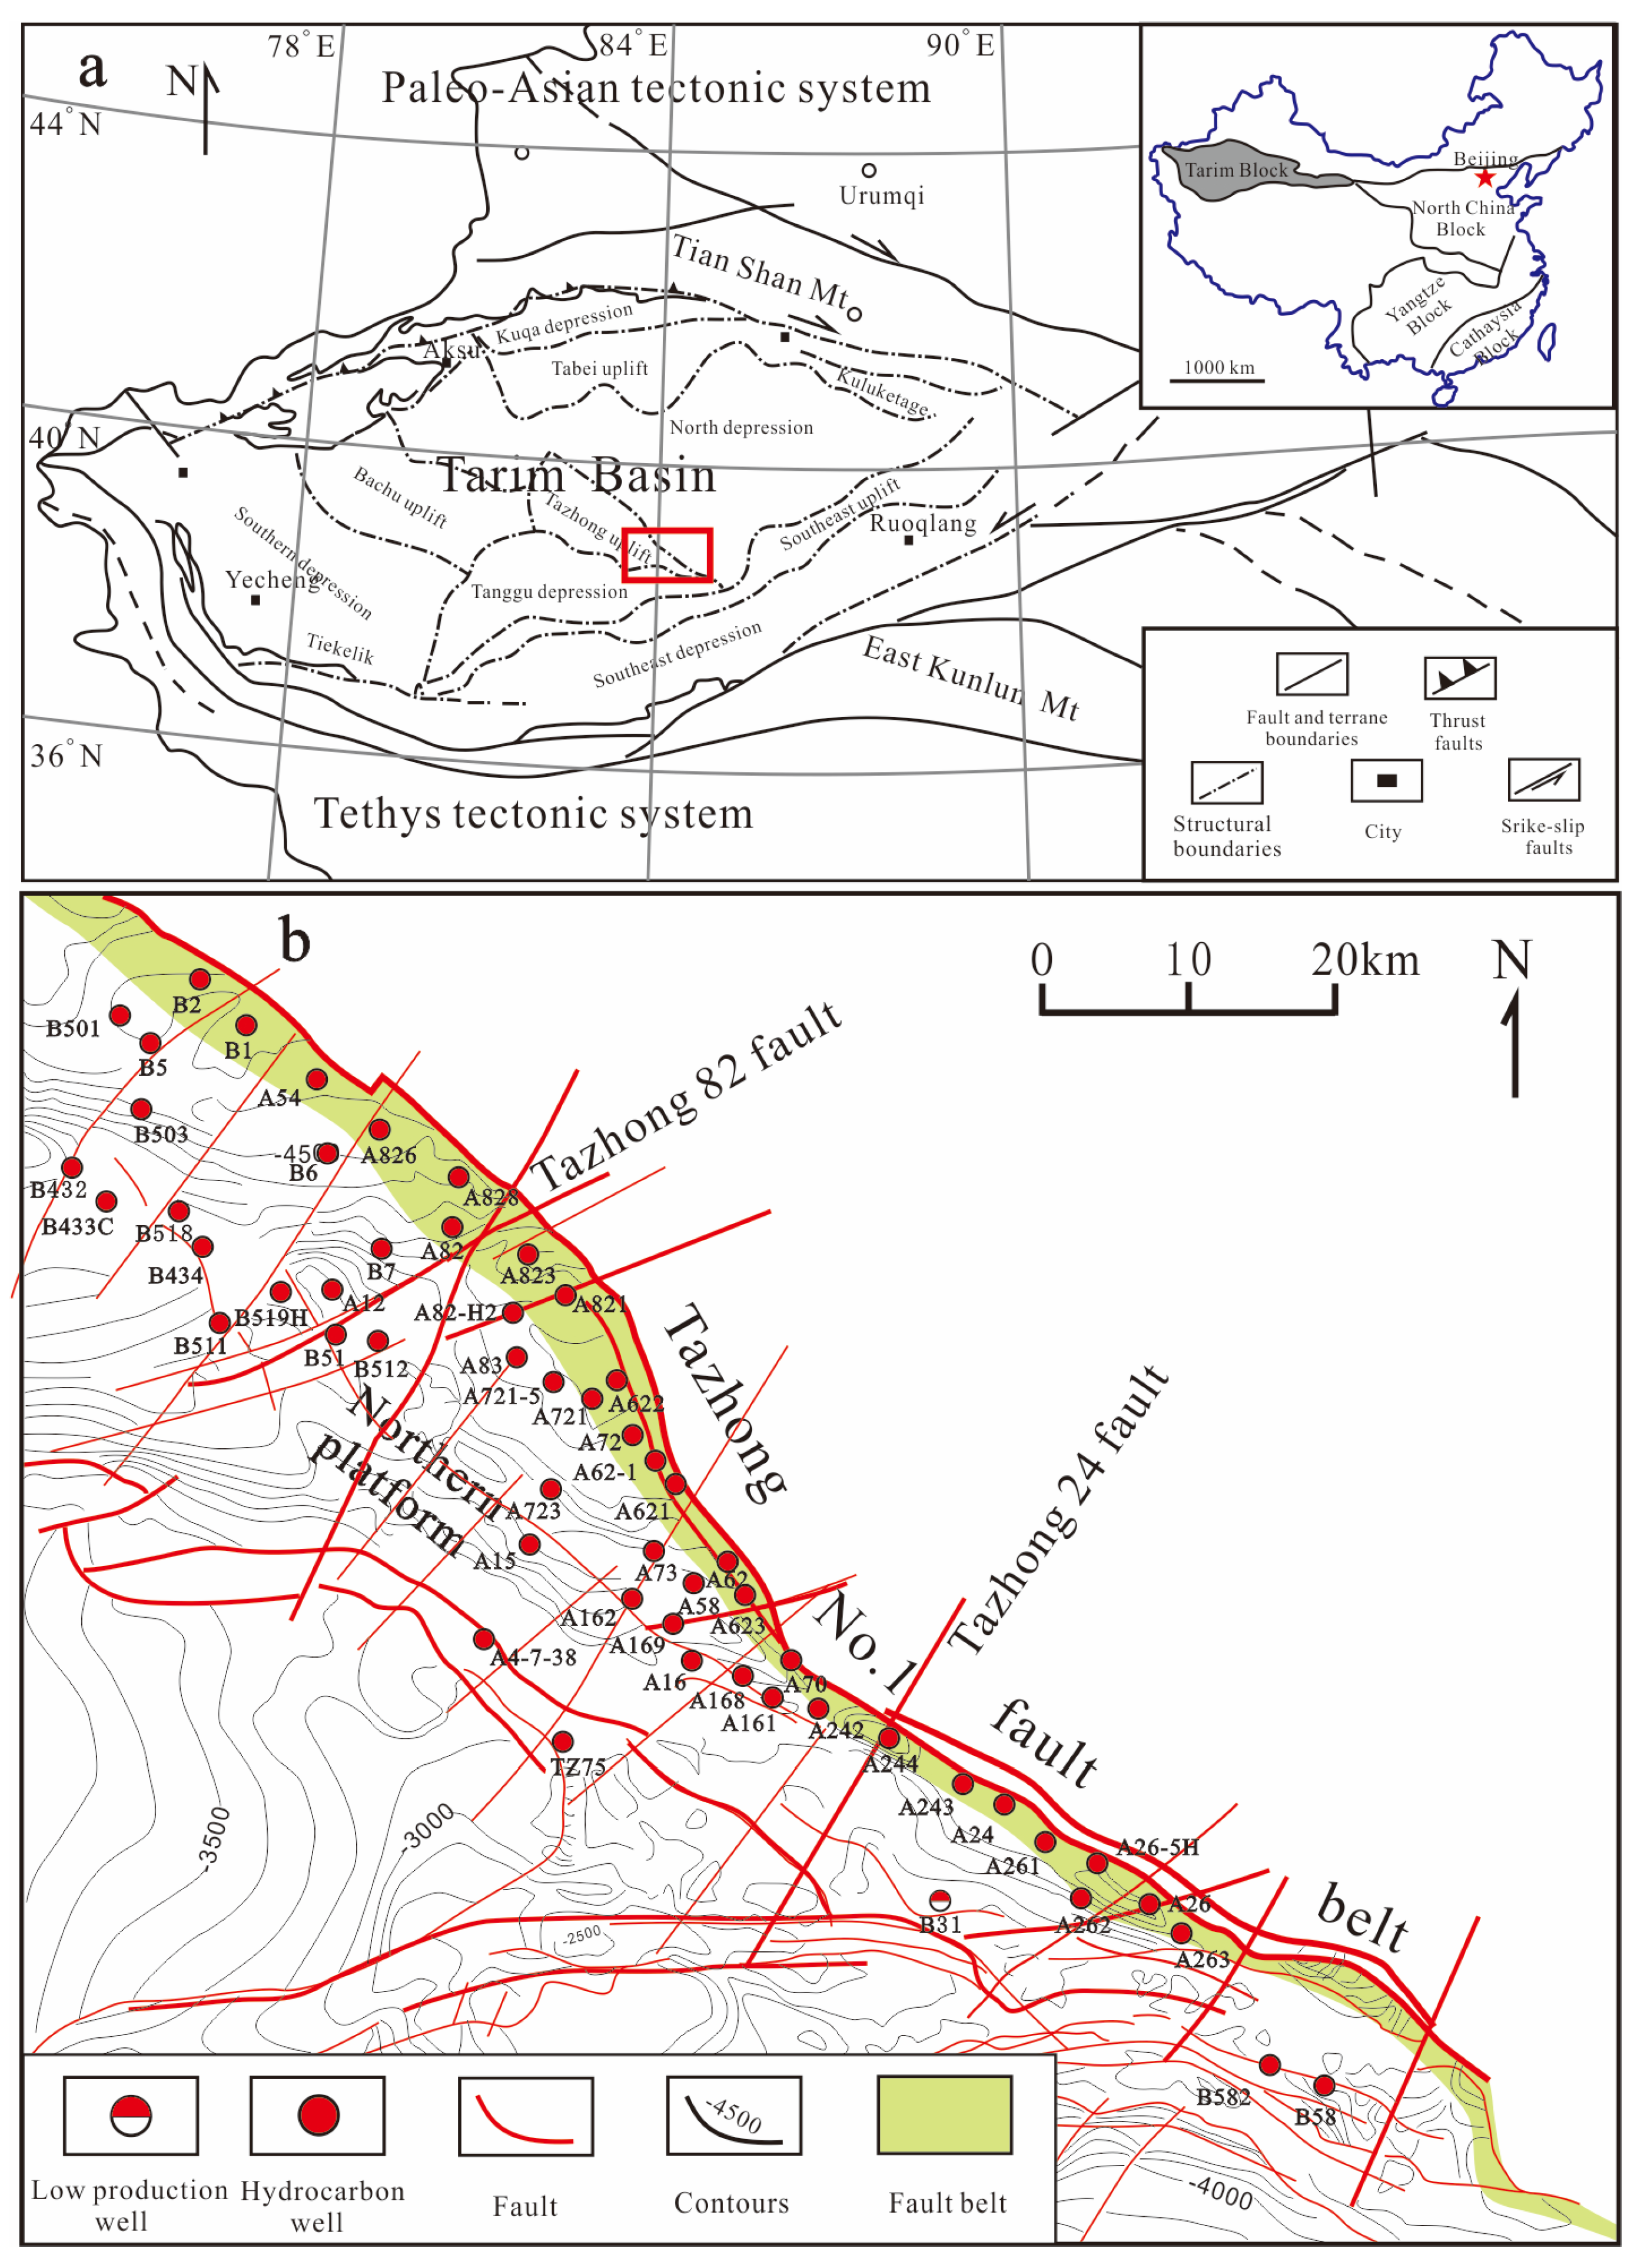
Figure 1. Ordovician reservoired oil–gas distribution in the Tazhong I block, Tarim Basin, NW China. (a) Location of the Tarim and its tectonic division (modified from the [1]). The red box shows the location of the Tazhong I block in the basin (b) Geological setting and hydrocarbon distribution in the Tazhong I block.
Energies 17 00723 g001
Figure 2. Lithology and petroleum geological settings in the Tazhong I block, Tarim Basin. (a) Generalized stratigraphic column of the Tazhong I block, showing the reservoir–caprock assemblage and hydrocarbon show (the orange area). Reef limestone refers to limestone with a biological skeleton structure. (b) The expelled hydrocarbon curves show the hydrocarbon generation history in the Tazhong Uplift. Є: Cambrian; O: Ordovician S: Silurian; D: Devonian; C: Carboniferous; P: Permian; T: Triassic; J: Jurassic; K: Cretaceous; E: Tertiary; N + Q: Neogene + Quaternary.
Energies 17 00723 g002
Figure 3. GOR distribution in the Ordovician reservoirs in the Tazhong I block, Tarim Basin.
Energies 17 00723 g003
Figure 4. Distribution of oil properties in the Ordovician reservoirs in the Tazhong I block, Tarim Basin. (a) Oil density; (b) Wax content.
Energies 17 00723 g004
Figure 5. Distribution of gas compositions in the Ordovician reservoirs in the Tazhong I block, Tarim Basin. (a) CH4 contents; (b) Dry coefficient.
Energies 17 00723 g005
Figure 6. Fluid phase diagrams and fluid tricomponent diagram of representative Ordovician samples in the Tazhong I block, Tarim Basin. (a) Well A82; (b) Well B432; (c) Gas compositions show the hydrocarbon phase in the Well A82 and Well B432.
Energies 17 00723 g006
Figure 7. Distribution of methane carbon isotope of the Ordovician gases in the Tazhong I block, Tarim Basin.
Energies 17 00723 g007
Figure 8. Total ion flow chart of aromatic hydrocarbons in the Ordovician crude oils in the Tazhong I block, Tarim Basin.
Energies 17 00723 g008
Figure 9. Scatter plots for the identification of the Ordovician natural gas genesis by Ln(C1/C2) and Ln(C2/C3).
Energies 17 00723 g009
Figure 10. Accumulation model of hydrocarbon in the Ordovician multi-phase reservoirs from the Tazhong I block, Tarim Basin. The section A–A’ can be seen in the Figure 1. (a) Hydrocarbon accumulation during the late Caledonian period. (b) Hydrocarbon accumulation during the late Caledonian–early Hercynian. (c) Hydrocarbon accumulation during the Late Hercynian. (d) Hydrocarbon accumulation during the Himalayan period.
Energies 17 00723 g010
Disclaimer/Publisher’s Note: The statements, opinions and data contained in all publications are solely those of the individual author(s) and contributor(s) and not of MDPI and/or the editor(s). MDPI and/or the editor(s) disclaim responsibility for any injury to people or property resulting from any ideas, methods, instructions or products referred to in the content.