Abstract
The outlined methodology for calculating operating costs in open-cast mines and quarries not only facilitates the selection of optimal mining equipment and systems for working lower-grade secondary deposits but also adds significant value in navigating the challenges of fluctuating prices of energy carriers and fuels. Moreover, the study rigorously assesses the impact of mining operations on the performance of deployed mining equipment and the overall viability of the rock mining project. The selection procedure relies on a comprehensive analysis of the technical and economic parameters of selected solutions, providing critical insights to guide decisions regarding the continuation or discontinuation of mining operations. We analyse, based on empirical data, the technical and economic parameters of several variants of mining equipment to be used for the extraction of rocks and stones from secondary deposits in conditions of fluctuation depending on the level of energy prices, in order to find the best configuration in terms of operating costs and potential revenue. In addition to analysing the structure of operating costs, the article presents their correlation with the required profit from the sale of raw materials using the linear correlation method. The results clearly demonstrate the economic viability of mining secondary deposits, taking into account the actual costs incurred by mining companies.
1. Introduction
Secondary marginal deposits are often found in surface mines and quarries adjacent to current workings and excavations, and the presence of numerous karst interlayers adds a further complication to the exploitation of the target deposits. Hitherto, the secondary deposit sections have been regarded as waste rock sections to be hauled away to dumping sites; alternatively, they have been left undisturbed when not interfering with excavation works in progress. This is now regarded as a major issue in the light of the economic, engineering, and environmental considerations presented by Dino, G. A. et al. [1].
In the light of current environmental concerns and the need to foster sustainable mining practices, it is reasonable to thoroughly analyse the structure of mining costs related to potential configurations of mining equipment in relation to the viability of secondary deposit mining projects, particularly when the prices of energy carriers and fuels tend to increase and fluctuate.
This issue is of particular importance because of the perpetual demand for rock and stone for the construction and road-building industry; moreover, the extraction sector is under pressure to also increase production from mining deposits, hitherto regarded as secondary mineral deposits and waste rock sections.
In view of the above, it seems necessary to carry out an analysis, based on empirical data, of the technical and economic parameters of several variants of mining equipment to be used for the extraction of rocks and stones from secondary deposits in fluctuating conditions, depending on the level of energy prices, in order to find the best configuration in terms of operating costs and potential revenues.
The cost effectiveness of machine system configurations is analysed in relation to the impact of fluctuations in energy and fuel carrier prices over the period 2019–2023.
The starting point of the analysis is 2019, when energy and fuel prices were stable, followed by a decrease in 2020, then a slight price increase in 2021, followed by a brief stabilisation and a sharp increase in 2022. The analysis is complemented by data up to mid-2023 showing current price levels for energy and fuel sources. In addition to analysing the structure of operating costs, the article presents their correlation with the required profit from the sale of raw materials using the linear correlation method.
Mining practice has shown that even in cases when the secondary mining operations are planned to be resumed, in most cases, they will never commence, as described by Jonczy, I. and Gawor, Ł. [2] and Marcisz, M. et al. [3]. On the other hand, selective extraction would allow the limitation of the size of dumping sites through generating smaller amounts of rock debris, as described by Dino, G. A. et al. [1], Stenis, J. and Hogland, W. [4], and Kaźmierczak, U. et al. [5]. The exploitation of secondary mineral deposits, hitherto treated as rock waste, alongside the excavation of the target deposit, may prove cost effective in the end since entire sections of waste rock do not go to the dumping site, as described by Patyk, M. and Bodziony, P. [6] and Yıldız, T. D. [7]. Rana, A. et al. [8] and Kumar Gautam, P. et al. [9] described the scope of recycling in the limestone mining industry is described.
Anon [10] outlines the broad cost patterns for the major functions within an open-pit operation. The estimation of operating costs in mining in Australia were investigated in [11,12,13]. Bertisen, J. and Davis, G. [14] described the modelling of the capital costs of mining projects via Monte Carlo analysis. The estimation of operating costs with multiple variables for open-pit mines is also described in the paper [15]. Analyses for reducing the operating costs of mining ventures are described in [16,17]. The authors of this article tried to describe the cost structure of machine systems in quarries [18]. Improvements in the operational efficiency of mining processes and cost efficiency were analysed in [19]. Rai San, H. et al. [20] determined the proportions of operating costs and capital expenditures, taking into account the transportation costs, in an open-pit mine. This issue was also addressed by Demir, E. et al. [21] and Hajarian, A. and Osanloo, M. [22], Rodovalho, E. [23] and Ercelebi, S. and Bascetin, A. [24], and Choudhary, R. [25]. Kecojevic, V. and Komljenovic, D. [26] investigated the cost and environmental burden of the haul trucks deployed in surface mining. Kecojevic, V. et al. [27] determined the proportions of the cost of energy consumption and the total energy cost in relation to the total revenue from open-pit coal mining. Ozdemir, B. and Kumral, M. [28] proposed a cost model that considers all activities in the mining cycle, adopting a system-wide approach to minimizing the total cost of bench production. Guo, H. et al. [29] relied on artificial intelligence to estimate costs in open-pit copper mining [30]. An empirical analysis of mining operations in Australia was conducted by Valle de Souza, S. et al. [31]. Carmichael, D. G. et al. [32] explored the relationship between the optimal unit cost of surface mining operations and the optimal unit of the emissions produced. Dougall, A. and Mmola, T. [33] identified key performance areas in southern African surface mining. Budeba, M. et al. [15] proposed a model for estimating the cost and technical efficiency of a surface mine. Teplická, K. et al. [34] summarised the research work on economic indicators used to evaluate the efficiency and functionality of mining processes. Da Gama, C. [35] presented the methodology used in each phase of an open-pit mining project to assess its current technical and economic feasibility. Dehghani, H. [36] and Costa Lima, G. A. [37] described the impact of cost variability on a mining project. Meanwhile, Mishra, P. C. et al. [38] described the impact of various factors on the performance of mining operations. Uberman, R. [39] and Mancini, S. et al. [40] wrote about the demand for recycled raw materials and secondary deposits in the EU.
2. Materials and Methods
The analysis was conducted to support the selection of mining equipment to be deployed in a surface limestone quarry with interbedded karst interlayers, such that 30% of the deposit is regarded as off-spec material and thus treated as waste rock. Additionally, this waste rock has to be hauled to the dumping site, which leads to a further increase in production costs. The output product is the raw material base (RMB) free from admixtures, requisite for preparing aggregate mix for the construction industry. The predetermined output level was taken to be 600 t/h for each configuration of the mining equipment. The underlying assumption was that equipment should be leased and serviced by a third-party service hired by the manufacturer of the mining equipment (the lessor company). Investment outlays on machines are not taken into consideration because the mining equipment in most part should be leased. Apart from haul trucks, all machines are effectively used during the two active work shifts for Te = 7 h (productive time). It was assumed that the machines would be used for 25 days in a month, totalling 350 h.
Figure 1 shows the potential configurations of mining equipment to be deployed for secondary deposit mining (selected machines and haulage distances).
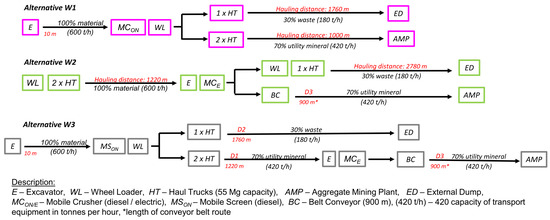
Figure 1.
Configurations of the mining equipment to be deployed for secondary deposit mining.
Previous studies on mining operations in secondary deposits [6] investigated the performance of different mining equipment configurations, yet their deployment proved too costly and hence unprofitable. That is why these variants are not considered in the present analysis.
The following assumptions were made for the analysis. Fixed costs depend on operational factors, while variable costs depend on geo-environmental factors (quantity of heap masses) and energy consumption factors. In this case, the amount of waste material in the deposit and the energy consumption of mining equipment (including transportation and processing equipment) influence variable costs, similar to in the work by Mishra, P.C. et al. [38]. This influence may result in a reduction in the environmental factor in the form of a lower volume of heap masses (less environmental degradation).
Furthermore, to comprehensively address the problem of mining operations, the assumption is that the cost of energy carriers will be the main and decisive component of all operating costs, determining the profitability of mining secondary deposits. Thus, energy consumption costs have a direct and decisive impact on the profitability of mining production. Additionally, it is assumed that there is a strong linear correlation between all operating expenses and generated revenue from the sale of the raw material base (RMB).
Additionally, the profitability range of raw material base (RMB) production was determined based on a cost balance where the sales revenue is reduced by the cost of waste rock storage and the overall operating costs of the mining equipment. Taking into account the sales revenue, which increases due to price adjustments in response to growing demand and the need to cover rising operating costs, a linear regression analysis was conducted to verify the accuracy of the adopted economic model.
The costs involved in the operation of several variants of machines and equipment for secondary deposit mining are thoroughly analysed and categorised, including:
- Fuel consumption (diesel oil/electricity);
- Leasing costs;
- Servicing and maintenance;
- Tyres and tyre servicing (haul trucks);
- Labour costs (payroll).
Fuel consumption (1):
where
- —fuel consumption costs for the technological and transport machines powered by diesel fuel in the i-th variant, PLN/year;
- —energy consumption costs for the technological and transport machines powered by electricity in the i-th variant, PLN/year;
- —average price of diesel fuel, l/PLN;
- —average price of electricity, MWh/PLN (Table 1);
 Table 1. Average price of electricity and diesel oil (per month) over the years 2019–2023.
 - —number of technological and transport machines powered by diesel fuel in the i-th variant;
- —number of technological and transport machines powered by electricity in the i-th variant.
Fuel costs were obtained, taking into account the operating time of machines over one month (350 h), the average price (from year to year, calculated month to month) of one litre of diesel oil and the price of electricity (1 kWh), the average fuel and power consumption, and the forecasted fuel consumption over a given transport route for haul trucks, as well as the number of active shifts.
The payroll costs depend on the number of employees and their wages (2).
where
- —number of operators of loaders, crusher screens, and belt conveyors in the i-th variant;
- —number of haul truck drivers in the i-th variant;
- —machine operator wages, ;
- —haul truck driver, .
Leasing costs for individual variants depend on the type and actual configuration of the mining and quarrying equipment (3).
where
- —number of loaders, crusher screens, and belt conveyors in the i-th variant;
- —number of haul truck in the i-th variant;
- —costs of leasing of loaders, crusher screens, and belt conveyors in the i-th variant, PLN/year;
- —haul trucks leasing costs in the i-th variant, PLN/year.
The total maintenance costs of haul trucks depend on the number of machines and the usage rate of the dump bed; in the case of other machines, these are related to their number and unit costs. The cost calculation procedure was similar to that adopted to obtain the leasing costs (4).
where
- —maintenance costs of loaders, crusher screens, and belt conveyors in the i-th variant, PLN/year;
- —maintenance costs for haul trucks in the i-th variant, PLN/year;
- —number of loaders, crusher screens, and belt conveyors in the i-th variant;
- —number of haul trucks in the i-th variant.
Tyre service (5):
where
- —number of loader tyres in the i-th variant;
- —tyre service costs for loaders in the i-th variant, PLN/mth;
- —number of haul truck tyres in the i-th variant;
- —tyre service costs for haul trucks in the i-th variant, PLN/mth.
All analysed costs are presented as values excluding tax (net). The cost data for diesel fuel were derived from actual data [41]. The data regarding the costs for electricity, leasing, servicing, and tyres were provided by the mines as average monthly costs. The labour costs have been adopted as average monthly remuneration costs for specific production employees, provided by several mining plants with a similar production profile.
The total operating costs of the machines are presented in Table 2.

Table 2.
Analysed costs of mining and quarrying equipment over the years 2019–2023.
The cost analysis involved three steps (stages). Step 1 highlighted the cost structure and cost itemisation for different configurations of mining equipment covering the years 2019–2022. In Step 2, the focus was on the variability of costs involved in the operation of mining equipment in various configurations to identify the key cost components. In Step 3, the range was determined in which the production of the RMB from secondary deposits was still economical and profitable in the conditions of fluctuating costs. The cost effectiveness of the mining equipment in each configuration was analysed empirically, assuming that all products (aggregate mix) should be sold and that sales proceeds and dumping prices might fluctuate. The costs of blasting works, which remained unchanged in each considered variant, were omitted for further analysis as they had no bearing on the overall operating costs of the mining equipment.
3. Results and Discussion
Step 1—Cost structure in different configurations of mining equipment for the years 2019–2023 (itemised costs).
The starting point in the analysis was the year 2019, when both fixed and variable costs had remained stable and unchanged for several years. For variant 1, the total costs were found to be the lowest in relation to the remaining variants. The respective differences were PLN 144 thousand (20%) in relation to W2, PLN 158 thousand (22.1%) in relation to W3, and PLN 454 thousand (63.5%) (Table 3 and Figure 2). The unit costs for energy carriers and fuels were PLN 460/MW (electricity price) and PLN 4.0 per one litre of diesel oil.

Table 3.
Cost components in each configuration of mining equipment in 2019.
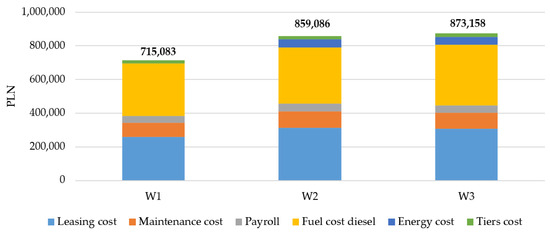
Figure 2.
Cost structures of mining equipment operations in different configurations in 2019.
All costs have been expressed in PLN.
In 2020, the total costs decreased slightly in relation to 2019, as shown in Figure 3, and variant W1 proved to have the lowest total cost. The respective differences between variant W1 and the remaining variants were PLN (142 thousand 21.4%) in relation to W2 and PLN 420 thousand (63.4%) in relation to W3 (Table 4, Figure 3). In 2020, the unit costs of energy carriers and fuels were PLN 380/MW (electricity price) and PLN 3.26 per one litre of diesel oil.
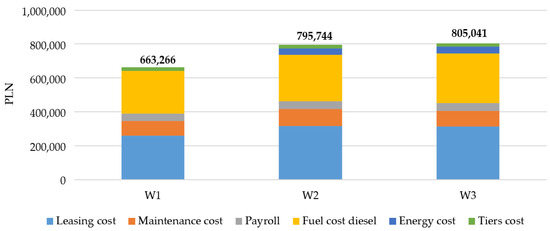
Figure 3.
Cost structures of mining equipment operations in different configurations in 2020.

Table 4.
Cost components in each configuration of mining equipment in 2020.
All costs have been expressed in PLN.
In 2021, the unit costs for energy carriers and fuels were PLN 560/MW (electricity price) and PLN 3.26 per one litre of diesel oil, showing a sharp increase in the price of electricity (Table 5), leading, as a consequence, to a marked increase in the total operating costs (Figure 4). The total cost involved in variant W1 was PLN 765 thousand, whilst variants W2 and W3 would generate higher costs: W2—LN 161 thousand (21%) and W3—PLN 176 thousand (23%).

Table 5.
Cost components in each configuration of mining equipment in 2021.
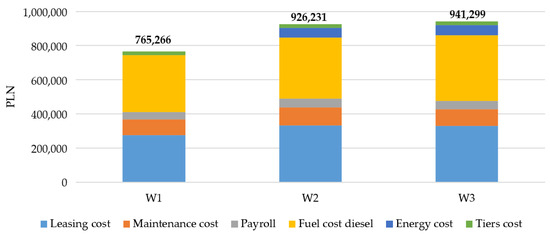
Figure 4.
Cost structures of mining equipment operations in different configurations in 2021.
All costs have been expressed in PLN.
In 2022, the prices of all energy carriers and fuels on the world markets rose dramatically, particularly the price of electricity; the increase in the price of diesel oil was less significant. The average unit price of diesel oil was PLN 5.85/litre and the price of electricity was PLN 780/MW. W1 is found to be the most economical and cost-effective variant in those conditions, its total costs being PLN 939/month. As regards W2 and W3, their total costs exceed the costs of variant W1 by PLN 202 thousand/month (21.5%) for W2 and PLN 226 thousand/month (24%) for W3 (Table 6 and Figure 5). Moreover, the respective cost components in variant W1 are found to be the lowest as this configuration uses the fewest machines, so, obviously, the leasing, maintenance, and payroll costs should be the lowest, too.

Table 6.
Cost components in each configuration of mining equipment in 2022.
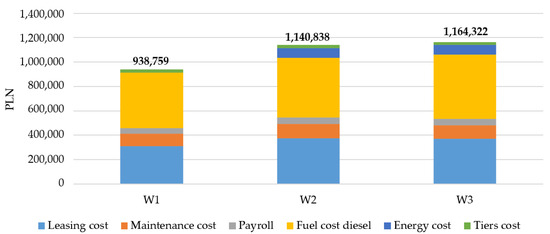
Figure 5.
Cost structures of mining equipment operations in different configurations in 2022.
All costs have been expressed in PLN.
In 2023, the price of diesel oil fell slightly whilst the price of electricity has continued to increase; the mid-year average unit prices were PLN 4.97/L (diesel oil) and PLN 1085/MW (electricity). All the same, W1 still remains the most economical variant, entailing total costs of PLN 896/month (a 4.5% decrease in relation to 2022) and variants W2 and W3 come next in line). The respective cost components of variant W1 are still the lowest. The electricity costs for variants W2 and W3 are decidedly higher, and their total costs exceed W1 by PLN 30 thousand/month (26%) for W2 and by PLN 250 thousand/month for W3 (Table 7 and Figure 6).

Table 7.
Cost components in each configuration of mining equipment in 2023.
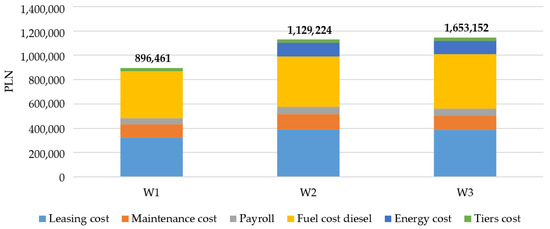
Figure 6.
Cost structures of mining equipment operations in different configurations in 2023.
All costs have been expressed in PLN.
The most considerable cost component in variant W1 is the fuel price, its relative share ranging from 38.2% in 2020 to 48.5% in 2022. The leasing cost is next in line, accounting for 36.1% of the total cost, on average. The relative share of leasing costs in variant W1 ranges from 33.0% in 2020 to 39.2% in 2022. The third-largest cost component, accounting for about 12% of the total cost, is maintenance. These costs range from 11.0% for 2022 to 13.1% in 2020. Average payroll and tyre service costs in this variant account for 8.5% of total costs. In the case of variant W1, a certain regularity is revealed: when fuel prices decrease (2020), leasing and maintenance will increase their share in the total cost structure. As regards the cost structure in variants W2 and W3, leasing costs account for 32.8%/31.9% of the total cost in 2022 and 39.6%/38.8% in 2020, respectively, with an average of 35.9%/35.0%. The relative share of maintenance costs is slightly smaller (relative to W1), ranging from 10.5%/9.5% in 2022 to 12.7%/11.6% in 2020, averaging 11.5%/10.5%. Fuel costs, as in W1, are found to be the largest component in W2 and W3, with their relative shares ranging from 34.2%/36.4% in 2020 to 42.9%/45.1% in 2022—an average of 38.3%/40.5%, which is 5.1%/2.9% less than in variant W1. It can be attributable to the effect of an additional cost component (electricity), ranging from 4.9%/4.8% in 2020 to 9.8%/9.7% in W2 and W3, respectively, in the first six months of 2023, with its average relative share being 6.7%/6.6%.
Step 2—The effects of the fluctuating prices of energy carriers and fuels on the operating cost structure of mining equipment over the years 2019–2023 (monthly).
In step 2, the relative shares of particular cost components in the total cost structure over the 2019–2023 (monthly) period are collated and analysed
In variant W1, with all equipment being diesel-powered, total costs diminished by about 7.2% in 2020 relative to 2019 (Figure 7). This decrease was the lowest among the analysed variants, due to the absence of electric-powered machinery. As a consequence of the increase in diesel prices in 2021, the total costs of operated mining equipment rose by 15.4% relative to 2020 and by 7.0% relative to 2019. The largest increase was reported in 2022, when the total costs increased by 22.7% relative to the previous year and by 31.3% relative to 2019. As shown in Figure 7, the increase in total costs was chiefly caused by the increase in the cost of diesel fuel and the leasing and maintenance cost; each of these cost components grew by 12.5%. In 2023, At the same time, there was a decrease in total costs attributable to a decrease in the diesel oil price. The decrease in total costs in 2023 relative to 2022 was 4.5%, equivalent to less than PLN 45 thousand/month.
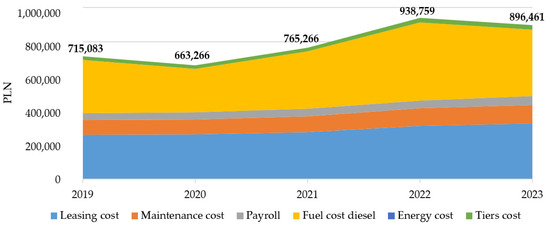
Figure 7.
Variable costs of mining equipment operations for variant W1 over the years 2019–2023, with the main cost categories.
In variant W2, the total costs in 2020 relative to 2019 decreased by about 7.4%. The following year (2021) brought a 16.4% increase in total costs relative to the previous year and a 7.8% increase relative to 2019. In 2022, costs increased by 23.2% relative to 2021 and by 32.8% relative to 2019 (Figure 8). In 2023, there was a 1.0%, decrease in costs, equivalent to less than PLN 12,000/month. In this variant, electricity costs account for 6.7% of all costs on the average, while the aggregate costs of fuel and energy carriers account for 45.0% of all costs, showing a strong dependence on the prices of energy carriers and fuels, particularly diesel oil. On average, diesel costs account for 38.3% of the total cost in the investigated period of time; they accounted for 34.2% in 2020, 42.9% in 2022, and 36.8% of the total cost in 2023. The annual increases in electricity costs caused its relative share of the total costs to rise to 9.8% in 2023 for variant W2. In comparison, the costs of electricity and diesel in 2022 accounted for 7.0% and 42.9% of the total cost, respectively (totalling 49.9%), and for 9.8% and 36.8% in 2023, totalling 46.6%.
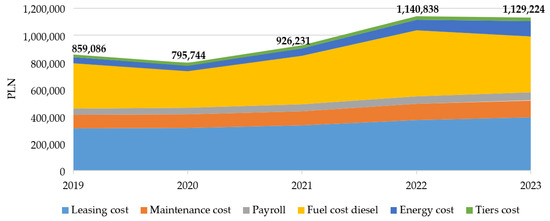
Figure 8.
Variable costs of mining equipment operations for variant W2 over the years 2019–2023, with the main cost categories.
For variant W3, the total costs in 2020 relative to 2019 decreased by 7.8%, the most significant decrease registered among the analysed variants. In 2021, the total costs increased by 16.9% relative to the previous year and by 7.8% relative to 2019. The most significant cost increase was reported in 2022, making it 23.7% (a year average) relative to the previous year and 33.3% relative to 2019, which is the largest reported increase with respect to other variants. In 2023, there was a slight decrease in total costs of about 1.5%, equivalent to PLN 18,000/month. For this variant, electricity costs accounted for about 6.6% of the total costs (on average), while the fuel and energy carriers contributed about 47.1% towards the total cost (Figure 9), revealing a strong dependence on the prices of energy carriers and fuels, particularly diesel oil. The relative share of diesel costs over the entire period under review averages 40.5%. In 2020, it accounted for 36.4% of the total costs; in 2022, the relative share was as high as 45.1%, while in 2023, it dropped again to 39.0%. The change in the relative share of diesel oil costs in 2023 was due to the increasing costs of electricity, accounting for 9.7% in 2023 (a 2.8% increase in relation to 2022). In comparison, the costs of electricity and diesel oil in 2022 accounted for 6.8% and 45.1% of the total costs (totalling 52.0%), and in 2023, their relative shares were 9.7% and 39.0%, respectively (totalling 48.6%).
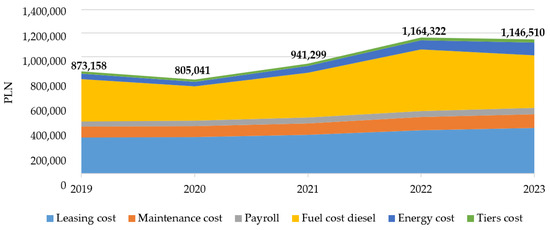
Figure 9.
Variable costs of mining equipment operation for variant W3 over the years 2019–2023, with the main cost categories.
The analysis of cost components and their variability revealed the diesel costs as the main cost component in all the considered variants. For variant W1, the average relative share of these costs is 43.4% in the analysed years: 48.5% in 2022, and 43.1% in 2023. For variants W2 and W3, the average relative share of these costs is 45.0% and 47.1%, respectively, approaching 49.9% and 52.0% in 2022, and 46.6% and 48.6% in 2023. The difference between these variants and W1 is that W2 and W3 use electric-powered machinery, which accounts for about 6.6% of all costs. The analysis shows that in 2022, fuel and electricity costs increased by 5% relative to other years and thus accounted for more than half of the total costs of mining equipment and machinery. On the other hand, a decrease in the price of diesel oil led to a 3% decrease in the relative share of fuel costs in relation to the increasing prices of electricity by 2022.
Step 3—Analysis of the profitability range of RMB production from secondary deposits in each considered variant of deployed mining equipment.
In step three, the profitability range of aggregate mix production is determined in the context of fluctuating operating costs (Table 8) for each investigated variant of the mining equipment, assuming increasing revenues from RMB sales and variable dumping costs.

Table 8.
Total costs involved in the investigated variants of mining equipment over the years 2019–2023.
The profitability range of RMB production was derived relying on the cost balance expressed as sales revenue minus the cost of waste rock dumping and the total operating costs of mining equipment. Dumping costs (Table 9), like other cost components, tend to vary over the years, mainly due to the fluctuating prices of the energy carriers and diesel fuel required for waste rock haulage to the dumping site.

Table 9.
Dumping costs and revenues from sales of aggregate mix over the years 2019–2023 for the considered variants of mining equipment.
Sales revenues show a growing trend thanks to sales price adjustments as a consequence of increasing demand and the need to cover rising costs of mining equipment operations. Both cost components are collated in Table 9.
A linear regression analysis performed to check the validity of the economic model adopted (Figure 10, Figure 11 and Figure 12 and Table 10, Table 11 and Table 12) for all variants representing different configurations of machine systems is presented below; a statistical linear relationship of high significance was noted between the RMB sales revenue generated and the resultant operating costs developed in the analysis in steps 1 through 3. The data used for analysis were considered error-free as they are actual data obtained from the mining facility (all cost components, including the electricity price and revenue from sales in RMB). However, fuel prices (diesel) were based on real market data.
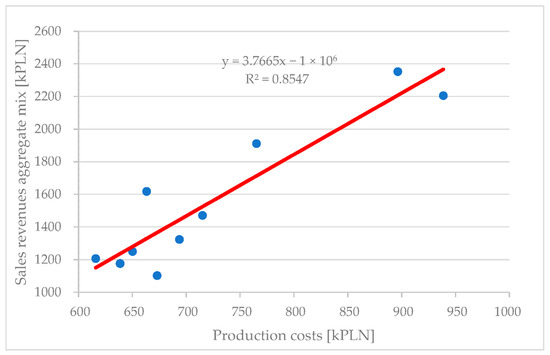
Figure 10.
Regression of variant W1 aggregate mix sales revenue and production costs (MSE = 16.8%).
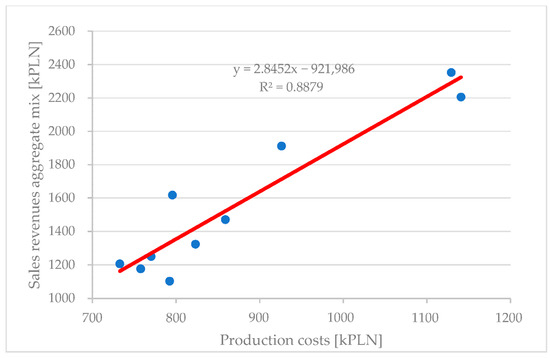
Figure 11.
Regression of variant W2 aggregate mix sales revenue and production costs (MSE = 10.2%).
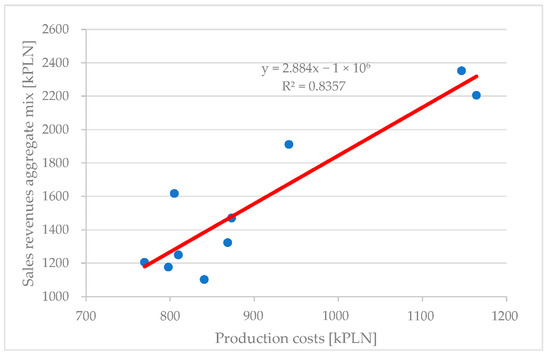
Figure 12.
Regression of variant W3 aggregate mix sales revenue and production costs (MSE = 12.7%).

Table 10.
Regression model and analysis of variance for W1.

Table 11.
Regression model and analysis of variance for W2.

Table 12.
Regression model and analysis of variance for W3.
The credibility level of the proposed model was verified by calculating the mean squared error (MSE) for each variant, expressed as an absolute percentage value (6).
where
- —the value predicted by the model for the i-th variant, PLN/year;
- —the actual value for the i-th variant, PLN/year;
- —the number of observations;
- —the number of predictors (independent variables).
The determined regression models are statistically significant. For all variants, the linear model turned out to be the best. The value of the coefficient of determination for all considered variants oscillates between 84 and 89%, and so their significance is similar. The level of significance for all the determined parameters of the models is <0.05. The model and the analysis of variance show that the best variant in terms of the efficiency of the costs incurred is variant W1 because for an increase in cost by a unit there is almost a fourfold increase in revenue. Variants W2 and W3 also yield good results, but an increase in cost by a unit yields a threefold increase in revenue. The analysis of the residuals shows their normal distribution, which indicates that they do not significantly affect the values derived from the regression model.
The mean squared error (MSE) expressed in absolute percentage values for variants W2 and W3 is 10.2% and 12.7%, respectively. However, in the machine system for variant W1, this error is 16.7%. This indicates that the model is correctly configured, especially for technological systems simultaneously powered by electricity and diesel fuel.
To summarise the entire technical and economic analysis, Table 13 shows the analysed cost balance for all variants over the entire calculation period. A chart was then drawn up showing the range of profitability of RMB production when the variable costs of energy carriers are taken into account (Figure 13).

Table 13.
Cost balance for the investigated variants of mining equipment over the years 2019–2023.
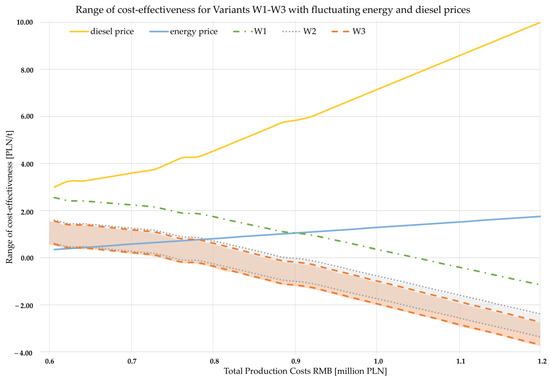
Figure 13.
Cost effectiveness of variants W1–W3 with fluctuating electricity and diesel prices.
The most cost-effective option throughout the analysis period was option W1, as shown in Table 13. In 2020, the variant generated a profit of nearly PLN 590 thousand; W2 and W3, yielding PLN 450 thousand, rank second. In 2021, all costs increased (by 16% on average); however, the price of the marketed product (aggregate mix) also increased by nearly 18%, which improved the profitability of the enterprise compared to previous years. The profit generated from aggregate mix production in W2 and W3 was about PLN 560 thousand/month and almost PLN 730 thousand/month in variant W1. However, due to a sharp increase in electricity prices (almost 40%) and diesel oil (about 37%), it was only in variant W1 that profits improved despite further increases in the price of the marketed product (aggregate mix), yielding PLN 762 thousand/month. In the remaining variants, W2 and W3, the profitability decreased by 1.5% and 3.1%, respectively, equivalent to profit levels of PLN 560/537 thousand/month. In 2023, the price of DIESEL oil decreased by about 15%, whilst the price of electricity rose again by 39.1%. Additionally, the dumping cost have increased significantly this year (by 25%). The increase in electricity prices led to another increase in the price of the marketed product (by 6.7%). Nonetheless, in one possible scenario, all variants should be profitable in 2023 as the price of marketed aggregate mix tends to increase whilst the price of diesel oil remains low.
Figure 13 shows the levels of profitability for each variant of the implemented mining equipment as a function of the actual prices of energy and fuel carriers. For variants W2 and W3, the profitability of RMB production varies according to the total production costs, which are the result of the price of energy carriers and fuels (diesel and electricity). In contrast, in the case of variant W1, the profitability depends only on the price of diesel.
The machinery system in variant W1 is powered solely by diesel and, as the analysis shows, this variant is the most cost-effective, even with a large increase in total costs. This is influenced by the smallest number of machines—three rigid dumpers, one loader, one excavator, and one mobile crusher—and the shortest transport routes. Consequently, the diesel consumption is the lowest of the mining equipment configuration options analysed.
The profitability range in W2 and W3 (shown on the graph as a filled image section between the dotted and dashed lines) is also dependent on the price of electricity used to power some of the mining machinery. Nevertheless, in all variants, the total operating cost show the strongest dependence on the diesel price. Variant W3 can be regarded as an expanded version of W2, with the addition of a Diesel-powered screen separating the waste rock from the excavated material near the excavation site, thus shortening the haulage routes. Variant W2 features a lower DIESEL consumption due to the smaller number of deployed machines (five machines and three haul trucks) compared to W3 (six machines and three haul trucks). Although the distance covered by haul trucks in variant W2 is longer, the incorporation of another screen in W3 leads to increased diesel oil consumption, thus increasing the total operating cost.
4. Discussion
The empirical analysis of associated costs reveals a notable impact of fluctuating fuel costs on the operating expenses of mining equipment, with diesel oil costs being the primary component of the total expenditure. The second-most-significant element constitutes the leasing costs, which exhibited a marginal increase of less than 1% in 2020, followed by approximately 5.6% in 2021, a substantial 12.5% in 2022, and a 4.8% rise in 2023 on a year-to-year basis. Maintenance costs demonstrated a similar trend to leasing costs.
Payroll expenses saw a 5.9% increase in 2020, followed by a 4.8% rise in 2021, a 6.2% increase in 2022, and a notable 11.4% surge in 2023 compared to the previous year. Diesel costs experienced an 18.5% decrease in 2020 relative to 2019, succeeded by a substantial 31.3% increase in 2021 and an additional 36.7% rise in 2022 relative to 2021.
Electricity costs underwent a 17.4% decline in 2020 compared to 2019, followed by a significant 47.4% increase in 2021 and a 39.3% rise in 2022 relative to the previous year. However, in 2023, the cost of electricity decreased by 15% compared to the preceding year. Over the analysed period, the average year-to-year increase in diesel oil costs was 46.3% (2019–2022) and 79.4% (2020–2022), with the overall increase for the entire period (2019–2023) remaining below 25%. Conversely, electricity costs escalated more dramatically, registering a nearly 70% increase (2019–2022) and over 105% in the subsequent period (2020–2022), resulting in a total increase of 135.9% for the entire analysed period (2019–2023).
The cost effectiveness of each variant is heavily contingent on the prices of energy carriers and fuels, as well as the operational context, including haulage route lengths and mining equipment configurations. In W1, where the haulage routes are the shortest, profitability is optimized. Variances in the profitability of W2 and W3 are attributed to the size of the mining equipment fleet, favouring W2 with a smaller machine count.
5. Conclusions
The principles outlined underscore the importance of strategic planning in the mining industry, particularly when dealing with challenging deposits. It is a complex and challenging subject, involving many interrelated variables and often incomplete and uncertain data, with high expectations placed on the results of such analyses. Given the assumed maximum efficiency from limited deposits, there is a compelling need for high-quality strategic planning to facilitate the comprehensive optimisation of mining operations. Consequently, the need to conduct this type of analysis and to further develop the methodologies becomes apparent.
The analysis indicates that an empirical approach should be taken to the economic evaluation of mining equipment used on an annual basis, as the differences in costs recorded at the end of the year can reach significant percentages. Comparing the performance of mining equipment over longer periods may not accurately reflect the challenges posed by fluctuating energy, fuel, and other variable costs. Nevertheless, the production of aggregate mixes from quarry tailings can still be profitable with the assurance of sufficient revenue from the sale of the RMB.
The analysis shows that simpler mining systems (using fewer units) tend to have lower costs. In the case of electrically powered machines, the diversification of energy sources and fuels is of paramount importance and can lead to more stable increases in total costs, which requires the effective planning of mining operations and production levels.
The economics of the mining equipment used depend primarily on the price of diesel fuel, with electricity prices playing a secondary role. However, the profitability of mining production is affected by the variable ratio of electricity prices to diesel prices. Energy and fuel costs (diesel and electricity) account for approximately 50% of the total costs, but other significant components include the leasing and maintenance costs.
The aim of the article was to present a universal and possibly comprehensive approach to the method of analysis of the structure and impact of operating costs on the profitability of mining activities in terms of secondary deposits and the profitability of RMB production, which was verified by means of linear regression.
With the escalation of electricity prices, mining systems that incorporate electrically powered machines are likely to incur higher costs than systems that rely on diesel. Further increases in electricity prices may alter the relative proportions of the respective cost components, potentially leading to a dominance of electricity costs over maintenance costs.
Energy and fuel costs are highly volatile. With the introduction of GBH gas emission charges for mining equipment, cost parity may shift substantially in favour of electrically powered equipment.
Author Contributions
Conceptualization, M.P. and P.B.; methodology, M.P. and P.B.; software, M.P.; validation, M.P. and P.B.; formal analysis, M.P. and P.B.; investigation, M.P. and P.B.; resources, M.P. and P.B.; data curation, M.P.; writing—original draft preparation, M.P and P.B.; writing—review and editing, P.B.; visualization, M.P.; supervision, P.B.; project administration, M.P.; funding acquisition, M.P. and P.B. All authors have read and agreed to the published version of the manuscript.
Funding
This research was funded by AGH University of Krakow, Faculty of Civil Engineering and Resource Management; subsidy number: 16.16.100.215.
Data Availability Statement
The data can be accessed upon a request to any of the authors. The data are not publicly available due to this is sensitive data of mining companies.
Acknowledgments
We thank AGH University of Krakow Tomasz Niedoba for his substantial assistance with the data analysis.
Conflicts of Interest
The authors declare no conflicts of interest.
References
- Dino, G.A.; Chiappino, C.; Rossetti, P.; Franchi, A.; Baccioli, G. Extractive waste management: A new territorial and industrial approach in Carrara quarry basin. Ital. J. Eng. Geol. Environ. 2017, 2017, 47–55. [Google Scholar] [CrossRef]
- Jonczy, I.; Gawor, Ł. Coal mining and post-metallurgic dumping grounds and their connections with exploitation of raw materials in the region of Ruda Śląska. Arch. Min. Sci. 2017, 62, 301–311. [Google Scholar] [CrossRef]
- Marcisz, M.; Probierz, K.; Gawor, Ł. Possibilities of reclamation and using of large-surface coal mining dumping grounds in Poland. Gospod. Surowcami Miner.-Miner. Resour. Manag. 2020, 36, 105–122. [Google Scholar] [CrossRef]
- Stenis, J.; Hogland, W. Optimization of mining by application of the equality principle. Resour. Policy 2011, 36, 285–292. [Google Scholar] [CrossRef]
- Kaźmierczak, U.; Blachowski, J.; Górniak-Zimroz, J.; Wirth, H. Quantitative and qualitative research on the waste from the mining of rock raw materials in lower Silesia. Minerals 2018, 8, 375. [Google Scholar] [CrossRef]
- Patyk, M.; Bodziony, P. Application of the Analytical Hierarchy Process to Select the Most Appropriate Mining Equipment for the Exploitation of Secondary Deposits. Energies 2022, 15, 5979. [Google Scholar] [CrossRef]
- Yıldız, T.D. Waste management costs (WMC) of mining companies in Turkey: Can waste recovery help meeting these costs? Resour. Policy 2020, 68, 101706. [Google Scholar] [CrossRef]
- Rana, A.; Kalla, P.; Csetenyi, L.J. Recycling of dimension limestone industry waste in concrete. Int. J. Min. Reclam. Environ. 2017, 31, 231–250. [Google Scholar] [CrossRef]
- Gautam, P.K.; Kalla, P.; Chouhan, H.S.; Sitaramanjaneyulu, K. Use of dimensional limestone mining waste as flexible pavement material. Mater. Today Proc. 2022, 65, 2016–2020. [Google Scholar] [CrossRef]
- Anon, J. The way the money goes in open-pit mining. Min. Mag. 1972, 127. [Google Scholar]
- Noakes, M.; Lanz, T. Cost Estimation Handbook for the Australian Mining Industry; Elsevier: Amsterdam, The Netherlands, 1993; 413p. [Google Scholar] [CrossRef]
- Shafiee, S.; Nehring, M.; Topal, E. Estimating Average Total Cost of Open Pit Coal Mines in Australia. Aust. Min. 2009, 134. [Google Scholar]
- Shafiee, S.; Topal, E. New approach for estimating total mining costs in surface coal mines. Min. Technol. 2012, 121, 109–116. [Google Scholar] [CrossRef]
- Bertisen, J.; Davis, G.A. Bias and error in mine project capital cost estimation. Eng. Econ. 2008, 53, 118–139. [Google Scholar] [CrossRef]
- Budeba, M.D.; Joubert, J.W.; Webber-Youngman, R.C.W. A proposed approach for modelling competitiveness of new surface coal mines. J. S. Afr. Inst. Min. Met. 2015, 115, 1057–1064. [Google Scholar] [CrossRef]
- Mordor Intelligence. Cosmeceutical Market: Growth, Trends, and Forecasts (2020–2025). Mordor Intell. 2019. [Google Scholar]
- Córdova, E.; Mobarec, V.; Pizarro, E.; Videla, A. A structured key cost analysis methodology to identify value-contributing activities in mining projects: A case study of the Chuquicamata Underground Project. J. S. Afr. Inst. Min. Met. 2018, 118, 279–288. [Google Scholar] [CrossRef]
- Patyk, M.; Bodziony, P.; Kasztelewicz, Z. Analysis of quarrying equipment operating cost structure. Inz. Miner. 2019, 311–317. [Google Scholar] [CrossRef]
- Rai, S.S.; Murthy, V.M.S.R.; Sukesh, N.; Teja, A.S.; Raval, S. Operational efficiency of equipment system drives environmental and economic performance of surface coal mining—A sustainable development approach. Sustain. Dev. 2021, 29, 25–44. [Google Scholar] [CrossRef]
- Pham, V.H.; Tran, T.C.; Le, H.A.; Le, T.T.H.; Pham, V.V.; Nguyen, A.T.; Le, T.H.G. Strategy in Dispatching Trucks and Shovels with Different Capacity to Increase the Operating Efficiency in Cao Son Surface Coal Mine, Vietnam. Inz. Miner. Pol. Miner. Eng. Soc. 2021, 1, 487–494. [Google Scholar] [CrossRef]
- Demir, E.; Karpuz, C.; Demirel, N. Design and implementation of a multimodal transportation cost analysis model for domestic lignite supply in Turkey. J. S. Afr. Inst. Min. Metall. 2012, 112, 993–998. [Google Scholar]
- Hajarian, A.; Osanloo, M. A new developed model to determine waste dump site selection in open pit mines: An approach to minimize haul road construction cost. Int. J. Eng. 2020, 33, 1413–1422. [Google Scholar] [CrossRef]
- Rodovalho, E.d.C.; Lima, H.M.; de Tomi, G. New approach for reduction of diesel consumption by comparing different mining haulage configurations. J. Environ. Manag. 2016, 172, 177–185. [Google Scholar] [CrossRef]
- Ercelebi, S.G.; Bascetin, A. Optimization of shovel-truck system for surface mining. J. S. Afr. Inst. Min. Metall. 2009, 109, 433–439. [Google Scholar]
- Choudhary, R.P. Optimization of load-haul-dump mining system by OEE and match factor for surface mining. Int. J. Appl. Eng. Technol. 2015, 5, 96–102. [Google Scholar]
- Kecojevic, V.; Komljenovic, D. Haul truck fuel consumption. Min. Eng. 2010, 44–48. [Google Scholar]
- Kecojevic, V.; Vukotic, I.; Komljenovic, D. Production, consumption and cost of energy for surface mining of bituminous coal. Min. Eng. 2014, 66, 51–57. [Google Scholar]
- Ozdemir, B.; Kumral, M. A system-wide approach to minimize the operational cost of bench production in open-cast mining operations. Int. J. Coal Sci. Technol. 2019, 6, 84–94. [Google Scholar] [CrossRef]
- Guo, H.; Nguyen, H.; Vu, D.-A.; Bui, X.-N. Forecasting mining capital cost for open-pit mining projects based on artificial neural network approach. Resour. Policy 2021, 74, 101474. [Google Scholar] [CrossRef]
- Dhekne, P.Y.; Kishore, N.; Mishra, R. Minimisation of Surface Mining Costs using Artificial Neural Network. Int. J. Res. Chem. Met. Civ. Eng. 2017, 4, 156–160. [Google Scholar] [CrossRef]
- de Souza, S.V.; Dollery, B.; Blackwell, B. An empirical analysis of mining costs and mining royalties in Queensland local government. Energy Econ. 2018, 74, 656–662. [Google Scholar] [CrossRef]
- Carmichael, D.G.; Bartlett, B.J.; Kaboli, A.S. Surface mining operations: Coincident unit cost and emissions. Int. J. Min. Reclam. Environ. 2014, 28, 47–65. [Google Scholar] [CrossRef]
- Dougall, A.; Mmola, M. Identification of key performance areas in the southern African surface mining delivery environment. J. S. Afr. Inst. Min. Met. 2015, 115, 1001–1006. [Google Scholar] [CrossRef]
- Teplická, K.; Khouri, S.; Beer, M.; Rybárová, J. Evaluation of the performance of mining processes after the strategic innovation for sustainable development. Processes 2021, 9, 1374. [Google Scholar] [CrossRef]
- da Gama, C.D. Easy profit maximization method for open-pit mining. J. Rock Mech. Geotech. Eng. 2013, 5, 350–353. [Google Scholar] [CrossRef]
- Dehghani, H.; Ataee-Pour, M. Determination of the effect of operating cost uncertainty on mining project evaluation. Resour. Policy 2012, 37, 109–117. [Google Scholar] [CrossRef]
- Lima, G.A.C.; Suslick, S.B. Estimating the volatility of mining projects considering price and operating cost uncertainties. Resour. Policy 2006, 31, 86–94. [Google Scholar] [CrossRef]
- Mishra, P.C.; Panigrahi, R.R.; Shrivastava, A.K. Geo-environmental factors’ influence on mining operation: An indirect effect of managerial factors. Environ. Dev. Sustain. 2023, 1–25. [Google Scholar] [CrossRef] [PubMed]
- Uberman, R. Mineral waste in light of the provisions of the Act on waste, the Act on extractive waste, and the Geological and mining. Gospod. Surowcami Miner.-Miner. Resour. Manag. 2021, 37, 117–140. [Google Scholar] [CrossRef]
- Mancini, S.; Casale, M.; Rossi, P.; Faraudello, A.; Dino, G.A. Operative instruments to support public authorities and industries for the supply of raw materials: A decision support tool to evaluate the sustainable exploitation of extractive waste facilities. Resour. Policy 2023, 81, 103338. [Google Scholar] [CrossRef]
- Orlen, P.L. Available online: https://www.orlen.pl/pl/dla-biznesu/hurtowe-ceny-paliw#paliwa-archive (accessed on 7 November 2023).
Disclaimer/Publisher’s Note: The statements, opinions and data contained in all publications are solely those of the individual author(s) and contributor(s) and not of MDPI and/or the editor(s). MDPI and/or the editor(s) disclaim responsibility for any injury to people or property resulting from any ideas, methods, instructions or products referred to in the content. |
© 2024 by the authors. Licensee MDPI, Basel, Switzerland. This article is an open access article distributed under the terms and conditions of the Creative Commons Attribution (CC BY) license (https://creativecommons.org/licenses/by/4.0/).