
Influence of the Shrinkage of the Inner Layer of Steel Tubes on Permissible Thermal Load


Abstract
1. Introduction
2. Materials and Methods
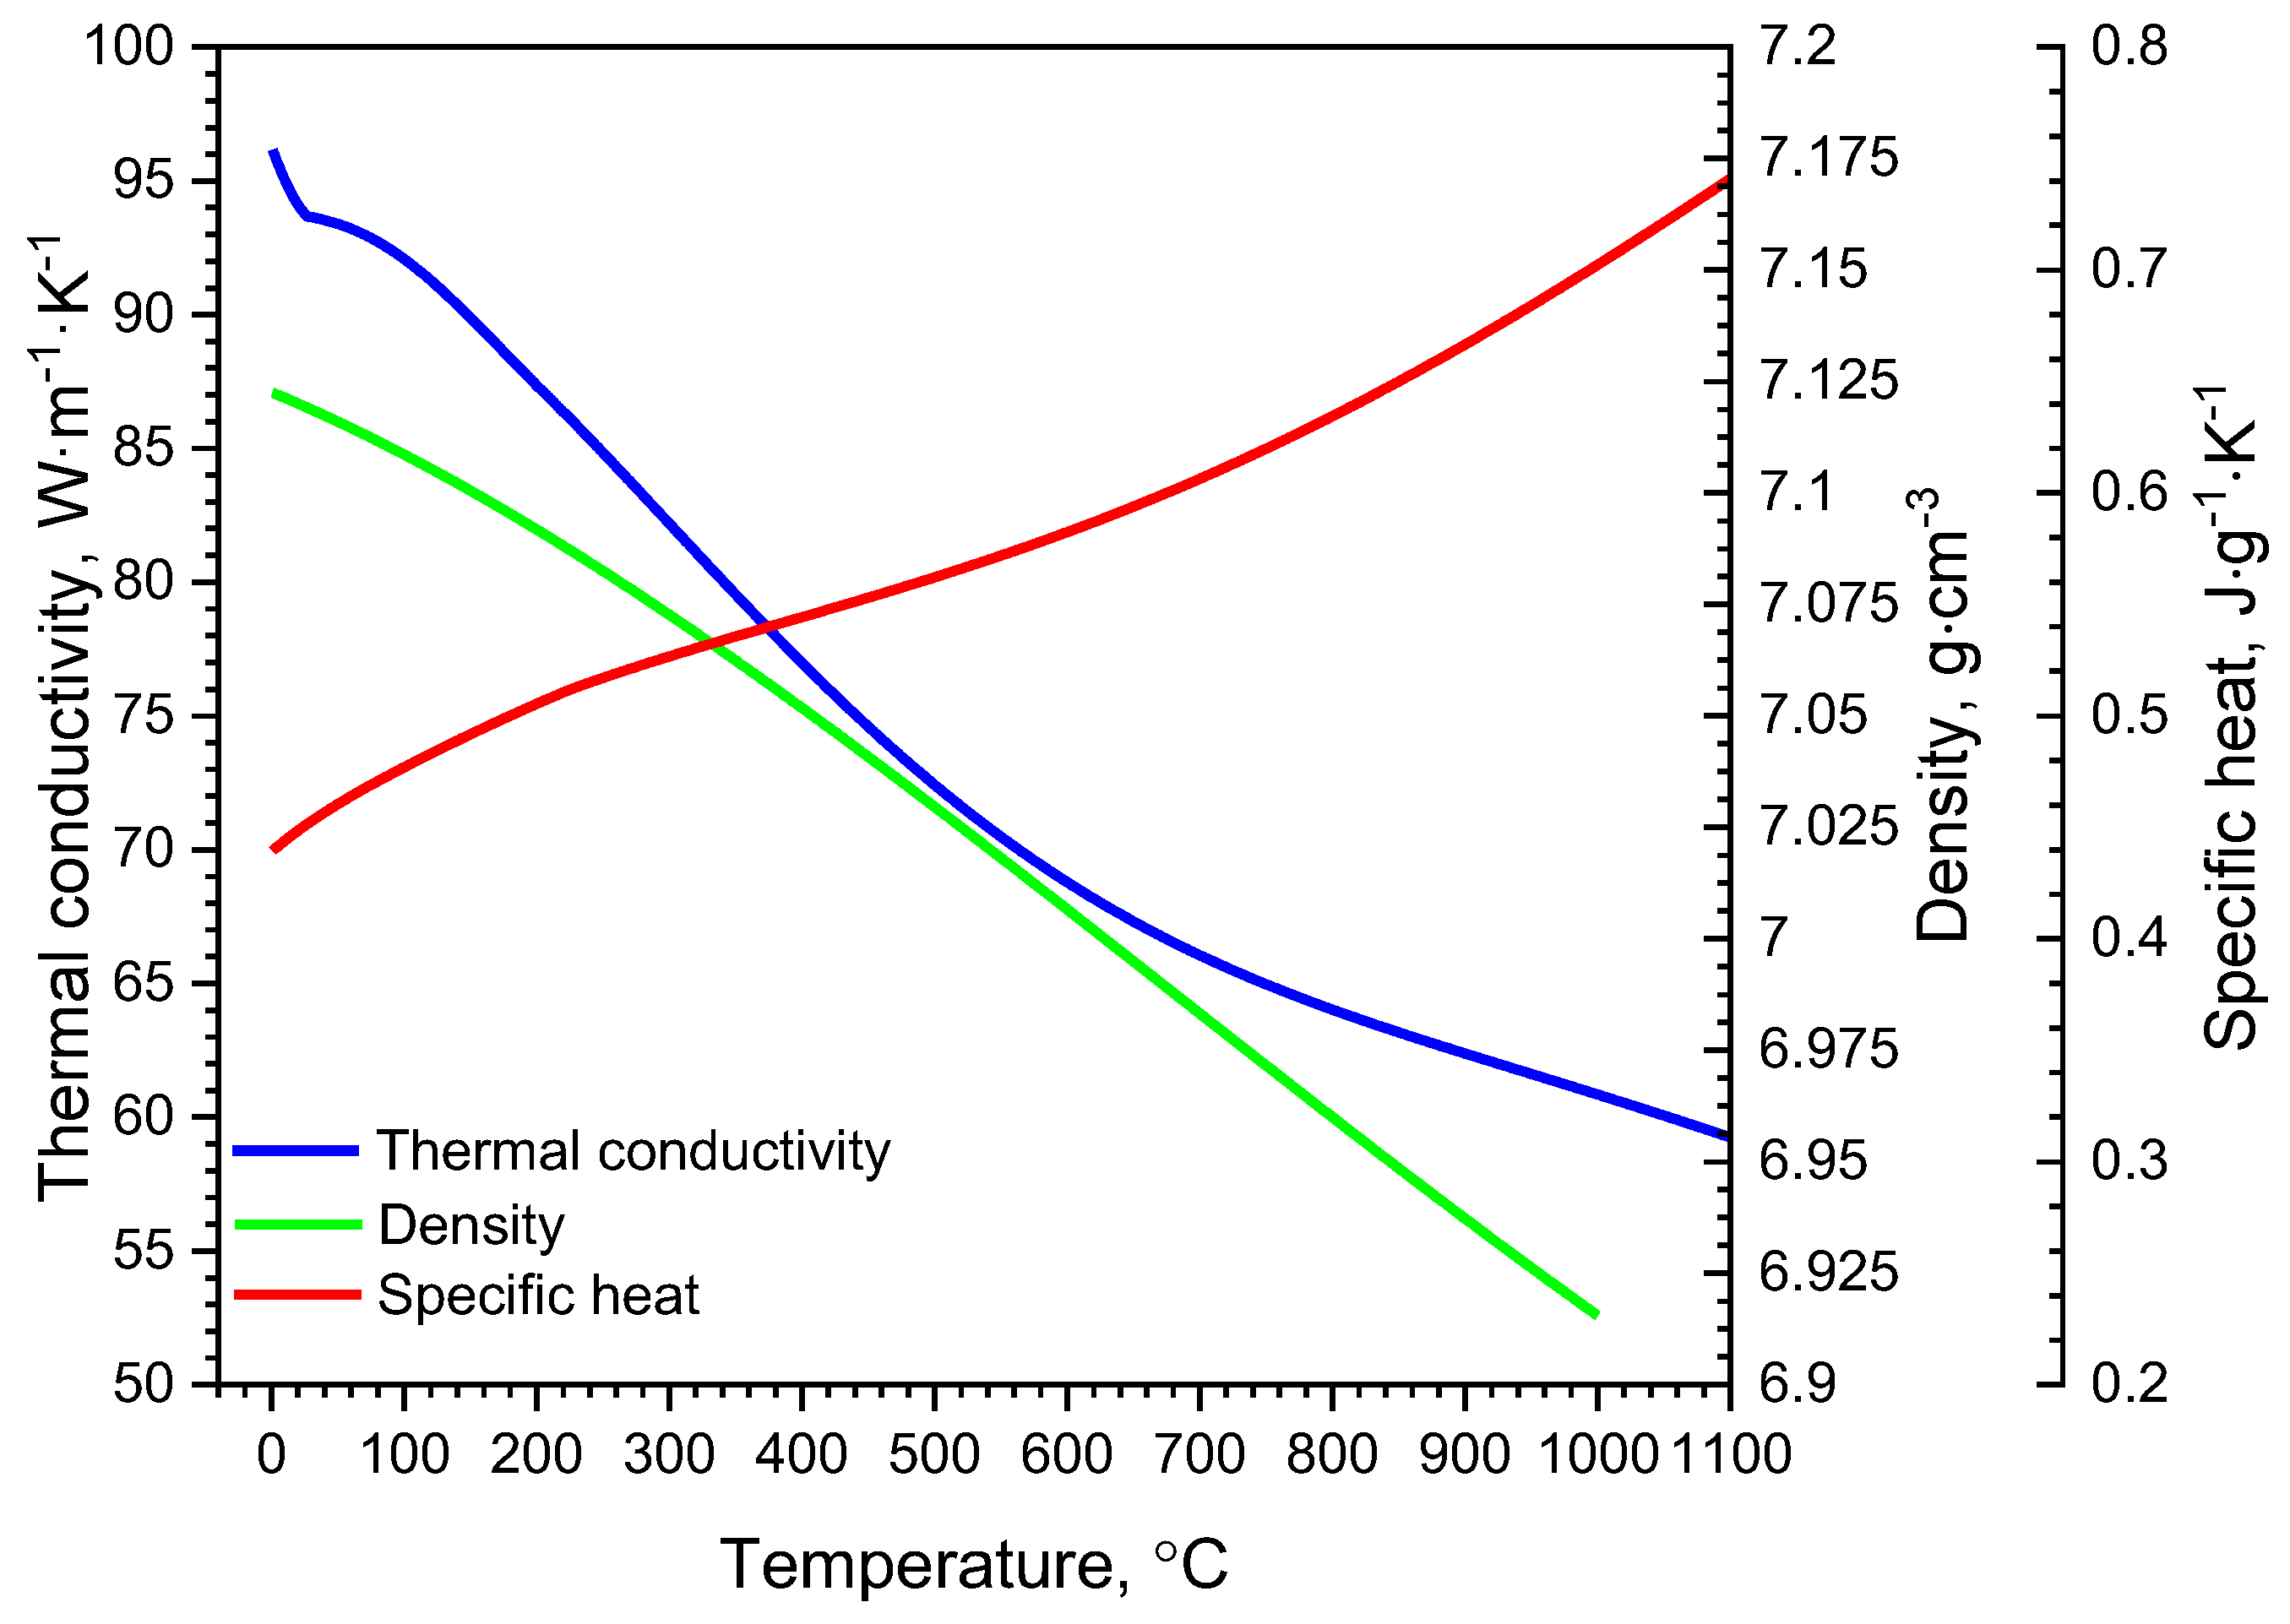
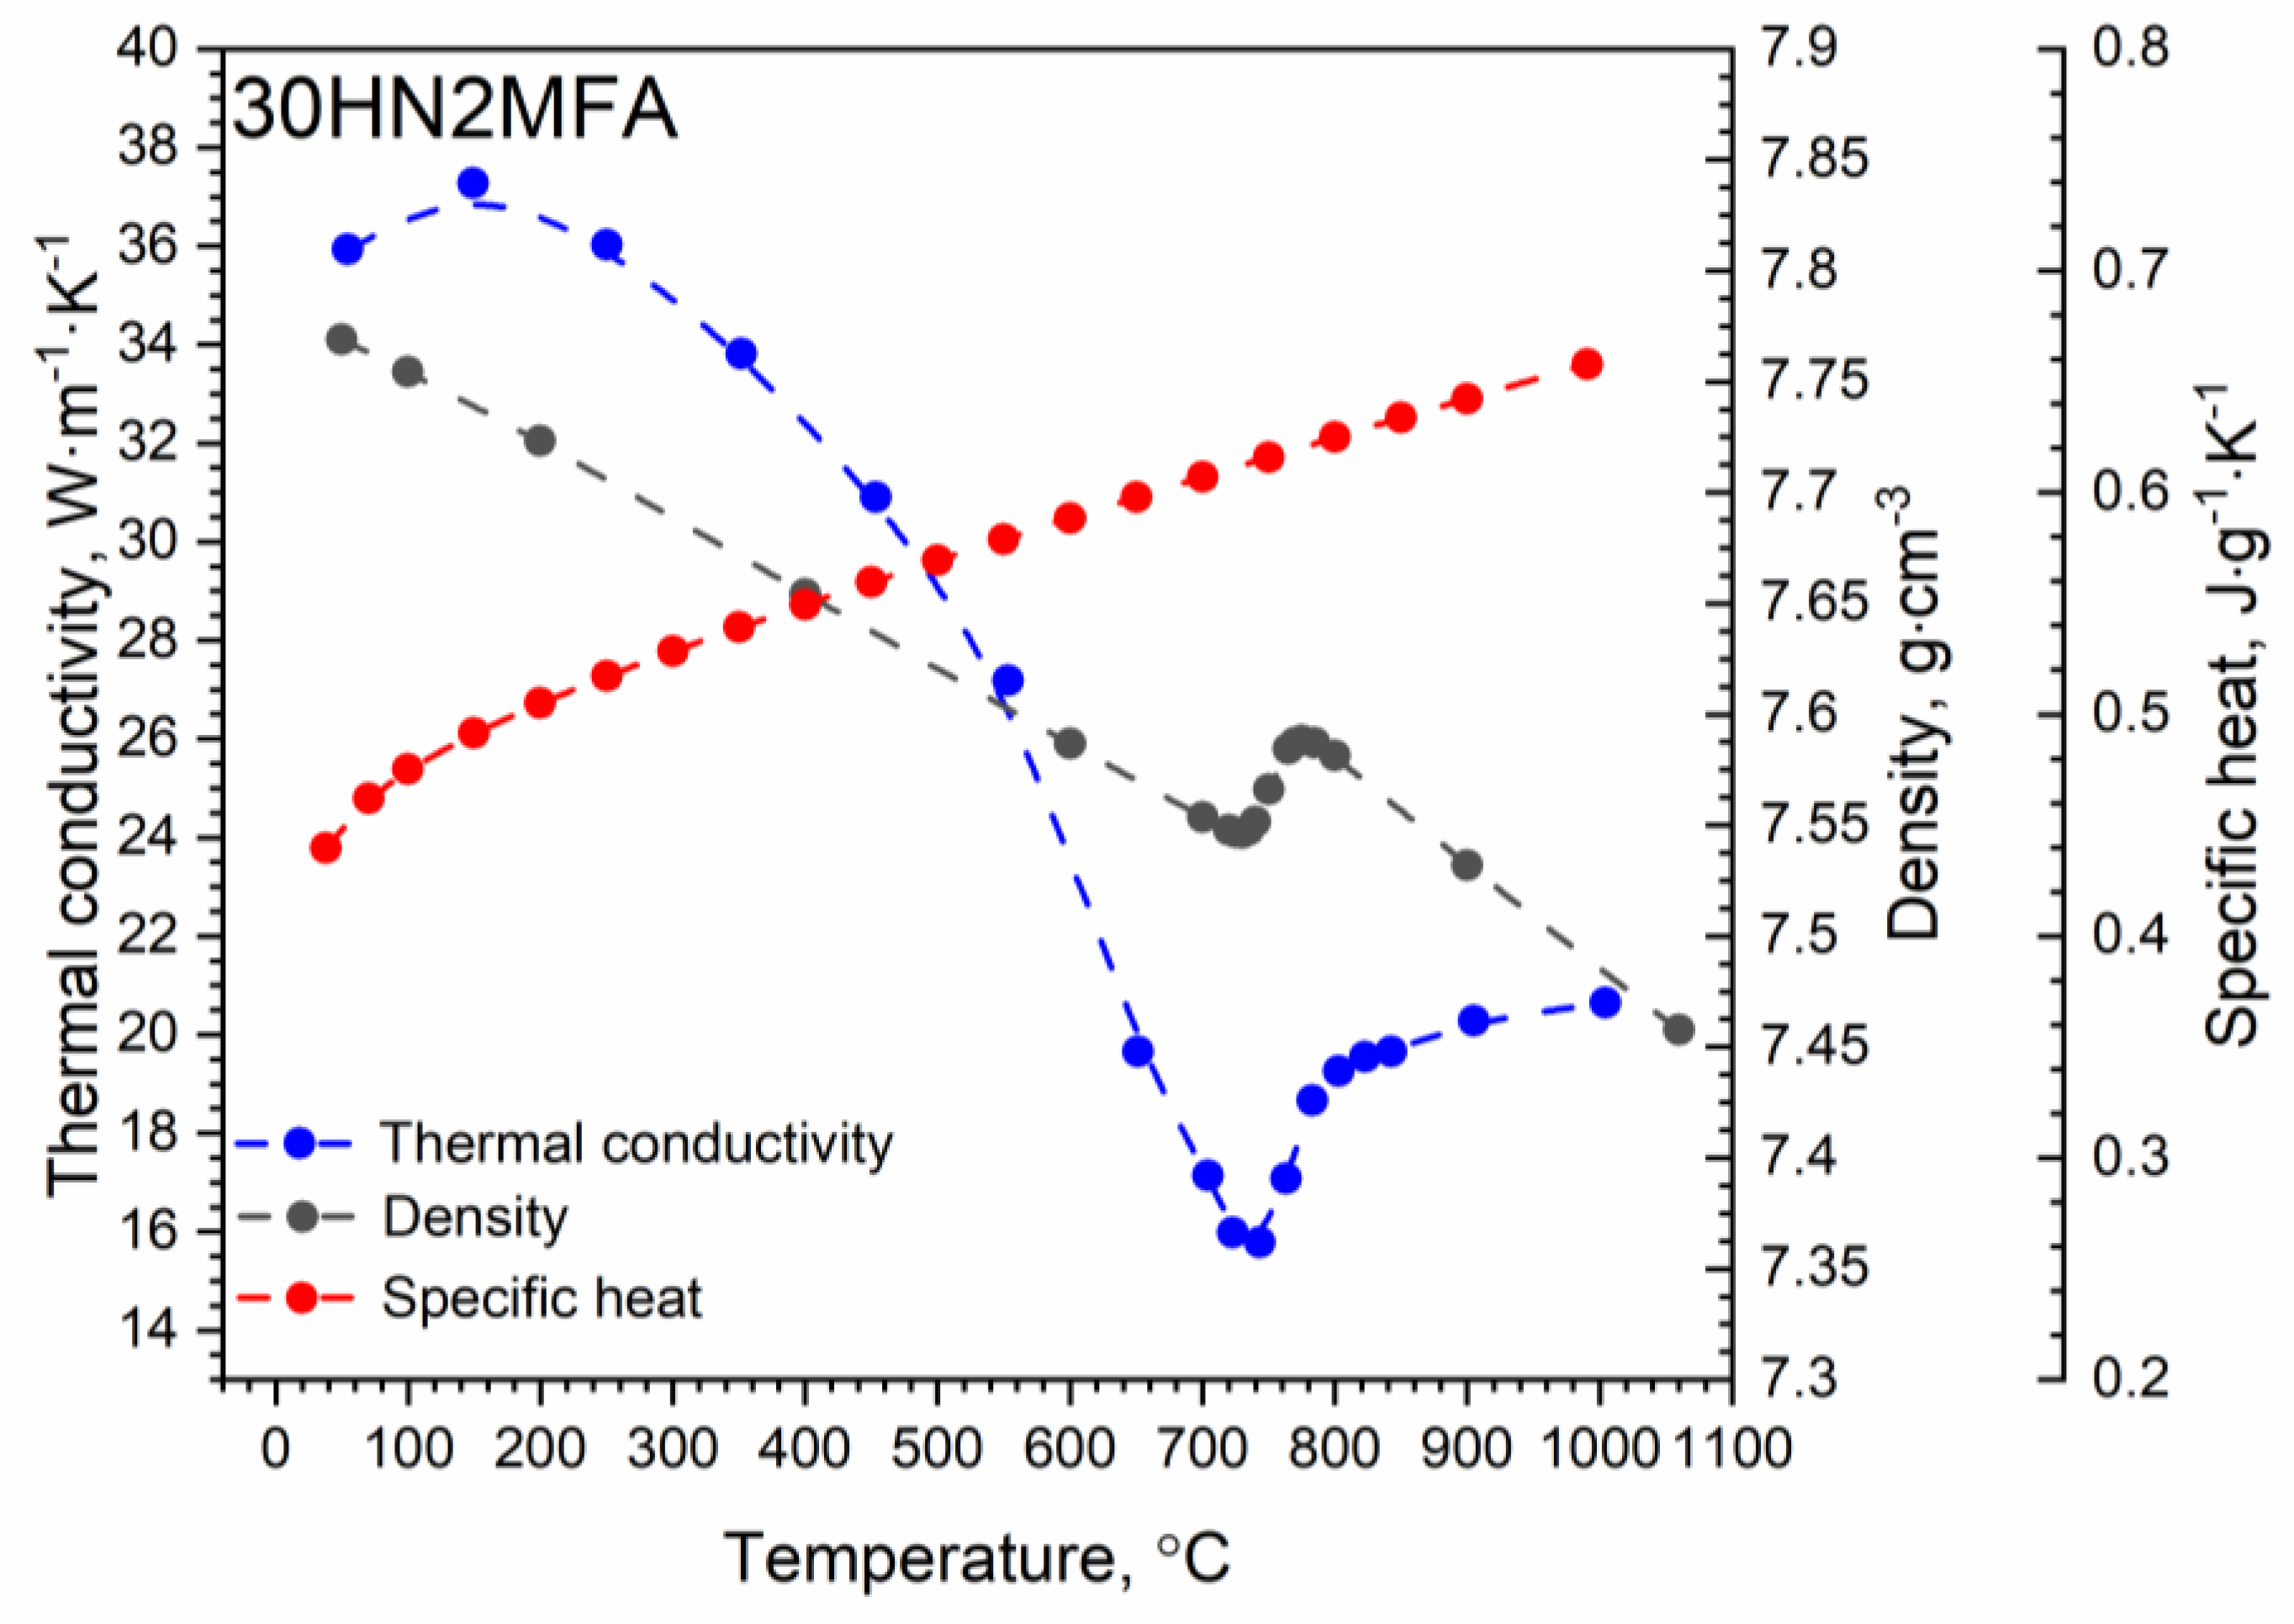
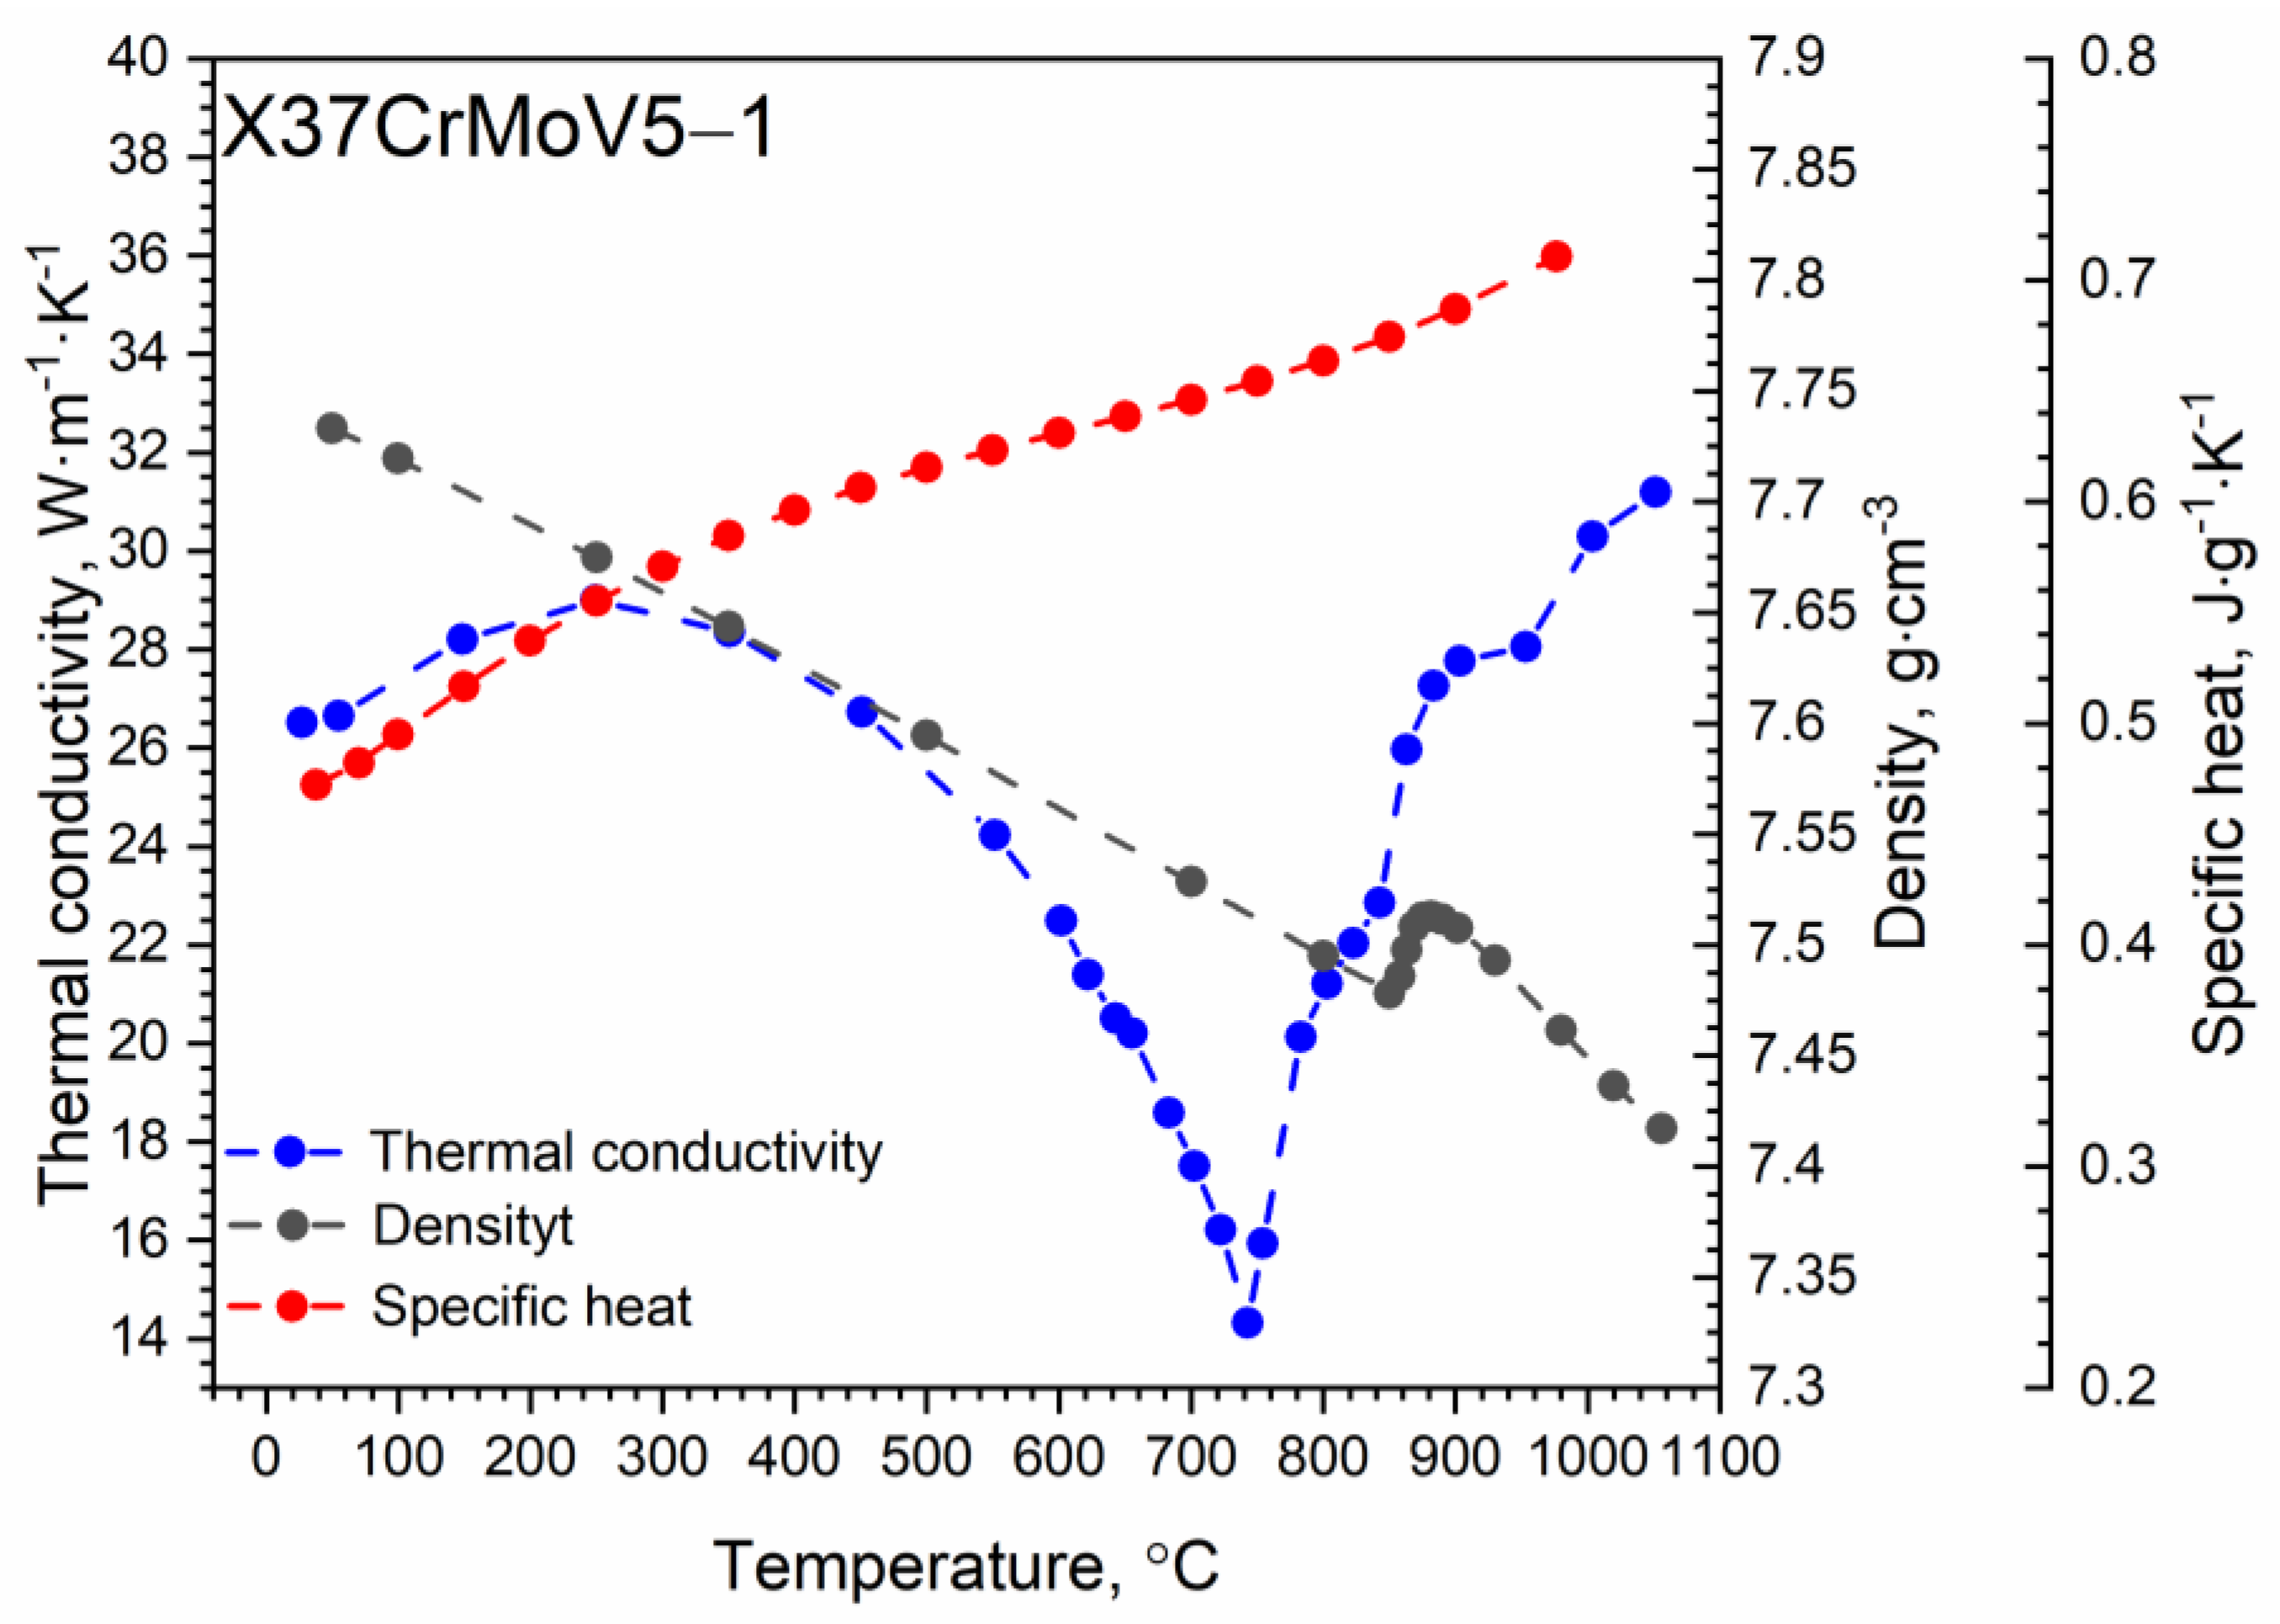
Thermophysical Properties of Selected Steels with Medium Carbon Content
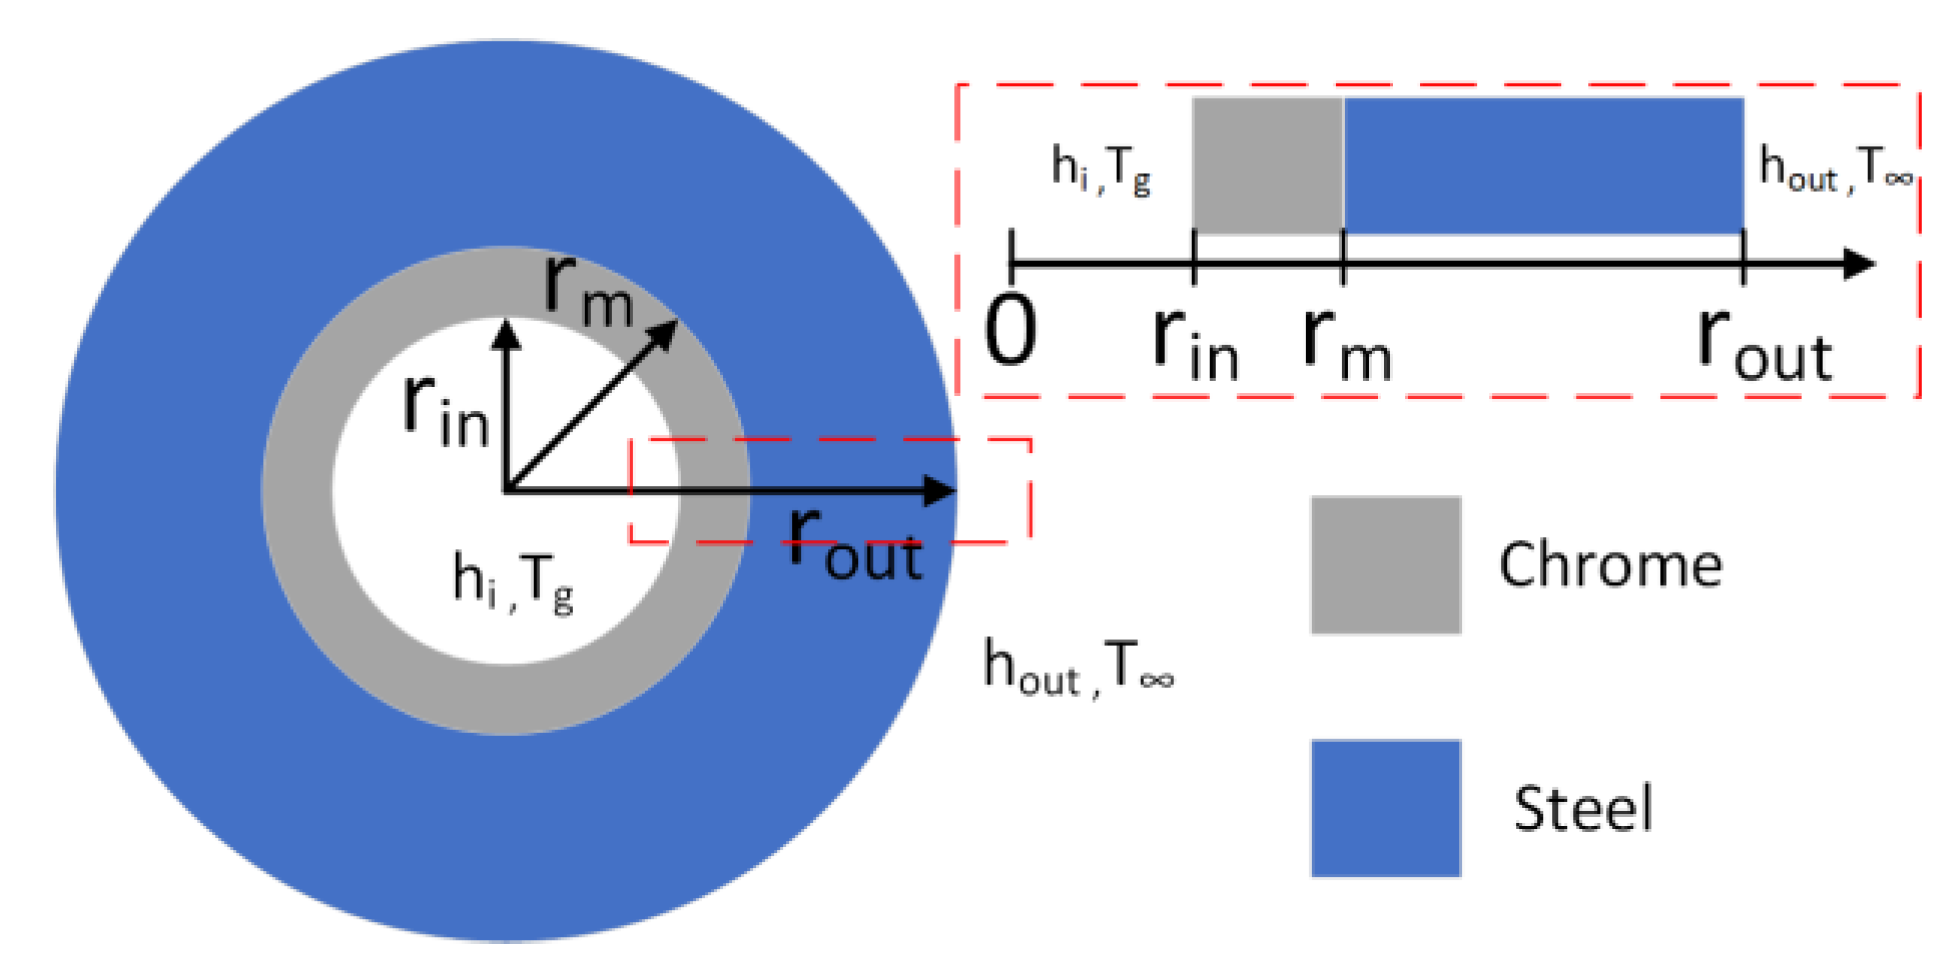
3. Numerical Calculations
3.1. Temperature Distribution in the 30HN2MFA Tube for a Series of Ten, Thirty, and Sixty Heat Impulses
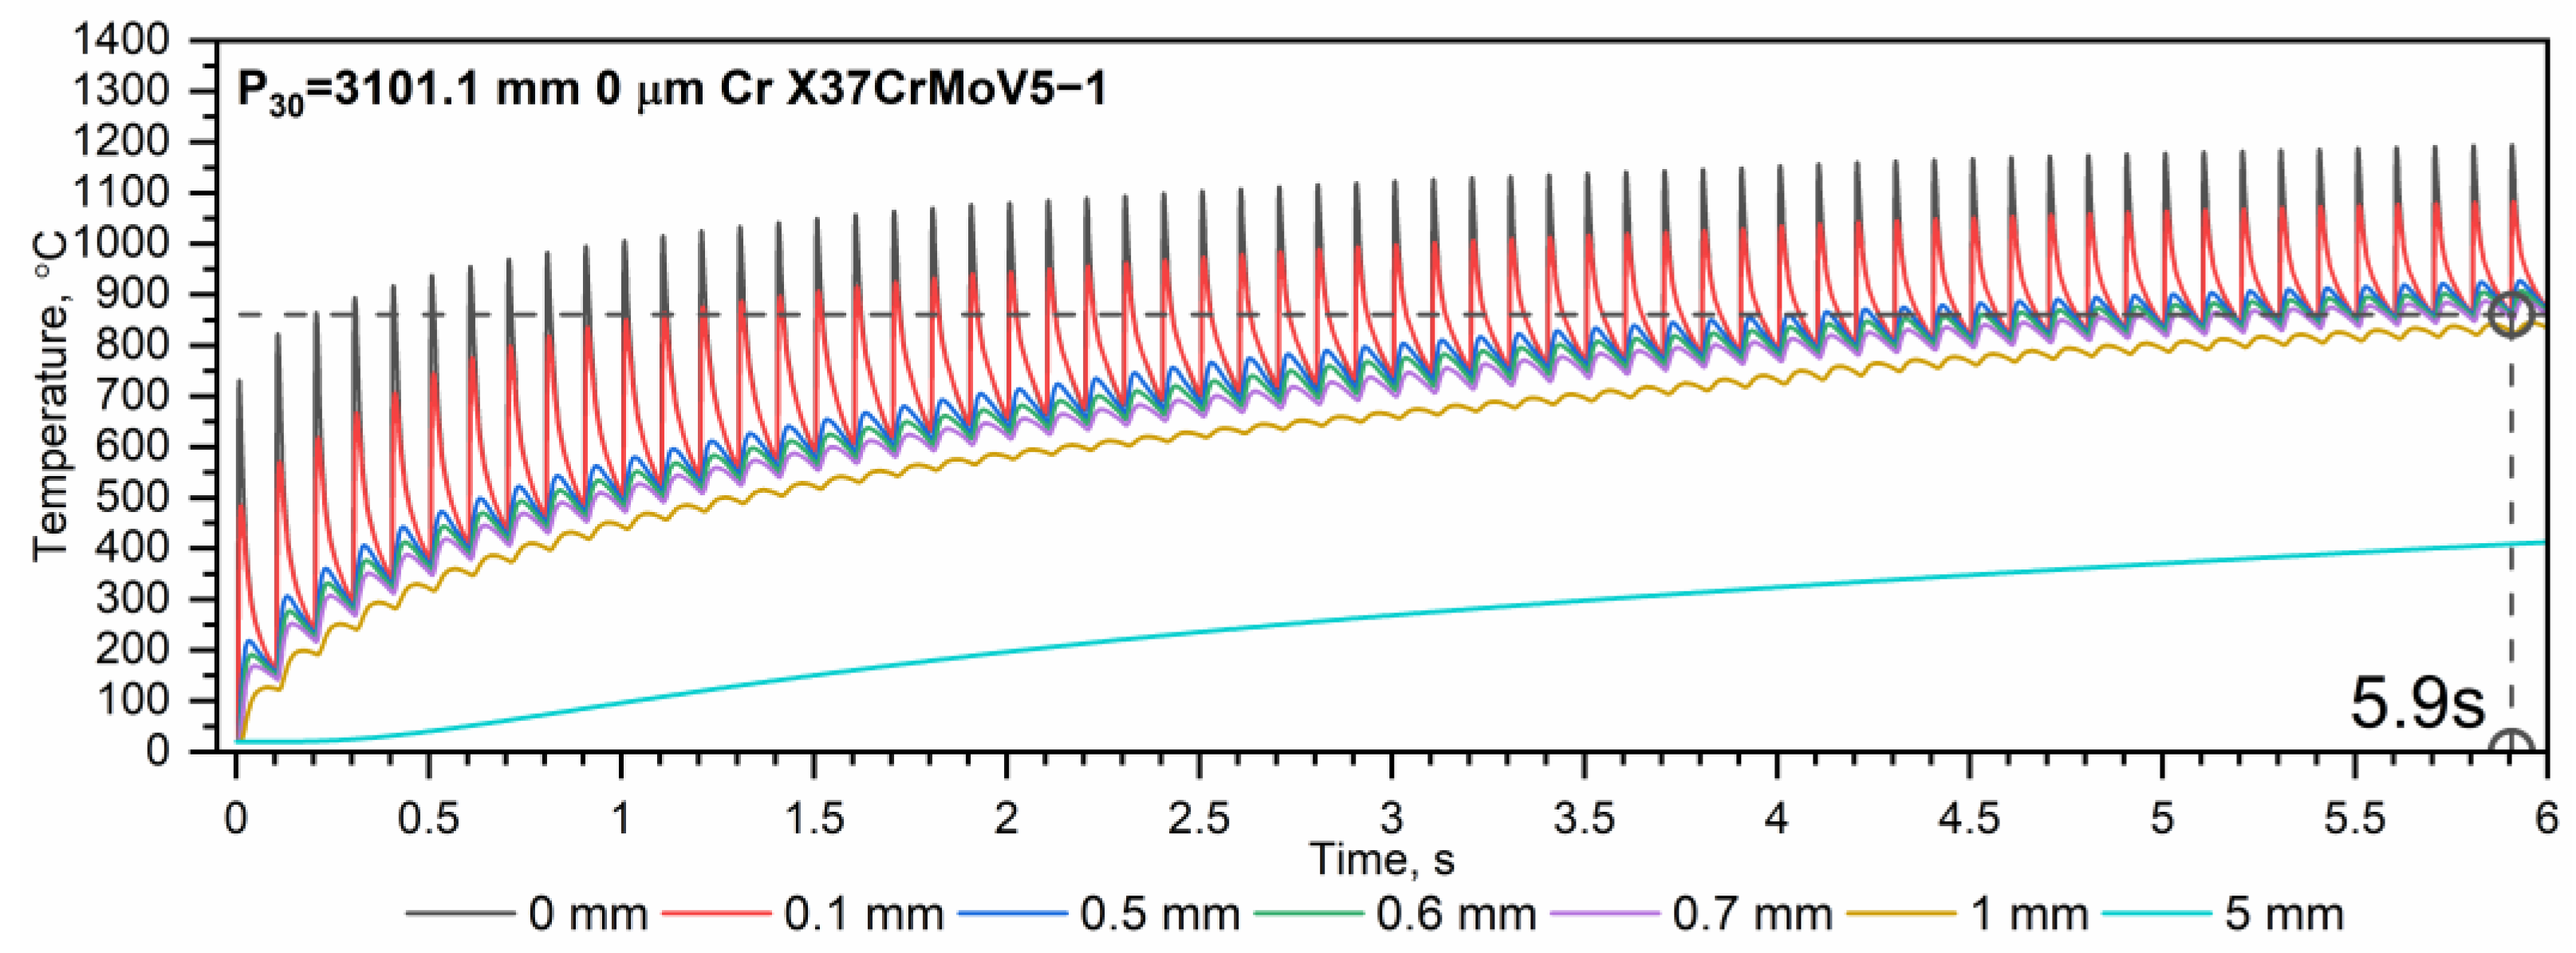
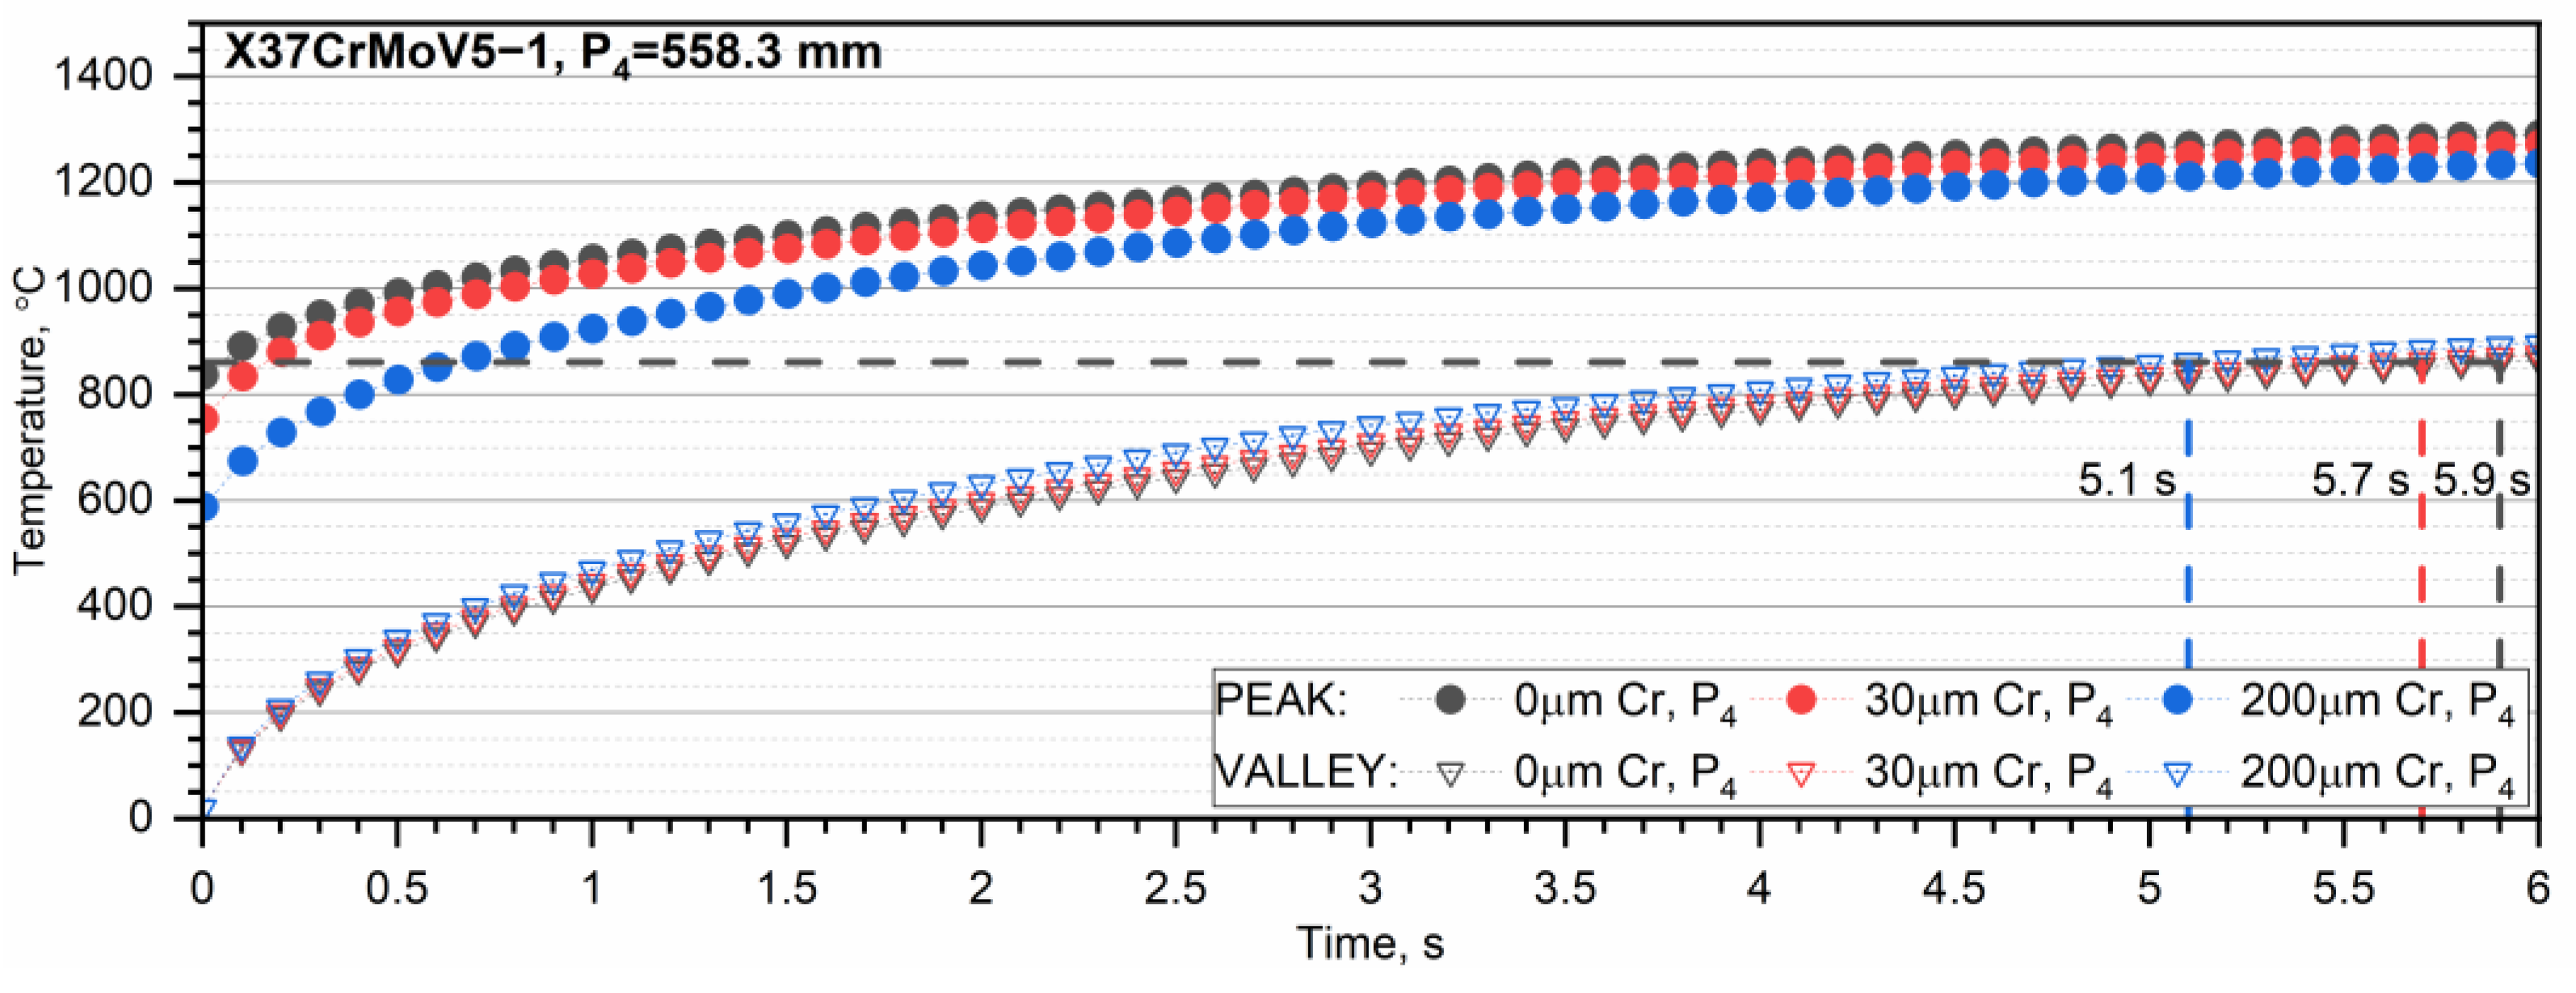
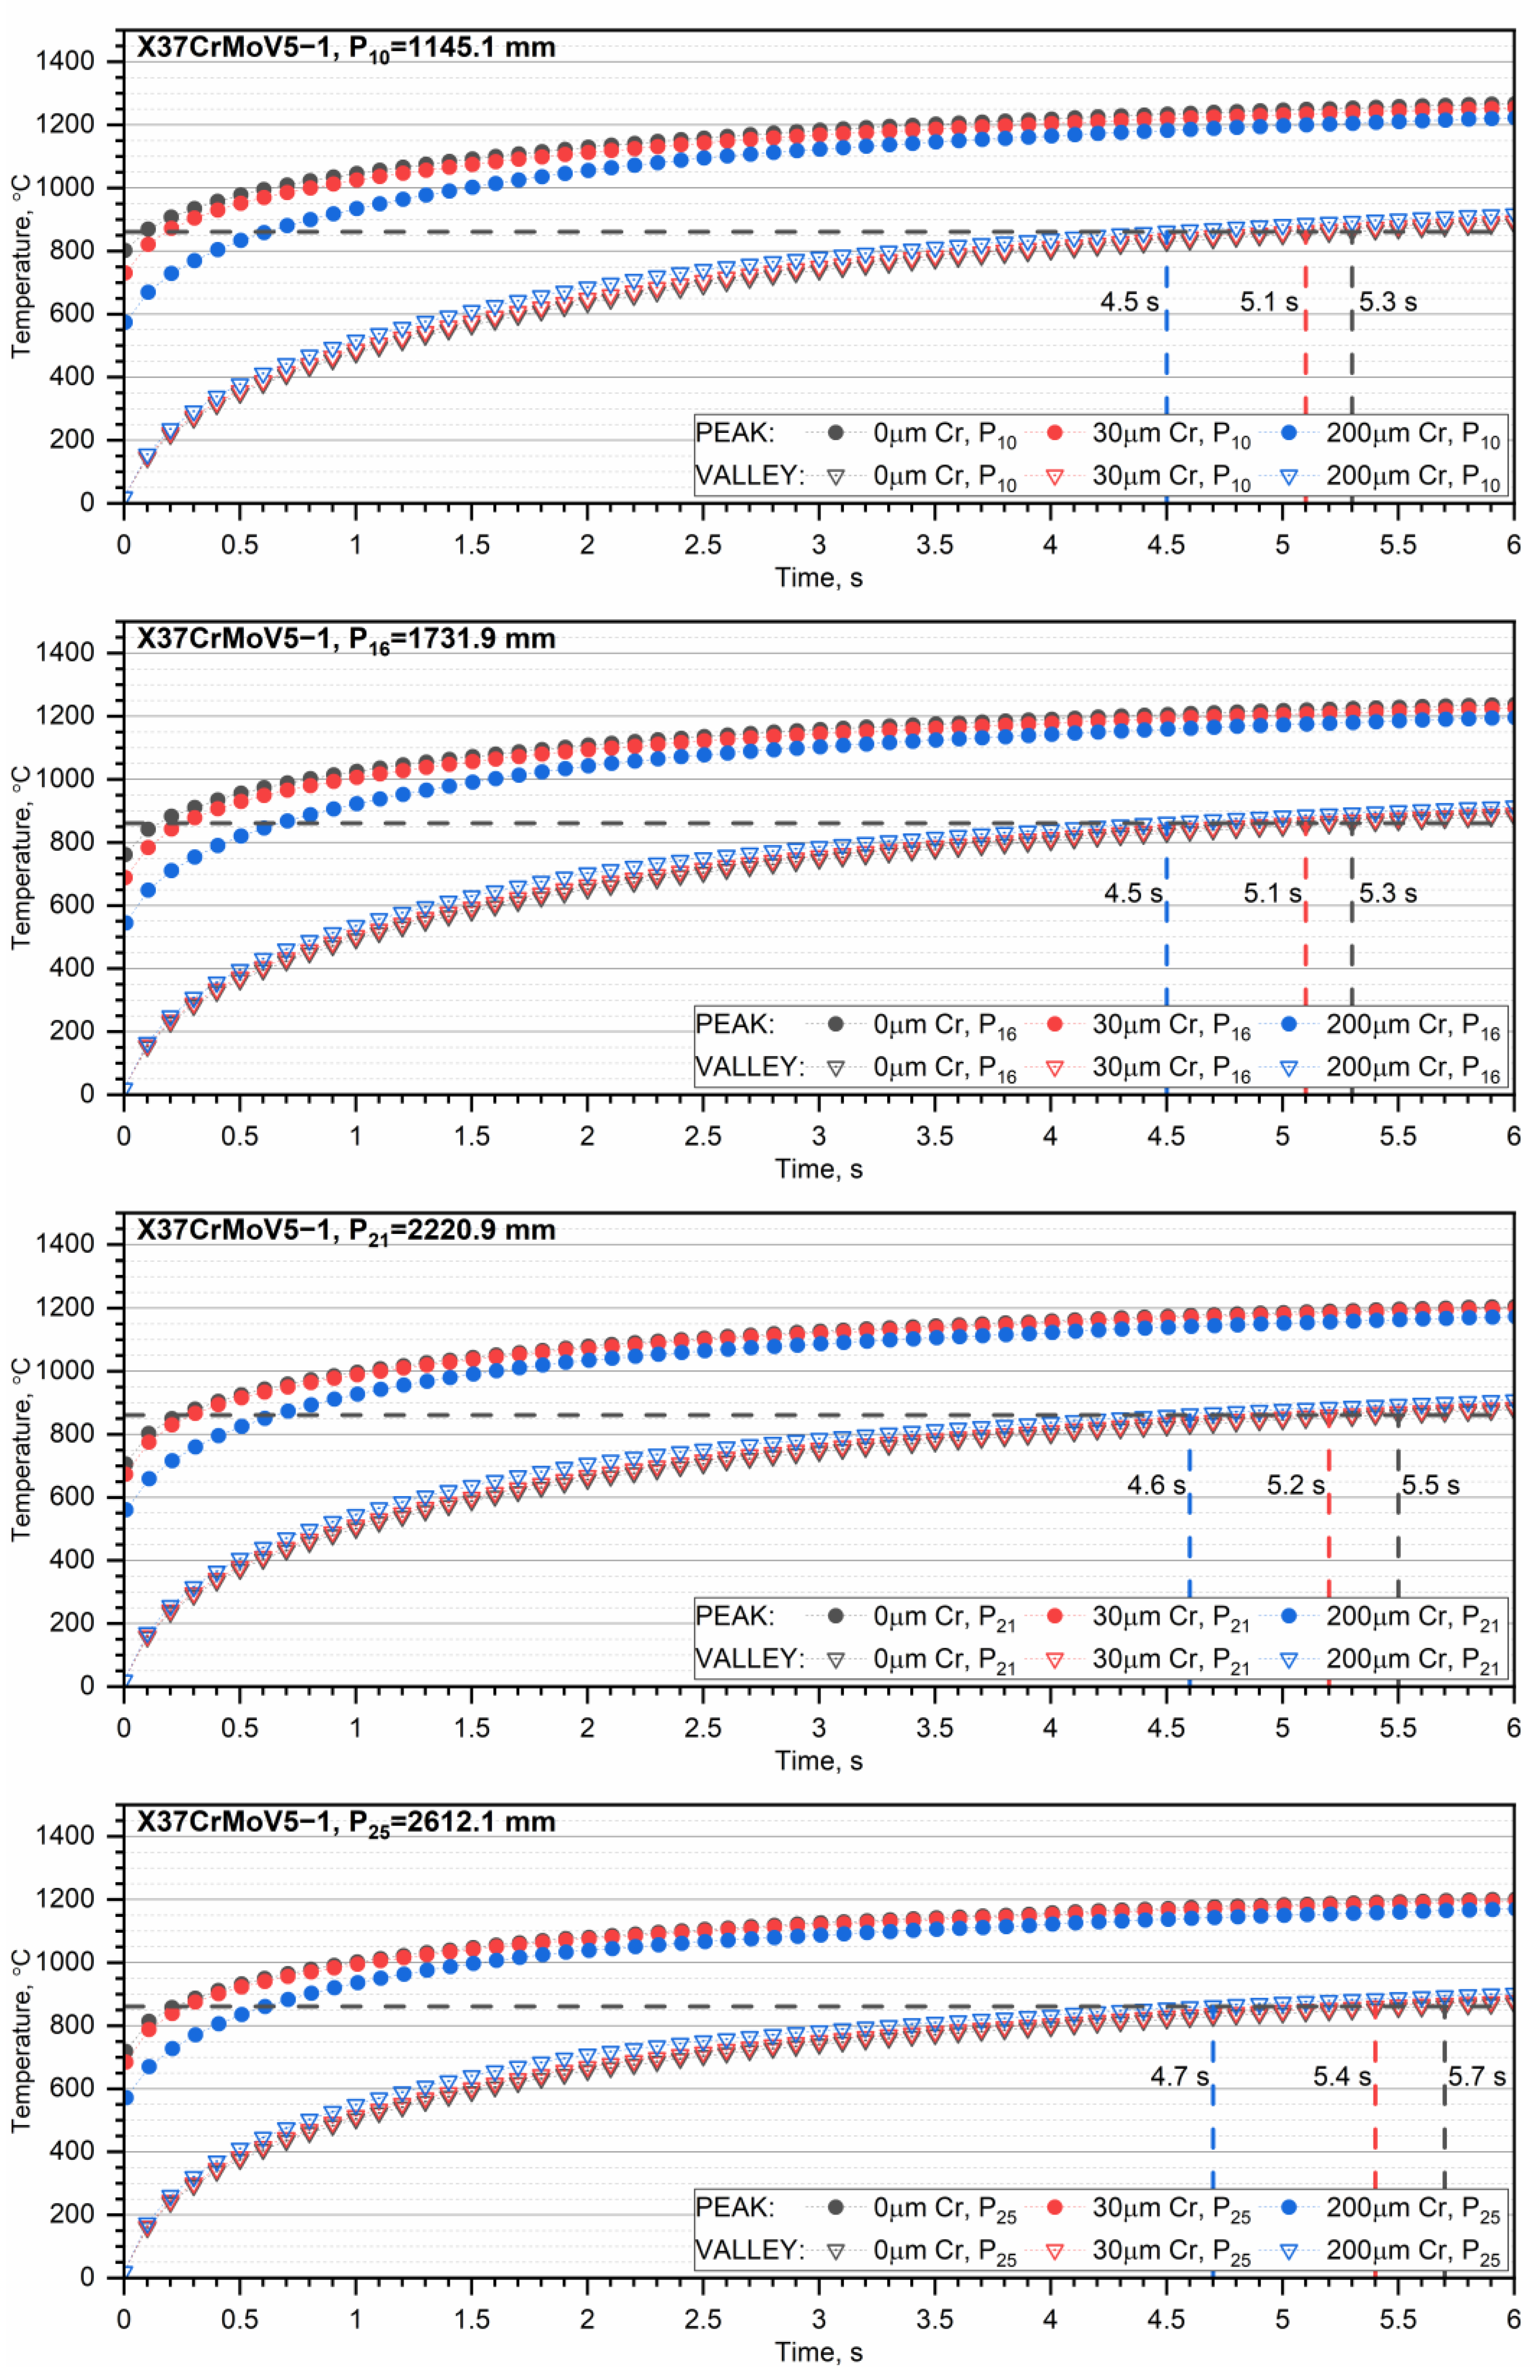
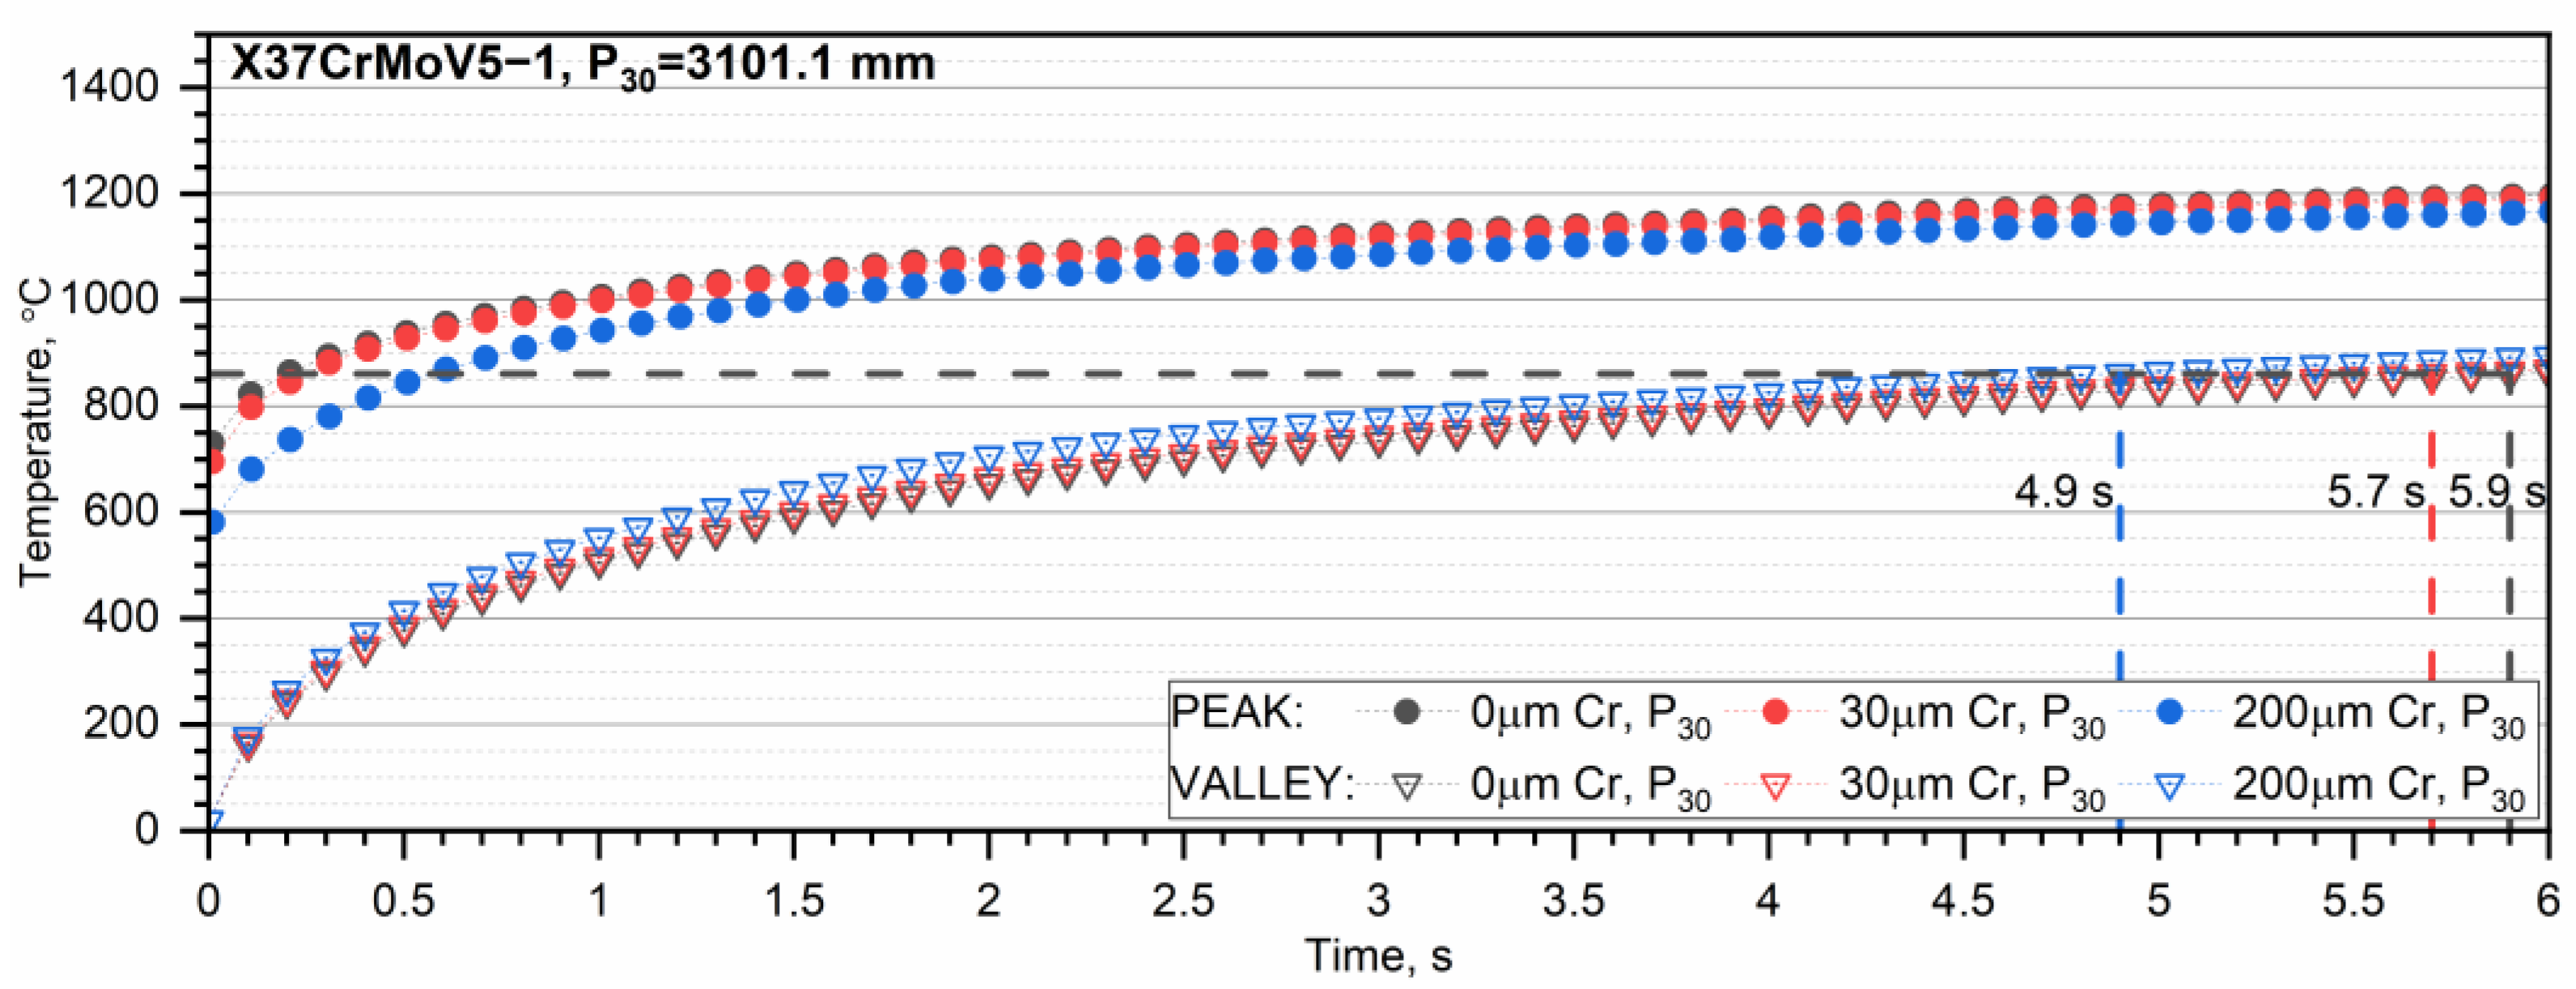
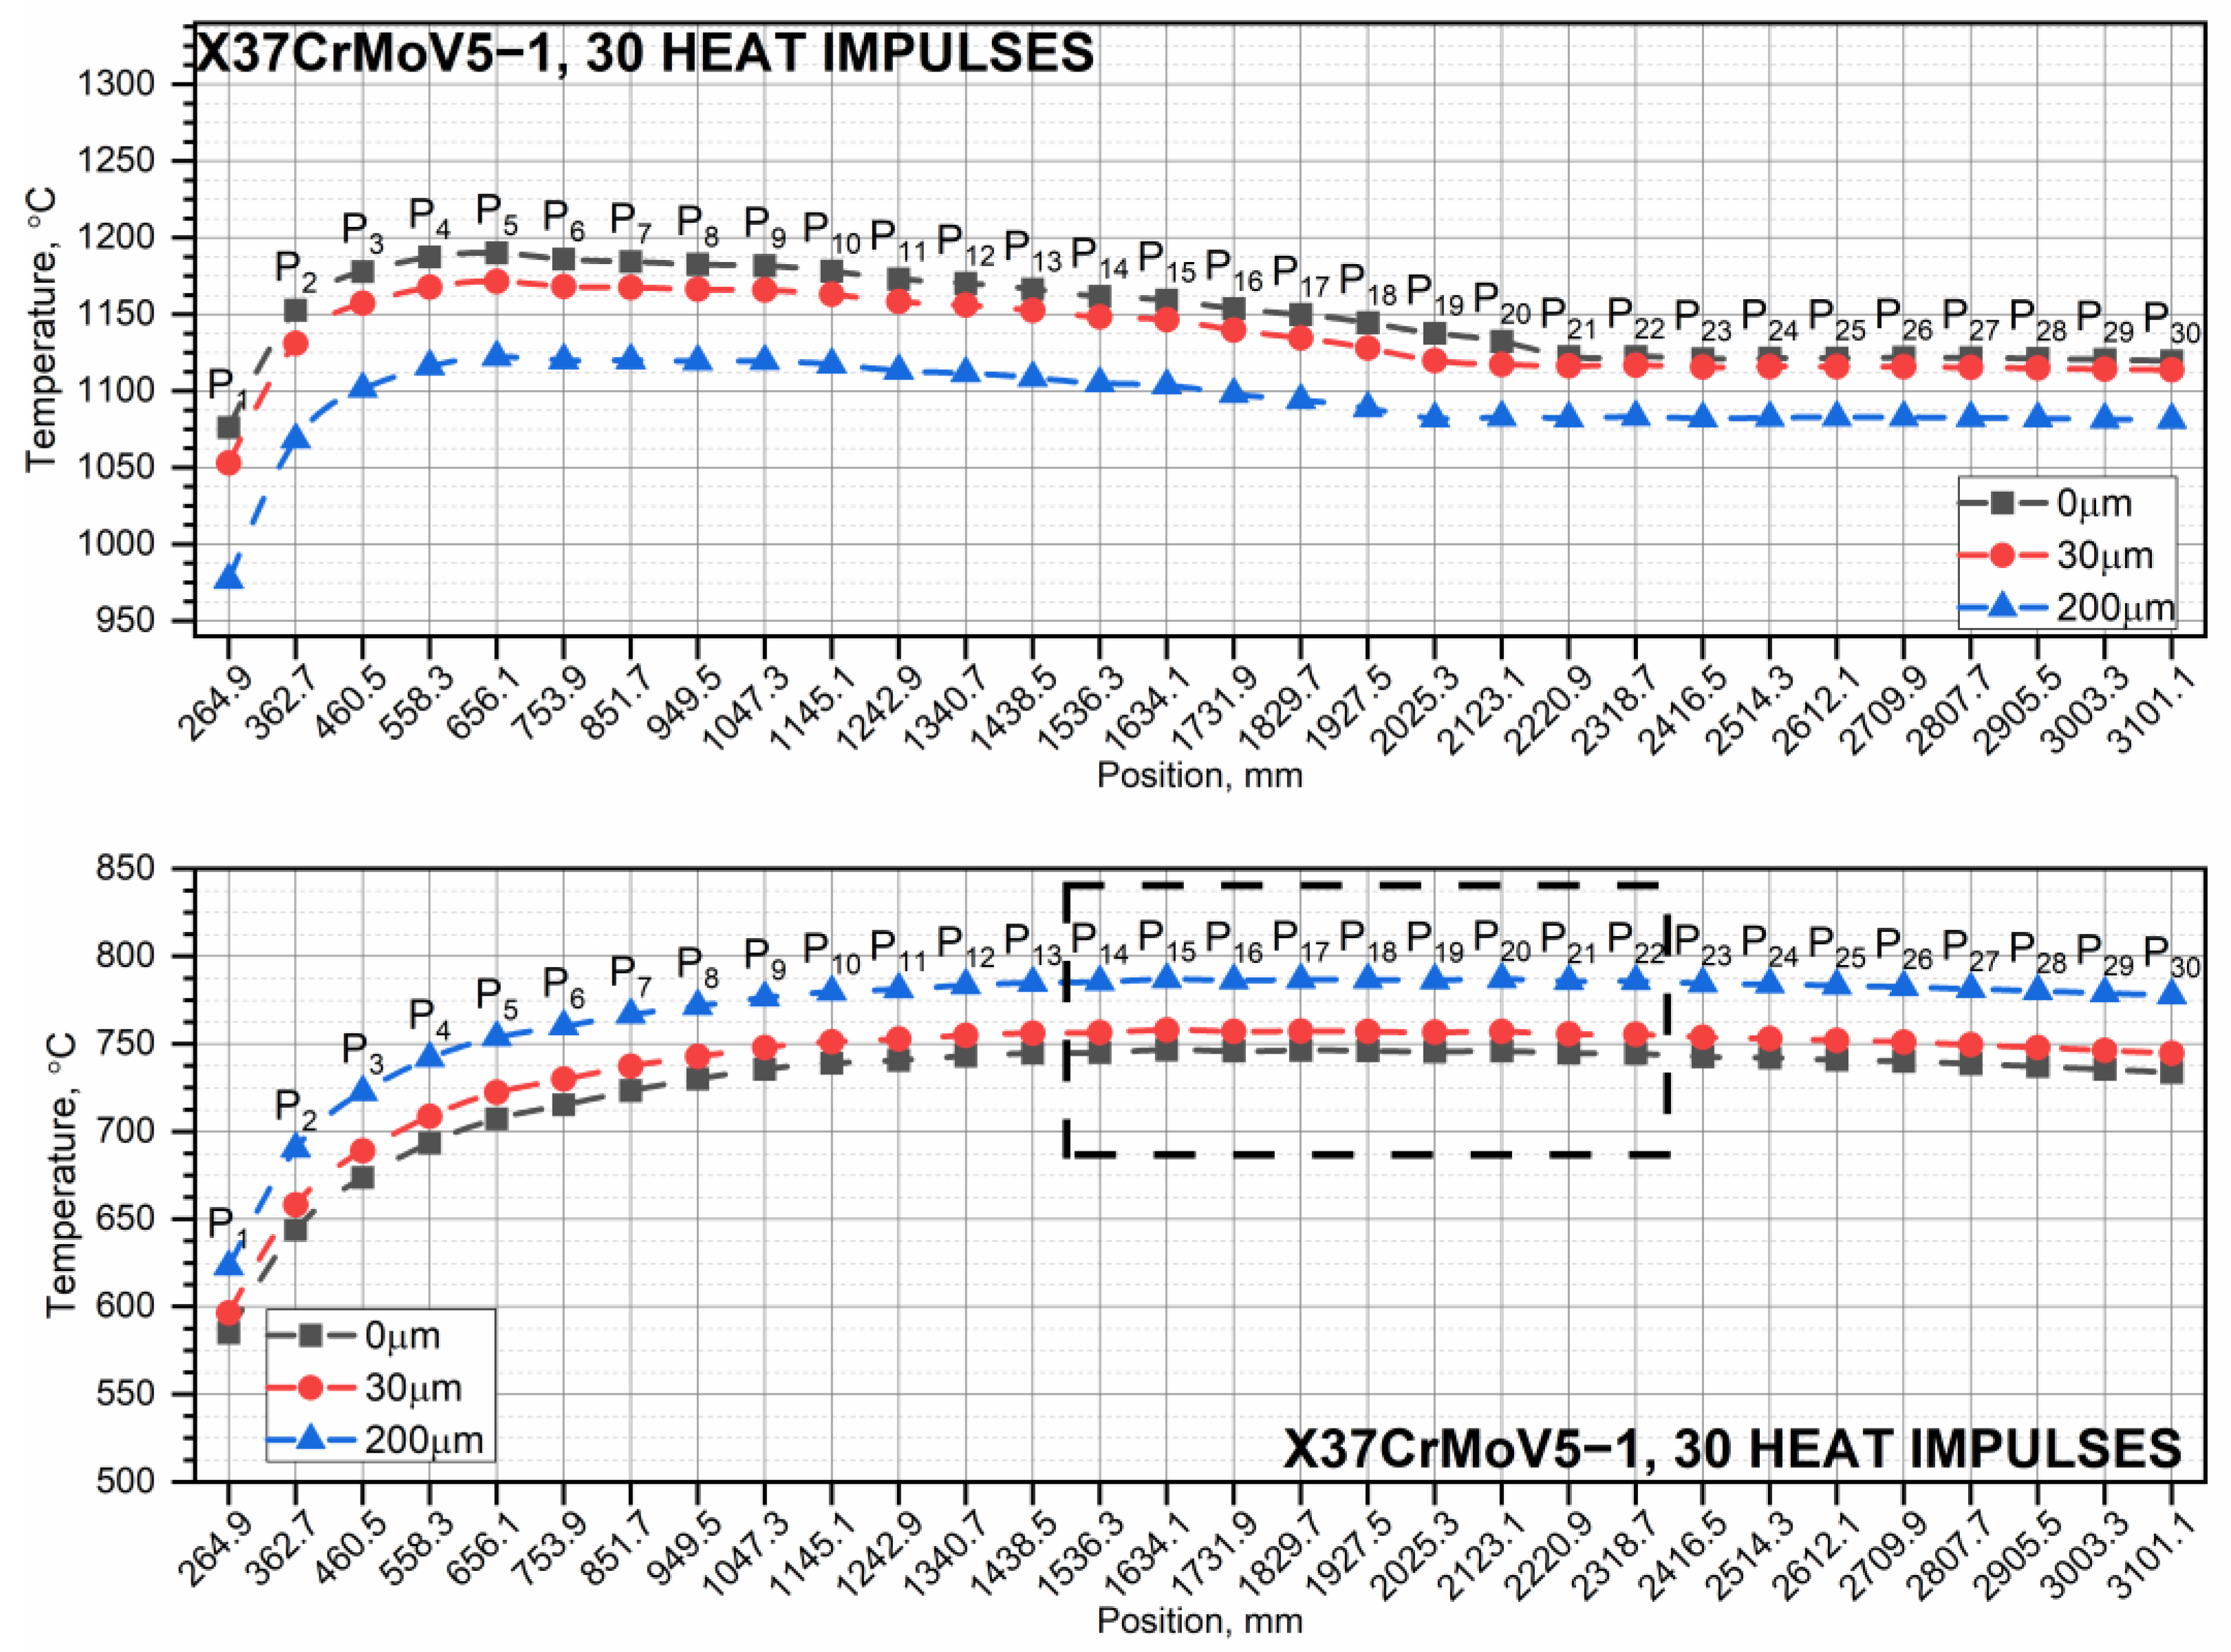
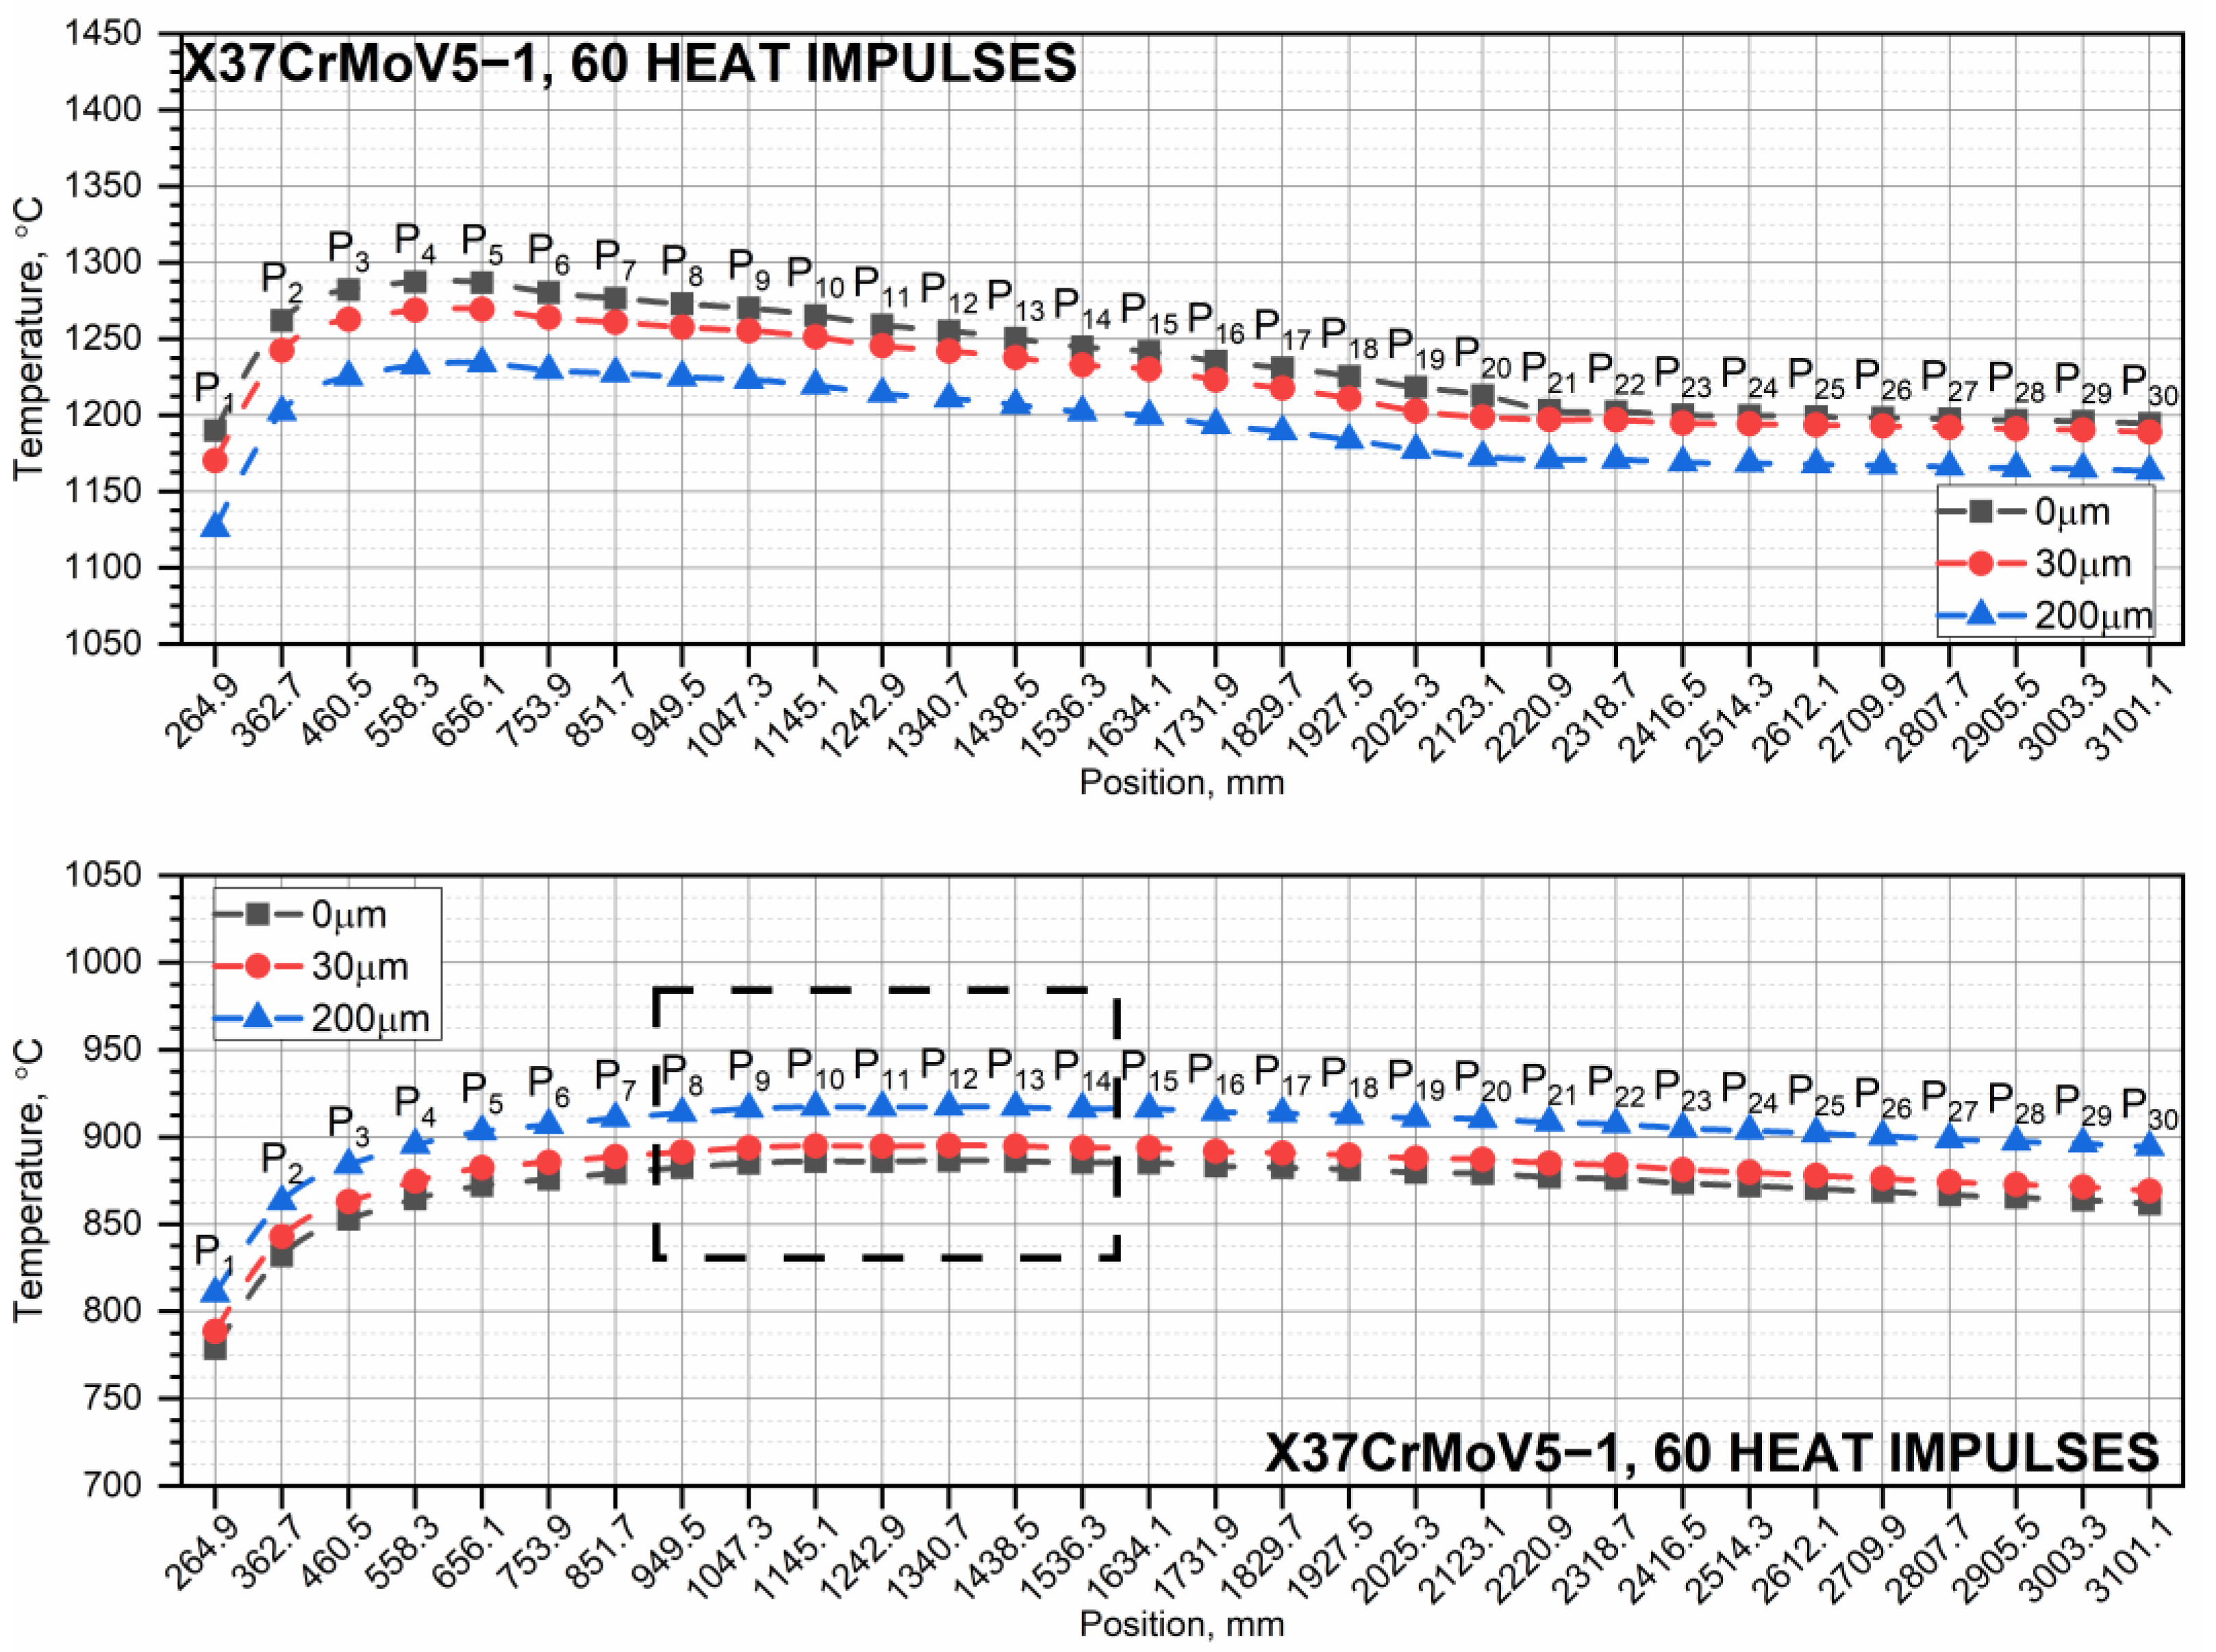
3.2. Temperature Distribution in the X37CrMoV5-1 Tube for a Series of Ten, Thirty, and Sixty Heat Impulses
4. Discussion
5. Conclusions
- (1)
- Repeatedly exceeding the shrinkage temperature during the operation of the device is an unfavorable phenomenon because it causes cracks in the steel on the inner surface of the tube and, as a result, the peeling of the chrome layer.
- (2)
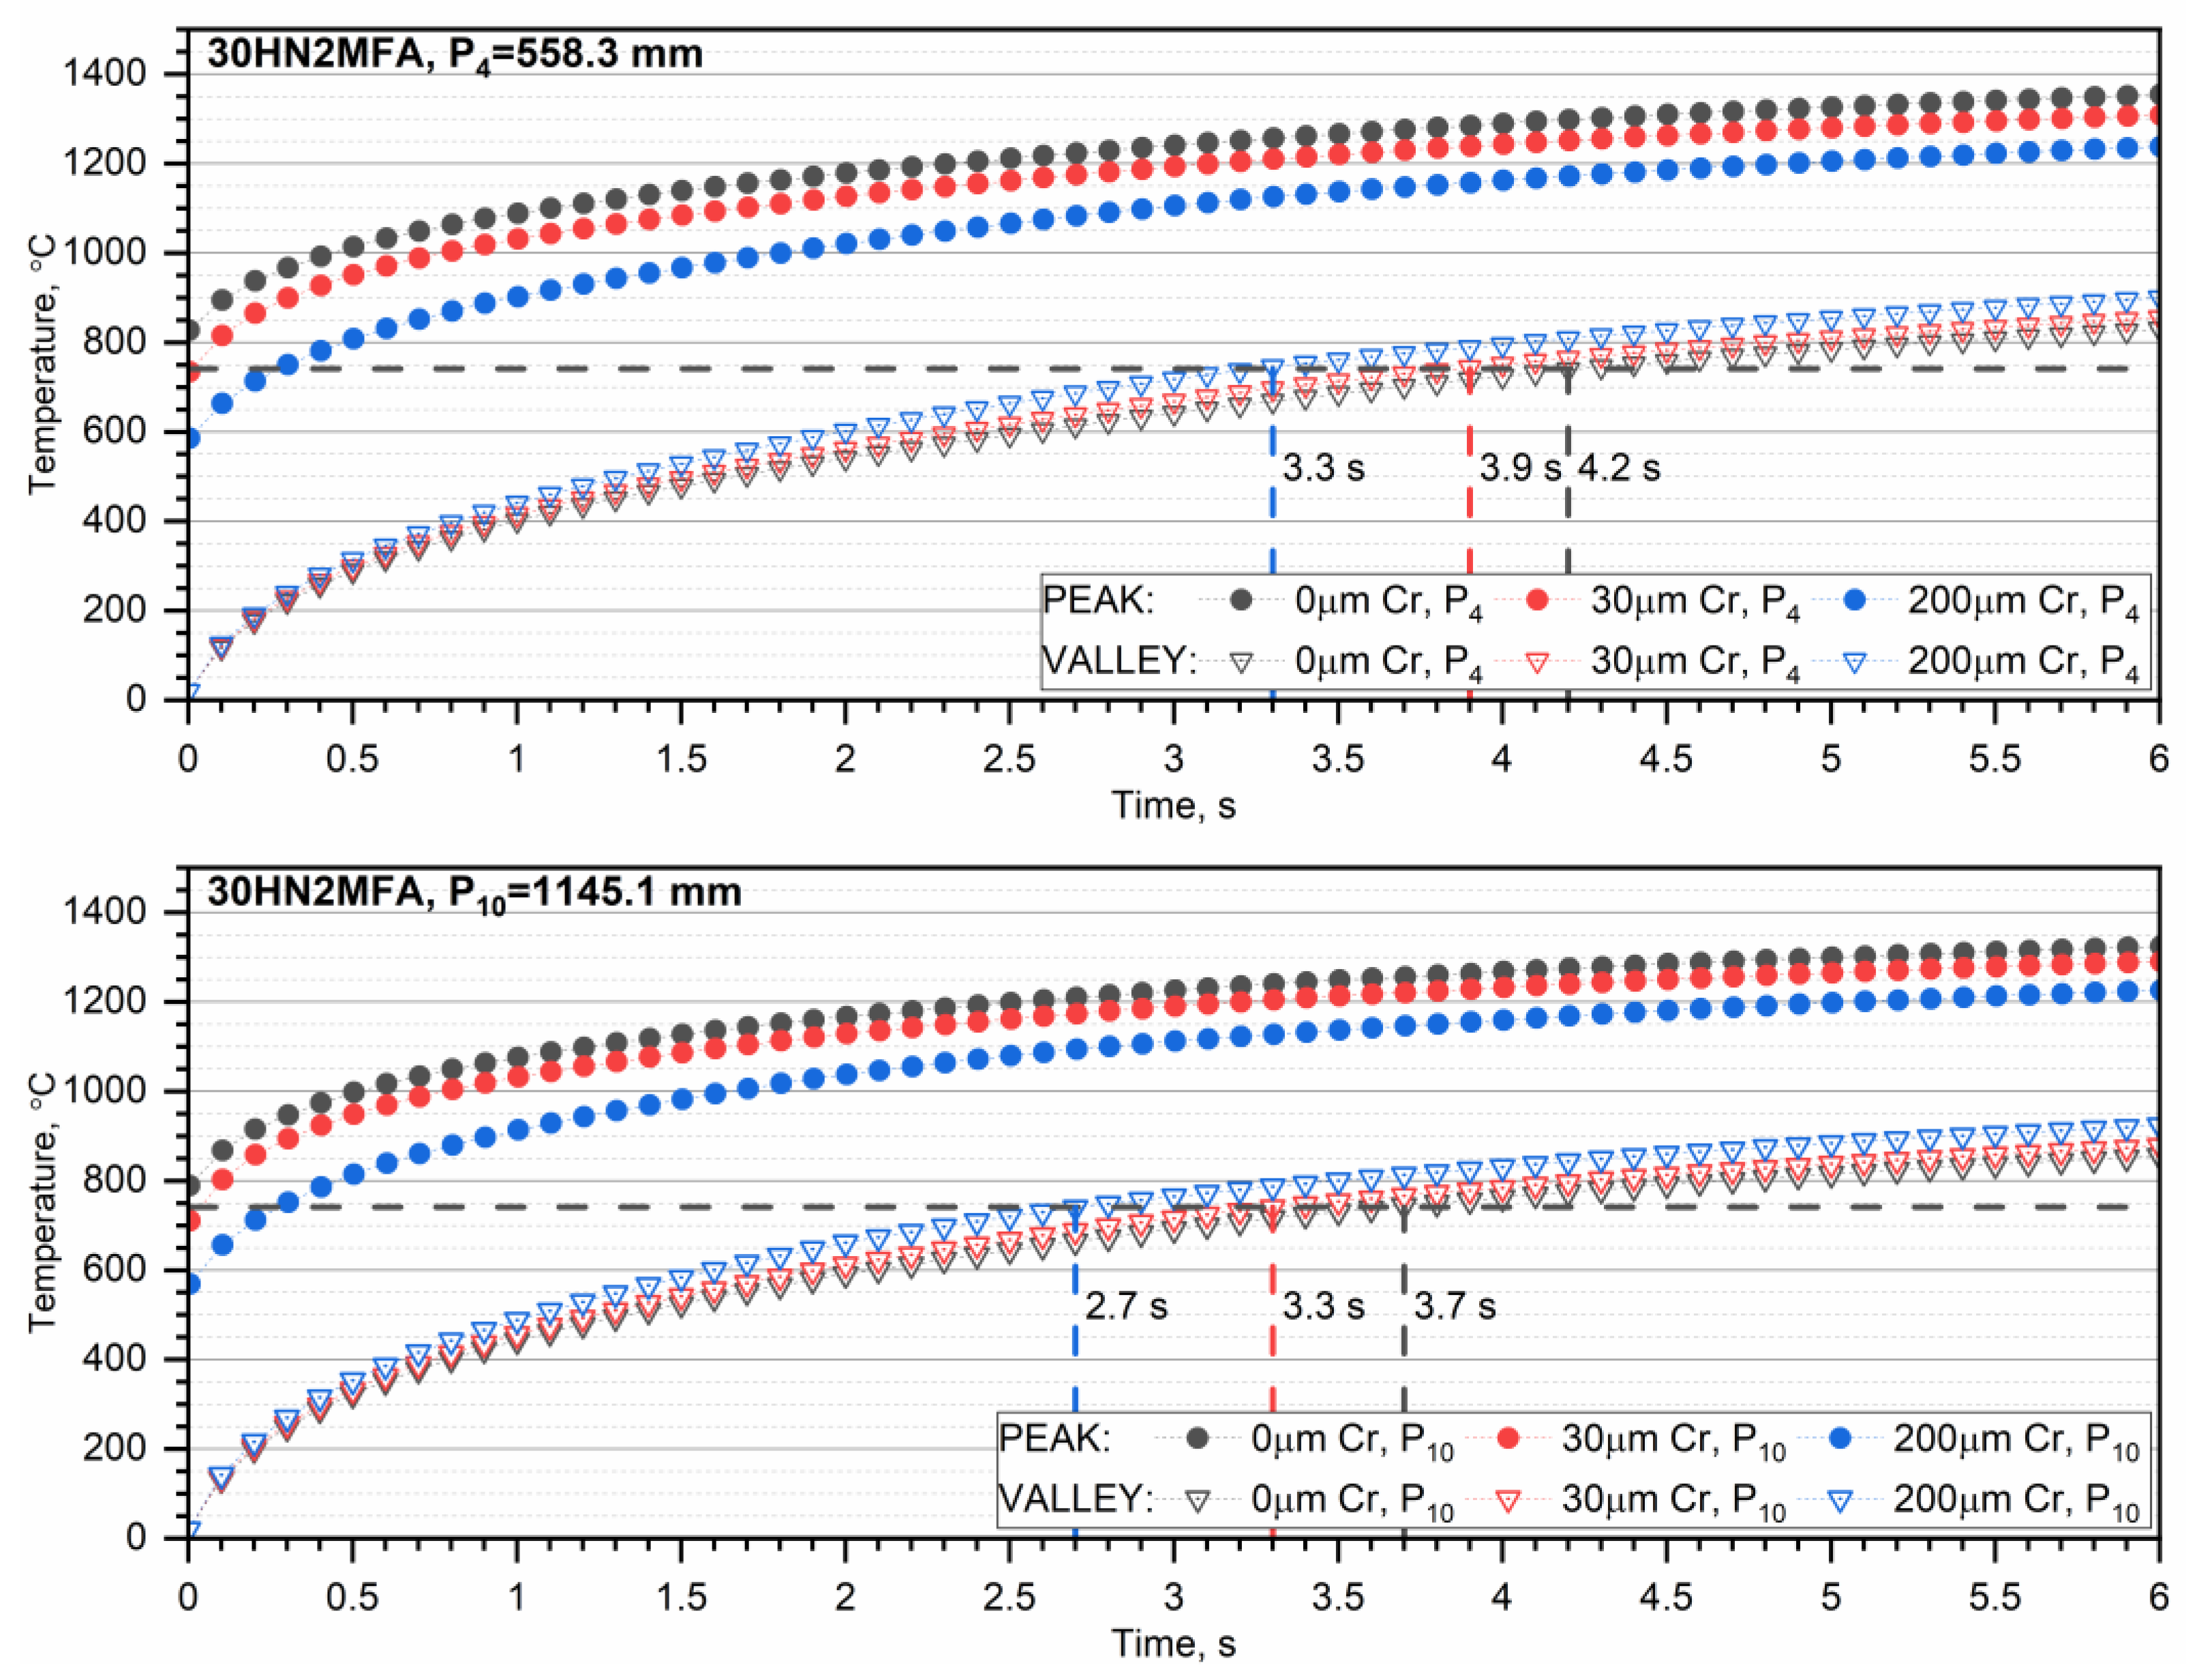
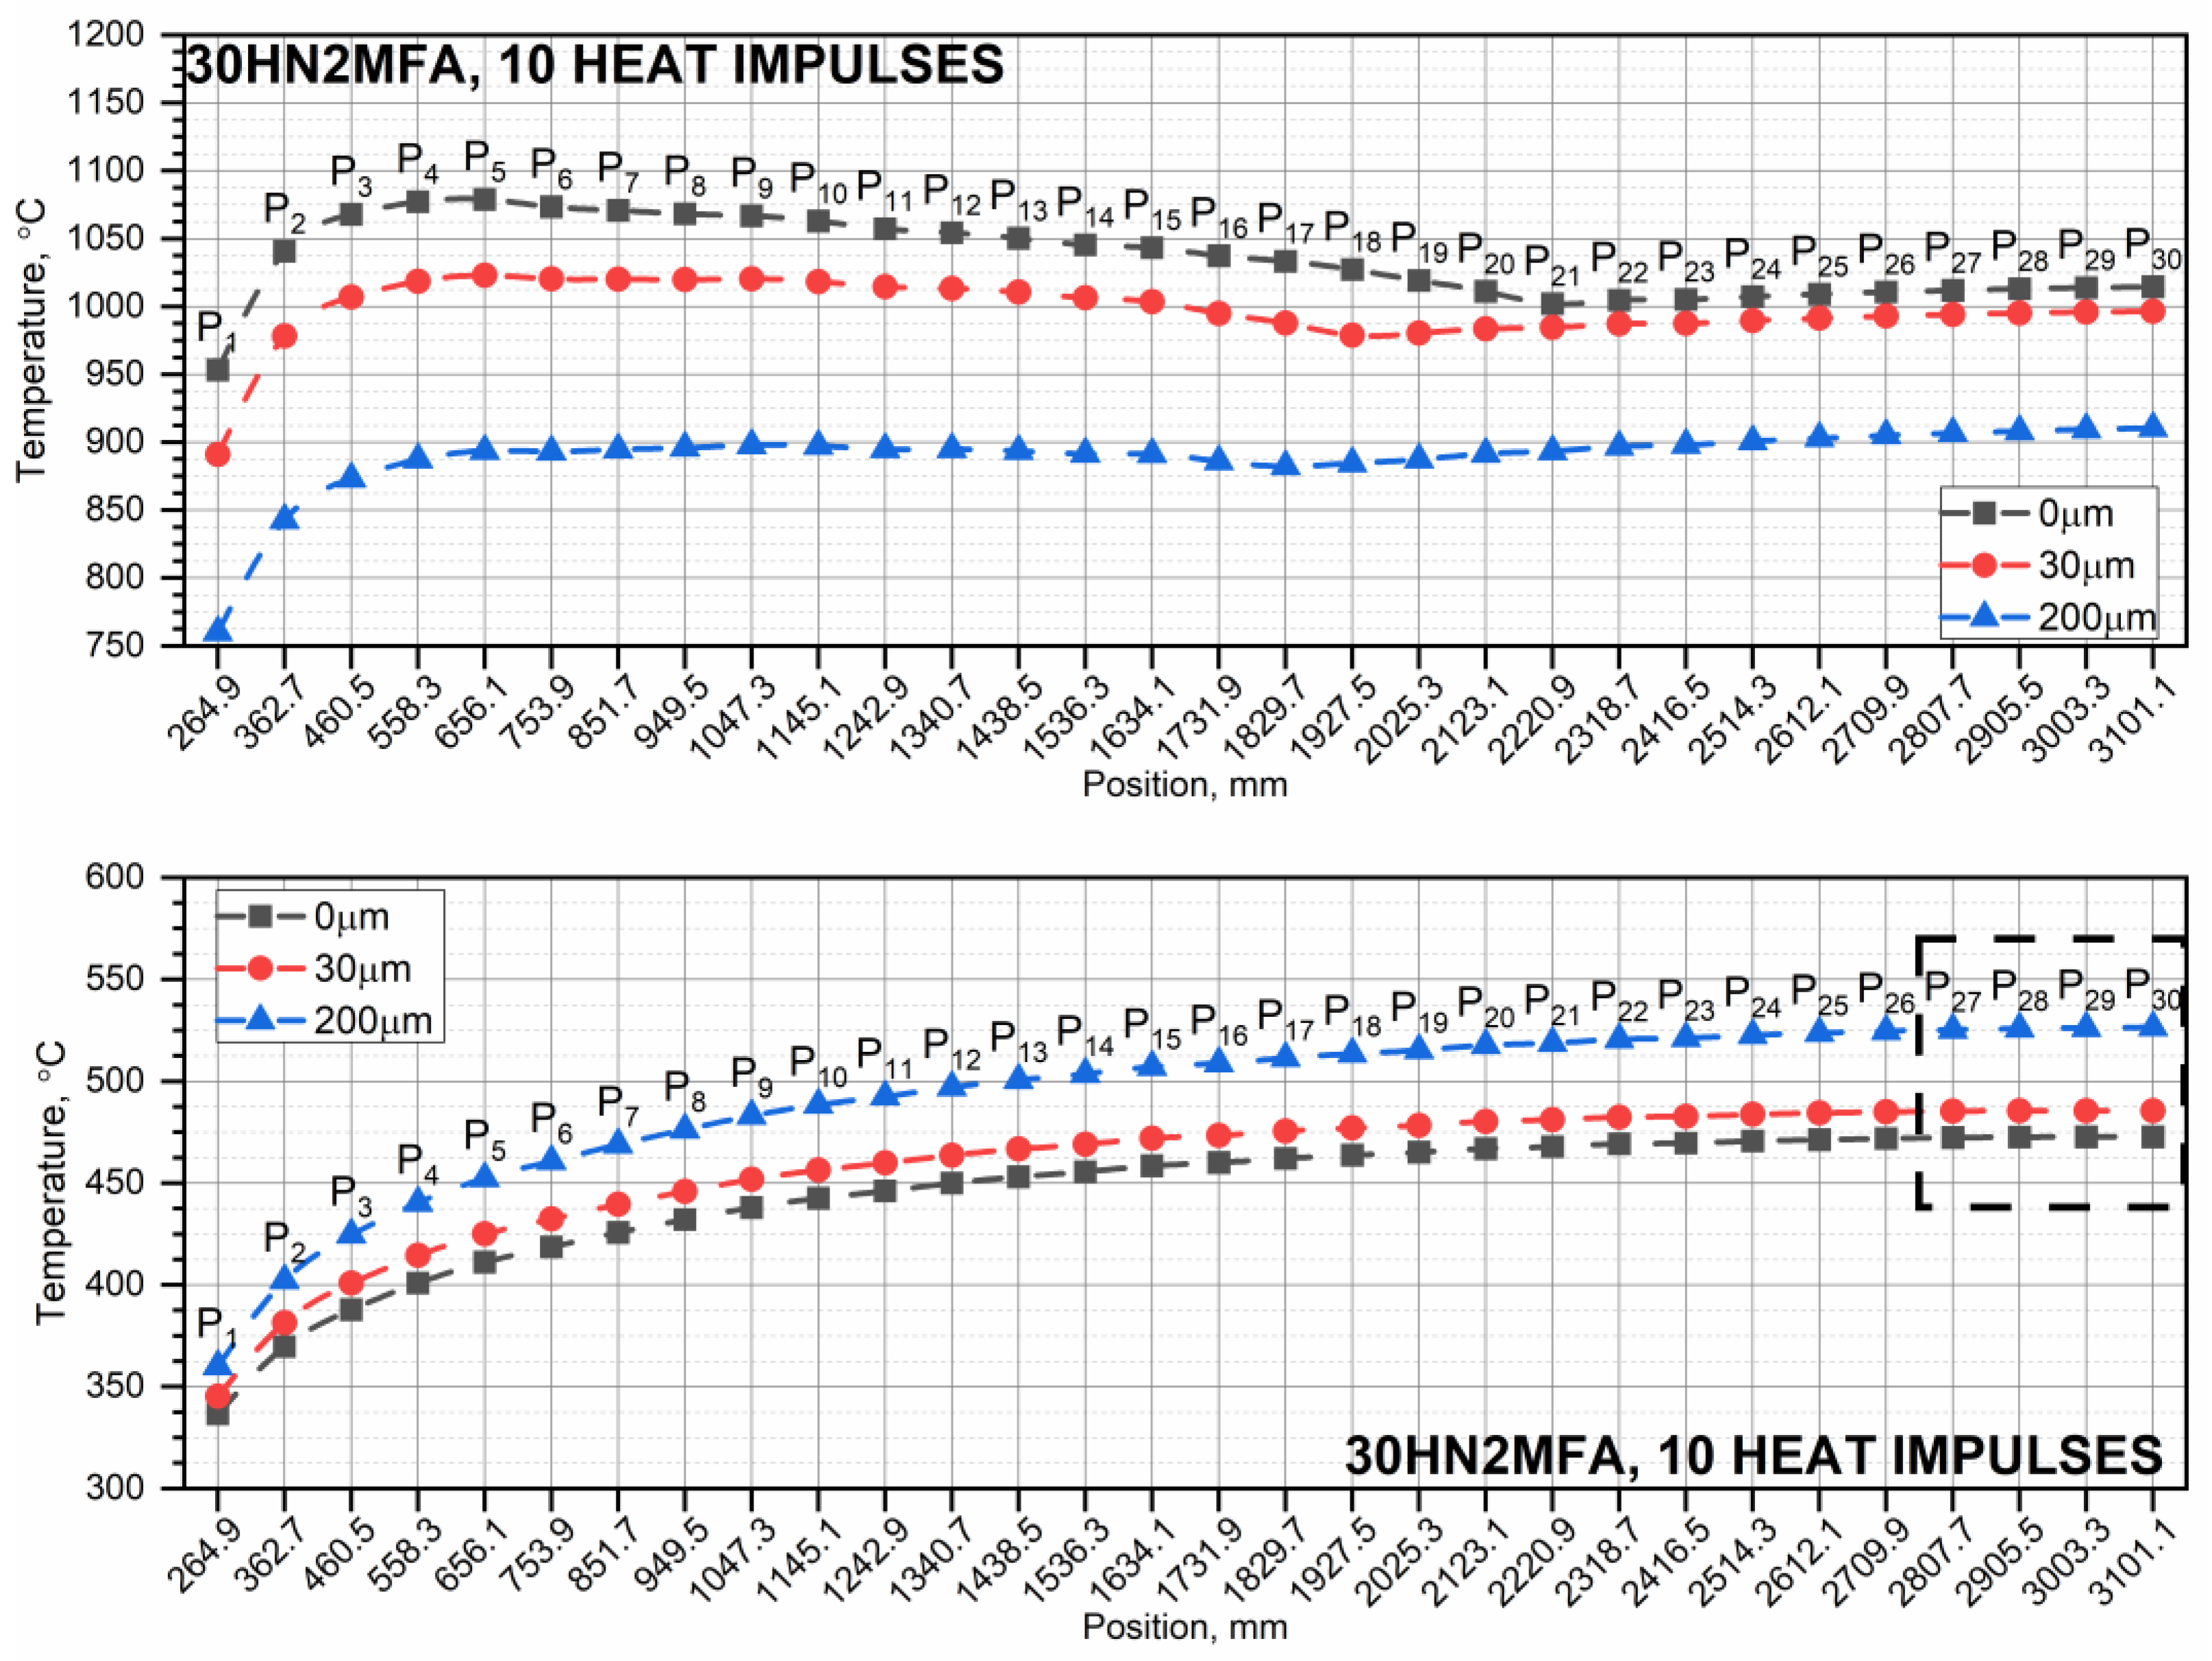
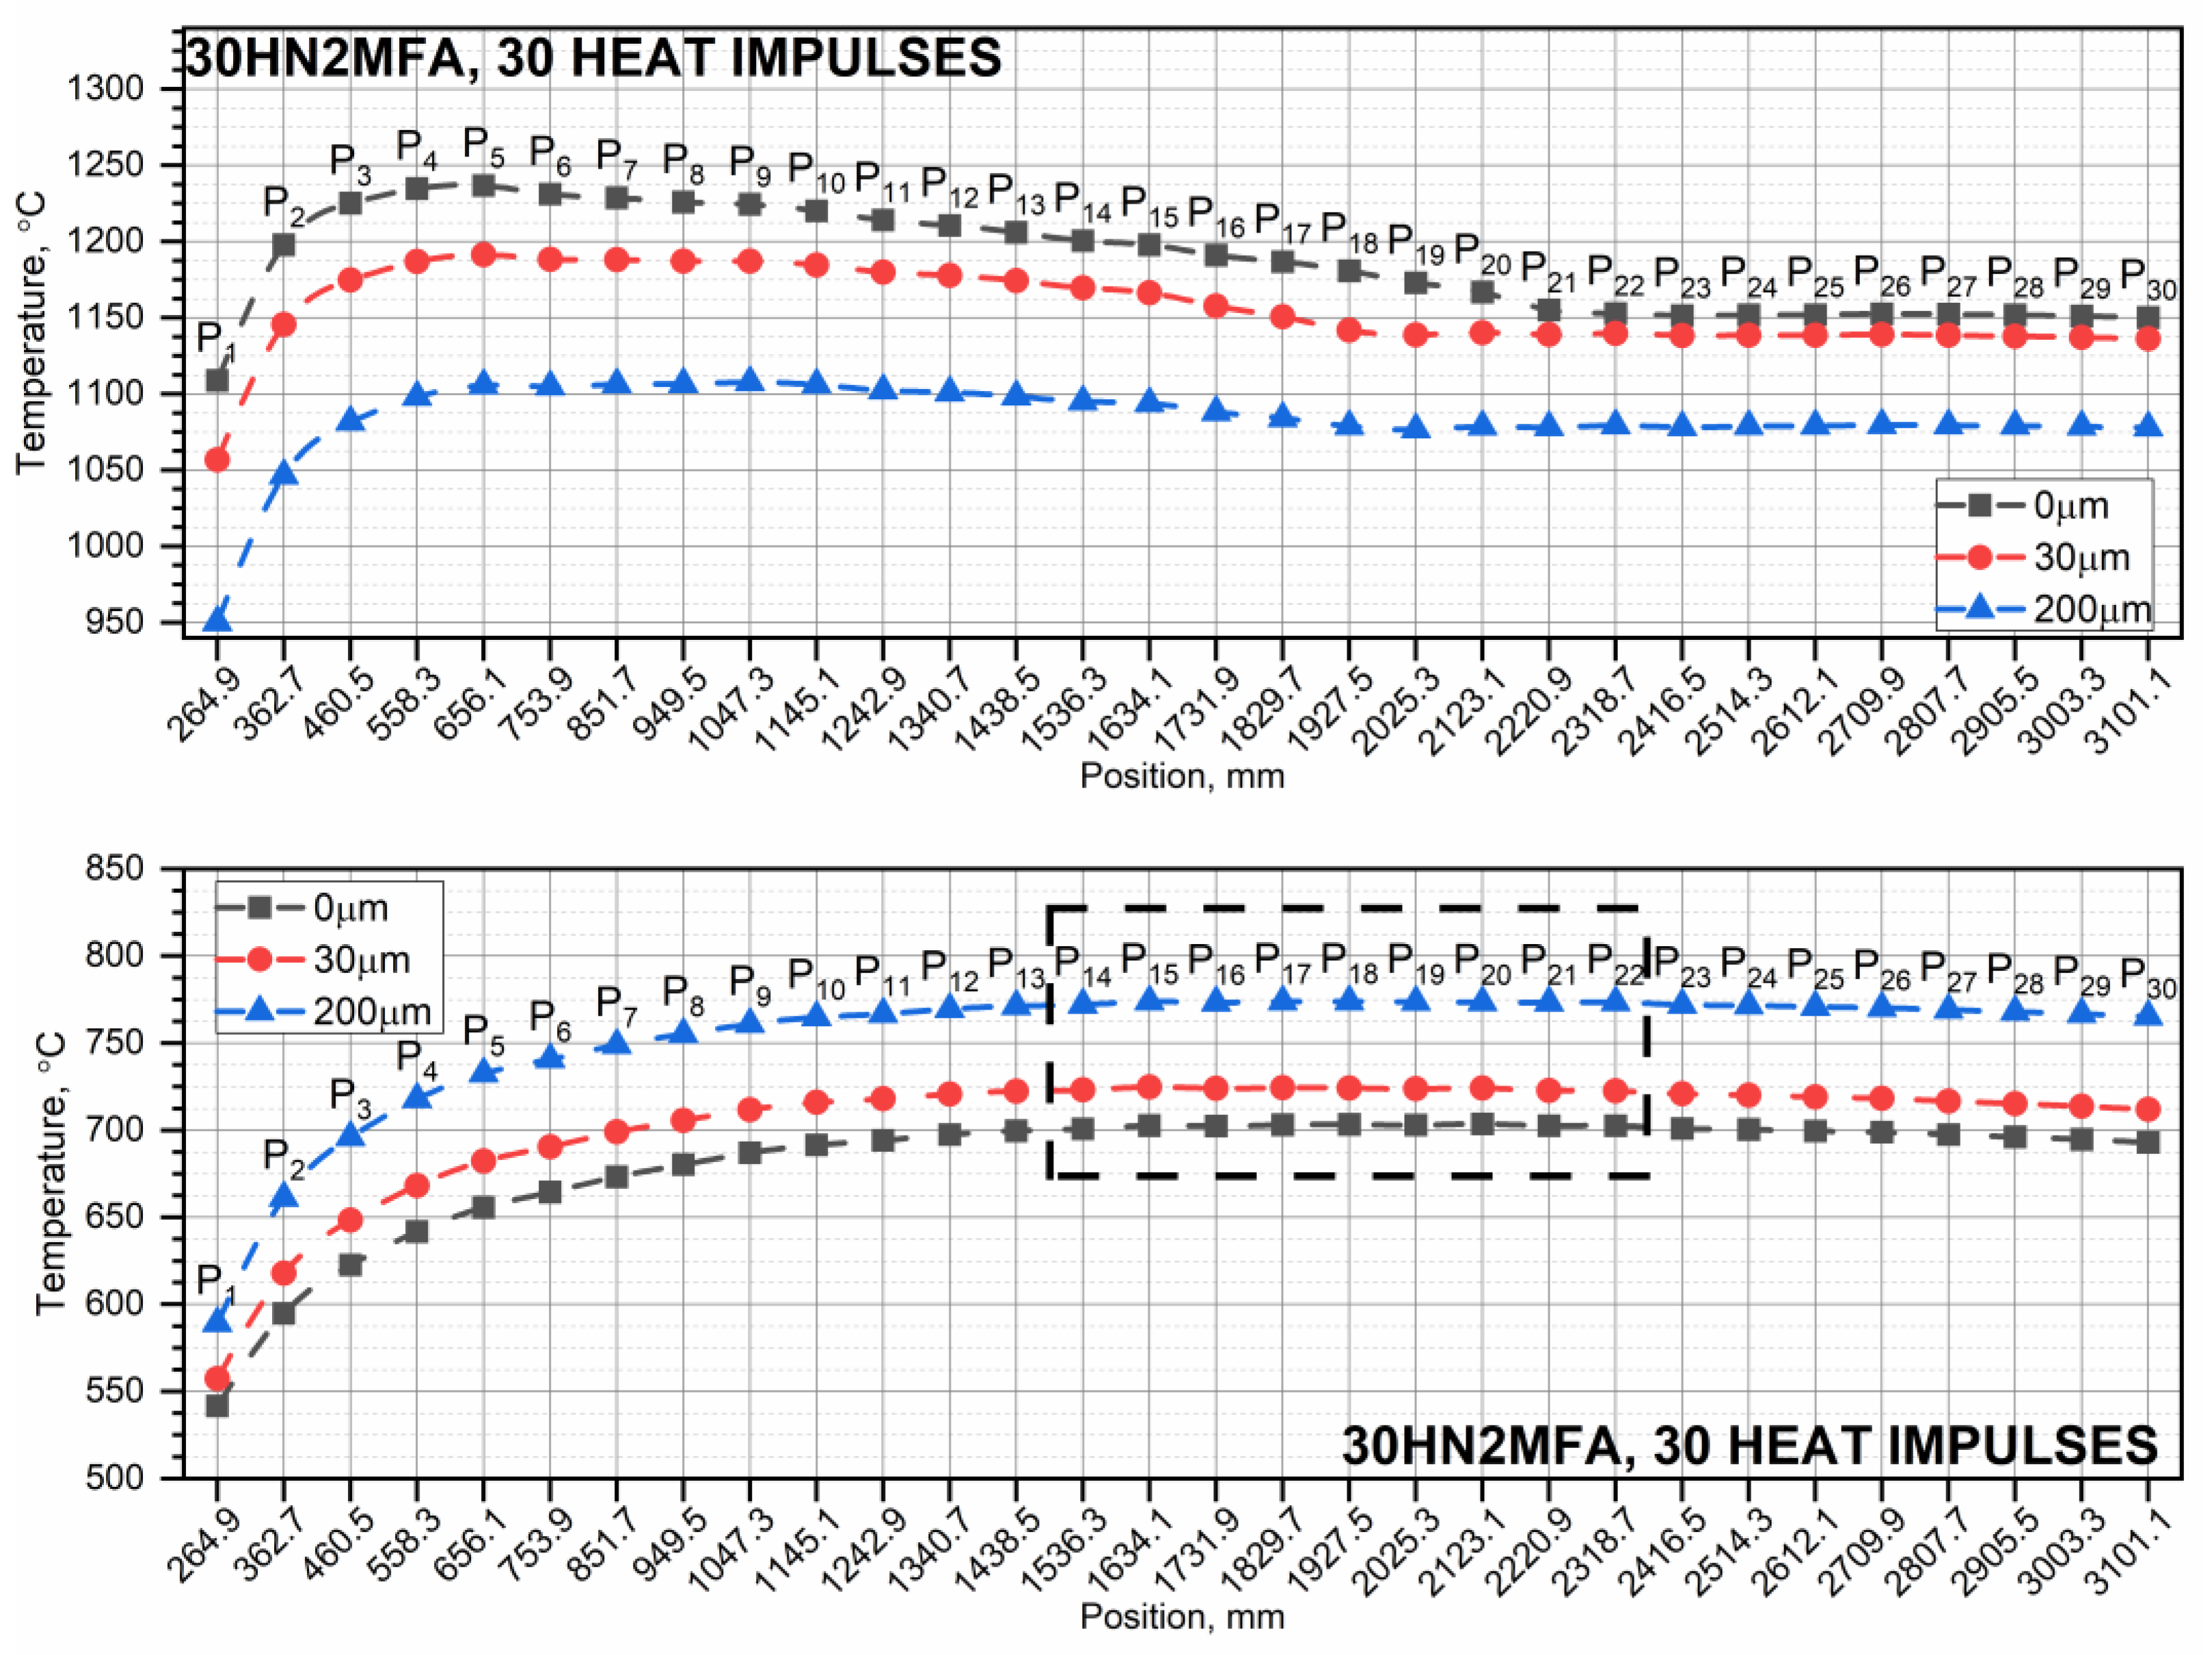
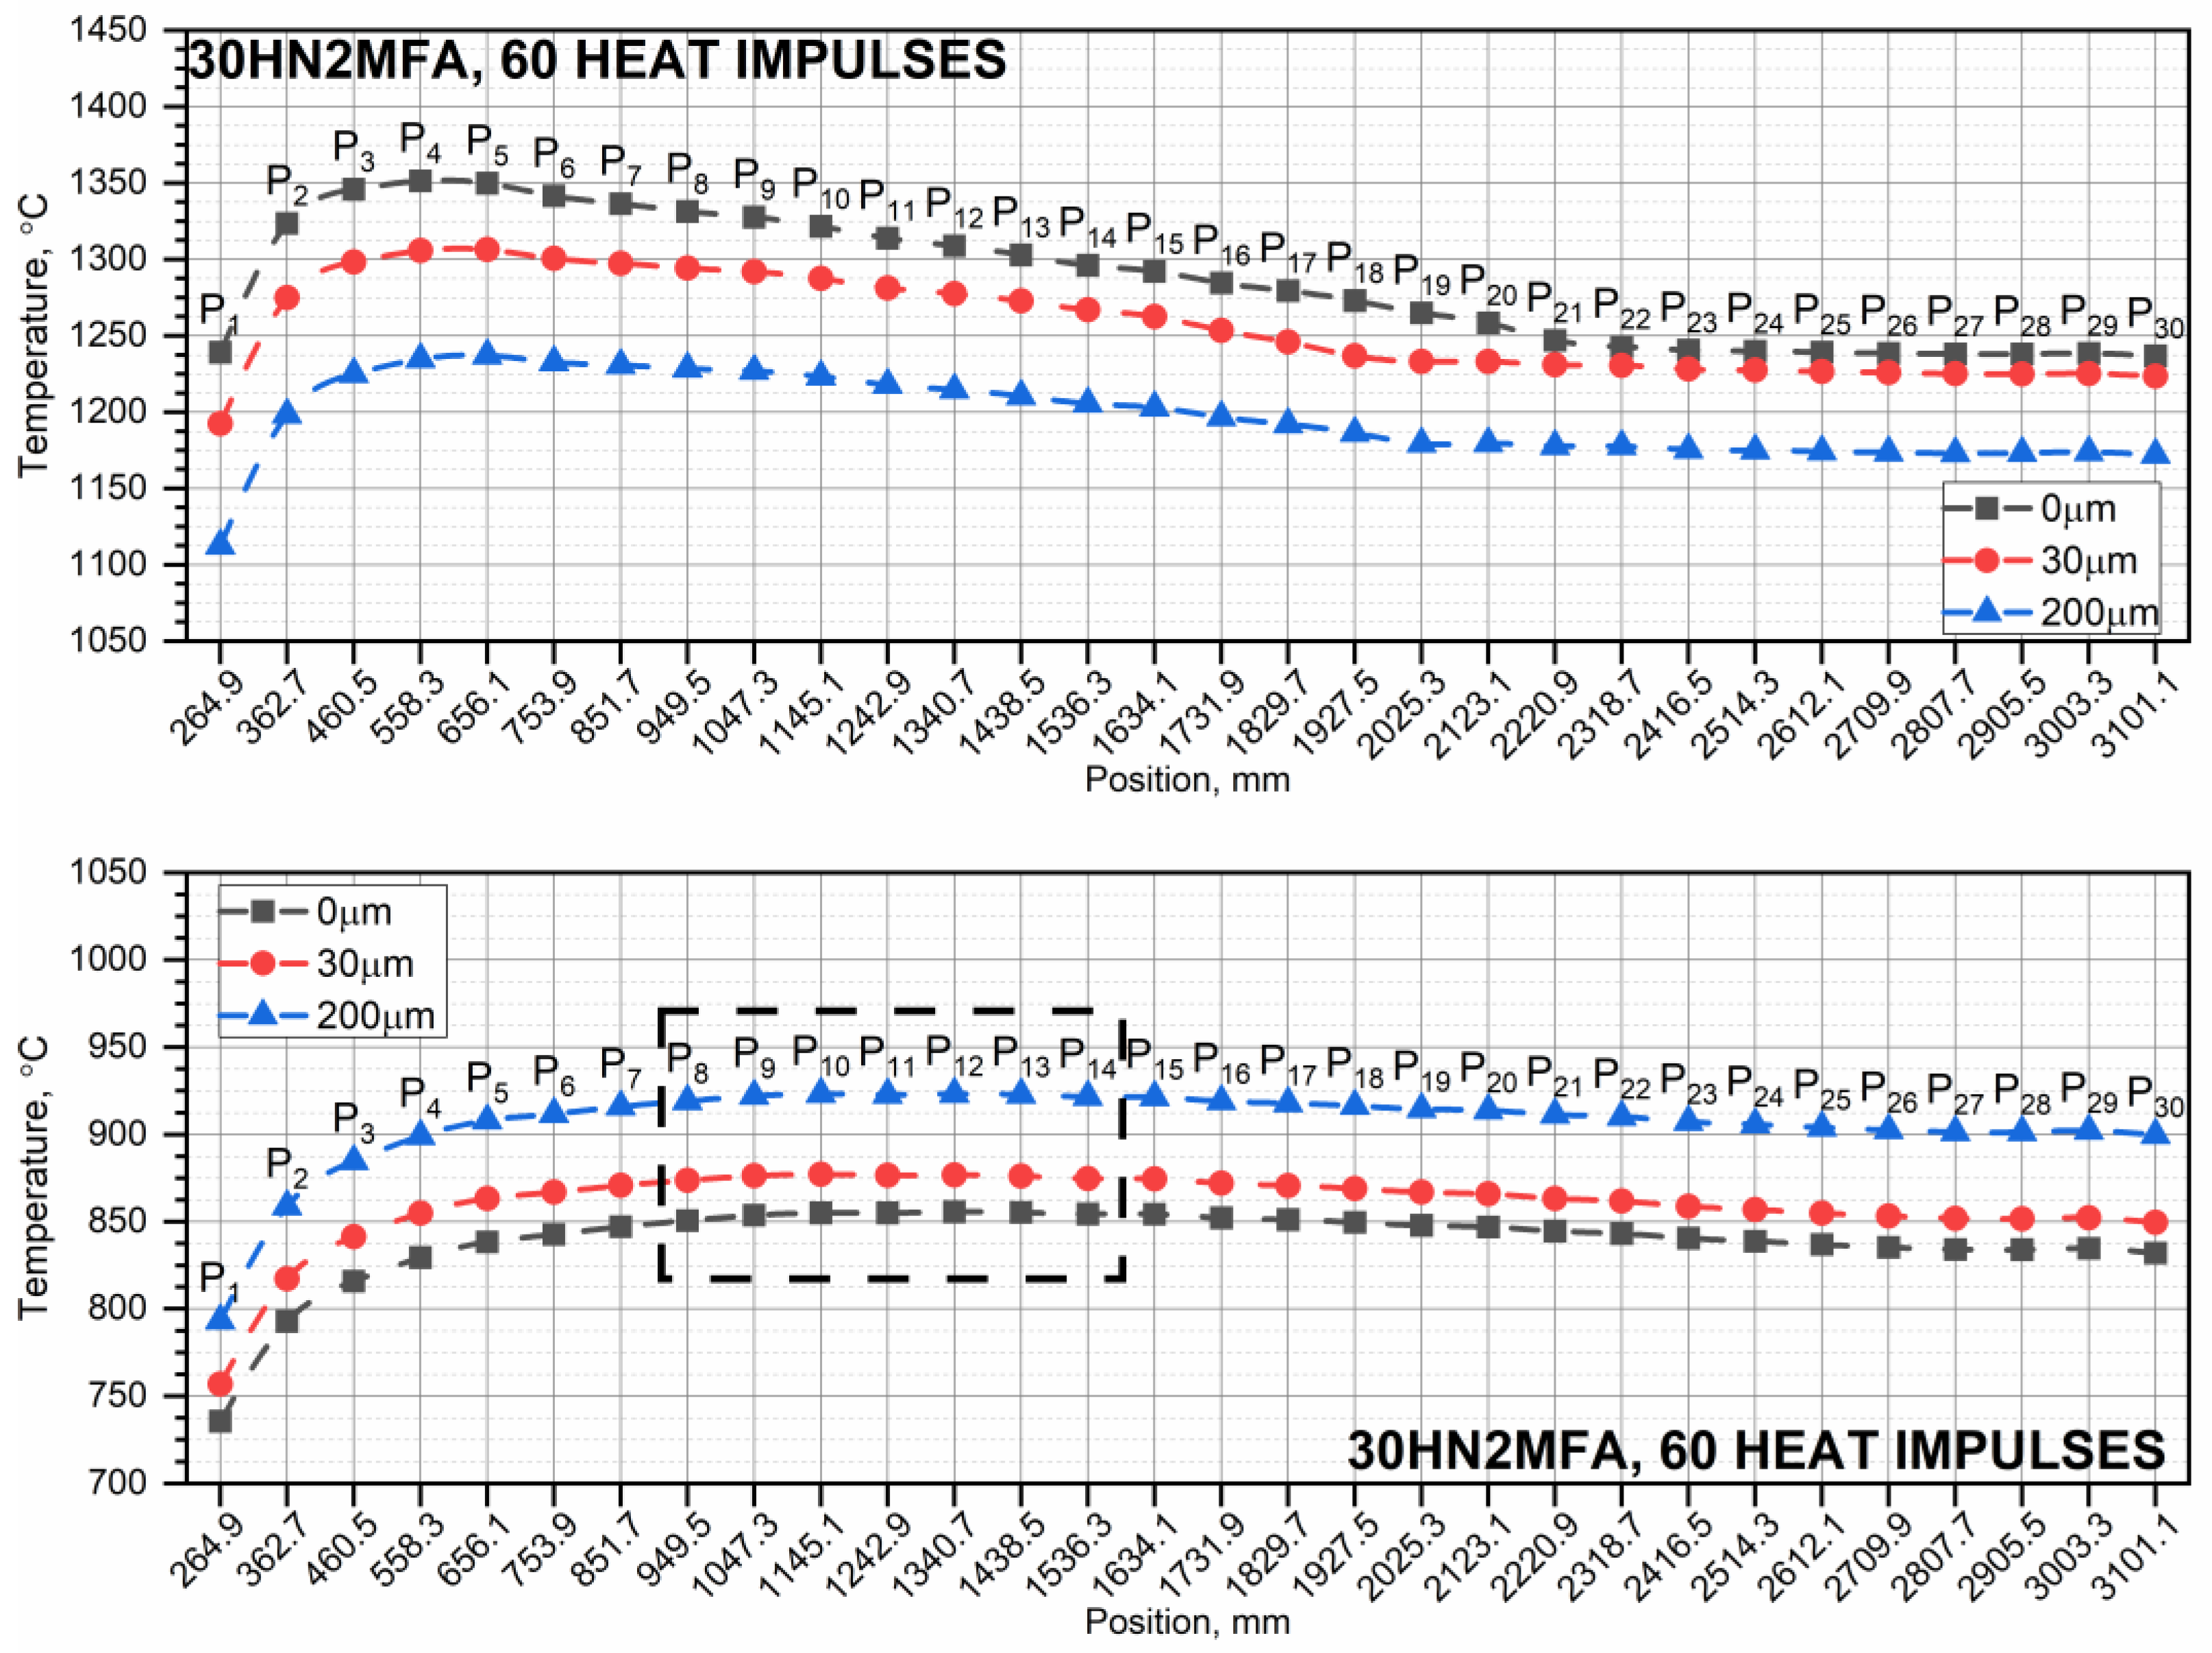
- When the pipe is operated with successive thermal impulses, it can be seen that as the thickness of the chrome layer increases, the temperature of the inner surface of the pipe increases. This is due to the high thermal conductivity of chromium. The number of thermal impulses needed to obtain the shrinkage temperature on the inner surface of the pipe is the largest for a pipe without a chrome coating.
- (3)
- A steel tube with a higher shrinkage temperature wears out more slowly because more heat impulses are needed to reach this temperature. In the case of a pipe made of X37CrMoV5-1 steel, regardless of the zone, the number of thermal impulses needed to reach the shrinkage temperature is significantly higher compared to a tube made of 30HN2MFA steel, i.e., by approx. 20 heat impulses. It is usually recommended that the number of heat impulses for the continuous operation of the tube should not exceed 30 heat impulses.
- (4)
- The smaller the thickness of the chromium layer on the inner surface, the greater the number of heat impulses needed to reach the shrinkage temperature of the steel. This is particularly important for a 30HN2MFA steel tube, for which the shrinkage temperature is reached after approx. 30 heat impulses.
- (5)
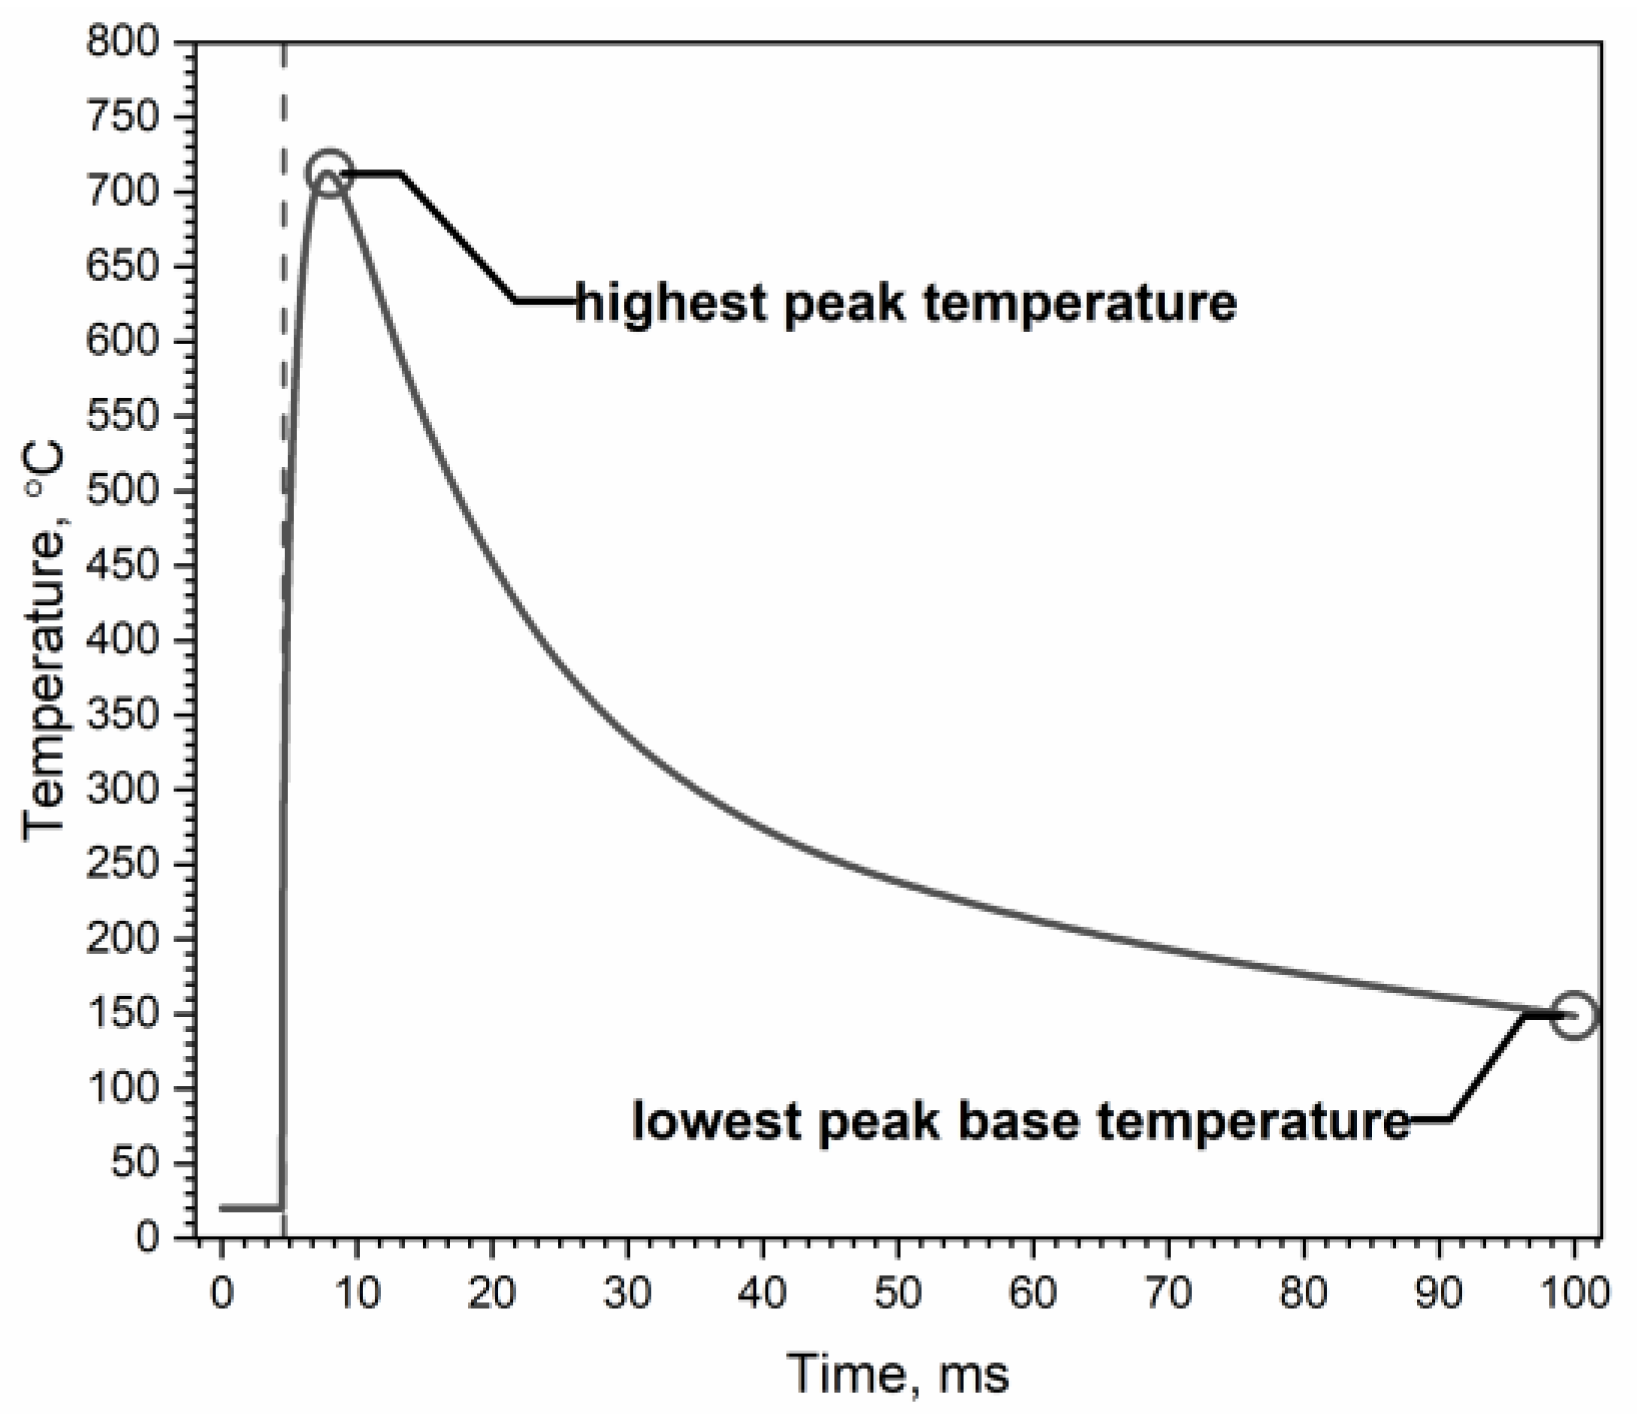
- As the number of successive thermal impulses increases, the maximum temperature of the inner surface of the tube, i.e., the lowest peak base temperature, moves from the end of the tube, i.e., from the tube outlet, to its beginning. This is due to the greater thickness of the tube wall in its initial part, which results in heat accumulation for a large number of thermal impulses.
Author Contributions
Funding
Data Availability Statement
Conflicts of Interest
References
- Sopok, S.; Rickard, C.; Dunn, S. Thermal–chemical–mechanical gun bore erosion of an advanced artillery system part one: Theories and mechanisms. Wear 2005, 258, 659–670. [Google Scholar] [CrossRef]
- Sopok, S.; Rickard, C.; Dunn, S. Thermal–chemical–mechanical gun bore erosion of an advanced artillery system part two: Modeling and predictions. Wear 2005, 258, 671–683. [Google Scholar] [CrossRef]
- Lawton, B. Thermo-chemical erosion in gun barrels. Wear 2001, 251, 827–838. [Google Scholar] [CrossRef]
- Ebihara, W.T.; Rorabaugh, D.T. Mechanisms of Gun-Tube Erosion and Wear. In Gun Propulsion Technology; Stiefel, L., Ed.; American Institute of Aeronautics and Astronautics: Washington, DC, USA, 1988; pp. 357–376. ISBN 0930403207. [Google Scholar]
- Ahmad, I. The Problem of Gun Barrel Erosion: An Overview. In Gun Propulsion Technology; Stiefel, L., Ed.; American Institute of Aeronautics and Astronautics: Washington, DC, USA, 1988; pp. 311–356. ISBN 0930403207. [Google Scholar]
- Baracuti, A.J. Wear-Reduction Additives—Role of Propellant. In Gun Propulsion Technology; Stiefel, L., Ed.; American Institute of Aeronautics and Astronautics: Washington, DC, USA, 1988; pp. 377–412. ISBN 0930403207. [Google Scholar]
- Almotairi, A.; Farhat, Z.; Warkentin, A. Thermal damage of conventional hard chromium coatings on 416 stainless steel. Eng. Fail. Anal. 2019, 105, 1118–1130. [Google Scholar] [CrossRef]
- Mills, K.C.; Su, Y.; Li, Z.; Brooks, R.F. Equations for the Calculation of the Thermo-physical Properties of Stainless Steel. ISIJ Int. 2004, 44, 1661–1668. [Google Scholar] [CrossRef]
- Zhen, W.; Jin, W. Heat Transfer Simulation of Large Caliber Gun Barrel. IOP Conf. Ser. Earth Environ. Sci. 2020, 546, 42039. [Google Scholar] [CrossRef]
- Koniorczyk, P.; Zmywaczyk, J.; Dębski, A.; Zieliński, M.; Preiskorn, M.; Sienkiewicz, J. Investigation of Thermophysical Properties of Three Barrel Steels. Metals 2020, 10, 573. [Google Scholar] [CrossRef]
- Moravčík, R.; Štefániková, M.; Čička, R.; Čaplovič, Ľ.; Kocúrová, K.; Šturm, R. Phase Transformations in High Alloy Cold Work Tool Steel. SV-JME 2012, 58, 709–715. [Google Scholar] [CrossRef]
- Balaško, T.; Burja, J.; Medved, J. Effect of steel’s thermal condition on the transformation temperatures of two hot-work tool steels with increased thermal conductivity. Mater. Technol. 2023, 57, 617–626. [Google Scholar] [CrossRef]
- Dębski, A.; Surma, Z.; Koperski, W. Material and Technological Optimization Research in Terms of Increasing the Durability of Small Arms; Military University of Technology: Warsaw, Poland, 2009. [Google Scholar]
- Woźniak, R.; Torecki, S.; Leciejewski, Z. Technology Demonstrator of a Remotely Controlled 35 mm Anti-Aircraft System; Military University of Technology: Warsaw, Poland, 2011. [Google Scholar]
- Huang, X.; Conroy, P.; Carter, R. 5.56 mm Ceramic Gun Barrel Thermal Analysis with Cycled Ammunition. In Proceedings of the 23rd International Symposium on Ballistics, Tarragona, Spain, 16–20 April 2007; pp. 16–20. [Google Scholar]
- Loiola, B.R.; Susantez, Ç.; Caldeira, A.B. Numerical modelling of heat transfer and simulation of a 5.56 mm rifle barrel. J. Phys. Conf. Ser. 2023, 2478, 112030. [Google Scholar] [CrossRef]
- Zieliński, M.; Koniorczyk, P.; Surma, Z.; Zmywaczyk, J.; Preiskorn, M. Numerical Study of Heat Transfer in a Gun Barrel Made of Selected Steels. Energies 2022, 15, 1868. [Google Scholar] [CrossRef]
- Zieliński, M.; Koniorczyk, P.; Surma, Z. Studies on Influence of Chromium Layer on Inner Surface of Steel Tube on Heat Transfer. Appl. Sci. 2023, 13, 5523. [Google Scholar] [CrossRef]
- Mishra, A.; Hameed, A.; Lawton, B. A Novel Scheme for Computing Gun Barrel Temperature History and Its Experimental Validation. J. Press. Vessel. Technol. 2010, 132, 444. [Google Scholar] [CrossRef]
- Keith Clutter, J.; Shyy, W. Computation of High-Speed Reacting Flow for Gun Propulsion Applications. Numer. Heat Transf. Part A Appl. 1997, 31, 355–374. [Google Scholar] [CrossRef]
- Wu, Y.-H. Analysis of the Temperature Field of a Gun Tube Based on Thermal-Solid Coupling. RJASET 2013, 5, 4110–4117. [Google Scholar] [CrossRef]
- Akçay, M.; Yükselen, M.A. Unsteady Thermal Studies of Gun Barrels During the Interior Unsteady Thermal Studies of Gun Barrels during the Interior Ballistic Cycle with Non-Homogenous Gun Barrel Material Thermal Characteristics. J. Therm. Sci. Technol. 2014, 34, 75–81. [Google Scholar]
- Ding, C.; Liu, N.; Zhang, X. A mesh generation method for worn gun barrel and its application in projectile-barrel interaction analysis. Finite Elem. Anal. Des. 2017, 124, 22–32. [Google Scholar] [CrossRef]
- Hill, R.; McLeod, L. Methodology for Transient Thermal Analysis of Machine Gun Barrels Subjected to Burst Firing Schedules. Available online: https://nts.com/content/uploads/2017/12/Methodology-for-Transient-Thermal-Analysis-of-Machine-Gun-Barrels-Subjected-to-Burst-Firing-Schedules.pdf (accessed on 2 November 2023).
- Hill, R.D.; Conner, J.M. Transient Heat Transfer Model of Machine Gun Barrels. Mater. Manuf. Process. 2012, 27, 840–845. [Google Scholar] [CrossRef]
- Ho, C.Y.; Powell, R.W.; Liley, P.E. Journal of Physical and Chemical Reference Data: Thermal Conductivity of the Elements: A Comprehensive Review. Available online: https://srd.nist.gov/JPCRD/jpcrdS1Vol3.pdf (accessed on 2 November 2023).
- McBride, B.J.; Gordon, S.; Reno, M.A. NASA Technical Paper 3287: Thermodynamic Data for Fifty Reference Elements. Available online: https://ntrs.nasa.gov/api/citations/20010021116/downloads/20010021116.pdf (accessed on 2 November 2023).
- Chromium Thermal Properties from Material Properties Database (MPDB) by JAHAM Software. Available online: https://www.jahm.com/demo_version.html (accessed on 2 November 2023).
- Koniorczyk, P.; Zieliński, M.; Sienkiewicz, J.; Zmywaczyk, J.; Dębski, A. Experimental Studies of Thermophysical Properties and Microstructure of X37CrMoV5-1 Hot-Work Tool Steel and Maraging 350 Steel. Materials 2023, 16, 1206. [Google Scholar] [CrossRef]
- Bejan, A.; Kraus, A.D. Heat Transfer Handbook; Wiley: Hoboken, NJ, USA, 2003; ISBN 0471390151. [Google Scholar]


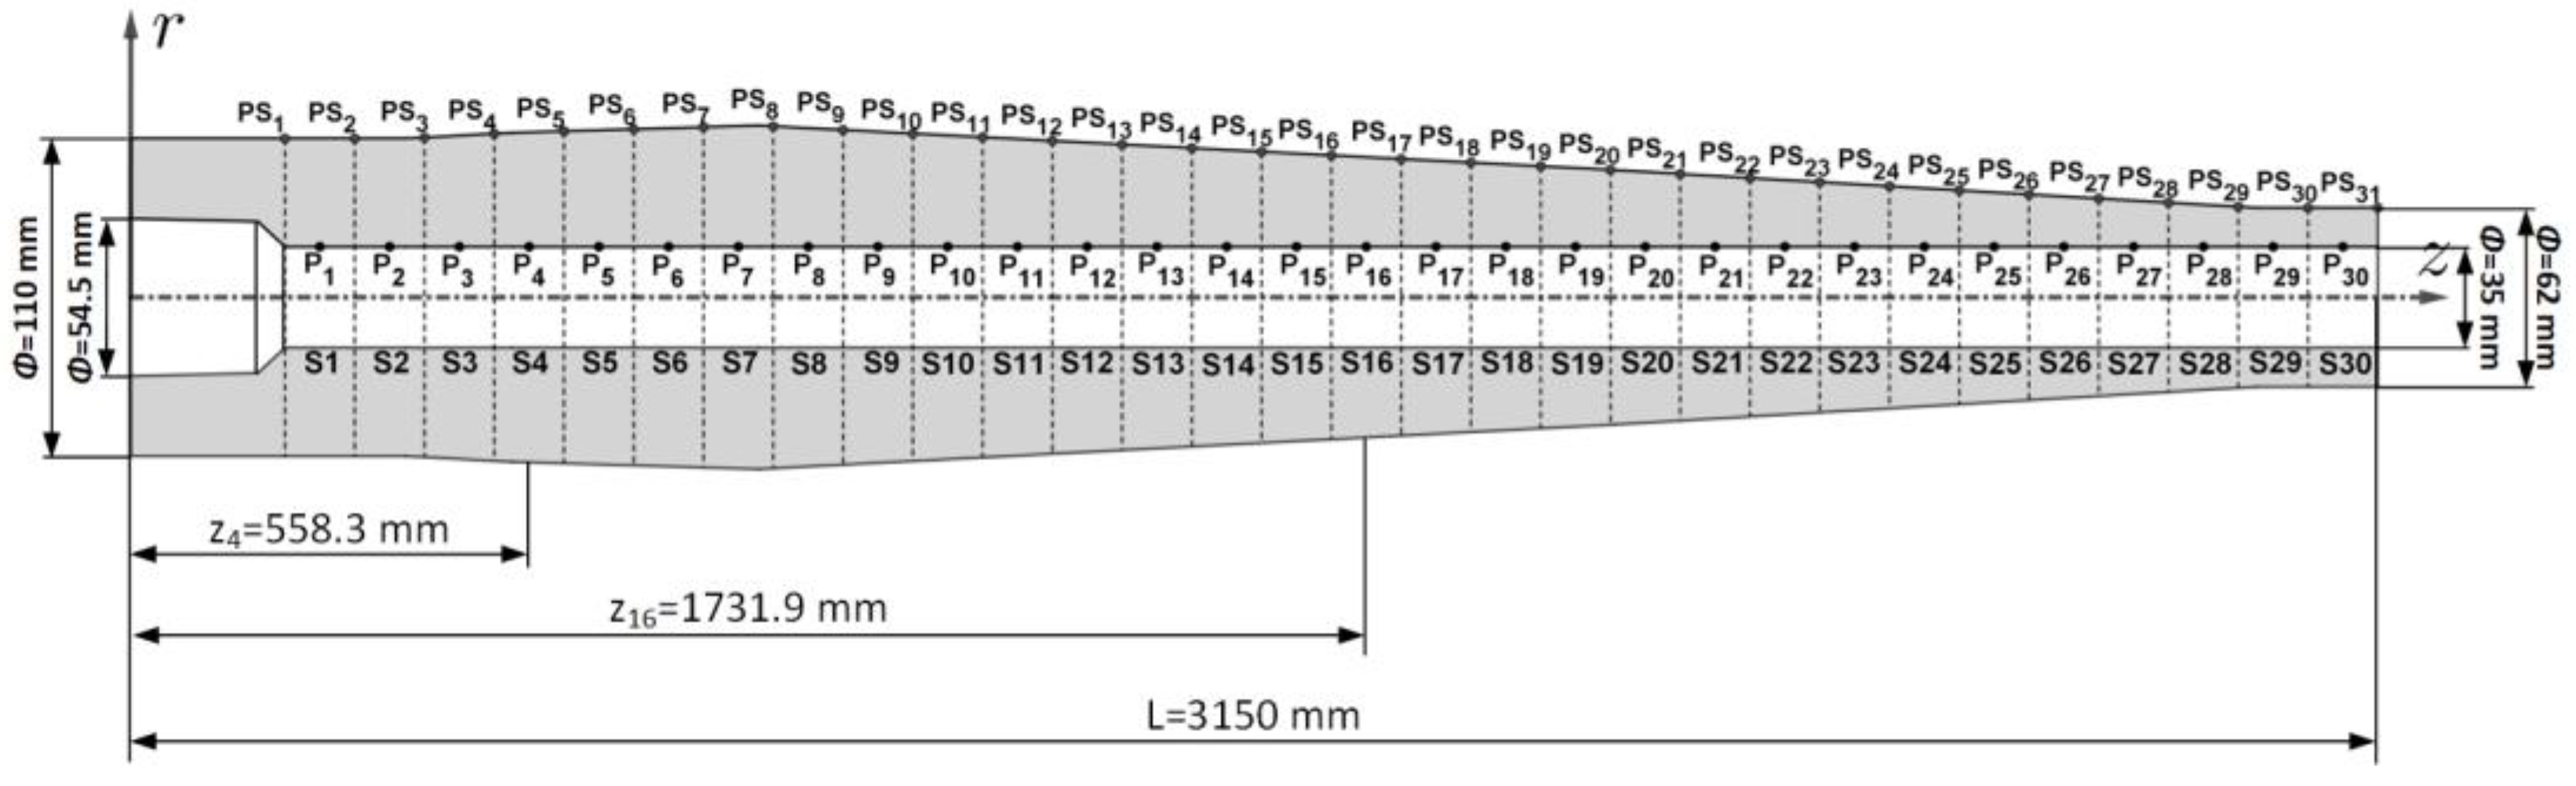
| Number of Zone i | S1 | S2 | S3 | S4 | S5 | S6 | S7 | S8 | S9 | S10 |
|---|---|---|---|---|---|---|---|---|---|---|
| 216.0 | 313.8 | 411.6 | 509.4 | 607.2 | 705.0 | 802.8 | 900.6 | 998.4 | 1096.2 | |
| 55.00 | 55.00 | 55.35 | 55.66 | 57.52 | 58.23 | 58.94 | 59.24 | 57.94 | 56.72 | |
| 264.9 | 362.7 | 460.5 | 558.3 | 656.1 | 753.9 | 851.7 | 949.5 | 1047.3 | 1145.1 | |
| Number of Zone i | S11 | S12 | S13 | S14 | S15 | S16 | S17 | S18 | S19 | S20 |
| 1194.0 | 1291.8 | 1389.6 | 1487.4 | 1585.2 | 1683.0 | 1780.8 | 1878.6 | 1976.4 | 2074.2 | |
| 55.47 | 54.21 | 52.93 | 51.70 | 50.44 | 49.18 | 47.93 | 46.67 | 45.41 | 44.16 | |
| 1242.9 | 1340.7 | 1438.5 | 1536.3 | 1634.1 | 1731.9 | 1829.7 | 1927.5 | 2025.3 | 2123.1 | |
| Number of Zone i | S21 | S22 | S23 | S24 | S25 | S26 | S27 | S28 | S29 | S30 |
| 2172.0 | 2269.8 | 2367.6 | 2465.4 | 2563.2 | 2661.0 | 2758.8 | 2856.6 | 2954.4 | 3052.2 | |
| 42.75 | 41.33 | 39.90 | 38.48 | 37.06 | 35.64 | 34.22 | 32.79 | 31.37 | 31.00 | |
| 2220.9 | 2318.7 | 2416.5 | 2514.3 | 2612.1 | 2709.9 | 2807.7 | 2905.5 | 3003.3 | 3101.1 | |
| 3150 | ||||||||||
| Steel | Composition, (wt. %) | |||||||
|---|---|---|---|---|---|---|---|---|
| Fe | C | Si | Mn | Cr | Mo | Ni | V | |
| 30HN2MFA | 96.42 | 0.29 | 0.26 | 0.36 | 0.65 | 0.24 | 2.21 | 0.23 |
| X37CrMoV5-1 | 90.71 | 0.39 | 0.84 | 0.36 | 5.52 | 1.30 | 0.40 | 0.45 |
| Zone | Steel Grade | Temperature of Shrinkage | Number of Heat Impulses for Different Chromium Layers | ||
|---|---|---|---|---|---|
| 0 μm Cr | 30 μm Cr | 200 μm Cr | |||
| S4 | 30HN2MFA | 741 °C | 42 | 39 | 33 |
| X37CrMoV5-1 | 860.9 °C | 59 | 57 | 51 | |
| S10 | 30HN2MFA | 741 °C | 37 | 33 | 27 |
| X37CrMoV5-1 | 860.9 °C | 53 | 51 | 45 | |
| S16 | 30HN2MFA | 741 °C | 36 | 32 | 23 |
| X37CrMoV5-1 | 860.9 °C | 53 | 51 | 45 | |
| S21 | 30HN2MFA | 741 °C | 36 | 33 | 26 |
| X37CrMoV5-1 | 860.9 °C | 55 | 52 | 46 | |
| S25 | 30HN2MFA | 741 °C | 38 | 34 | 26 |
| X37CrMoV5-1 | 860.9 °C | 57 | 54 | 47 | |
| S30 | 30HN2MFA | 741 °C | 39 | 35 | 27 |
| X37CrMoV5-1 | 860.9 °C | 59 | 57 | 49 | |
Disclaimer/Publisher’s Note: The statements, opinions and data contained in all publications are solely those of the individual author(s) and contributor(s) and not of MDPI and/or the editor(s). MDPI and/or the editor(s) disclaim responsibility for any injury to people or property resulting from any ideas, methods, instructions or products referred to in the content. |
© 2024 by the authors. Licensee MDPI, Basel, Switzerland. This article is an open access article distributed under the terms and conditions of the Creative Commons Attribution (CC BY) license (https://creativecommons.org/licenses/by/4.0/).
Share and Cite
Zieliński, M.; Koniorczyk, P.; Surma, Z. Influence of the Shrinkage of the Inner Layer of Steel Tubes on Permissible Thermal Load. Energies 2024, 17, 702. https://doi.org/10.3390/en17030702
Zieliński M, Koniorczyk P, Surma Z. Influence of the Shrinkage of the Inner Layer of Steel Tubes on Permissible Thermal Load. Energies. 2024; 17(3):702. https://doi.org/10.3390/en17030702
Chicago/Turabian StyleZieliński, Mateusz, Piotr Koniorczyk, and Zbigniew Surma. 2024. "Influence of the Shrinkage of the Inner Layer of Steel Tubes on Permissible Thermal Load" Energies 17, no. 3: 702. https://doi.org/10.3390/en17030702
APA StyleZieliński, M., Koniorczyk, P., & Surma, Z. (2024). Influence of the Shrinkage of the Inner Layer of Steel Tubes on Permissible Thermal Load. Energies, 17(3), 702. https://doi.org/10.3390/en17030702