Article

Coordinated Volt-Var Control of Reconfigurable Microgrids with Power-to-Hydrogen Systems

1
Renewable Energy and Electric Vehicle (REEV) Laboratory, School of Engineering, Deakin University, Geelong, VIC 3216, Australia
2
School of Electrical and Data Engineering, University of Technology Sydney, Sydney, NSW 2007, Australia
3
School of Engineering and Energy, Murdoch University, Perth, WA 6150, Australia
*
Author to whom correspondence should be addressed.
Energies 2024, 17(24), 6442; https://doi.org/10.3390/en17246442
Submission received: 4 November 2024 / Revised: 9 December 2024 / Accepted: 19 December 2024 / Published: 20 December 2024
(This article belongs to the Section A5: Hydrogen Energy)

Abstract

:
The integration of electrolyzers and fuel cells can cause voltage fluctuations within microgrids if not properly scheduled. Therefore, controlling voltage and reactive power becomes crucial to mitigate the impact of fluctuating voltage levels, ensuring system stability and preventing damage to equipment. This paper, therefore, seeks to enhance voltage and reactive power control within reconfigurable microgrids in the presence of innovative power-to-hydrogen technologies via electrolyzers and hydrogen-to-power through fuel cells. Specifically, it focuses on the simultaneous coordination of an electrolyzer, hydrogen storage, and a fuel cell alongside on-load tap changers, smart photovoltaic inverters, renewable energy sources, diesel generators, and electric vehicle aggregation within the microgrid system. Additionally, dynamic network reconfiguration is employed to enhance microgrid flexibility and improve the overall system adaptability. Given the inherent unpredictability linked to resources, the unscented transformation method is employed to account for these uncertainties in the proposed voltage and reactive power management. Finally, the model is formulated as a convex optimization problem and is solved through GUROBI version 11, which leads to having a time-efficient model with high accuracy. To assess the effectiveness of the model, it is eventually examined on a modified 33-bus microgrid in several cases. Through the results of the under-study microgrid, the developed model is a great remedy for the simultaneous operation of diverse resources in reconfigurable microgrids with a flatter voltage profile across the microgrid.

1. Introduction

Microgrids, primarily powered by abundant renewable energy sources (RESs), can serve as smart grid components to enhance the reliability of an overall network, as well as effecting market price fluctuations [1,2]. Additionally, the adoption of diverse technologies, such as electric vehicle aggregators (EVAs) and hydrogen generation through electrolyzers, followed by conversion back to electricity via fuel cells, has significantly increased due to their eco-friendly nature. However, like the number of RESs, EVAs, and conversions between hydrogen and power grows, microgrids may experience voltage fluctuations, leading to technical and economic challenges for microgrid operators and customers alike. To overcome the disturbances related to voltages, the concept of volt-var control is appealed. Voltage and volt-ampere reactive (volt-var) control means developing a strategy to simultaneously manage different equipment, including an on-load tap changer (OLTC), switchable capacitor banks (SCBs), diesel generators (DGs), smart inverters, and so on, to maintain the voltage of a network within acceptable ranges.
There are various volt-var control techniques in the literature, which are discussed as follows. One of the most well-known devices that has always been used in controlling voltage in power grids is SCB because of its affordable cost on the market [3]. OLTC is another conventional device frequently used to control the voltage of a network due to its reasonable cost and effective applicability [4]. Smart PV inverters (SPIs) are a novel technology that can serve as a great remedy to be used in volt-var control strategies because they have a fast response under different conditions and do not inject any harmonics into the grid [5]. Authors managed to use energy storage systems (ESSs) to mitigate over-/under-voltage issues in distribution grids by developing a coordinated charging/discharging scheme in [6,7]. Soft open point is another electronic-based technique used in voltage management in distribution grids [8]. Coordinating volt-var with demand response programs was investigated in [9]. It is clear that current distribution grids have been equipped with various technologies to control voltage and reactive power. Although this enhances the flexibility needed to have a secure system, coordination among them entails up-to-date tools.
Electric vehicles are cutting-edge technologies that have penetrated power system operational and planning schemes. In terms of EVAs in volt-var control, some investigations have been conducted so far. To illustrate this, Ref. [10] developed a coordination approach for electric vehicle charging stations, dispatchable generation sources, and energy storage units in distribution grids. Similarly, volt-var control was developed in distribution grids in the presence of electric vehicles, renewable resources, capacitors, and OLTC in [11]. Additionally, the reactive power provision via electric vehicle charging stations was deployed to manage the voltage stability index in distribution networks [12]. Through the mentioned papers, electric vehicles have been investigated in volt-var schemes, but there are some gaps that need to be tackled. To begin with, extensive volt-var devices were not considered. Secondly, the technology of vehicle-to-grid and grid-to-vehicle EVAs has not been studied adequately. Thirdly, network reconfiguration has not been involved. Fourthly, uncertainties have not been studied thoroughly.
Feeder reconfiguration is a cutting-edge capability of smart grids that can be used at the distribution level for different purposes. For example, researchers implemented the network reconfiguration and capacitor allocation for volt-var control of distribution grids by using a population-based algorithm in [13]. On the same track, modified gray wolf optimization was used to assess the impact of feeder reconfiguration on the volt-var control of distribution grids in [14]. From this research, it can be seen that simultaneous feeder reconfiguration and PV inverter management result in higher energy savings. Ref. [15] concentrated on volt-var control in reconfigurable droop-based islanded microgrids with the aim of power loss minimization. Additionally, power sharing among multi-microgrid systems was coordinated through feeder reconfigurations to address the fluctuations of renewable energy in [16]. Compared to the references mentioned, this paper uses convex formulation, which enables operators to reach a possible global solution, but it does not consider different volt-var control equipment such as smart PV inverters, EVAs, and so on. Although there are a few feeder reconfigurations in volt-var control schemes, some factors have not been sufficiently addressed, such as the coordination of EVAs aggregations, suitable uncertainty modeling, and so on. Accordingly, developing a mathematical framework for reaching extensive volt-var control in reconfigurable microgrids while considering the coordination of diverse resources entails further assessments.
Power-to-hydrogen (P2H) and hydrogen-to-power (H2P) technologies are typically implemented using electrolyzers and fuel cells [17,18]. Consequently, some researchers have focused on energy management within microgrids that incorporate these technologies to reach the net-zero target soon. For example, researchers proposed a method for determining the optimal size of concentrated solar power systems intended for hydrogen refueling stations in [19]. The resilience of microgrids utilizing the P2H concept was examined for their operation in islanded mode in [20]. A stochastic energy management strategy, utilizing the particle swarm optimization algorithm, was also explored for operating hydrogen-based microgrids in both islanded and grid-connected modes in [21]. It was shown that H2P and P2H will play a main role in future power systems. However, their effects on volt-var management have not been investigated adequately.
Considering the fact that volt-var control includes some uncertain parameters such as load, renewable resources, and so on, assessing the impact of such uncertain parameters on the model output should be investigated. So far, several investigations have been conducted in the literature. To begin with, authors used a stochastic framework, namely Monte Carlo simulation, to capture the uncertainties related to the arrival and departure times and charging demand of EVAs in [22]. Even though Monte Carlo simulation provides highly accurate results, it is assigned to the time-consuming techniques because of its taking extensive scenarios into account. Volt-var control operates in real time, which significantly limits the feasibility of using Monte Carlo simulation. To overcome this issue, authors modeled the influence of uncertainties on the volt-var control using a point estimation technique, which is not computationally expensive, in [23]. It is worthwhile that the point estimation method is computationally friendly, but it assumes the input uncertain parameters are independent from each other and that there is not any correlation among them [24]. In order to tackle this drawback, the unscented transformation (UT) method, which can model the correlation among uncertain input parameters, has been introduced [25]. In more detail, as the UT method offers several benefits, including ease of programming, simplicity, a strong capacity for capturing uncertainties, low computational demands, and the effective simulation of uncertainties in correlated scenarios [26,27]; the UT method is utilized to model the uncertainties related to the loads, RESs, and EVAs in this investigation.
To the best knowledge of the authors, developing a volt-var control that simultaneously addresses the following aspects is still necessary in the literature.
  • Developing comprehensive volt-var control by effectively managing various equipment, such as OLTC, SCBs, RESs, smart PV inverters (SPVIs), etc.;
  • Incorporating the concepts of P2H and H2P into the volt-var control via an electrolyzer, hydrogen storage, and a fuel cell;
  • Incorporating the concept of grid-to-vehicle and vehicle-to-grid EVA in the volt-var control of reconfigurable microgrids;
  • Implementing the dynamic feeder reconfiguration in the presence of coordinating other equipment to increase the flexibility of the microgrids;
  • Thoroughly considering the unpredictability and intermittency regarding loads, RESs, and EVAs via the UT method in order to evaluate the suggested volt-var control in a realistic manner;
  • Developing volt-var control that can perform convex formulation, which results in finding the possible global solution in a finite time.
The rest of the paper is organized as follows. Section 2 discusses the problem formulation. The UT method is described in Section 3 to model uncertainties. The results are provided in Section 4, followed by a conclusion in Section 5.

2. Problem Formulation

A microgrid (MG) is a localized energy system that integrates various renewable energy sources, energy storage units, and conventional generators. It can be configured to adapt to changing conditions through the incorporation of remote switches. Key components of the considered microgrid include the following cutting-edge technologies.
  • SPVIs: Convert the direct current output from solar panels into alternating current and provide or absorb reactive power.
  • OLTCs: Regulate voltage levels by adjusting the tap positions on transformers, which are generally installed after the slack bus.
  • Electrolyzers: Generate hydrogen by converting electrical power into hydrogen through water electrolysis.
  • Fuel cells: Convert stored hydrogen back into electricity.
  • Hydrogen Storage: A tank located between the electrolyzer and the fuel cell that enhances flexibility by storing hydrogen generated from surplus renewable energy for use by the fuel cell.
  • EVAs: Aggregations of EVs that are used as mobile energy storage systems.
  • DGs: Diesel generators that are typically deployed to meet loads when renewable energy sources do not provide sufficient generation.
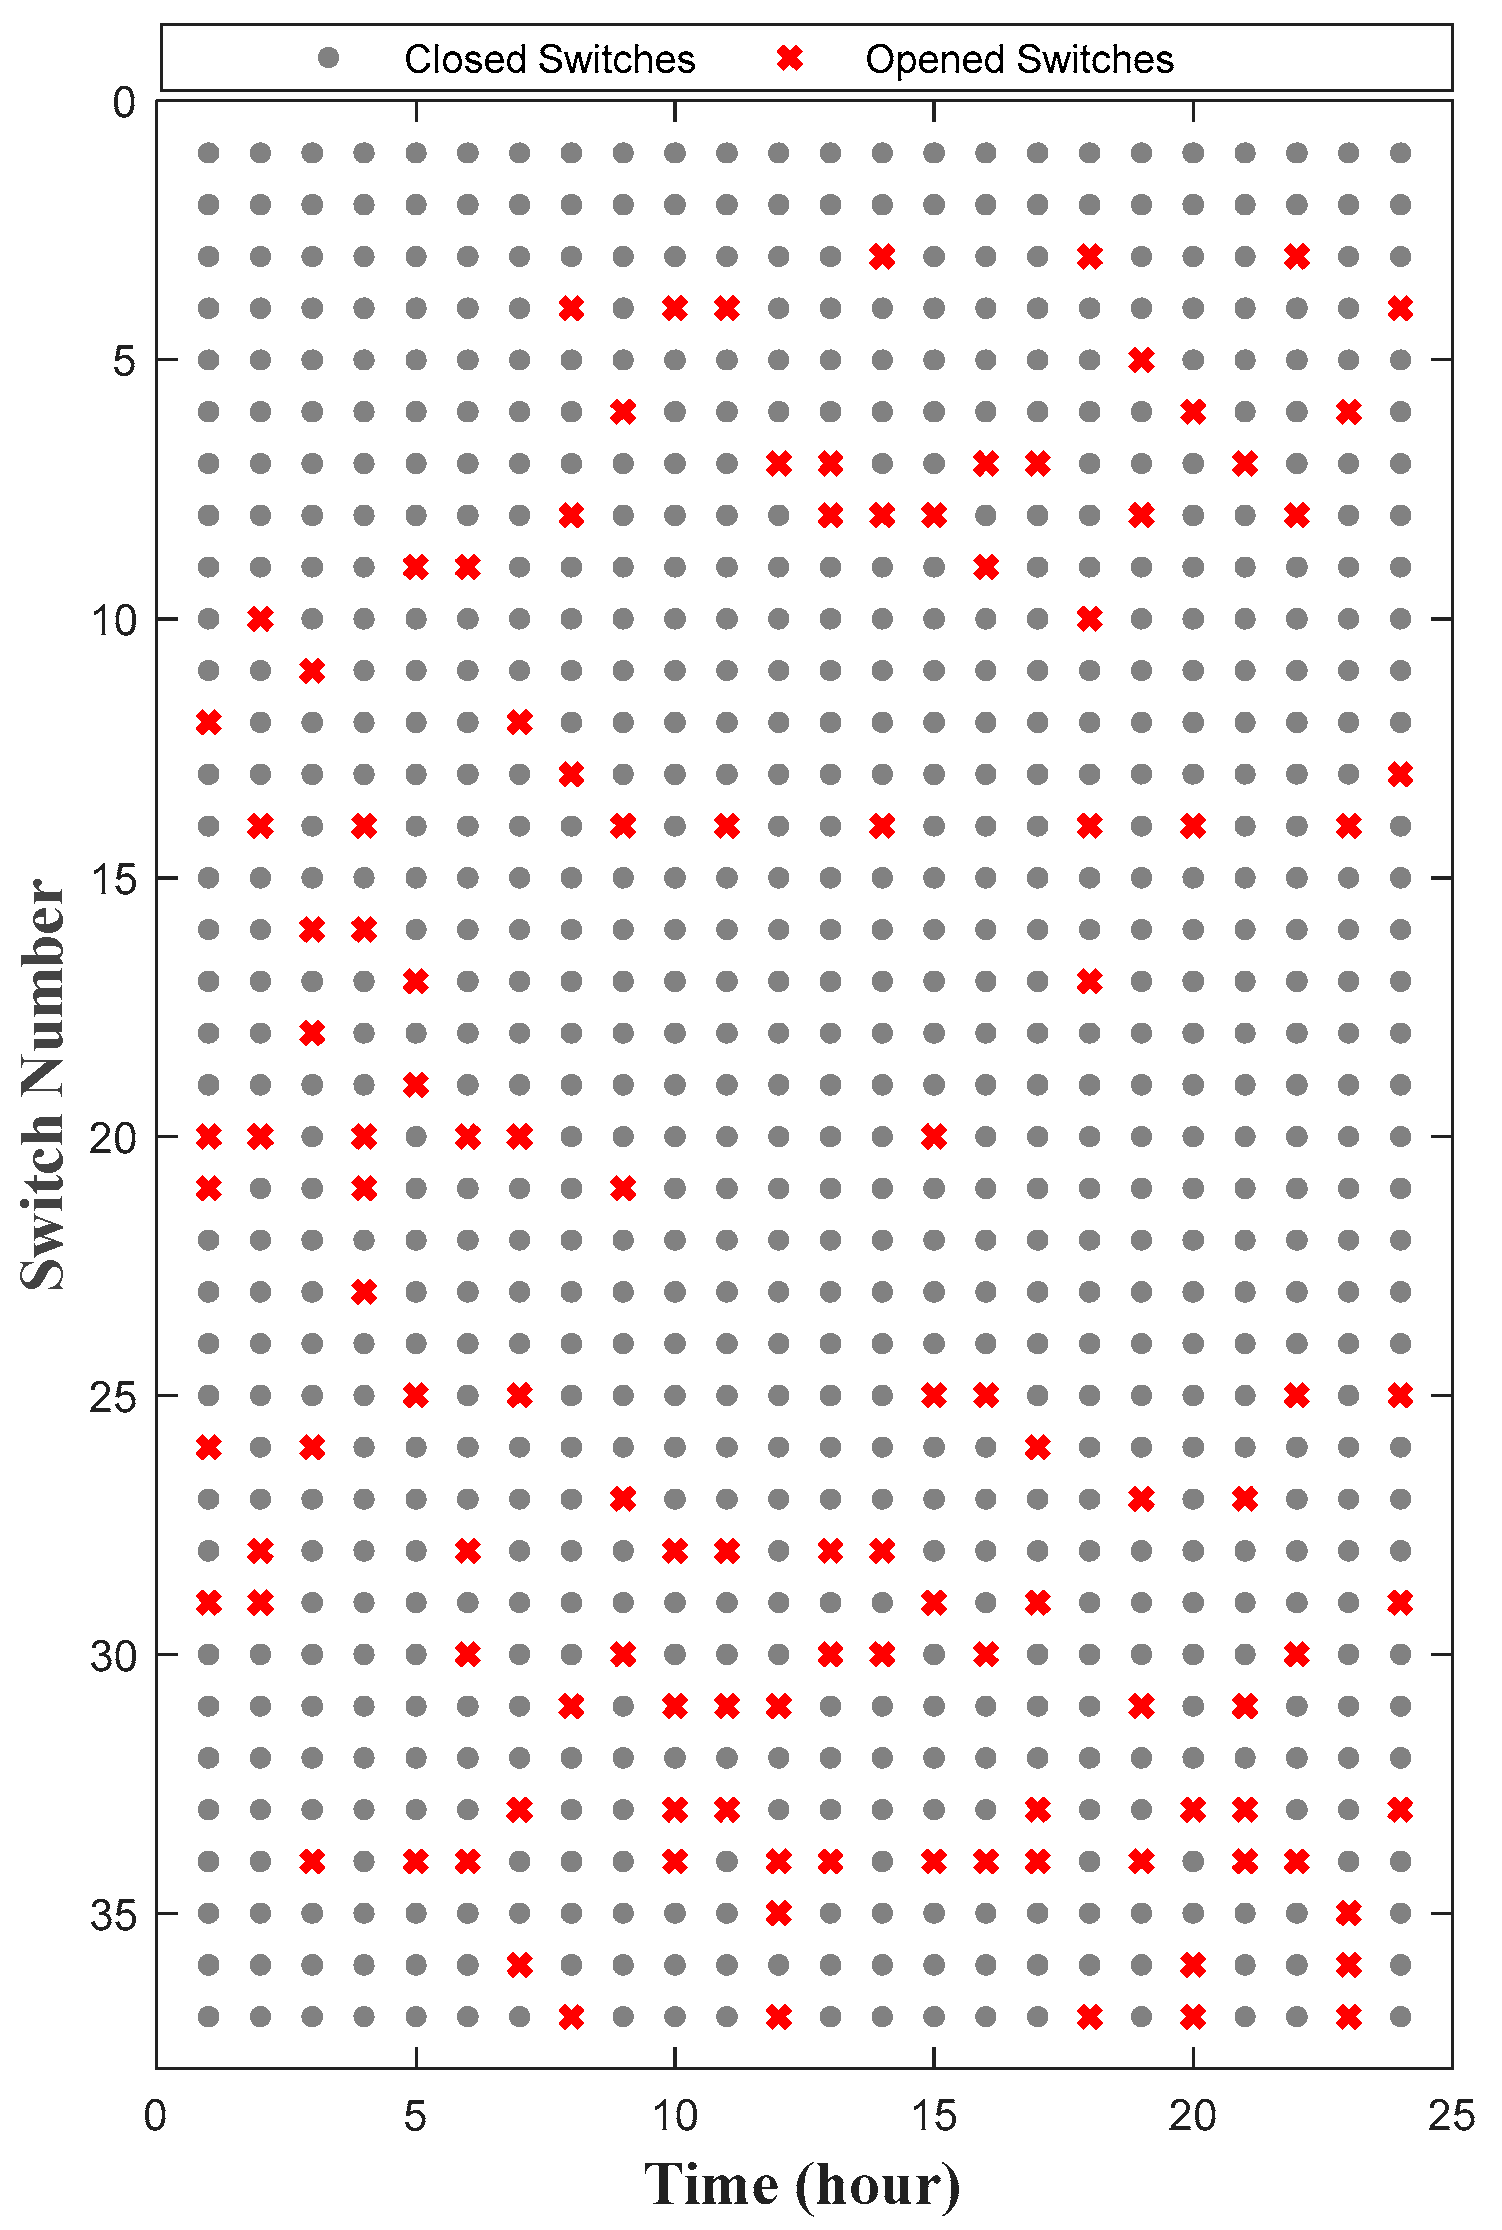
  • Remote Switches: These switches enable microgrid operators to change the configuration of the microgrid in order to enhance its techno-economic efficiency.
This investigation aims at the cost-efficient operation of grid-connected microgrids by minimizing expenses related to power trading in energy markets, energy production, and equipment operations. Furthermore, electrolyzers and fuel cells are effectively integrated into the volt-var control model, allowing for an assessment of their impact on the microgrid’s voltage stability. It also applies network reconfiguration to optimize power flow and enhance overall efficiency. Moreover, the uncertainties in the model are also managed using the UT model because of its simplification and efficiency.
The following subsections define the proposed objective function, which is followed by various constraints related to microgrids’ equipment, such as SPVIs, OLTC, an electrolyzer, a fuel cell, etc.

2.1. Objective Function

The objective function (OF) of the suggested volt-var control is mathematically defined as follows. In this OF, there are six terms [9]. The first one is related to the cost of purchasing energy from the wholesale market. The cost of power generation via DGs is shown in the second term. The cost of switching OLTC and SCB is referred to in terms three and four, respectively. The costs of charging and discharging of EVA and a hydrogen system are presented in the fifth and sixth terms, respectively.
O F = t Ω t i m e λ S S t P S S t t 1 + d Ω d g t Ω t i m e λ D G d , t P D G d , t t 2 + o Ω o l t c t Ω t i m e λ o l t c o T a p o l t c o , t T a p o l t c o , t 1 3 + c Ω c b t Ω t i m e λ C B c ψ C B c , t ψ C B c , t 1 4 + e Ω e v a t Ω t i m e λ S S t P c h , e v a e , t P d i s , e v a e , t 5 t + h Ω h g n t Ω t i m e λ S S t P e l s r h , t P F C h , t t 6

2.2. List of Constraints

Constraints are a mandatory part of optimization problems for establishing reliable models. With regard to the volt-var control, predominant constraints, including SPVIs, SCBs, OLTCs, EVAs, and H2P/P2H conversions, are elaborated in the Section 2.2.1, Section 2.2.2, Section 2.2.3, Section 2.2.4, Section 2.2.5, Section 2.2.6, Section 2.2.7 and Section 2.2.8.

2.2.1. Smart PV Inverters

SPVI is an emerging technology that has gained attention from researchers due to its ability to mitigate voltage fluctuations by injecting or absorbing reactive power into the grid [28]. This concept of the smart inverter can be modeled into the volt-var control using the following constraints.
Q P V p , t S P V p 2 P P V p , t 2 , t Ω t i m e , p Ω P V

2.2.2. Electric Vehicles

To achieve the net-zero target in the near future, EVAs have been implemented. These environmentally friendly solutions can undoubtedly replace fuel-based transportation systems. Consequently, there will be an extensive integration of EVs in power grids. However, if operated in an uncoordinated manner, the network is likely to experience voltage disturbances. Therefore, a set of constraints must be satisfied in the vol-var control problem. Constraint (4) is related to the energy of EVA. The energy of EVA must remain within its maximum and minimum capacities as guaranteed by (5). The charging and discharging of EVA are regulated by Constraints (6) and (7), respectively. Additionally, Constraint (8) ensures that the energy at the start and end of a 24-h period remains equal.
E e v a e , t = E e v a e , t 1 + η c h P c h , e v a e , t t 1 η d i s P d i s , e v a e , t t , t Ω t i m e   a n d   t > 1 , e Ω e v a
E e v a e , m i n E e v a e , t E e v a e , m a x , t Ω t i m e , e Ω e v a
P c h , e v a e , m i n P c h , e v a e , t P c h , e v a e , m a x , t Ω t i m e , e Ω e v a
P d i s , e v a e , m i n P d i s , e v a e , t P d i s , e v a e , m a x , t Ω t i m e , e Ω e v a
E e v a e , i n i t i a l = E e v a e , f i n a l , e . g . , i n i t i a l = 0 , f i n a l = 24 , e Ω e v a

2.2.3. Switchable Capacitor Banks

SCBs are an essential component of volt-var control schemes due to their cost efficiency and ability to effectively compensate for the reactive power in the network [29]. To schedule the on/off status of SCBs, the following constraints are considered.
Q C B c , t = ψ C B c , t Q r a t e c , t Ω t i m e , c Ω c b
0 ψ C B c , t ψ C B c , M a x , t Ω t i m e , c Ω c b

2.2.4. On-Load Tap Changer

OLTC is typically installed in the upstream network, and its main function is to regulate the network’s voltage level from the slack bus perspective [30]. Consequently, the OLTC tap position must be constrained within allowable limits, as defined by the following constraint.
T o l t c o , m i n T o l t c o , t T o l t c o , m a x , t Ω t i m e , o Ω o l t c

2.2.5. Diesel Generator

DGs typically consume fuel to generate power. These dispatchable units can be employed for various purposes, such as supporting specific loads, reducing operational costs, and so on. Given that DGs have limited generation capacity, their output is constrained between maximum and minimum values, as specified by Constraint (12). Additionally, the output of DGs cannot fluctuate rapidly over different intervals; therefore, their ramp-rate limitation is enforced through Constraint (13).
P D G d , m i n P D G d , t P D G d , m a x , t Ω t i m e , d Ω d g
R D G d , D o w n P D G d , t P D G d , t 1 R D G d , U p p e r , t Ω t i m e , d Ω d g

2.2.6. Hydrogen-to-Power Conversion Technology

The generation of green hydrogen depends on electrolyzers that convert electricity into hydrogen, a process commonly referred to as P2H. This hydrogen can subsequently be converted back into electricity through fuel cells, a process known as H2P. It is notable that hydrogen storage plays a crucial role in this cycle, enabling surplus energy generated from renewable sources to be stored as hydrogen and later utilized during periods of higher load demand, elevated market prices, or other needs [31,32,33]. The mathematical formulation of the P2H and H2P concepts is described as follows. Initially, the state of hydrogen in the h t h hydrogen storage unit for t = 1 and t > 1 is represented by Constraints (14) and (15), respectively. The electricity consumed by the electrolyzer to produce hydrogen is determined by Constraint (16). Similarly, the power generated by the fuel cell is calculated using Constraint (17). Equations (18) and (19) define the operational limits for the fuel cell and electrolyzer, respectively. Constraint (20) guarantees that the hydrogen state remains within its allowable range. Lastly, Equation (21) ensures that the amount of stored hydrogen at the end of the cycle (e.g., the 24th hour) is equal to the amount stored at the beginning of the cycle.
S h g n h , 1 = S h g n h , t i n i t i a l + H e l s r h , 1 t H F C h , 1 t , h Ω h g n
S h g n h , t = S h g n h , t 1 + H e l s r h , t t H F C h , t H F C h , t t , t > 1 , t Ω t i m e , h Ω h g n
P e l s r h , t = Ψ e i h × H e l s r h , t η e l s r , t Ω t i m e , h Ω h g n
H F C h , t = P F C h , t η F C × Ψ e i h , t Ω t i m e , h Ω h g n
P F C h , m i n P F C h , t P F C h , m a x , t Ω t i m e , h Ω h g n
P e l s r h , m i n P e l s r h , t P e l s r h , m a x , t Ω t i m e , h Ω h g n
S h g n h , m i n S h g n h , t S h g n h , m a x , t Ω t i m e , h Ω h g n
S h g n h , t i n i t i a l = S h g n h , t f i n a l , e . g . , t i n i t i a l = 0 , t f i n a l = 24 , h Ω h g n

2.2.7. Power Flow

Network-constrained volt-var control is central to volt-var optimization, and it is modeled through the following constraints [8,34,35], with reconfiguration discussed in [36,37]. Constraints (22) and (23) balance the real and reactive power in the network. To calculate the voltage of each bus, Constraints (24) and (25) are utilized [34,37,38]. The power flow of the opened switches must be zero, as modeled in Equations (26) and (27). The active and reactive power demands and generation at each bus are modeled by Constraints (28) and (29), respectively. Maintaining a network voltage within acceptable ranges is enforced by (30). Constraint (31) ensures that branch capacities do not exceed their allowable limits.
P n e t n , t = m Ω p a r n P f l o w m n , t k Ω c h i l n P f l o w n k , t , t Ω t i m e , n Ω b u s
Q n e t n , t = m Ω p a r n Q f l o w m n , t k Ω c h i l n Q f l o w n k , t , t Ω t i m e , n Ω b u s
V b m , t V b n , t 1 α m n , t M b i g + R L m n , t P f l o w m n , t + X L m n , t Q f l o w m n , t / V s 0 , t Ω t i m e , n , m Ω b u s
V b m , t V b n , t α m n , t 1 M b i g + R L m n , t P f l o w m n , t + X L m n , t Q f l o w m n , t / V s 0 , t Ω t i m e , n , m Ω b u s
M b i g α m n , t P f l o w m n , t M b i g α m n , t , t Ω t i m e , n , m Ω b u s
M b i g α m n , t Q f l o w m n , t M b i g α m n , t , t Ω t i m e , n , m Ω b u s
P n e t n , t = P L n , t P D G d , t P P V p , t + P c h , e v a e , t P d i s , e v a e , t + P e l s r h , t P F C h , t , t Ω t i m e , n Ω b u s , d Ω d g , p Ω P V , e Ω e v a , h Ω h g n
Q n e t n , t = Q L n , t Q D G d , t Q P V p , t Q C B c , t , t Ω t i m e , n Ω b u s , d Ω d g , p Ω P V , c Ω c b
V b n , m i n V b n , t V b n , m a x , t Ω t i m e , n Ω b u s
P f l o w m n , t 2 + Q f l o w m n , t 2 S f l o w m n , M a x 2 , t Ω t i m e , n , m Ω b u s

2.2.8. Radiality of Network

The network must maintain a radial configuration during optimization, which means the network does not have any loops. This can be achieved by spanning tree conditions [39,40]. Equation (32) ensures that the number of closed switches equals the number of buses minus one. Equation (33) specifies that a line is included in the spanning tree if bus m serves as the parent of bus n , or if bus n serves as the parent of bus m . Equation (34) ensures that each bus, apart from the slack bus, is assigned exactly one parent. Equation (35) signifies that the slack bus does not have any parents.
m n Ω b r a n c h α m n = Ω b u s 1 , α m n { 0,1 }
φ m , n + φ n , m = α m n , n , m Ω b u s , m n Ω b r a n c h
m N ( n ) φ m , n = 1 , n , m Ω b u s
φ 1 , n = 0 , n Ω b u s

3. Unscented Transformation

Generally, three main measures are used to evaluate the impact of uncertainties on models: (1) Monte Carlo simulation [12], (2) analytic approaches, and (3) approximation methods [26,27]. The primary drawback of the first method is the substantial number of trials required for convergence. The second approach, while fast and accurate, depends on precise mathematical assumptions to simplify problems. To address the limitations of both, the third approach that is more advantageous has been, therefore, introduced. The most well-known approximation approach is the UT method, which has proven to be an effective tool for estimating uncertainties in nonlinear correlated transformations [26,27]. The UT method offers several benefits, including ease of programming, simplicity, a strong capacity for capturing uncertainties, low computational demands, and the effective simulation of uncertainties in correlated scenarios [26,27]. The UT method can be implemented on standard computing platforms with minimal hardware requirements, running efficiently on personal computers or servers using languages like Python 3.12 or MATLAB 2023b. It is effective in terms of running time and memory usage. Its main advantage is evident when handling large, correlated datasets, with which other methods, such as Monte Carlo simulations, would incur much higher computational costs [41,42].
The unscented transform (UT) method has been applied in various power system planning and operation schemes. For instance, uncertainties in system models can significantly impact the bidding strategies of virtual power plants. To address this, researchers have developed a strategy leveraging the UT method to effectively manage uncertainty in renewable energy generation in [43]. Researchers applied the UT method to evaluate the reliability of transmission towers, addressing the challenges arising from the correlation between wind and ice loads. The UT method demonstrates high accuracy, with less than 6% error compared to the Monte Carlo method, while significantly improving calculation efficiency, especially for towers with lower reliability [44]. While energy hubs can engage in various markets like reactive power, energy, and reserve markets, uncertainties in the model can complicate the bidding process. To address this, the UT method was used to handle uncertainties in energy prices, renewable generation, load, and mobile storage. The results demonstrated notable improvements in the economic and flexibility performance of energy hubs, along with enhanced network efficiency, including reductions in energy loss and other operational metrics [45]. A study introduced an innovative application of the UT-based probabilistic power flow for unbalanced three-phase islanded microgrids, effectively modeling uncertainties in active and reactive power loads, as well as wind generation [46].
To illustrate this approach, consider a general probabilistic problem expressed as Y = f i t ( X ) , where Y denotes the output, f i t provides the value of the objective function, and X represents the uncertain input parameters. Let Ω u p be the set of these uncertain parameters, and let X be a vector of length Ω u p , characterized by a mean value ( μ x ) and a covariance matrix, C x x . In this matrix, the diagonal components represent the variance of the uncertain parameters, while the off-diagonal components indicate the covariances between them. The UT method simulates uncertainties for Ω u p parameters with only 2 Ω u p + 1 evaluations, significantly reducing computational complexity. This method consists of the following steps:
(1)
Based on the input uncertain parameters, 2 Ω u p + 1 sample points are generated using the following expression:
S p l = μ x + Ω u p 1 W 0 C x x l , l = 1,2 , , Ω u p
S p l + Ω u p = μ x Ω u p 1 W 0 C x x l , l = 1,2 , , Ω u p
S p 2 Ω u p + 1 = μ x
In the preceding expressions, the term B l represents the l-th row or column of matrix B.
(2)
For every generated sample point, the corresponding weighting factor is determined using the following equations:
W l = 1 W 0 2 Ω u p , l = 1,2 , , Ω u p
W l + Ω u p = 1 W 0 2 Ω u p , l = 1,2 , , Ω u p
W 2 Ω u p + 1 = W 0
(3)
The proposed problem is solved for the 2 Ω u p + 1 samples generated above to compute the fitness function for each sample point, as follows.
Y l = f i t S p l , l = 1,2 , , 2 Ω u p + 1
(4)
The mean, μ y , and the covariance, C y y , of the output variable Y are determined using the following formulas:
μ y = l = 1 2 Ω u p + 1 W l Y l
C y y = l = 1 2 Ω u p + 1 W l Y l μ y Y l μ y T

4. Simulation Results

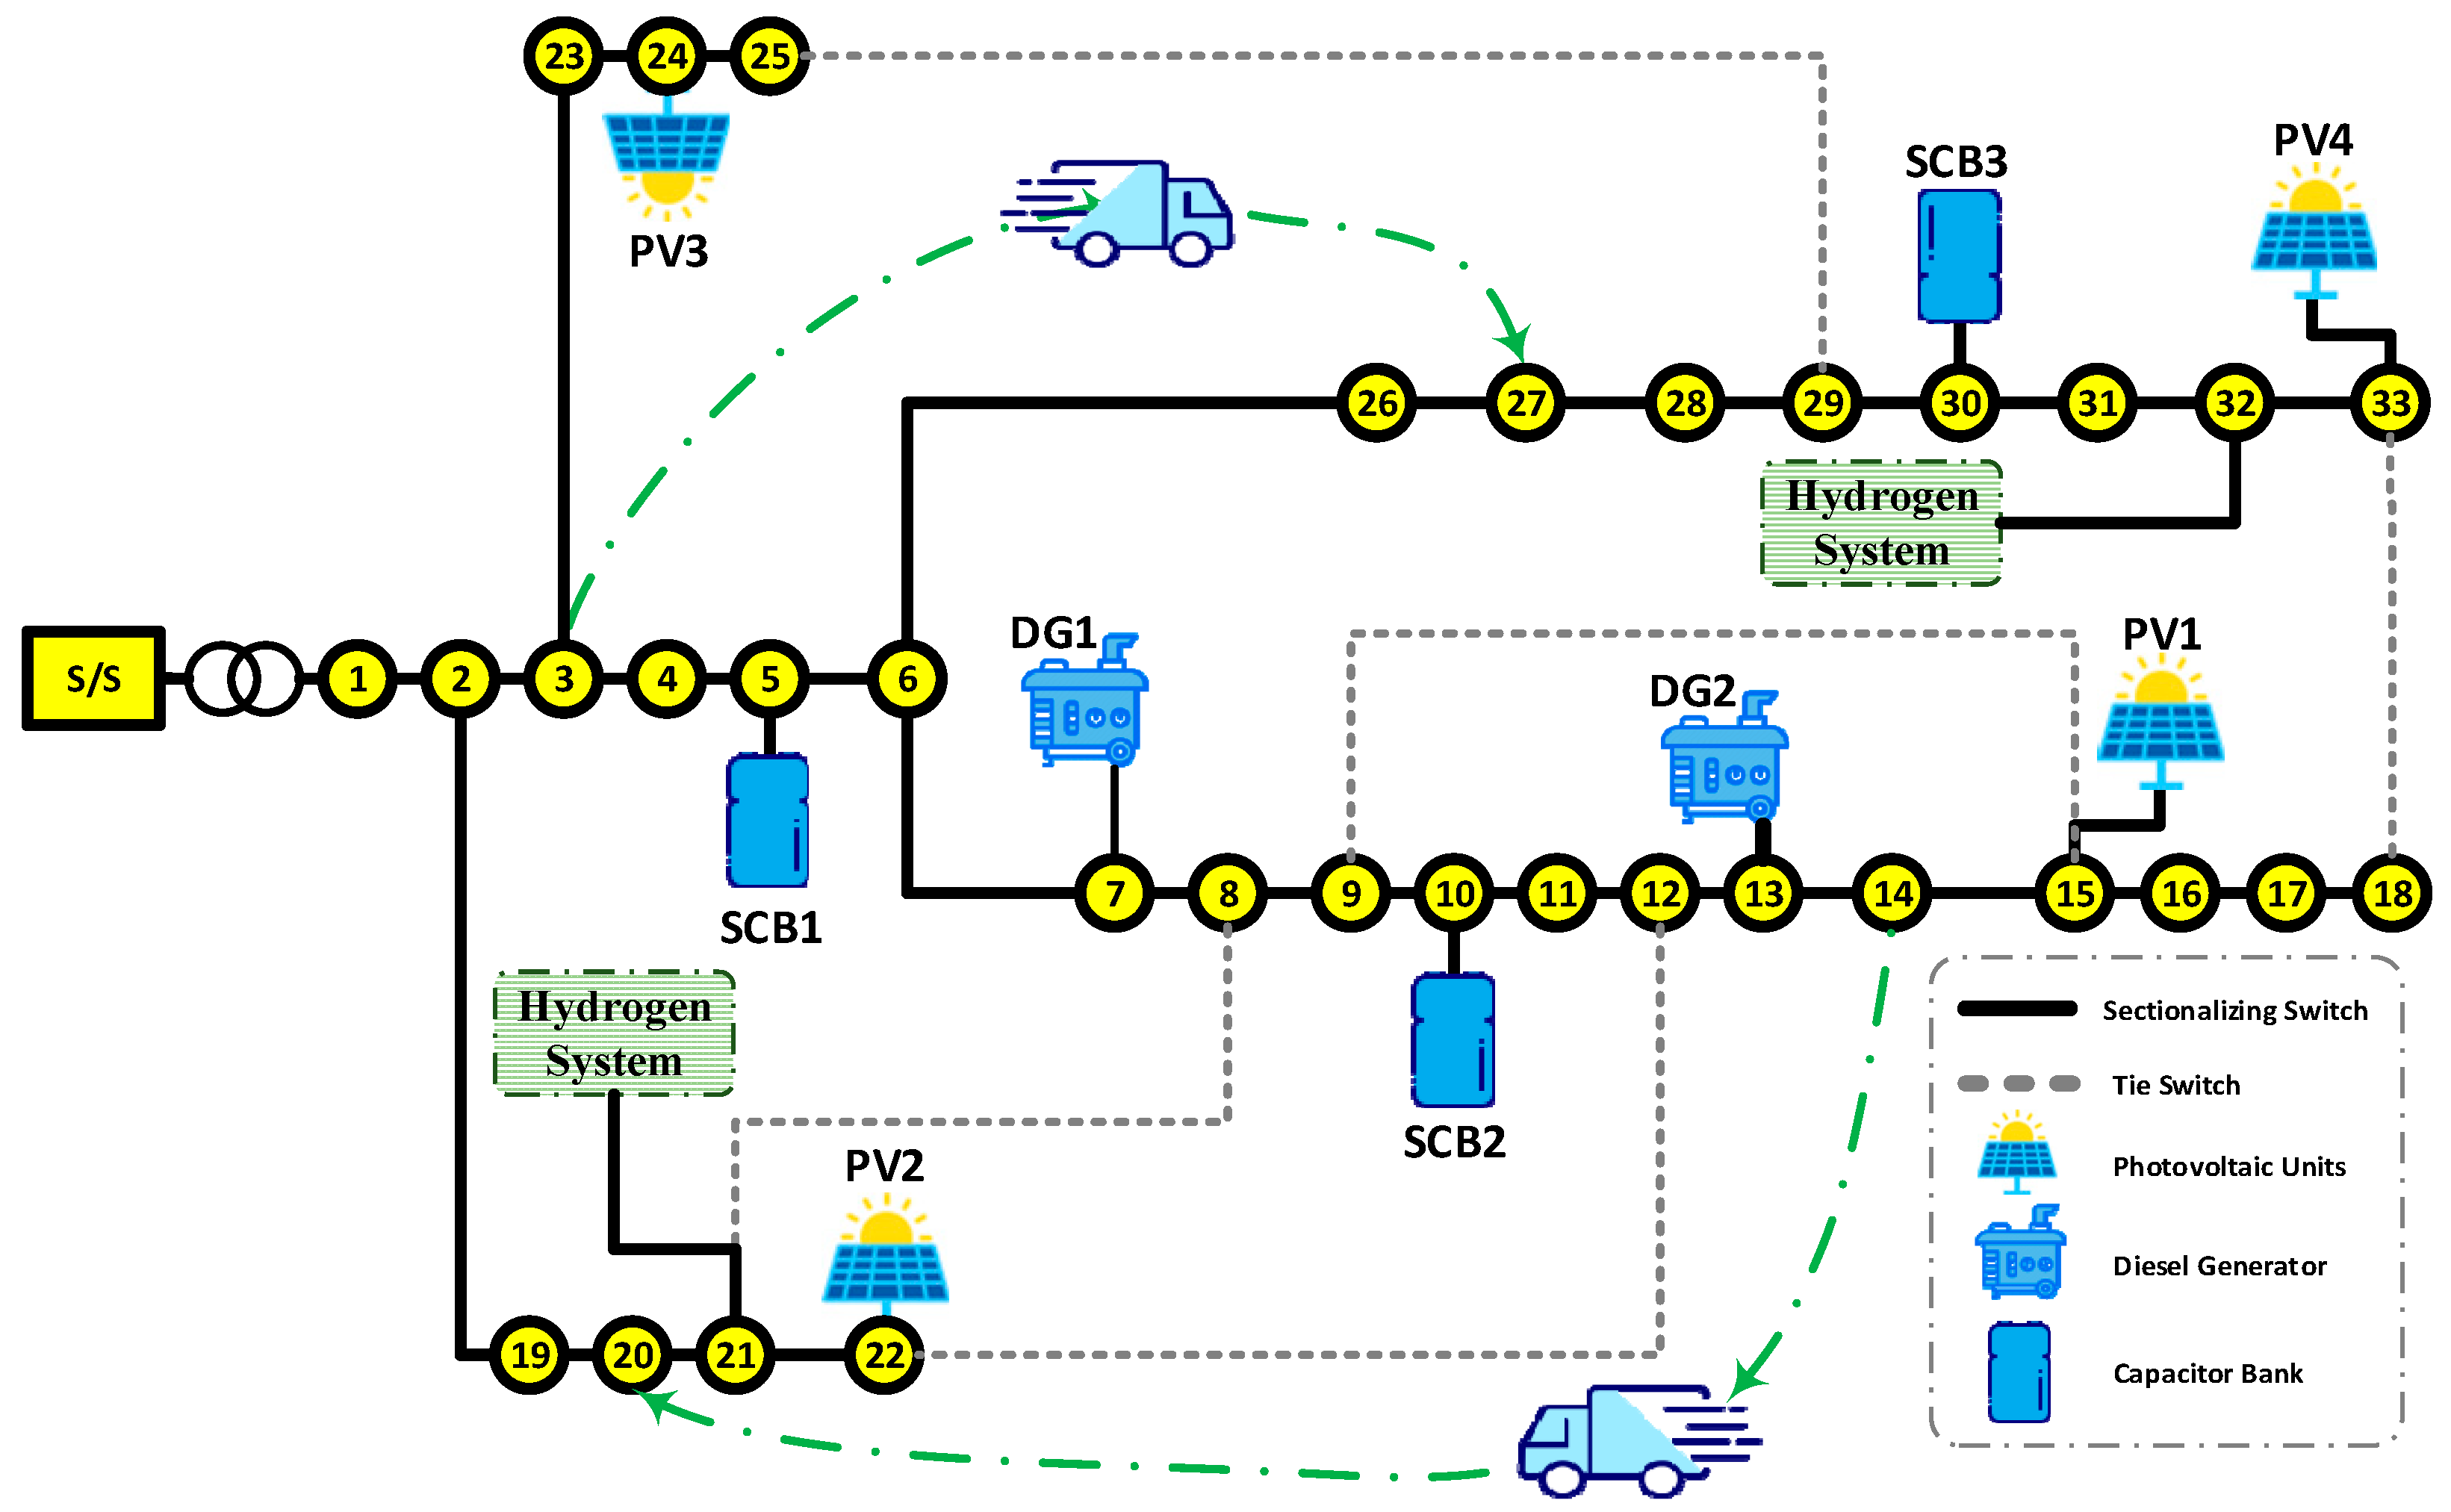
4.1. System Description

The performance of the suggested volt-var control is analyzed on a reconfigurable 33-bus microgrid [47], as illustrated in Figure 1. This microgrid was equipped with various devices, as follows. To begin with, an OLTC was immediately installed after the upstream network with ten tap positions, e.g., five step-up and five step-down bands. Four PV resources were allocated at buses 15, 22, 24, and 33 via 500 kVA inverters, respectively; their forecasted active powers are shown in Figure 2. Three switchable capacitor banks, which possess three steps of 500 kVAr, were dedicated at buses 5, 10, and 30, respectively. Diesel generators, another generation source, were placed at buses 7 and 13 with a capacity of 200 kW, respectively. There are also two EVAs with their specifications in Table 1 and trip paths in Figure 1 and Table 2. The forecasted values of active and reactive demands are demonstrated in Figure 3 and Figure 4, respectively. Two hydrogen systems, each equipped with an electrolyzer, hydrogen storage, and a fuel cell, are located at buses 21 and 32. The electrolyzers and fuel cells both have a capacity of 200 kW. Additionally, each hydrogen storage unit has a maximum capacity of holding 200 kg of hydrogen. The forecasted market price is illustrated in Figure 5.
The framework is evaluated under the following cases:
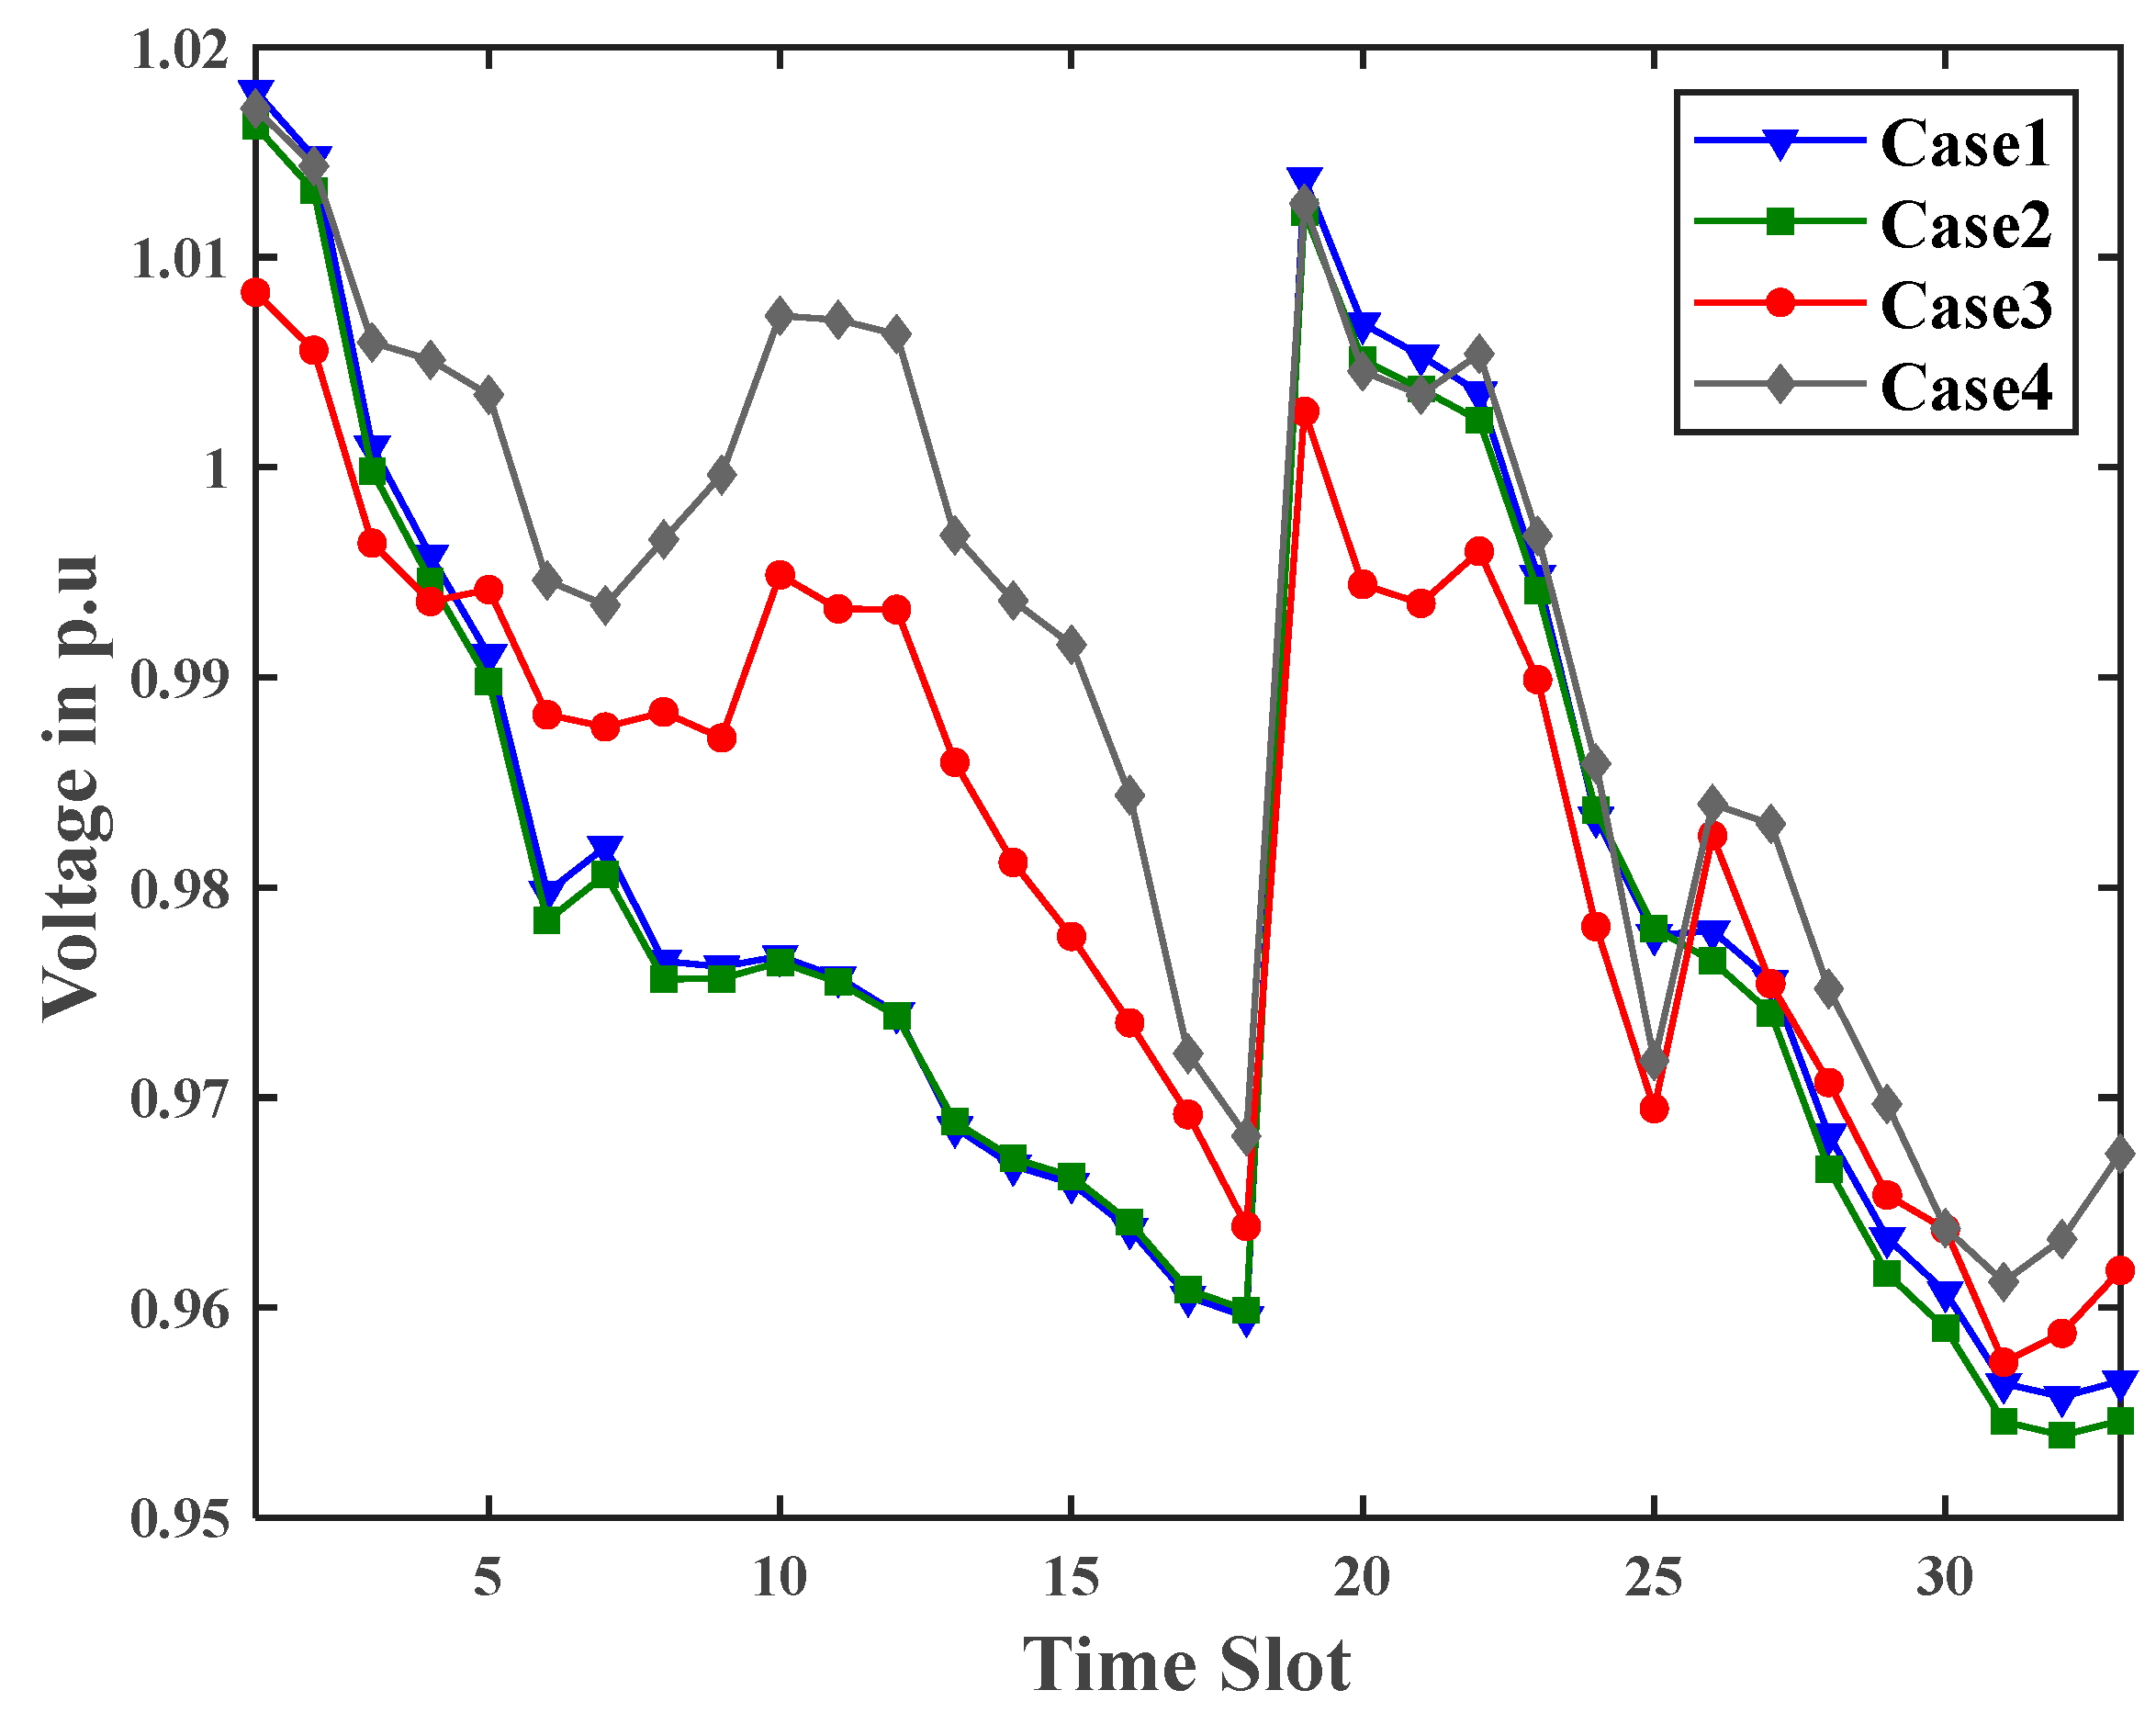
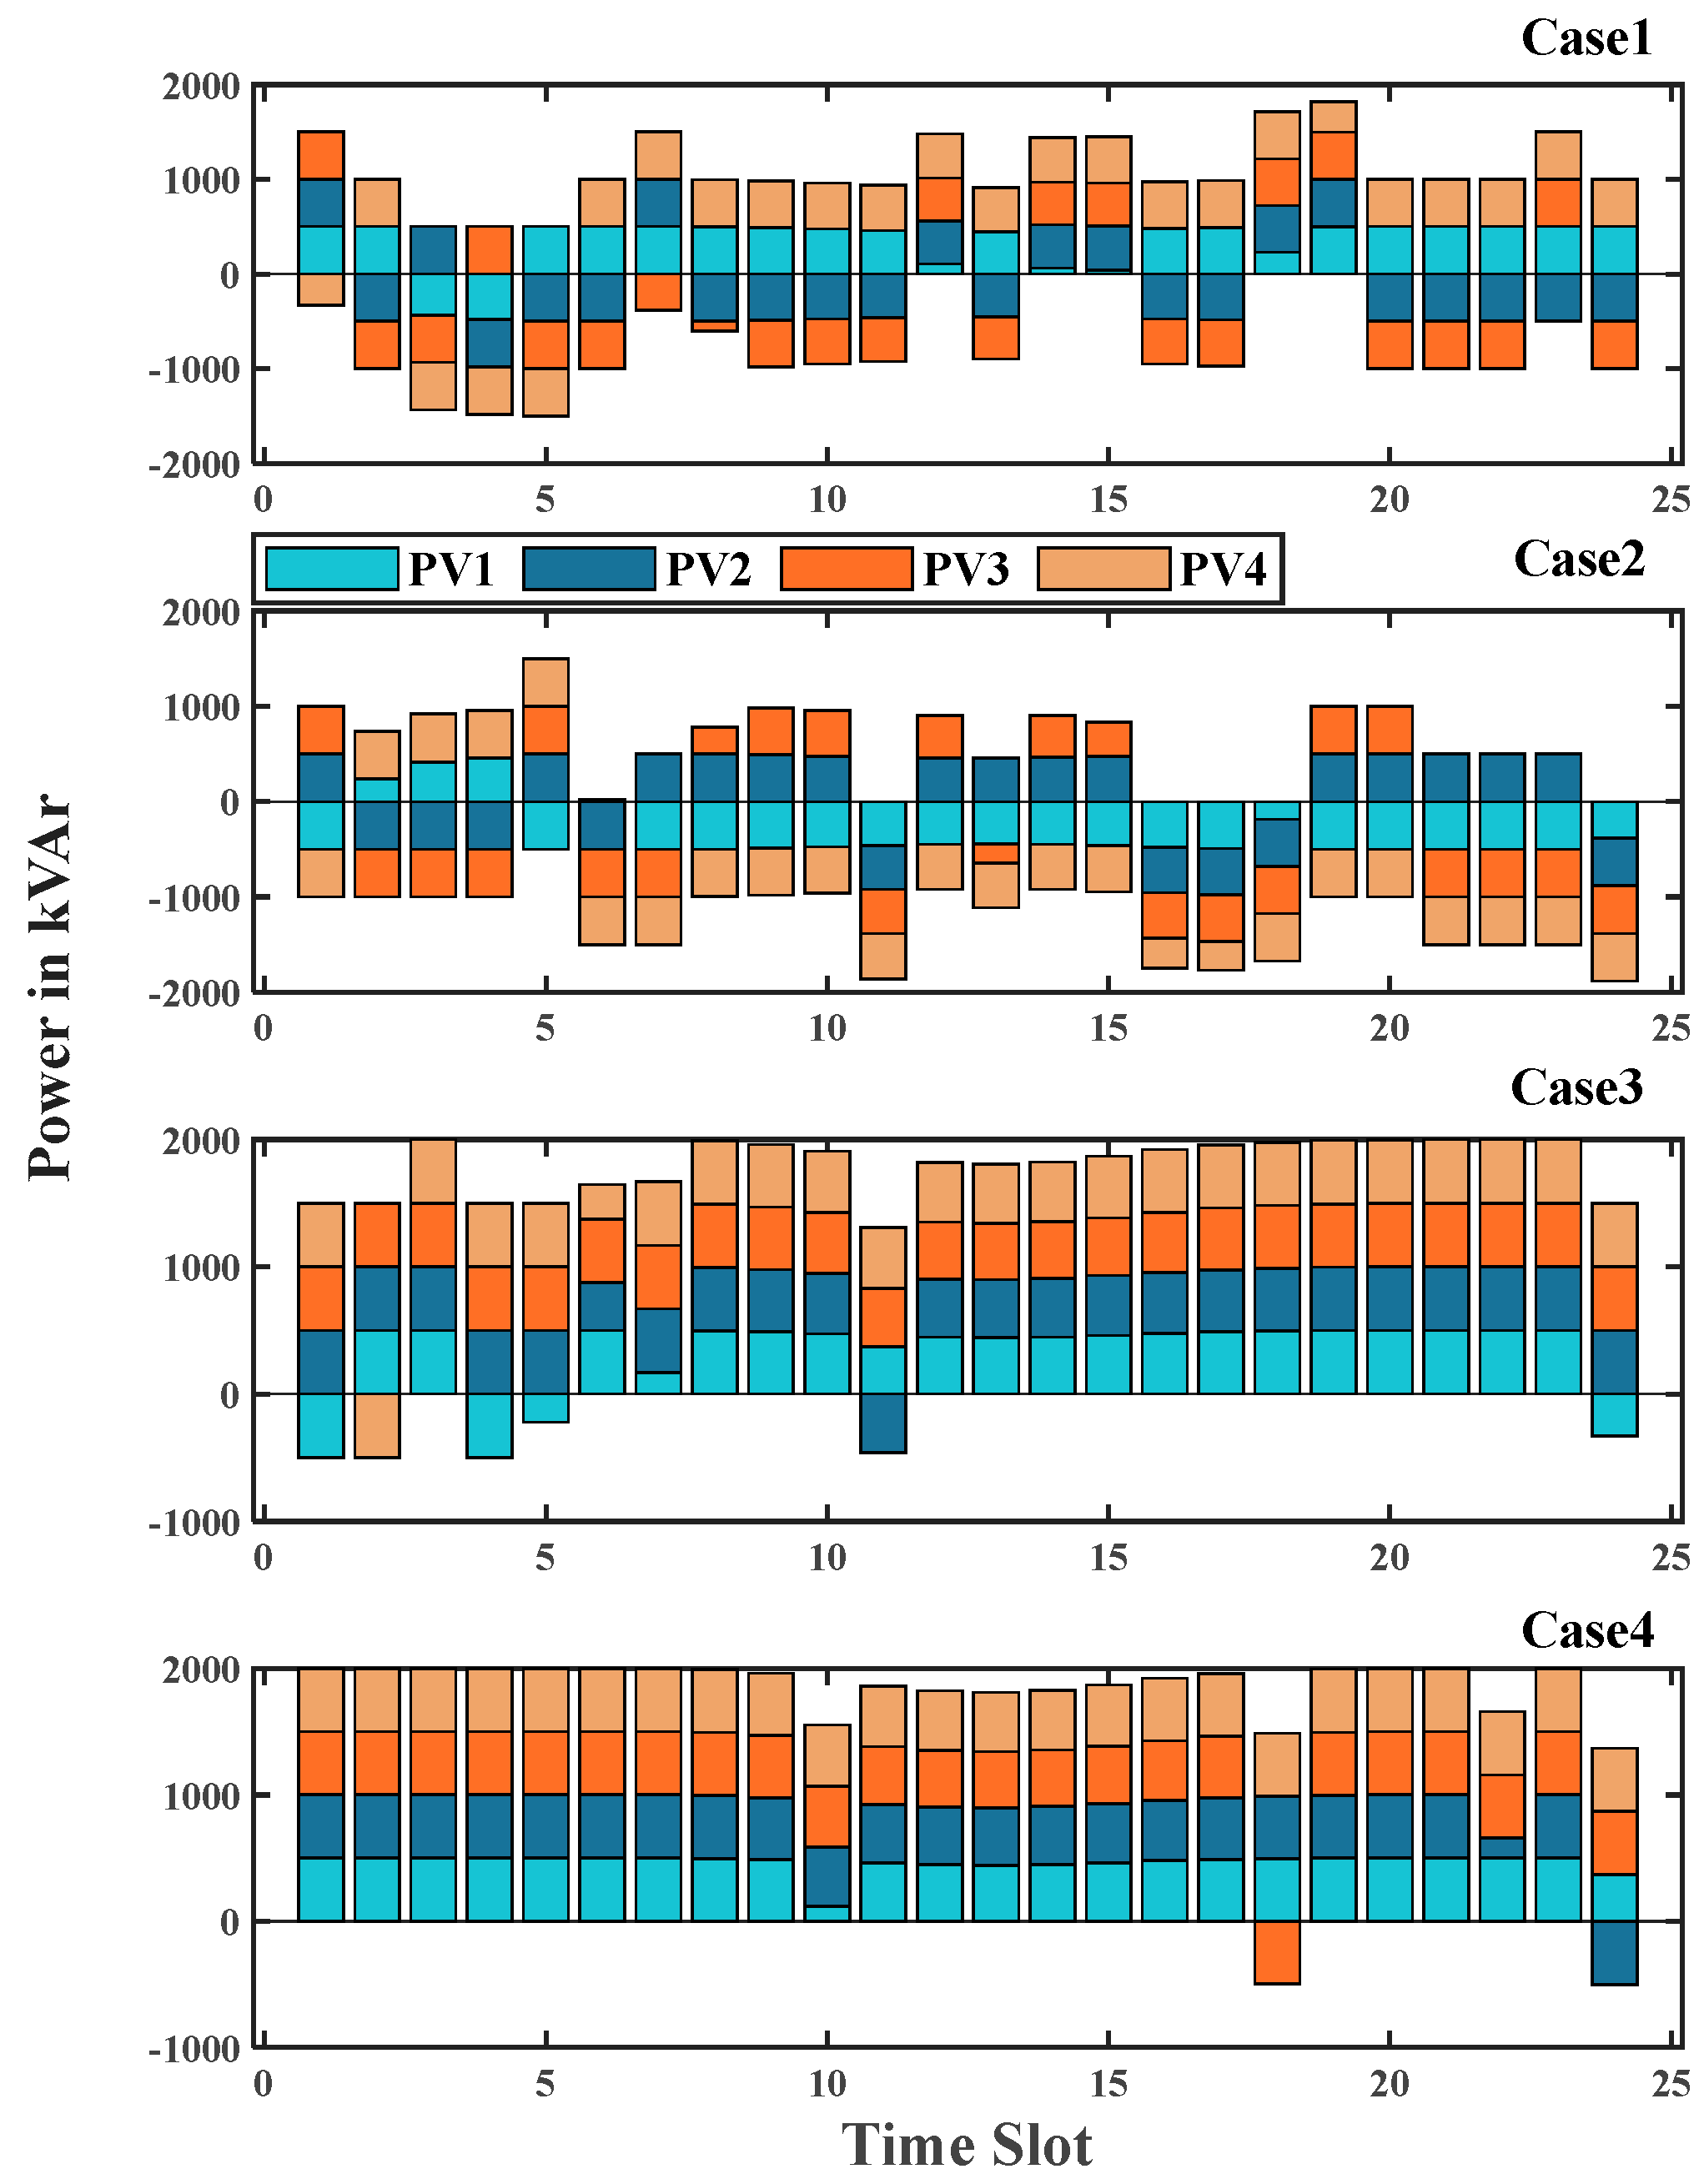
  • Case 1: RESs (yes), DGs (yes), SCBs (yes), OLTC (yes), EVA (no), reconfiguration (no), electrolyzer (no), hydrogen storage (no), and fuel cell (no).
  • Case 2: RESs (yes), DGs (yes), SCBs (yes), OLTC (yes), EVA (yes), reconfiguration (no), electrolyzer (no), hydrogen storage (no), and fuel cell (no).
  • Case 3: RESs (yes), DGs (yes), SCBs (yes), OLTC (yes), EVA (yes), reconfiguration (yes), electrolyzer (no), hydrogen storage (no), and fuel cell (no).
  • Case 4: RESs (yes), DGs (yes), SCBs (yes), OLTC (yes), EVA (yes), reconfiguration (yes), electrolyzer (yes), hydrogen storage (yes), and fuel cell (yes).

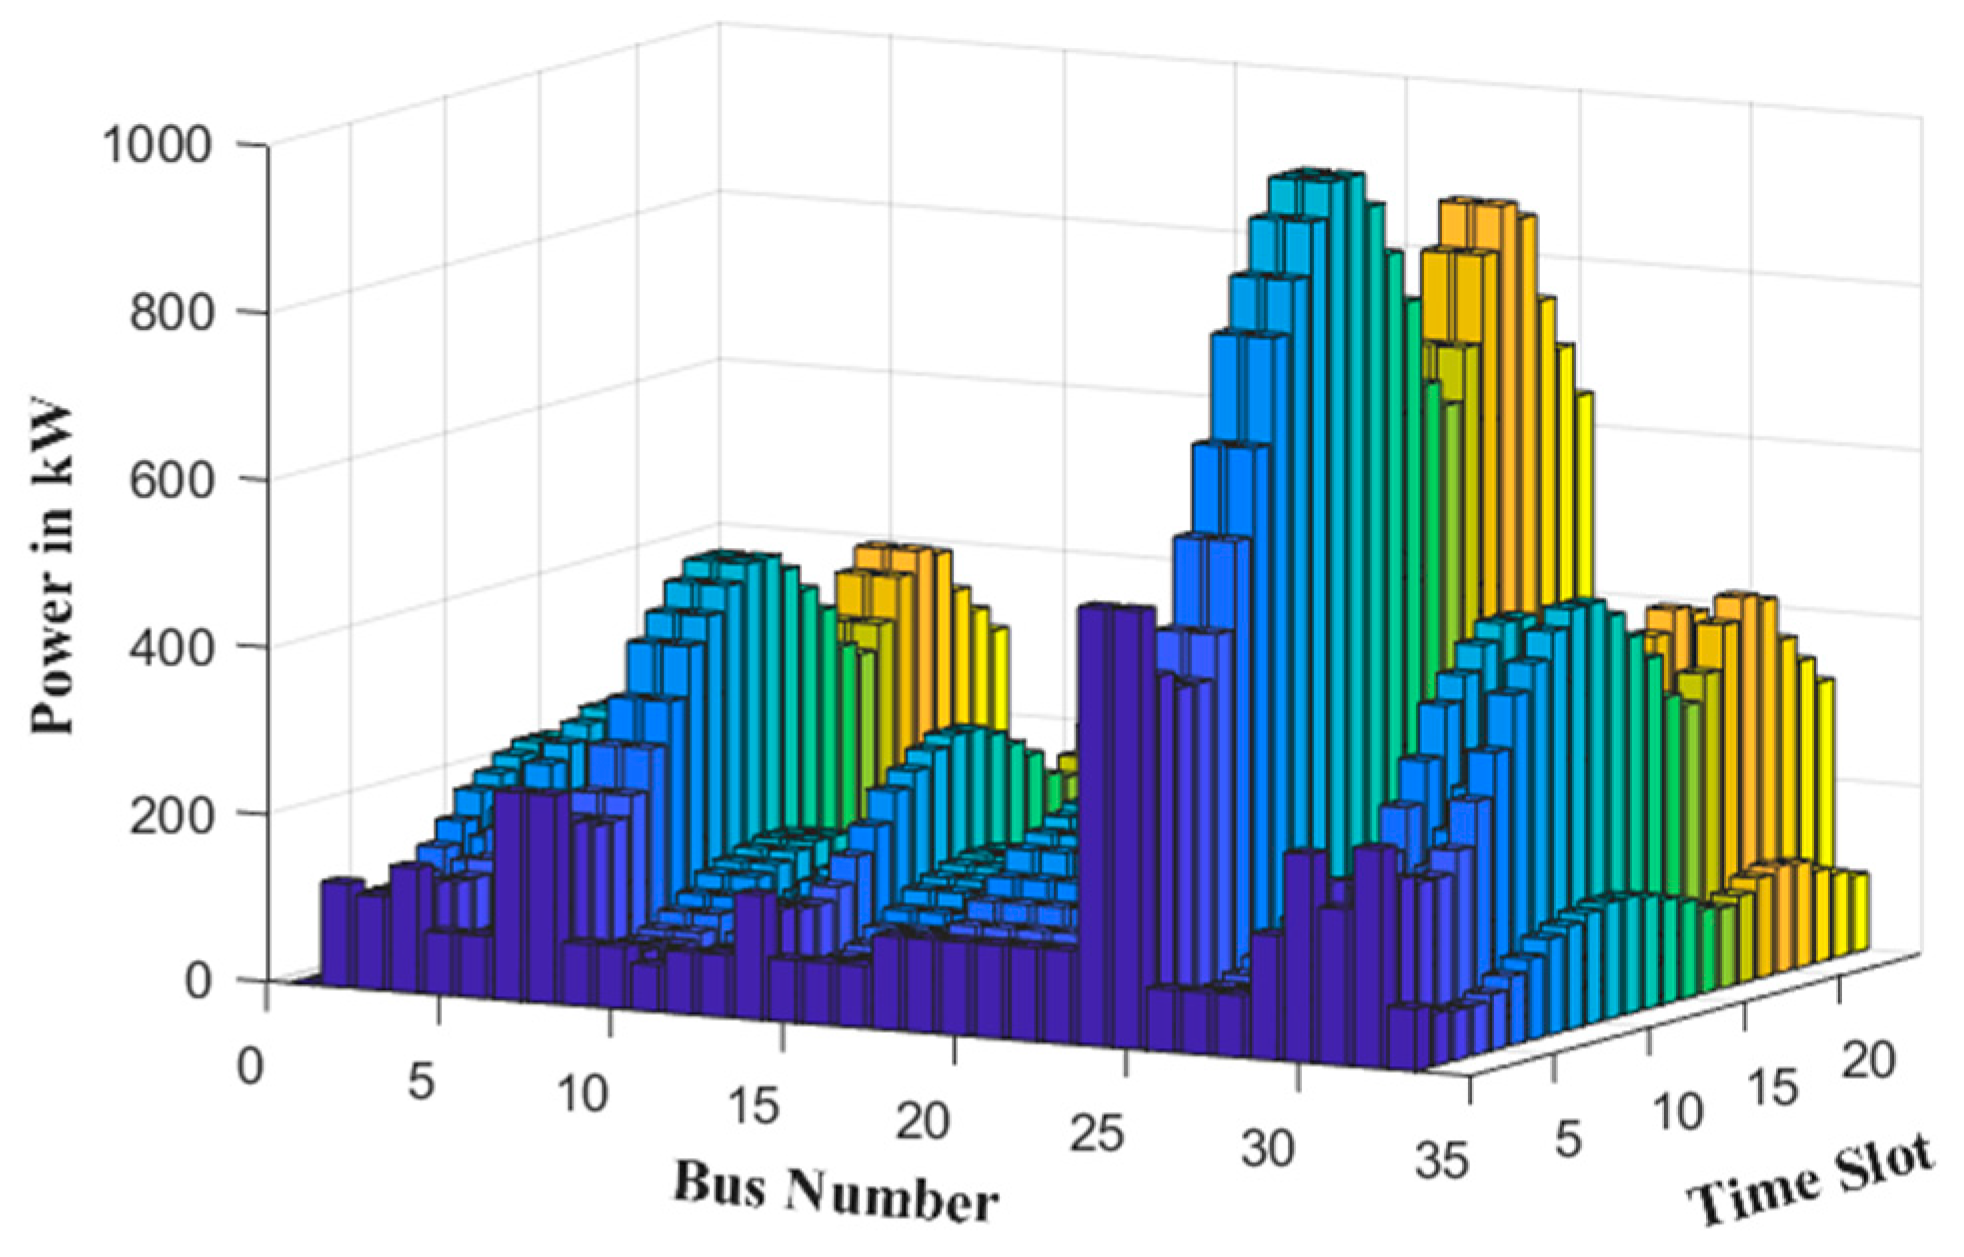
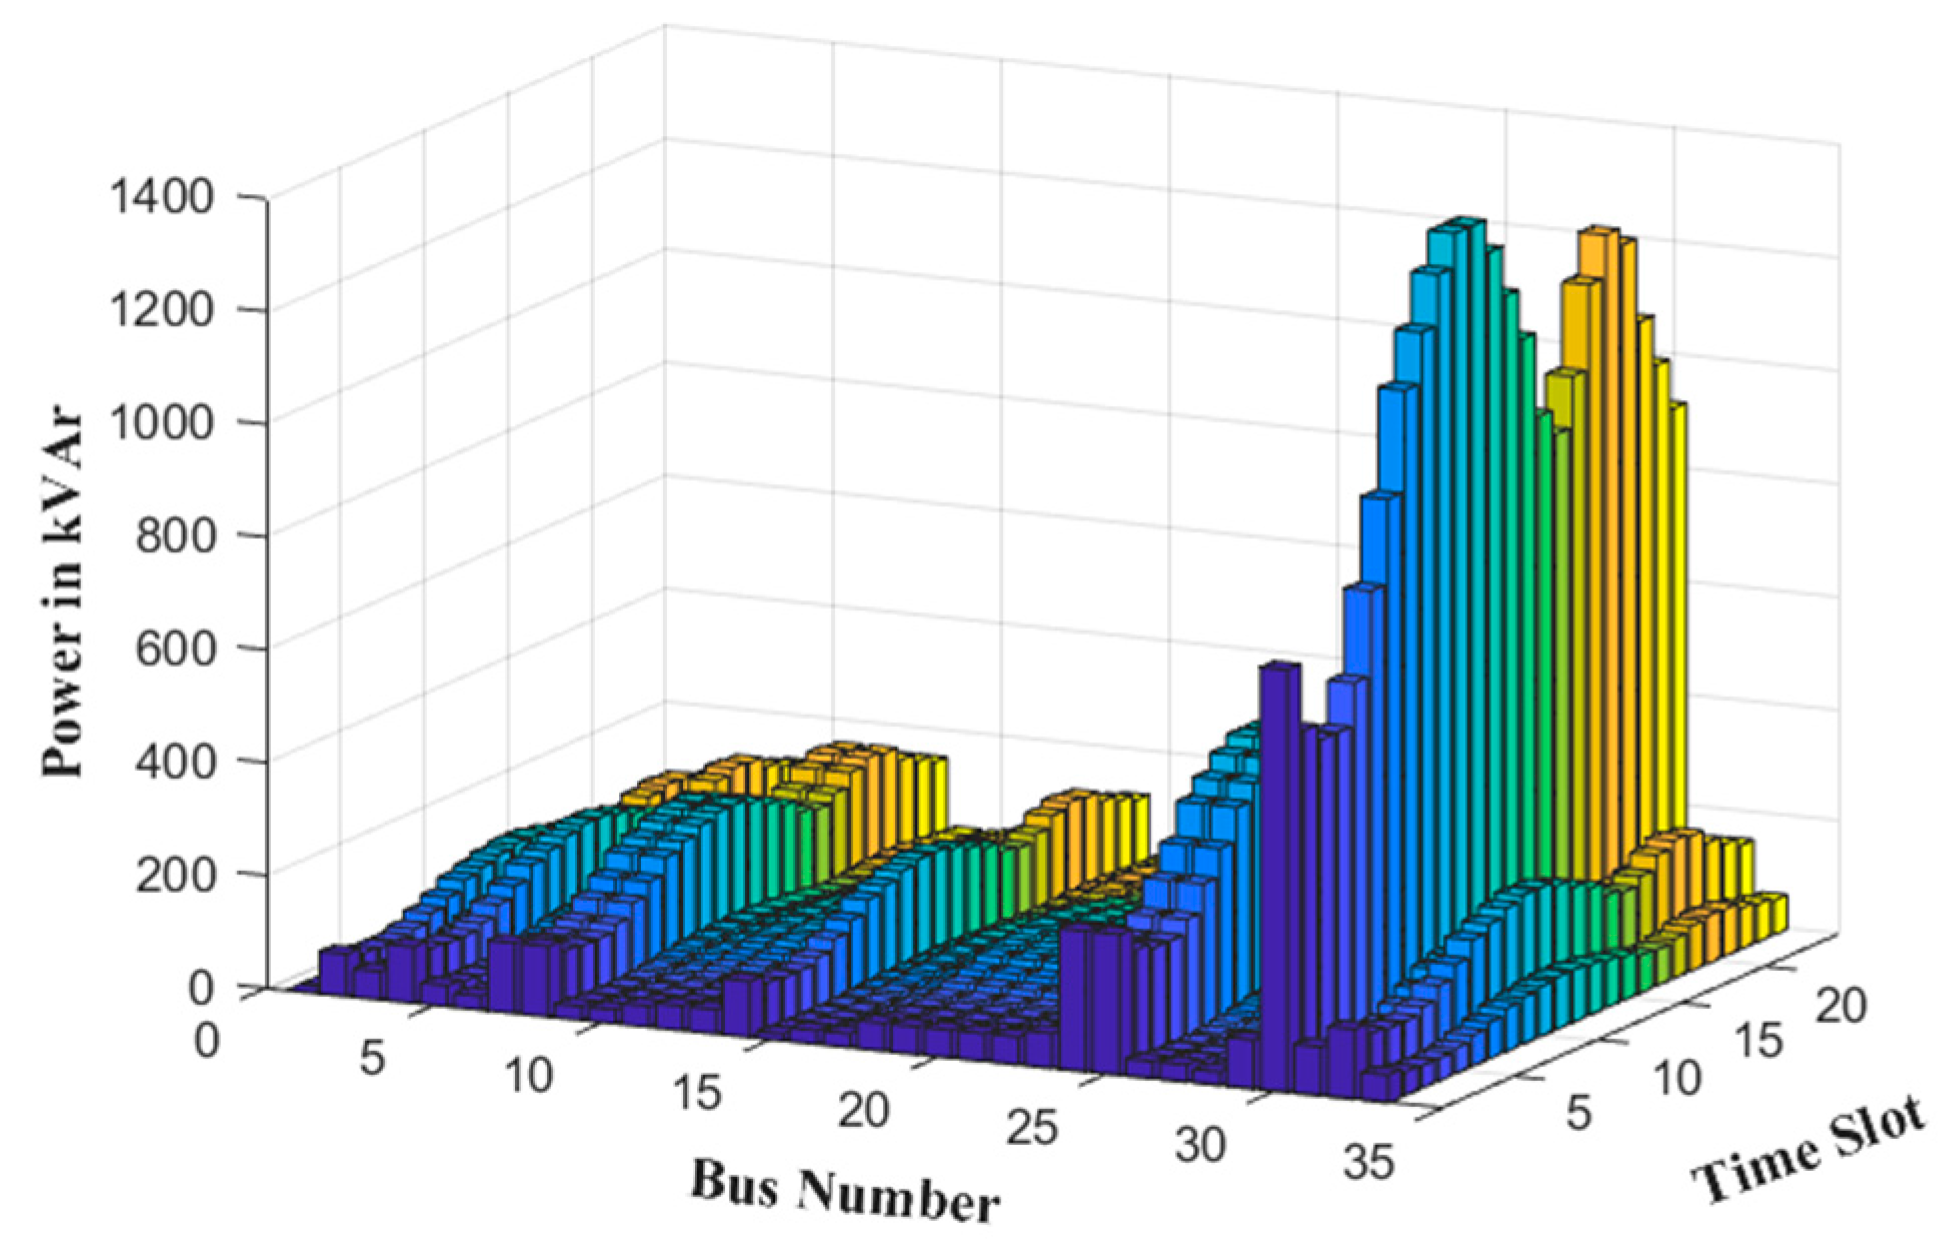
4.2. Numerical Results and Discussion

In this section, the framework is implemented in Cases 1–4 to yield a comprehensive comparison among cases and recognize what effect EVAs, the hydrogen-to-power concept, and feeder reconfiguration could have on volt-var control.
The average voltage profile of the microgrid is illustrated in Figure 6 for all case studies. This figure demonstrates that the proposed volt-var control ensures a safe operational scheme by maintaining the voltage at the buses within acceptable ranges across all cases. Notably, the voltage profile in Case 3 is flatter than in Cases 1 and 2, which can be attributed to feeder reconfiguration that enhances power sharing among the branches of the microgrid. In Case 4, the hydrogen-to-power-to-hydrogen conversions significantly impact the microgrid’s voltage levels, as their functions affect the OLTC tap positions. This adjustment aims to keep the network voltage within acceptable ranges, resulting in higher voltage levels across the network. It can be deduced that feeder reconfiguration in the presence of coordinating other equipment can participate in attaining a flatter voltage profile.
The operation actions of OLTC are depicted in Figure 7. The tap position of OLTC in Case 1 is higher than in Cases 2 and 3 because of keeping the voltage between permissible ranges. However, in Case 2, when EVAs are also coordinated along with other features/equipment, the tap operation of OLTC is decreased in some intervals, e.g., interval 10–15. The reason is that the EVAs are charged and discharged in the off-peak and peak intervals, respectively, and they could compensate for over-/under-voltages; therefore, the OLTC is operated at a lower level. Interestingly, in Case 3, when feeder reconfiguration is also incorporated in the volt-var model, the tap positions decreased more significantly than in Cases 1 and 2. Because of changing the microgrid structure, the penetration of RESs and EVA aggregations increased significantly. Consequently, if volt-var is integrated with EVAs and feeder reconfiguration, the OLTC is operated in the lowest positions. The lower tap positions give operators a hand in decreasing the over-voltage issue that occurs during the reverse power flow of PVs. In Case 4, however, the tap position changes more frequently compared to Case 3. This is due to the frequent occurrences of hydrogen-to-power-to-hydrogen conversions, which require the OLTC tap position to be accordingly adjusted in order to maintain the voltage within acceptable ranges.
The obtained charge and discharge of EVA throughout the time frame is depicted in Figure 8. It can be seen that the EVAs are approximately charged from 1 to 7 h; this corresponds to the off-peak intervals when the electricity price is lower. At the middle interval, from 9 to 15, with a higher market price, the EVAs are discharged to reduce the operational cost. In addition, there are also two hours, comprising 8 and 18, during which EVAs consume energy to transfer the passengers, and therefore, they do not engage with the microgrid. Such a charging/discharging pattern not only satisfies the technical aspects of the microgrid but also could enable the operator to achieve more cost savings.
The reactive power provided via SPIs for Cases 1–4 is illustrated in Figure 9. From this figure, it is clear that the reactive power management in Case 1 fluctuates significantly from hour 1 to hour 24 to address over-voltage and under-voltage conditions. In Case 2, the reactive power from SPIs experienced a slight change compared to Case 1 because EVAs are charged during hours 1–7, increasing demand and reducing the need for reactive power to address the over-voltage problem. Turning to Case 3, we find that this behavior is attributed to changes because of alterations in the microgrid’s topology, which alters power flows among the branches and enables better sharing of reactive power. Case 4 demonstrates a pattern similar to Case 3, following roughly the same approach to reactive power management.
The committed scheduling of DGs is shown in Figure 10. It is also noteworthy that the output of the DGs remains relatively stable, with ramp-rate limitations consistently respected throughout the period. The figure clearly indicates that DGs predominantly commit to power generation during hours when market prices are higher, while their generation is constrained during intervals with lower market prices.
Figure 11 illustrates the operation of two electrolyzers and two fuel cells within the microgrid, emphasizing the P2H and H2P conversions. The electrolyzers generally consume power during hours 1 to 6, specifically taking advantage of lower market prices to charge the hydrogen storage. This stored hydrogen can subsequently be converted back into electricity by the fuel cells, which generate power between hours 10 and 14, when market prices are higher. This sequential operation demonstrates that, by shifting power across different intervals, economic benefits are attained.
Figure 12 and Figure 13 illustrate the status of switches for the microgrid configuration in Cases 3 and 4, respectively. A noteworthy aspect is that the microgrid configuration changes over time due to the availability and unavailability of various equipment within the timeframe. In other words, adjustments in the penetration of different resources, such as EVAs, electrolyzers, and fuel cells, lead to these changes. Additionally, the configurations in both cases differ because of the incorporation of various resources. This highlights the need to optimize the microgrid topology in the presence of diverse resources to achieve better power sharing and ensure the reliability of technical operations.

5. Conclusions

This paper has introduced a novel volt-var control strategy for reconfigurable microgrids, incorporating EVAs, electrolyzers, fuel cells, and other devices to effectively address under-voltage and over-voltage challenges.
The results yield several key conclusions. Initially, the operational frequency of OLTCs decreased when the simultaneous integration of EVAs and feeder reconfigurations was considered. This indicates that the OLTC operated at a lower level, resulting in a more stable voltage profile across the microgrids. Notably, through the optimal coordination of EVAs, both over-voltage and under-voltage occurrences significantly decreased during off-peak and peak intervals. This improvement is attributed to charging EVAs during off-peak hours and discharging them during peak periods. Furthermore, the combination of feeder reconfiguration and EVA coordination enhanced the model flexibility, leading to a flatter voltage profile. The effective management of hydrogen conversion technologies, alongside volt-var devices, significantly improved voltage levels, increasing from 0.95 p.u in Case 1 to 0.96 p.u in Case 4.
Although this article examined voltage management in microgrids integrated with hydrogen-to-power systems, several gaps remain for future investigation. First, electrolyzers and fuel cells are costly equipment, highlighting the need for further research into considering the investment costs to develop a more cost-efficient framework. Additionally, future work will focus on integrating direct load control to enhance the system’s efficiency.

Author Contributions

Conceptualization, K.G. and A.A. (Ali Azizivahed); methodology, K.G., A.A. (Ali Azizivahed) and L.L.; software, K.G. and A.A. (Ali Azizivahed); validation, A.A. (Ali Arefi) and L.L.; formal analysis, A.A. (Ali Arefi), L.L., M.T.A. and M.E.H.; investigation, K.G. and A.A. (Ali Azizivahed); writing—original draft, K.G.; writing—review and editing, A.A. (Ali Azizivahed), A.A. (Ali Arefi), L.L., M.T.A. and M.E.H.; supervision, A.A. (Ali Arefi), L.L., M.T.A. and M.E.H.; project administration, A.A. (Ali Arefi) and L.L. All authors have read and agreed to the published version of the manuscript.

Funding

This research received no external funding.

Data Availability Statement

Data is contained within the article.

Conflicts of Interest

The authors declare no conflicts of interest.

Nomenclature

Sets, Indexes
Ω p a r Set of parent buses
Ω c h i l Set of child buses
Ω b u s Set of buses
Ω b r a n c h Set of branches
Ω d g Set of DGs
Ω P V Set of SPVIs
Ω e v a Set of EVAs
Ω t i m e Set of time horizon
Ω u p Set of uncertain parameters
Ω h g n Set of hydrogen system
Ω c b Set of capacitor banks
Ω o l t c Set of OLTC
Ω b u s Cardinality of the set Ω b u s
N ( n ) Set of buses connected to bus n
n , m , k Index of buses
d Index of DGs
e Index of EVA
p Index of SPVIs
c Index of SCBs
t Index of time
o Index of OLTCs
l Indices of sample points
h Index of hydrogen system
Parameters
λ S S t 
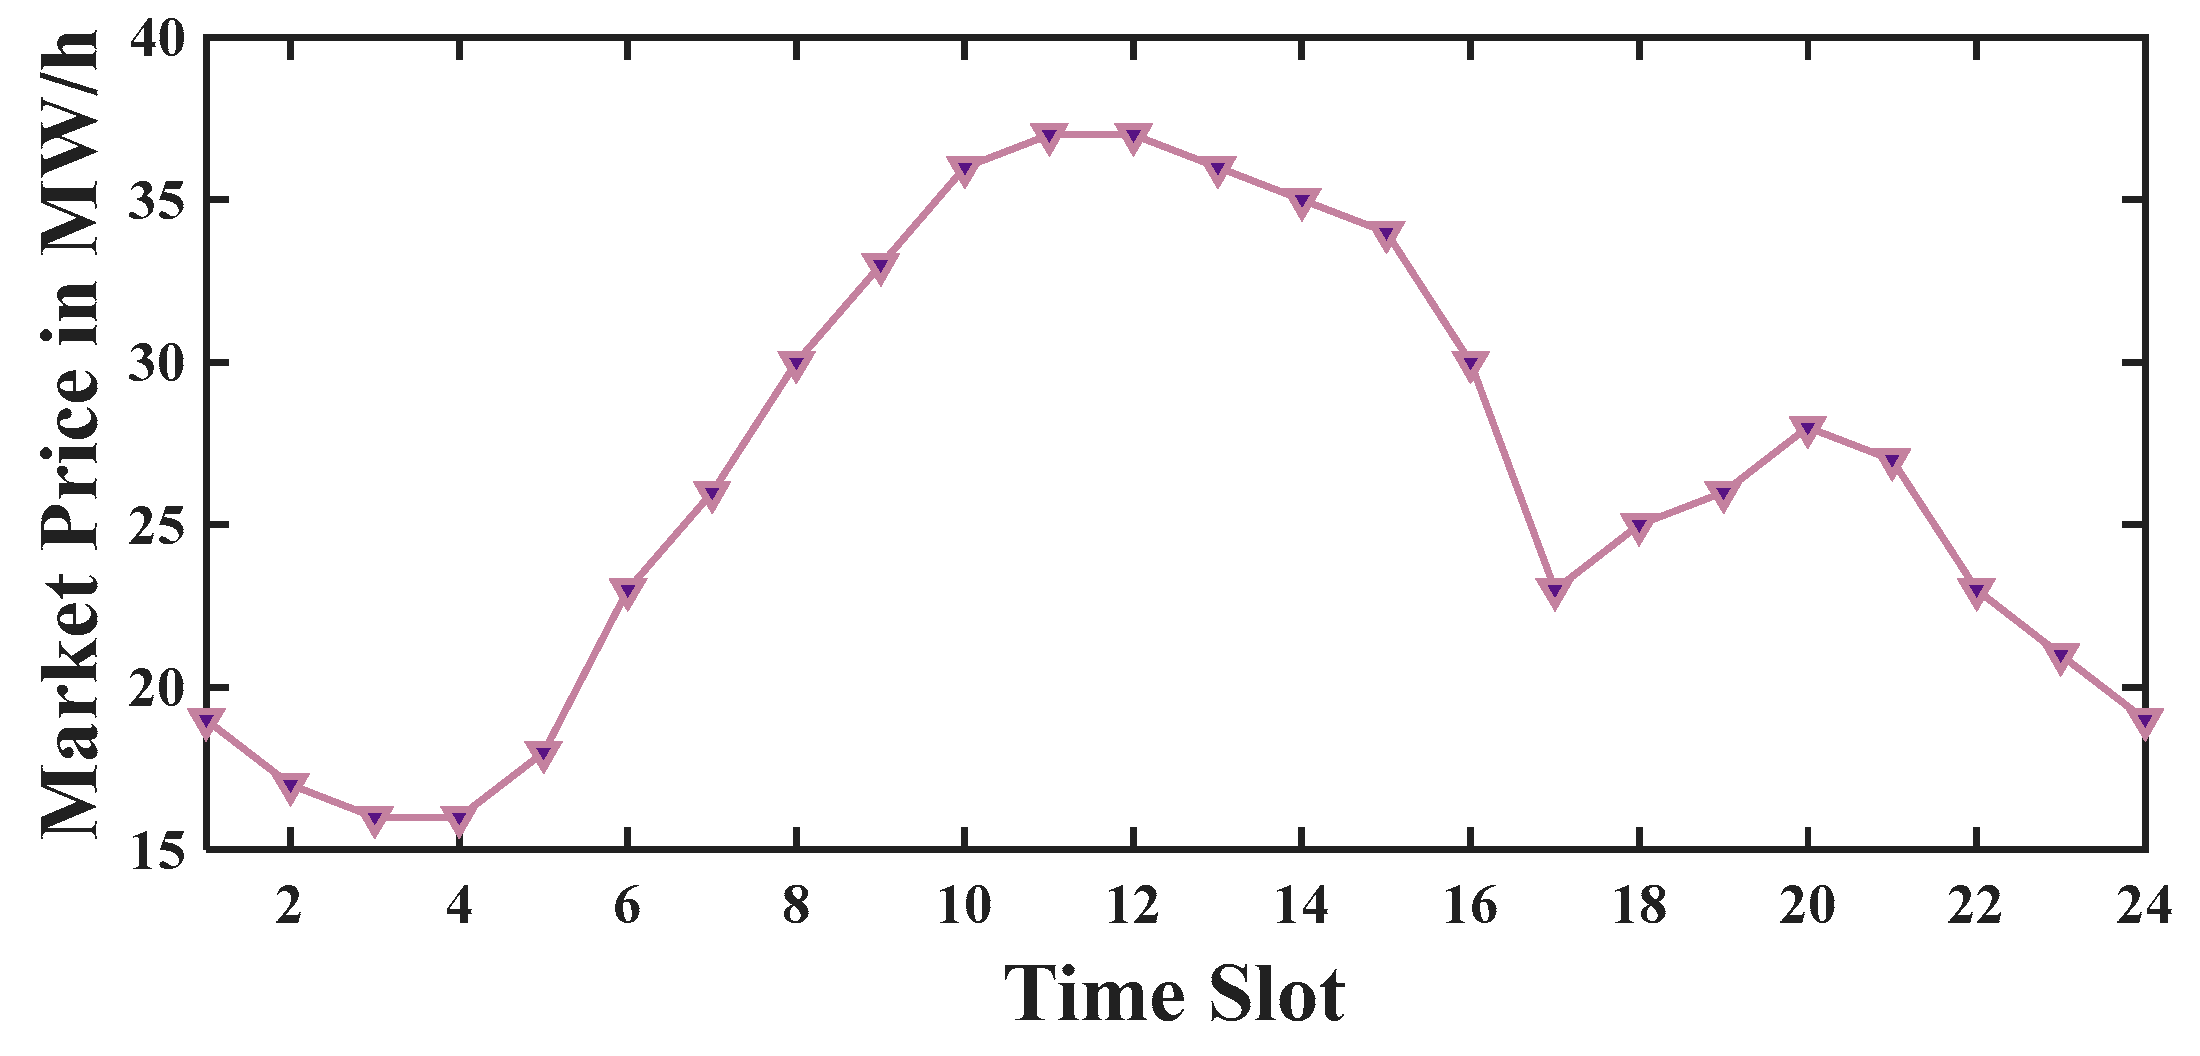
Wholesale market price (upstream network)
λ o l t c o OLTC tap adjustment cost
λ C B c Switching cost of capacitor banks
λ D G d Operational cost per MWh of DG d
E e v a e , m i n Minimum energy for E V A e
E e v a e , m a x Maximum energy for E V A e
E e v a e , i n i t i a l Initial energy for E V A e
E e v a e , f i n a l Ultimate energy for E V A e
P L n , t Amount of active power demand at n -th bus
P D G d , m i n Minimum output of DG d
P D G d , m a x Maximum output of DG d
P c h , e v a e , m i n Minimum charging of EVA e
P c h , e v a e , m a x Maximum charging of EVA e
P d i s , e v a e , m i n Minimum discharging of EVA e
P d i s , e v a e , m a x Maximum discharging of EVA e
P F C h , m i n Minimum generation limit of fuel cell h
P F C h , m a x Maximum generation limit of fuel cell h
P e l s r h , m i n Minimum consumption limit of electrolyzer h
P e l s r h , m a x Maximum consumption limit of electrolyzer h
Q L n , t Amount of reactive power demand at n -th bus
Q r a t e c Quantity of reactive power via c -th shunt capacitor bank at each step
R D G d , U p p e r Ramp-up rate of d -th DG
R L m n , t Branch resistance to connect the bus m to n
R D G d , D o w n Ramp-up rate of d -th DG
S f l o w m n , M a x Maximum capacity of branch m n to transmit the complex power
S P V p Inverter rating to connect PV to network
S h g n h , m i n Minimum limit of state of hydrogen storage
S h g n h , m a x Maximum limit of state of hydrogen storage
S h g n h , t f i n a l Final state of hydrogen ( e . g . , t f i n a l = 24 )
S h g n h , t i n i t i a l Initial state of hydrogen ( e . g . , t i n i t i a l = 0 )
T o l t c o , m i n Lower bound of OLTC taps
T o l t c o , m a x Upper bound of OLTC taps
V b n , m i n Minimum acceptable voltage at n -th bus
V b n , m a x Maximum acceptable voltage at n -th bus
V s 0 Voltage of substation s
W 0 Weight of the mean value μ x
W k Weight of the k -th sample point
X L m n , t Branch reactance to connect the bus m to n
η c h Charging efficiency coefficient of EVA
η d i s Discharging efficiency coefficient of EVA
η e l s r Electrolyzer efficiency coefficient
η F C Fuel cell efficiency coefficient
t Time interval
Ψ e i h Energy density of hydrogen, considered as 39 kWh/kg
ψ C B c , M a x Maximum tap setting of the c -th capacitor
M b i g A big number
Variables
C x x Covariance of input uncertain parameters
C y y Covariance of the output variable Y
E e v a e , t Energy of e -th EVA
H e l s r h , t The generated hydrogen by electrolyzer h
H F C h , t The consumed hydrogen by fuel cell h
O F Objective function
P f l o w m n , t Amount of active power which branch m n carries
P S S t Amount of power injected into the microgrid via the upstream network
P D G d , t Amount of active power which d -th DG generates
P c h , e v a e , t Charging rate of e -th EVA
P d i s , e v a e , t Discharging rate of e -th EVA
Summation of active loads and generations at n -th bus
P P V p , t Amount of active power generated by P n e t n , t -th PV resource
P e l s r h , t Consumed power via h -th electrolyzer
P F C h , t Generated power via h -th fuel cell
Q f l o w m n , t Amount of reactive power that branch m n carries
Q D G d , t Amount of reactive power that d -th DG generates
Q P V p , t Amount of reactive power generated by p -th PV resource
Q n e t n , t Summation of reactive loads and generations at n -th bus
Q C B c , t Amount of reactive power that c -th switchable capacitor bank provides
S h g n h , t State of charge of hydrogen storage h
φ m , n , φ n , m Binary variables that indicate parent–child relationship indices
α m n , t Status of branch m n at time t (open switches are represented as 0, while closed switches are represented as 1)
S p l l -th sample observation of uncertain parameters
Y l Value of the fitness function at the l -th sample observation
T a p o l t c o , t Step of o -th OLTC
V b n , t Voltage of bus n
ψ C B c , t Integer variable taking the steps of c -th switchable capacitor bank
μ x Average value of input uncertain parameters
μ y Average value of the output variable Y
Abbreviation
P2HPower-to-hydrogen
H2PHydrogen-to-power
DGsDiesel generators
EVAElectric vehicle aggregation
volt-varVoltage and volt-ampere reactive
OLTCOnline tap changer transformer
PVPhotovoltaic array
RESsRenewable energy sources
SCBsSwitchable capacitor banks
SPIsSmart PV inverters
Volt-VArVoltage-volt ampere-reactive
VVCVolt-VAr control
UTUnscented transformation
PDFProbability distribution function

References

  1. Hemmatpour, M.H.; Mohammadian, M.; Gharaveisi, A.A. Optimum Islanded Microgrid Reconfiguration Based on Maximization of System Loadability and Minimization of Power Losses. Int. J. Electr. Power Energy Syst. 2016, 78, 343–355. [Google Scholar] [CrossRef]
  2. Boland, J.; Filar, J.A.; Mohammadian, G.; Nazari, A. Australian Electricity Market and Price Volatility. Ann. Oper. Res. 2016, 241, 357–372. [Google Scholar] [CrossRef]
  3. Aryanezhad, M. Management and Coordination of LTC, SVR, Shunt Capacitor and Energy Storage with High PV Penetration in Power Distribution System for Voltage Regulation and Power Loss Minimization. Int. J. Electr. Power Energy Syst. 2018, 100, 178–192. [Google Scholar] [CrossRef]
  4. Liu, J.; Li, Y.; Rehtanz, C.; Cao, Y.; Qiao, X.; Lin, G.; Song, Y.; Sun, C. An OLTC-Inverter Coordinated Voltage Regulation Method for Distribution Network with High Penetration of PV Generations. Int. J. Electr. Power Energy Syst. 2019, 113, 991–1001. [Google Scholar] [CrossRef]
  5. Abbas, A.S.; El-Sehiemy, R.A.; Abou El-Ela, A.; Ali, E.S.; Mahmoud, K.; Lehtonen, M.; Darwish, M.M.F. Optimal Harmonic Mitigation in Distribution Systems with Inverter Based Distributed Generation. Appl. Sci. 2021, 11, 774. [Google Scholar] [CrossRef]
  6. Zafar, R.; Ravishankar, J.; Fletcher, J.E.; Pota, H.R. Multi-Timescale Voltage Stability-Constrained Volt/VAR Optimization with Battery Storage System in Distribution Grids. IEEE Trans. Sustain. Energy 2020, 11, 868–878. [Google Scholar] [CrossRef]
  7. Prabpal, P.; Kongjeen, Y.; Bhumkittipich, K. Optimal Battery Energy Storage System Based on VAR Control Strategies Using Particle Swarm Optimization for Power Distribution System. Symmetry 2021, 13, 1692. [Google Scholar] [CrossRef]
  8. Pamshetti, V.B.; Singh, S.; Thakur, A.K.; Singh, S.P. Multistage Coordination Volt/VAR Control with CVR in Active Distribution Network in Presence of Inverter-Based DG Units and Soft Open Points. IEEE Trans. Ind. Appl. 2021, 57, 2035–2047. [Google Scholar] [CrossRef]
  9. Gholami, K.; Azizivahed, A.; Arefi, A.; Li, L. Risk-Averse Volt-VAr Management Scheme to Coordinate Distributed Energy Resources with Demand Response Program. Int. J. Electr. Power Energy Syst. 2023, 146, 108761. [Google Scholar] [CrossRef]
  10. Sabillon-Antunez, C.; Melgar-Dominguez, O.D.; Franco, J.F.; Lavorato, M.; Rider, M.J. Volt-VAr Control and Energy Storage Device Operation to Improve the Electric Vehicle Charging Coordination in Unbalanced Distribution Networks. IEEE Trans. Sustain. Energy 2017, 8, 1560–1570. [Google Scholar] [CrossRef]
  11. Tushar, M.H.K.; Assi, C. Volt-VAR Optimization by Using Electric Vehicle, Renewable Energy and Residential Load-Shifting. In Proceedings of the 2016 IEEE International Conference on Smart Grid Communications, SmartGridComm 2016, Sydney, Australia, 6–9 November 2016; pp. 460–465. [Google Scholar] [CrossRef]
  12. Gholami, K.; Karimi, S.; Rastgou, A.; Nazari, A.; Moghaddam, V. Voltage Stability Improvement of Distribution Networks Using Reactive Power Capability of Electric Vehicle Charging Stations. Comput. Electr. Eng. 2024, 116, 109160. [Google Scholar] [CrossRef]
  13. Nandhakumar, S.K.; Muthukumar, R. Combined Reconfiguration and Capacitor Placement for Distribution System Volt/Var Control through Opposition Based Differential Evolution Algorithm. Automatika 2015, 56, 140–148. [Google Scholar] [CrossRef]
  14. Pamshetti, V.B.; Singh, S.; Singh, S.P. Combined Impact of Network Reconfiguration and Volt-VAR Control Devices on Energy Savings in the Presence of Distributed Generation. IEEE Syst. J. 2020, 14, 995–1006. [Google Scholar] [CrossRef]
  15. Microgrid, D. Volt—Var Optimization and Reconfiguration: Reducing Power Demand and Losses in a droop-based microgrid. IEEE Trans. Ind. Appl. 2021, 57, 2769–2781. [Google Scholar]
  16. Azizivahed, A.; Gholami, K.; Arefi, A.; Li, L.; Arif, M.T.; Haque, M.E. Stochastic Scheduling of Energy Sharing in Reconfigurable Multi-Microgrid Systems in the Presence of Vehicle-to-Grid Technology. Electr. Power Syst. Res. 2024, 231, 110285. [Google Scholar] [CrossRef]
  17. Guo, X.; Zhu, H.; Zhang, S. Overview of Electrolyser and Hydrogen Production Power Supply from Industrial Perspective. Int. J. Hydrogen Energy 2024, 49, 1048–1059. [Google Scholar] [CrossRef]
  18. Massaro, M.C.; Biga, R.; Kolisnichenko, A.; Marocco, P.; Monteverde, A.H.A.; Santarelli, M. Potential and Technical Challenges of On-Board Hydrogen Storage Technologies Coupled with Fuel Cell Systems for Aircraft Electrification. J. Power Sources 2023, 555, 232397. [Google Scholar] [CrossRef]
  19. Ghaithan, A.M.; Kondkari, M.; Mohammed, A.; Attia, A.M. Optimal Design of Concentrated Solar Power-Based Hydrogen Refueling Station: Mixed Integer Linear Programming Approach. Int. J. Hydrogen Energy 2024, 86, 703–718. [Google Scholar] [CrossRef]
  20. Shahbazbegian, V.; Shafie-khah, M.; Laaksonen, H.; Strbac, G.; Ameli, H. Resilience-Oriented Operation of Microgrids in the Presence of Power-to-Hydrogen Systems. Appl. Energy 2023, 348, 121429. [Google Scholar] [CrossRef]
  21. Yu, N.; Duan, W.; Fan, X. Hydrogen-Fueled Microgrid Energy Management: Novel EMS Approach for Efficiency and Reliability. Int. J. Hydrogen Energy 2024, 80, 1466–1476. [Google Scholar] [CrossRef]
  22. Zhang, W.; Gandhi, O.; Quan, H.; Rodríguez-Gallegos, C.D.; Srinivasan, D. A Multi-Agent Based Integrated Volt-Var Optimization Engine for Fast Vehicle-to-Grid Reactive Power Dispatch and Electric Vehicle Coordination. Appl. Energy 2018, 229, 96–110. [Google Scholar] [CrossRef]
  23. Malekpour, A.R.; Niknam, T. A Probabilistic Multi-Objective Daily Volt/Var Control at Distribution Networks Including Renewable Energy Sources. Energy 2011, 36, 3477–3488. [Google Scholar] [CrossRef]
  24. Baghaee, H.R.; Mirsalim, M.; Gharehpetian, G.B.; Talebi, H.A. Application of RBF Neural Networks and Unscented Transformation in Probabilistic Power-Flow of Microgrids Including Correlated Wind/PV Units and Plug-in Hybrid Electric Vehicles. Simul. Model. Pract. Theory 2017, 72, 51–68. [Google Scholar] [CrossRef]
  25. Dabbaghjamanesh, M.; Kavousi-Fard, A.; Mehraeen, S. Effective Scheduling of Reconfigurable Microgrids With Dynamic Thermal Line Rating. IEEE Trans. Ind. Electron. 2019, 66, 1552–1564. [Google Scholar] [CrossRef]
  26. Kavousi-Fard, A.; Niknam, T.; Fotuhi-Firuzabad, M. Stochastic Reconfiguration and Optimal Coordination of V2G Plug-in Electric Vehicles Considering Correlated Wind Power Generation. IEEE Trans. Sustain. Energy 2015, 6, 822–830. [Google Scholar] [CrossRef]
  27. Aien, M.; Fotuhi-Firuzabad, M.; Aminifar, F. Probabilistic Load Flow in Correlated Uncertain Environment Using Unscented Transformation. IEEE Trans. Power Syst. 2012, 27, 2233–2241. [Google Scholar] [CrossRef]
  28. Jashfar, S.; Esmaeili, S. Volt/Var/THD Control in Distribution Networks Considering Reactive Power Capability of Solar Energy Conversion. Int. J. Electr. Power Energy Syst. 2014, 60, 221–233. [Google Scholar] [CrossRef]
  29. Ameli, A.; Ahmadifar, A.; Shariatkhah, M.H.; Vakilian, M.; Haghifam, M.R. A Dynamic Method for Feeder Reconfiguration and Capacitor Switching in Smart Distribution Systems. Int. J. Electr. Power Energy Syst. 2017, 85, 200–211. [Google Scholar] [CrossRef]
  30. Emarati, M.; Barani, M.; Farahmand, H.; Aghaei, J.; del Granado, P.C. A Two-Level over-Voltage Control Strategy in Distribution Networks with High PV Penetration. Int. J. Electr. Power Energy Syst. 2021, 130, 106763. [Google Scholar] [CrossRef]
  31. Arunachalam, M.; Yoo, Y.; Al-Ghamdi, A.S.; Park, H.; Han, D.S. Integrating Green Hydrogen Production with Renewable Energy-Powered Desalination: An Analysis of CAPEX Implications and Operational Strategies. Int. J. Hydrogen Energy 2024, 84, 344–355. [Google Scholar] [CrossRef]
  32. Li, M.; Bai, Y.; Zhang, C.; Song, Y.; Jiang, S.; Grouset, D.; Zhang, M. Review on the Research of Hydrogen Storage System Fast Refueling in Fuel Cell Vehicle. Int. J. Hydrogen Energy 2019, 44, 10677–10693. [Google Scholar] [CrossRef]
  33. Mehrjerdi, H. Off-Grid Solar Powered Charging Station for Electric and Hydrogen Vehicles Including Fuel Cell and Hydrogen Storage. Int. J. Hydrogen Energy 2019, 44, 11574–11583. [Google Scholar] [CrossRef]
  34. Yuan, W.; Wang, J.; Qiu, F.; Chen, C.; Kang, C.; Zeng, B. Robust Optimization-Based Resilient Distribution Network Planning Against Natural Disasters. IEEE Trans. Smart Grid 2016, 7, 2817–2826. [Google Scholar] [CrossRef]
  35. Javadi, M.S.; Esmaeel Nezhad, A.; Jordehi, A.R.; Gough, M.; Santos, S.F.; Catalão, J.P.S. Transactive Energy Framework in Multi-Carrier Energy Hubs: A Fully Decentralized Model. Energy 2022, 238, 121717. [Google Scholar] [CrossRef]
  36. Dorostkar-Ghamsari, M.R.; Fotuhi-Firuzabad, M.; Lehtonen, M.; Safdarian, A. Value of Distribution Network Reconfiguration in Presence of Renewable Energy Resources. IEEE Trans. Power Syst. 2016, 31, 1879–1888. [Google Scholar] [CrossRef]
  37. Guo, Z.; Zhou, Z.; Zhou, Y. Impacts of Integrating Topology Reconfiguration and Vehicle-to-Grid Technologies on Distribution System Operation. IEEE Trans. Sustain. Energy 2020, 11, 1023–1032. [Google Scholar] [CrossRef]
  38. Mohseni, M.; Joorabian, M.; Lashkar Ara, A. Distribution System Reconfiguration in Presence of Internet of Things. IET Gener. Transm. Distrib. 2021, 15, 1290–1303. [Google Scholar] [CrossRef]
  39. Moghari, P.; Chabanloo, R.M.; Torkaman, H. Distribution System Reconfiguration Based on MILP Considering Voltage Stability. Electr. Power Syst. Res. 2023, 222, 109523. [Google Scholar] [CrossRef]
  40. Jabr, R.A.; Singh, R.; Pal, B.C. Minimum Loss Network Reconfiguration Using Mixed-Integer Convex Programming. IEEE Trans. Power Syst. 2012, 27, 1106–1115. [Google Scholar] [CrossRef]
  41. Aien, M.; Hajebrahimi, A.; Fotuhi-Firuzabad, M. A Comprehensive Review on Uncertainty Modeling Techniques in Power System Studies. Renew. Sustain. Energy Rev. 2016, 57, 1077–1089. [Google Scholar] [CrossRef]
  42. Aien, M.; Rashidinejad, M.; Fotuhi-Firuzabad, M. On Possibilistic and Probabilistic Uncertainty Assessment of Power Flow Problem: A Review and a New Approach. Renew. Sustain. Energy Rev. 2014, 37, 883–895. [Google Scholar] [CrossRef]
  43. Ramos, L.F.; Canha, L.N.; Do Prado, J.C.; de Menezes, L.R.A.X. A Novel Virtual Power Plant Uncertainty Modeling Framework Using Unscented Transform. Energies 2022, 15, 3716. [Google Scholar] [CrossRef]
  44. Chen, J.; Zhao, X.; Shi, K.; Ao, Z.; Zheng, X. Reliability Analysis of Transmission Tower Based on Unscented Transformation Under Ice and Wind Loads. Energies 2024, 17, 5604. [Google Scholar] [CrossRef]
  45. Parhoudeh, S.; Eguía López, P.; Kavousi Fard, A. Stochastic Scheduling of Grid-Connected Smart Energy Hubs Participating in the Day-Ahead Energy, Reactive Power and Reserve Markets. Smart Cities 2024, 7, 3587–3615. [Google Scholar] [CrossRef]
  46. Peres, W. A Probabilistic Load Flow for Unbalanced Three-Phase Islanded Microgrids Using Unscented Transformation. Int. J. Electr. Power Energy Syst. 2024, 155, 109554. [Google Scholar] [CrossRef]
  47. Gholami, K.; Jazebi, S. Multi-Objective Long-Term Reconfiguration of Autonomous Microgrids through Controlled Mutation Differential Evolution Algorithm. IET Smart Grid 2020, 3, 738–748. [Google Scholar] [CrossRef]
Figure 1. Schematic of 33-bus microgrid with buses represented as circles labeled 1 to 33.
Energies 17 06442 g001
Figure 2. Forecasted values of PV resources.
Energies 17 06442 g002
Figure 3. Forecasted active power of microgrid (the color spectrum enhances visualization).
Energies 17 06442 g003
Figure 4. Forecasted reactive power of microgrid (the color spectrum enhances visualization).
Energies 17 06442 g004
Figure 5. Forecasted electricity market price.
Energies 17 06442 g005
Figure 6. Average voltage of microgrid for different cases.
Energies 17 06442 g006
Figure 7. OLTC operation for different cases.
Energies 17 06442 g007
Figure 8. Scheduling of EVAs.
Energies 17 06442 g008
Figure 9. Reactive power scheduling of PV inverters.
Energies 17 06442 g009
Figure 10. Scheduling of DGs.
Energies 17 06442 g010
Figure 11. Scheduling of electrolyzer (P2H) and fuel cell (H2P).
Energies 17 06442 g011
Figure 12. The network configuration in Case 3.
Energies 17 06442 g012
Figure 13. The network configuration in Case 4.
Energies 17 06442 g013
Table 1. EVAs’ specification.
EVA Capacity (kWh)Charge/Discharge (kW)
minmaxminmax
1502000200200
2502000200200
Table 2. EVAs’ trip specification.
EVA Trip 1Trip 2
DepartureArrivalDepartureArrival
TimeBusTimeBusTimeBusTimeBus
181492418241914
2839271827193
Disclaimer/Publisher’s Note: The statements, opinions and data contained in all publications are solely those of the individual author(s) and contributor(s) and not of MDPI and/or the editor(s). MDPI and/or the editor(s) disclaim responsibility for any injury to people or property resulting from any ideas, methods, instructions or products referred to in the content.

