1. Introduction
In the last years, energy communities (EC) have emerged in several EU countries; however, currently, energy markets are still dominated by traditional actors [
1]. The Clean Energy Package, more precisely the recast of the Renewable Energy Directive (RED-II) and the Electricity Market Directive, provides the legal playground for “Renewable Energy Communities (RECs)” and “Citizen Energy Communities (CECs)”, enabling new actors to become viable players in the energy market. The national transposition is up to the member states, and the regulatory frameworks differ quite widely in the EU at the moment. Proposed supporting financial mechanisms include net metering, local grid tariffs, or direct subsidies. Moreover, different regulatory limitations regarding the size, location, and membership are defined by the member states [
2].
Several papers analyze the status of the regulatory framework of energy communities. These papers mostly focus on the transposition status, the boundary conditions, such as the locality of the energy community, and potential challenges. Tarpani et al., for example, compare the implementation status between pioneer and laggard countries with the example of Italy and the Netherlands [
3]. Losada-Puente et al. analyze the progress and barriers for energy communities in Spain, Italy, and Greece [
4]. Krug et al. evaluate the progress, delays, and gaps in implementation frameworks for energy communities in nine different countries [
5]. Frieden et al. [
2] and Comodi et al. [
6] analyze the status of energy communities and collective self-consumption schemes in the European Union, while Cejka et al. [
7] qualitatively compare different grid tariffs. Other studies have conducted quantitative calculations regarding the economic feasibility of energy communities [
8,
9,
10,
11]. De la Hoz et al. analyze the economic impact of different regulatory frameworks, such as feed-in tariffs, net metering, and self-consumption schemes on the economic feasibility of energy communities [
12]. Barbaro and Napoli compare the economic feasibility of an energy community in Italy and Spain, highlighting higher economic benefits in the Italian set-up [
13]. Eisner et al. simulated the economic feasibility for different sharing keys for Austria [
14].
On one side, the literature suggests that energy communities are suited to unburden the grid [
15]; on the other side, authors are more cautious given the current regulatory frameworks and question the over-promotion of energy communities by lowering community grid tariffs too much without having a clear understanding of grid and cost impacts [
16,
17]. Indeed, limited evidence is available on energy communities unburdening the grid and, in general, on the interactions between energy communities and energy markets [
18]. While independence from market prices is often claimed as a benefit of energy communities [
19], also the clear market dependency of the internal price formation of energy communities is acknowledged in the literature [
20]. Overall, there is no comprehensive picture of how internal price formation is made in practice and how strong these market dependencies are.
While previous studies have examined the status of national regulatory frameworks for energy communities and others have assessed economic case studies, few have combined both. This research seeks to fill this gap by combining the analysis of regulatory frameworks across EU member states with the impact on the savings of energy communities. Moreover, not only the savings but also the resilience to market volatility as well as potential electricity grid benefits of energy communities are assessed. To address this objective, three hypotheses were formulated. H1: National support schemes impact the savings of energy communities to different degrees. H2: Energy communities allow for increasing resilience towards electricity price market volatility. H3: Energy communities bring electricity grid benefits to the electricity grid. The findings hold practical implications for policymakers by highlighting the impact national incentive schemes have on the savings of energy communities and could potentially guide countries without a national incentive scheme at the moment towards suitable strategies. In summary, this research contributes to the field by providing a deeper understanding of the impact of the national regulatory incentive scheme for energy communities, giving insights into the impact on savings, resilience to market vitality, as well as grid benefits. These insights could guide future developments for national incentive schemes for energy communities.
The following section presents an overview of regulatory frameworks for energy communities in EU countries.
Section 2 presents the underlying data as well as the applied methodology regarding the calculation of the economic feasibility of the energy community in the set-up under different national regulations.
Section 3 presents the results and
Section 4 the discussion.
Section 5 highlights the conclusions of this paper.
2. Overview of Regulatory Frameworks for Energy Communities in EU Countries
All member states have transposed energy communities and collective self-consumption into their national law, in a very diverse manner and with strongly differing levels of detail. In a few member states, such as Croatia or Bulgaria, basic legislation is in place, but details are missing, not yet allowing for an implementation of energy communities. A few countries, such as Spain, focus on collective self-consumption concepts beyond the building level rather than on energy communities in their national framework [
2].
While the Clean Energy Package requests the proximity of members to the production facilities, different approaches have been taken. Some member states have defined proximity alongside grid typologies, others via administrative boundaries, or spatial limitations. A few member states have introduced specific support schemes, such as a reduction in grid fees, while many member states have subsidies for specific technologies only.
Table 1 highlights a possible connection between the physical boundaries of an energy community and national support schemes. Energy communities that are defined along boundaries on grid levels can reduce grid fees with the argument that higher grid levels are not used. In the table below, n.a. refers to countries without a national incentive.
While Sweden has not yet transposed the EU energy community provisions, in Bulgaria, Cyprus, Denmark, Germany, Malta, Slovakia, Finland, Estonia, the Netherlands, and Romania, detailed provisions are still missing.
Reduced grid fees fulfil the requirements for member states to set cost-reflective tariffs and should not be seen as subsidies for energy communities. In practice, energy community deployment is the driver for setting such tariffs.
The table above shows the heterogeneity across countries. In most member states, frameworks were introduced several years ago. In some countries these are regularly updated, such as in Spain, where the radius for collective self-consumption has been widened over time. In Greece, the virtual net metering scheme for energy communities was abandoned in 2024 and replaced by a 15 min net billing scheme for households and energy communities, which is less advantageous in terms of energy cost savings (Law 5106/2024).
In addition, other framework conditions impact the savings of energy communities, such as the energy-sharing key. For energy communities, most countries have proposed static and dynamic sharing coefficients (Austria, Portugal), and some have variable sharing coefficients that are set ex ante (Spain). Static coefficients mean the allocation of energy is fixed for participants, independent of their actual energy needs; variable coefficients take into account forecasted demand patterns, while dynamic coefficients are based on real-time data and specific allocation formulas, improving self-sufficiency and economic performance. A few countries have only static coefficients so far and will move to dynamic ones in the future (Czech Republic, Finland). While in a range of EU countries energy sharing is already operationalized, only a few EU countries, such as Belgium, allow peer-to-peer trading.
An emerging trend that can be observed is the linkage of collective self-consumption schemes, or energy communities, to larger interconnected trading systems, expanding the scope, reducing the cost, and making consumers more independent of individual suppliers. In 2024, Austria introduced a scheme for the participation in up to five renewable citizen energy communities. The Czech energy law adopted in 2024 established sharing groups (located within the territory of three neighboring municipalities) that can be under the umbrella of a larger energy community.
Based on the presented assessment, Austria, France, Italy, Portugal, and Spain were chosen as exemplary countries for further assessment, as those countries set their boundary conditions alongside the grid topology, allowing them to apply a grid fee-related incentive scheme. Moreover, the regulation has been in place in these countries for some period, allowing energy communities to form. Austria defines the physical boundaries for RECs according to the LV/MV; Italy extends it to include HV, while in France a distance of 20 km is set for collective self-consumption. In Spain, CSC is limited to 2 km, while in Portugal the physical boundaries depend on the system relation. Other countries that set their boundaries according to the grid topology do not yet have clear incentives for energy communities and were therefore disregarded.
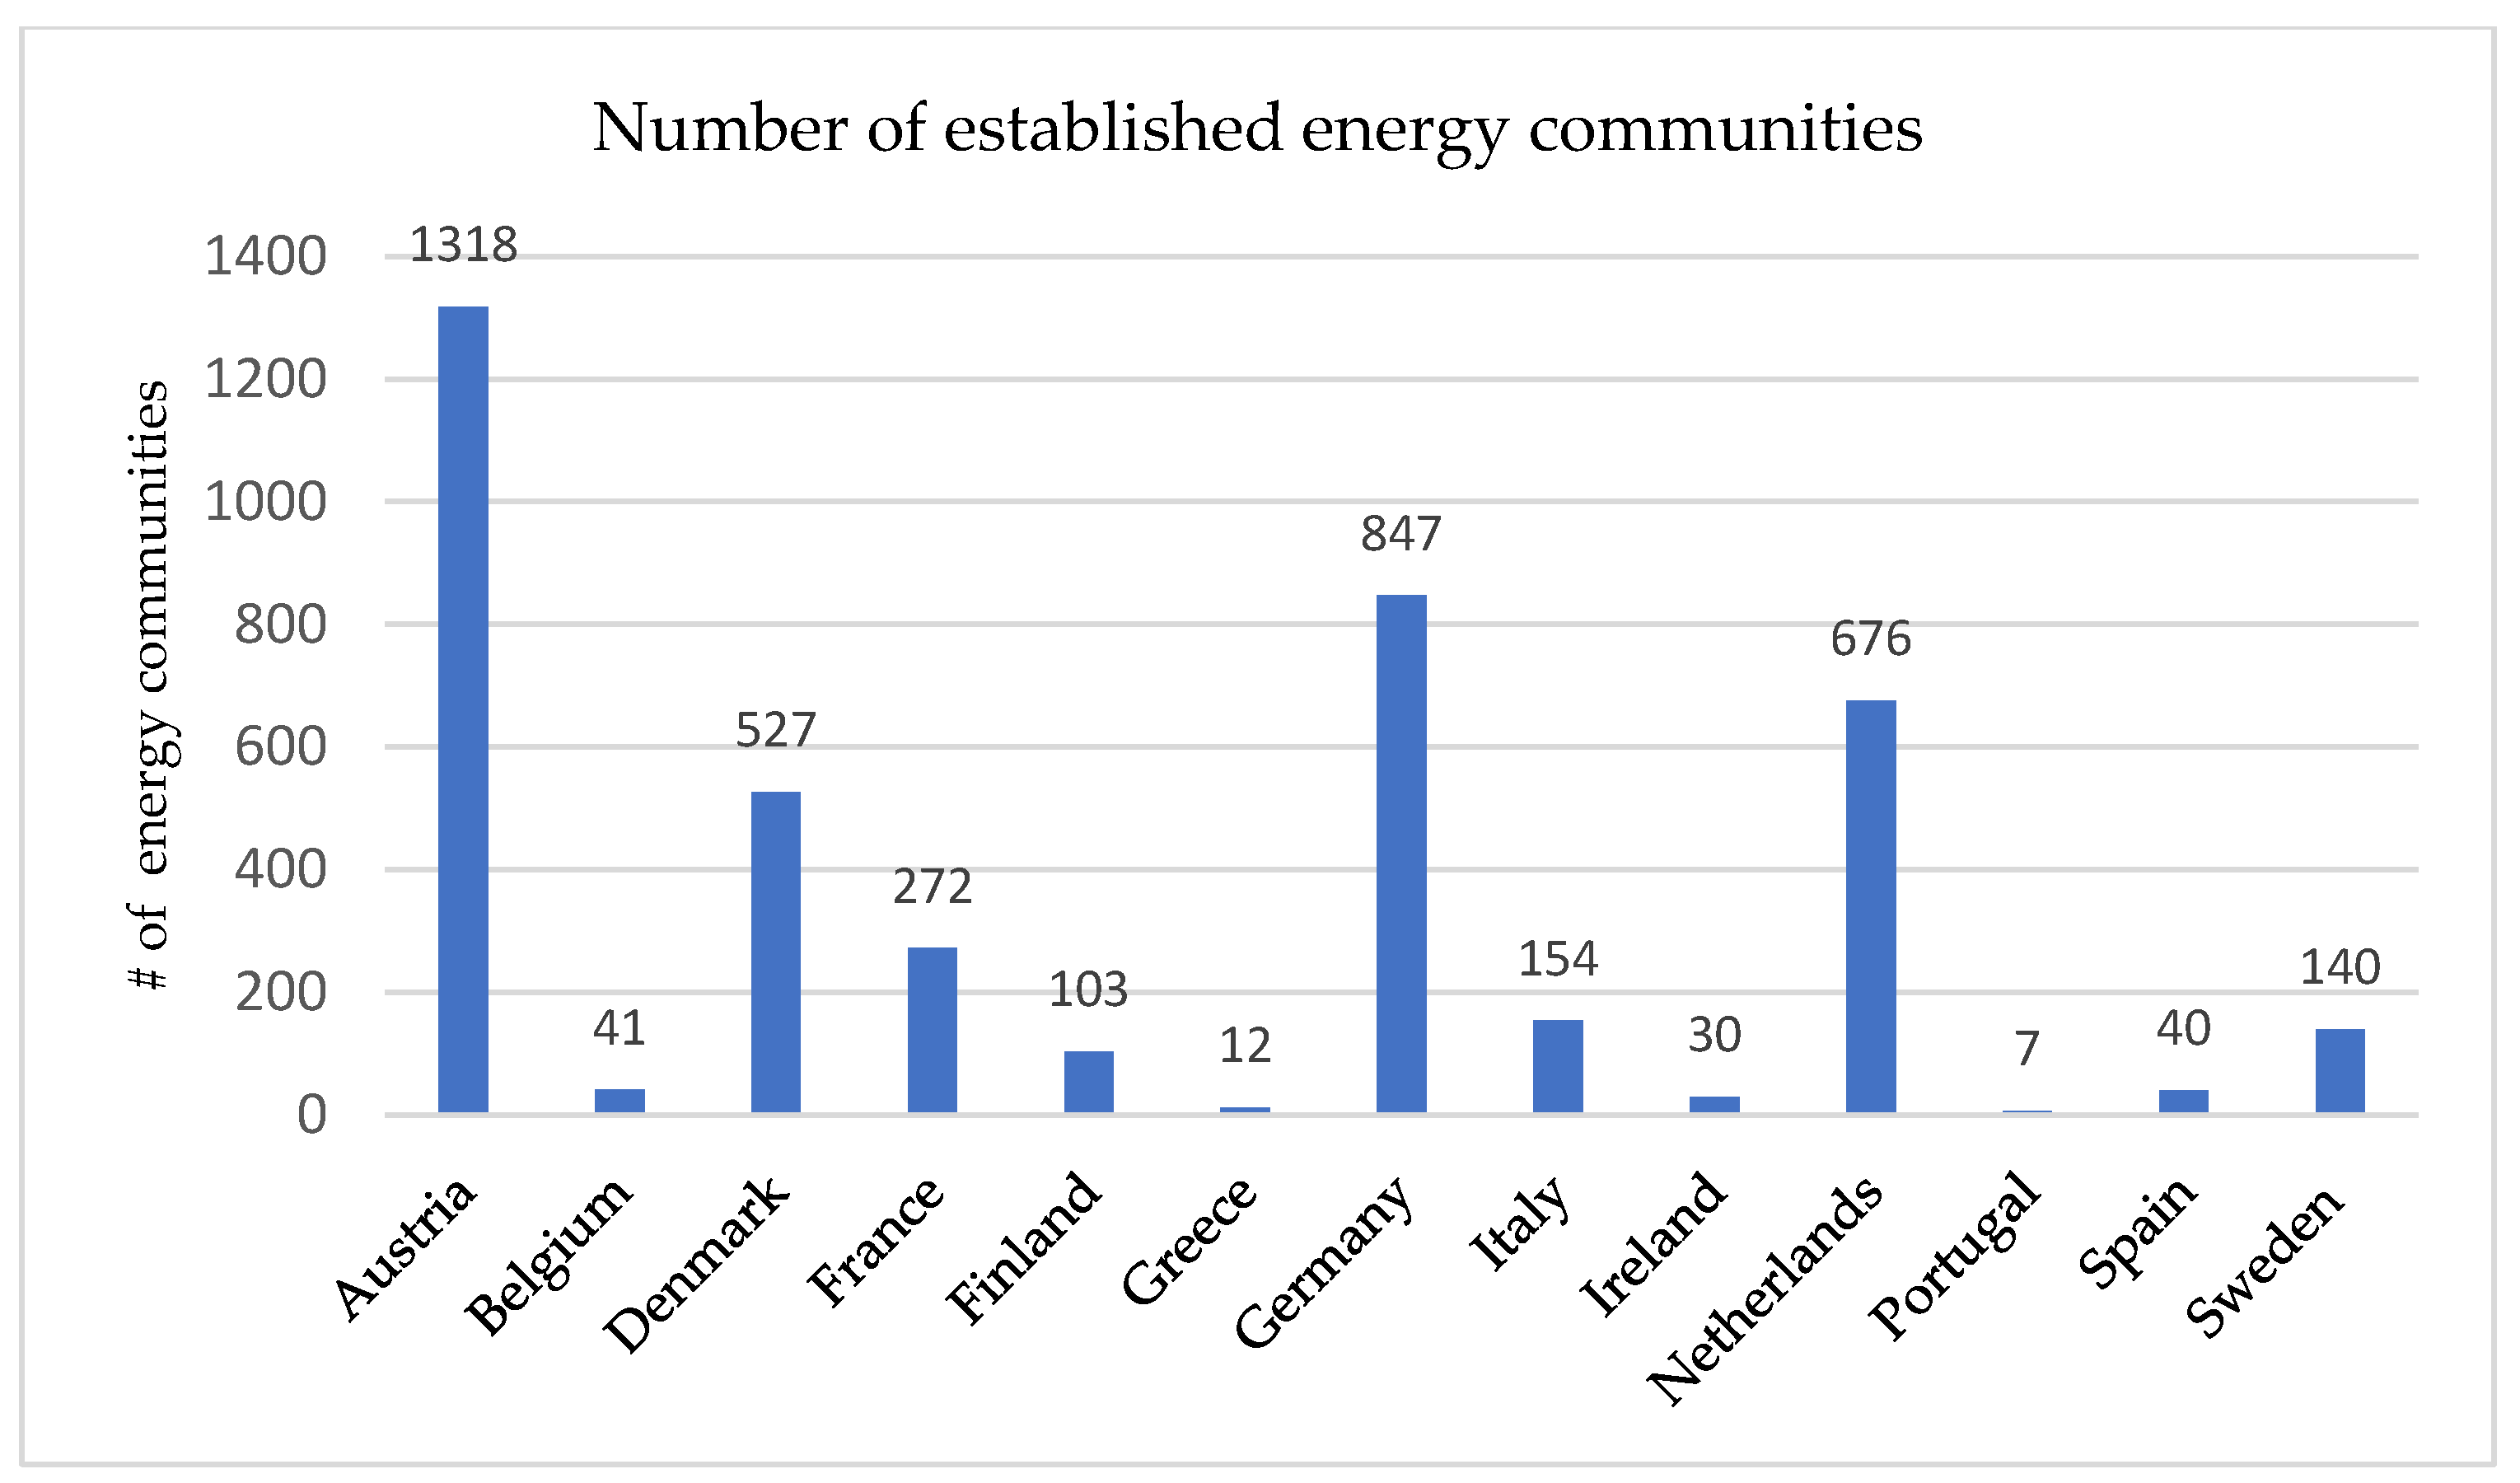
The analysis highlights that the implementation status as well as the legislations of national policies for energy communities vary quite widely, which could also explain the difference in the number of energy communities established in different member states.
Figure 1 presents an overview of the number of energy communities for EU countries, where energy communities are already taking off. Austria has the highest number of energy communities, with over 1300 energy communities [
21]. France, Sweden, Finland, and Italy have established over 100 energy communities or collective self-consumption schemes [
22,
23,
24]. Germany, the Netherlands, and Denmark have over 500 energy communities [
24]. In Spain, Belgium, Greece, Ireland, and Portugal, energy communities are just picking up [
24]. Zooming in on the countries assessed in this paper, the figure suggests that the environment for energy communities is friendlier in Austria, France, and Italy in comparison to Spain and Portugal.
The following sections give a closer look into the national framework of selected countries and assess the economic incentives for energy communities.
2.1. Austrian Regulatory Framework
In Austria, RECs can either be local (network behind the low voltage transformer) or regional (network behind the medium voltage transformer). On the local level, a reduction in the grid tariff of 57% and, on the regional level, a reduction of 28% are applicable, incentivizing the formation of energy communities [
25]. The renewable energy surcharge, being part of the grid tariffs, is, however, currently omitted for all consumers since the beginning of the energy crisis, slightly reducing the relative benefits from a REC. As most energy communities have a rather low self-sufficiency, the Austrian regulator stated in 2024 that there are no clear electricity grid benefits yet visible in terms of grid unburdening while Austria had over 400 energy communities by the middle of last year [
26].
Starting April 2024, it is permitted for energy community members to join up to five different energy communities. The combination of all types of energy communities is allowed (CECs and RECs (local and regional)) and settled by the means of a participation factor. Participation in several different energy communities allows increasing the self-consumption ratio and may make consumers more independent from a specific supplier [
27].
The price structure for Austria reveals a high difference between the electricity price and the revenues for excess electricity as shown in
Table 2.
In Austria, there is no discussion yet on local flexibility markets; however, a transition to more capacity-based tariffs has been ongoing. Austria was strongly hit by the energy crisis in 2021/2022 with high electricity prices. While the government took measures to limit the electricity prices for consumers, the revenue for surplus electricity was high and more favorable for producers than selling electricity to an energy community.
2.2. French Regulatory Framework
In 2021, France implemented Ordinance n° 2021-236 [
30] establishing the legal framework for RECs and CECs. Energy sharing is enabled as part of the collective self-consumption scheme, which was introduced under Article L315-2 of the energy code [
31].
To promote the uptake of such schemes, a special grid tariff (TURPE) is introduced, reducing the grid costs for collectively self-consumed electricity, however raising the grid costs for electricity consumed from the grid. This sets the incentive to dimension the photovoltaic (PV) unit in a way to cover most of the demand. CSC members can choose between the normal grid tariff and this special grid tariff. The TURPE is defined according to four different periods as visualized in
Table 3.
Table 4 presents the TURPE for a consumer (CU4) and the TURPE for a member of a collective self-consumption scheme. Within the self-consumption scheme, the TURPE is divided into:
TURPE for the electricity from the grid (CU4 collective, part from the grid)
TURPE for the electricity collectively consumed (CU4 collective, part self-consumed)
The management component for collective self-consumption installations is increased for all participants without a PV system to 20.64 EUR/year (from 16.56 EUR/year) without VAT. For prosumers, this rate is increased to 24.26 EUR/year [
34].
Table 5 presents the electricity costs for France. The grid costs include the abovementioned TURPE as well as the electricity tax TIFCE.
2.3. Italian Regulatory Framework
In 2020, Italy set-up an incentive scheme targeting self-consumption of renewable energy sources (RES) geographically limited to the same medium voltage/low voltage substation or at a condominium level (collective self-consumption (CSC) of RES). In both cases, within a “virtual” model, RECs and CSC schemes can join and exchange electricity through the public low-voltage electricity network. As part of this legislation, the boundaries for energy communities were extended to the medium voltage/high voltage substation, and the size of the RES plant was increased to 1 MW. In 2024, the law was updated.
The distribution system operator evaluates the shared energy, and the economic incentive for the REC is calculated [
38]. Italy introduced a premium tariff for collective self-consumption schemes and energy communities with installations up to 1 MW. This premium tariff is paid for each kWh of self-consumed energy from the Gestore dei Servizi Energetici (GSE) to the energy community, which is recognized for 20 years and has a value of between 60 EUR/MWh and 120 EUR/MWh, depending on the size of the plant and the market price of the energy. As a sliding premium, a higher incentive is paid to the EC in case market prices for excess electricity drop, reducing the financial risk of an energy community. The structure of this incentive therefore reduces the risk, as a minimum incentive is guaranteed over 20 years, while the variable part allows minimizing market fluctuations. Incentives of 4 EUR/MWh for central Italian regions and 10 EUR/MWh for Northern Italian regions are added, respectively, to make up for lower solar irradiation. Additionally, a refund of 8.48 EUR/MWh is offered for each hour of self-consumed electricity to account for the reduction in costs to balance the grid. EC can therefore share electricity under the same medium voltage/low voltage substation using the public grid, paying normal grid tariffs while receiving remuneration for each kWh self-consumed. The total incentive is paid on an annual incentive to the community, and the community can decide how to share it. The EC must ensure that any surplus from the support tariff is used exclusively for the benefit of consumers other than businesses and/or for social purposes that have an impact on the areas in which the installations are located.
The costs for electricity for 2024 in Italy are presented in
Table 6 [
39].
2.4. Portuguese Regulatory Framework
The Portuguese legislator has started the transposition of the EU framework introducing RECs and CSC schemes in Decree Law 162/2019 [
42] and further refined in Decree-Law15/2022 [
43]. With this legislation, the Portuguese government renewed the previous regulatory framework on individual self-consumption, introducing the concepts of RECs and CSC. As RECs are defined as part of this CSC framework, their scope is currently limited to generation and self-consumption of electricity.
Collective self-consumption is exempt from the CIEG (a surcharge related to general economic interest cost), which is normally part of the grid tariff [
44]. The CIEG exemption is either 50%, in the case of individual self-consumption, or 100%, in the case of collective self-consumption. The costs for electricity for 2024 in Portugal are presented in
Table 7.
2.5. Spanish Regulatory Framework
Collective self-consumption was introduced in the Spanish Royal Decree 244/2019; for shared energy within an energy community, no taxes are paid, and grid fees are set to zero (Article 17 [
1] and Article 18 [
2]) [
47]. CSC schemes must fulfil the following requirements according to Article 3:
Their low-voltage distribution lines must be connected to the same secondary substation (low voltage to medium voltage),
Both production and consumption connection points must be within a geographical range of 500 m,
Their cadastral reference must be under the same sector (first 14 digits).
With the Royal Decree 20/2022, the geographical range was expanded to 2.000 m only for PV systems on the roofs of one or more buildings, industrial areas, or artificial structures whose main objective is not electricity generation. This may lead to cases where two potential participants are in proximity but registered in two different sectors and hence are not able to form a CSC. With the Royal Decree 23/2020 [
48], Spain has introduced a regulation for RECs, and with the Royal Decree 5/2023, Spain has introduced a regulation for CECs but without providing many details. A royal decree providing all the details for RECs and CECs was published for consultation in 2023, pending approval.
Spain’s electricity tariff is composed of an energy term that is paid for the total volume consumed and a power term defined by the highest peak in a year for off- and on-peak times (on-peak 08:00–0:00, off-peak 1:00–07:00, and weekends). It is therefore beneficial to reduce consumption/generation peaks. For the volumetric grid costs, P3 is on weekends from 00:00–24:00 and weekdays from 00:00 to 08:00; P2 is from 08:00–10:00, 14:00–18:00, and 22:00–00:00; and P1 is from 10:00–14:00 and 18:00–22:00.
Table 8 presents the electricity price composition in Spain.
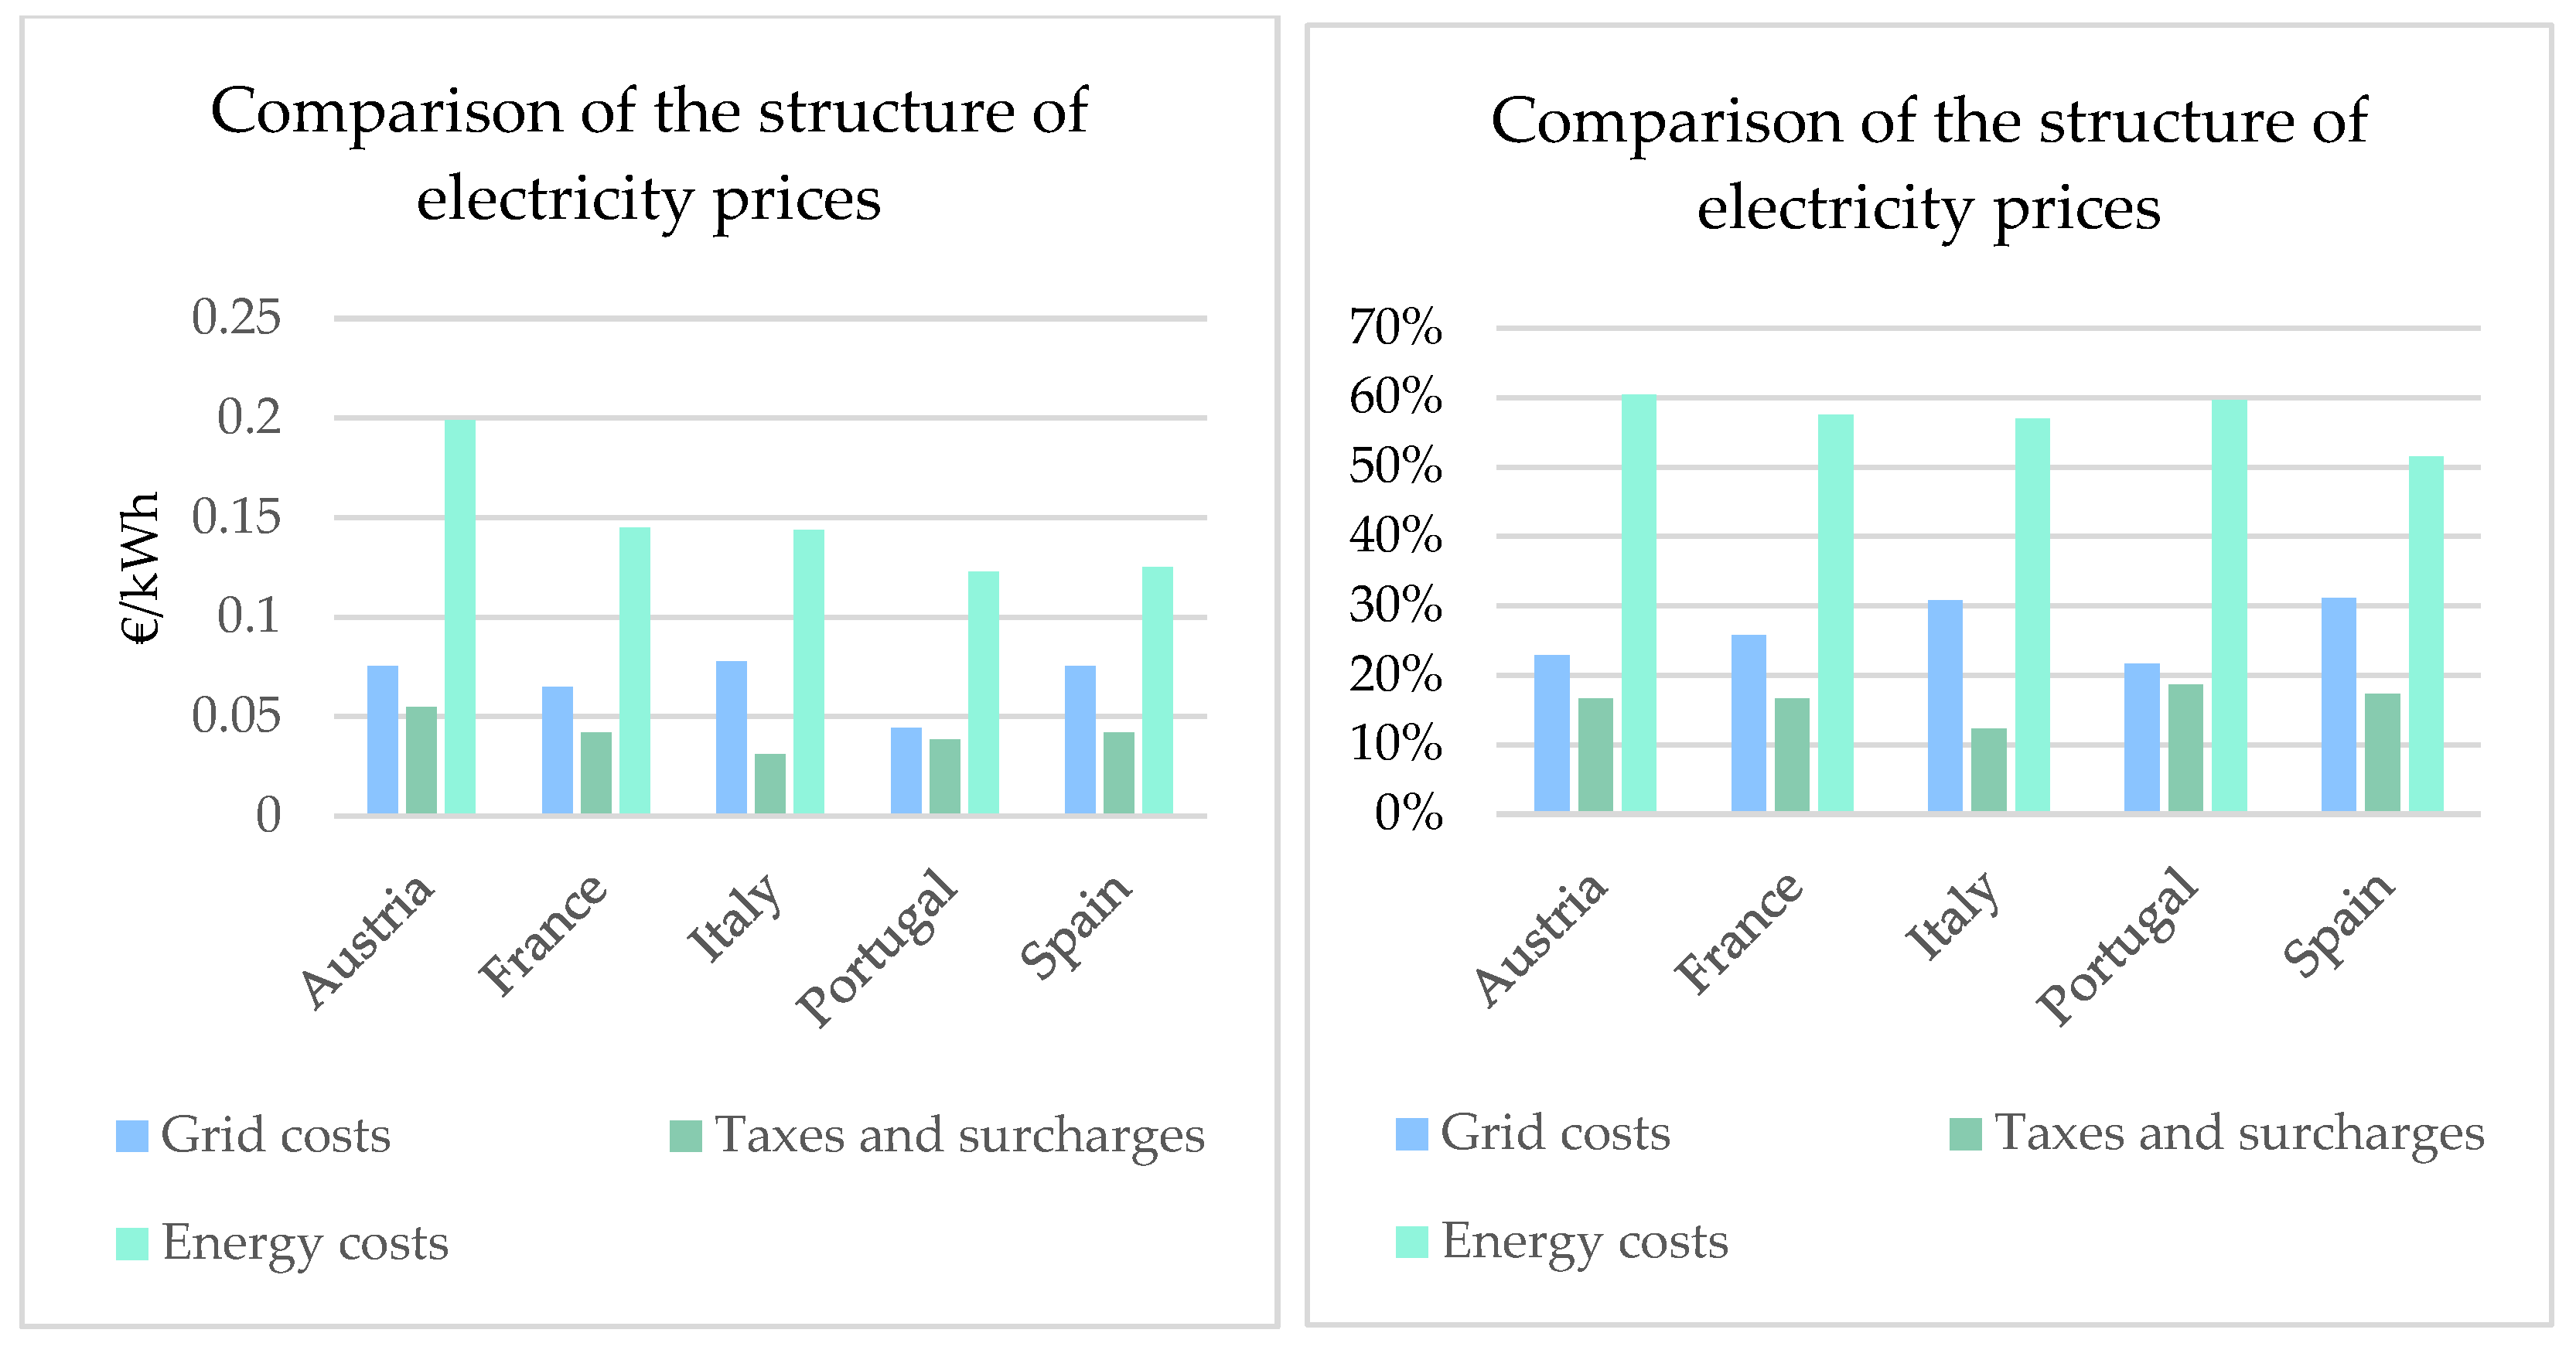
2.6. Comparison of the Structure of Electricity Prices
This section presents an overview of the electricity tariff structure in different countries (
Figure 2). This is essential for the incentive design as well as for the possible savings for energy communities without national incentives, solely due to lower production costs of PV. For this comparison, the volumetric as well as the capacity-based parts of the electricity costs are regarded. It should be mentioned that only energy-related expenses are considered, and no additional fees that are combined with the electricity bill are included.
The grid tariffs make up between 22% (0.04 EUR/kWh) and 31% (0.08 EUR/kWh) of the electricity bill. This is of interest as it highlights the potential savings a reduction in grid costs can entail. If grid costs only make up a small percentage of the overall electricity costs, the potential savings are limited. While a reduction in grid costs can set an incentive to form an energy community, the reduction should also reflect the benefits an energy community brings to the grid. While the Austrian grid operator did not find any benefits of energy communities for the electricity network [
26], in Belgium benefits are identified in the form of shifting their demand (EVs, electric heating) towards times with PV production in the energy community and therefore reducing the induced peak [
51]. The degree of reduction in the contribution to peak (in average number of kW per participant) is a still uncertain parameter.
Taxes and surcharges account for 12% to 27% of the overall electricity bill. In general, it is visible that the biggest part of the energy costs relates to the energy costs. This highlights the impact a change in the cost of energy, such as in 2022, has on the overall bill. It also emphasizes the possibility of energy communities to generate electricity at lower costs. A study by Santecchia et al. simulates the levelized cost of electricity (LCOE) for different generation types in EU countries [
52]. For solar PV, which is the predominant source of electricity within an energy community, the LCOE for Austria is 130 EUR/MWh, for France 101 EUR/MWh, for Italy 91 EUR/MWh, for Portugal 71 EUR/MWh, and for Spain 69 EUR/MWh. The difference between the LCOE and the energy costs paid from the grid is the savings for energy communities that can be achieved without an additional incentive. Forecasts show that in 2040, the LCOE will be between 3.58 and 6.77 c/kWh for small rooftop systems [
53], potentially creating higher benefits if the level of market prices stays constant. The diverse LCOE for solar PV in the countries also indicates a different level of needed incentives.
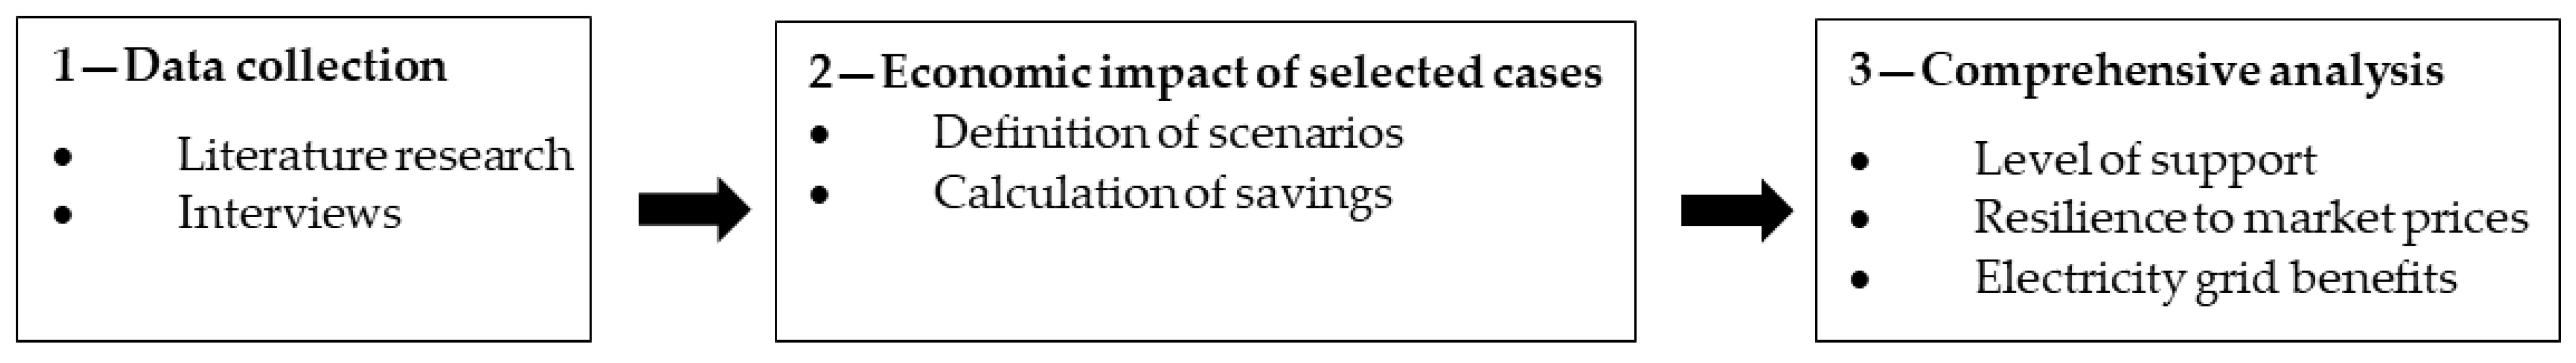
3. Materials and Methods
Figure 3 presents the methodological steps undertaken in this paper. In the first step, data regarding regulatory frameworks for energy communities in EU countries as well as electricity price composition were collected by means of a literature research, interviews with research partners from the EU Horizon Projects COMPILE and DECIDE as well as energy communities across the EU.
In the second step, the economic feasibility study of selected use cases was conducted, including the definition of different scenarios and the calculation of savings for the community and individual members. Based on the information gathered within the first two steps, the level of support, the resilience to market prices, as well as the electricity grid benefits of energy communities were analyzed and validated. Resilience to market prices is defined as the possibility of energy communities to offer electricity prices as well as revenues for excess electricity that are decoupled from market prices. To assess the resilience to market prices, an indicator that highlights the percentage of the savings of the energy community that is resilient to changes in the market prices. This part relates to the national incentives that are usually fixed over a longer period of time and therefore stay constant even if market prices change.
To assess the impact of the regulatory frameworks on the economic feasibility of an energy community, an exemplary energy community (
Table 9) is introduced. Data is taken from the COMPILE project [
54]. The energy community consists of nine members, of which seven are residential members and a library and a kindergarten. Five members own a PV system. This set-up was chosen to represent a typical energy community, based on insights from different European projects we were involved in, such as COMPILE and DECIDE. PV is the most common source of electricity within an energy community, and households are the main members of an energy community. Approximately half of all members own a PV, with a regular size of 5 kWp and the kindergarten with 30 kWp. Moreover, two public entities were included to have more heterogeneous load profiles.
Energy is shared between the members according to a dynamic sharing coefficient, which is based on the hourly individual demand (Demand_ind) and the hourly energy community demand (demand_EC) at time t. The same principle holds true for the supply, determining who is allowed to sell what amount of their excess electricity to the energy community in a given hour.
Two different scenarios are calculated. The electricity demand stays constant for scenario 1 and scenario 2. In scenario 1, all parameters but the regulatory incentives (
Table 10) for an energy community are the same for all countries. This scenario allows singling out the heterogeneous impact related to the regulatory frameworks.
Table 11 and
Table 12 present the country-specific parameters for scenario 1. The electricity tariff in scenario 1 is 0.289 EUR/kWh (EU average household electricity price 2023) [
55]; the grid fees are 0.1445 EUR/kWh, and the revenues for surplus are 0.089 EUR/kWh (average EU wholesale electricity price) [
56]. The grid fees are the difference between the wholesale market price of 0.089 EUR/kWh and the electricity price without taxes (0.24 EUR/kWh). The yearly irradiation for Spain with 1 717 kWh/kWp/year is assumed for all countries. The EC electricity price states the price that EC members have to pay for exchanged energy. The EC revenues for surplus electricity state the price prosumers receive from the EC for exchanged energy. While there is a big difference between the electricity price and the revenues for excess electricity, the actual benefits are minor. This is due to the fact that there are quite high grid fees (0.14 EUR/kWh) in place limiting the benefits. As the incentive in Italy does not relate to the grid fee but to the amount of self-consumed energy, higher savings can be achieved. The grid costs in scenario 1a are reduced according to the absolute reduction as foreseen in the national regulatory frameworks or, for the Italian case, the absolute value for exchanged electricity. Grid costs in scenario 1b are reduced according to the percentage reduction to the local grid tariff as foreseen in the national regulatory frameworks. For both scenarios 1a and 1b, the national absolute national incentives are the bases for calculation. The percentage approach is applied to account for different levels of the national electricity costs.
In scenario 2, the surrounding parameters of the specific country are regarded to assess the country-specific economic feasibility of the energy community. The yearly irradiation is based on hourly data obtained via PV GIS.
Table 13 highlights the differences regarding the shared electricity, electricity prices, revenues for surplus energy, and the implications for the energy community in scenario 2.
For both scenarios, only the impact of the volumetric grid charges is regarded.
4. Results
This section presents the results of the economic feasibility of the previously introduced energy community. The first subsection presents the savings for the energy community without a national incentive. Revenues solely relate to the span between the electricity price, the revenues for surplus electricity, as well as the grid fees. In scenario 1, all external parameters are kept constant to highlight the difference of the impact of the incentive. In scenario 1a the absolute reduction is considered, while in scenario 1b percentage reductions are used to account for lower price levels of countries. Scenario 2 takes country-specific parameters into consideration.
4.1. Savings Without Considering National Incentive Schemes
Before diving into the exemplary assessment of the impact of national incentives on energy communities, this subsection describes the benefits for energy communities without national incentives.
The savings of an energy community are described in the following formula:
Electricity costs refer to the electricity costs energy community members pay for electricity from the grid; grid fees include all fees that have to be paid when exchanging electricity within the community, and revenues for surplus electricity refer to the revenues prosumers get for feeding electricity into the grid. The higher this difference is, the higher the savings are. Low grid tariffs for the exchanged electricity within the EC therefore benefit the community. The electricity price and the revenues for the excess electricity do not necessarily correlate, as many households do not yet have variable grid tariffs; a change in one of the two affects the overall savings.
Table 14 sets this span into the context of the analyzed countries. It is visible that Austria comes with the highest span, followed by Portugal and Italy. The span can either be increased by a big difference between the electricity price and the revenues for excess electricity or by low grid costs. It could be argued that countries with a higher span may need lower national incentives. It should, however, be mentioned that the span is usually dependent on market prices and therefore may change, while the national incentives should provide benefits over a longer period and therefore reduce the risk. Savings of 100 EUR/year for the energy community members is reached for all but one member without an incentive in Portugal and Austria, while in Italy and Spain three members do not reach 100 EUR/year. In France, six members do not reach savings of 100 EUR/year due to a low gap between the electricity price and the revenue for excess electricity as well as a low solar irradiation.
4.2. Results Scenario 1
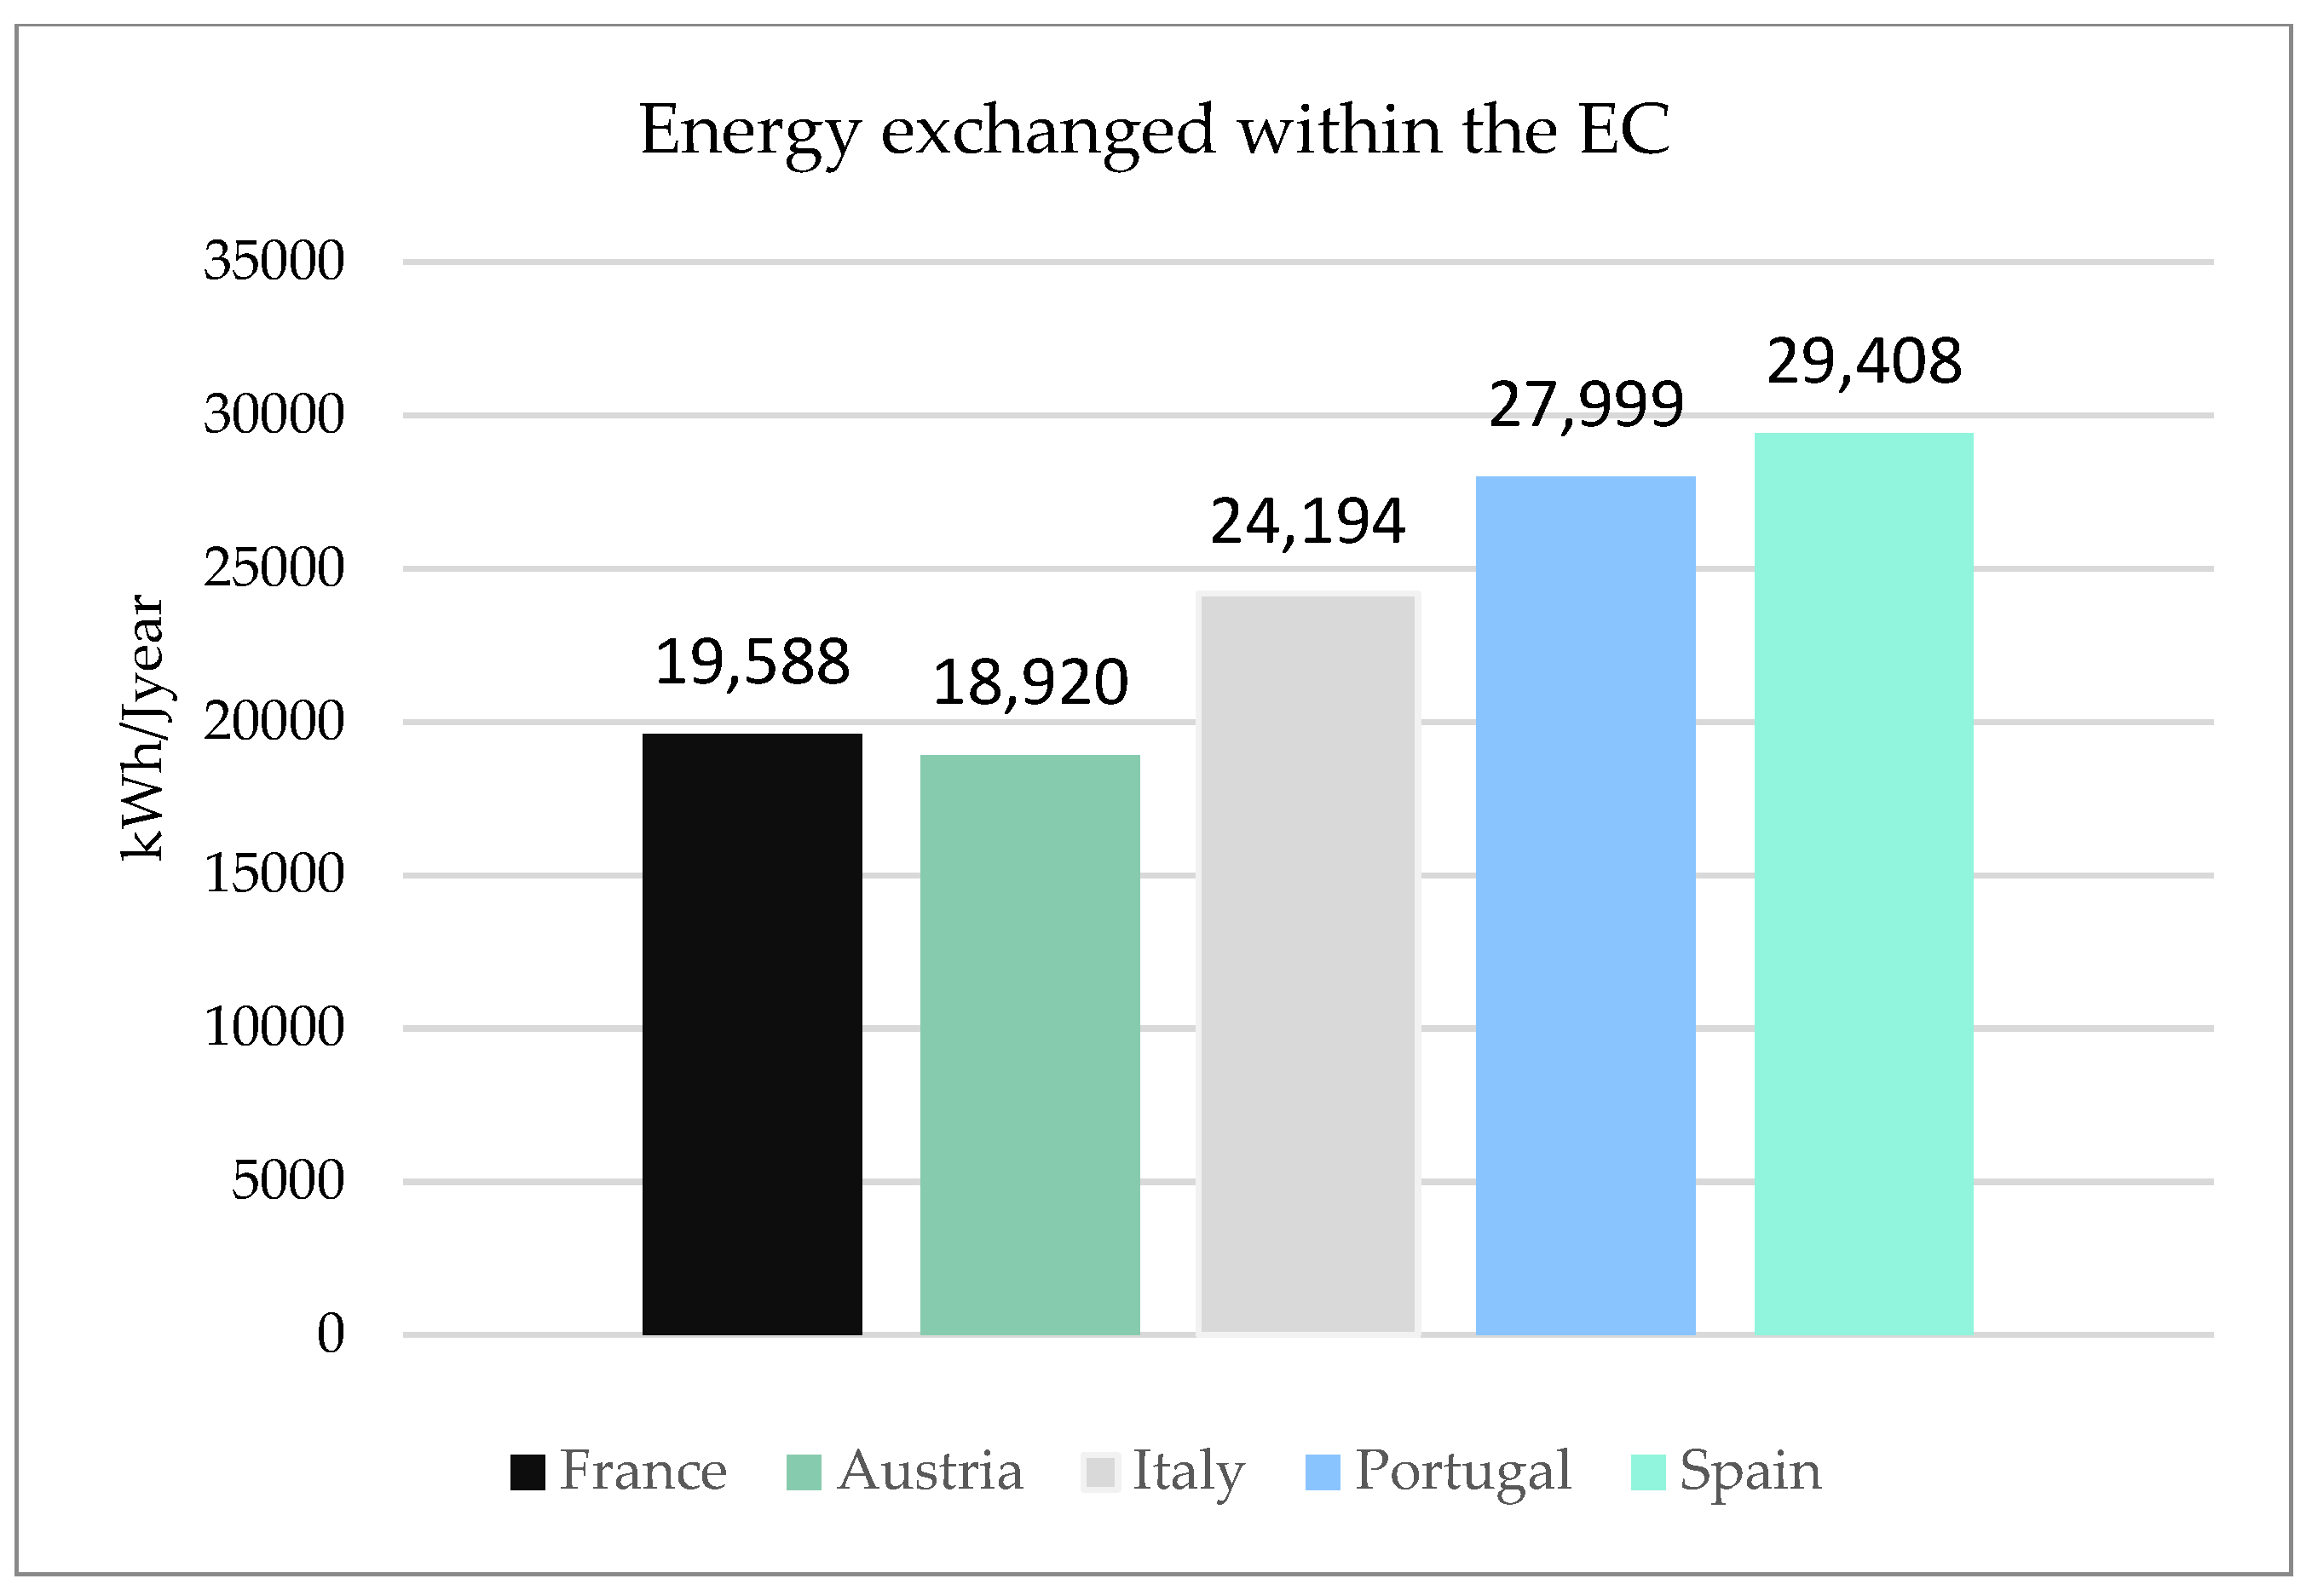
This section presents the results of scenario 1, in which only the regulatory incentives vary for each country. This aims to compare the impact of the different national incentives for energy communities. The electricity flows do not differ by country, as the same irradiation is considered for all. Within the community, 29,408 kWh/year of electricity are exchanged, 64,918 kWh/year are consumed from the grid, and 22,153 kWh/year are fed into the grid. The self-consumption ratio is 57%, and the self-sufficiency ratio is 31%.
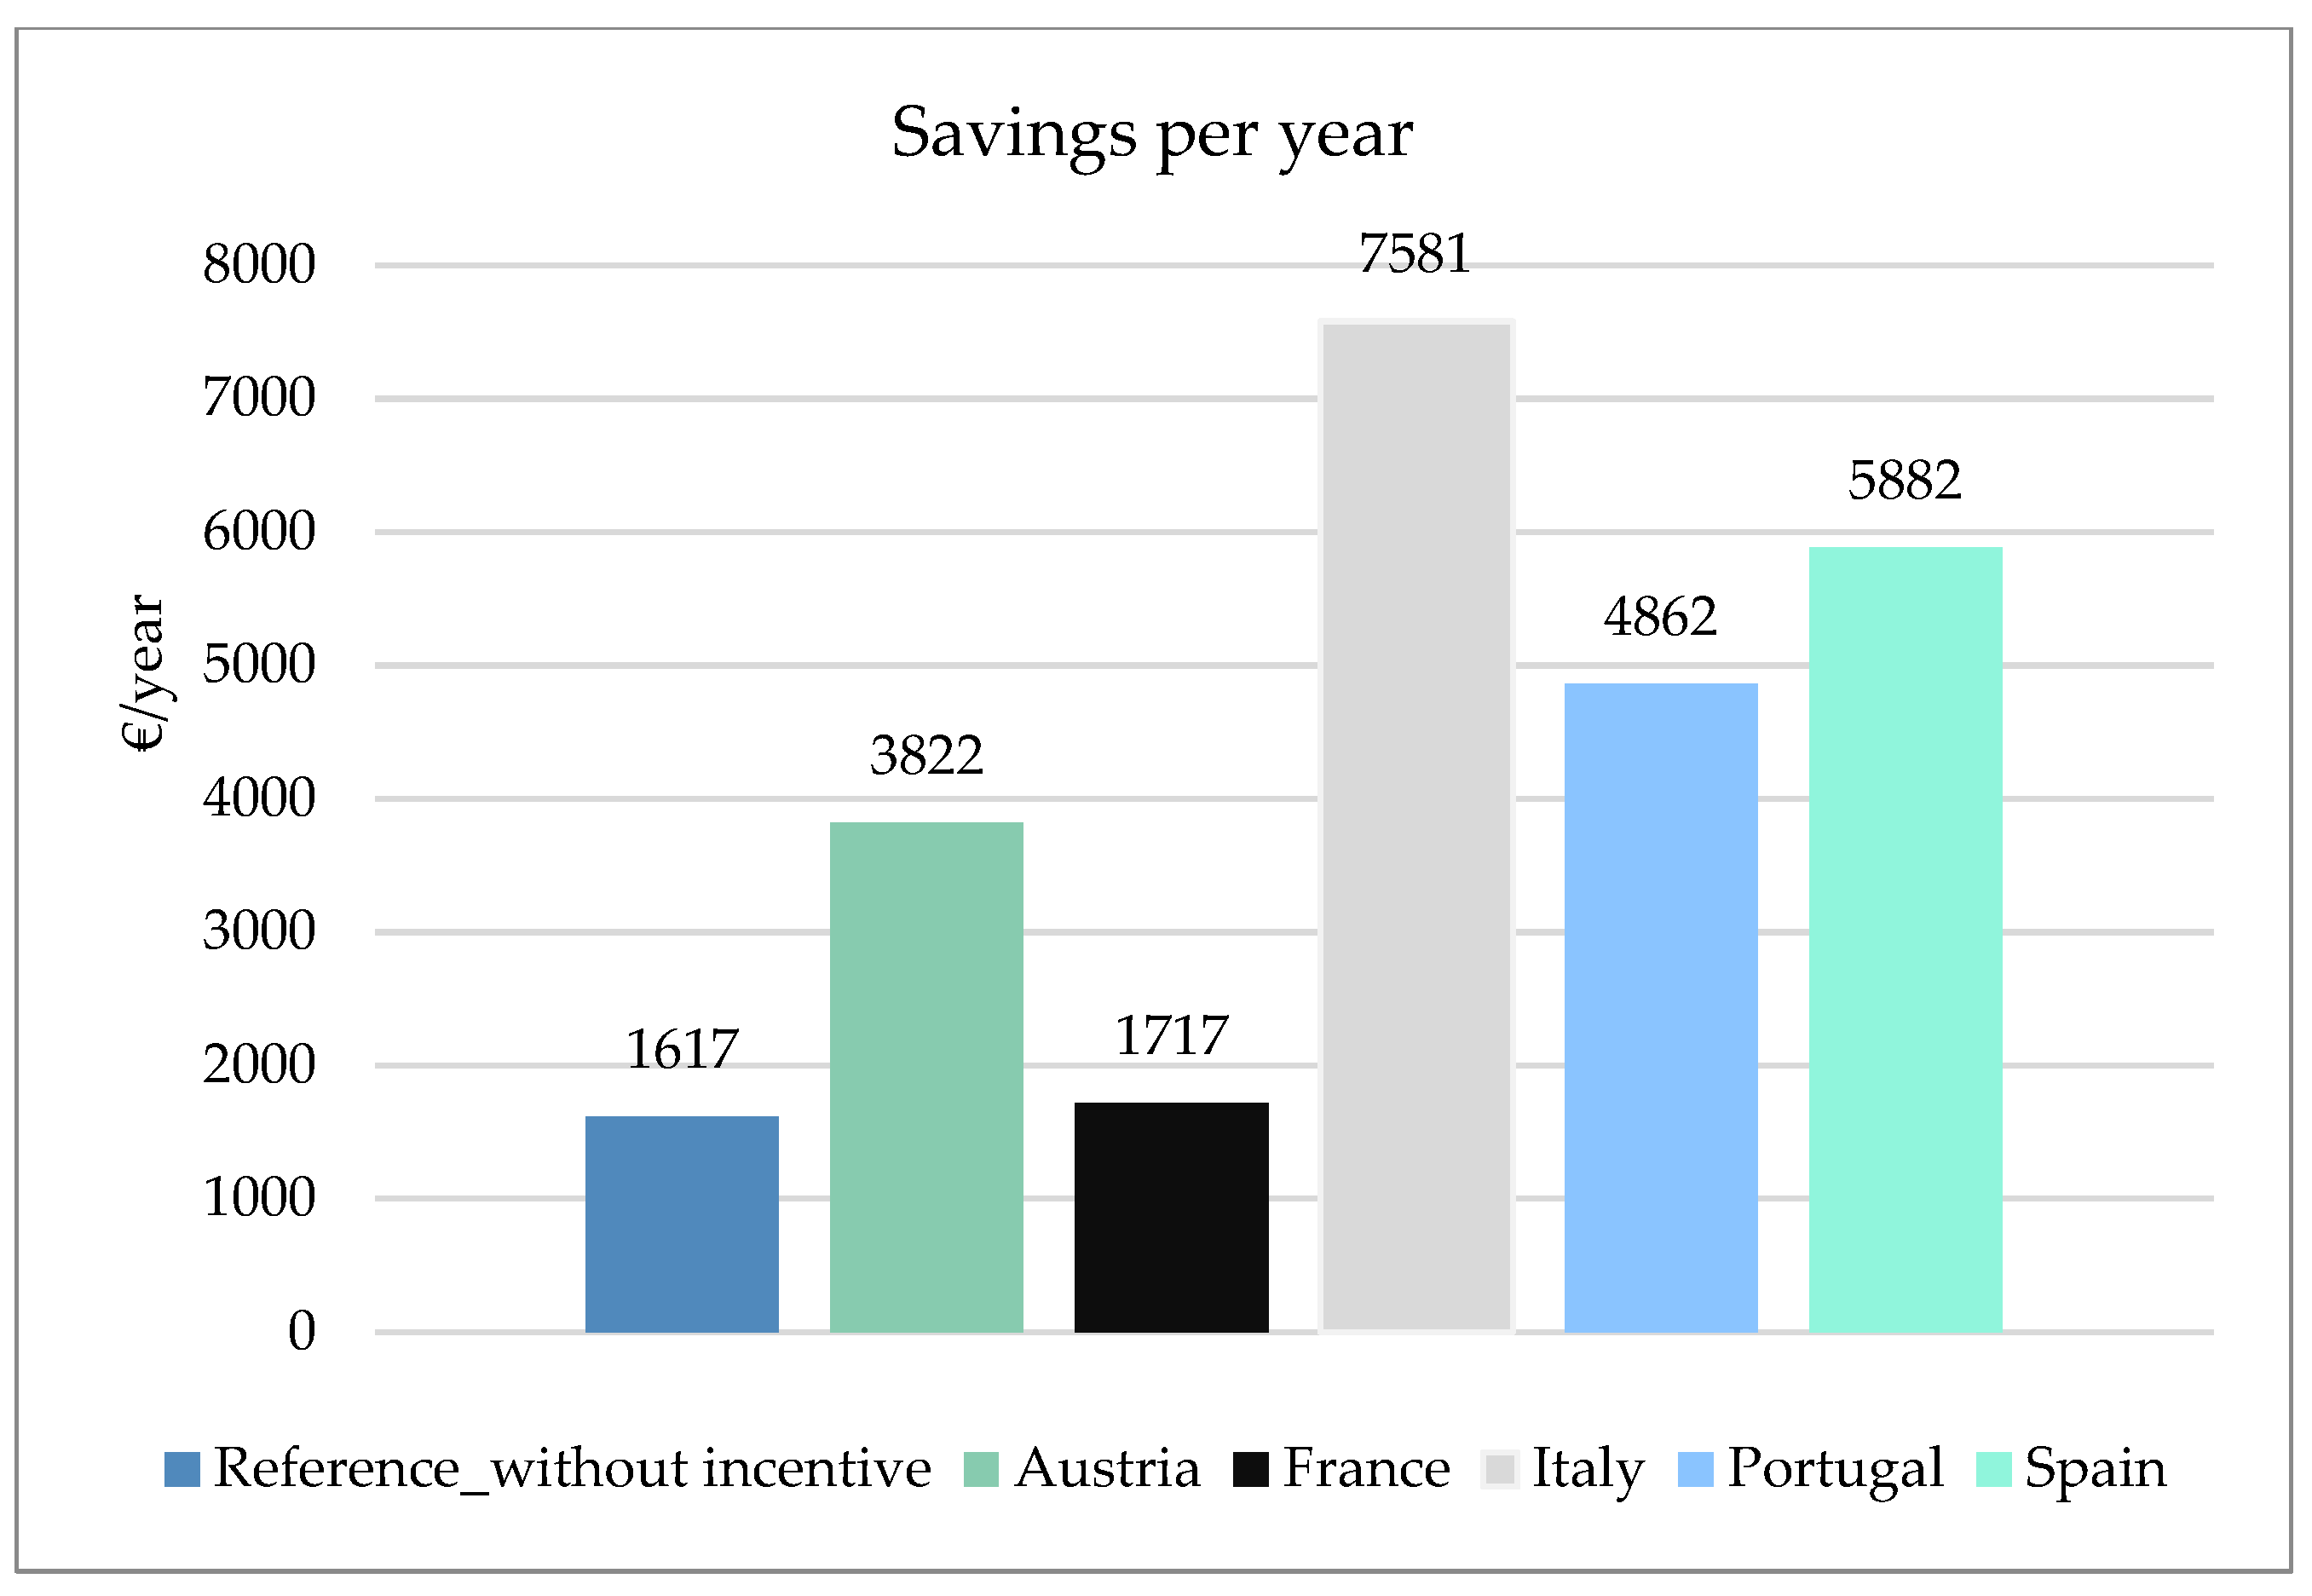
4.2.1. Scenario 1a—Absolute Reduction
Figure 4 presents the savings of the EC in the respective regulatory set-up of each country, taking the absolute reduction in the national incentive into consideration. It is shown that the savings in the Spanish and French set-ups are minor; the EC in the Austrian, Portuguese, and Italian set-ups comes with significantly higher savings. If no regulatory incentives prevail, the savings accumulate to 1617 EUR/year, attributed to the difference between the current electricity price assumed and the revenues for surplus electricity (
Figure 4—reference without incentive). The additional savings in the other countries relate to the regulatory incentives.
Figure 5 presents the savings on the level of the individual energy community members for scenario 1a. This could be of interest, taking into account that the creation of an energy community usually is related to costs (smart meter, contracts, EC manager…) and effort, and therefore it could be argued that members with very low savings may not profit from becoming energy community members. It is visible that the savings for households 4–7 are quite small, as these are entities without a PV system and quite low demand. Member 4 uses most of their own PV directly and therefore does not benefit from the energy community to a wide extent. If we assume 100 EUR/year to be the minimal incentive for new members to join, this would mean that one member in the Austrian, Portuguese, and Italian, two members in the Spanish, and three members in the French set-up are not incentivized to join the energy community. It should, however, be mentioned that Member 6 comes with a very low overall demand (2661 kWh/year), which explains the rather small savings.
4.2.2. Scenario 1b—Percentage Reduction
Figure 6 presents the savings of the EC based on the percentage reduction. It is shown that the savings vary widely between the different countries and are higher than in scenario 1a. This is because the grid fees are quite high (0.15 EUR/kWh), and therefore the impact of the percentage reduction is very pronounced. Only for France are savings lower; this is due to the percentage increase in costs for electricity from the grid, which is higher than savings for electricity exchanged. For France, both scenarios come with minor savings. This is due to the structure of the national incentive increasing the costs for each kWh from the grid and a low self-sufficiency rate of 31% in the French demo set-up. In the Italian case, the incentive is 140% of the grid tariffs and therefore entails high benefits for the energy community. The same holds true for Spain, where the grid fees are reduced by 100%.
Figure 7 presents the savings for the individual households for scenario 1b. It is visible that the savings for households 4–7 are quite small, as these are entities without a PV system and quite low demand. Member 4 uses most of their own PV directly and therefore does not benefit from the energy community to a wide extent. It is visible that all members, but member 6 for all but the Italian case and member 4/5 in the French case, reach minimum savings of 100 EUR/year.
4.3. Results Scenario 2
Scenario 2 presents the results taking the country-specific features (solar irradiation and electricity prices components) into consideration.
Figure 8 shows the impact of the difference in solar irradiation on the energy exchanged within the community. In countries with a higher irradiation, more PV is produced, and therefore more PV can be shared between the EC members.
Table 15 presents the self-consumption and self-sufficiency rates for the different countries.
Figure 9 presents the savings of the energy community per year. It is visible that even though the EC in the Austrian set-up comes with the lowest amount of energy exchanged within the EC, the second highest savings can be achieved. This is largely attributed to the currently wide gap between the electricity costs and the revenues for surplus electricity in Austria. Even without a reduction in grid fees, the energy community would save 3441 EUR/year. Similar savings are reached in Portugal, where the higher solar irradiation is counterbalanced by a lower incentive. Italy and Spain have very similar savings without considering the national incentive; while Spain comes with a higher solar irradiation, Italy has a wider span between the electricity tariff and the revenues for surplus electricity. The EC in the Italian set-up comes with the highest benefits, as the incentive for self-consumed electricity is very high (0.11 EUR/kWh). Since the structure of the French incentive aims to promote self-sufficiency, and in the demo set-up, a self-sufficiency ratio of only 19% is reached, the savings of the energy communities are reduced. In this specific set-up, it would therefore make sense to opt for the conventional structure of the grid tariff and not the one designed for collective self-consumption. The overall savings vary between 24% in Portugal and 5% in France in comparison to the reference case without an energy community. Scenario 2 highlights the impact of country-specific parameters on the overall savings of an energy community.
In Italy, the savings are similar to scenario 1a. For Austria, the grid fees are lower, and the span between the electricity tariff and the revenues for surplus electricity is bigger than in scenario 1a, and therefore higher savings can be achieved, even with a lower solar irradiation. In Spain and Portugal, the electricity price is lower, and therefore the impact of the absolute incentive is higher. For France, the savings are lower due to a lower solar irradiation than in scenario 1a.
Figure 10 presents the savings on the level of the individual energy community members. If we assume 100 EUR/year to be the minimal incentive for new members to join, this would mean that one member in the Austrian, Italian, Spanish, and Portuguese set-up and five members in the French set-up may not profit economically from joining the energy community.
5. Discussion
The comparison of the incentives for energy communities highlights different national approaches. In Austria, Spain, and Portugal, grid fees are reduced. A reduction in grid fees is usually based on spatial boundaries for energy communities on the low, medium, or high voltage grid, as it can be argued that higher grid levels are not used. Italy, in contrast, offers a premium for each kWh of exchanged electricity. France offers a specific scheme for grid fees that supports each kWh collectively consumed but penalizes electricity taken from the grid.
The different schemes set different incentives for energy communities. A reduction in grid fees, considering only the cost for grid levels used, incentivizes the exchange of electricity locally and increases self-consumption within the community. The Italian scheme subsidizes the self-consumption of the produced electricity within the energy community. This could potentially incentivize demand response measures to increase the self-consumption rate while at the same time giving room to unreasonable demand response measures, such as heating in summer to receive benefits for self-consumption in contrast to feeding electricity into the grid for (potentially negative) market prices. France incentivizes a high self-sufficiency rate, as otherwise, it makes more sense to stick to the normal grid tariffs. This scheme, on the one hand, incentivizes shifting demand towards times with PV production while, on the other hand, could also lead to oversizing PV systems to cover most of the demand. This in turn could lead to high midday peaks in summer or discourage the formation of energy communities with smaller PV plants. This highlights how the objective of the energy communities depends on the design of the regulatory incentive. While the key aim in France would be to increase self-sufficiency, the other incentives promote the collective consumption of the production.
The differentiation of the incentive scheme also varies between countries. The Italian framework takes the size of the PV plant, the location, as well as market prices for the definition of the incentive into consideration. Austria adapts the incentive according to the proximity of the EC, while the other countries have a more generalized approach.
Scenario 1 highlights the impact of the national regulation within a uniform environment (same PV production and electricity price composition). As in scenario 1, grid fees are quite high in relation to the span between the electricity price and the revenues for surplus electricity; the potential for savings without a regulatory incentive is rather limited. As the absolute savings of the national legislation are considered, effects may be bigger in countries with lower electricity tariffs. Therefore, scenario 1b is calculated where the percentage reduction regarding the grid fees is considered. Italy profits significantly as the incentive for each kWh is almost 140% of the grid tariff. Spain also comes with high savings under the current regulatory framework, as no volumetric grid fees have to be paid. Overall, this approach shows very diverse savings for the different countries.
Scenario 2 shows the benefits for the energy community members in the country-specific set-up. It is shown that while the energy community in Austria almost consumed 35% less within the energy community than in the Spanish set-up, the absolute savings are higher due to a more favorable regulatory framework and higher electricity costs. The percentage savings highlight very similar savings for Italy, Spain, and Portugal of around 22–24%. Austria comes with savings of 13% and France with savings of 5%. It could be argued that the national incentive of France is not sufficient, as five members do not reach a minimum of 100 EUR/year. This is partly related to the structure of the incentive, where the highest benefits are awarded in winter, where there is a lower PV production, but usually the time with the highest grid problems in France. This proves H1 that national incentives impact the savings of energy communities.
5.1. Level of Support
The comparison between scenario 1b and scenario 2 highlights the importance of defining a national incentive considering the surrounding national parameters. In scenario 1, the savings for the set-up in different countries are quite pronounced. Scenario 2 produced more homogenous results. France and Italy are notable exceptions, with a very high level of support in Italy and no support in France. Scenario 1a also comes with quite homogenous savings, as the level of the absolute reduction already indicates the level of the electricity tariff in the respective country. The structure of electricity tariffs is essential for the regulatory effect, as shown in scenario 1, where a reduction is applied without considering the structure of the electricity tariff, leading to very different savings in the various countries. In general, the results show that all but the French case generate savings of more than 100 EUR/year for all members but member 6, assuming this may be the minimum incentive to join an energy community. Moreover, 100 EUR/year is also reached for all but one member without an incentive in Portugal and Austria.
The results also show that several factors determine the economic feasibility of the energy community. First of all, the gap between the electricity tariff and the revenues for surplus electricity is a decisive factor. The higher the gap is, the higher the benefits for the energy community members are. In most member states, the revenue for surplus electricity is volatile, the region of Brussels even defines a zero-injection tariff encouraging decentralized electricity consumption. Furthermore, low grid tariffs for exchanged energy increase the financial benefits of the energy community.
Based on the results, it could be argued that countries with a higher PV irradiation, low grid fees, and a higher span between the electricity tariff and feed-in need lower regulatory incentives. This is already regarded in the Italian regulatory framework, where energy communities located in areas with lower solar irradiation (Northern and Central Italy) receive higher incentives. This could be a logical approach, especially in countries with different levels of solar irradiation. In the same manner, it could be argued that larger PV plants need lower incentives, as the LCOE is lower, and therefore higher savings can be achieved. Countries, such as Italy, have specified that any financial surplus from the support tariff needs to be used for consumers and/or social purposes locally.
If the national regulatory framework allows for participation in several different energy communities, such as in Austria, further (financial) benefits can be created. This allows for an increase in the self-consumption rate further due to the combination of different load profiles as well as renewable sources in the different energy communities, such as PV in summer and wind and water in winter. Consumers are also less dependent on the price formation in a specific community.
The number of energy communities established indicates that other barriers, besides the economic feasibility, may be in place hampering the implementation of energy communities, such as in Italy, where the highest incentive is found; however, this does not necessarily transpose towards the highest number of energy communities established. Higher incentives may also be a way to counteract technical, social, or organizational barriers.
The design of the incentives should, on the one hand, foster the establishment of energy communities while, on the other hand, reflect potential grid benefits energy communities provide.
5.2. Resilience to Market Volatility
The price formulation within the energy communities for scenario 1 and scenario 2 was done on the basis that the same benefits should occur to the one selling and the one buying electricity. The price formulation can be designed by the energy community members after any principle. In general, it would be sensible that the ones selling to the EC receive a higher remuneration than from selling to the grid, and the ones buying from the EC pay less than from the grid. Price formations depend, however, on the involved actors and can be different in every energy community. Prices in energy communities are normally lower than market prices, but market prices often serve as a benchmark. This does therefore not allow reducing the dependency on market prices significantly as presumed in H2. In price formations, however, other benefits, such as an enhanced ESG investment portfolio, could make companies sell their excess electricity for less than they would get from market prices or allow all benefits to go to energy-poor members of the energy community.
As countries are phasing out fixed feed-in tariffs, energy communities provide an alternative to selling surplus back to the grid for low market prices. Energy communities could also offer models where part of the electricity is sold for fixed conditions, while the other part is sold for market prices. This allows taking advantage of opportunities that arise from potentially high market prices and, at the same time, protects against risk in case the market prices fall again. This is also the scheme of the Italian national incentive, where part of the incentive is fixed over 20 years, while 1/3 of the incentive depends on the market prices, which ensures that energy communities are less exposed to market fluctuations.
Table 16 presents the percentage of the savings that refers to the national incentive and is therefore not impacted by changes in the market prices. As visible in the table below, 20% and 27%, respectively, of the savings are related to national incentives in the Austrian, Spanish, and Portuguese cases, while for Italy this number rises to 57%. It could therefore be argued that energy communities in Italy are more resilient to market prices than countries in Austria, Spain, and Portugal. For the French case, the negative impacts of the national incentive are further highlighted.
An increasing deployment of PV installations will increase midday peaks towards low or even negative market prices. If it comes to negative market prices, it would make sense to employ demand response schemes within the energy community or curtail electricity instead of feeding electricity into the grid. For energy community members with hourly fluctuating electricity prices, the benefits of an energy community would be minimal, as prices in hours with excess PV would already be very low.
In general, we see a trend towards an ongoing volatile electricity system with fluctuating prices. As it is impossible to decouple entirely from market developments without storage or long-term contracts, energy communities need to react and adapt to changes in the market and consequently adjust their price formulation to provide an attractive model for consumers and prosumers. The market structure, as well as the dependency of the EC on developments in the market, provides a difficult environment for investors. If regulatory incentives are set over a longer time period such as the 20 years in Italy, the risk of forming an energy community can be reduced because the Italian approach of premium support reduces the market dependency and therefore reliably reduces the costs of the exchanged electricity within an energy community. This is especially interesting as long contract durations with fixed prices are becoming less common.
5.3. Electricity Grid Benefits
The higher the exchanged electricity in the community and, therefore, self-consumption rate, the higher the benefits stemming from national incentives. It is therefore either advisable to form an energy community with heterogeneity between demand and supply of the individual members or set, as part of an energy community, incentives for energy community members to shift their demand towards hours with PV production. This would subsequently reduce the midday as well as the evening peak, which could create benefits for the electricity network. Further electricity grid benefits can be created if the energy community decides to invest in a community battery, which would further help reduce midday and evening peaks. So far, no relevant grid benefits of energy communities have been observed in EU countries contradicting H3, even in countries with hundreds of energy communities [
26], such as Austria. The linkage of smaller RECs with CECs or the possibility of participating in multiple energy communities leads to an optimization of assets and prevention of overinvestment in decentralized technologies and reduced dependency on individual actors. Importantly, energy communities need to be accompanied by additional incentives for demand response, increasing self-consumption/self-sufficiency and potentially adding another revenue stream, such as flexibility offers for energy communities. However, currently, only a few member states, such as Slovenia, are discussing suitable frameworks for demand response for small-scale prosumers and on a local level.
5.4. Limitations of the Analysis
This paper focuses on the comparison of regulatory incentives regarding the volumetric electricity price composition and does not consider investment costs and national funding opportunities for technologies, such as PV systems. These costs could vary between the different countries and could therefore have an impact on the overall economic feasibility of the energy community set-up. Moreover, it is assumed that no additional taxes have to be paid for profits made by the community. In Austria, for example, if the community creates a profit of above 35,000 EUR/year, taxes would apply. The most recent electricity prices were considered, but the drivers for the energy costs are beyond the scope of the papers. Furthermore, it is assumed that the demand is the same for all countries. It should be considered that the self-consumption rate in countries with, e.g., a higher cooling demand in hours with PV production could be higher.
6. Conclusions
The comparison reveals significant variation in how countries incentivize energy communities. Austria, Spain, and Portugal reduce grid fees, whereas Italy provides direct financial benefits for each kWh of electricity exchanged. France offers a unique model that supports collective consumption but penalizes drawing from the grid. The effectiveness of these incentives is also shaped by the structure of electricity tariffs and the level of regulatory detail. Italy’s framework, which considers PV plant size, location, and market prices, offers more tailored incentives compared to the generalized approaches seen in other countries.
The design of these incentives significantly influences the objectives and behavior of energy communities. For instance, reduced grid fees encourage local electricity exchange, while Italy’s approach promotes self-consumption, potentially leading to demand response measures that align consumption with production. In contrast, France’s model may drive the oversizing of photovoltaic systems to maximize self-sufficiency, possibly leading to midday peaks and discouraging smaller communities.
Several factors are crucial for the economic viability of energy communities. A larger gap between electricity tariffs and surplus revenues increases community benefits. Lower grid tariffs for exchanged energy enhance financial benefits. Higher self-consumption rates within the community improve overall savings, underscoring the importance of a balanced mix of demand and supply among members. It is shown that the national incentives need to take the electricity price structure and PV potential in the respective country into consideration. In general, it can be concluded that all but the French national incentive framework offer sufficient benefits for average members to save 100 EUR/year.
It is furthermore shown that energy communities cannot significantly reduce market dependencies, as price formulations within the EC still depend to different degrees on market prices. National incentives that are not based on market developments and are in place over several years can reduce the financial risk of energy communities.
The analysis demonstrates that while the regulatory framework can drive significant savings, the design of these incentives must carefully consider the local context to maximize the benefits for community members while at the same time ensuring that the incentive reflects the grid benefits an energy community could create. These benefits mostly refer to demand response action, shaving midday as well as evening peaks, and should be better taken into account in future regulatory frameworks and incentive schemes.


