Article

Productivity Model for Multi-Fractured Horizontal Wells with Complex Fracture Networks in Shale Oil Reservoirs Considering Fluid Desorption and Two-Phase Behavior

State Key Laboratory of Oil and Gas Reservoir Geology and Exploitation, Southwest Petroleum University, Chengdu 610500, China
*
Author to whom correspondence should be addressed.
Energies 2024, 17(23), 6012; https://doi.org/10.3390/en17236012
Submission received: 18 October 2024 / Revised: 17 November 2024 / Accepted: 26 November 2024 / Published: 29 November 2024
(This article belongs to the Special Issue Petroleum and Natural Gas Engineering)

Abstract

:
Shale oil reservoirs are characterized by extremely low porosity and permeability, necessitating the utilization of multi-fractured horizontal wells (MFHWs) for their development. Additionally, the complex phase behavior and desorption effect of two-phase fluids make the fluid flow characteristics of shale oil reservoirs exceptionally intricate. However, there are no productivity models for MFHWs in shale oil reservoirs that incorporate the complex hydraulically fractured networks, the oil–gas desorption effect, and the phase change of oil and gas. In this study, we propose a novel productivity model for MFHWs in shale oil reservoirs that incorporates these complex factors. The conformal transformation, fractal theory, and pressure superposition principle are used to establish and solve the proposed model. The proposed model has been validated by comparing its predicted results with the field data and numerical simulation results. A detailed analysis is conducted on the factors that influence the productivity of shale oil wells. It is found that the phase behavior results in a significant 33% reduction in well productivity, while the fluid desorption leads to a significant 75% increase in well productivity. In summary, the proposed model has demonstrated promising practical applicability in predicting the productivity of MFHWs in shale oil reservoirs.

1. Introduction

In recent years, with the depletion of conventional resources, unconventional energy has been occupying an increasingly important position in the world’s energy [1]. With the breakthrough in hydraulic fracturing technology, the development of shale oil and gas has become the focus of research in global energy development [2,3,4,5,6].
Shale oil reservoirs are distinguished by their extremely low porosity and permeability, with the majority of shale oil and gas being stored through adsorption mechanisms. Studies have revealed that the proportion of movable hydrocarbons in some shale oil reservoirs does not exceed 30% [7], which poses a significant obstacle to the development of shale oil resources. The use of multi-fractured horizontal wells (MFHWs) has been proven to be an effective method for increasing drainage area and mitigating wellbore contamination in the development of shale oil and gas reservoirs, leading to a substantial increase in production [8,9]. Therefore, there is a growing emphasis among researchers on the application of MFHWs in low- and ultra-low-permeability reservoirs.
Since the early 1970s, the configuration of wells in the petroleum industry has evolved through three primary stages: transitioning from vertical wells to fractured vertical wells, then progressing from fractured vertical wells to horizontal wells, and ultimately advancing from horizontal wells to MFHWs [10]. Wu et al. [11,12] transformed three-dimensional anisotropic reservoirs into equivalent isotropic reservoirs based on tensor theory and established the productivity equations of vertical fracture wells and multi-branch horizontal wells in three-dimensional anisotropic reservoirs by considering the coupling of natural fractures and artificial fractures. Chen et al. [13] proposed a comprehensive steady-state productivity equation for multi-fractured vertical wells operating under constant pressure drop conditions, taking into account stress-sensitive permeability, threshold pressure gradient, asymmetry in fracture angle, length, and conductivity. Wei et al. [14] developed a productivity equation for fractured vertical wells in gas reservoirs under stable seepage conditions, considering the influence of water saturation on various seepage mechanisms, and conducted an analysis of the influencing factors. In recent years, the development of a productivity model for MFHWs has emerged as a research hotspot. Soleimani et al. [15] used the method of ‘process conversion flowing pressure correction’ to convert the modified backpressure test process into an isochronous test, which was used to determine the productivity of horizontal wells in anisotropic tight gas formations. Lou et al. [16] developed a productivity equation for hydraulic fracturing wells that incorporates the desorption and diffusion of coalbed methane, based on the Langmuir equation and Fick’s law. Clarkson and Williams-Kovacs [17] employed a support vector machine based on statistical theory and kernel function to develop a productivity model for MFHWs. Song et al. [18] derived a productivity model for MFHWs in water-bearing tight gas reservoirs, taking into account the impact of the threshold pressure gradient. Qi and Zhu [19] developed a productivity equation for MFHWs in shale gas reservoirs, taking into account diffusion, slippage, desorption, and absorption phenomena. Jiang et al. [20] developed a productivity model for MFHWs in shale oil reservoirs, taking into account the starting pressure gradient and stress sensitivity. However, the model did not consider the adsorption and desorption processes of shale oil, which are important aspects to consider when understanding production behavior in such reservoirs. Some scholars [21,22,23] proposed various productivity models for MFHWs in different reservoirs. Although some scholars have proposed non-steady-state productivity models for MFHWs in shale oil reservoirs and predicted the transient production rate of MFHWs [24,25,26,27], there is a lack of research on the steady-state productivity model for MFHWs in shale oil reservoirs.
Accurate production forecasting for MFHWs is crucial for the efficient development of shale oil reservoirs [28]. The productivity of shale low-permeability reservoirs is affected by reservoir transformation such as fracturing or drilling [29,30]. Among the influencing factors of MFHWs in shale oil reservoirs, hydraulic fracturing can increase the fluid discharge area and permeability of the matrix, thereby enhancing the well productivity. However, during pressure drop, shale oil will desorb in the reservoir. Additionally, fluid phase change during the seepage process will significantly impact the well productivity. Therefore, it is highly challenging to comprehensively consider hydraulic fracture characteristics, shale oil–gas desorption, and fluid phase change when predicting the productivity of MFHWs.
Some researchers [31,32,33,34] verified that the desorption characteristics of shale gas can be effectively described by the Langmuir isotherm theory, which was supported by experimental data. In the case of shale oil, a number of scholars [35,36,37] proposed a modified matrix permeability model to account for shale oil desorption. Li et al. [38] developed a comprehensive chemical reaction model that accounts for the interplay between shale oil desorption and fluid phase behavior. The simulation results show strong agreement with field data. However, accurately predicting well productivity remains challenging due to the complex geological conditions of shale oil reservoirs, variations in fracture parameters, and changes in fluid phase. Additionally, existing models do not consider the phase transition characteristics of shale oil and rely solely on single-phase oil or gas in simulation calculations [39]. As the reservoir pressure decreases and the formation pressure falls below the bubble point, dissolved gas is released, leading to changes in the fluid composition and migration [40]. Liu et al. [41] proposed a new equation of state suitable for confined fluids, which demonstrated improved matching with type I and IV adsorption isotherms. Therefore, it is crucial to consider the phase behavior of shale oil. Alharthy et al. [42] found that the phase behavior has a significant impact on the initial oil production. Researchers have observed, through hydraulic fracturing model testing and numerical studies of the fracture network, that hydraulic fractures in fracture rock layers exhibit significant interruption, distortion, and bifurcation due to lithology and stress influences [43,44]. This leads to the development of a complex fracture network system with tree-like fractal characteristics (as shown in Figure 1). The formation fluid flows from the matrix to the tree-shaped fractures and subsequently from the fracture to the wellbore. These fractures consist of numerous branch networks, significantly enhancing the complexity of the pore medium and altering fluid seepage characteristics. In contrast to traditional productivity models for MFHWs, this fractal-like tree-shaped fracture model is more appropriate for describing fluid seepage in real reservoirs with complex fractures.
To the best of our knowledge, there are currently no productivity models for MFHWs in shale oil reservoirs that incorporate the complex, tree-shaped, hydraulically fractured networks, the oil–gas desorption effect, and the phase change of oil and gas. In this work, we have developed a novel productivity model for MFHWs in shale oil reservoirs that incorporates these complex factors and have investigated the effects of these factors on well productivity.

2. Mathematical Models

2.1. Model Assumptions

In order to develop a mathematical model for predicting the productivity of MFHWs, taking into account shale oil and gas desorption, phase change, and tree-shaped fracture characteristics, the following assumptions are made:
(1)
The shale oil reservoir is a finite, vertically sealed formation with a thickness of h , and the reservoir exhibits homogeneity and isotropy.
(2)
The horizontal well, with a length of L , is centrally situated within the reservoir and runs parallel to both the upper and lower boundaries of the reservoir.
(3)
The N hydraulic fractures, each with a half-length of x f , fully penetrate the reservoir while maintaining uniform spacing between them.
(4)
The fluid flows from the formation into the fracture, and then it flows from the fracture into the wellbore. The production of the MFHW is the sum of the production from each fracture.
(5)
The fluid flow in shale oil reservoirs is considered to be isothermal two-phase flow, governed by Darcy’s law.

2.2. Seepage Model for Oil and Gas Flows in Shale Matrix

2.2.1. Model Establishment

Based on the principles of material balance [45], the steady-state continuity equation for shale oil and gas, taking into account desorption, is formulated as [46]
ρ v + q d = 0 ,
where ρ is the density of shale oil or shale gas, k g / m 3 ; q d is the desorption amount of shale oil and gas desorbed from the matrix, k g / ( m 3 s ) ; and v is the velocity of shale oil or shale gas, m / s .
Based on the Langmuir isothermal adsorption theory and Fick’s law of diffusion, the desorption amount of shale gas in Equation (1) can be obtained by [46]
q d g = G D m F s c m c p = G D m F s ρ s M g V s t d V L p e p L + p e ρ s M g V s t d V L p p L + p ,
where q d g is the desorption amount of shale gas, k g / ( m 3 s ) ; G is the geometric factor, dimensionless; D m is the diffusion coefficient, m 2 / s ; F s is the shape factor of the matrix block, 1 / m 2 ; c m is the adsorption concentration in the matrix block under the initial reservoir pressure p e , k g / m 3 ; c p is the adsorption concentration in the matrix block under the reservoir pressure p , k g / m 3 ; ρ s is the density of the shale matrix, k g / m 3 ; M g is the molar mass of the gas, k g / m o l ; V s t d is the molar volume of the gas under standard conditions, m 3 / m o l ; V L is the Langmuir volume, m 3 / k g ; p L is the Langmuir pressure, M P a ; p e is the initial reservoir pressure, M P a ; and p is the reservoir pressure, M P a .
The desorption amount of shale oil in Equation (1) can be determined using the following equation [38]:
q d o = 0.01 k d e T O C Δ p ,
where q d o is the desorption amount of shale oil, k g / ( m 3 s ) ; k d e is the desorption amount per unit organic carbon content and pressure drop, k g / ( m 3 s M P a ) ; T O C is the organic carbon content of shale, %; and Δ p is the pressure drop, M P a .
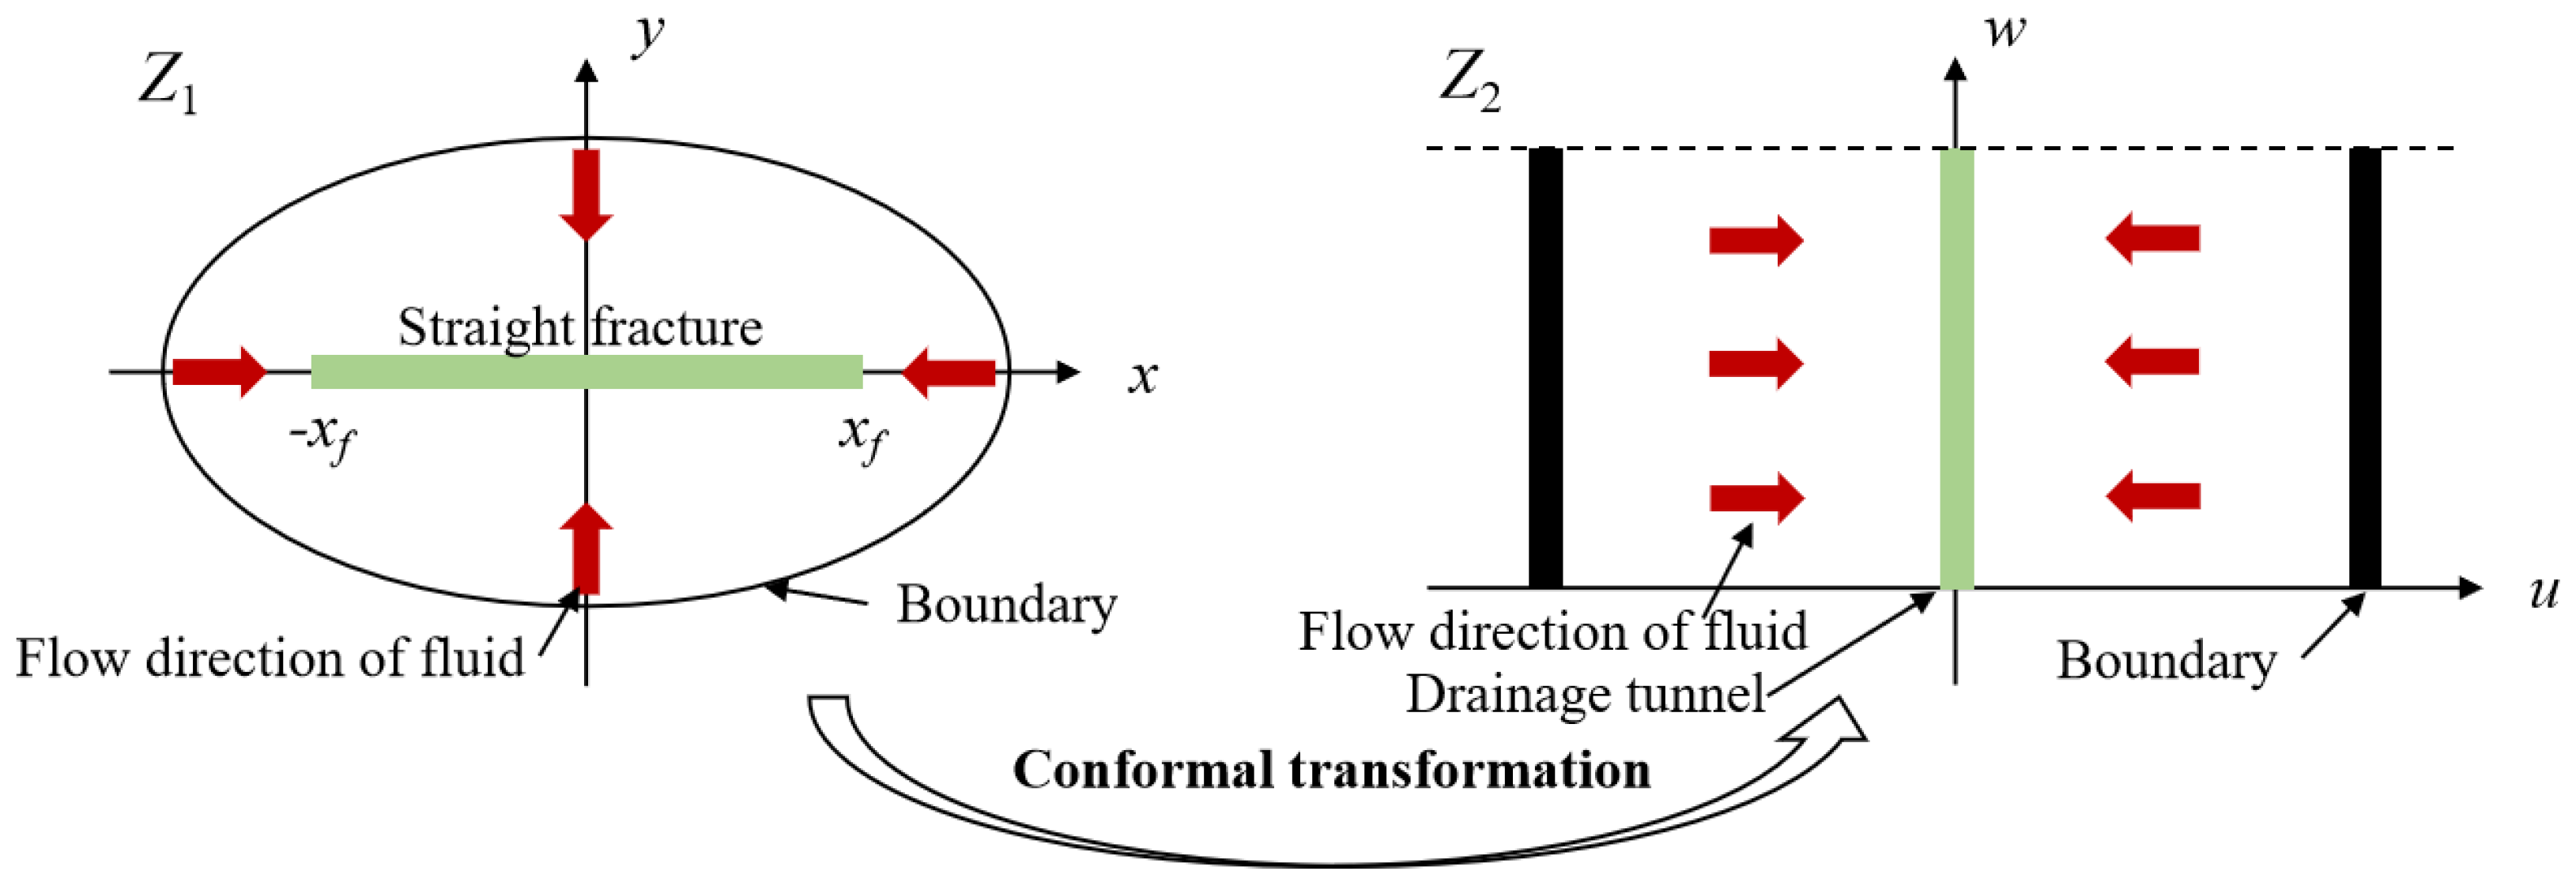
During the process of developing shale oil reservoirs through MFHWs, each fracture induces two-dimensional elliptical flow in the plane, forming conjugate isobaric ellipses and hyperbolic streamline clusters converging with the fracture endpoint as foci. By using the conformal transformation, the seepage region of a single fracture is transformed into a drainage tunnel with a width of π .
The point Z 1 = x + i y in the Z 1 -plane can be mapped to the point Z 2 = u + i w in the Z 2 -plane by the conformal transformation Z 2 = f Z 1 .
According to Darcy’s law, the two-dimensional steady-state continuity Equation (1) in the Z 1 -plane is formulated as
ρ v + q d = ρ K μ p + q d = ρ K μ 2 p + q d = 0 ,
where K is the absolute permeability, m D ; μ is the fluid viscosity, c p ; and 2 is the Laplace operator, which is expressed as
2 = 2 x 2 + 2 y 2 .
The Laplace operator in the Z 1 -plane (i.e., Equation (5)) can be mapped to the Z 2 -plane, with specific details provided as follows:
According to the partial derivative chain rule, one can deduce that
x = u x u + w x w ,
y = u y u + w y w ,
2 x 2 = 2 u x 2 u + 2 w x 2 w + u x 2 2 u 2 + w x 2 2 w 2 + 2 u x w x 2 u w ,
2 y 2 = 2 u y 2 u + 2 w y 2 w + u y 2 2 u 2 + w y 2 2 w 2 + 2 u y w y 2 u w .
Substituting Equations (8) and (9) into Equation (5) yields that
2 = 2 x 2 + 2 y 2       = u x 2 + u y 2 2 u 2 + w x 2 + w y 2 2 w 2 + 2 u x 2 + 2 u y 2 u            + 2 w x 2 + 2 w y 2 w + 2 u x w x + u y w y 2 u w .
According to the theory of complex variable functions, the conformal transformation must satisfy the Cauchy–Riemann condition:
u x = w y       ,       u y = w x .
According to the Cauchy–Riemann condition (11), one can derive that
2 u x 2 + 2 u y 2 = 0 ,
2 w x 2 + 2 w y 2 = 0 ,
f Z 1 2 = u x 2 + u y 2 = w x 2 + w y 2 .
By substituting Equations (11)–(14) into Equation (10), we can obtain that
2 = 2 x 2 + 2 y 2 = f Z 1 2 2 u 2 + 2 w 2 .
By substituting Equation (15) into Equation (4), we derive the two-dimensional steady-state continuity equation in the Z 2 -plane:
ρ K μ f Z 1 2 2 p u 2 + 2 p w 2 + q d = 0 .
Equation (16) can be rewritten as
ρ K μ 2 p u 2 + 2 p w 2 + q d f Z 1 2 = 0 .
The difference between the steady-state continuity equation in the Z 1 -plane (i.e., Equation (1)) and that in the Z 2 -plane (i.e., Equation (17)) lies in the fact that the desorption source term in Equation (17) is multiplied by a coefficient 1 / f Z 1 2 . The coefficient 1 / f Z 1 2 can be determined as follows:
The conformal transformation in Figure 2 for the seepage region of a single fracture is
Z 1 = x f cosh Z 2 .
The transformed coordinate correspondence can be obtained from Equation (18) as follows:
x = x f c h u cos w y = x f s h u sin w .
According to Equation (19), one can obtain that
x 2 x f 2 c h 2 u + y 2 x f 2 s h 2 u = 1 ,
x 2 x f 2 cos 2 w y 2 x f 2 sin 2 w = 1 ,
where
u = a r c c h 1 2 x f 2 + x 2 + y 2 x f 2 + x f 2 + x 2 + y 2 x f 2 2 4 x 2 x f 2 0.5 ,
w = arccos 1 2 x f 2 + x 2 + y 2 x f 2 x f 2 + x 2 + y 2 x f 2 2 4 x 2 x f 2 0.5 .
According to Equations (14) and (22), f Z 1 2 can be obtained by
f Z 1 2 = u x 2 + u y 2 ,
where
u x = 8 x x f 2 4 x ( x 2 + x f 2 + y 2 ) x f 4 / 4 ( x 2 + x f 2 + y 2 ) 2 x f 4 4 x 2 x f 2 0.5 x x f 2 2 ( x 2 + x f 2 + y 2 ) 2 x f 2 + ( x 2 + x f 2 + y 2 ) 2 x f 4 4 x 2 x f 2 0.5 / 2 0.5 × ( x 2 + x f 2 + y 2 ) 2 x f 2 + ( x 2 + x f 2 + y 2 ) 2 x f 4 4 x 2 x f 2 0.5 / 2 0.5 1 0.5 × ( x 2 + x f 2 + y 2 ) 2 x f 2 + ( x 2 + x f 2 + y 2 ) 2 x f 4 4 x 2 x f 2 0.5 / 2 0.5 + 1 0.5 ,
u y = y x f 2 + y ( x 2 + x f 2 + y 2 ) / x f 4 ( x 2 + x f 2 + y 2 ) 2 x f 4 4 x 2 x f 2 0.5 2 ( x 2 + x f 2 + y 2 ) 2 x f 2 + ( x 2 + x f 2 + y 2 ) 2 x f 4 4 x 2 x f 2 0.5 / 2 0.5 × ( x 2 + x f 2 + y 2 ) 2 x f 2 + ( x 2 + x f 2 + y 2 ) 2 x f 4 4 x 2 x f 2 0.5 / 2 0.5 1 0.5 × ( x 2 + x f 2 + y 2 ) 2 x f 2 + ( x 2 + x f 2 + y 2 ) 2 x f 4 4 x 2 x f 2 0.5 / 2 0.5 + 1 0.5 .
Considering Equations (22)–(26), we can obtain that
f Z 1 2 = 1 x f 2 c o s h ( u ) 2 c o s ( w ) 2 .
The oil phase exhibits linear flow in a channel flow along the u direction, which can be described as
ρ o K K r o μ o d 2 p d u 2 + q d o f Z 1 2 = 0 ,
where ρ o is the oil phase density, k g / m 3 ; K r o is the relative permeability of oil phase; and μ o is the oil viscosity, c p .
When the formation pressure falls below the bubble point, it results in oil–gas two-phase seepage in the reservoir. The continuity equation for the gas phase is
ρ g K K r g μ g d 2 p d u 2 + q d g f Z 1 2 = 0 ,
where ρ g is the gas phase density, k g / m 3 ; K r g is the relative permeability of gas phase; and μ g is the gas viscosity, c p .
Adding Equations (28) and (29) results in
K d u ρ g K r g μ g + ρ o K r o μ o d p d u + Q d f Z 1 2 = 0 ,
where
Q d = q d g + q d o .
Introducing the pseudo-pressure function   φ p = ρ g K r g / μ g + ρ o K r o / μ o   d p , the steady-state continuity equation in the Z 2 -plane for two-phase flows is described as
d 2 φ d u 2 + Q d f Z 1 2 K = 0 .

2.2.2. Model Solution

In the Z 2 -plane, the mass flow rate of the two-phase fluid extracted from the fracture is
q t = 2 π K h d φ d u ,
where q t = ρ g q g + ρ o q o is the mass flow rate of the two-phase fluid, kg / d ; q g is the volume flow rate of gas, m 3 / d ; q o is the volume flow of oil, m 3 / d ; and h is the thickness of the formation, m .
Solving Equation (32) with boundary condition (33) can produce the pseudo-pressure solution
φ p = q t u 2 π K h + Q d 2 K x f 2 sinh u 2 u 2 cos w 2 + C ,
where C is a constant.
If the fracture center is located at the coordinate 0 , y 0 instead of the coordinate (0,0), Equations (22) and (23) can be rewritten as
u = a r c c h 1 2 x f 2 + x 2 + y y o 2 x f 2 + x f 2 + x 2 + y y o 2 x f 2 2 4 x 2 x f 2 0.5 ,
w = arccos 1 2 x f 2 + x 2 + y y o 2 x f 2 x f 2 + x 2 + y y o 2 x f 2 2 4 x 2 x f 2 0.5 .
According to the superposition principle of potential, the pseudo-pressure at the j -th fracture induced by N fractures can be calculated as follows:
φ 0 , y j = i = 1 N q t i 2 π K h a r c c h 1 + y j y i 2 x f 2 + Q d 2 K x f 2 sinh a r c c h 1 + y j y i 2 x f 2 2 a r c c h 1 + y j y i 2 x f 2 2 cos π 2 2 + C .
The pseudo-pressure at the outer boundary 0 , r e is given as
φ 0 , r e = i = 1 N q t i 2 π K h a r c c h 1 + r e y i 2 x f 2 + Q d 2 K x f 2 sinh a r c c h 1 + r e y i 2 x f 2 2 a r c c h 1 + r e y i 2 x f 2 2 cos π 2 2 + C .
With the assistance of Equation (39), subtracting Equation (37) from Equation (38) results in Equation (40):
a r c c h 1 + x 2 = ln x + 1 + x 2 ,
φ e φ f j = 1 2 π K h i = 1 N q t i ln r e y i x f + 1 + r e y i 2 x f 2 y j y i x f + 1 + y j y i 2 x f 2 + Q d 2 K x f 2 i = 1 N { ( r e y i ) 2 x f 2 ( r e y i ) 2 x f 2 + 2 ( y i y j ) 2 x f 2 ( y i y j ) 2 x f 2 + 2 cos π 2 2 ln ( r e y i ) 2 x f 2 + 1 + ( r e y i ) 2 x f 2 + 1 2 1 + cos π 2 2 ln ( y i y j ) 2 x f 2 + 1 + ( y i y j ) 2 x f 2 + 1 2 1 } .

2.3. Seepage Model for Oil and Gas Flows in Tree-Shaped Fractures

2.3.1. Characteristic Parameters of Tree-Shaped Fractures

Based on fractal theory [47], a tree-shaped fracture network, consisting of a combination of primary fractures and multiple branch fractures as shown in Figure 3, is used to better characterize the multi-fracture network of MFHWs in shale oil reservoirs. Some characteristic parameters, which are listed in Table 1, can be used to describe the tree-shaped fracture.
Based on the triangular cosine theorem, the characteristic length from the tree-shaped fracture inlet at 0 level to the i -level fracture outlet is derived as
L 0 , i = L 0 , i 1 2 + l i 2 + 2 L 0 , i 1 l i cos θ .
The relationship between the fracture half-length and the characteristic length is described as
x f = L 0 , i .
The total fracture volume can be determined by adding together the individual volumes of fractures across all levels and is calculated assuming a fracture branch number of 2 as follows:
V f = l 0 w 0 h 0 + l 0 w 0 h 0 2 a b c + + l 0 w 0 h 0 2 a b c n = l 0 w 0 h 0 1 2 a b c n + 1 1 2 a b c .
The effective width of a tree-shaped crack is
w f = w 0 2 b n .
The total length of tree-shaped cracks can be obtained by
L f = l 0 + l 0 a + + l 0 a n = l 0 1 a n + 1 1 a .
The equivalent area of tree-shaped cracks is
A f = V f L f = w 0 h 0 1 2 a b c n + 1 1 2 a b c l 0 1 a 1 a n + 1 .

2.3.2. Tree-Shaped Fracture Permeability

If the cross-section of the fracture is assumed to be a rectangle with a width of w , the fracture permeability is
k s l i t = w 2 12 .
Assuming that the seepage of oil and gas in rectangular fractures conforms to Darcy’s law, the seepage equation of each phase is
K r o ρ o μ o Δ p = 12 Q o w 3 h Δ l ,
K r g ρ g μ g Δ p = 12 Q g w 3 h Δ l ,
where Q o is the mass flow rate of oil phase, k g / d ; and Q g is the mass flow rate of gas phase, k g / d .
The sum of Equations (48) and (49) yields the two-phase seepage equation:
Δ φ = 12 q t w 3 h Δ l ,
where
Δ φ = K r g ρ g μ g + K r o ρ o μ o Δ p ,
q t = Q g + Q o .
The seepage equation for the i-level fracture is
Δ φ i = 12 q t m i w i 3 h i l i .
The total pressure drop from the fracture outlet to the bottom of the well for the tree-shaped fracture is
Δ φ f = 12 q t l o w o 3 h o 1 a 2 b 3 c n + 1 1 a 2 b 3 c .
A complex, tree-shaped fracture can be transformed into a rectangular fracture with a half-length of L 0 , i , a width of w f , and a height of h after determining their characteristic parameters using fractal theory (Figure 4).
According to Darcy’s law, the total mass flow rate of fluid through rectangular fractures is determined by
q t = A k f Δ φ f L 0 , i .
The effective permeability of the tree-shaped fracture is obtained by combining Equations (41), (46), (54) and (55):
k f = w 0 2 12 L 0 , n 1 2 + l n 2 + 2 L 0 , n 1 l n cos θ l 0 1 a n + 1 1 a 1 2 a b c 1 2 a b c n + 1 1 a 2 b 3 c 1 a 2 b 3 c n + 1 .
Similarly, the effective permeability of the tree-shaped fracture with a fracture branch number of m is
k f = w 0 2 12 L 0 , i 1 2 + l i 2 + 2 L 0 , i 1 l i cos θ l 0 1 a n + 1 1 a 1 m a b c 1 m a b c n + 1 1 a m b 3 c 1 a m b 3 c n + 1 .
After the hydraulic fracturing operation of the horizontal well, it is imperative to inject sand into the fractures to prevent closure. Assuming a fracture porosity of ϕ f after sand injection, the effective permeability of the fracture is [39]
K f = k f ϕ f .

2.3.3. Oil–Gas Two-Phase Seepage Model

It is assumed that the fluid flow within the fracture follows Darcy’s law, with no consideration for the influence of gravity. The seepage of oil and gas within the fracture can be considered as a plane radial flow with a radius of h / 2 and a thickness of w f . The productivity equation for radial flow within the fracture plane is as follows:
φ p f φ p w f = q t 2 π K f w f ln h 2 r w ,
where
q t = ρ g q g + ρ o q o = ρ g s c q g s c + ρ o s c q o s c .

2.4. Productivity Model for MFHWs

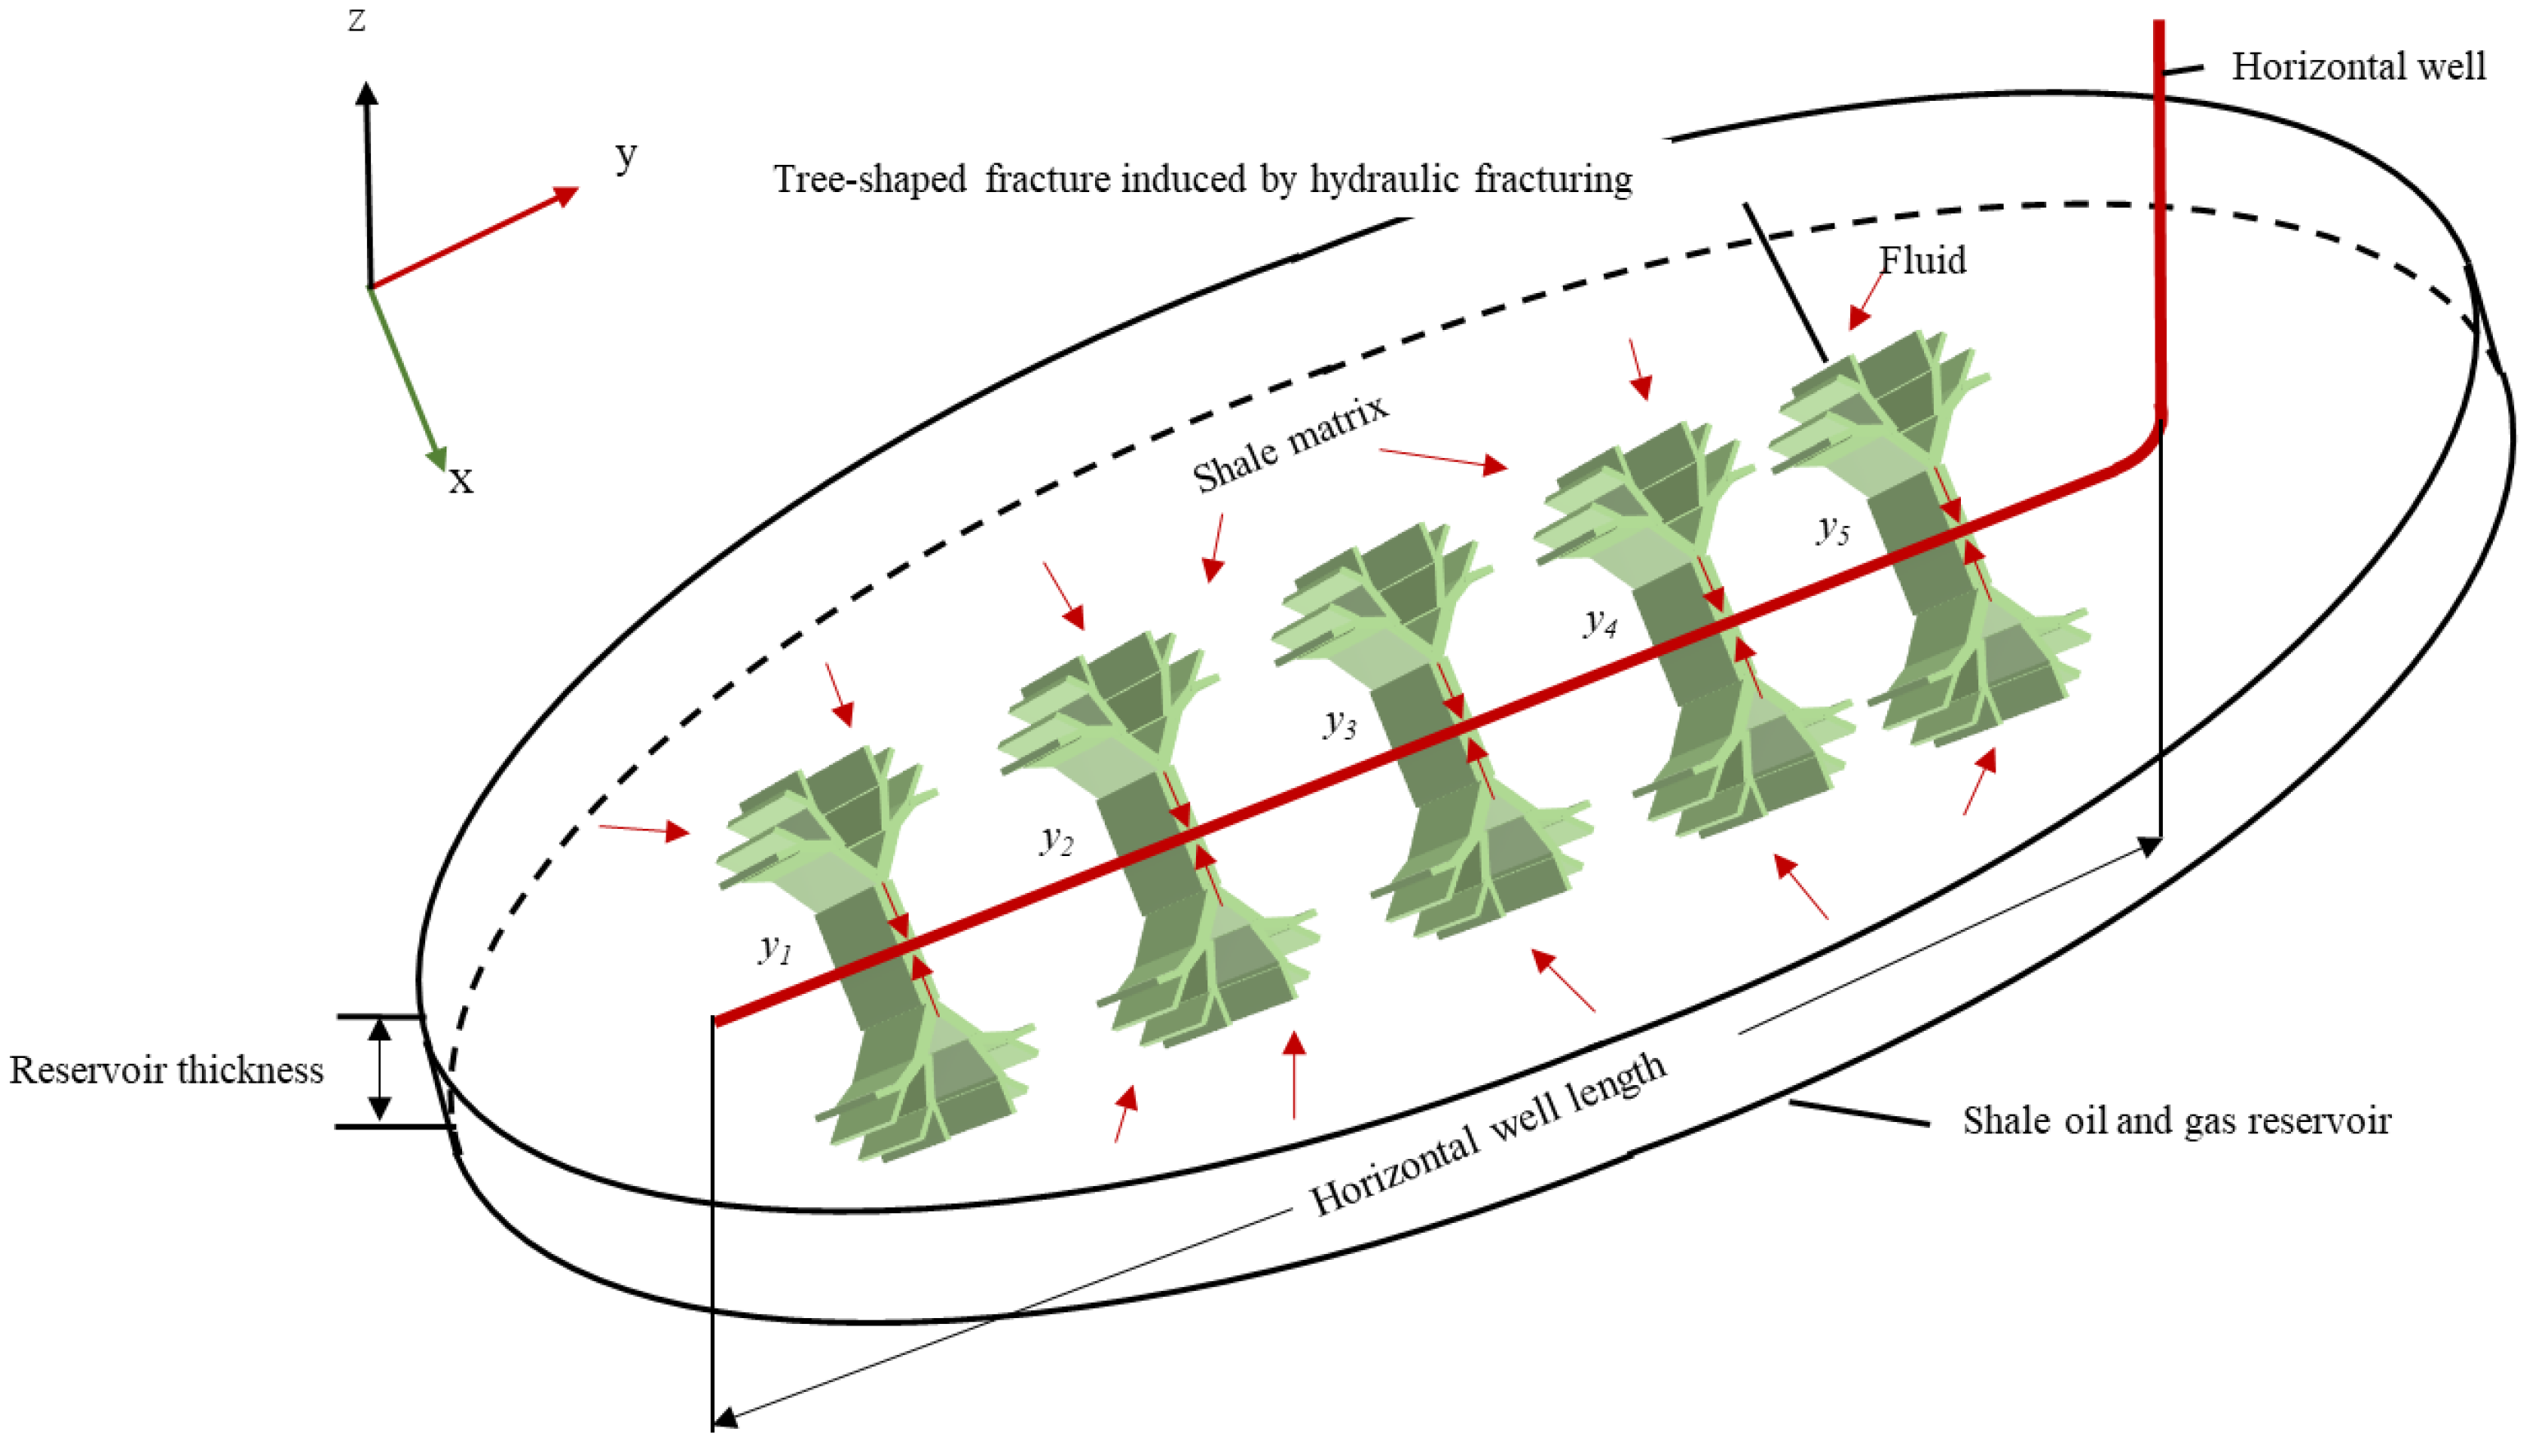
The formation fluid flows from the matrix into the fractures and then flows from the fractures towards the wellbore. The detailed schematic is shown in Figure 5.
The total pressure drop from the matrix to the wellbore is equal to the sum of the pressure drop from the matrix to the fracture and that from the fracture to the wellbore. Therefore, adding together Equations (40) and (59) yields the productivity model of the j th fracture:
φ p e φ p w f = 1 2 π K h i = 1 N q t i ln r e y i x f + 1 + r e y i 2 x f 2 y j y i x f + 1 + y j y i 2 x f 2 + Q d 2 K x f 2 i = 1 N ( r e y i ) 2 x f 2 ( r e y i ) 2 x f 2 + 2 ( y i y j ) 2 x f 2 ( y i y j ) 2 x f 2 + 2 cos π 2 2 ln ( r e y i ) 2 x f 2 + 1 + ( r e y i ) 2 x f 2 + 1 2 1 + cos π 2 2 ln ( y i y j ) 2 x f 2 + 1 + ( y i y j ) 2 x f 2 + 1 2 1 + q t j 2 π K f w f ln h 2 r w
In addition, the total productivity of the MFHW is equal to the sum of the productivity of each fracture:
q t = i = 1 N q t i .
By substituting Equations (2), (3), (44), (58) and (61) into Equation (62), N sets of productivity equations can be obtained, and the total mass productivity of the MFHW can be obtained by solving the simultaneous equations.

2.5. Solution for Two-Phase Pseudo-Pressure

Based on the definition of two-phase pseudo-pressure, calculating this parameter requires determining the relative permeabilities (i.e., K r o and K r g ) of oil and gas, as well as establishing the functional relationship between oil–gas physical parameters (i.e., μ o , μ g , ρ o , and ρ g ) and pressure ( p ). The correlation between oil–gas physical parameters (i.e., μ o , μ g , ρ o , and ρ g ) and pressure ( p ) can be determined through pressure–volume–temperature (PVT) fitting using the Peng–Robinson (PR) state equation (i.e., Equation (63)). Additionally, the relationship between gas-phase molar percentage ( V 1 ) and pressure ( p ) is established through a two-phase flash program.
p = R T V b a α T V ( V + b ) + b V b ,
where R is the molar gas constant, which is equal to 8.31 M P a c m 3 / m o l K ; a , b are molecular gravitational and repulsive coefficients; V is molecular volume; T is temperature, K; and α T is the temperature function.
According to the steady-state seepage theory, the relationship between K r o / K r g and pressure ( p ) can be obtained by Equation (64). Based on this, the relationship between the relative permeabilities (i.e., K r o and K r g ) and pressure can be easily derived with the assistance of relative permeability curves.
K r o K r g = ρ g L 1 μ o ρ o V 1 μ g ,
where L 1 is the liquid-phase molar percentage, %; and V 1 is the gas-phase molar percentage, %.
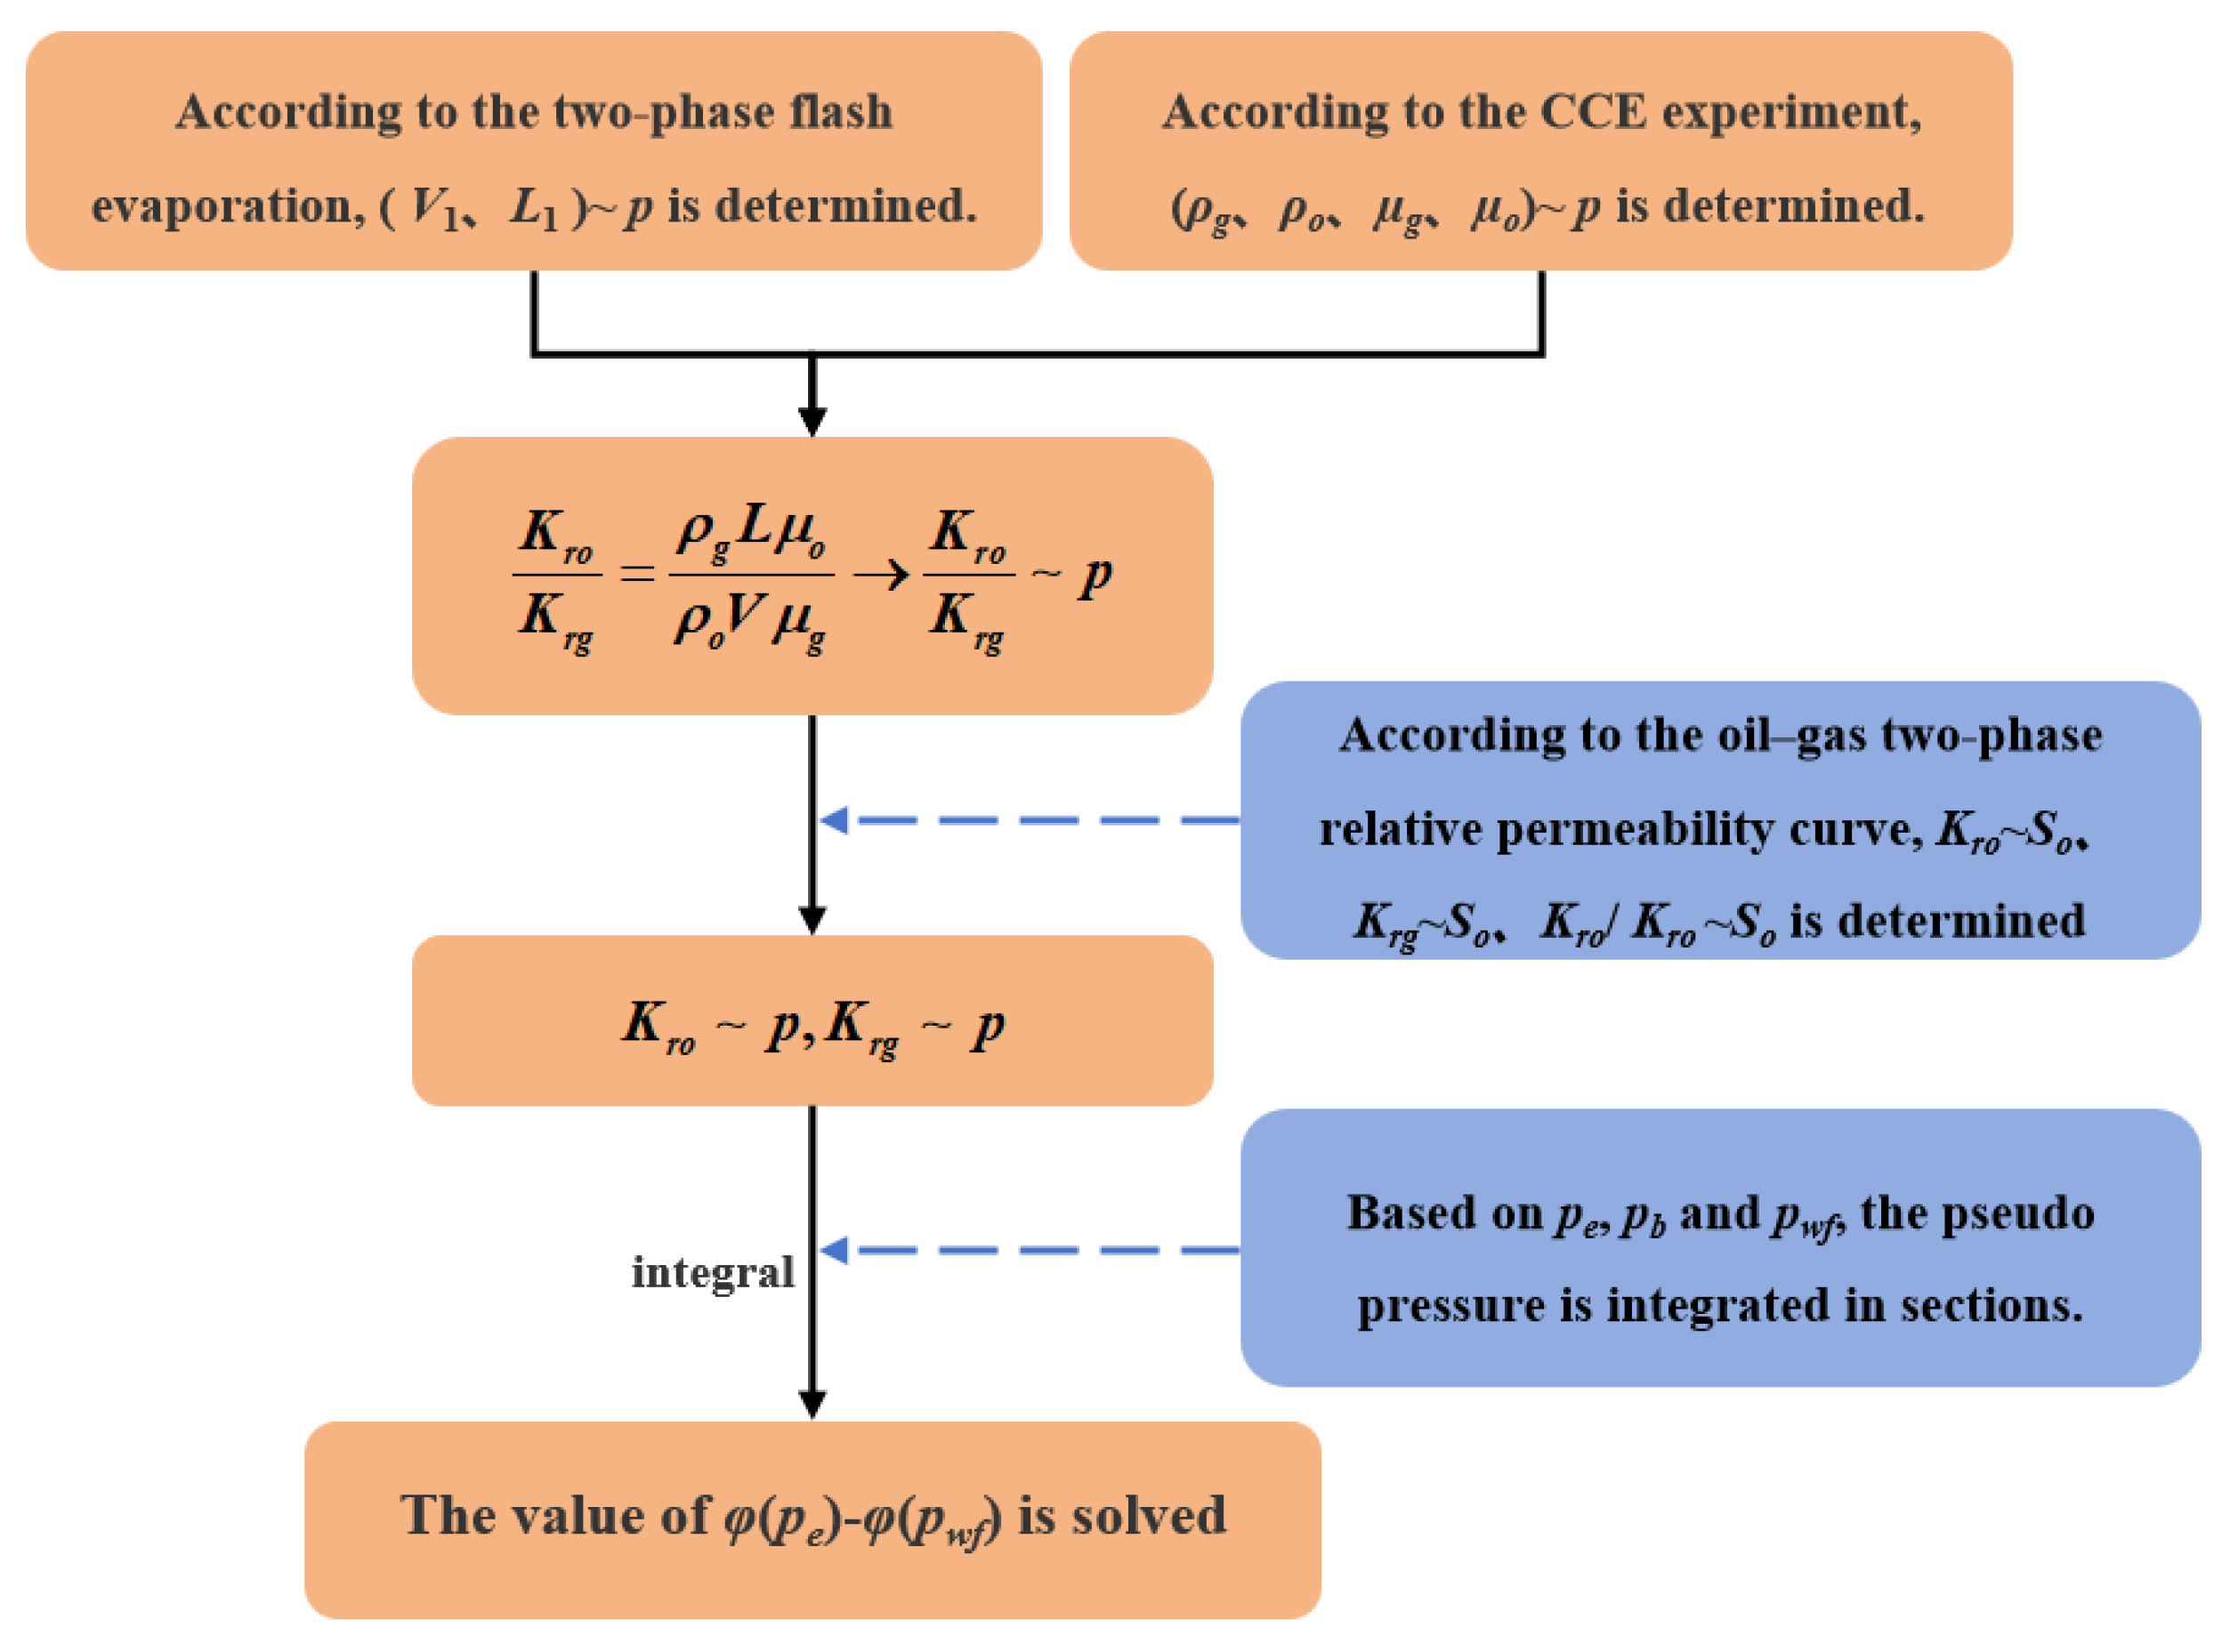
The two-phase pseudo-pressure in Equation (65) can be calculated by the steps outlined in Figure 6. The integral of the pseudo-pressure should be divided into two segments, with the bubble point pressure serving as the dividing point.
  φ p e φ p w f = p b p e ρ o K r o μ o   d p + p w f p b ρ g K r g μ g + ρ o K r o μ o   d p ,
where p b is the bubble point pressure, M P a .

2.6. Solution for Productivity Model

Given the presence of N fractures in the horizontal well, Equations (61) and (62) form a system of N linear equations with N unknowns, i.e., q t i 1 i N , which can be expressed in matrix form as follows:
E 11 + K h K f w f ln h 2 r w E 1 N E N 1 E N N + K h K f w f ln h 2 r w q t 1 q t N = 2 π K h φ e φ w f F 11 + + F 1 N G 11 G 1 N π x f 2 h Q d 2 π K h φ e φ w f F N 1 + + F N N G N 1 G N N π x f 2 h Q d ,
E = ln r e y 1 x f + 1 + r e y 1 2 x f 2 ln r e y N x f + 1 + r e y N 2 x f 2 y 1 y N x f + 1 + y 1 y N 2 x f 2 ln r e y 1 x f + 1 + r e y 1 2 x f 2 y N y 1 x f + 1 + y N y 1 2 x f 2 ln r e y N x f + 1 + r e y N 2 x f 2 ,
F = r e y 1 x f ( r e y 1 ) 2 x f 2 + 2 cos π 2 2 ln ( r e y 1 ) 2 x f 2 + 1 + ( r e y 1 ) 2 x f 2 + 1 2 1 r e y N x f ( r e y N ) 2 x f 2 + 2 cos π 2 2 ln ( r e y N ) 2 x f 2 + 1 + ( r e y N ) 2 x f 2 + 1 2 1 r e y 1 x f ( r e y 1 ) 2 x f 2 + 2 cos π 2 2 ln ( r e y 1 ) 2 x f 2 + 1 + ( r e y 1 ) 2 x f 2 + 1 2 1 r e y N x f ( r e y N ) 2 x f 2 + 2 cos π 2 2 ln ( r e y N ) 2 x f 2 + 1 + ( r e y N ) 2 x f 2 + 1 2 1
G = 0 y 1 y N x f ( y 1 y N ) 2 x f 2 + 2 cos π 2 2 ln ( y 1 y N ) 2 x f 2 + 1 + ( y 1 y N ) 2 x f 2 + 1 2 1 y N y 1 x f ( y N y 1 ) 2 x f 2 + 2 cos π 2 2 ln ( y N y 1 ) 2 x f 2 + 1 + ( y N y 1 ) 2 x f 2 + 1 2 1 0
where E , F , and G are N × N square matrices; E i j is the value in the i th row and j th column of matrix E ; F i j is the value in the i th row and j th column of matrix F ; and G i j is the value in the i th row and j th column of matrix G .
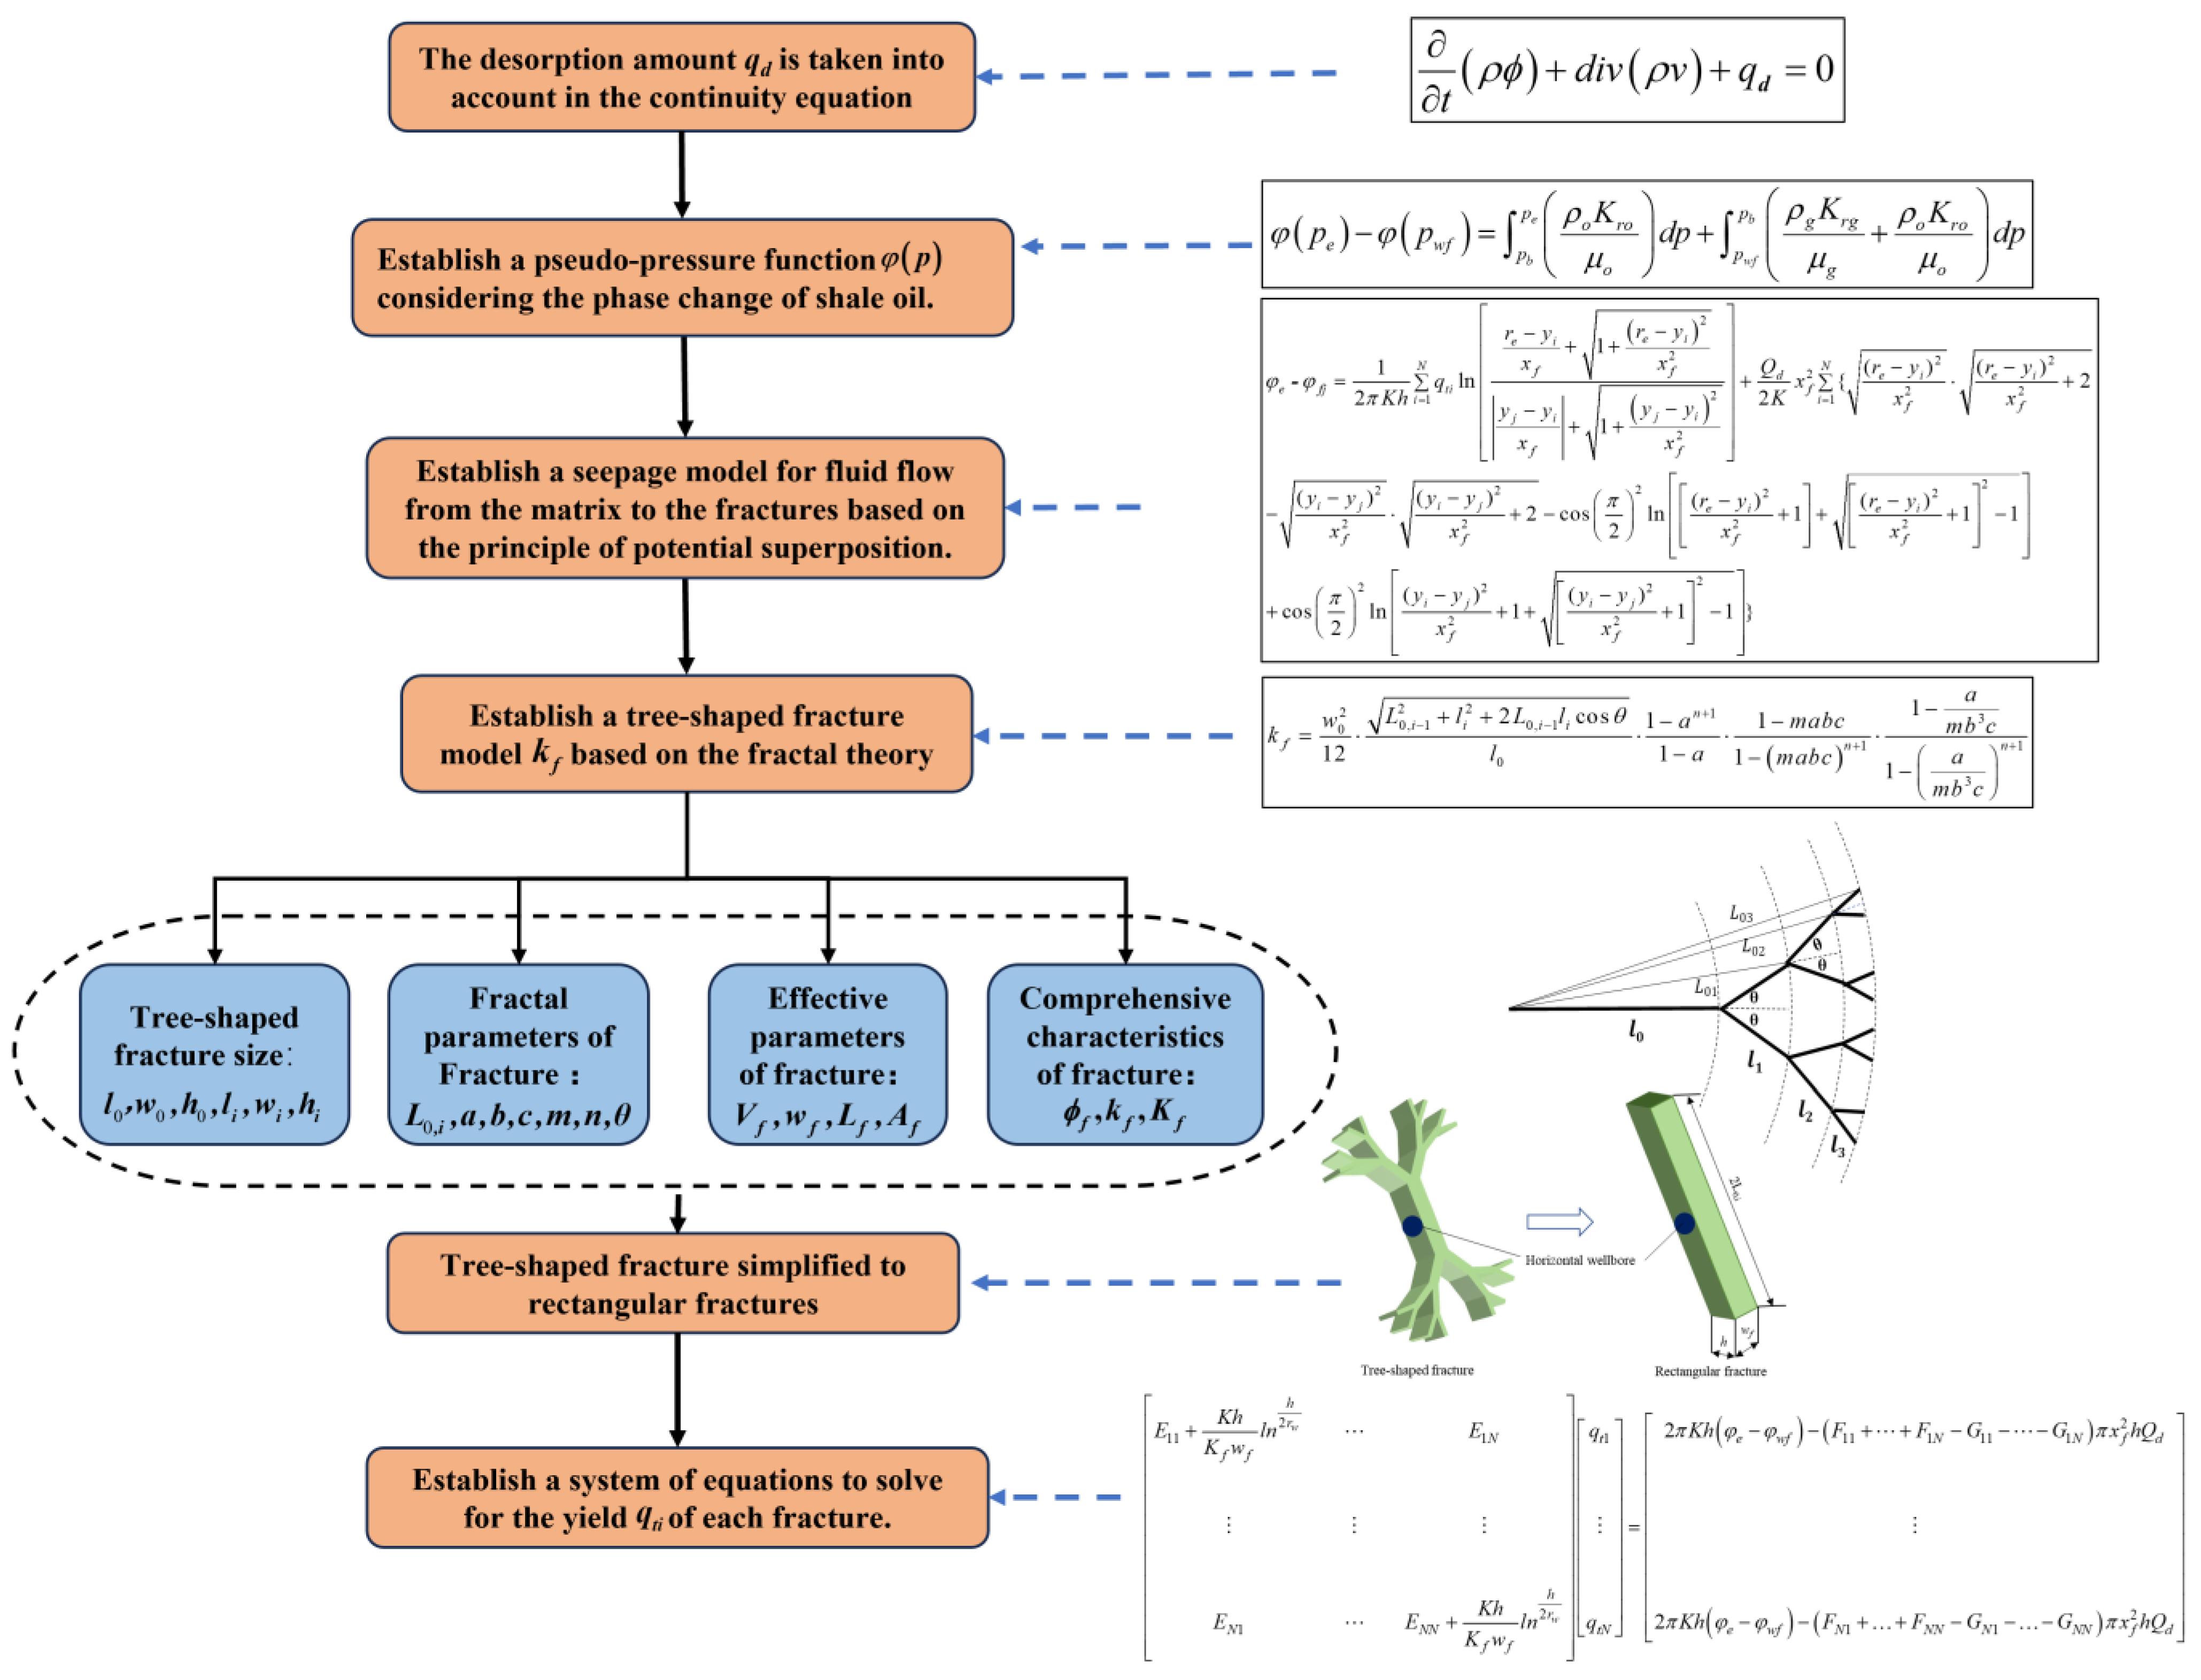
Solving the system of linear equations allows for determining the production rate ( q t i ) of each fracture, subsequently enabling the calculation of the productivity of MFHWs. The solution procedure for the proposed productivity model is illustrated in Figure 7, which provides a comprehensive summary of the process.

3. Model Verification

In this section, the proposed productivity model is validated by comparing it with field data and a numerical model. We only have access to field data from two shale oil wells, namely the PA-1 well and the YY-1 well, in China and are unable to obtain additional field data due to confidentiality concerns. The YY-1 well is a newly drilled well, and as of now, no fluid PVT test has been carried out. Given that the YY-1 well is situated within the same block as the pre-existing PA-1 well, it is hypothesized that the fluid properties of YY-1 are similar to those of PA-1. The proposed productivity model is used to calculate the productivity of the two actual shale oil wells. Through conducting PVT tests on fluid samples extracted from the PA-1 well, precise correlations between thermodynamic parameters and pressure have been established in order to derive accurate two-phase pseudo-pressure. The proposed productivity model is utilized to predict the inflow performance relationship (IPR) curve, which is then compared with field data to validate the model.

3.1. PVT Fitting

The composition of the fluid sample obtained from the PA-1 well is detailed in Table 2. The PR state equation is used to fit the PVT testing data of the fluid sample. As shown in Figure 8, the predicted parameters, such as fluid density and gas deviation factor, are in good agreement with the experimental values. In addition, it is interesting that there is an inflection point in the oil phase density–pressure curve in Figure 8a. This occurs because when the pressure is greater than the bubble point pressure (36.17 MPa), the fluid consists of single-phase oil. The higher the pressure, the greater the density of the oil phase becomes. When the pressure is less than the bubble point pressure (36.17 MPa), gas phase deaeration occurs as the pressure decreases. The content of heavy components in crude oil gradually increases, leading to a gradual increase in density.

3.2. Productivity Calculation

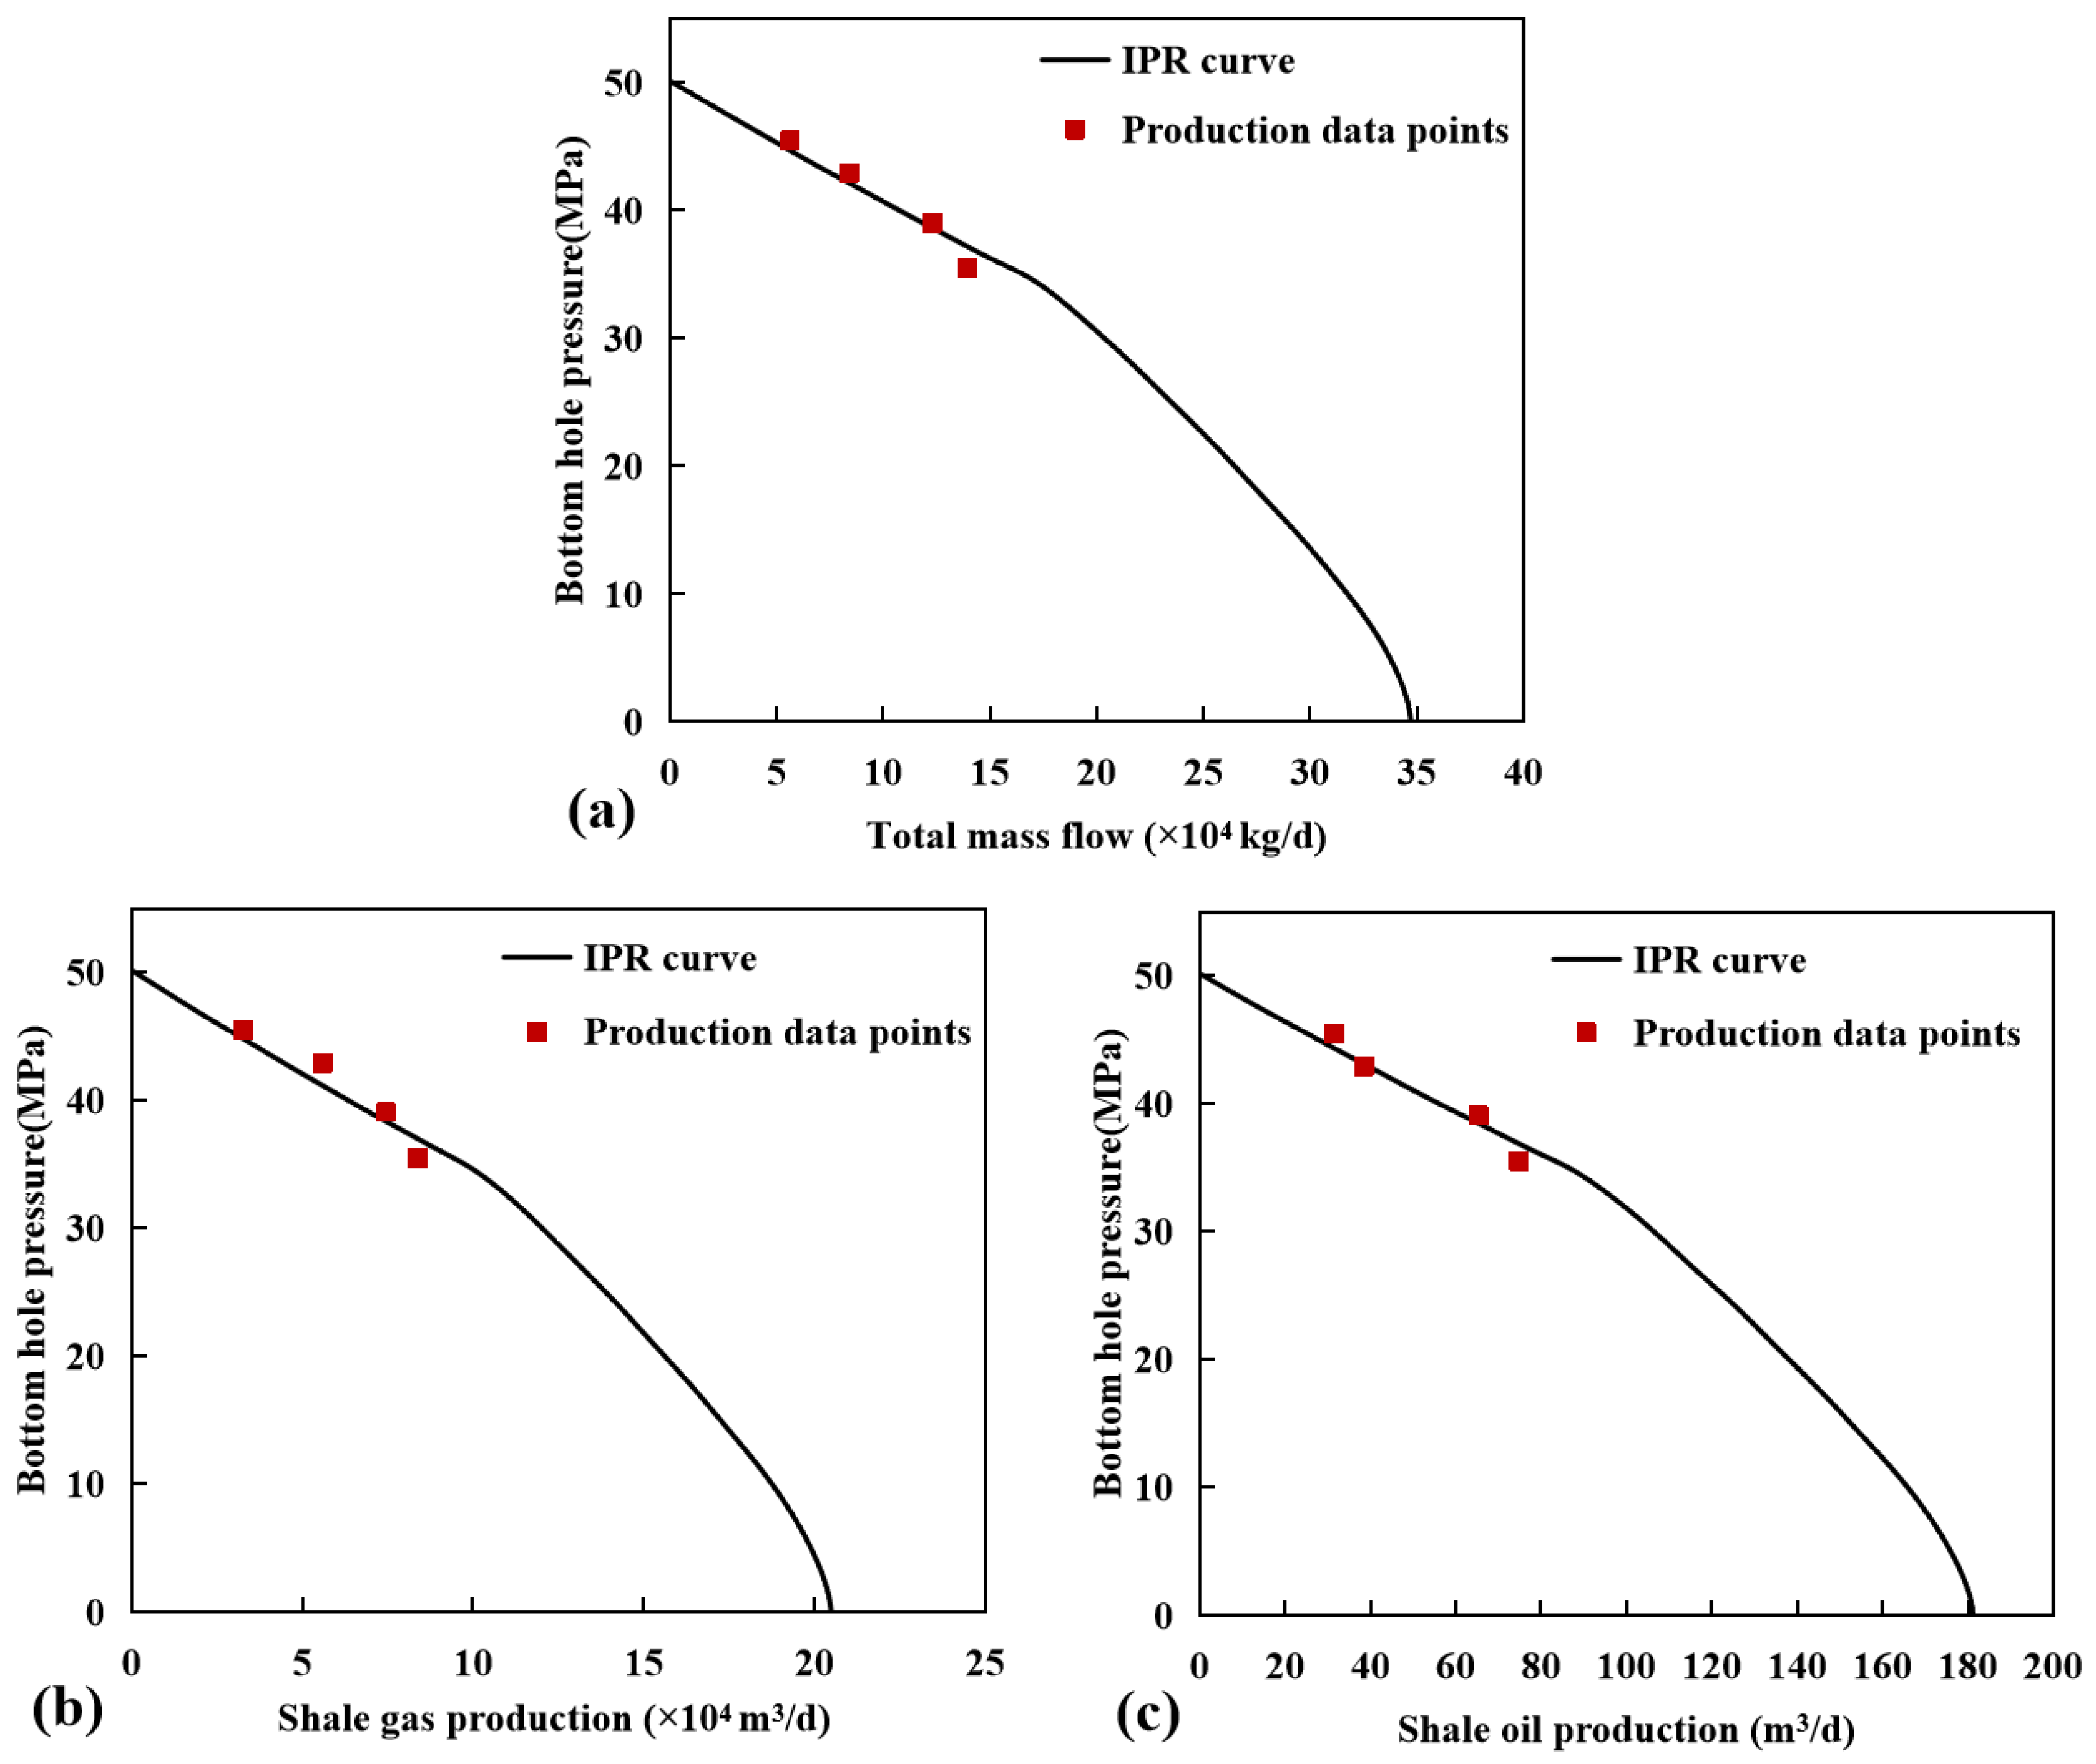
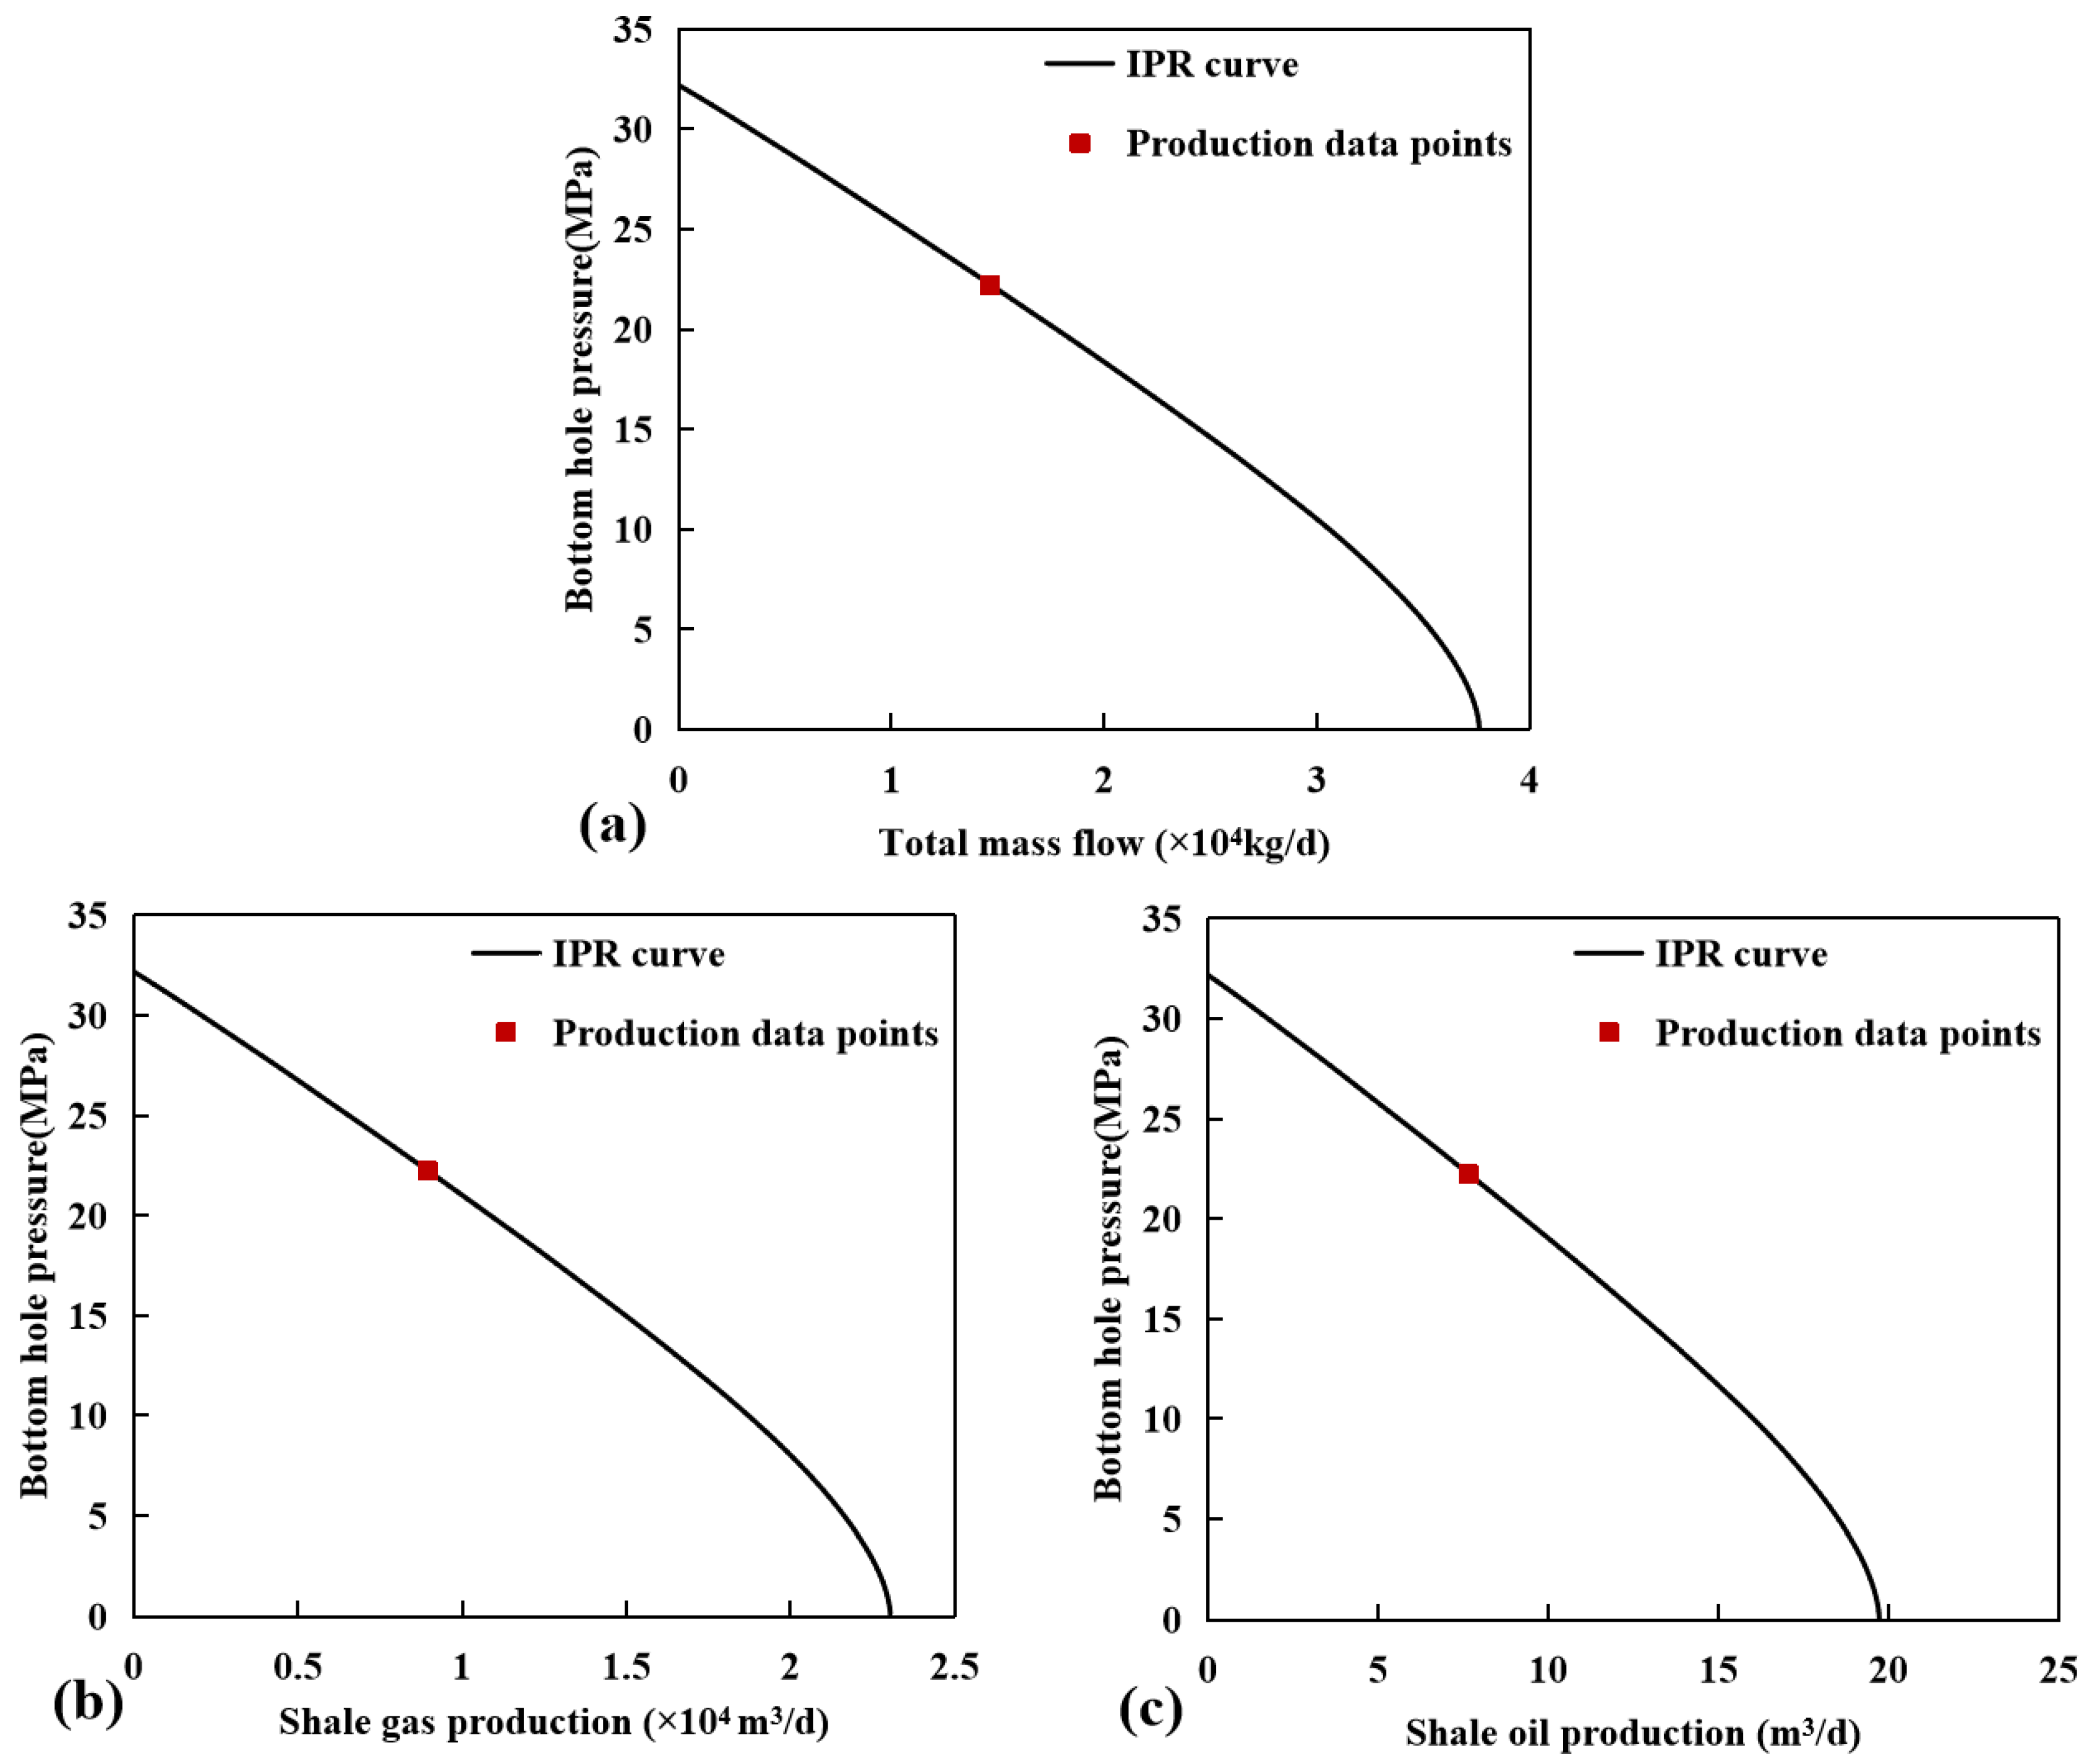
Based on the basic parameters of the PA-1 well and YY-1 well listed in Table 3, the proposed productivity model is employed to calculate the IPR curves of the PA-1 well and YY-1 well. The comparisons between the predicted results and the field data are shown in Figure 9 and Figure 10, which indicate that the predicted results are consistent with the field data. Therefore, the proposed productivity model is validated as feasible for accurately calculating the productivity of shale oil wells. The predicted oil and gas productivities of the PA-1 well are 192.87 m3/d and 199,600 m3/d, respectively. The predicted oil and gas productivities of the YY-1 well are 19.75 m3/d and 22,700 m3/d, respectively.

3.3. Numerical Simulation Verification

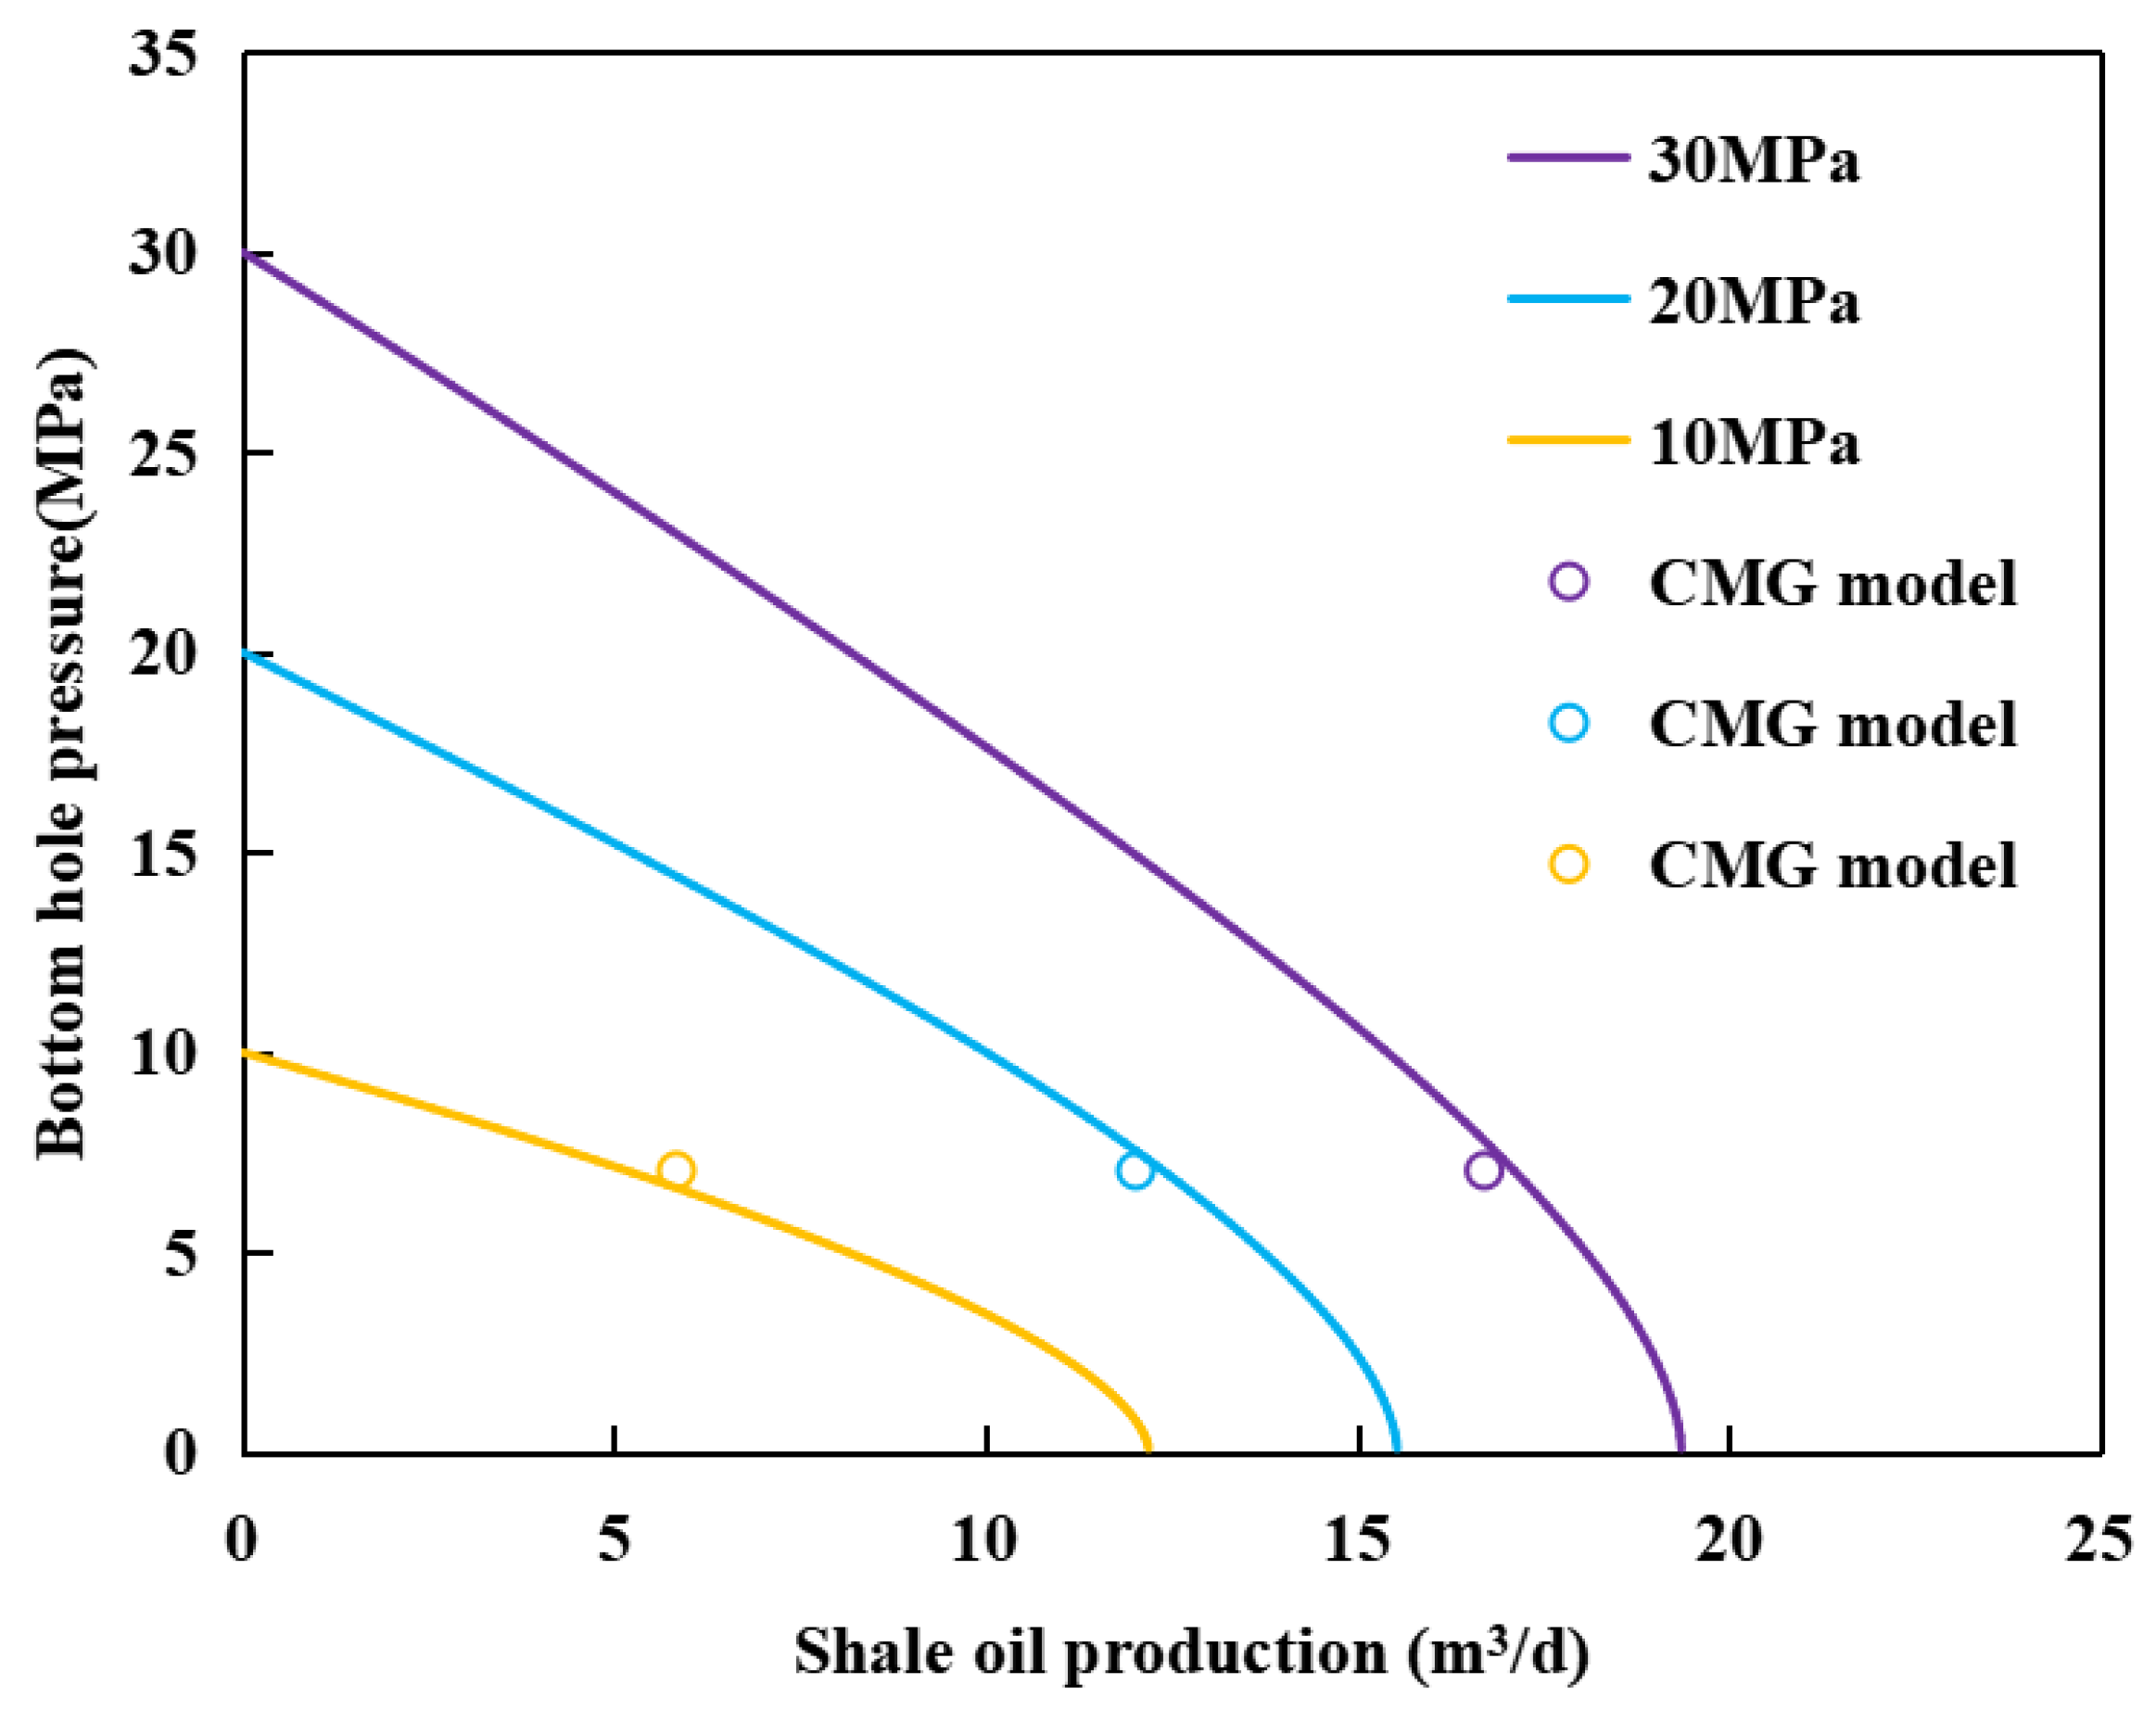
To validate the accuracy of the proposed productivity model, a numerical model of a MFHW is established using CMG. By assuming the same parameters as those of the YY-1 well presented in Table 3, the production rate is obtained using CMG. A conceptual model of a MFHW is generated by CMG (Figure 11). The production well maintains consistent bottom hole flowing pressure during operation. When the pressure wave propagates to the outer boundary, the average formation pressure and well production at different times are recorded. The average formation pressure and constant bottom hole flowing pressure are employed to obtain the IPR curve based on the proposed productive model. The comparison of the calculated IPR curves with CMG numerical solutions is shown in Figure 12. It is observed that numerical solutions agree well with the calculated IPR curves under different average formation pressures, indicating the reliability of the model.

4. Results and Analyses

4.1. The Impact of Shale Oil Phase Behavior on Well Productivity

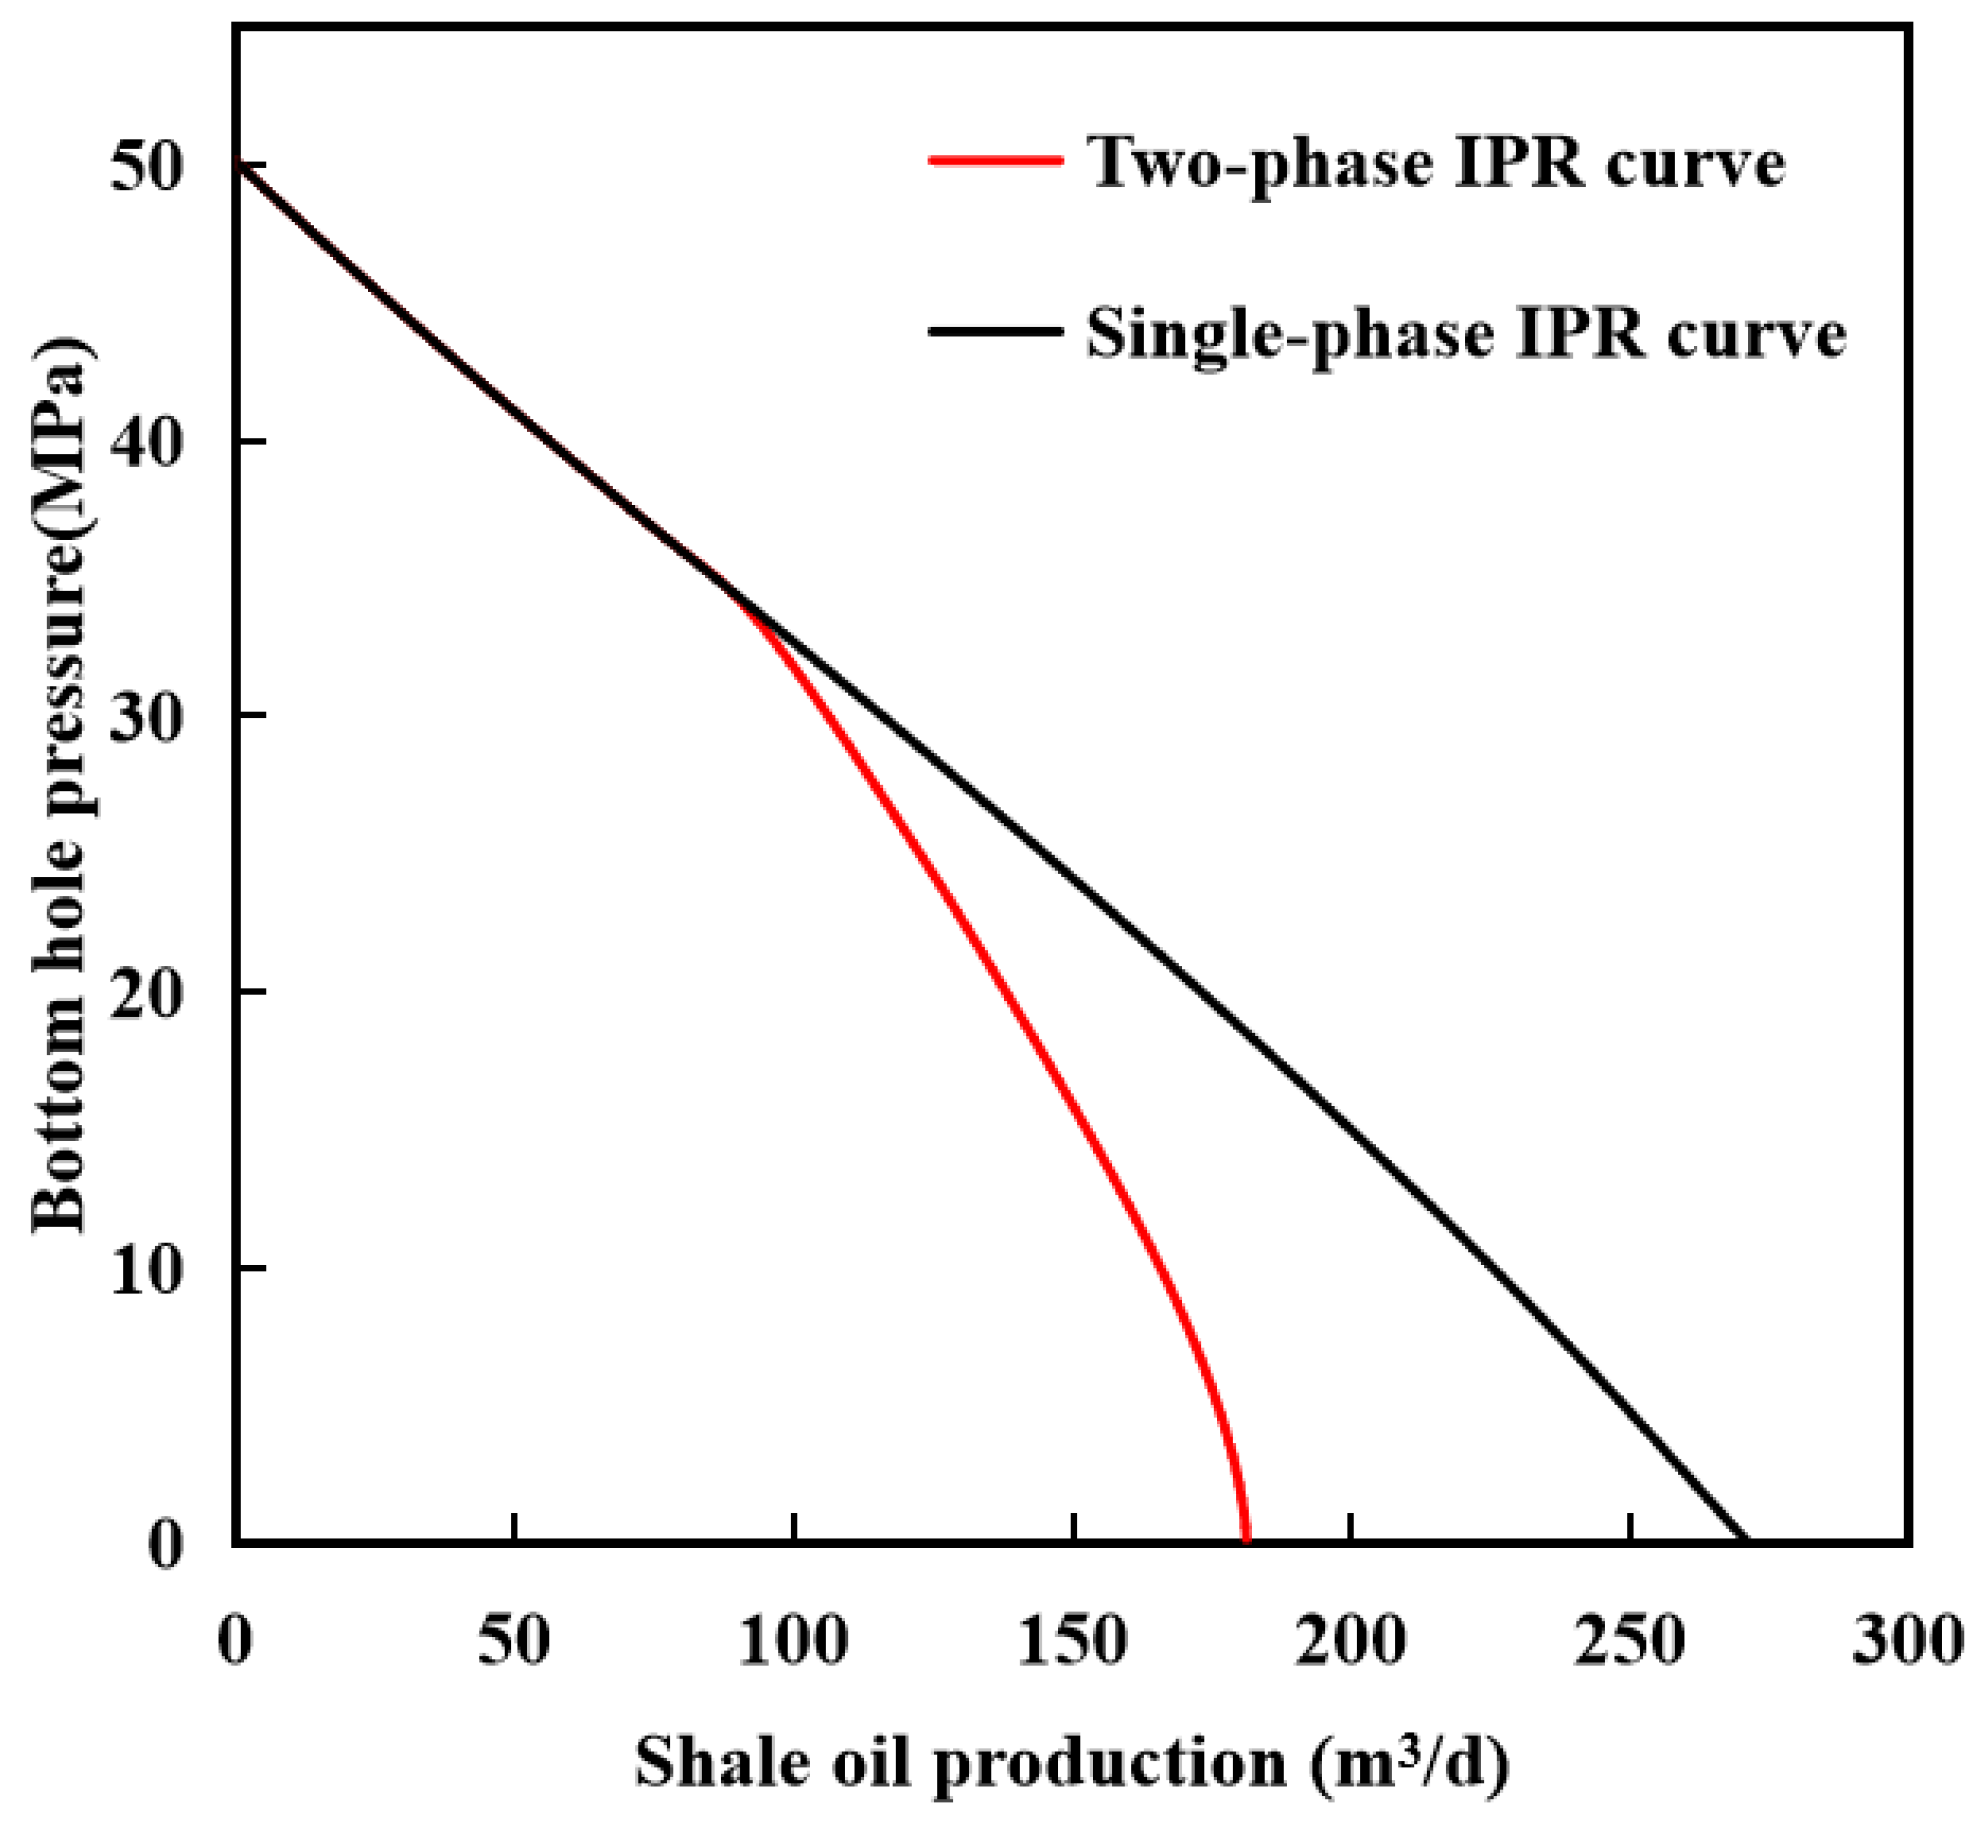
Figure 13 shows the effect of the phase behavior on the IPR curve of shale oil wells. As depicted in Figure 13, the IPR curves demonstrate a significant disparity when considering the phase behavior versus not considering it. Without accounting for phase change, a decrease in bottom hole pressure results in a linear increase in production rate. However, factoring in the phase change leads to the production rate initially exhibiting a linear increase with decreasing bottom hole pressure; subsequently transitioning from single-phase flow to two-phase flow leads to a sharp decline in production rate. As shown in Figure 13, the phase behavior results in a 33% reduction in the well productivity. The productivity of shale oil wells is notably reduced when accounting for phase behavior, as compared to the productivity without considering phase behavior.

4.2. The Impact of Fracture Spacing on Well Productivity

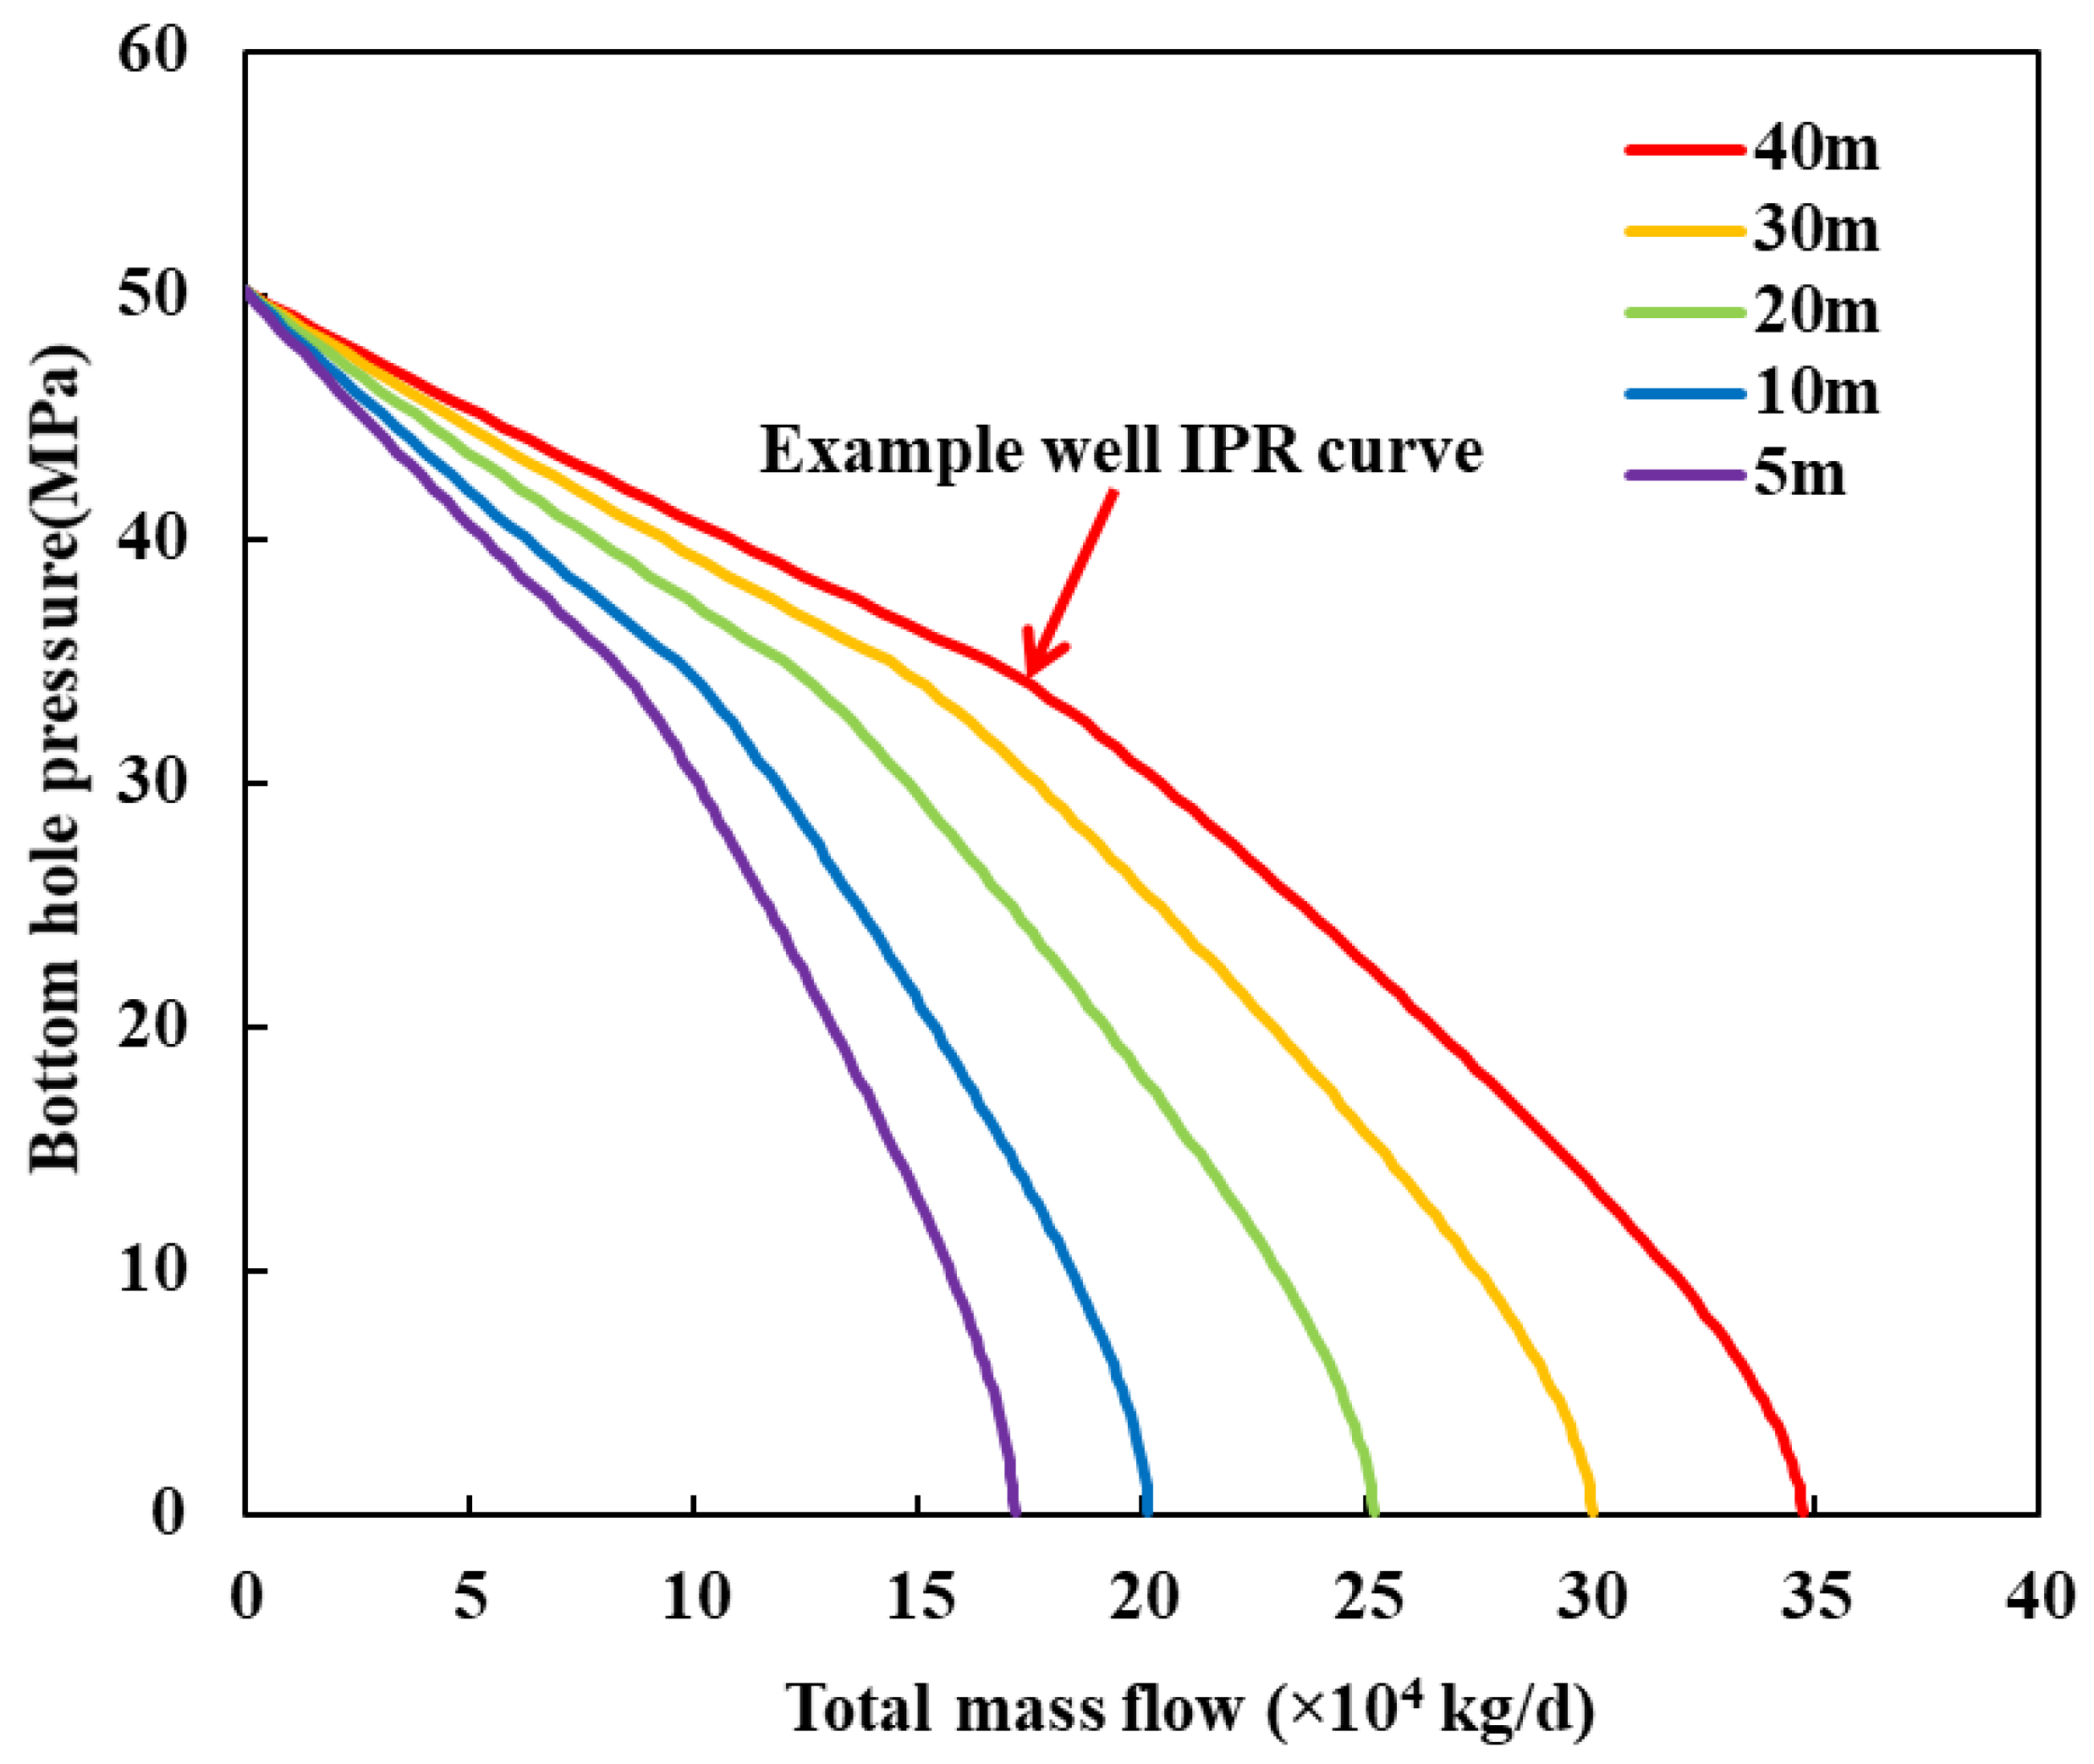
Figure 14 shows the effect of fracture spacing on IPR curves of shale oil wells. It is seen from Figure 14 that as the fracture spacing increases, the production rate of shale oil wells increases, and the lower the bottom hole pressure, the more pronounced this increase in production rate becomes. The reason is that as the fracture spacing decreases, the interference between hydraulic fractures becomes stronger, resulting in a decrease in production rate.

4.3. The Impact of Tree-Shaped Fracture Characteristics on Well Productivity

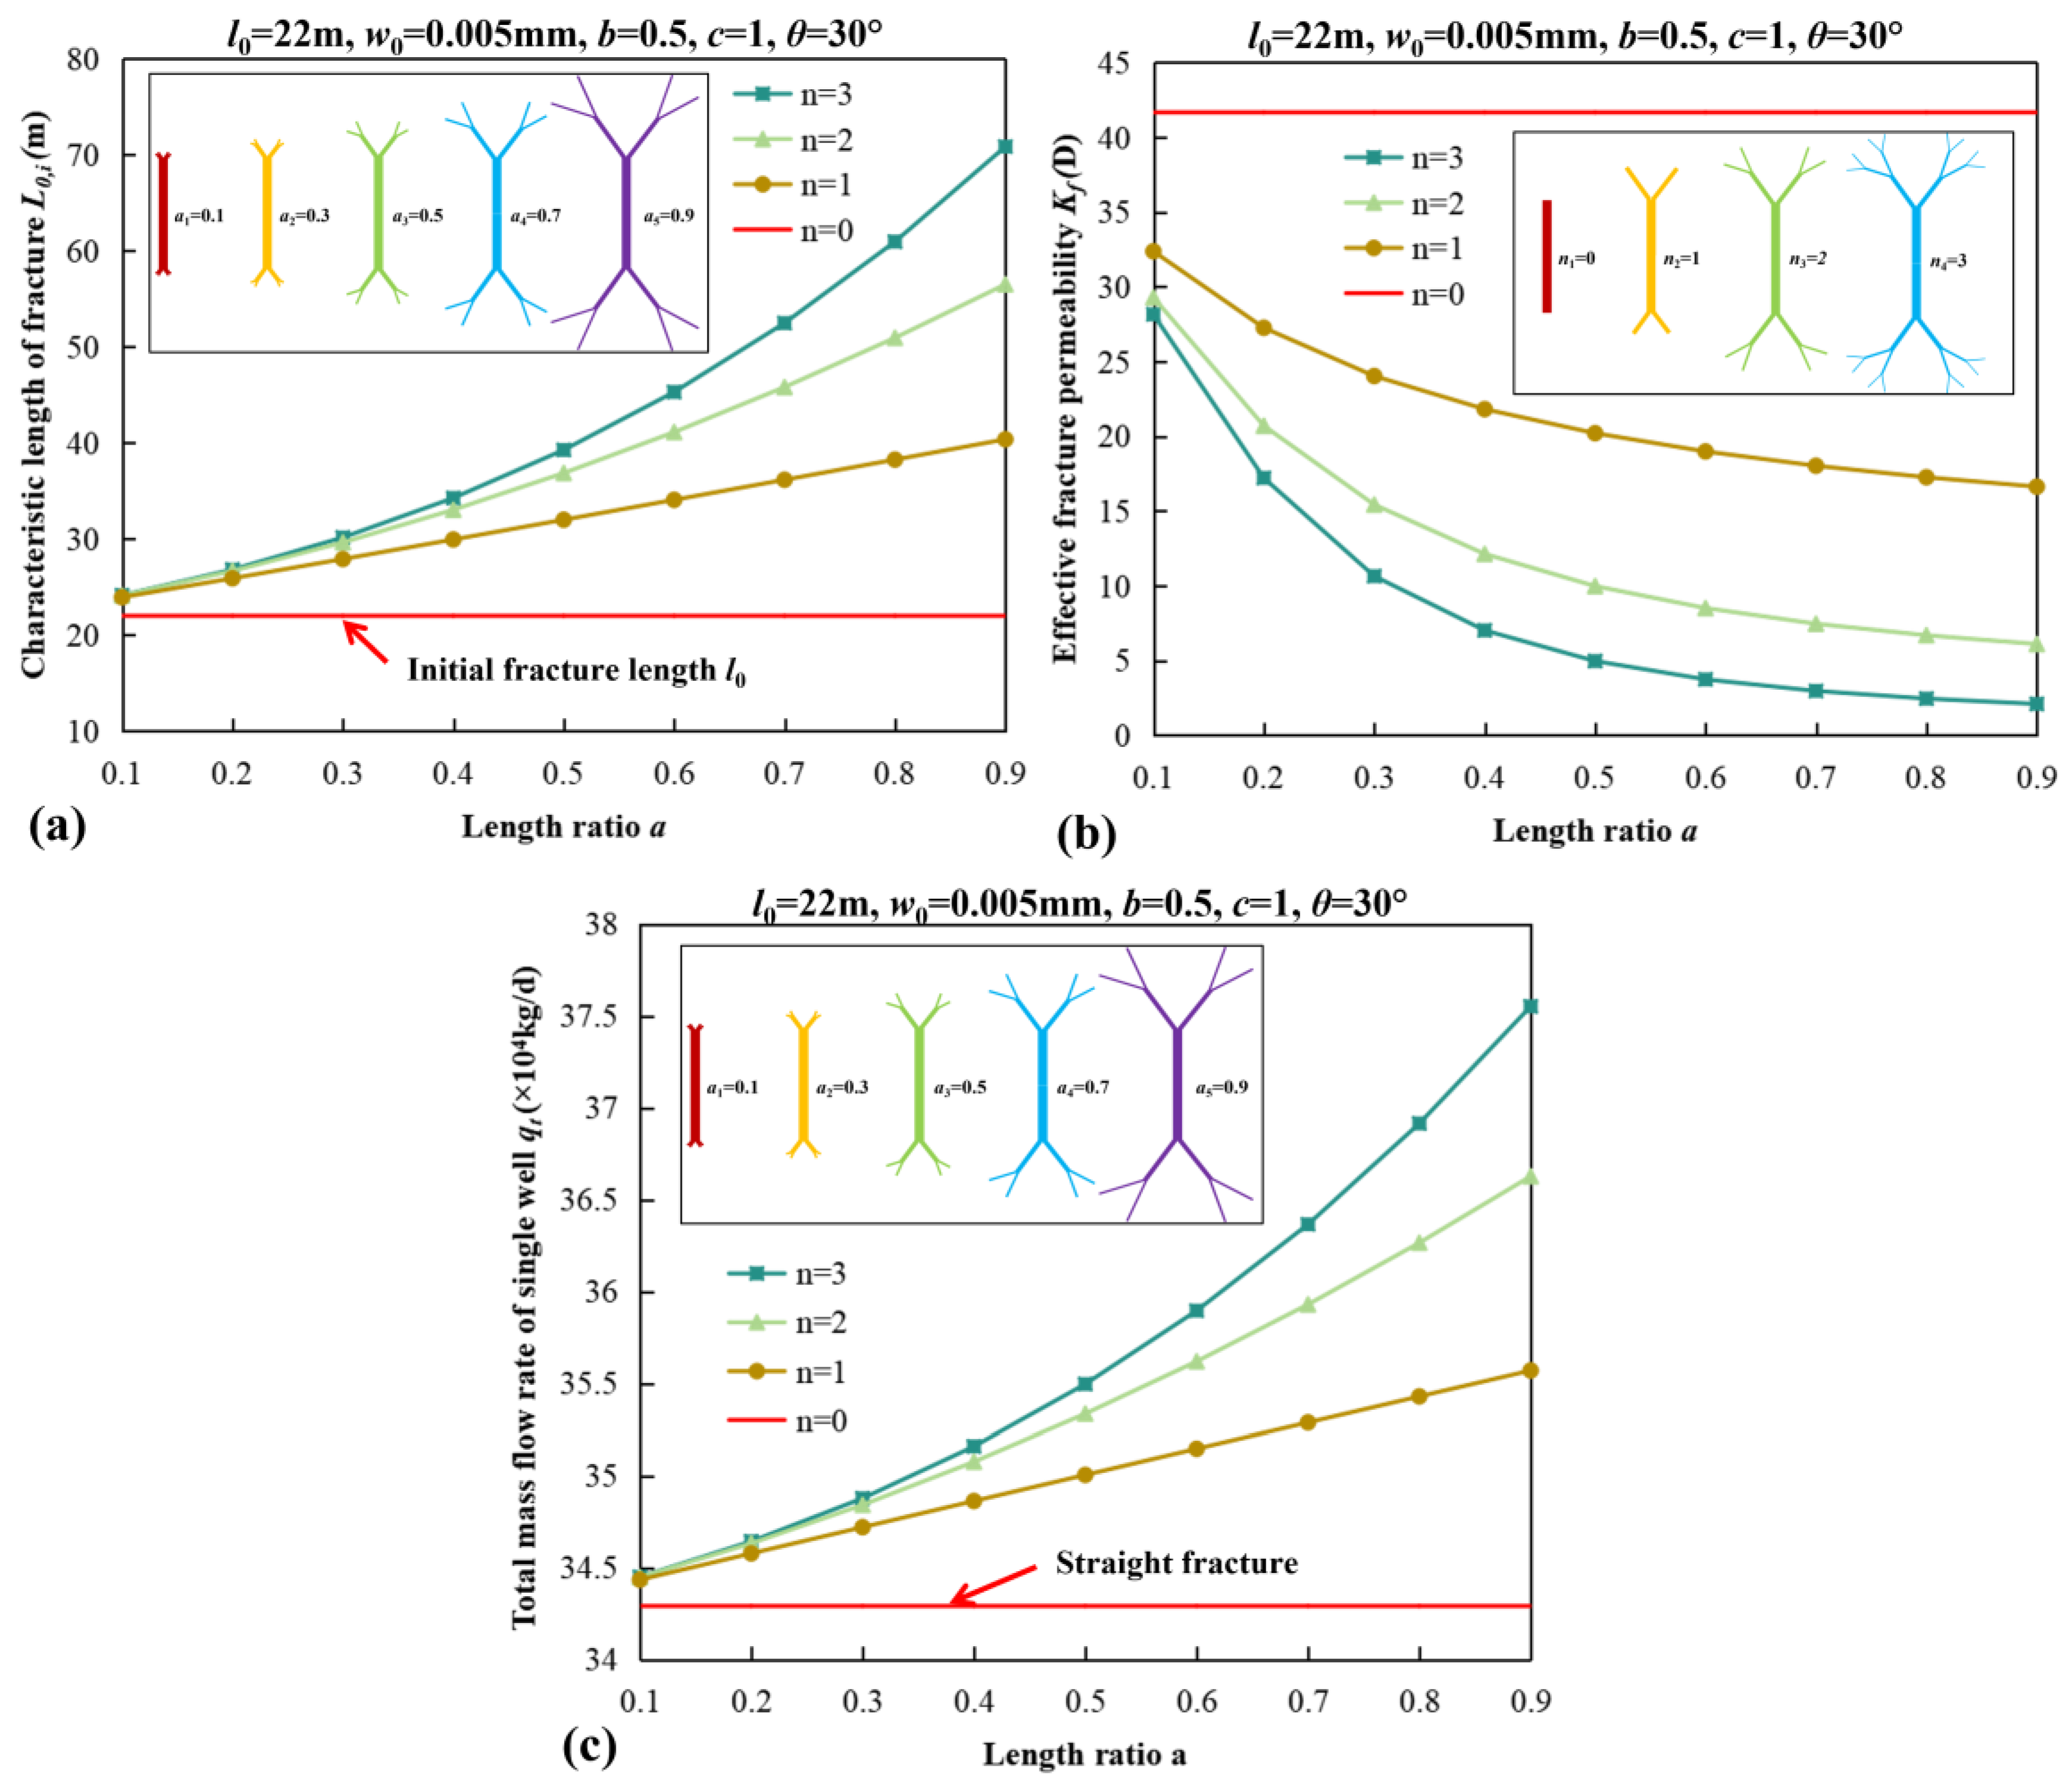
Figure 15 shows the influence of length ratio a at different branch levels n on fracture characteristic length, fracture effective permeability, and well productivity. It can be observed from Figure 15a,b that with an increase in the length ratio and branch level, there is an increase in the fracture characteristic length, accompanied by a corresponding decrease in fracture permeability. This observation suggests that an increase in fracture characteristic length leads to a reduction in fracture conductivity, which can be elucidated through Equation (57). Figure 15c demonstrates a positive correlation between the length ratio and well productivity, indicating that as the length ratio increases, so does the well productivity. Furthermore, it is evident that higher branch levels result in a greater increase in well productivity with an increase in the length ratio.
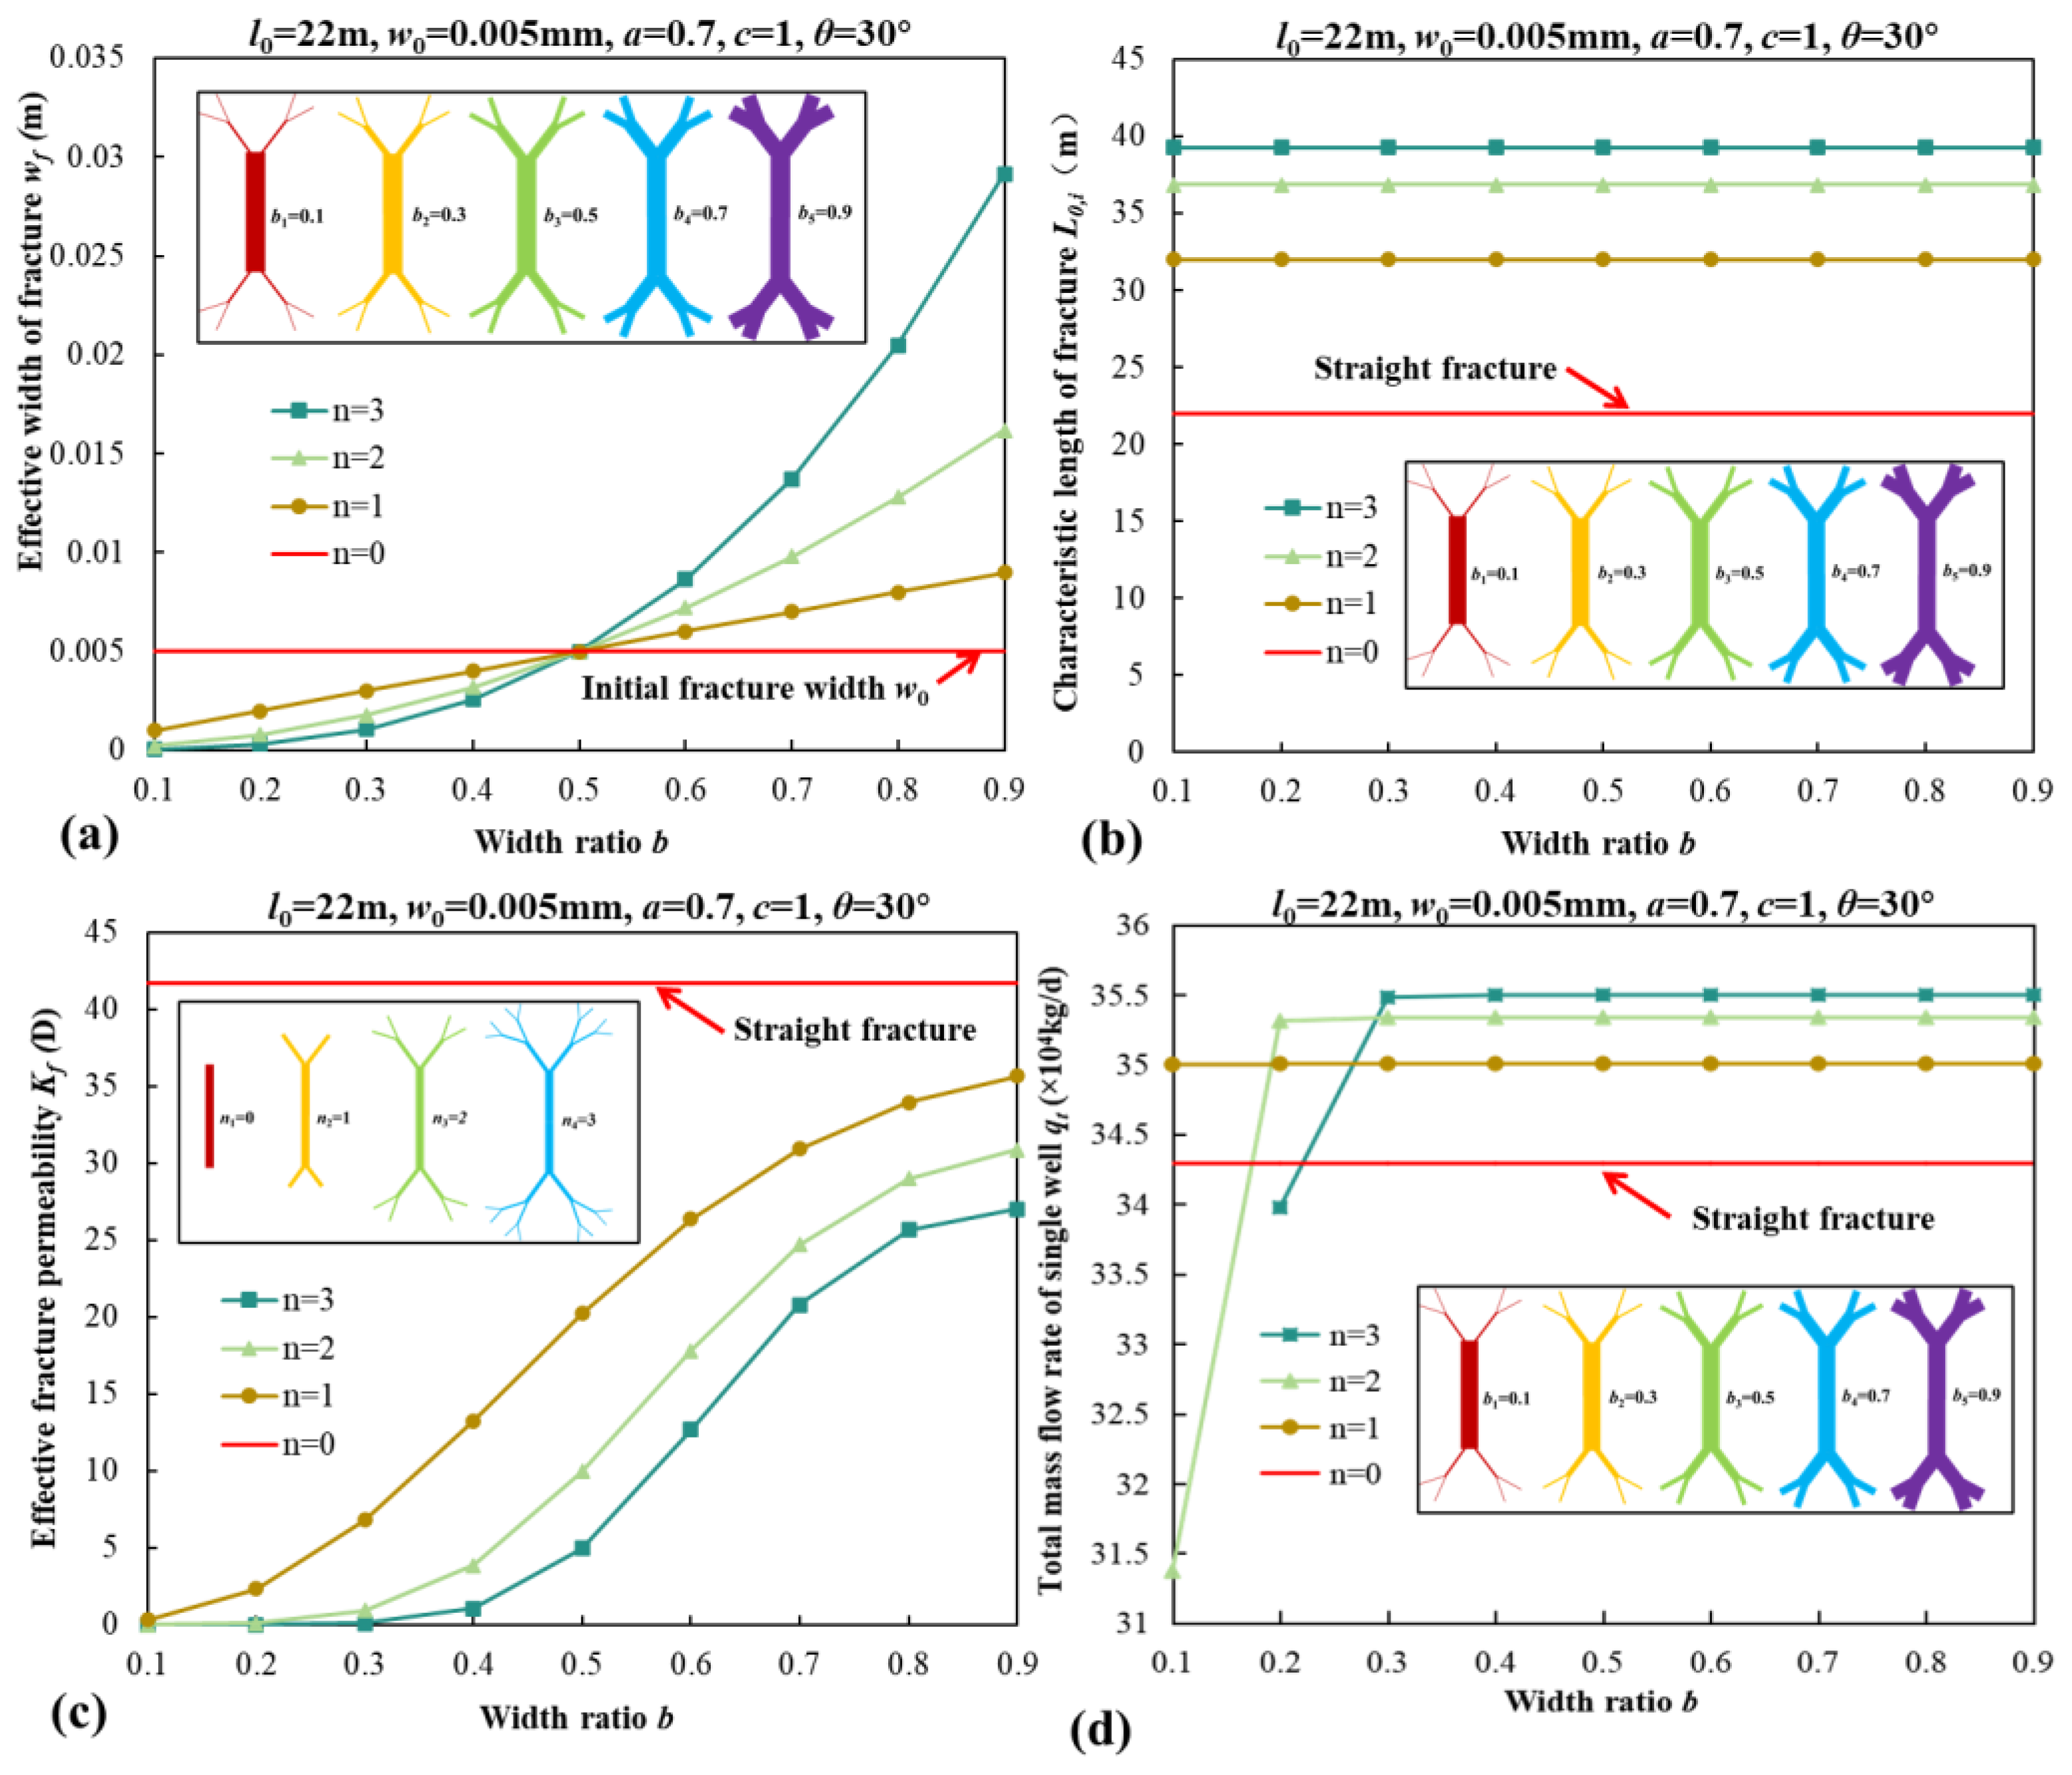
Figure 16 shows the influence of width ratio b at different branch levels n on fracture effective width, fracture characteristic length, fracture effective permeability, and well productivity. The fracture effective width w f increases as the width ratio b increases. For b ≥ 0.5, w f is greater than the initial width w 0 , whereas for b ≤ 0.5, w f is less than the initial width w 0 (Figure 16a). The fracture characteristic length is independent of the width ratio and slowly increases with the elevation of the branch level (Figure 16b). The fracture effective permeability increases with an increase in the width ratio b , while it decreases with an increase in the branch level (Figure 16c). As the width ratio increases, the well productivity gradually increases and reaches a stable value. When n = 0, the fracture exhibits a linear configuration without any branching, and the productivity remains constant regardless of the width ratio of adjacent cracks. When n = 1, the fracture demonstrates high permeability and no starting pressure gradient within the fracture. Under these conditions, the production also remains unaffected by changes in the width ratio of adjacent cracks. Compared to the conventional straight fractures, tree-shaped fractures have the potential to enhance well productivity, although their influence is limited (Figure 16d).
Figure 17 shows the influence of branch angle θ at different branch levels n on fracture characteristic length, fracture effective permeability, and well productivity. The smaller the branch angle, the larger the fracture characteristic length, and the greater the fracture effective permeability. It is evident that well productivity decreases as the branch angle increases; however, there is minimal impact of the branch angle on well productivity.

4.4. The Impact of Oil and Gas Desorption on Well Productivity

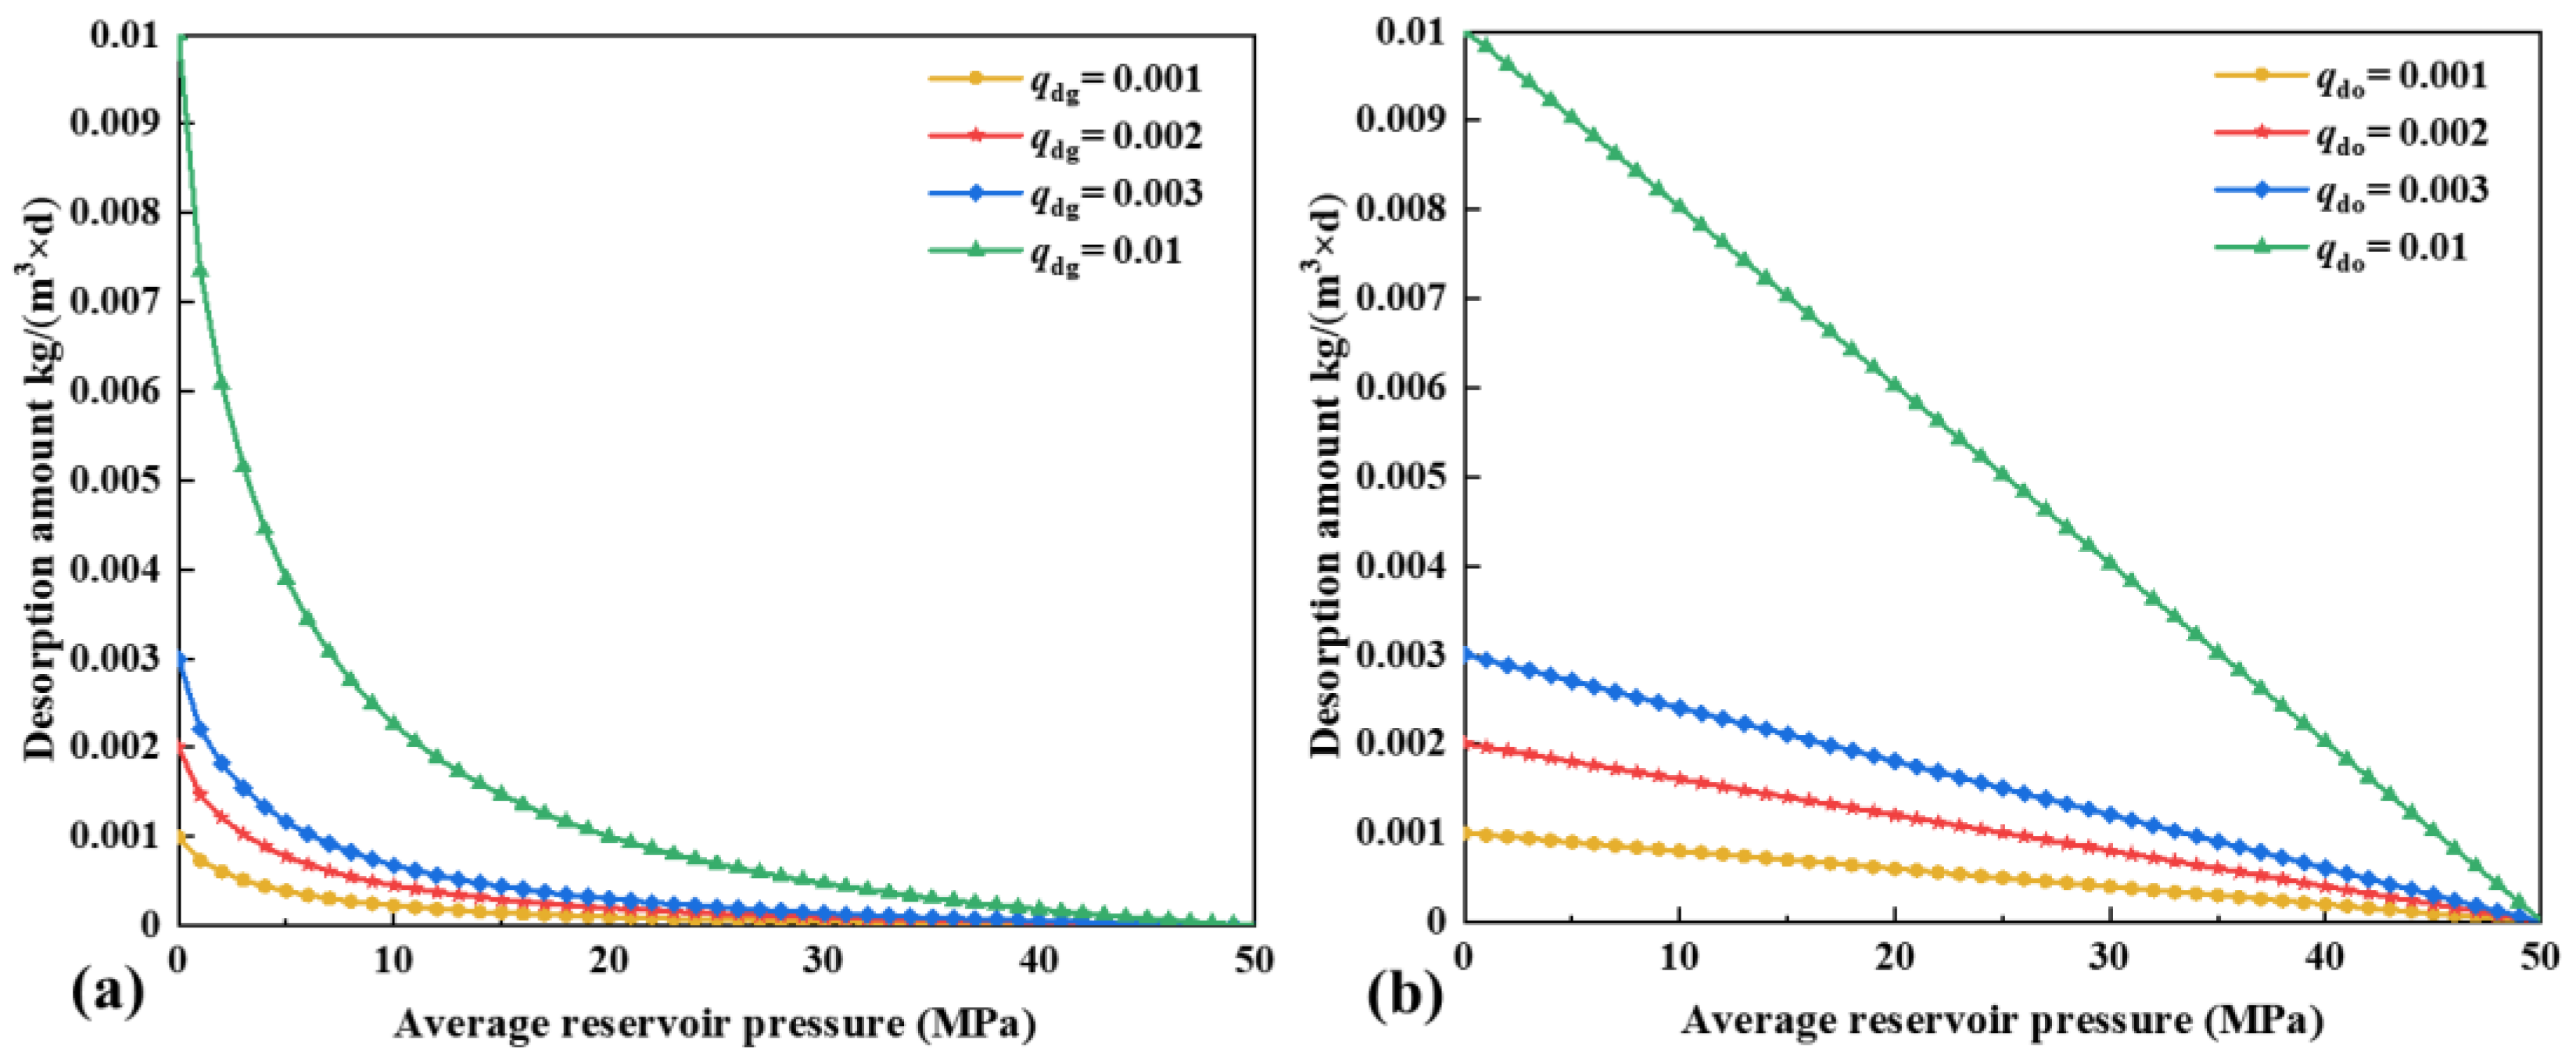
Figure 18 shows the desorption amounts of shale oil and gas change with the pressure. It is observed from Figure 18 that as the pressure decreases, the desorption amount of oil increases linearly, while the desorption amount of gas initially increases slowly and then rapidly.
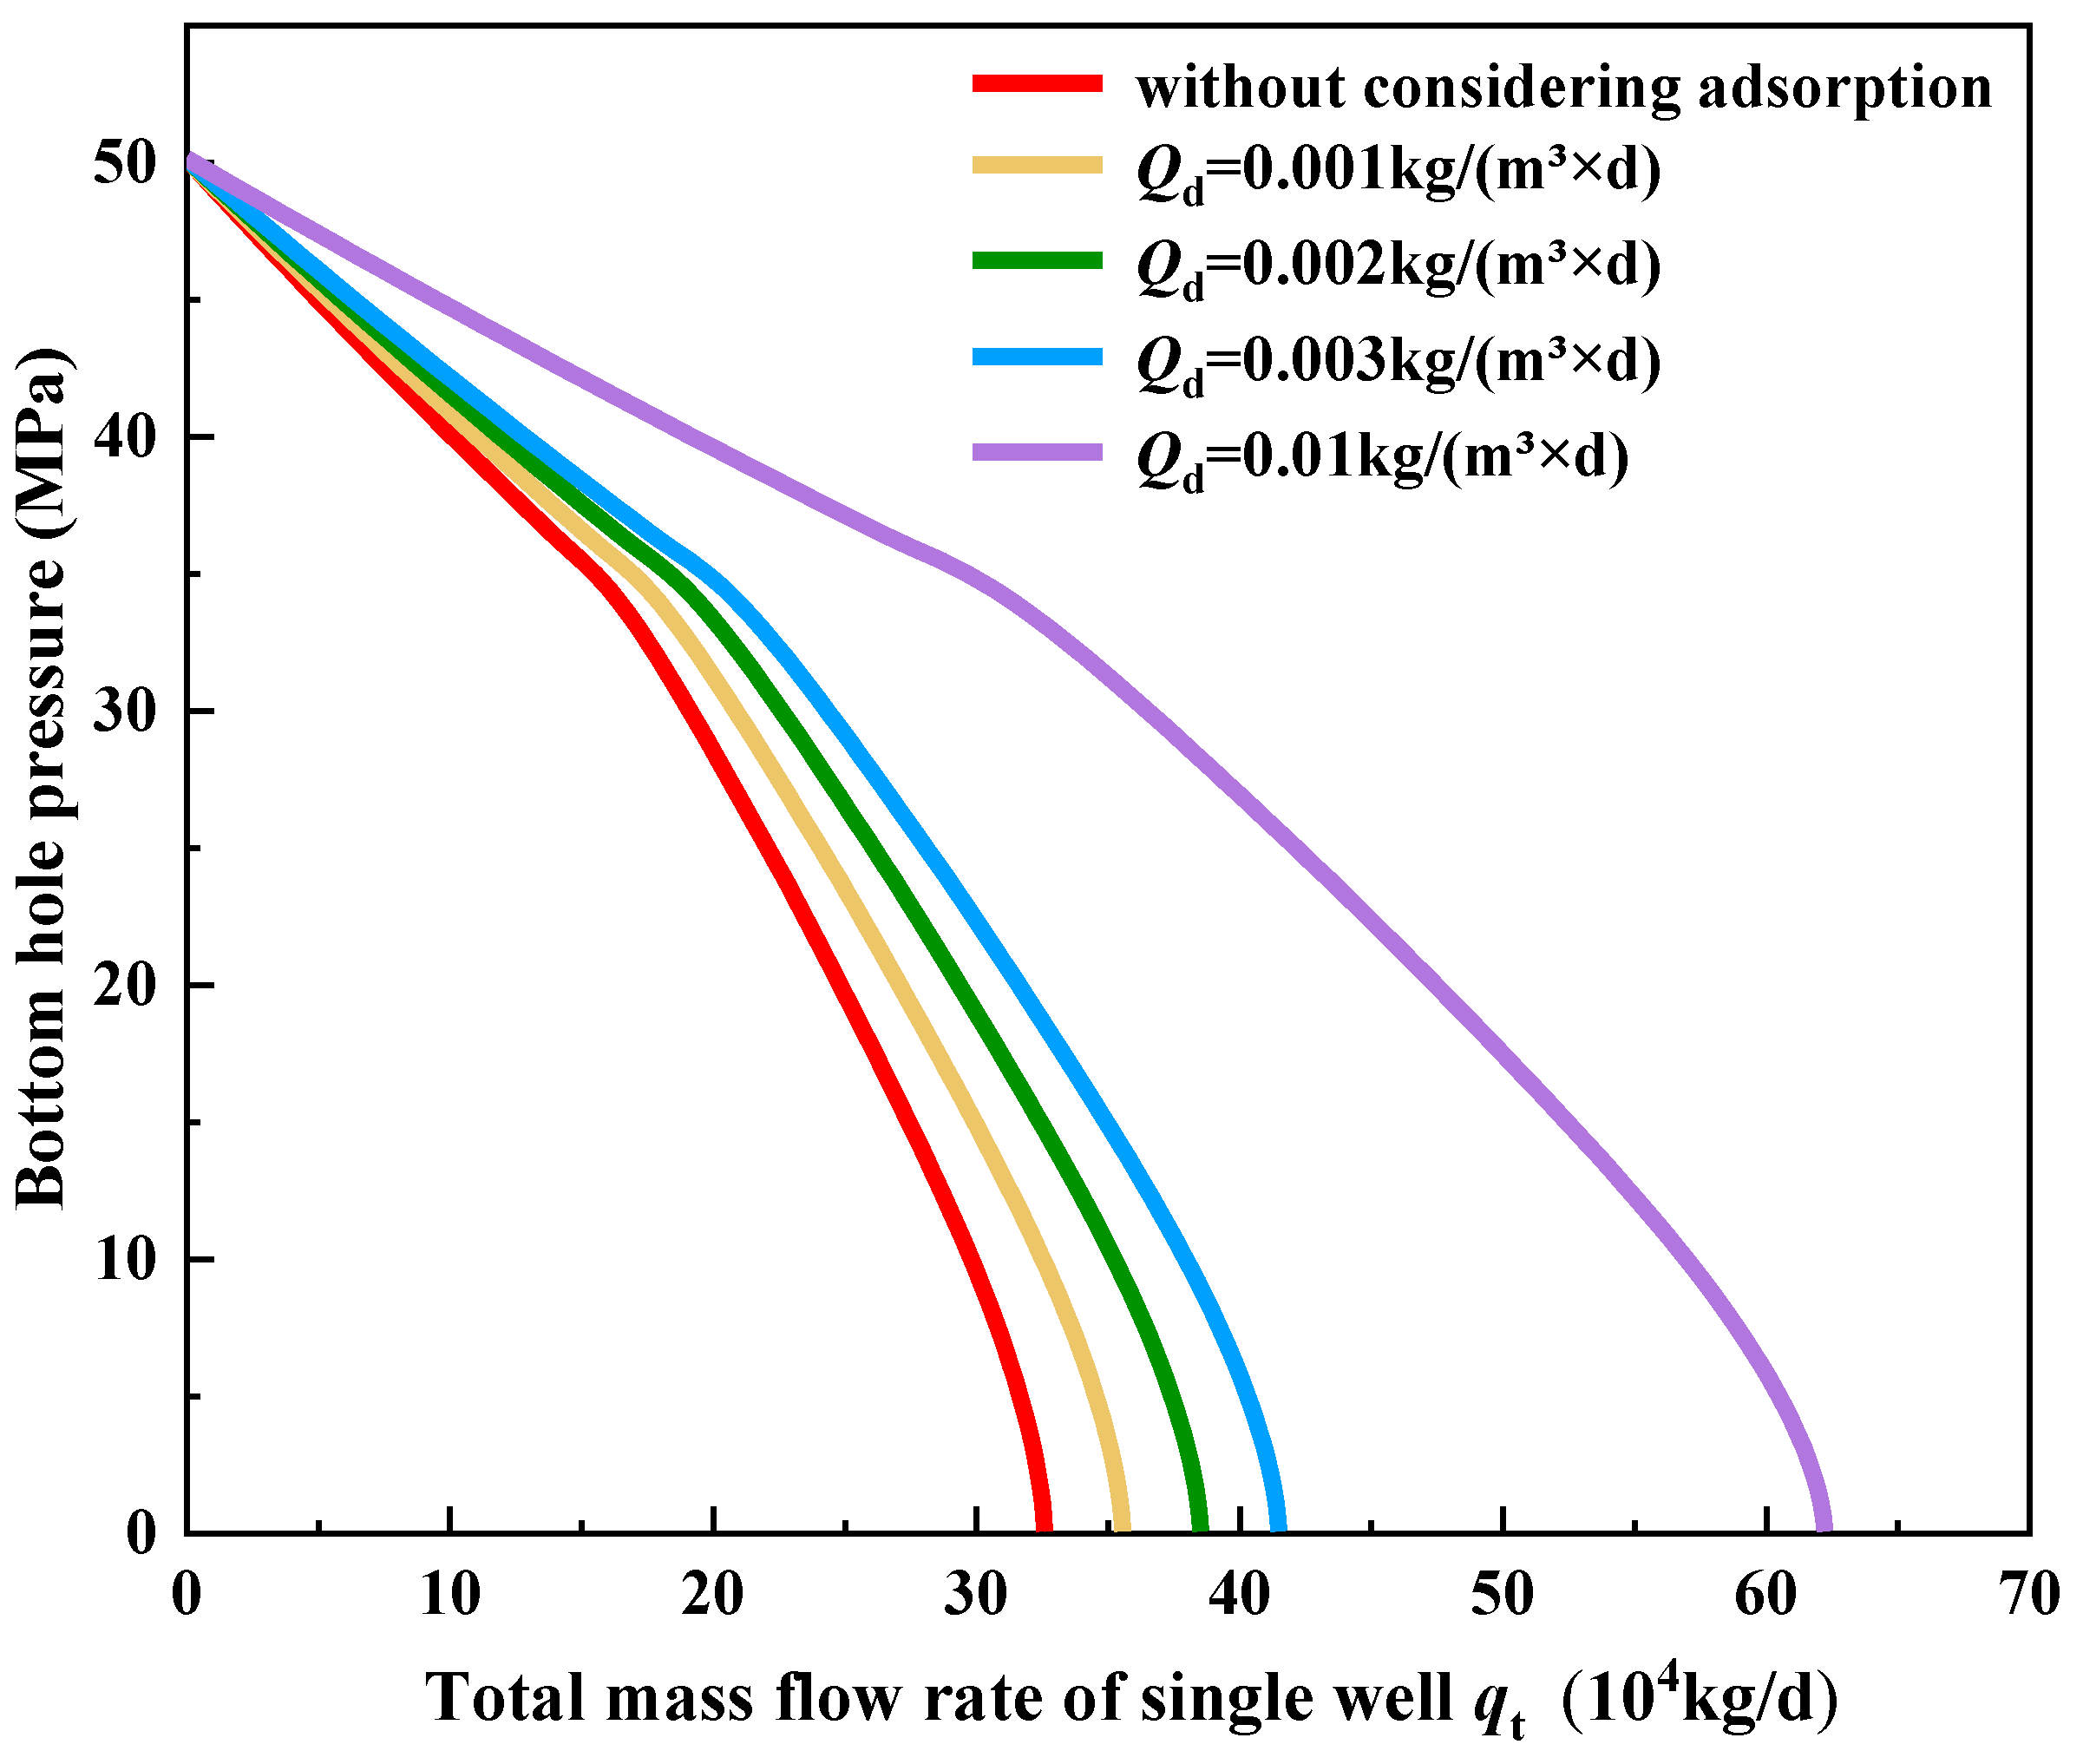
Figure 19 shows the influence of the maximum desorption amount on IPR curves of shale oil wells. It is evident that fluid desorption has a great influence on well productivity. As the maximum desorption amount increases, there is a corresponding increase in well productivity. As shown in Figure 19, when the maximum desorption amount increases from 0.001 kg/(m3·d) to 0.01 kg/(m3·d), there is a significant 75% increase in well productivity. Additionally, as the bottom hole pressure decreases, the impact of desorption on well productivity becomes more pronounced. This can be attributed to the fact that the desorption amounts of shale oil and gas increase with decreasing pressure.

5. Conclusions

In this study, a novel productivity model is proposed for MFHWs in shale oil reservoirs to accurately predict well productivity. This model takes into account the complex, tree-shaped, hydraulically fractured networks, as well as the oil–gas desorption effect and phase change of oil and gas, ensuring a comprehensive understanding of the production process. The proposed model has been validated through comparison with field data from an actual shale oil well. The effects of key parameters on IPR curves are obtained and analyzed. Several important conclusions are drawn as follows:
(1)
Compared to previous productivity models, this model considers the effects of fluid desorption, hydraulic fracture networks, and oil–gas phase behavior, which is more consistent with the actual development of shale oil reservoirs. The predicted results of the proposed model show strong agreement with the field data from an actual shale oil well, confirming the reliability of the proposed model.
(2)
As the pressure decreases, the oil phase undergoes a phase change into a two-phase mixture of oil and gas, leading to an increase in flow resistance. Consequently, this phase behavior of oil and gas results in a significant decrease in well production. As the fracture spacing decreases, the interference between hydraulic fractures becomes stronger, leading to a reduction in well productivity.
(3)
The characteristic parameters of hydraulic fracture networks have a substantial influence on well productivity. The increase in length ratio a , the decline in branch angle θ , and the increase in branch level n result in an increase in well productivity. As the width ratio b increases, the well productivity gradually increases and reaches a stable value.
(4)
As the pressure decreases, the desorption amount of oil exhibits a linear increase, whereas the desorption amount of gas demonstrates an initial slow increase followed by a rapid escalation. As the maximum desorption amount increases, there is a significant enhancement in well productivity, highlighting the crucial role of fluid desorption in improving well performance.

Author Contributions

Conceptualization, X.L. and P.G.; Methodology, X.L. and J.R.; Software, X.L.; Validation, X.L.; Resources, J.R. and Z.W.; Writing—original draft, X.L.; Writing—review & editing, X.L., P.G., J.R., Z.W. and H.T.; Visualization, X.L.; Supervision, P.G., J.R., Z.W. and H.T.; Project administration, P.G.; Funding acquisition, P.G. All authors have read and agreed to the published version of the manuscript.

Funding

This research received no external funding.

Data Availability Statement

The original contributions presented in the study are included in the article, further inquiries can be directed to the corresponding author/s.

Conflicts of Interest

The authors declare no conflict of interest.

References

  1. Zou, C.N.; Yang, Z.; Cui, J.W.; Zhu, R.K.; Hou, L.H.; Tao, S.Z.; Yuan, X.J.; Wu, S.T.; Lin, S.H.; Wang, L. Formation mechanism, geological characteristics and development strategy of nonmarine shale oil in China. Pet. Explor. Dev. 2013, 40, 15–27. [Google Scholar] [CrossRef]
  2. Bažant, Z.P.; Salviato, M.; Chau, V.T.; Viswanathan, H.; Zubelewicz, A. Why fracking works. J. Appl. Mech. 2014, 81, 101010. [Google Scholar] [CrossRef]
  3. Peplow, M. The great gas gold rush. Nature 2017, 550, 26–28. [Google Scholar] [CrossRef] [PubMed]
  4. Hughes, J.D. A reality check on the shale revolution. Nature 2013, 494, 307–308. [Google Scholar] [CrossRef] [PubMed]
  5. Li, J.H.; Li, Y.J.; Sang, Q.; Gong, H.J.; Xu, L.; Zhang, H.Y.; Arif, M.; Dong, M.Z.; Cui, C.Z. Quantification of seepage characteristics in shale oil reservoirs: A triple medium model-driven approach. Geoenergy Sci. Eng. 2024, 242, 213225. [Google Scholar] [CrossRef]
  6. Qu, J.; Tang, Z.; Lei, G.; Wu, Q.; Liao, Q.; Ning, F. A novel threshold pressure gradient model and its influence on production simulation for shale oil reservoirs. Energy Fuels 2024, 38, 11644–11661. [Google Scholar] [CrossRef]
  7. Zou, C.; Zhao, Q.; Dong, D.; Yang, Z.; Qiu, Z.; Liang, F.; Wang, N.; Huang, Y.; Duan, A.; Zhang, Q.; et al. Geological characteristics, main challenges and future prospect of shale gas. Nat. Gas Geosci. 2017, 2, 273–288. [Google Scholar] [CrossRef]
  8. Lei, Q.; Xu, Y.; Cai, B.; Guan, B.; Wang, X.; Bi, G.Q.; Li, H.; Li, S.; Ding, B.; Fu, H.F.; et al. Progress and prospects of horizontal well fracturing technology for shale oil and gas reservoirs. Pet. Explor. Dev. 2022, 49, 191–199. [Google Scholar] [CrossRef]
  9. Zhang, D.; Zhang, L.; Zhao, Y.; Guo, J. A composite model to analyze the decline performance of a multiple fractured horizontal well in shale reservoirs. J. Nat. Gas Sci. Eng. 2015, 26, 999–1010. [Google Scholar] [CrossRef]
  10. Wang, C.; Li, Z.P.; Li, H.; Wei, Q.; Bai, R.T. A new method to calculate the productivity of fractured horizontal gas wells considering non-Darcy flow in the fractures. J. Nat. Gas Sci. Eng. 2015, 26, 981–991. [Google Scholar] [CrossRef]
  11. Wu, J.; Liu, Y.; Yang, H. New method of productivity equation for multibranch horizontal well in three-dimensional anisotropic oil reservoirs. J. Energy Resour. Technol. 2012, 134, 032801. [Google Scholar] [CrossRef]
  12. Wu, J.; Liu, Y.; Yang, H. A new analytical solution of the productivity equation for a vertical fractured well in 3D anisotropic oil reservoirs. Pet. Sci. Technol. 2014, 32, 433–441. [Google Scholar] [CrossRef]
  13. Chen, Z.M.; Liao, X.W.; Zhao, X.L.; Lyu, S.B.; Zhu, L.T. A comprehensive productivity equation for multiple fractured vertical wells with non-linear effects under steady-state flow. J. Pet. Sci. Eng. 2017, 149, 9–24. [Google Scholar] [CrossRef]
  14. Wei, B.C.; Nie, X.R.; Zhang, Z.H.; Ding, J.C.; Shayireatehan, R.Y.Z.; Ning, P.Z.; Deng, D.T.; Cao, Y. Productivity equation of fractured vertical well with gas–water co-production in high-water-cut tight sandstone gas reservoir. Processes 2023, 11, 3123. [Google Scholar] [CrossRef]
  15. Soleimani, R.; Jahanpeyma, Y.; Salehian, M. Analysis of horizontal well productivity in tight gas formations and its sensitivity to reservoir properties. J. Pet. Explor. Prod. Technol. 2019, 9, 1237–1244. [Google Scholar] [CrossRef]
  16. Lou, Y.; Song, H.Q.; Yang, J.S.; Huang, X.H.; Dong, H. Productivity equation of fractured well in CBM reservoirs. J. Nat. Gas Sci. Eng. 2013, 11, 39–45. [Google Scholar] [CrossRef]
  17. Clarkson, C.R.; Williams-Kovacs, J.D. Modeling two-phase flowback of multifractured horizontal wells completed in shale. SPE J. 2013, 18, 795–812. [Google Scholar] [CrossRef]
  18. Song, H.Q.; Liu, Q.P.; Yang, D.W.; Yu, M.X.; Lou, Y.; Zhu, W.Y. Productivity equation of fractured horizontal well in a water-bearing tight gas reservoir with low-velocity non-Darcy flow. J. Nat. Gas Sci. Eng. 2014, 18, 467–473. [Google Scholar] [CrossRef]
  19. Qi, Q.; Zhu, W.Y. The three-zone composite productivity model for a multi-fractured horizontal shale gas well. IOP Conf. Ser. Earth Environ. Sci. 2018, 121, 052051. [Google Scholar] [CrossRef]
  20. Jiang, B.M.; Mu, L.F.; Yan, Y.Q.; Li, Q.; Wu, Z.B.; Chen, J.Y.; Zhang, Q.S. Calculation method of productivity for shale oil in volumetric fractured horizontal wells. ACS Omega 2022, 7, 20495–20504. [Google Scholar] [CrossRef]
  21. Wang, Q.; Wan, J.; Mu, L.; Shen, R.; Jurado, M.J.; Ye, Y. An analytical solution for transient productivity prediction of multi-fractured horizontal wells in tight gas reservoirs considering nonlinear porous flow mechanisms. Energies 2020, 13, 1066. [Google Scholar] [CrossRef]
  22. Yao, S.S.; Wang, X.Z.; Yuan, Q.W.; Guo, Z.X.; Zeng, F. Production analysis of multifractured horizontal wells with composite models: Influence of complex heterogeneity. J. Hydrol. 2020, 583, 124542. [Google Scholar] [CrossRef]
  23. Zhang, H.; Sheng, J.J. Complex fracture network simulation and optimization in naturally fractured shale reservoir based on modified neural network algorithm. J. Nat. Gas Sci. Eng. 2021, 95, 104232. [Google Scholar] [CrossRef]
  24. Lu, M.J.; Qian, Q.; Zhong, A.H.; Yang, F.; He, W.J.; Li, M. High-precision flow numerical simulation and productivity evaluation of shale oil considering stress sensitivity. Fluid Dyn. Mater. Process. 2024, 20, 2281–2300. [Google Scholar] [CrossRef]
  25. Guan, Q.S.; Chen, C.W.; Pu, X.G.; Wan, Y.G.; Xu, J.; Zeng, H.W.; Jia, C.; Gao, H.H.; Yang, W.; Peng, Z.S. Production performance analysis of a continental shale oil reservoir in Bohai Bay basin. Petroleum 2024, 10, 294–305. [Google Scholar] [CrossRef]
  26. Yan, Z.; Wang, F.; Liu, Y.; Wang, P. A coupled matrix-fracture productivity calculation model considering low-velocity non-Darcy flow in shale reservoirs. Fuel 2024, 357, 129845. [Google Scholar] [CrossRef]
  27. Zhang, Q.; Wang, W.D.; Su, Y.L.; Chen, W.; Lei, Z.D.; Li, L.; Hao, Y.M. A semi-analytical model for coupled flow in stress-sensitive multi-scale shale reservoirs with fractal characteristics. Pet. Sci. 2024, 21, 327–342. [Google Scholar] [CrossRef]
  28. Wang, Z.P.; Zhu, W.Y.; Yue, M.; Gao, Y.; Zhao, G.J.; Wang, H.Q. A method to predict the production of fractured horizontal wells in low/ultra-low permeability reservoirs. Chin. J. Eng. 2012, 34, 750–754. [Google Scholar]
  29. Li, Q.; Li, Q.C.; Wang, F.L.; Wu, J.J.; Wang, Y.L. The carrying behavior of water-based fracturing fluid in shale reservoir fractures and molecular dynamics of sand-carrying mechanism. Processes 2024, 12, 2051. [Google Scholar] [CrossRef]
  30. Li, Q.C.; Li, Q.; Han, Y. A numerical investigation on kick control with the displacement kill method during a well test in a deep-water gas reservoir: A case study. Processes 2024, 12, 2090. [Google Scholar] [CrossRef]
  31. Wang, J.G.; Hu, B.W.; Wu, D.; Dou, F.K.; Wang, X.L. A multiscale fractal transport model with multilayer sorption and effective porosity effects. Transp. Porous Media 2019, 129, 25–51. [Google Scholar] [CrossRef]
  32. Lane, H.S.; Lancaster, D.E.; Watson, A.T. Characterizing the role of desorption in gas production from Devonian shales. Energy Sources 1991, 13, 337–359. [Google Scholar] [CrossRef]
  33. Bumb, A.C.; McKee, C.R. Gas-well testing in the presence of desorption for coalbed methane and Devonian shale. SPE Form. Eval. 1988, 3, 179–185. [Google Scholar] [CrossRef]
  34. Jenkins, C.D.; Boyer, C.M. Coalbed- and shale-gas reservoirs. J. Pet. Technol. 2008, 60, 92–99. [Google Scholar] [CrossRef]
  35. Guo, C.; Xu, J.; Wu, K. Study on gas flow through nano pores of shale gas reservoirs. Fuel 2015, 143, 107–117. [Google Scholar] [CrossRef]
  36. Xiong, H.; Devegowda, D.; Huang, L.L. Water bridges in clay nanopores: Mechanisms of formation and impact on hydrocarbon transport. Langmuir 2020, 36, 723–733. [Google Scholar] [CrossRef]
  37. Singh, H.; Javadpour, F.; Ettehadtavakkol, A.; Darabi, H. Nonempirical apparent permeability of shale. SPE Reserv. Eval. Eng. 2014, 17, 414–424. [Google Scholar] [CrossRef]
  38. Li, M.; Su, Y.L.; Dong, M.Z.; Zhou, L.H.; Li, Y.J.; Pu, X.G.; Li, S.; Han, W.Z.; Wang, W.D. A numerical study of fluids desorption and phase behavior in shale oil reservoir using a chemical reaction model. J. Pet. Sci. Eng. 2021, 196, 108050. [Google Scholar] [CrossRef]
  39. Mo, C.P.; Zhang, G.D.; Zhang, Z.W.; Yuan, Y.H.; Yang, S. Productivity calculation model for fractured horizontal wells considering phase variation. J. Pet. Sci. Eng. 2022, 209, 109811. [Google Scholar] [CrossRef]
  40. Liu, X.Y.; Zhang, D.X. A review of phase behavior simulation of hydrocarbons in confined space: Implications for shale oil and shale gas. J. Nat. Gas Sci. Eng. 2019, 68, 102901. [Google Scholar] [CrossRef]
  41. Liu, X.Y.; Li, X.; Zhang, D.X. A statistical thermodynamics-based equation of state and phase equilibrium calculation for confined hydrocarbons in shale reservoirs. J. Nat. Gas Sci. Eng. 2022, 102, 104579. [Google Scholar] [CrossRef]
  42. Alharthy, N.; Teklu, T.; Kazemi, H.; Graves, R.; Hawthorne, S.; Braunberger, J.; Kurtoglu, B. Enhanced oil recovery in liquid–rich shale reservoirs: Laboratory to field. SPE Reserv. Eval. Eng. 2018, 21, 137–159. [Google Scholar] [CrossRef]
  43. Yang, Y.; Yang, Y.M.; Ma, S.; Ju, Y.; Guo, Y.C.; Yu, Y. Crack propagation induced by hydraulic fracturing in low permeability rocks using CT technology. J. Min. Saf. Eng. 2013, 30, 739–743. [Google Scholar]
  44. Chen, M. Re-orientation and propagation of hydraulic fractures in shale gas reservoir. J. China Univ. Pet. 2013, 37, 88–94. [Google Scholar]
  45. Deng, J.; Zhu, W.Y.; Liu, J.X.; Zhang, Z.; Ma, Q.; Zhang, M.; Deng, K.; Ma, L. Productivity prediction model of shale gas considering stress sensitivity. Nat. Gas Geosci. 2013, 24, 456–460. [Google Scholar]
  46. Zhu, W.Y.; Yue, M.; Song, H.Q.; Yang, J.S.; Wang, Y.B.; Yu, M.X. Productivity model of gas flow in CBM fractured reservoirs considering desorption and diffusion. J. Basic Sci. Eng. 2013, 21, 953–960. [Google Scholar]
  47. Xu, P.; Yu, B.M.; Yun, M.J.; Zou, M.Q. Heat conduction in fractal tree-like branched networks. Int. J. Heat Mass Transf. 2006, 49, 3746–3751. [Google Scholar] [CrossRef]
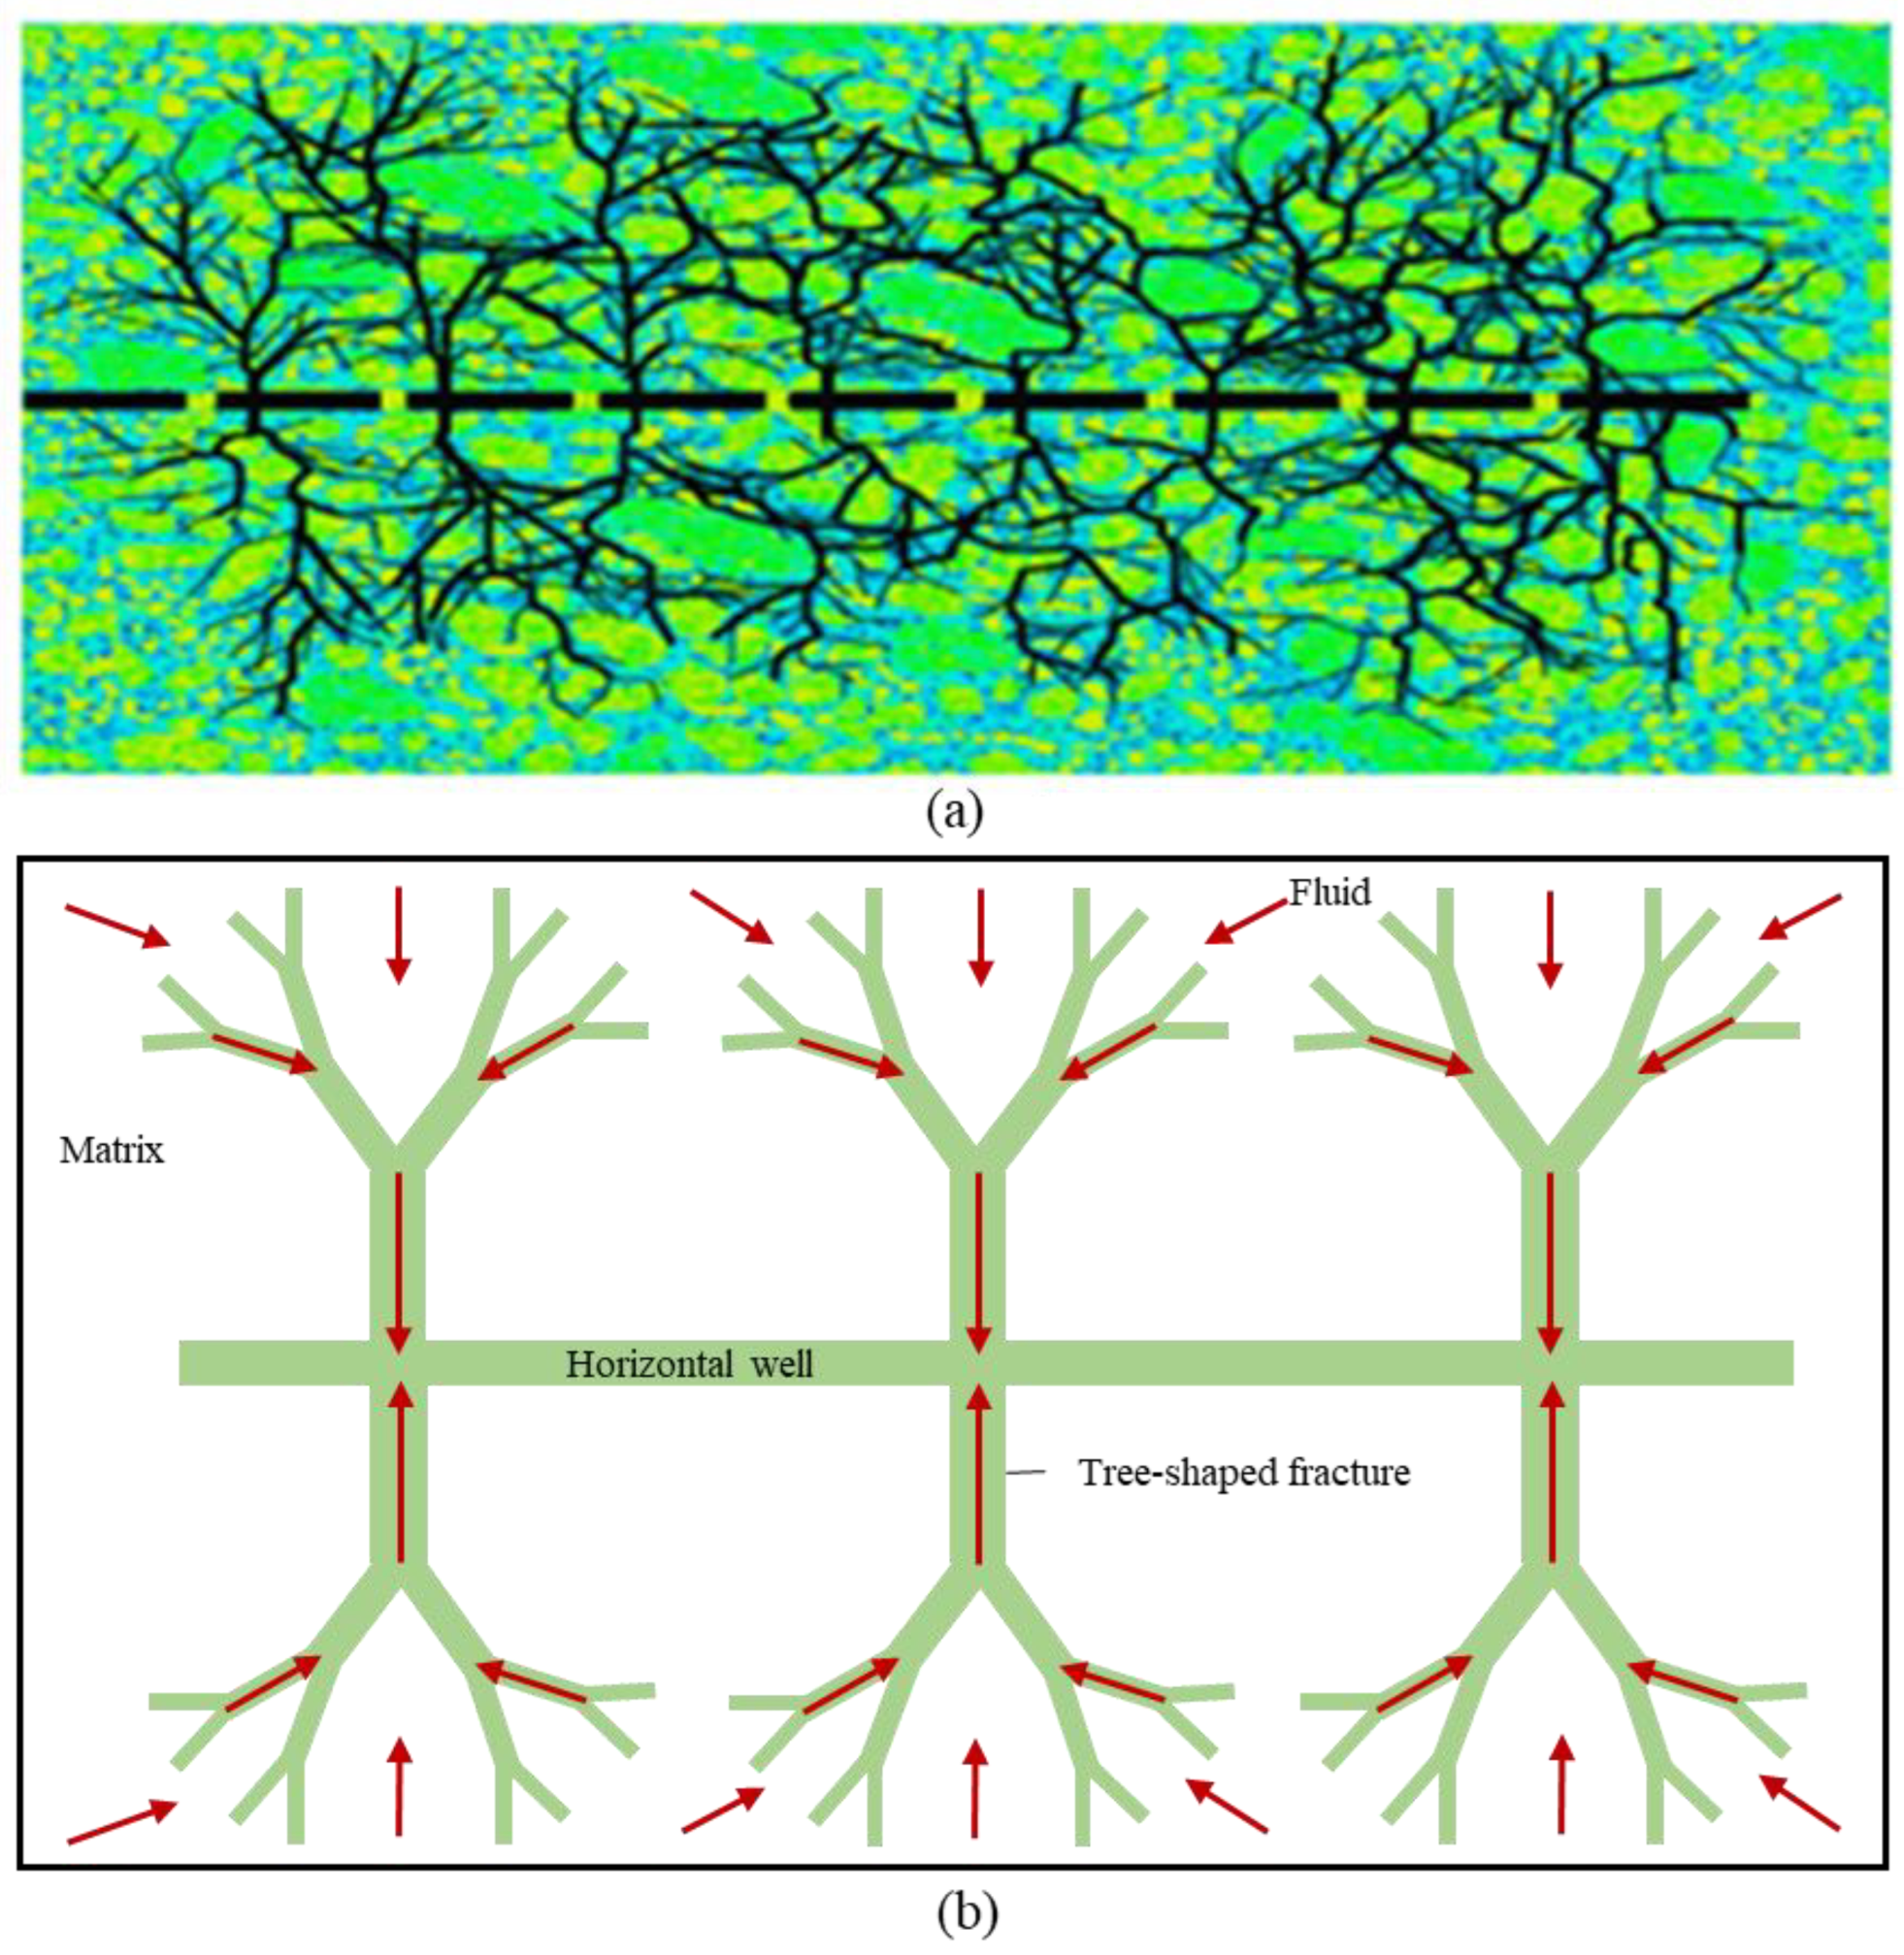
Figure 1. Horizontal well with tree-shaped fracture networks (a) Artificial fracture propagation law, (b) Tree-shaped fracture network model.
Energies 17 06012 g001
Figure 2. Conformal transformation diagram for the seepage region of a fracture.
Energies 17 06012 g002
Figure 3. Diagram of tree-shaped fracture network.
Energies 17 06012 g003
Figure 4. Transformation diagram of tree-shaped fractures and rectangular fractures.
Energies 17 06012 g004
Figure 5. Multiple tree-shaped fractures distributed along a horizontal well.
Energies 17 06012 g005
Figure 6. Flowchart for calculating two-phase pseudo-pressure.
Energies 17 06012 g006
Figure 7. Flow chart of solution procedure for the proposed productively model.
Energies 17 06012 g007
Figure 8. Comparison of the calculated PVT parameters with experimental results (a) CCE experimental fitting results, (b) differential liberation experimental fitting results.
Energies 17 06012 g008
Figure 9. Comparison of the calculated IPR curves with field data of the PA-1 well for (a) total mass flow rate q t , (b) oil production rate q o , and (c) gas production rate q g .
Energies 17 06012 g009
Figure 10. Comparison of the calculated IPR curves with field data of the YY-1 well for (a) total mass flow rate q t , (b) oil production rate q o , and (c) gas production rate q g .
Energies 17 06012 g010
Figure 11. Conceptual model of a MFHW generated by CMG.
Energies 17 06012 g011
Figure 12. Comparison of the calculated IPR curves with CMG numerical solutions under different average formation pressures.
Energies 17 06012 g012
Figure 13. The relationship between shale oil production and bottom hole pressure with and without considering the phase behavior.
Energies 17 06012 g013
Figure 14. Effect of fracture spacing on IPR curves of shale oil wells.
Energies 17 06012 g014
Figure 15. The influence of length ratio a at different branch levels n on (a) fracture characteristic length L 0 , i , (b) fracture effective permeability K f , and (c) well productivity q t .
Energies 17 06012 g015
Figure 16. The influence of width ratio b at different branch levels n on (a) fracture effective width w f , (b) fracture characteristic length L 0 , i , (c) fracture effective permeability K f , and (d) well productivity q t .
Energies 17 06012 g016
Figure 17. The influence of branch angle θ at different branch levels n on (a) fracture characteristic length L 0 , i , (b) fracture effective permeability K f , and (c) well productivity q t .
Energies 17 06012 g017
Figure 18. (a) Desorption amount of shale gas q d g and (b) desorption amount of shale oil q d o change with pressure.
Energies 17 06012 g018
Figure 19. The influence of the maximum desorption amount on IPR curves of shale oil wells.
Energies 17 06012 g019
Table 1. Characteristic parameters of tree-shaped fractures.
Characteristic ParameterSymbolCharacteristic ParameterSymbol
Fracture characteristic length at i-level L 0 , i Branch angle of crack θ
Fracture length at i-level l i Length ratio of adjacent cracks a
Fracture width at i-level w i Width ratio of adjacent cracks b
Fracture height at i-level h i Height ratio of adjacent cracks c
Initial fracture length l 0 Fracture branch grade n
Initial fracture width w 0 Fracture branch number m
Initial fracture height h 0 Rectangular fracture permeability k s l i t
Effective width of tree-shaped crack w f Fracture effective porosity ϕ f
Total volume of tree-shaped crack V f Tree-shaped fracture permeability k f
Total length of tree-shaped crack L f Correctional fracture permeability K f
Equivalent area of tree-shaped crack A f
Table 2. Molar composition of sample.
ComponentMolar Composition, %Molecular Weight, g/mol
CO20.11244.01
N20.28028.01
C156.79816.04
C216.71630.07
C35.76544.1
iC41.41558.12
nC41.57158.12
iC50.94272.15
nC50.46872.15
C60.40386.18
C71.304100.2
C81.959114.23
C91.420128.26
C101.175142.29
C11+9.672248.18
Table 3. Basic parameters of the PA-1 well and YY-1 well.
ParameterPA-1YY-1ParameterPA-1YY-1
Fracture number, N 2131Bubble point pressure, P b , MPa36.1736.17
Horizontal well length, L , m8171400Reservoir pressure, P e , MPa50.1432.19
Control radius, r e , m500750Matrix permeability, K , mD0.0250.016
Well radius, r w f , m0.069850.06985Reservoir thickness, h , m63.520
0-level fracture length, l 0 , m2228Oil density, ρ o s c , kg/m3786.2786.2
0-level fracture width, w 0 , mm0.0050.005Gas density, ρ g s c , kg/m30.96080.9608
Length ratio, a 0.50.5Reservoir temperature, T , °C66.566.5
Width ratio, b 0.50.5Langmuir volume, V L , m3/kg5.82 × 10−35.82 × 10⁻³
Height ratio, c 11Langmuir pressure, P L , MPa4.454.45
Branch angle, θ 30°30°
Branch number, m 22
Fracture branch level, n 33
Disclaimer/Publisher’s Note: The statements, opinions and data contained in all publications are solely those of the individual author(s) and contributor(s) and not of MDPI and/or the editor(s). MDPI and/or the editor(s) disclaim responsibility for any injury to people or property resulting from any ideas, methods, instructions or products referred to in the content.