Article

Correlating Sediment Erosion in Rotary–Stationary Gaps of Francis Turbines with Complex Flow Patterns

1
Waterpower Laboratory, Department of Energy & Process Engineering, Norwegian University of Science and Technology, 7034 Trondheim, Norway
2
Turbine Testing Lab, Kathmandu University, Dhulikhel 45200, Nepal
3
Aker Solutions Hydropower AS, 1325 Lysaker, Norway
*
Author to whom correspondence should be addressed.
Energies 2024, 17(23), 5961; https://doi.org/10.3390/en17235961
Submission received: 8 October 2024 / Revised: 7 November 2024 / Accepted: 19 November 2024 / Published: 27 November 2024
(This article belongs to the Section A: Sustainable Energy)

Abstract

:
Secondary flows in Francis turbines are induced by the presence of a gap between guide vanes and top–bottom covers and rotating–stationary geometries. The secondary flow developed in the clearance gap of guide vanes induces a leakage vortex that travels toward the turbine downstream, affecting the runner. Likewise, secondary flows from the gap between rotor–stator components enter the upper and lower labyrinth regions. When Francis turbines are operated with sediment-laden water, sediment-containing flows affect these gaps, increasing the size of the gap and increasing the leakage flow. This work examines the secondary flows developing at these locations in a Francis turbine and the consequent sediment erosion effects. A reference Francis turbine at Bhilangana III Hydropower Plant (HPP), India, with a specific speed (Ns = 85.4) severely affected by a sediment erosion problem, was selected for this study. All the components of the turbine were modeled, and a reference numerical model was developed. This numerical model was validated with numerical uncertainty measurement and experimental results. Different locations in the turbine with complex secondary flows and the consequent sediment erosion effects were examined separately. The erosion effects at the guide vanes were due to the development of leakage flow inside the guide vane clearance gaps. At the runner inlet, erosion was mainly due to a leakage vortex from the clearance gap and leakage flow from rotor–stator gaps. Toward the upper and bottom labyrinth regions, erosion was mainly due to the formation of secondary vortical rolls. The simultaneous effects of secondary flows and sediment erosion at all these locations were found to affect the overall performance of the turbine.

1. Introduction

At present, due to energy consumption around the globe, there is an increasing concentration of atmospheric greenhouse gases caused by the emission of harmful gases from non-renewable energy sources. Therefore, present-day energy demand needs to be fulfilled by the use of renewable energy sources [1,2]. When it comes to harnessing renewable energy resources, the enormous potential of hydropower sources always surpasses that of other forms of energy, mainly due to the efficiency of hydro-turbines and the usefulness of hydropower in cases that require frequent shutdowns/restarts [3].
Hydro energy generation requires a machine that converts the available potential into a useful form of energy. Out of the different kinds of hydro-turbines, Francis turbines are the most commonly used. However, these turbines, most widely used in hydropower plants, are also associated with flow complexities and, more significantly, sediment erosion challenges [4,5,6]. They are mixed-flow reaction machines, where the fluid enters the machine radially and exits the runner in an axial direction. During this process, hydraulic energy conversion takes place in different components, which causes associated flow losses [4,6,7].
In Francis turbines, flow leaving the penstock enters the spiral casing inlet, which usually has a circular cross-section. Through the spiral casing, it enters the stay vanes, which do not perform any hydraulic functions but allow flow passage to enter the guide vanes. In the guide vanes, energy conversion takes place, and nearly half of the available hydraulic energy is converted to kinetic energy [4]. Thus, the accelerated flow can be predicted toward the runner inlet. In the runner, energy conversion from hydraulic energy to mechanical energy takes place, and the draft tube converts the residual flow energy to the pressure head and improves the hydraulic efficiency of the turbine. Although these components are designed to perform the desired functions, due to the complexity and the nature of the fluid flow, several losses occur in these components, and these losses cause the efficiency of the turbine to drop. The IEC [8] has defined hydraulic turbine efficiency based on the net head acting on the turbine as follows:
η I E C = O u t p u t   p o w e r I n p u t   p o w e r = τ r u n n e r × ω r u n n e r ρ × g × Q × H = τ r u n n e r × ω r u n n e r ρ × g × Q p s t a t i n ρ × g + 1 2 g Q A i n 2 p s t a t o u t ρ × g + 1 2 g Q A o u t 2
A study by Iliev et al. presented the different kinds of losses that occur in a typical Francis turbine [9] and reported that secondary flows and friction losses occur for all components. In addition, losses due to wake mixing and flow incidence occur at the stay vanes, guide vanes, and runner, and the elbow structure and channel divergence occurring in the draft tube induce losses in the draft tube. By incorporating the losses that occur in a Francis turbine, the efficiency equation, as suggested by the IEC [8], can be represented as follows:
η I E C = 1 P L o s s P i n = 1 P L o s s s p i r a l c a s e + P L o s s s t a y v a n e s + P L o s s g u i d e v a n e s + P L o s s r u n n e r + P L o s s d r a f t t u b e + P L o s s l e a k a g e + P L o s s d i s c f r i c t i o n P i n
The study of these losses has been a major research concern over the past two decades as, by minimizing them, the efficiency of turbines can be improved. The following studies were conducted to investigate and/or minimize such losses [7,10,11,12,13,14,15]: Zemanová and Rudolf presented a comprehensive review of fluid flow inside the gap between rotor–stator components and suggested that the flow in such regions can influence a turbine’s overall flow, thus affecting the overall performance in terms of efficiency [10]. A study by Ayad et al. presented a numerical method for investigating the effect of these clearances on a pump’s performance in terms of the overall head and efficiency [11]. Likewise, Schiffer [7,12] reported that the losses due to the runner were higher compared to those due to other components, such as guide vanes, and leakages, which were also significant in the turbine studied. The losses due to leakage were from the sidewall gaps of the runner that flows toward the labyrinths. In the same study, without considering the losses from the guide vane clearance gaps, guide vane losses were found to be based on the change in inlet and outlet total pressure. Wei Zhao presented a detailed examination of leakage loss from runner clearance gaps using both numerical and experimental techniques [13]. Recently, the behavior of fluid flow in these regions was also studied by Yonenzawa and Watamura, who incorporated an analysis of the sediment flow [14]. In a recent study by Hou et al., the flow patterns, pressure oscillations, and hydraulic forces acting in the runner were examined considering the outflow from the gap between rotating–stationary geometries [15].
While a limited number of works have been carried out on the flow field and wear due to sediments in the labyrinths of Francis turbines, several works have examined clearance gap leakage [16]. Chitrakar et al. presented a review on the effect of secondary flow from the GV clearance gaps and the effect due to sediment-containing flow [6]. It was reported that sediment-laden leakage flow simultaneously affects the turbine’s performance in terms of both sediment erosion and the resulting change in flow dynamics. In another study on a turbine at Bhilangana HPP, India [5,17,18], the effects on the turbine’s performance due to this sediment-containing leakage flow were presented. These effects were also presented in [16,17,18,19,20]. Mack [21] examined sediment erosion considering both guide vane clearance and labyrinth seals and showed good agreement between the local effects of sediment erosion and the numerical results. In a similar study, Song et al. [22] analyzed the impact of varying guide vane openings on sediment movement and clearance wear, highlighting that smaller vane openings intensify leakage and erosion within the clearance, while larger openings reduce these effects, stabilizing flow and wear patterns. A recent study by Guo et al. [23] gives insights into the spatial and temporal evolution of tip leakage vortices in the cavitation-induced flow that induces wake propagation, which affects the erosion patterns and performance impacts in sediment-laden turbine components.
In this study, an effort is made to correlate secondary flows and sediment erosion in Francis turbines by focusing on the following questions: (i) How does the flow from the clearance gap of the guide vane combined with the leakage through runner sidewall gaps affect the turbine performance in terms of sediment erosion and efficiency? (ii) How is the flow developed inside the bottom and upper labyrinths? (iii) How does the sediment-laden flow affect the labyrinth regions? (iv) Is the leakage flow from the clearance gap alone the cause of the severe erosion damage toward the oblique regions of the hub and shroud side of the Francis runner?

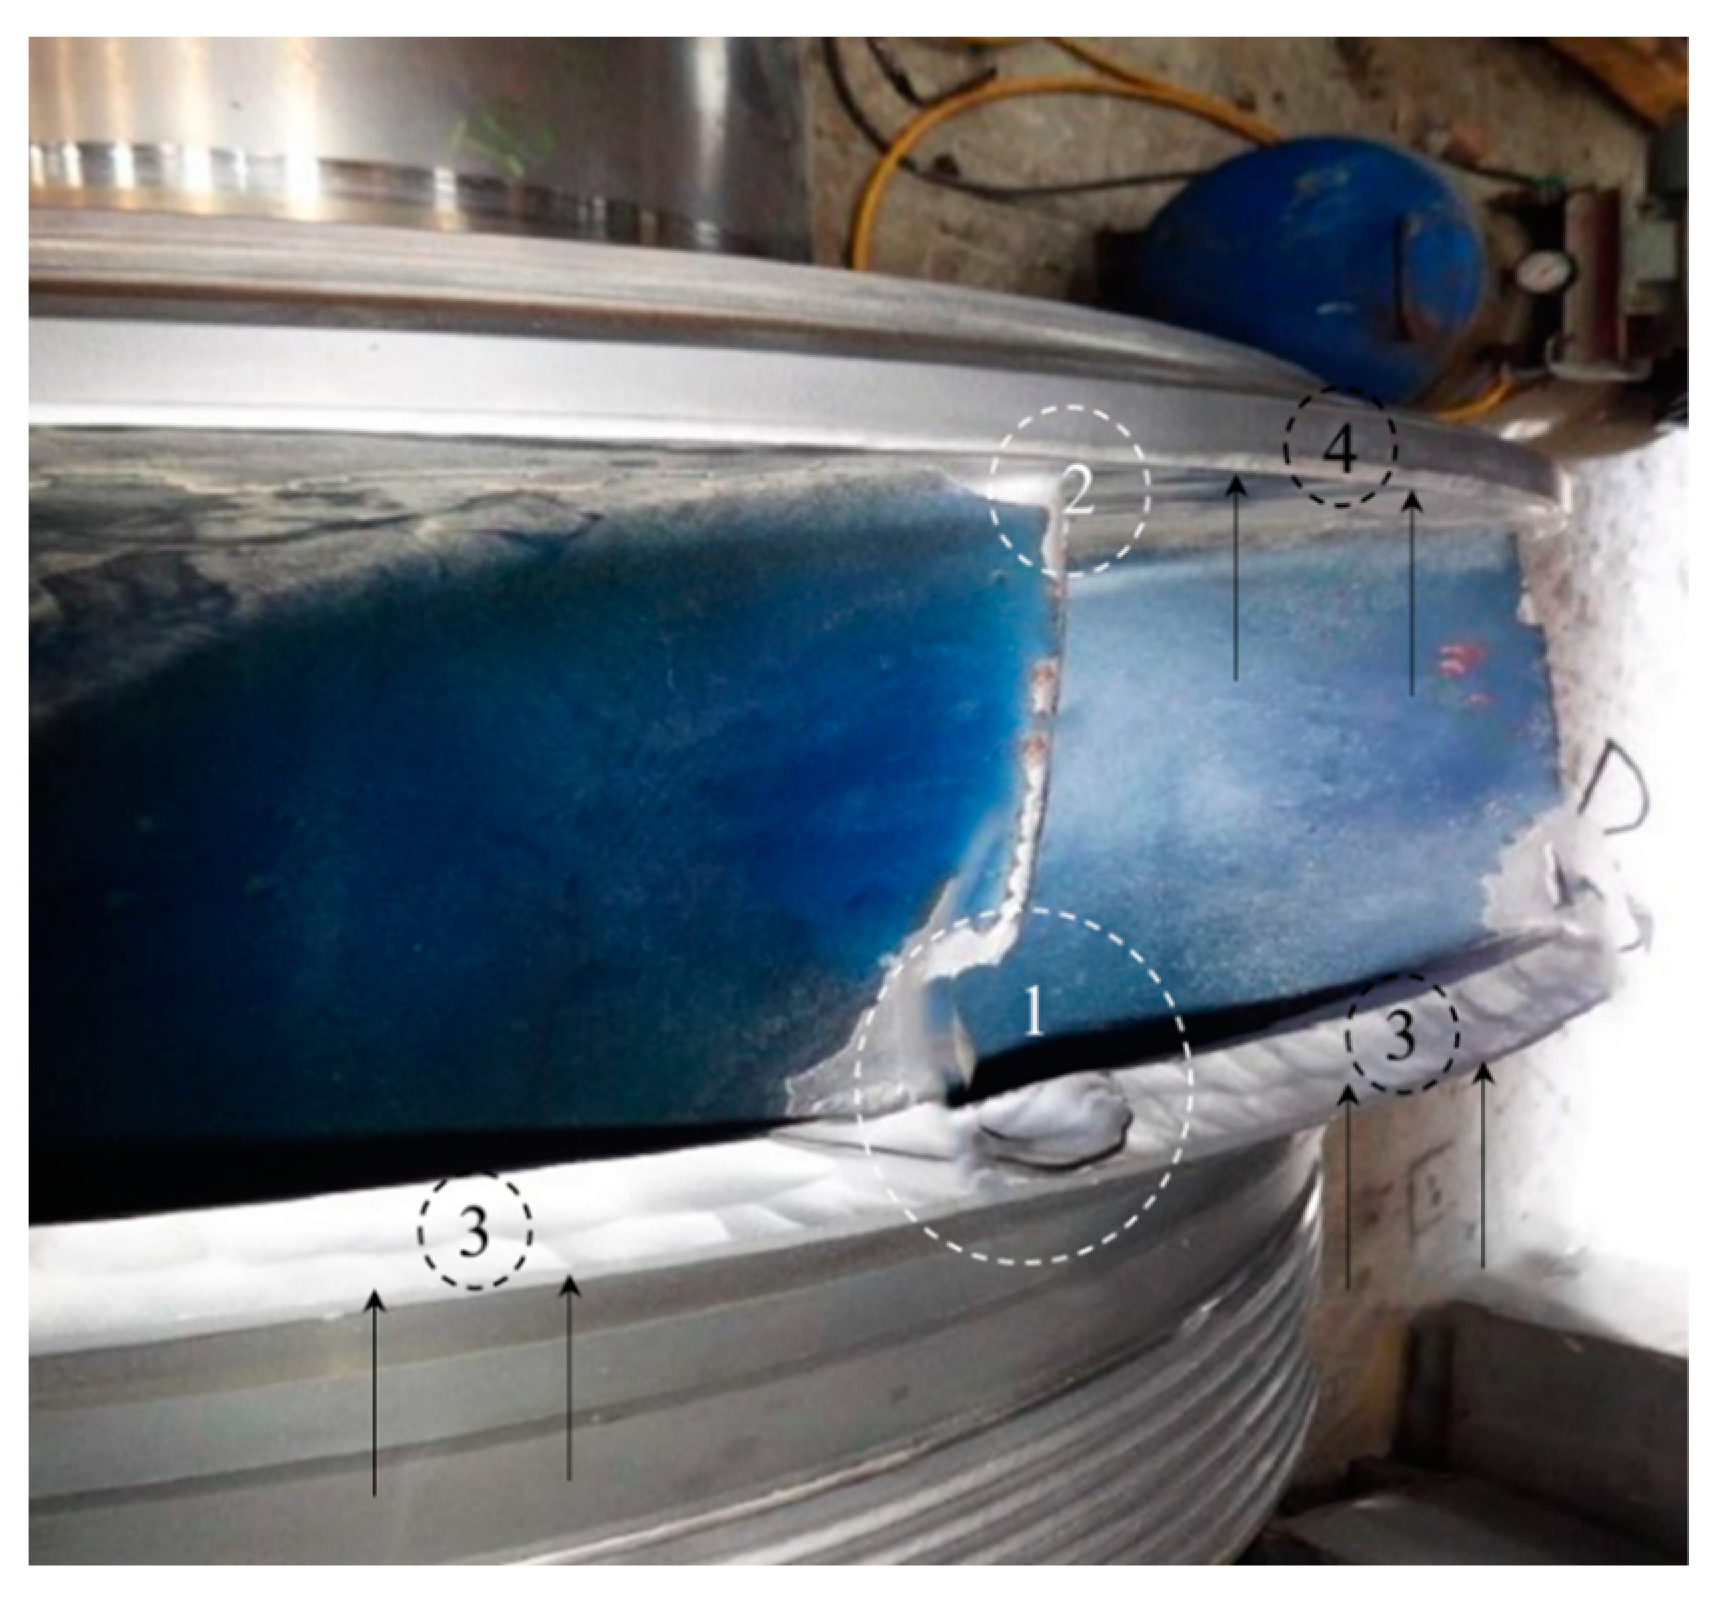
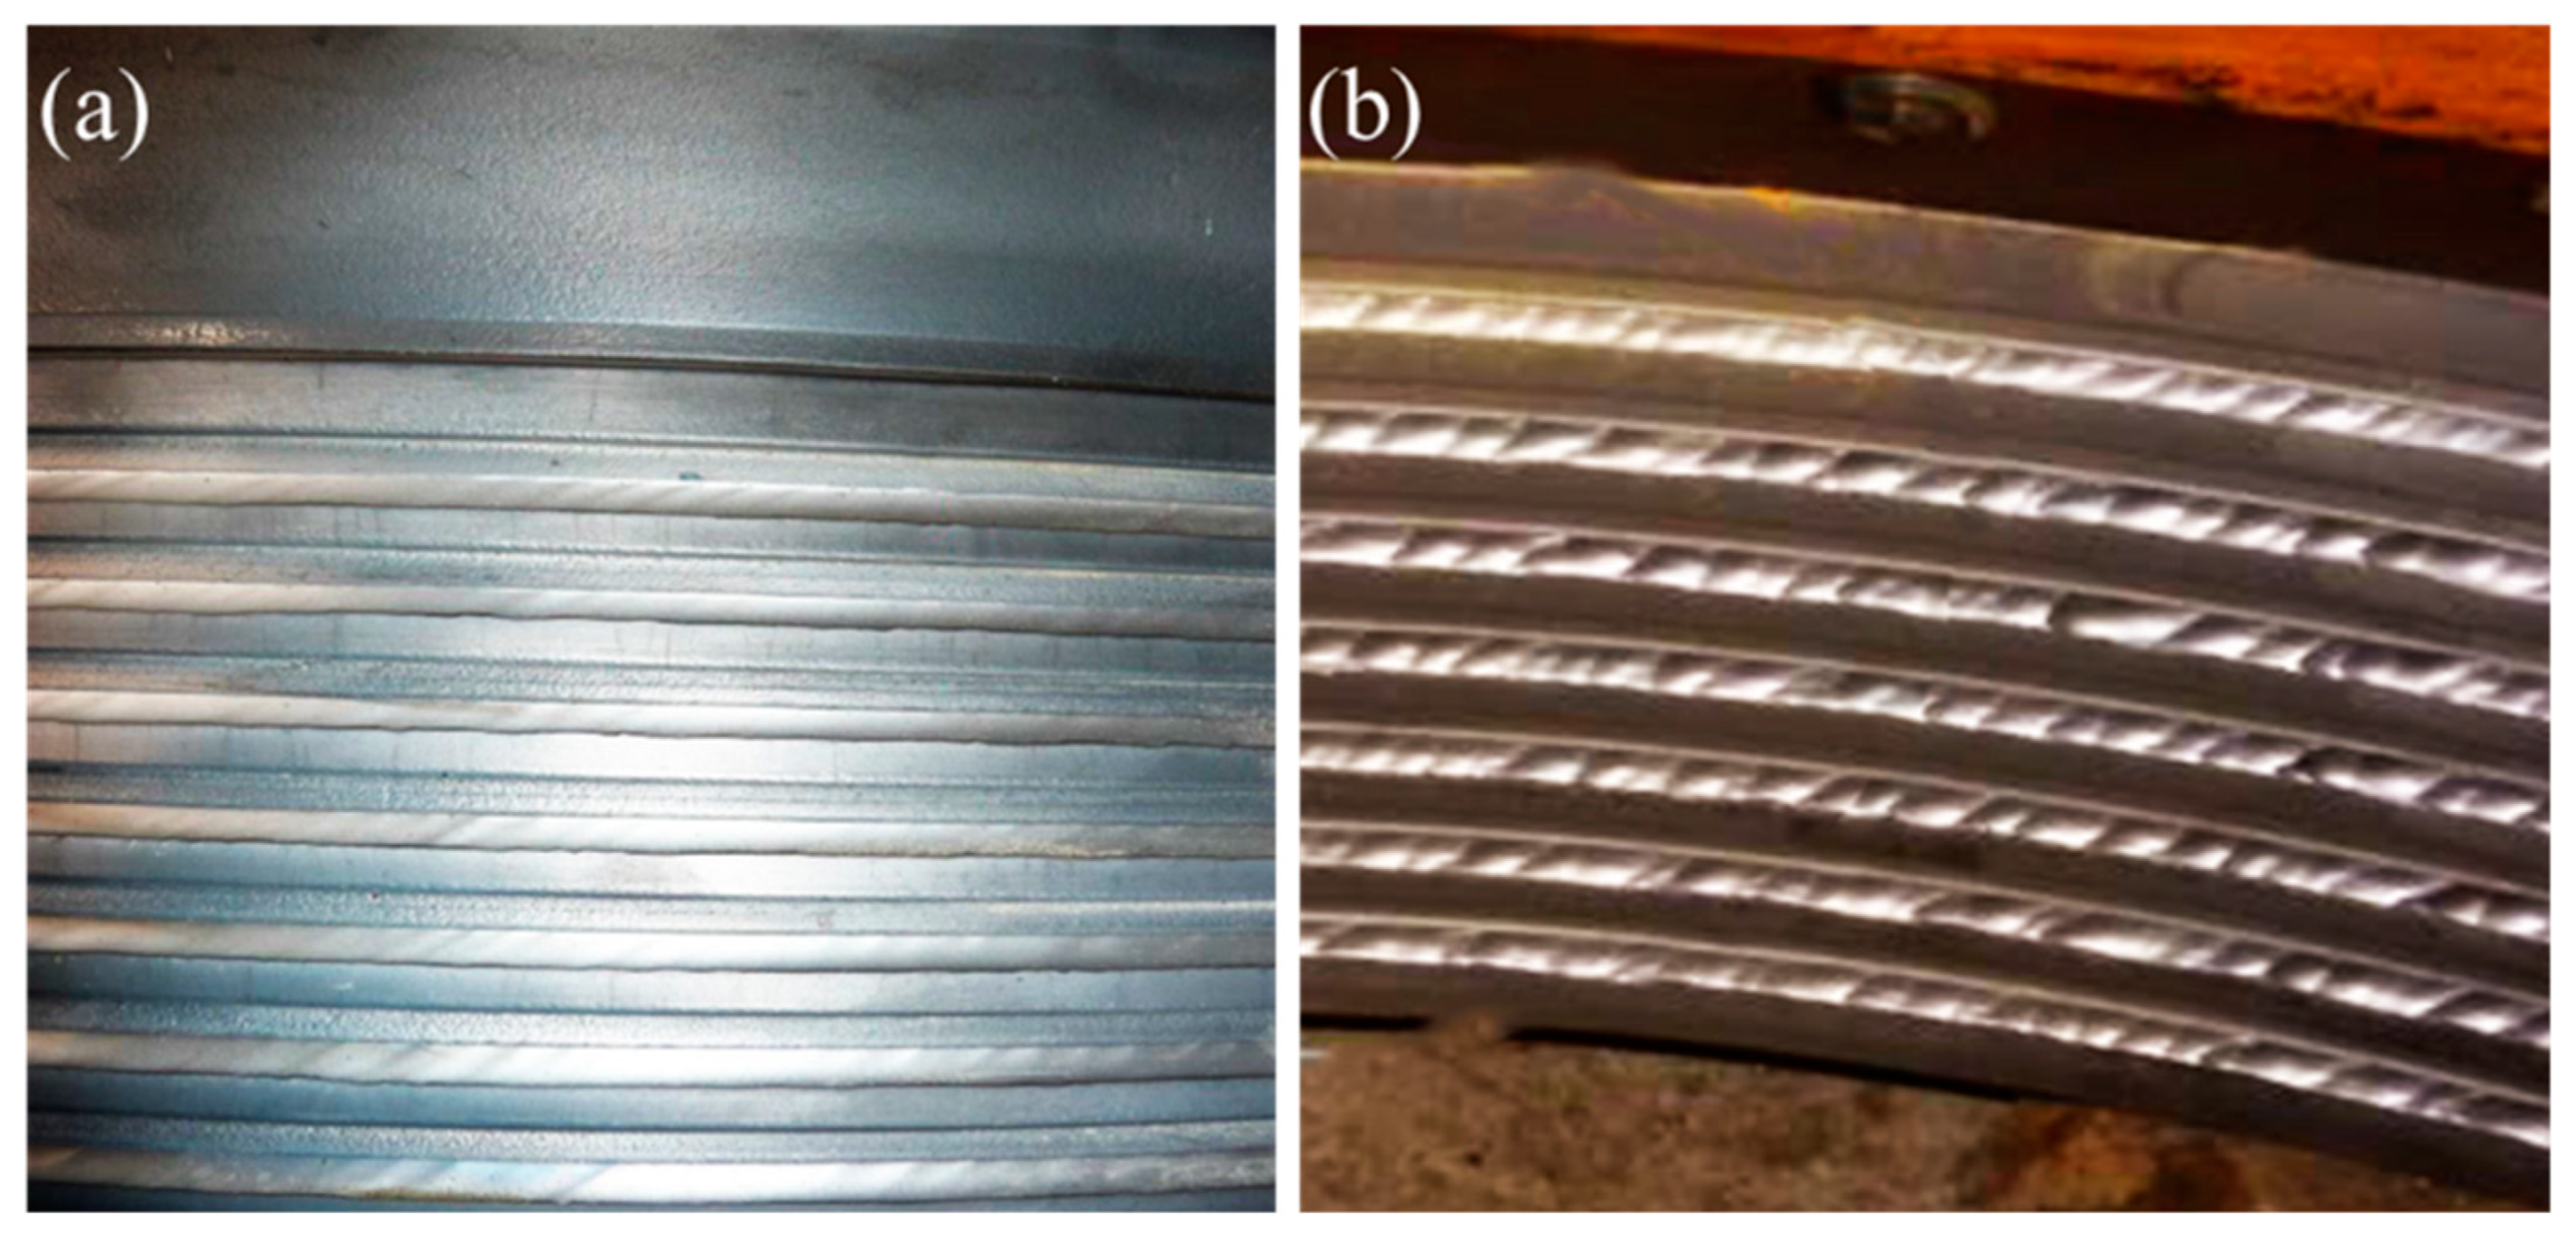
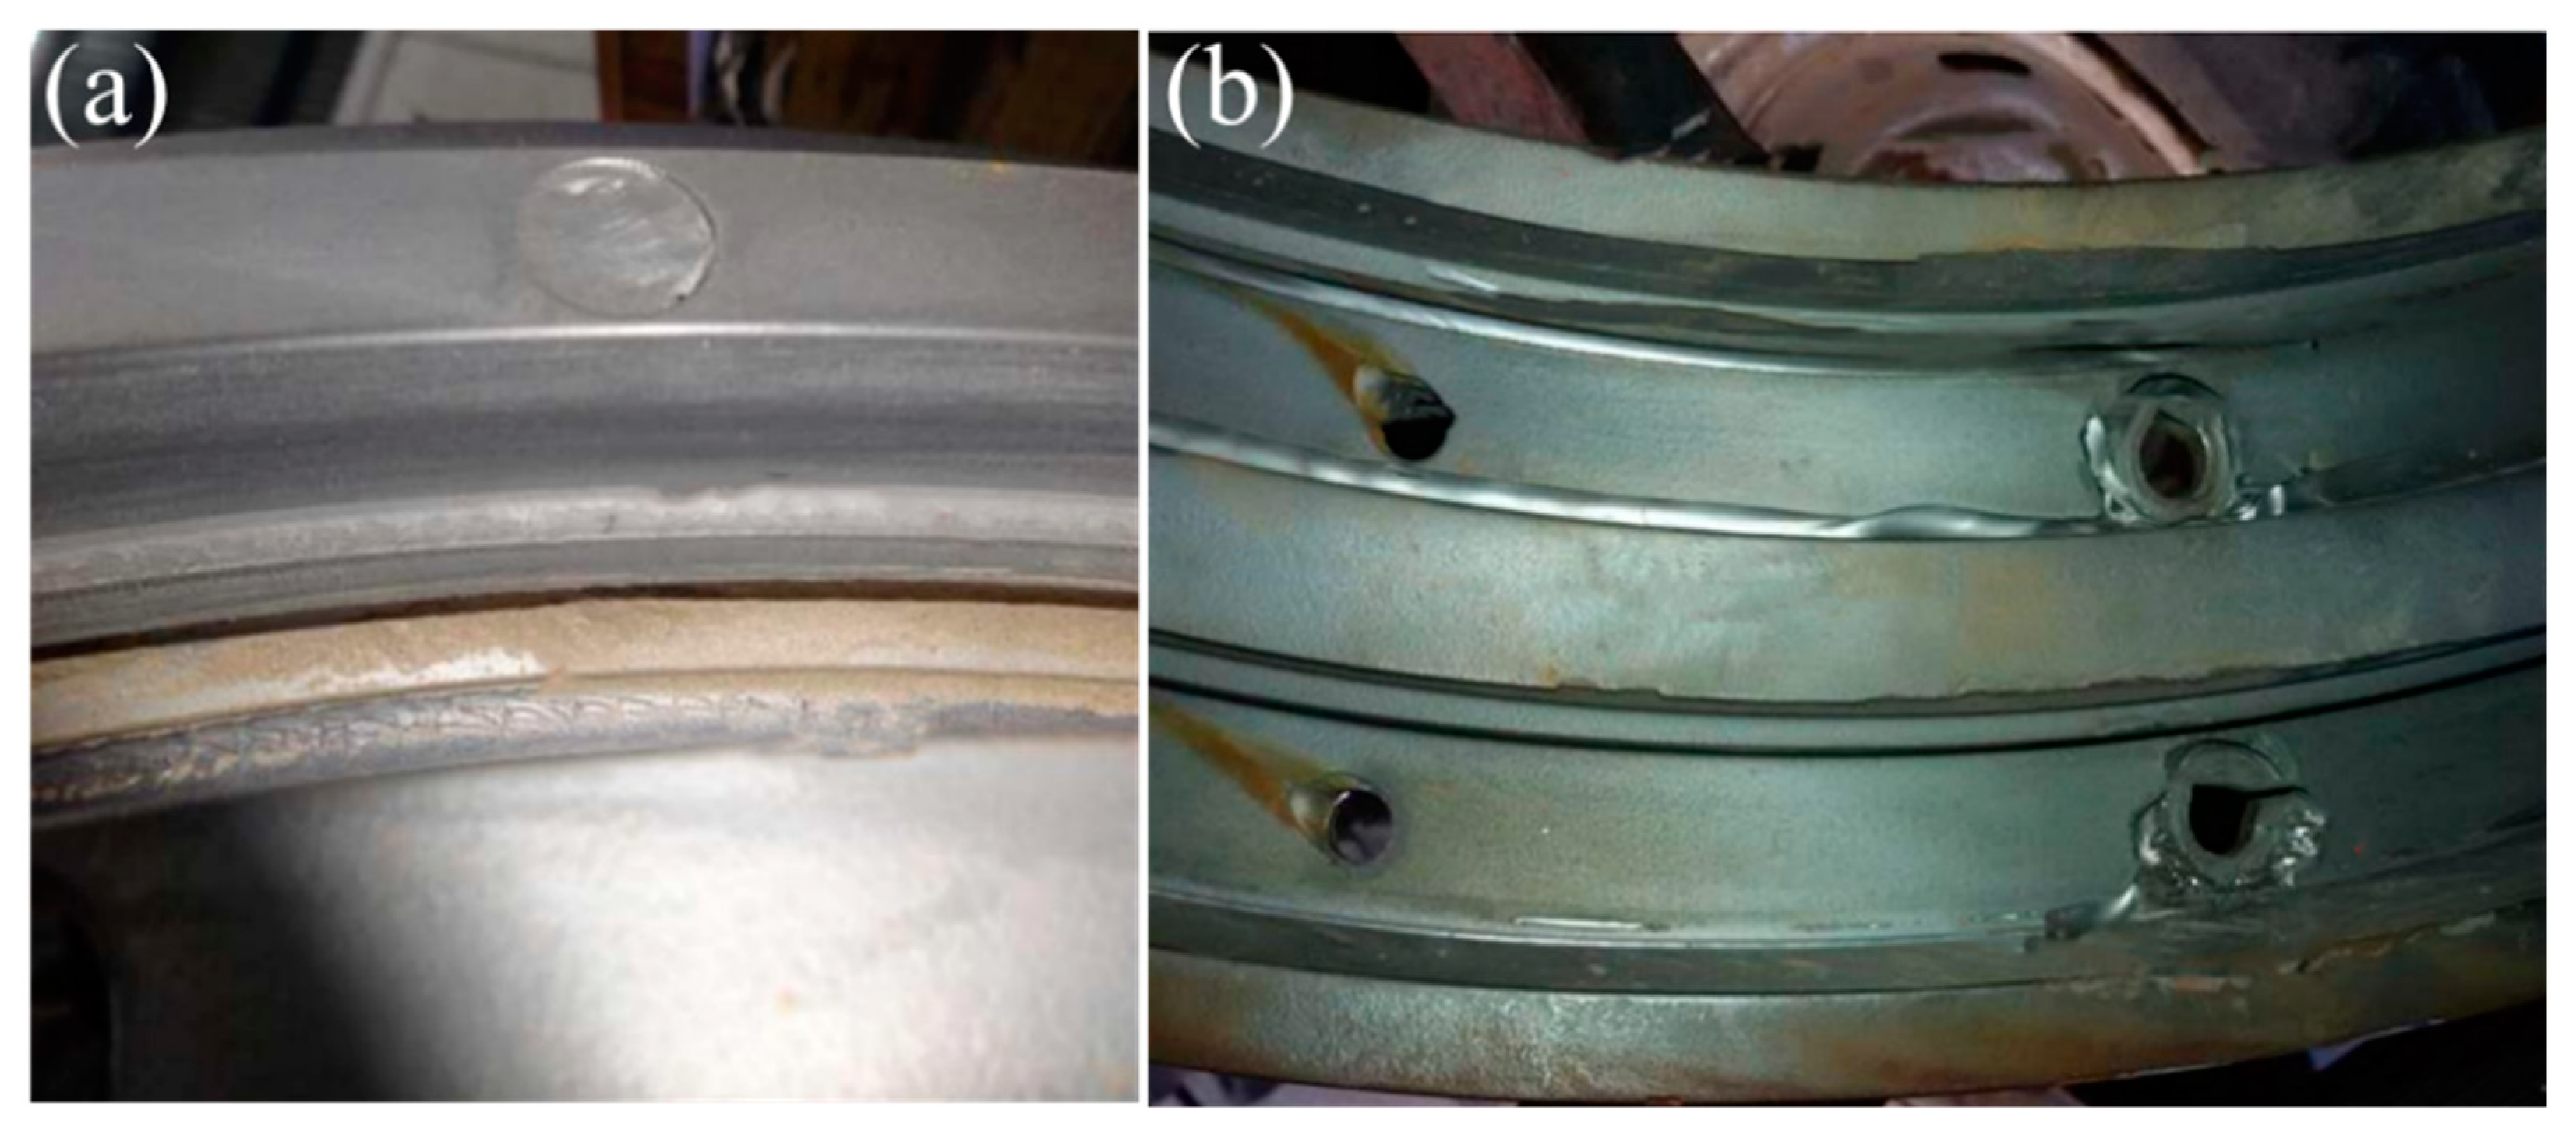
2. Erosion Wear in Francis Turbine Components

The regions highly affected due to secondary flows and sediment erosion in Francis turbines are discussed in this section. Since the overall work is focused on a numerical model of a full turbine, all regions are investigated for sediment flow except the spiral casing and stay vanes, which are negligibly affected by secondary flow and sediment erosion. As described by Brekke, erosion damage in the stay vanes is due to the secondary flow from the spiral casing and the presence of corner vortices [24]. In Francis turbines, other potentially critical regions of sediment erosion are the guide vanes and runner, with erosion in the guide vanes being severely influenced by the cross-leakage flow between the pressure side and suction side [4,17,18,19,20,25]. Figure 1 shows the different locations of the guide vane clearance gap region where secondary flow and sediment erosion occur. As suggested by the literature [6,20,25], sediment-containing flow affects the geometry of the guide vane and the clearance gap regions, and this change in geometry further increases the flow irregularities and also the sediment erosion problem. Thus, sediment erosion and leakage flow simultaneously occur in these regions.
In Figure 2, the erosion locations in different sections of the inlet of the runner are shown. Earlier research on the secondary flow from guide vanes suggested that erosion at these regions was due to high-intensity leakage vortices traveling from guide vane clearance gaps [5]. However, toward the circumference of the band and crown side of the runner, where the leakage vortex does not hit at all, the effect of erosion is present. These oblique erosion locations in the runner inlet are due to the combined effect of leakage flow from guide vane clearance gaps (at the leading edge of the runner blade) and sidewall gaps (throughout the circumferential location). ‘Sidewall gaps’ here refer to the minimum clearance regions between the stationary and rotating components of the turbine. Based on the previous literature [5], erosion in Section 1 and Section 2, in Figure 2 near the leading-edge geometry of the runner, is due to the high-intensity vortex flow from clearance gaps. Previous studies [17,20,26] suggested that, at these locations, pressure oscillations are higher due to vortical flow. Thus, erosion due to the impact of a high-intensity leakage vortex from guide vane clearance gaps is higher compared to the leakage from sidewall clearance gaps. This occurs toward the inlet of each runner blade, where the effect of the rotor–stator interaction (RSI) dominates. However, based on various studies [10,11,12,13,14,15,27,28,29,30,31], the leakage flow from sidewall clearance gaps cannot be neglected.
When the flow leaving the guide vanes enters the rotating domain, a small portion of the total flow escapes from the top and bottom sidewall gaps. In a turbine in design condition, Brekke [26] suggests that there will be a leakage of 0.5% of the total flow from these gaps. Trivedi et al. [31,32,33] used 1.65% of the total inlet flow during the No-Load Speed (NLS) condition while investigating the leakage flow in the labyrinth seals. Schiffer et al. [7,12] reported that the hydraulic efficiency reduction due to leakage flow from this region was approximately 1% of the total efficiency for clean water, and the efficiency reduction can be predicted to be higher with sediment-containing flow. Likewise, the flow leaving from sidewall gaps is affected by the rotational speed of the runner; hence, the continuous abrasion and erosion due to sediment particles will have a severe effect at those locations.
This flow escaping from the sidewall gaps enters the labyrinths of the turbine. For instance, flow from the bottom clearance gap enters the bottom labyrinth seals. The annular region of the fluid flow lies between two distinct regions: a domain rotating with the runner angular speed at a lower radius from the runner axis of rotation and the other stationary region at a higher radius. Moreover, since the runner is considered the most critical component of a Francis turbine, the material of the rotating labyrinth is different from that of the stationary labyrinth. Therefore, erosion is higher toward the stationary end of the bottom labyrinth, potentially due to (i) the difference in the geometrical positions and (ii) the variation in the materials used. Figure 3 presents the erosion regions caused by sediment flow toward the rotary and stationary ends of the bottom labyrinth, which validates the hypothesis as explained above.
Similarly, the flow escaping from the upper sidewall gaps reaches the upper labyrinth seals. In some cases, the flow from the upper labyrinth seal is the loss in the total volumetric flow since it is released completely. While some manufacturers guide the water from the upper labyrinth through the center of the runner and into the draft tube, in the case of the bottom labyrinth, the flow mixes with the draft tube flow. Toward the upper labyrinth regions as well, erosion effects toward the corner of the stationary domain are dominant, as shown in Figure 4. Toward the rotating end, the eroded region is negligible. Apart from erosion near the corner of the labyrinth, the erosion regions can be seen at the circumferential positions of the holes for bolts due to the presence of accelerated flow around the circular region of the bolts. Overall, the erosion effects at all these locations are unique and should be examined carefully based on flow analysis. A detailed flow analysis of all these regions is given in Section 3 and Section 4.

3. Numerical Study

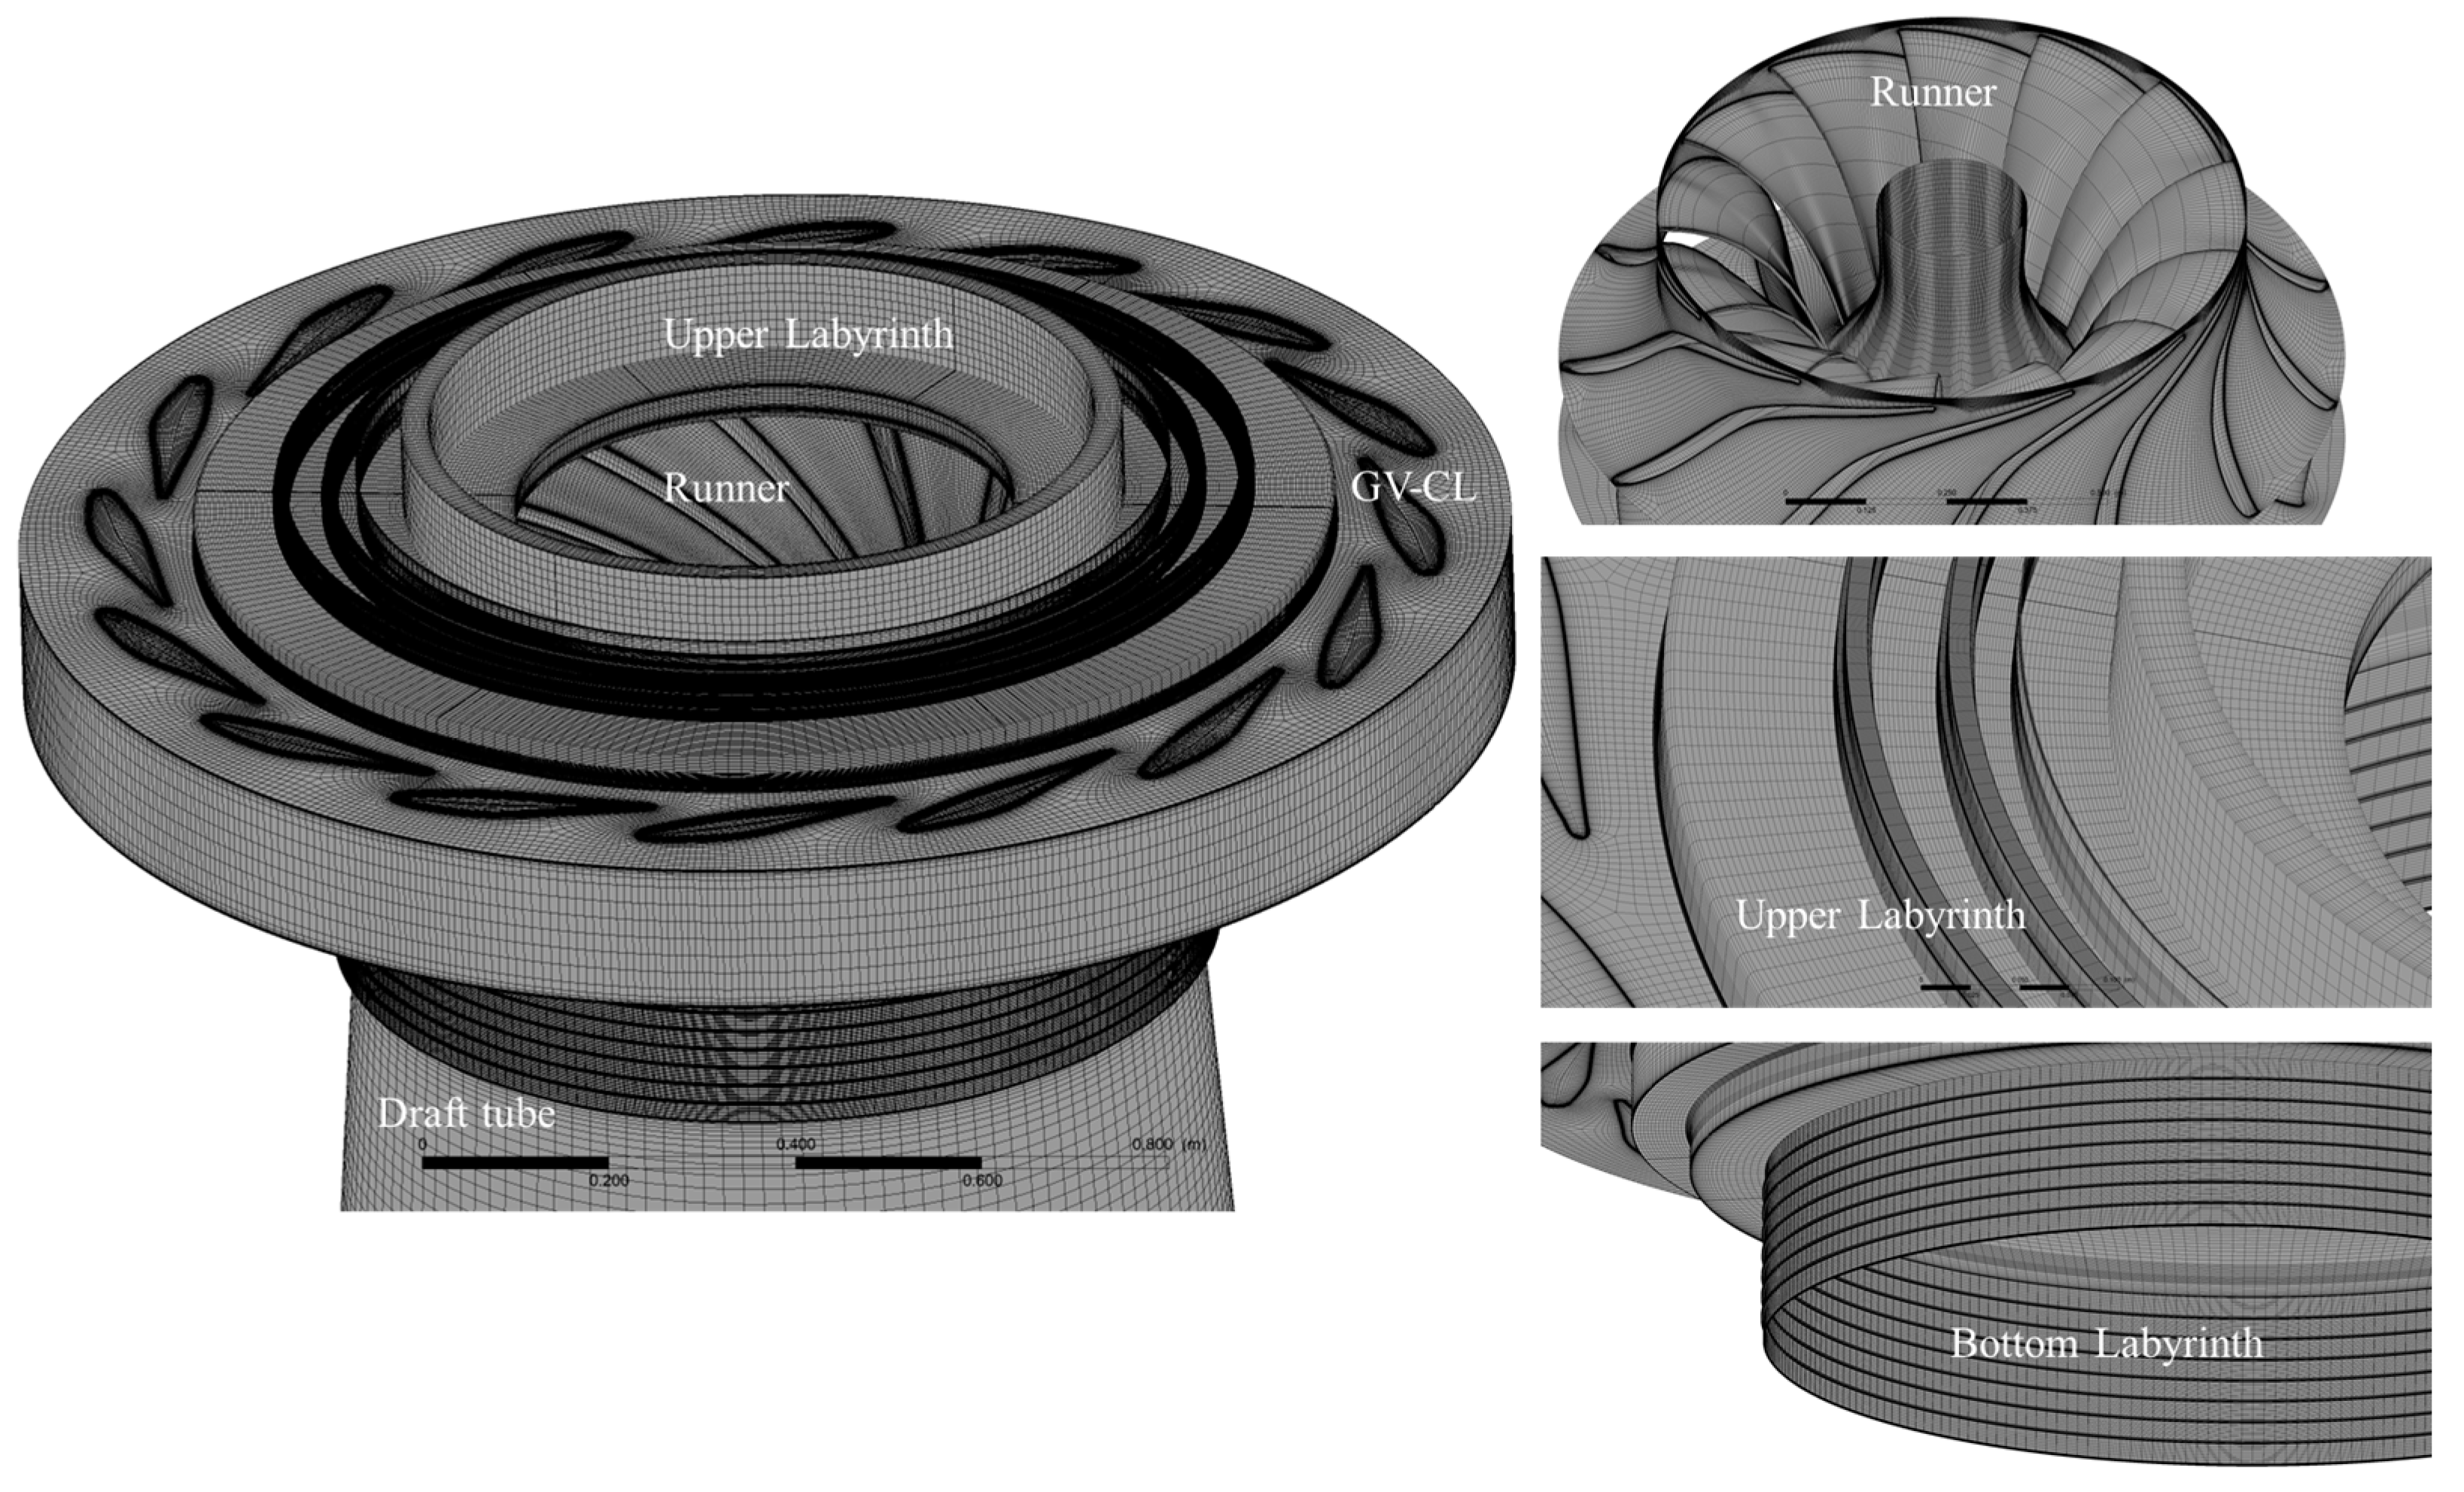
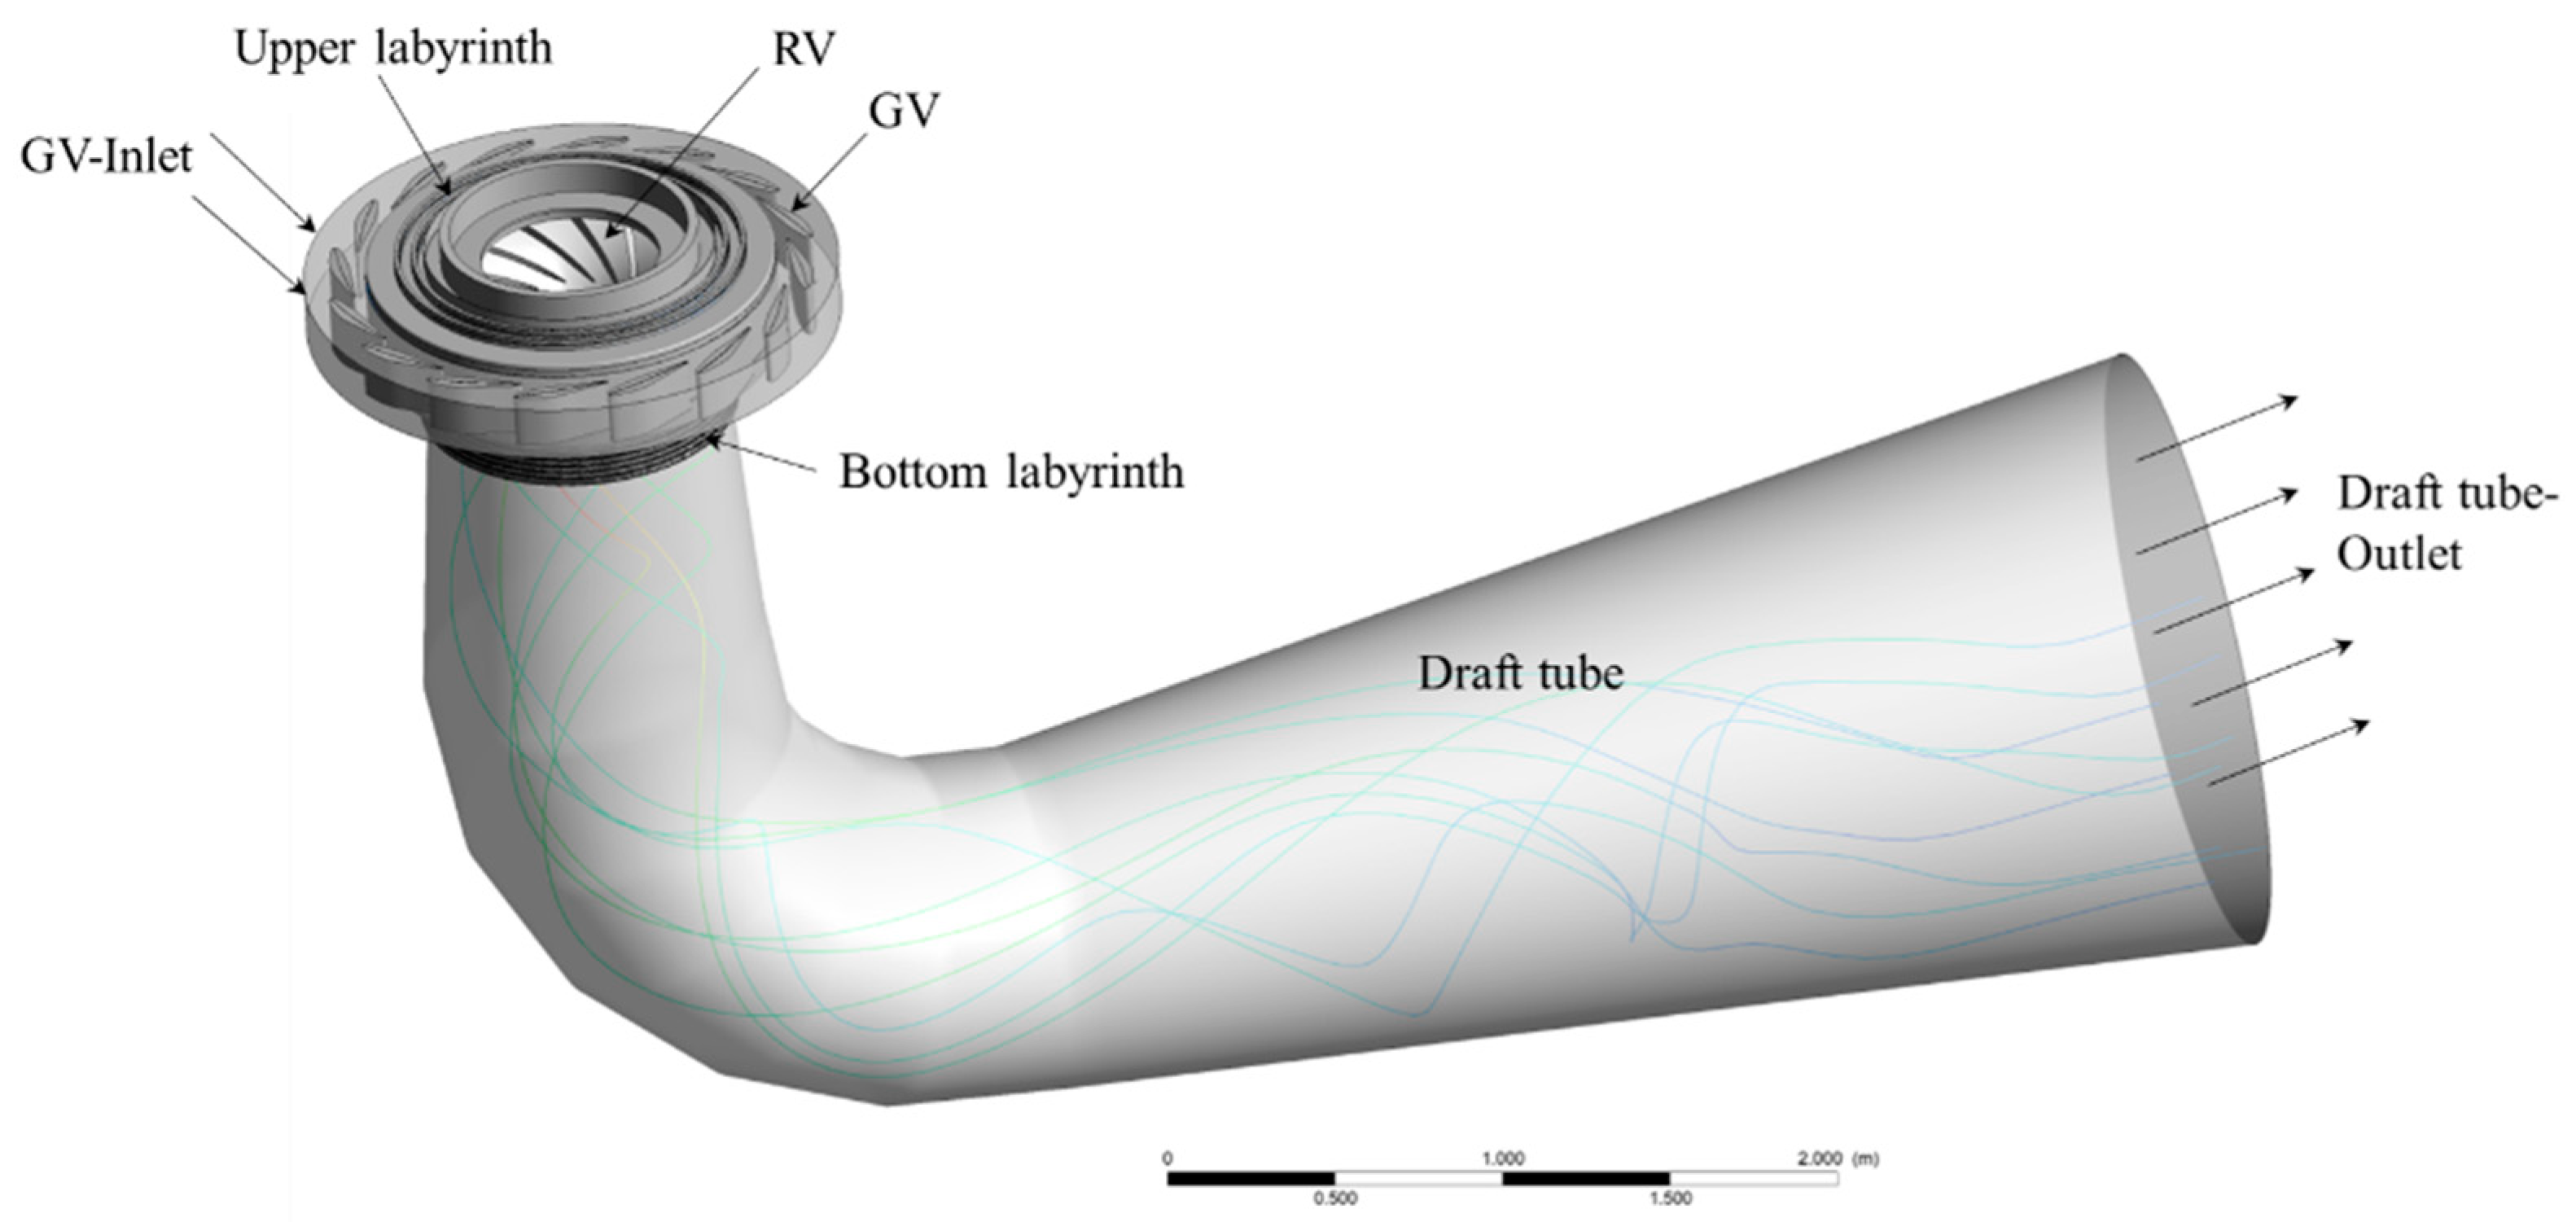
3.1. Development of Numerical Model

In this study, a reference Francis runner with a specific speed of Ns = 85.4 is considered. Specific speed measures the rotational speed of a turbine that operates at 1 m head, producing 1 kW of power, which is identical to the reference turbine, and is given by
N s = N P H 5 / 4
The reference turbine used in this study has a net head of 207 m, producing 8 MW of power at a rotational speed of 750 rpm. The model of the reference turbine consists of 16 guide vanes, upper labyrinth sealing, bottom labyrinth sealing, a draft tube, and a runner with 13 blades. Figure 5 shows the cross-section of the turbine used for this study, and since the upper and bottom labyrinth regions are the areas of interest, a detailed view of the flow region from the top–bottom sidewall gap toward the top–bottom labyrinth and draft tube is presented in the figure. The region of fluid flow is accurately modeled and discretized to investigate the nature of the flow.
The numerical model consists of a structured hexahedral grid in the entire domain. The domains of the GVs and RVs are discretized to hexahedral cells using ANSYS®®® TURBOGRID™ v. 2019, and the geometries of the draft tube, upper labyrinth seals, and bottom labyrinth seals are discretized using ANSYS®®® ICEM™ v. 2019 available at Waterpower lab, NTNU, Trondheim, Norway. The overall quality of the mesh for the draft tube and labyrinths is above 0.45, with a minimum angle greater than 27 degrees. The maximum non-dimensional wall space y+ values for the runner blade are 2, 8, and 80 for fine, medium, and coarse grids, respectively. Figure 6 shows the detailed mesh for the entire numerical model.

3.2. Boundary Conditions, Governing Equations, and Turbulence Model

The boundary condition used for this numerical study is the standard mass flow inlet and opening-type pressure outlet boundary condition, which is considered an appropriate boundary condition for Francis turbines [33]. Since the numerical model does not include the spiral casing and stay vanes, the mass flow inlet boundary condition is maintained at the inlet of the GV with cylindrical vector components (r, theta, z). The axial flow condition does not change when the flow enters the GV from the SV; thus, it is considered to be zero for this study. Moreover, the value of (r, theta) is calculated such that the flow is uniform and hits the leading edge of the GV profile at an appropriate angle. There are also two opening-type boundary conditions in the model: (1) at the outlet of the draft tube and (2) at the outlet of the upper labyrinth seal. The outlet of the bottom labyrinth seal is connected to the draft tube such that the leakage flow mixes with the main flow, leaving the outlet of the runner. The individual components are connected using the General Grid Interface (GGI) technique. Figure 7 presents a 3-D model of the turbine developed for this study.
Unsteady Reynolds-Averaged Navier–Stokes (URANS) equations are used to solve the incompressible fluid flow. The URANS continuity and momentum equations are
u ¯ i x ¯ i = 0
u ¯ i t + u ¯ j u ¯ i x j = 1 ρ p ¯ x i + υ 2 u ¯ i x j 2 ( u ¯ ' i u ¯ ' j ) x j
Here, ui, p, ʋ, and ui’ are time-averaged velocity, pressure, kinematic viscosity, and fluctuating velocity components, respectively. In the above equation, the Reynolds stress term u ¯ ' i u ¯ ' j is modeled using a suitable turbulence model. Different kinds of turbulence models have been used in the case of hydraulic turbines, from an equation linear viscosity model to an improved Large Eddy Simulation that requires high-quality mesh and high computational power [31,33]. k-ɛ and k-ɷ are widely used equation turbulence models that compromise for the higher computational power requirements with more accurate solutions. However, these equations fail to capture the regions of adverse pressure gradients such as separation and wake formations. These drawbacks are resolved by using the Shear Stress Transport (SST) turbulence model developed by Menter [34], which is the most widely used turbulence model for the numerical investigation of hydraulic turbines [27]. The formulation of SST turbulence is
( ρ k ) t + ( ρ u j k ) x j = P β * ρ ω k + x j ( μ + σ k μ t ) k x j
( ρ ω ) t + ( ρ u j ω ) x j = γ υ t P β ρ ω 2 + x j ( μ + σ ω μ t ) ω x j + 2 ( 1 F 1 ) ρ σ ω 2 ω k x j ω x j
Table 1 gives details of the boundary conditions and set-up employed for the current numerical study.

3.3. Erosion Modeling

A two-phase numerical model with a particle transport fluid model is used in this study and is addressed using a Eulerian–Lagrangian scheme. In the numerical model, the main parameters of the sediment such as density, size, shape, and concentration are defined. This flow is considered a homogeneous incompressible flow. The overall characteristics and model set-up for the erosion investigation are presented in Table 2.
For the quantification of the erosion-affected regions in the hydraulic components of Francis turbines, different erosion models have been used. Gautam et al. [5] investigated the usefulness of these different erosion models in hydraulic machines and reported that the Tabakoff erosion model can accurately predict the erosion-affected regions since it uses more sediment flow parameters and also involves an experimental validation for the materials of a Francis turbine. Thus, in this study, the Tabakoff and Grant erosion model is used for erosion prediction, and a two-phase numerical model employing a one-way coupling method is utilized to investigate the interaction between sediment and fluid phases. The sediment particles, characterized by a density of 2650 kg/m³, are considered to interact with a fluid of density 1000 kg/m³. In this one-way coupling framework, the effects of the sediment phase on the fluid dynamics are accounted for in terms of erosion and sediment transport, while the phase behavior of the fluid remains governed solely by its own characteristics. Likewise, Ref. [5] defined different constant terms that can be utilized in the case of a Francis turbine, and those chosen for the erosion model are listed in Table 3.

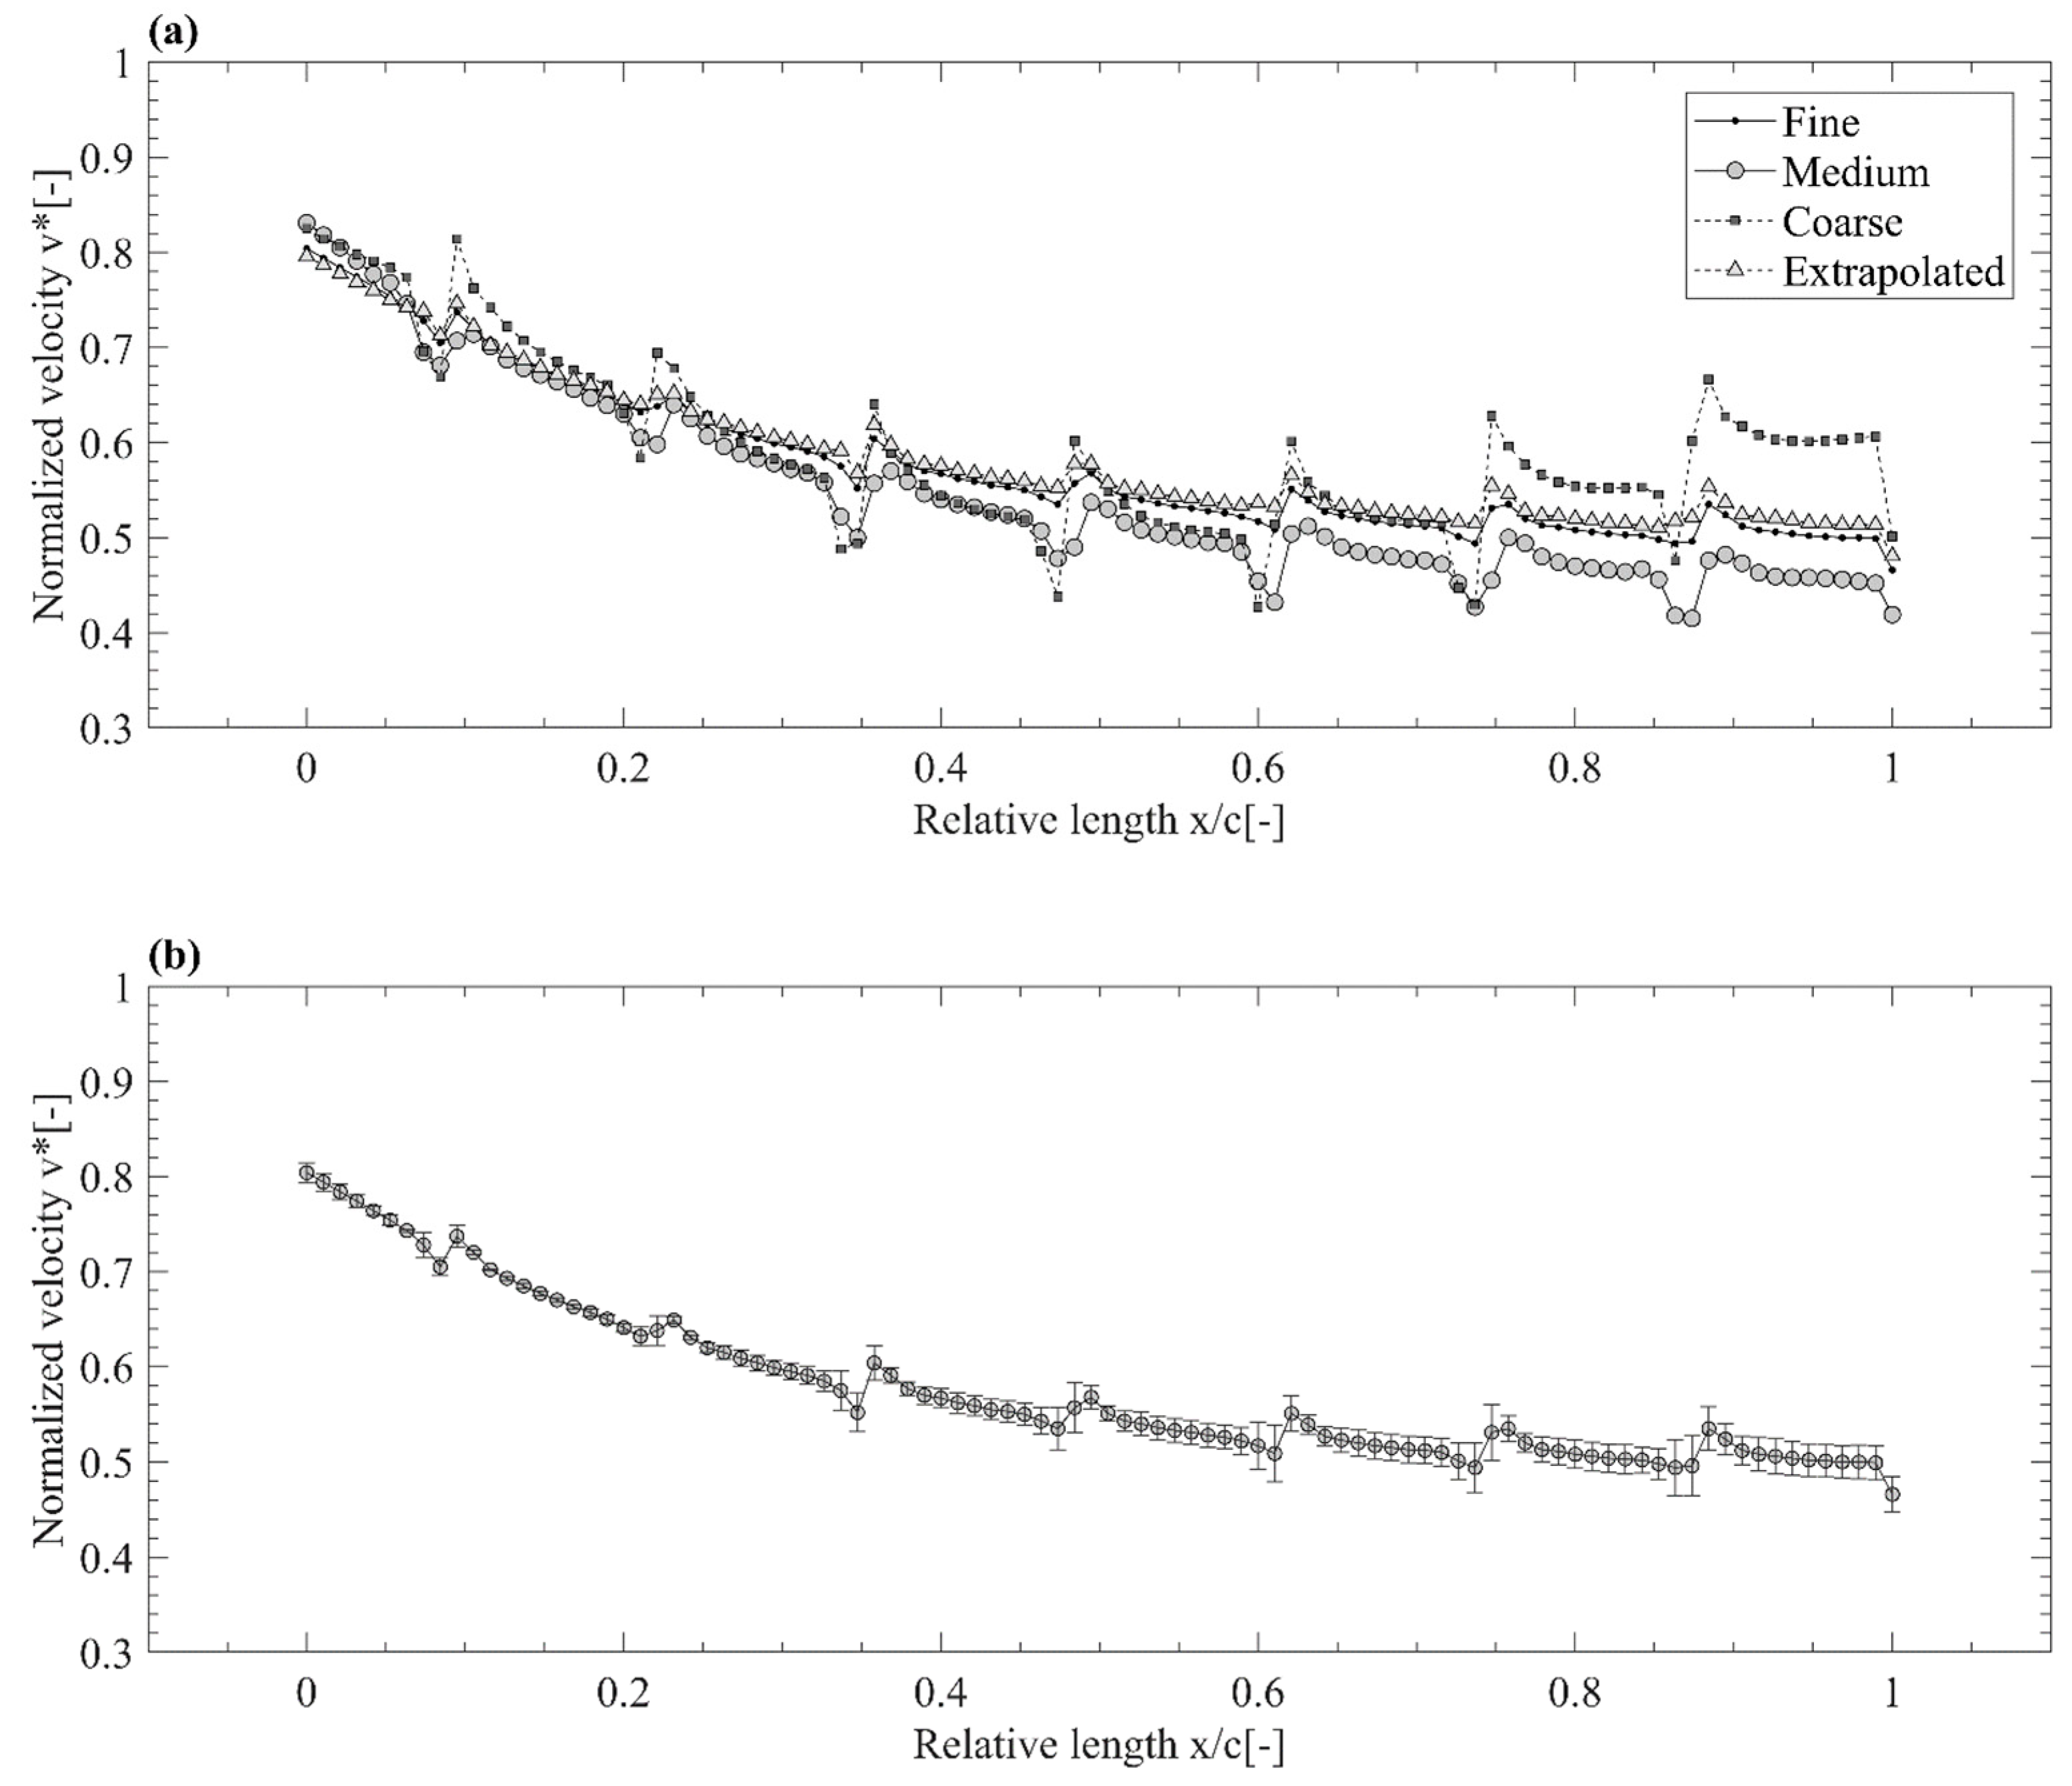
3.4. Grid Sensitivity Study

The grid independence study in this work uses three different meshes (coarse, medium, and fine), based on the Richardson extrapolation method suggested in [35,36]. To examine the uncertainty in the numerical solution, both dependent and independent parameters are considered. Efficiency is a considered a dependent parameter for this study as it is dependent on the torque, rotational speed, head, and flow. Trivedi [36] suggested that the uncertainty in the efficiency could produce misleading information related to uncertainty measurement and thus suggested investigating the independent parameters. Hence, for this study, the following parameters are included in the grid independency study: pressures (P1, P2 and P3) inside the upper labyrinth, the mid-span of the vaneless space and bottom labyrinth, as presented in the Figure 8, and the torque and area-averaged erosion rate density (Ea) in the runner blade. Ea is the measure of the erosion wear in the region of sediment flow and is given by
E a = i = 1 n E i A i i = 1 n A i [ kgm 2 s 1 ]
where n is the number of segment areas (Ai) on the runner blade surface, and Ei is the erosion rate in each segment area.
For the grid independence study, three different mesh sizes are chosen such that the grid refinement factor r > 1.3 for any two meshes. The grid refinement factor is the ratio of the average spacing between two successive grids, and, thus, the Grid Convergence Index (GCI) for the mesh can be calculated as follows:
G C I f i n e 21 = 1.25 e a 21 r 21 p 1
ϕ e x t 21 = r 21 p ϕ 1 ϕ 2 r 21 p 1
e a 21 = ϕ 1 ϕ 2 ϕ 1
where e a is the error as an absolute value, r21 is the grid refinement factor between a medium mesh and a fine mesh, ϕ represents the parameters selected for the measurement, and indices 1 and 2 represent the medium and fine mesh, respectively.
Table 4 summarizes the significant parameters selected for the grid convergence study and the corresponding GCI values. In the table, all parameters, both dependent and independent, have GCI values of less than 1% except for erosion measurement. The uncertainty in the erosion measurement is dependent on the choice of erosion model and the set of values that is used [5]. In this case, the uncertainty in the erosion rate from the medium mesh to the fine mesh is 3%.
For further uncertainty quantification, the velocity inside the curve in the annular region of the bottom labyrinth region is measured for three different meshes. The curve is divided into 100 different segments and normalized from 0 to 1. Velocity, in this case, is normalized using the following equation:
v * = u 2 + v 2 + w 2 π . D . n     [ ]
where u, v, and w are the circumferential, axial, and radial velocities; D is the mean diameter of the bottom labyrinth; and n is the rotational speed of the runner. Figure 9 shows the normalized velocity inside the bottom labyrinth for the three different mesh densities along with the extrapolated results from Equation (9). Since the bottom labyrinth has seven bi-directional cavities, higher-velocity fluctuations in seven different regions can be seen in Figure 9, caused by the influence of the stationary bottom labyrinth toward the rotating labyrinth. The maximum uncertainties can be seen in the location near the cavity, where the velocity gradient is highest.

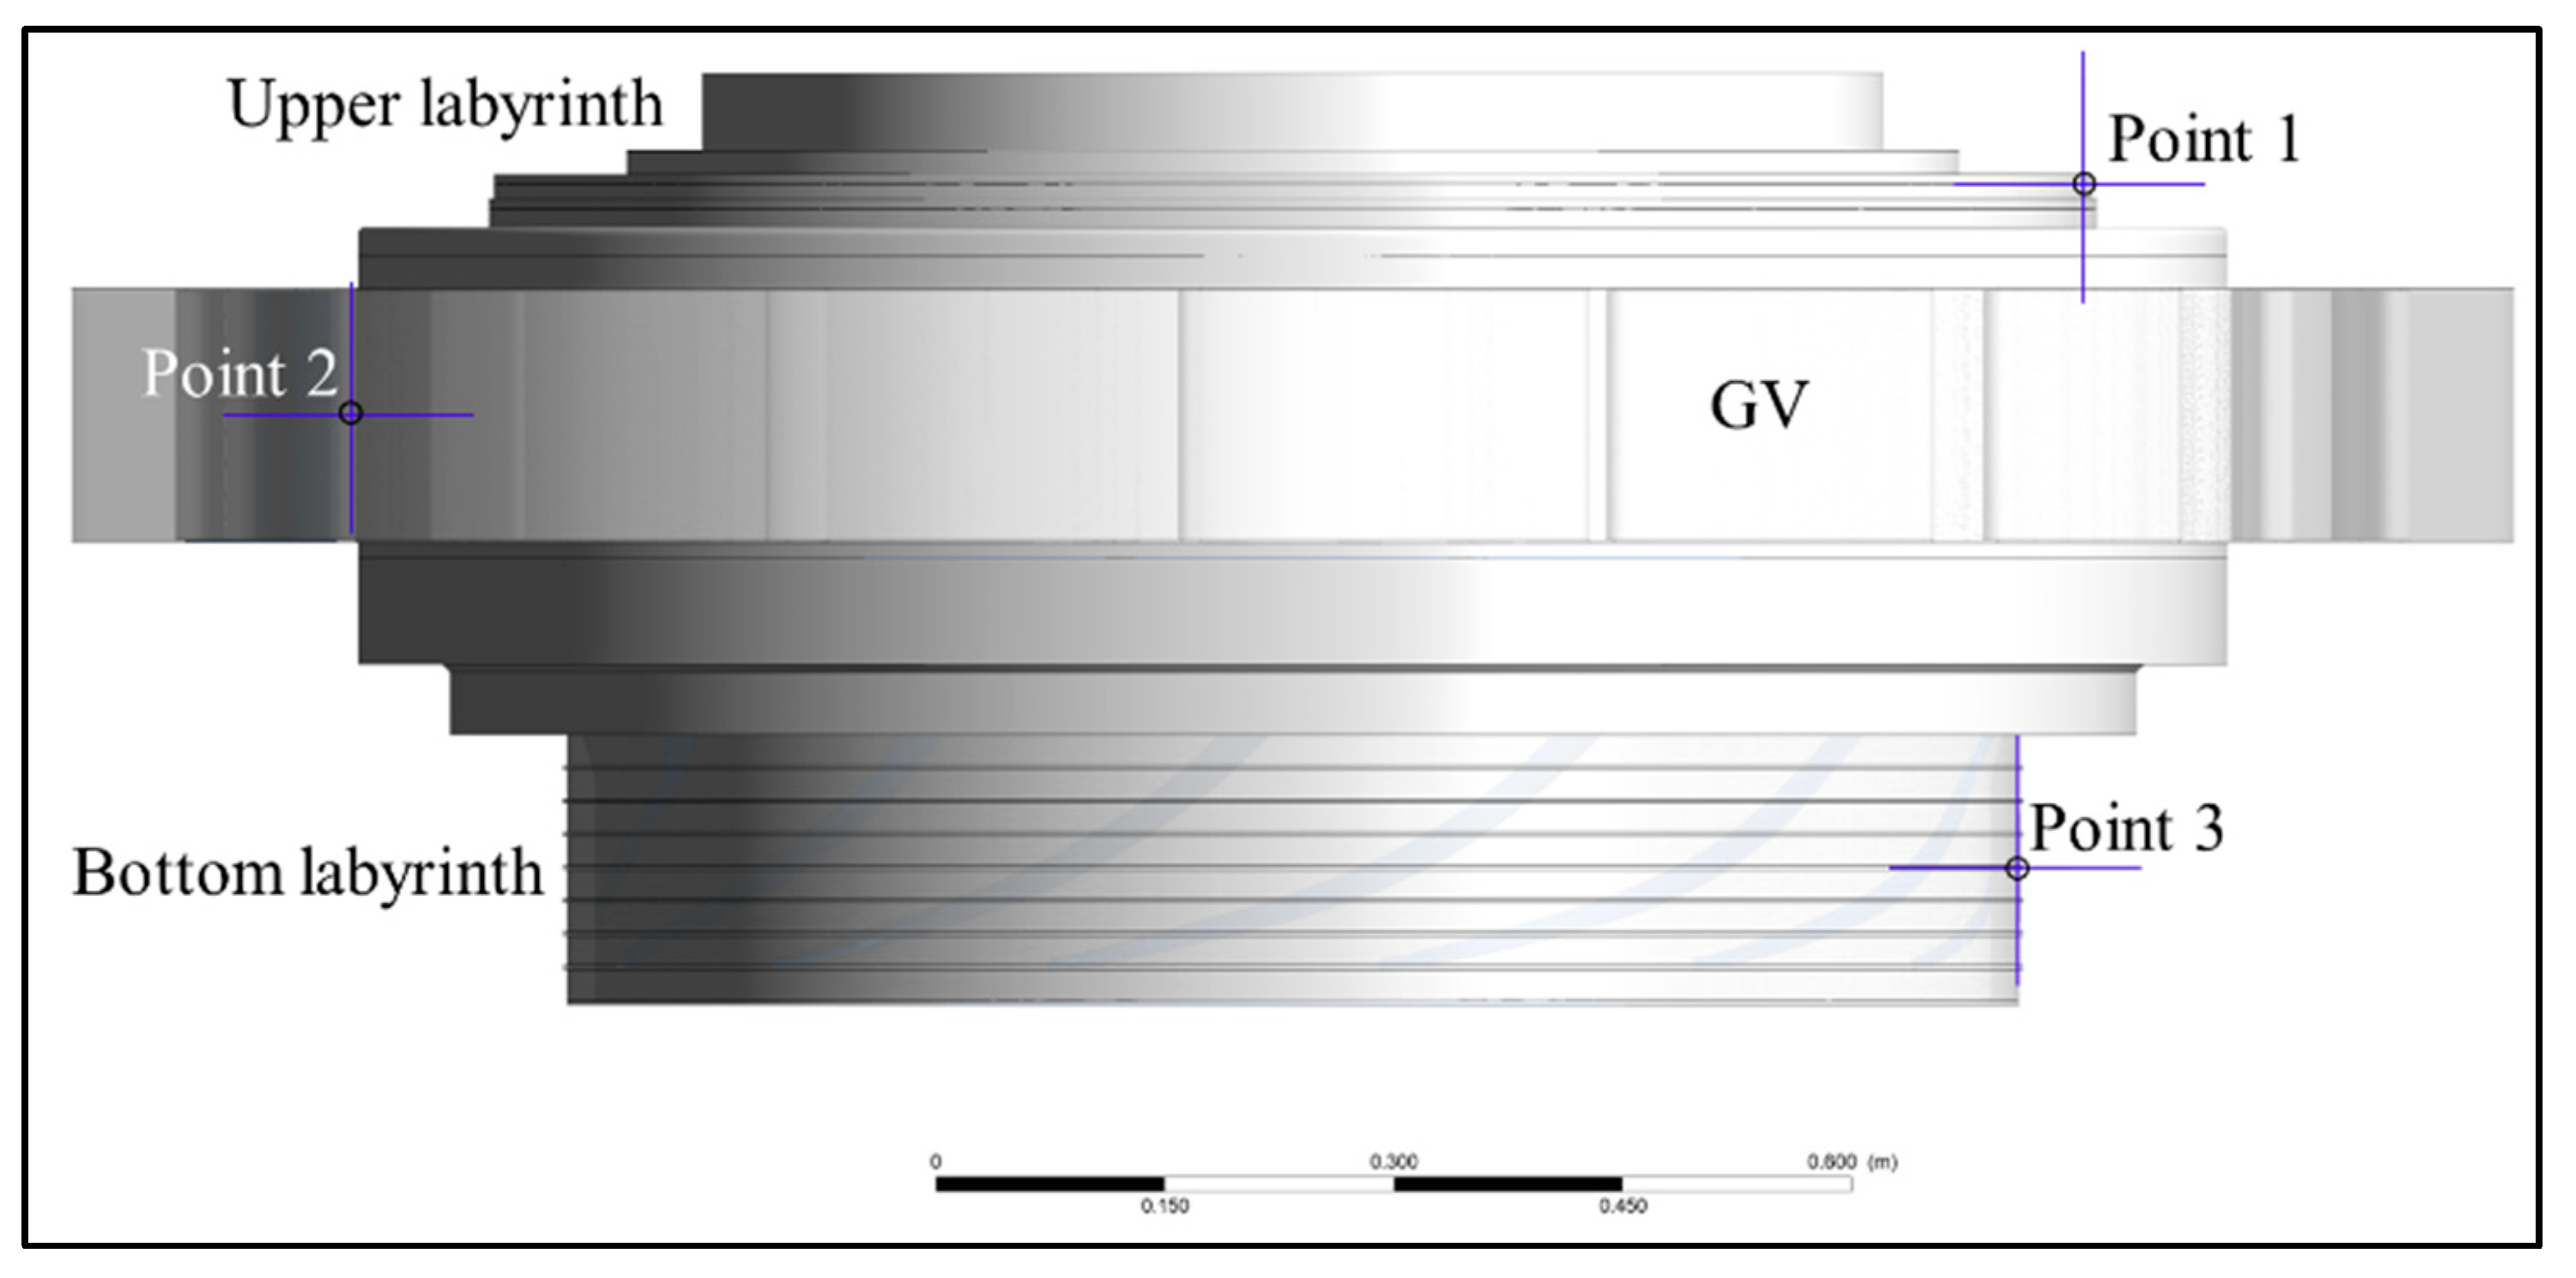
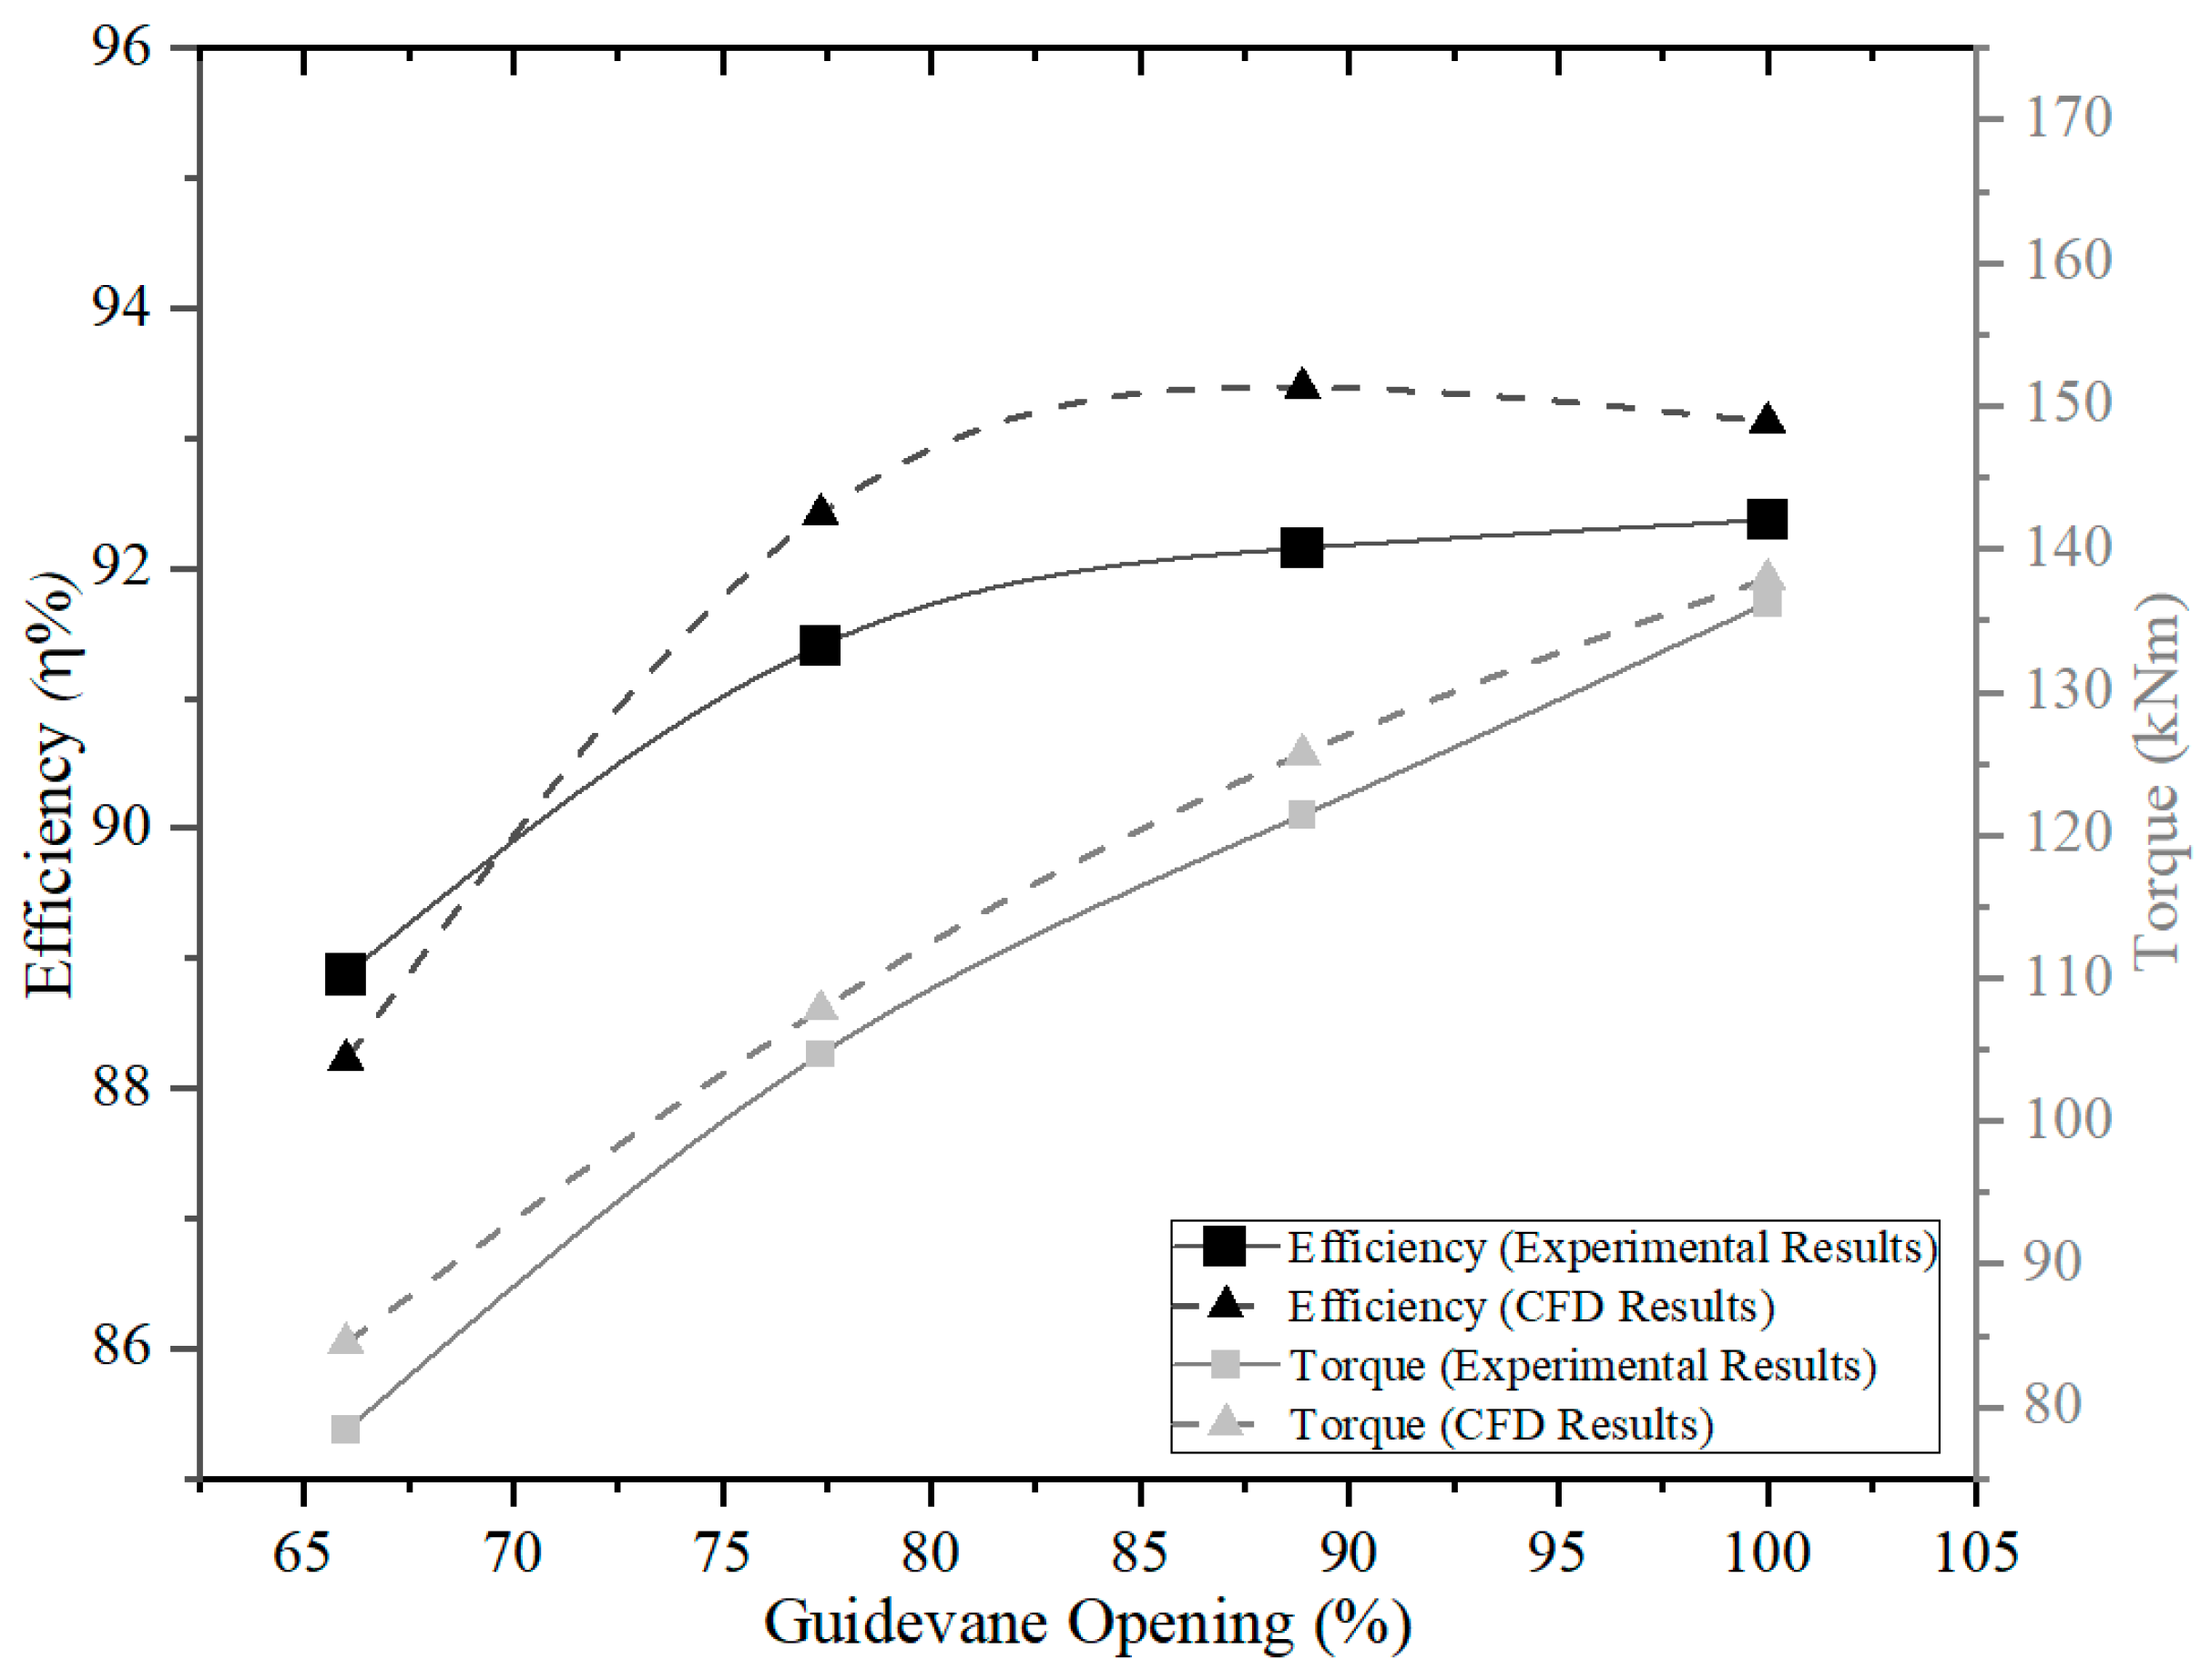
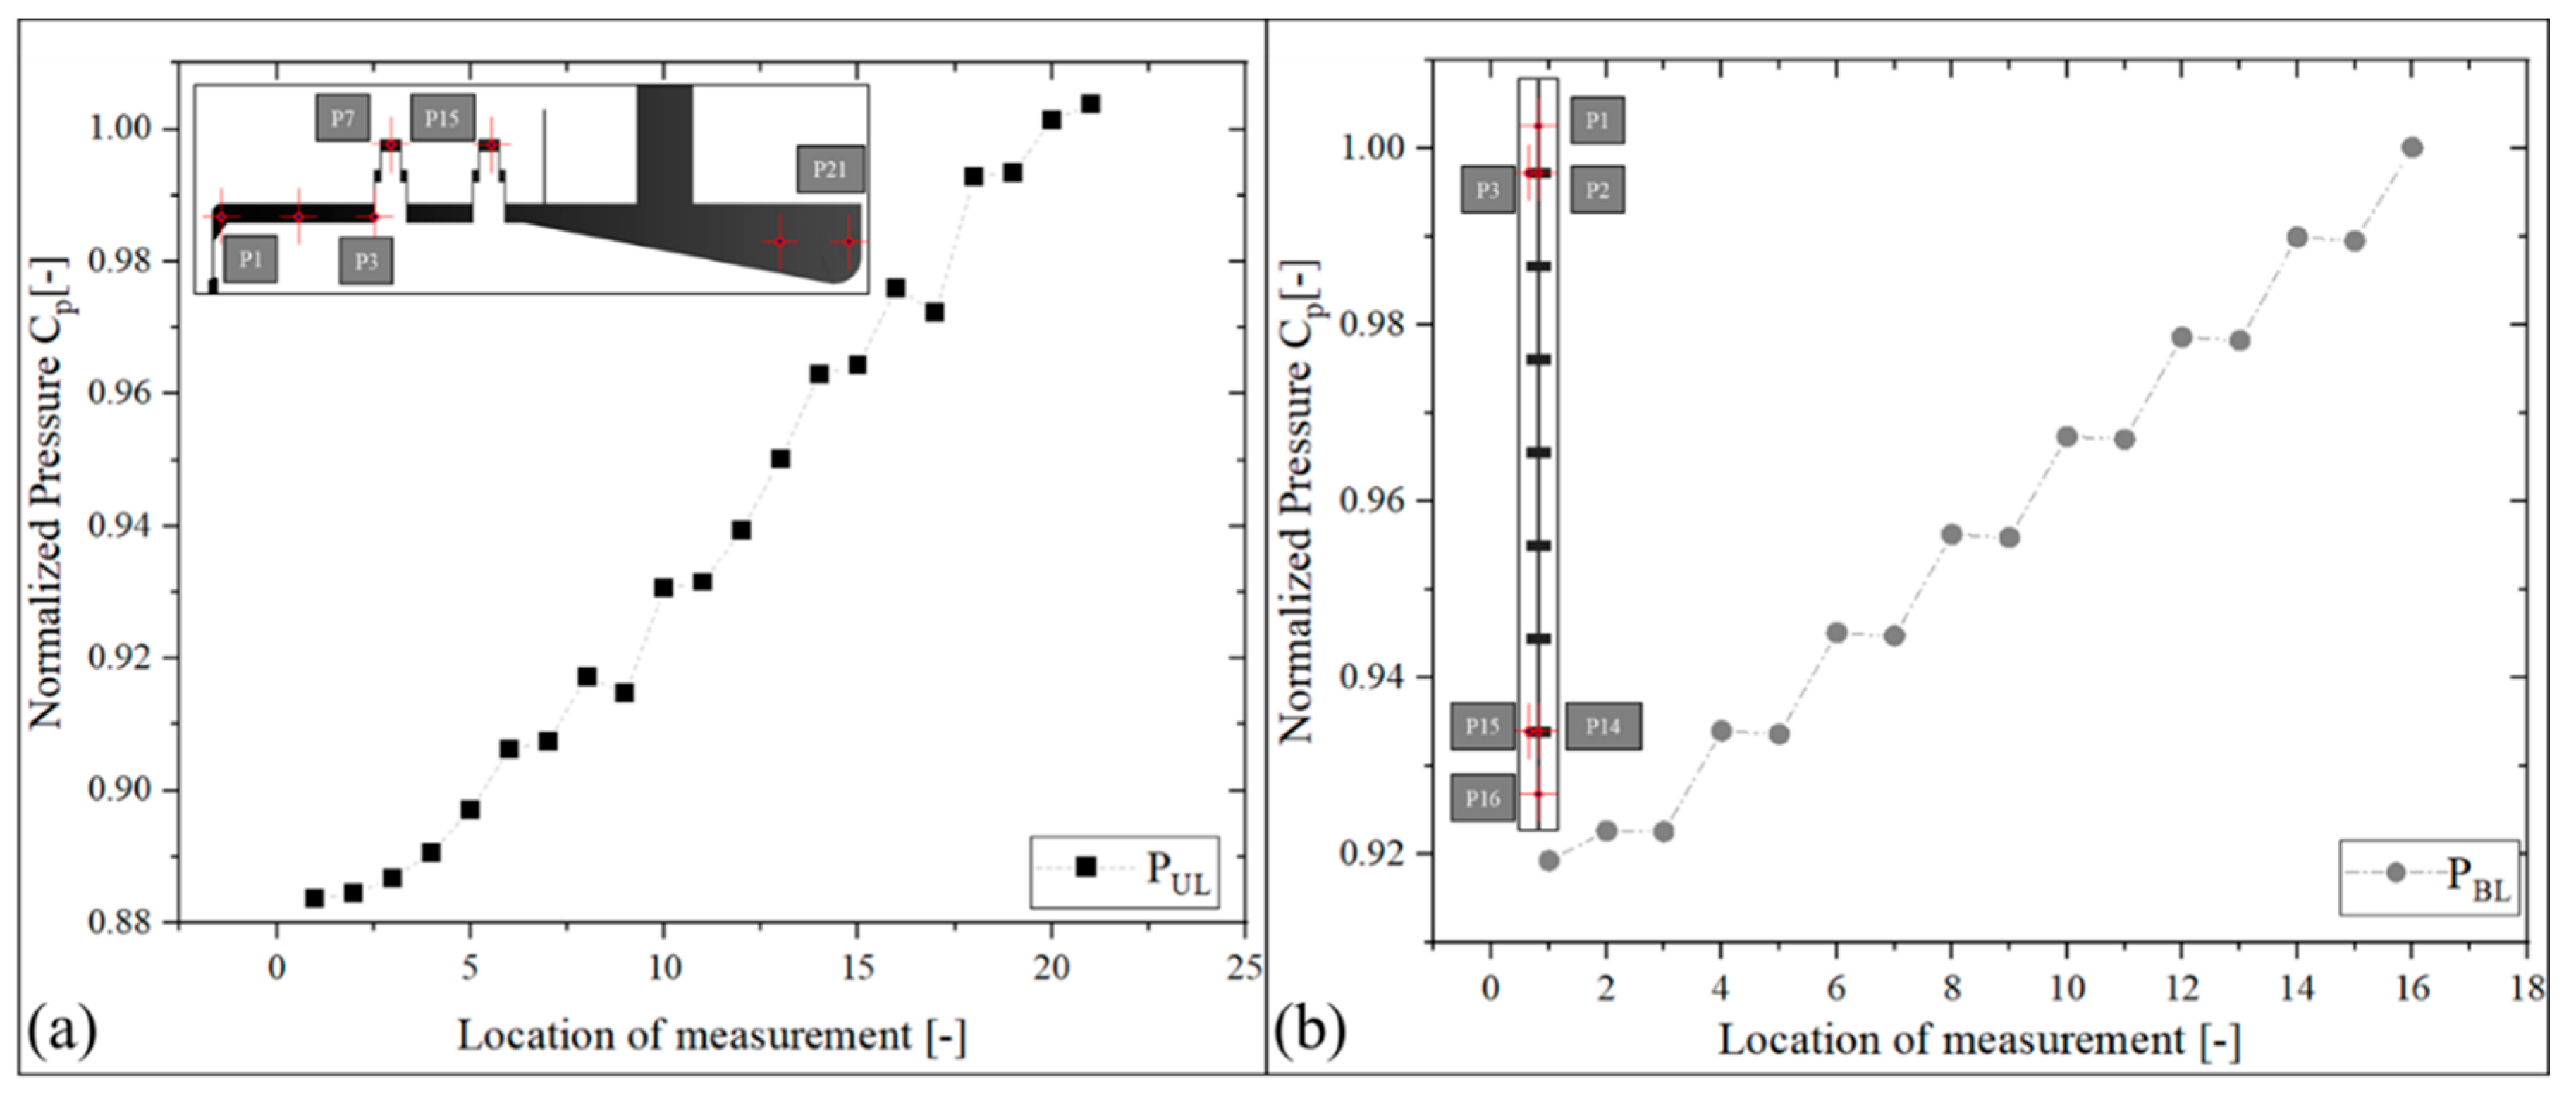
3.5. Validation of Numerical Model

Figure 10 shows a comparison of the results from the CFD calculations and data from the experimental measurement. The experimental data are from the study of a turbine at Bhilangana III HPP carried out by Acharya et al. [17,18]. It can be seen from the figure that, for the overall operating condition, excluding the deep part load condition, the efficiency predicted by the numerical model is higher compared to the experimental data. However, the trends of efficiency and torque compared to the experimental values are similar, with both of these terms being overestimated by the numerical model in absolute terms.
This overprediction of the efficiency terms for the overall operating condition agrees with previous studies, some of which also suggested that the influence of turbulence modeling in hydraulic turbines significantly affects the performance of runners under off-design conditions [36,37]. Since this study only uses the SST turbulence model to compromise the error in the standard k-ɛ or k-ɷ turbulence model, high-fidelity numerical simulation with SAS and LES calculations should give a lesser error in the numerical calculation. However, overall, the error in the numerical calculation is less than 2%, which is sufficient for carrying out further investigations.

4. Results and Discussion

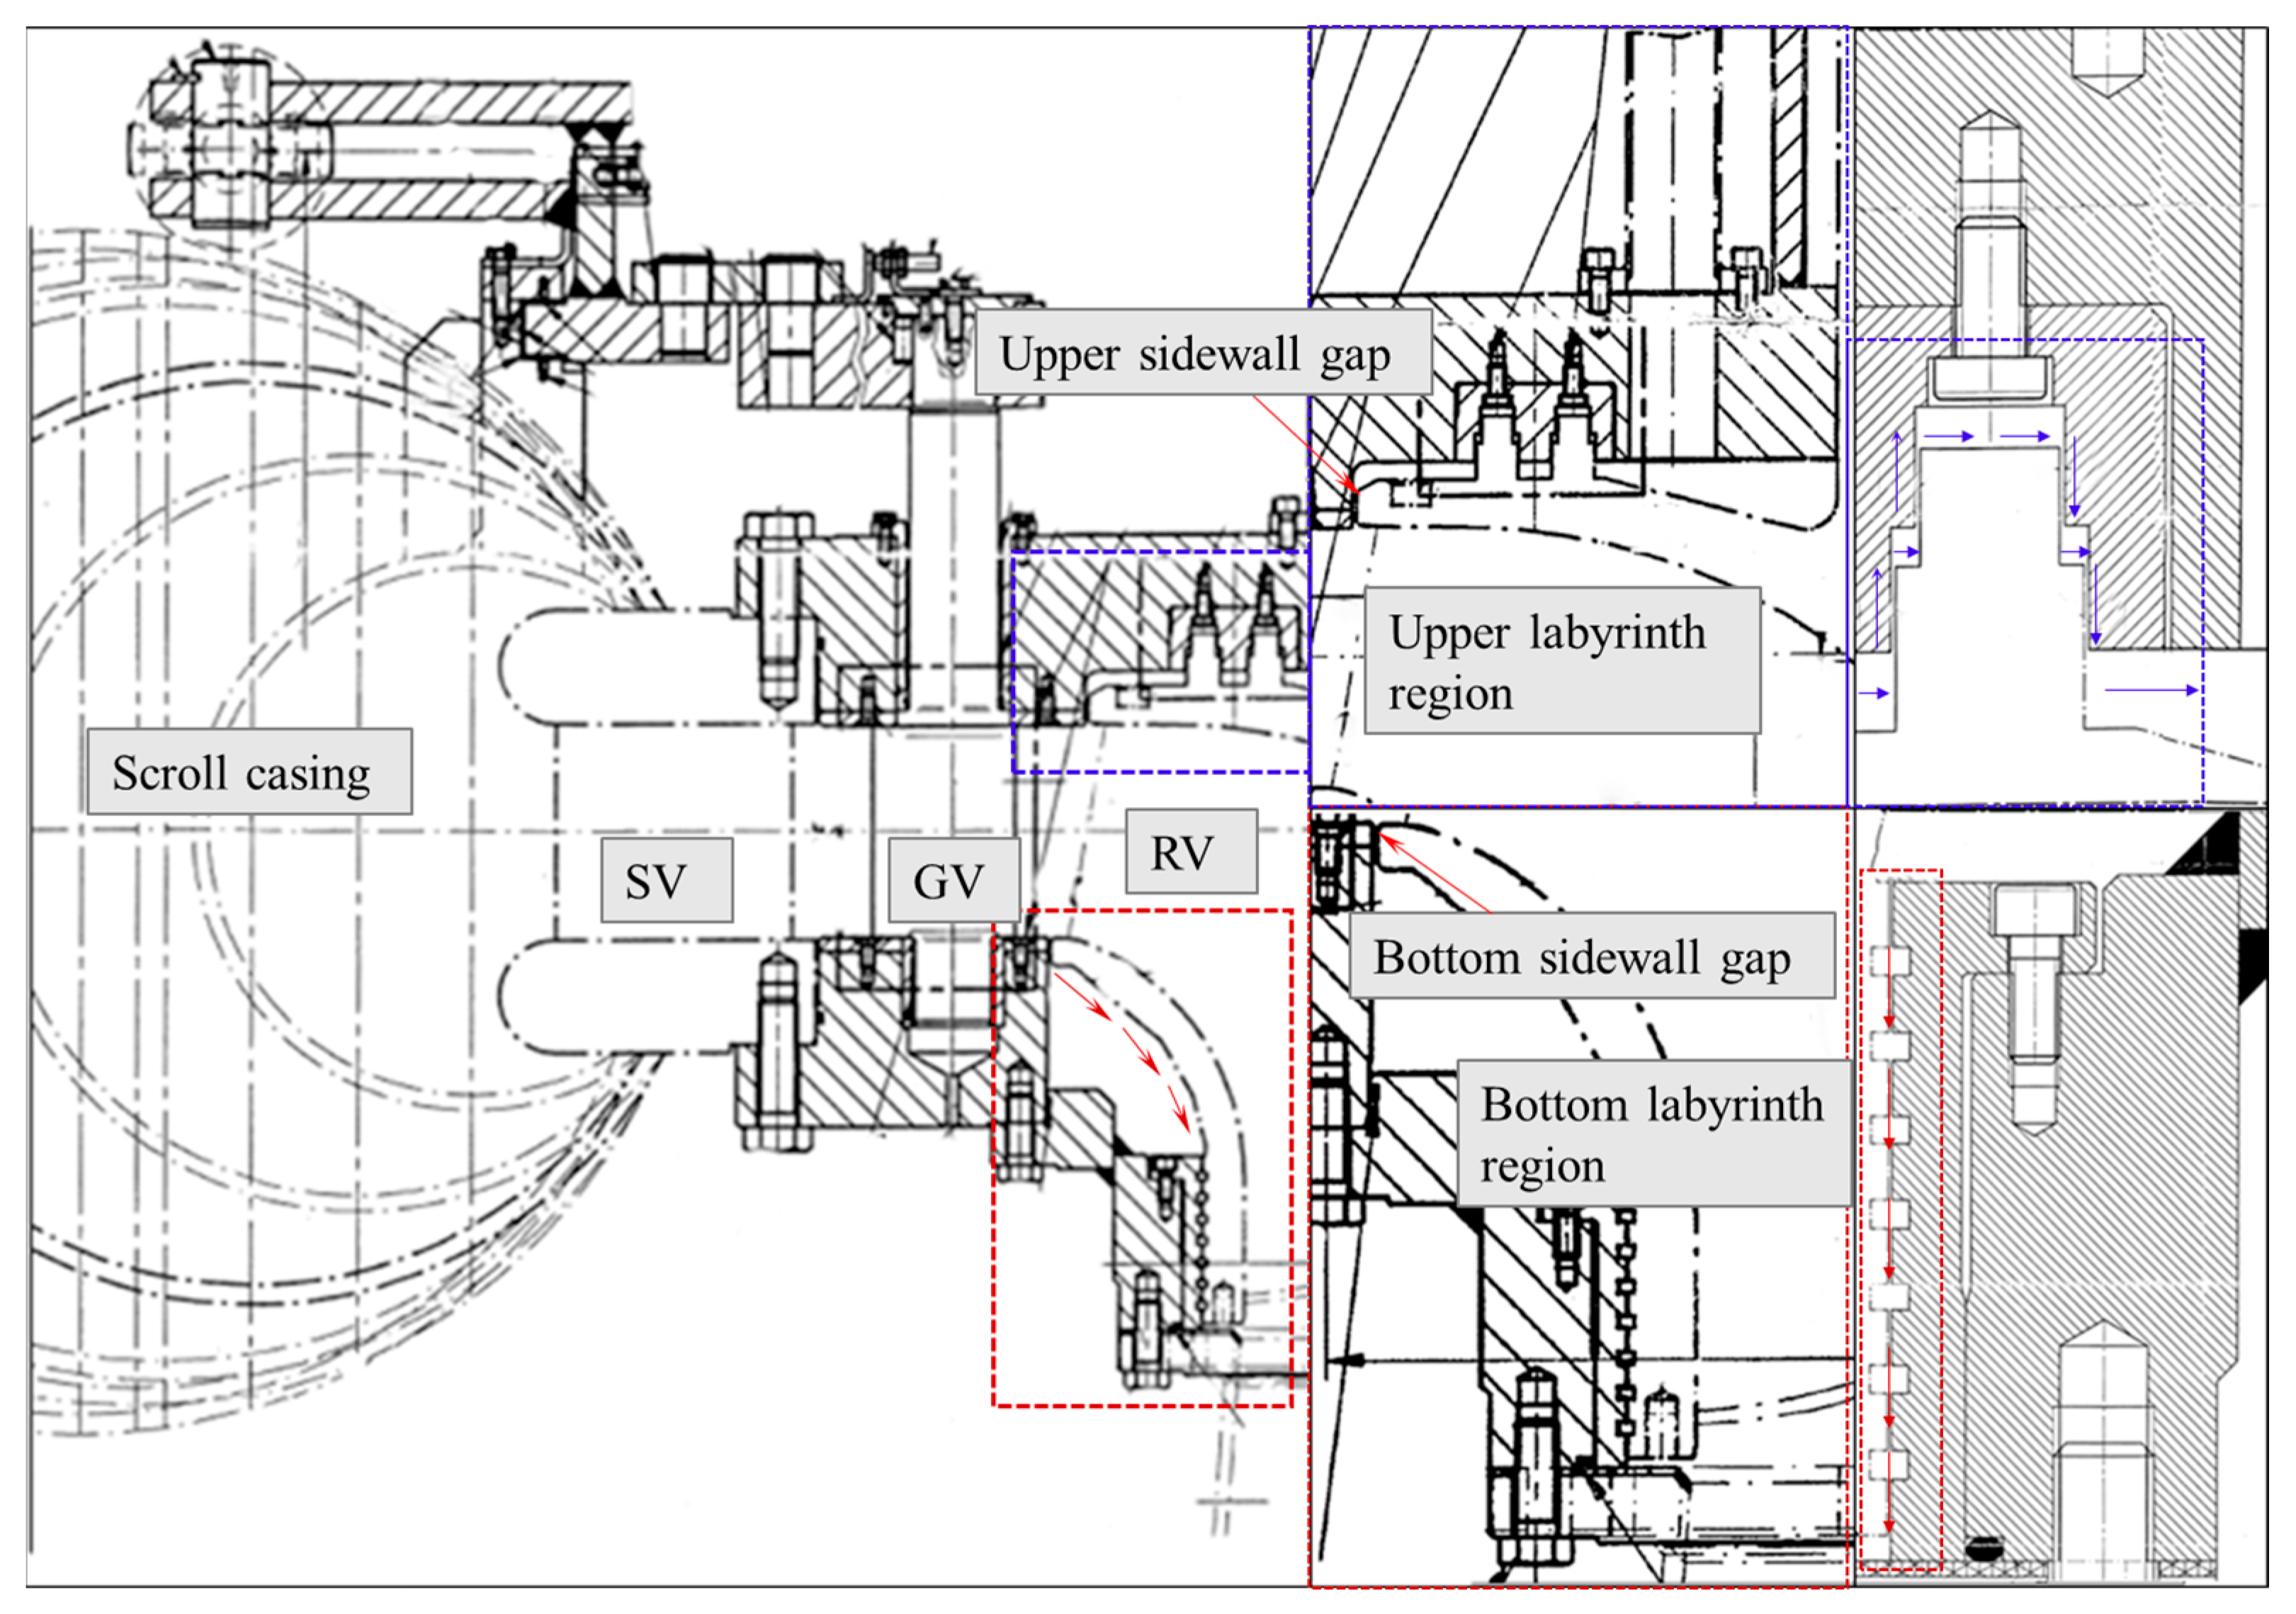
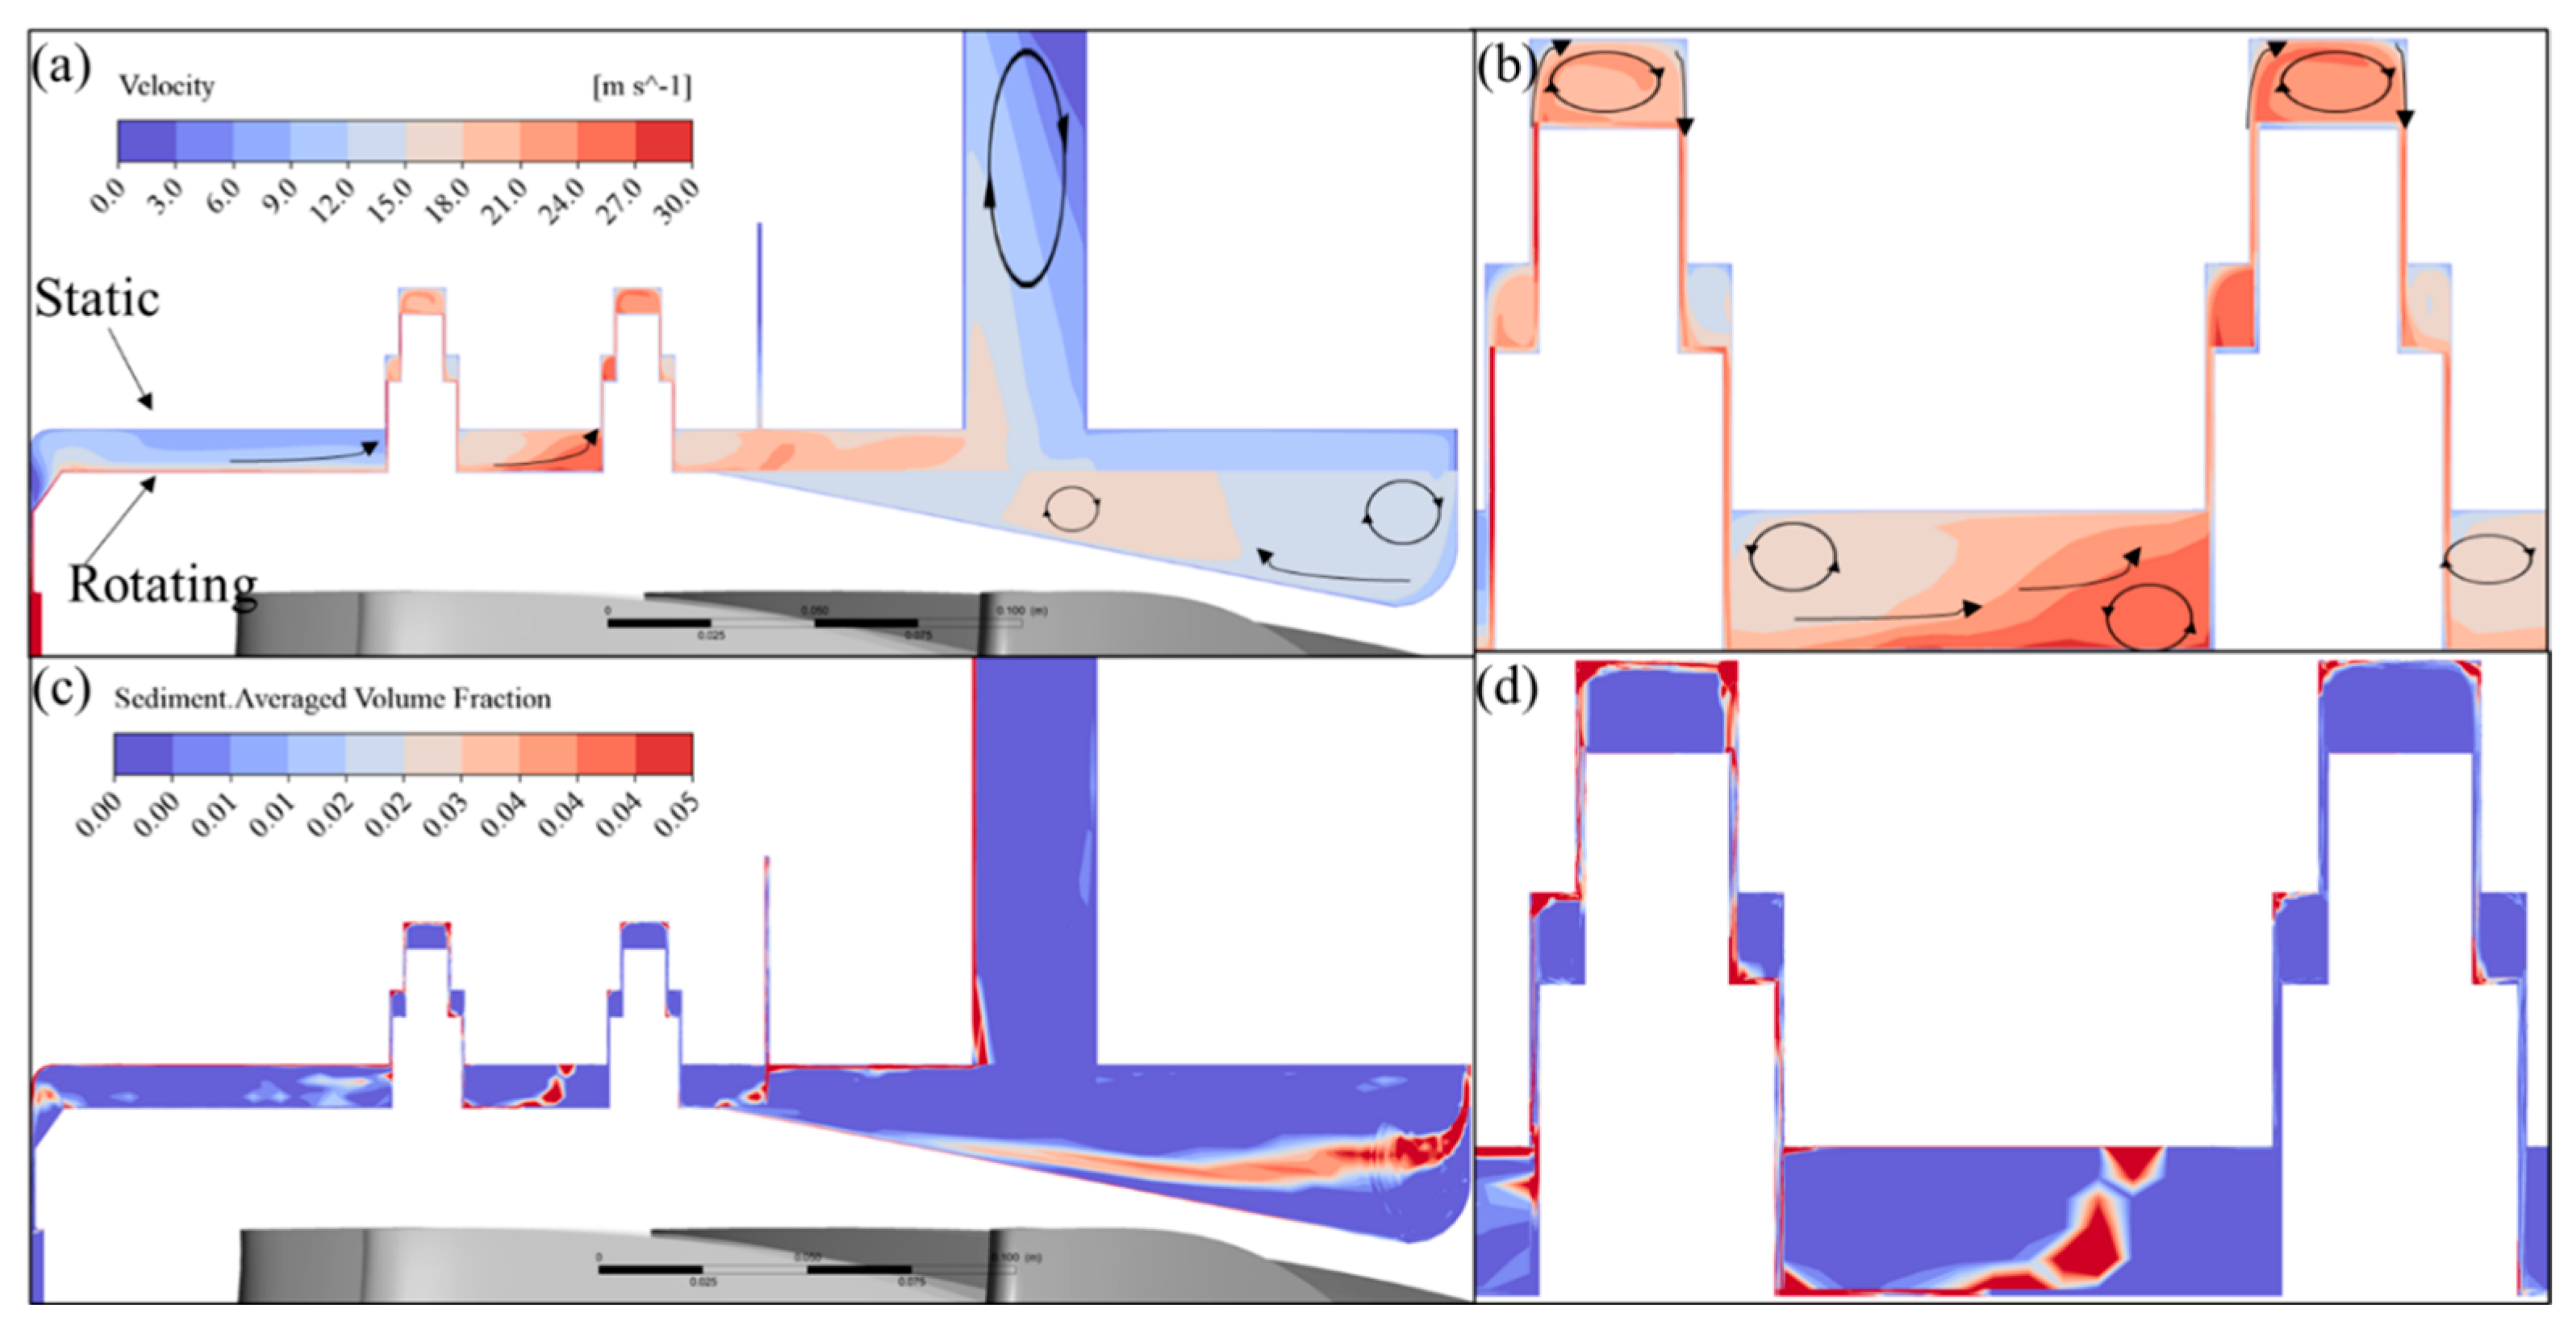
4.1. Flow in the Labyrinths

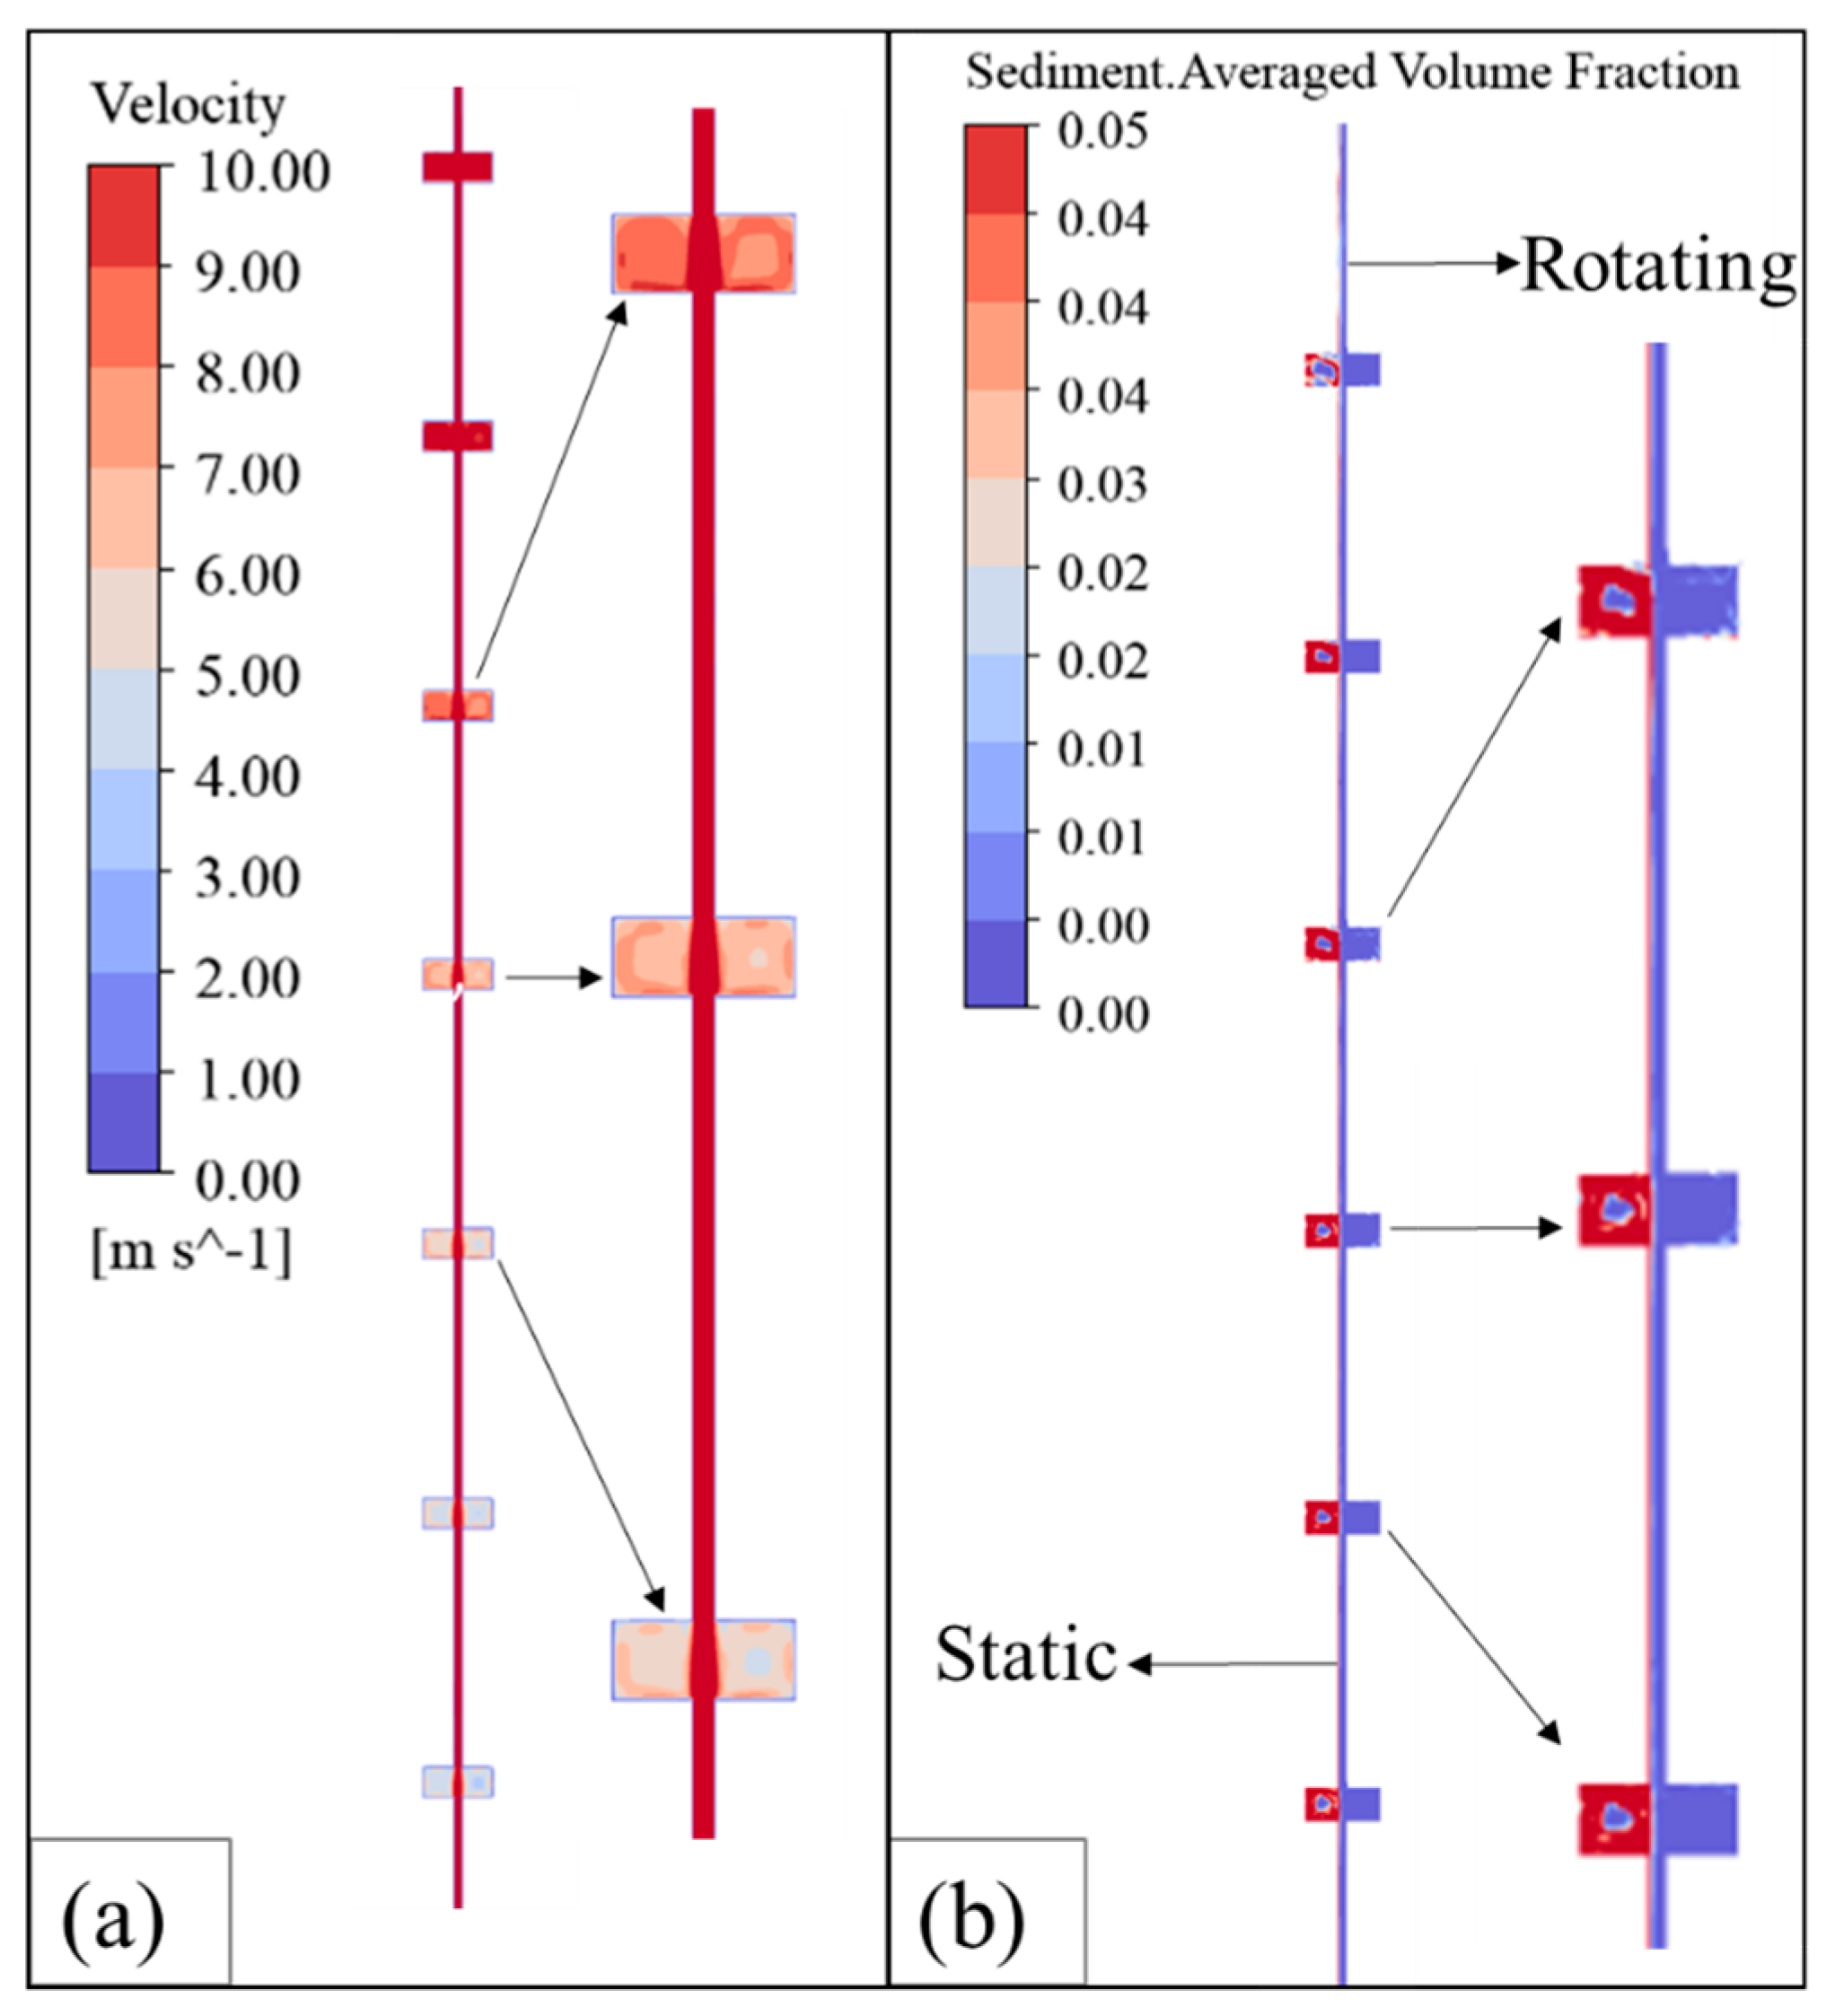
4.1.1. Upper Labyrinth Seal

Figure 11 shows the flow field inside the upper labyrinth seal at the BEP and the corresponding sediment volume fraction. As discussed in the previous sections, flow inside the channel of the labyrinth is affected by fluid flow in the seal. The domain of the upper labyrinth is divided into two distinct segments: (i) the static domain and (ii) the rotating domain. The crown side of the runner is composed of the rotating upper labyrinth, and the interaction of these rotating and stationary labyrinths affects the resulting pressure oscillation and, finally, the flow scheme. Vortex formation within the flow field can occur due to the high-velocity interactions at the labyrinth seals, leading to the development of rotational structures that can enhance sediment entrainment. This sediment build-up can adversely affect rotor performance by causing additional wear and reducing the efficiency of fluid transfer. As the sediment volume fraction increases, it can disrupt the hydrodynamic characteristics of the flow, significantly changing the pressure distributions and inducing cavitation in critical regions [23]. In the flow contour presented in Figure 11 and the detailed view of the stepped labyrinth, a region of rotational vortices can be noticed. These vortices facilitate the particles’ movement toward the rotor, and the interaction between the sediments and the rotor leads to increased erosion rates and affects the overall performance of the turbine.

4.1.2. Bottom Labyrinth Seal

Figure 12 shows the flow field and corresponding sediment-averaged volume fraction in the bottom labyrinth at the BEP. Toward the opposite ends of the annular flow, flow recirculation in the cavities can be observed in the form of toroidal rolls.
When the fluid escapes through the sidewall gaps, it reaches toward the upper labyrinth region and the bottom labyrinth region. In these regions, there is a successive decline in the pressure. As already explained, flow leaving the upper labyrinth is transferred to an atmosphere prescribed as an opening-type boundary. Similarly, flow leaving the bottom seal gap mixes with the draft tube fluid. In Figure 13, the normalized pressure (Cp) is plotted against different points of measurement inside the rotating labyrinth. Here, the pressure is normalized as follows:
C p = p ˜ p ¯ ( ρ g H ) B E P       [ ]
The comparison of pressure distribution at these locations is similar to the analytical solution suggested in [7,12]. The locations of the pressure measurements in the upper labyrinth region are presented in Figure 13a. Overall, the pressure seems to decrease from inlet point 1 to point 21, but there are some regions toward P6–P7, P8–P9, P14–P15, and P16–P17 where the pressure fluctuation is almost the same. All these points are the main geometries of the upper labyrinth, where the pressure changes are similar, but the flow is rotational.
Due to this, erosion is predominant toward the corner of the labyrinth. Similarly, toward the bottom labyrinth, there is a gradual decrease in the pressure from point 1 to point 16, where the flow is directed toward the draft tube flow. Due to the geometrical distinction between the bottom labyrinth and the upper, the pressure variation is also different, taking the shape of the geometrical measurement locations. Also, there is a gradual decrease in the pressure from P1 to P16. In locations such as P2-P3, P4-P5, and so on until P14-P15, there is no change in the magnitude of pressure. However, if the fluid flow is analyzed in terms of sediment-containing flow, as presented in Figure 11 and Figure 12, there is a distinct variation in the sediment accumulation region where the region of the stationary bottom labyrinth has higher sediment accumulation compared to the rotating bottom labyrinth. Therefore, in Figure 3 and Figure 4, the erosion effect is much higher toward the stationary end.
Figure 14 shows the variation in the sediment erosion rate toward the stationary and rotating end of the bottom labyrinth. Since the erosion rate toward the stationary side is much higher than toward the rotating side (nearly 10 folds higher), the figure has different scales for the rotary and stationary sections. It can be noticed that the erosion is higher toward the stationary part, which is due to the highest accumulation of sediment particles in this region (see Figure 12). Moreover, in the case of the stationary domain, the erosion rate gradually decreases with respect to the guide vane opening, while, in the case of the rotating domain, it increases.
Figure 15 shows the flow field inside the draft tube at the design point and the effect of the unsteady vortical flow leaving the runner domain up to the draft tube bend. Flow leaving the bottom labyrinth mixes with the flow in the draft tube near the wall of the draft tube cone, and inside the draft tube, there is a region of high–low-pressure zones that extends up to the draft tube bend. A region of flow separation toward the cone of the draft tube and also some regions of rotational flow are observed. Under NLS conditions, high intensity was reported by Trivedi et al. for such a flow [32].
However, for the design point, the operating conditions in this study are such that a high-intensity vortical region is not present, except the mixing region, due to leakage from the bottom labyrinth.
This region of vortical flow is further examined in different sections of the draft tube cone, as shown in Figure 16. In this case, two distinct vortical regions are observed while the flow is visualized for different planes of the draft tube cone. The first region of the high-intensity vortex is near the wall of the cone, which gradually decreases from Plane 1 to Plane 6. Here, up to Plane 4, a high-intensity vortex near the wall is observed due to the mixing of leakage from the bottom labyrinth. However, away from Plane 4, this leakage completely mixes with the main flow, and, therefore, the region vanishes, except for the boundary layer flow. The second vortical region is observed at the center upstream of Plane 4 and vanishes when the flow moves downstream. Such vortex core regions could affect the overall performance of the turbine, thus reducing the efficiency [38].

4.2. Theoretical Implications and Overall Discussion

The nature of the fluid flow is directly related to the erosion region at different geometrical locations in the Francis turbine and, as suggested by past studies [2,31,32,33,34], is highly unpredictable. This unpredictability is even higher if the regions such as the clearance gaps, sidewall gaps, and labyrinths are considered. This section aims to give detailed insights into the fluid flow in these regions.

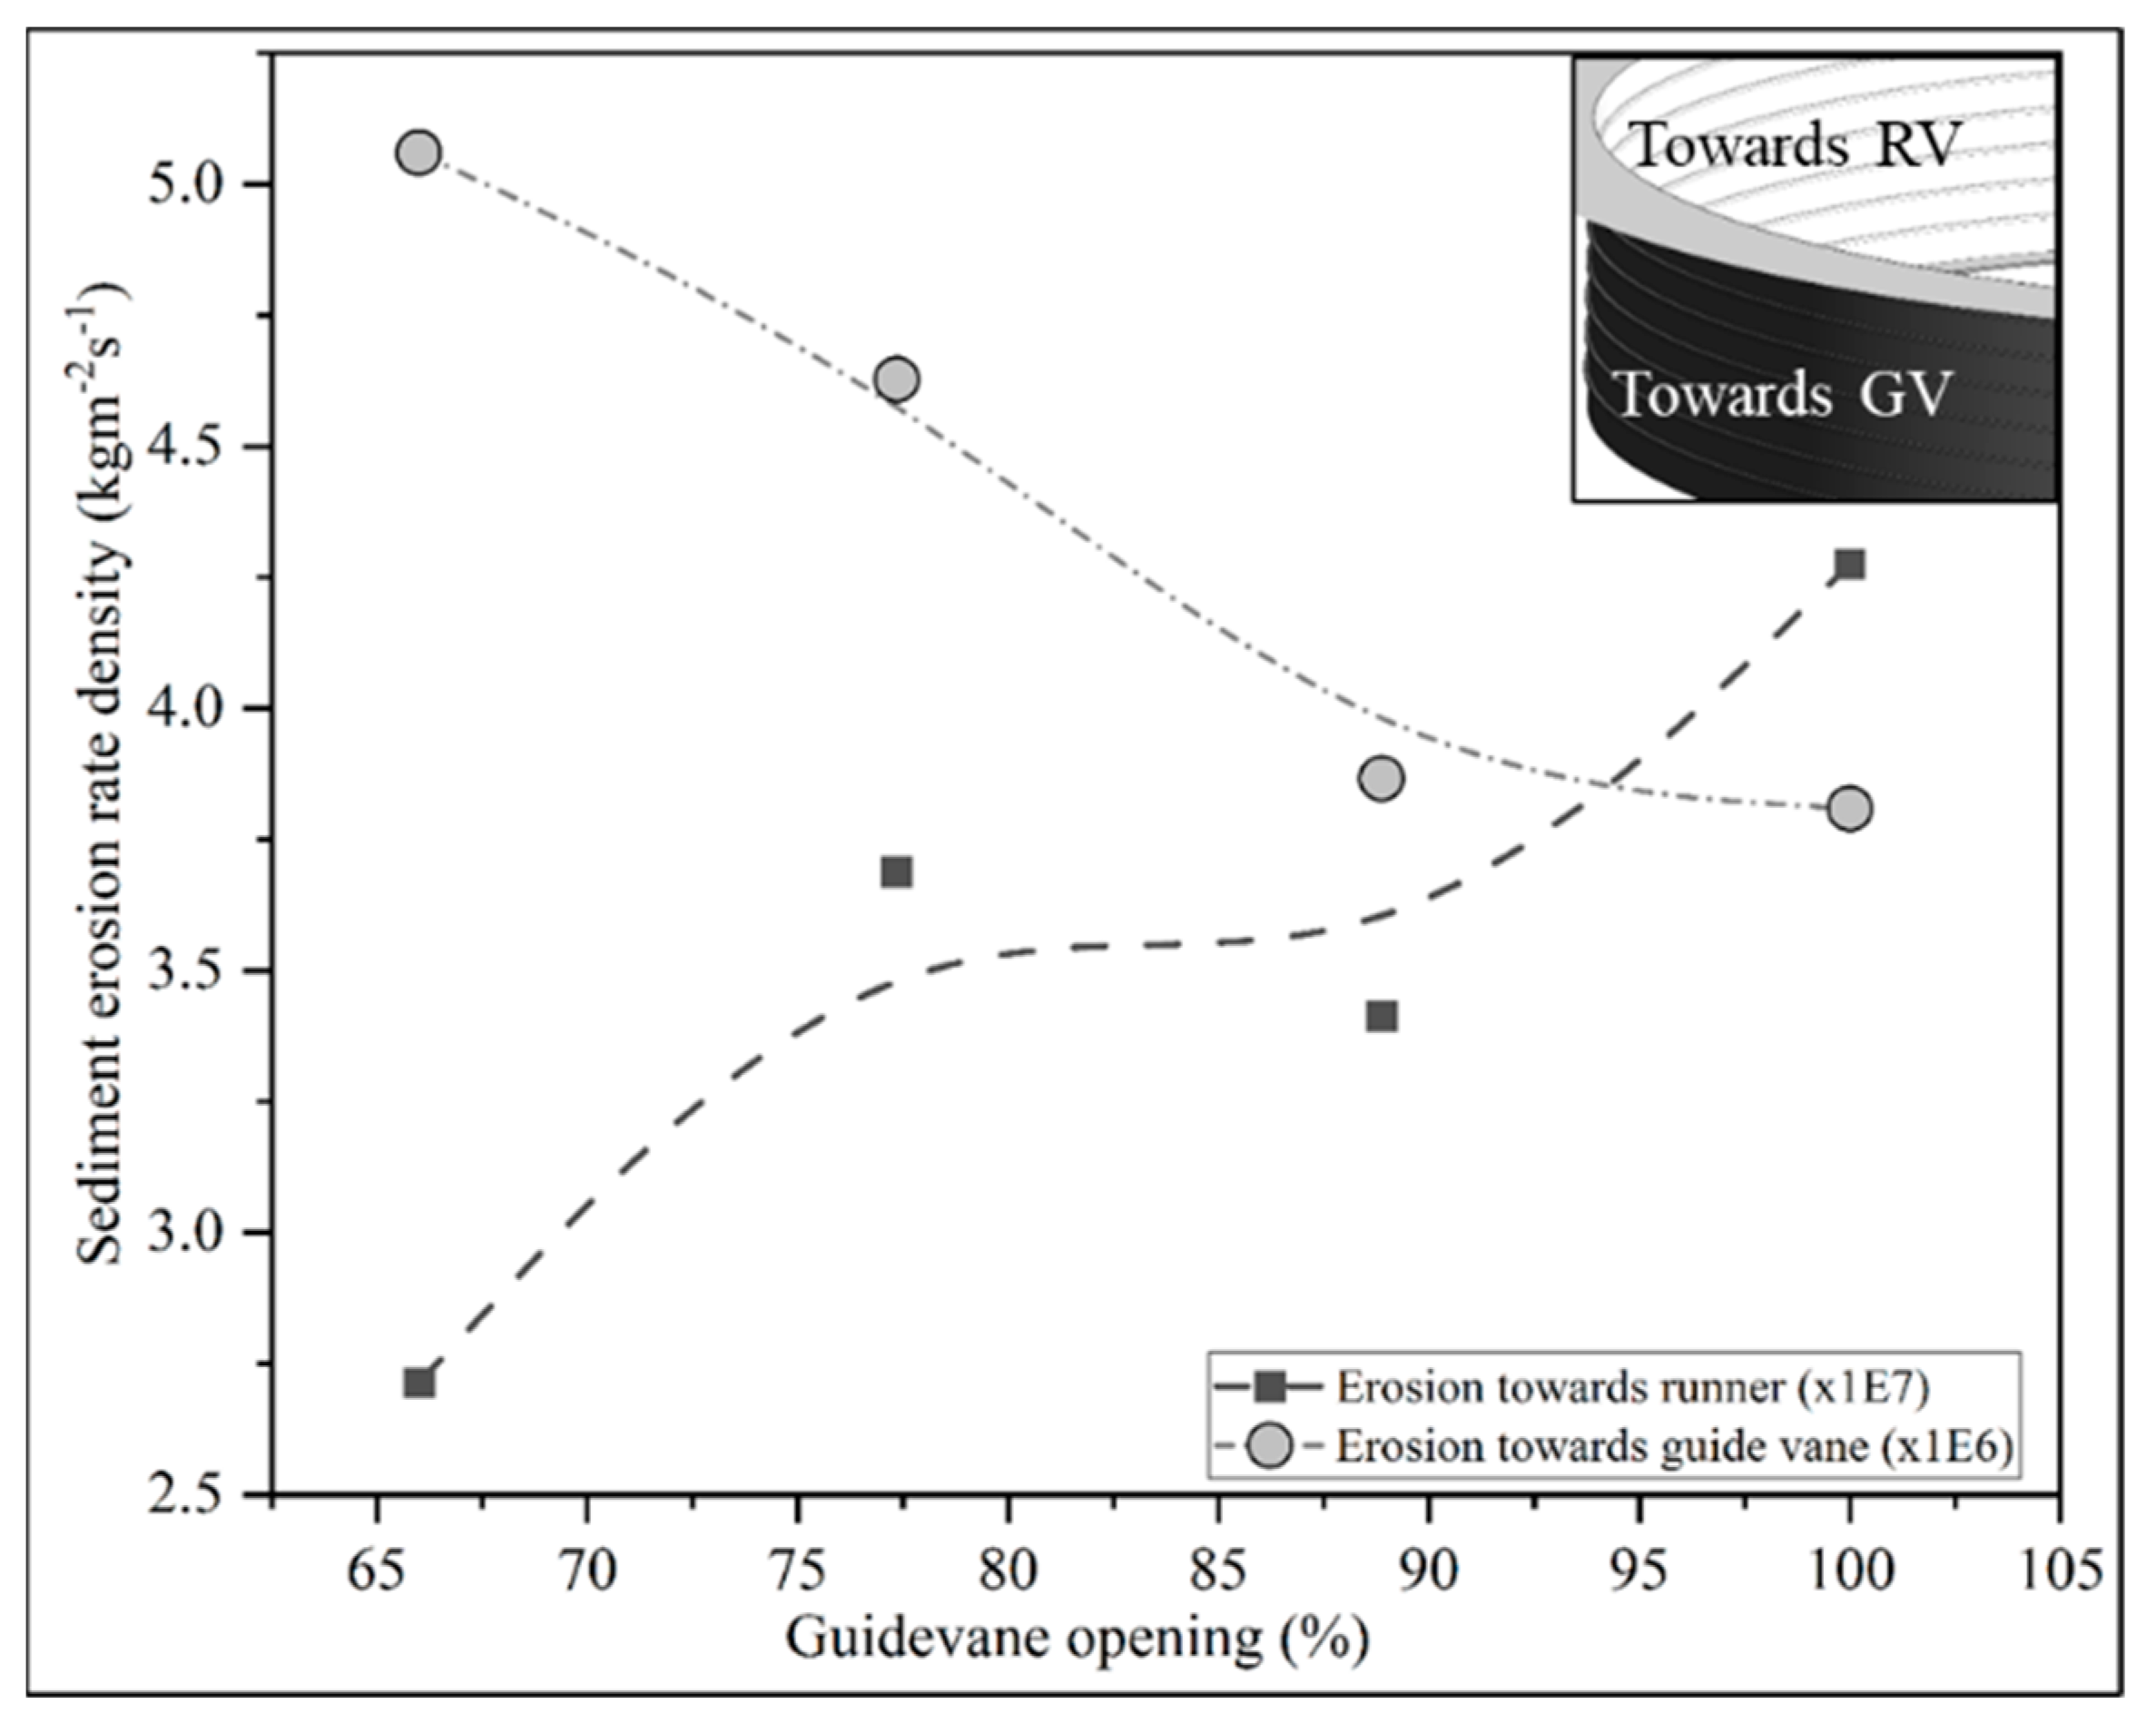
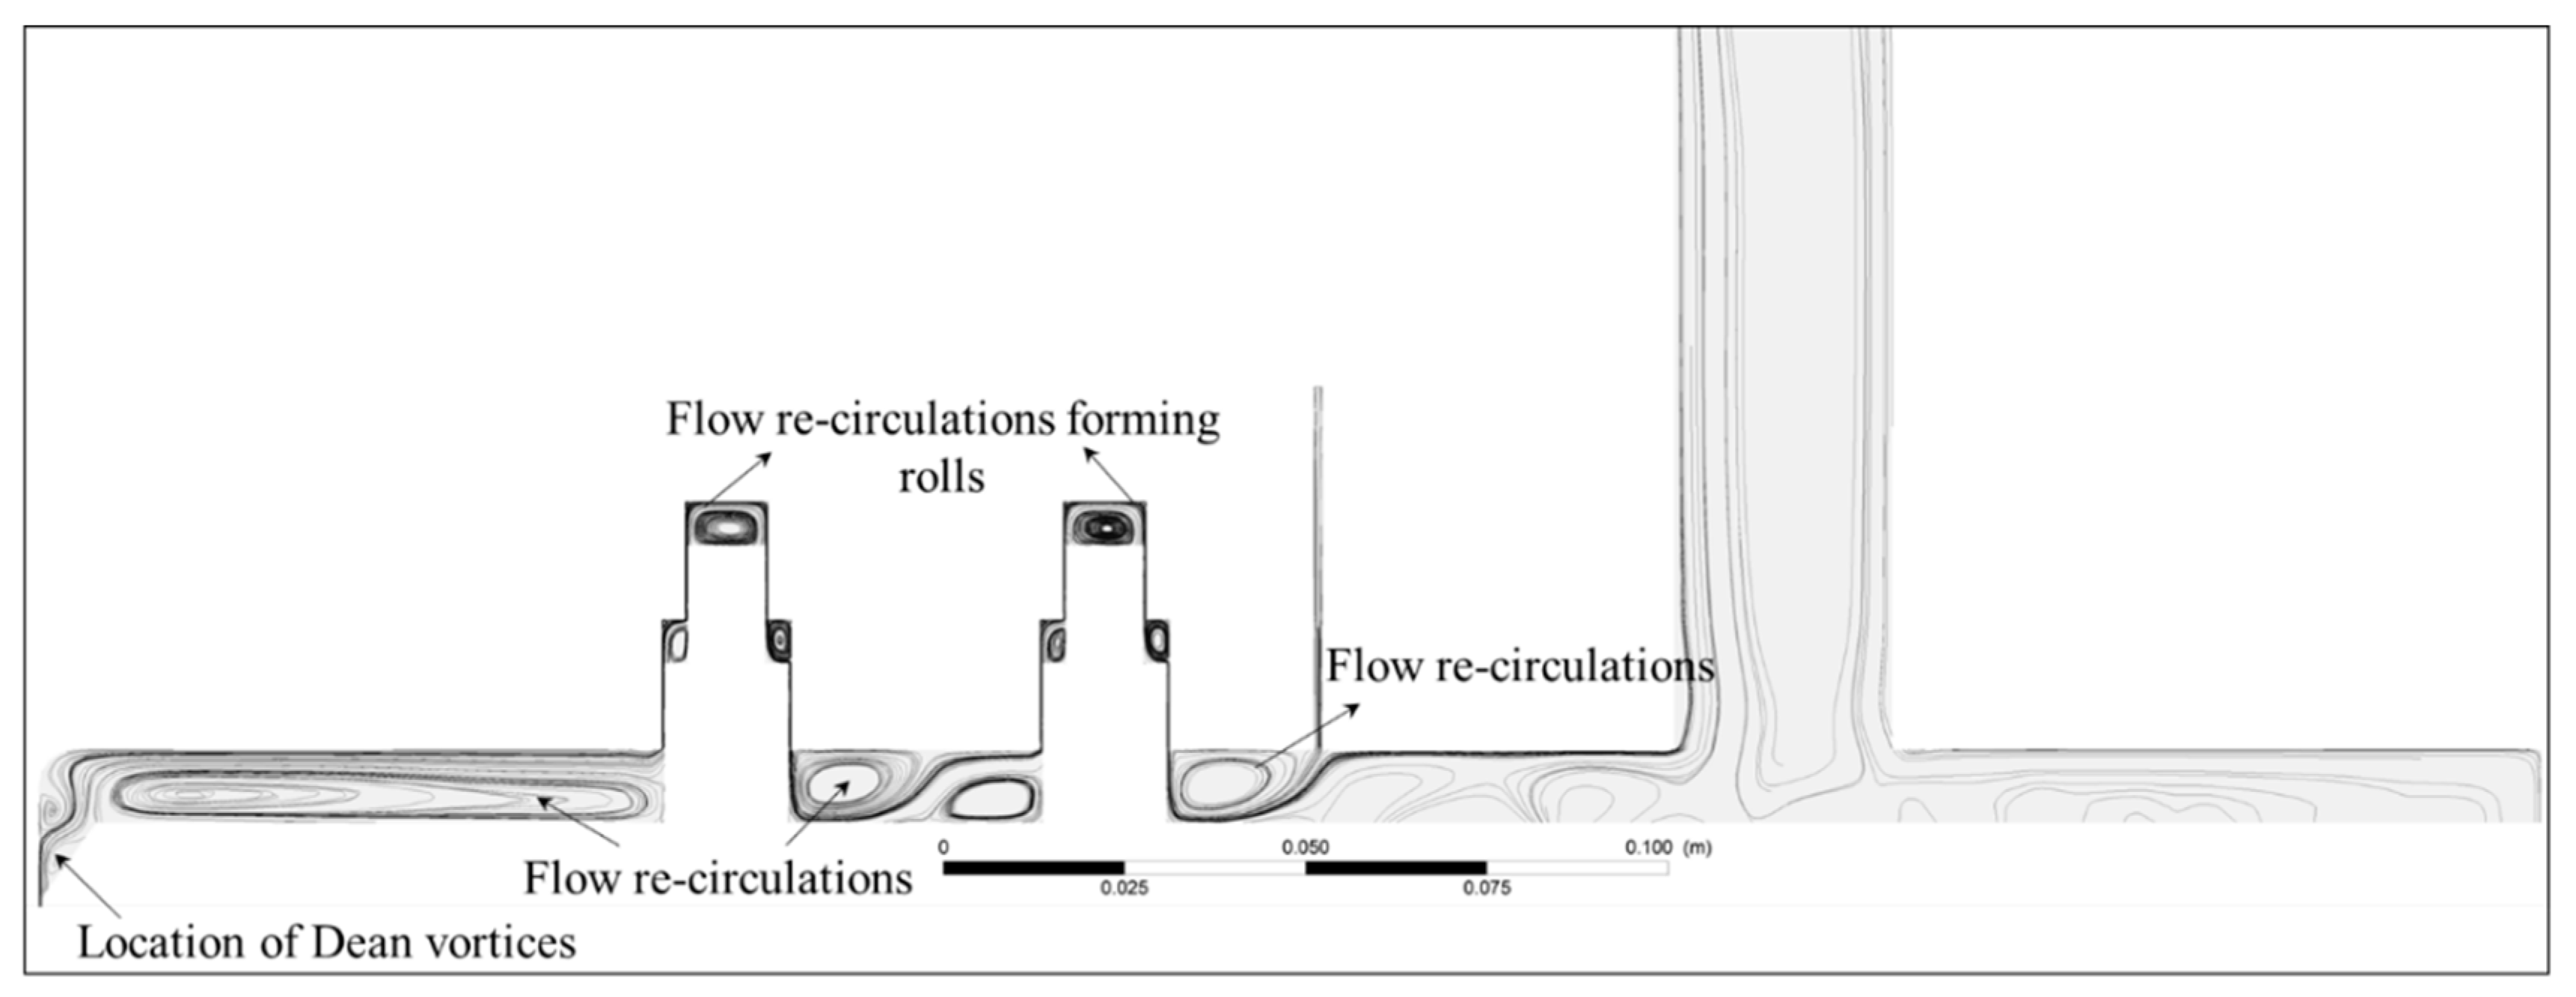
4.2.1. Guide Vane Clearance Gaps

Detailed investigations into the flow field inside the clearance gap of guide vanes and its effect are available in the literature [5,17,18,19,20]. In a recent study by Acharya et al. [16], three different kinds of vortices were developed from the clearance gap regions: vortex 1, originating from the leading edge of the GV, vortex 2 from the shaft regions, and vortex 3 from the trailing edge of the GV. Since circular shaft geometry was also used in that study, the leakage vortex was found to be of higher intensity compared to the clearance gap when considering no shaft region. Acharya et al. [18] examined the nature of the vortices considering no shaft in the GV. In any case, the vortex is developed from the clearance gap region due to cross-leakage flow and is mixed with the main flow. The complex nature of the fluid flow in the clearance gap of the GV not only enhances the sediment erosion problem in the GV alone but also affects the rotating runner. The nature of these vortices was also observed in terms of the profile of the GV in the literature [22]. It was reported that an asymmetrical profile of the GV is better suited for high-head Francis turbines since it minimizes the pressure oscillations at the vaneless regions and is best suited for sediment-laden projects because the differential pressure between the two sides of the guide vane is minimized.

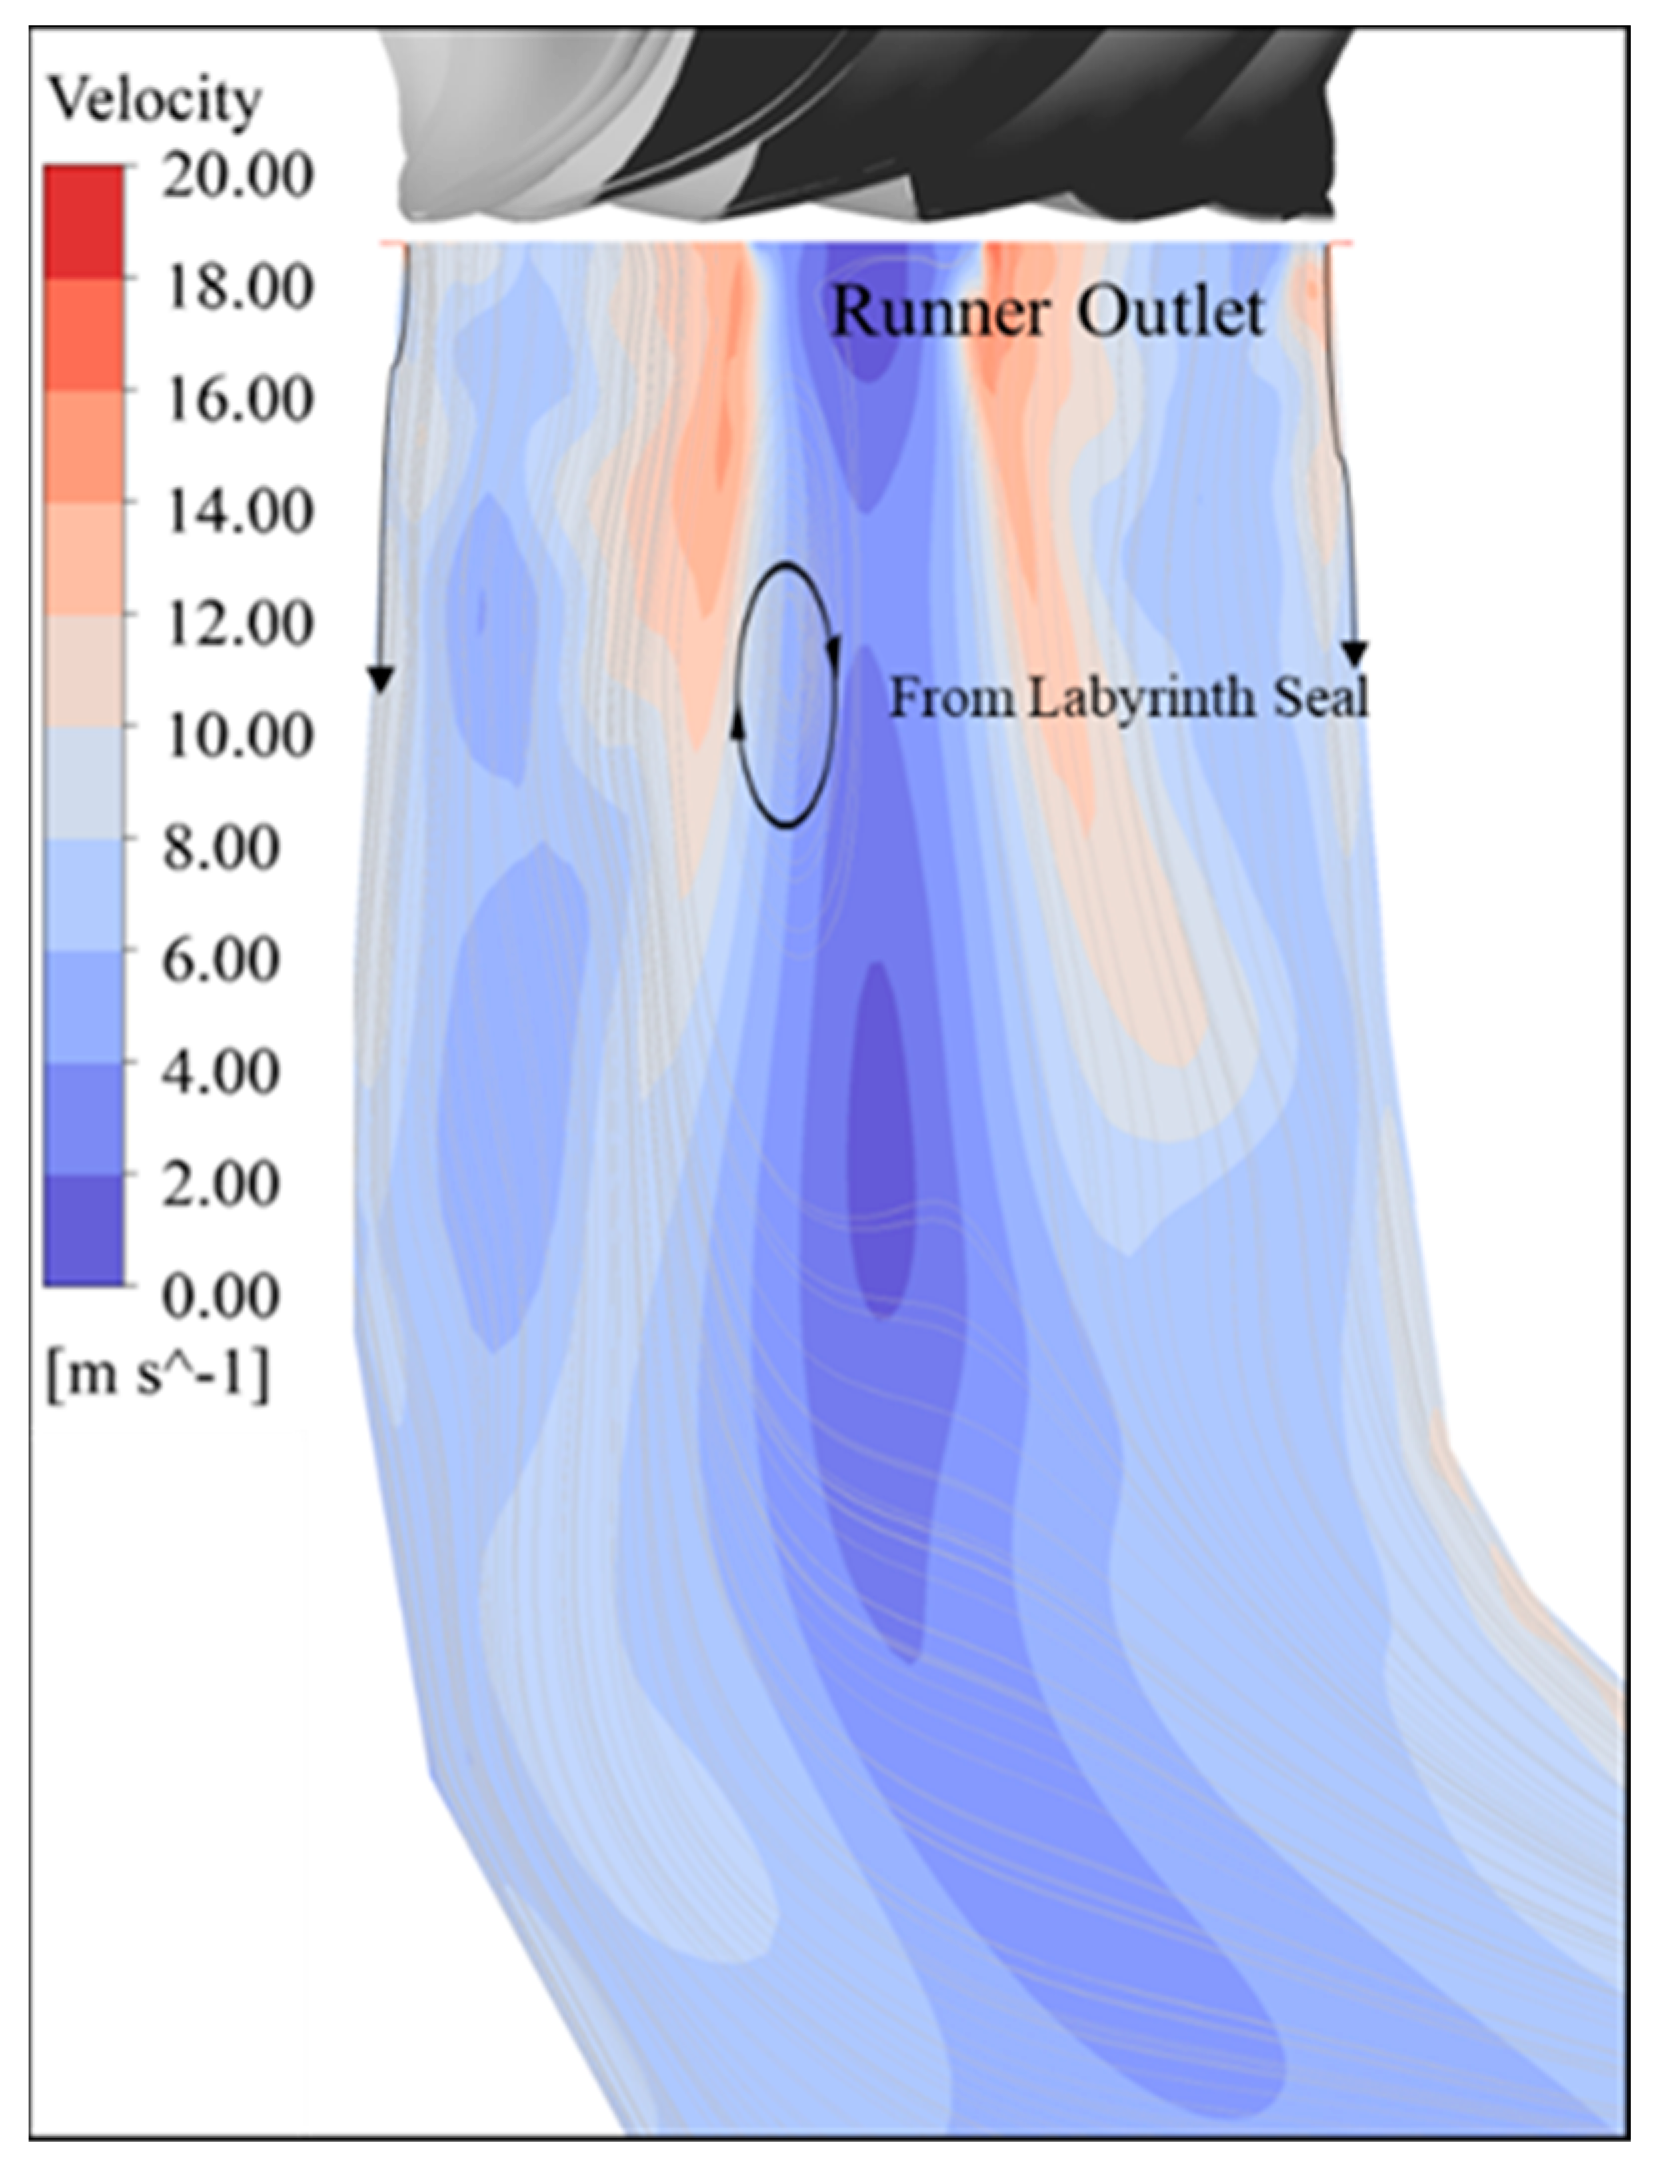
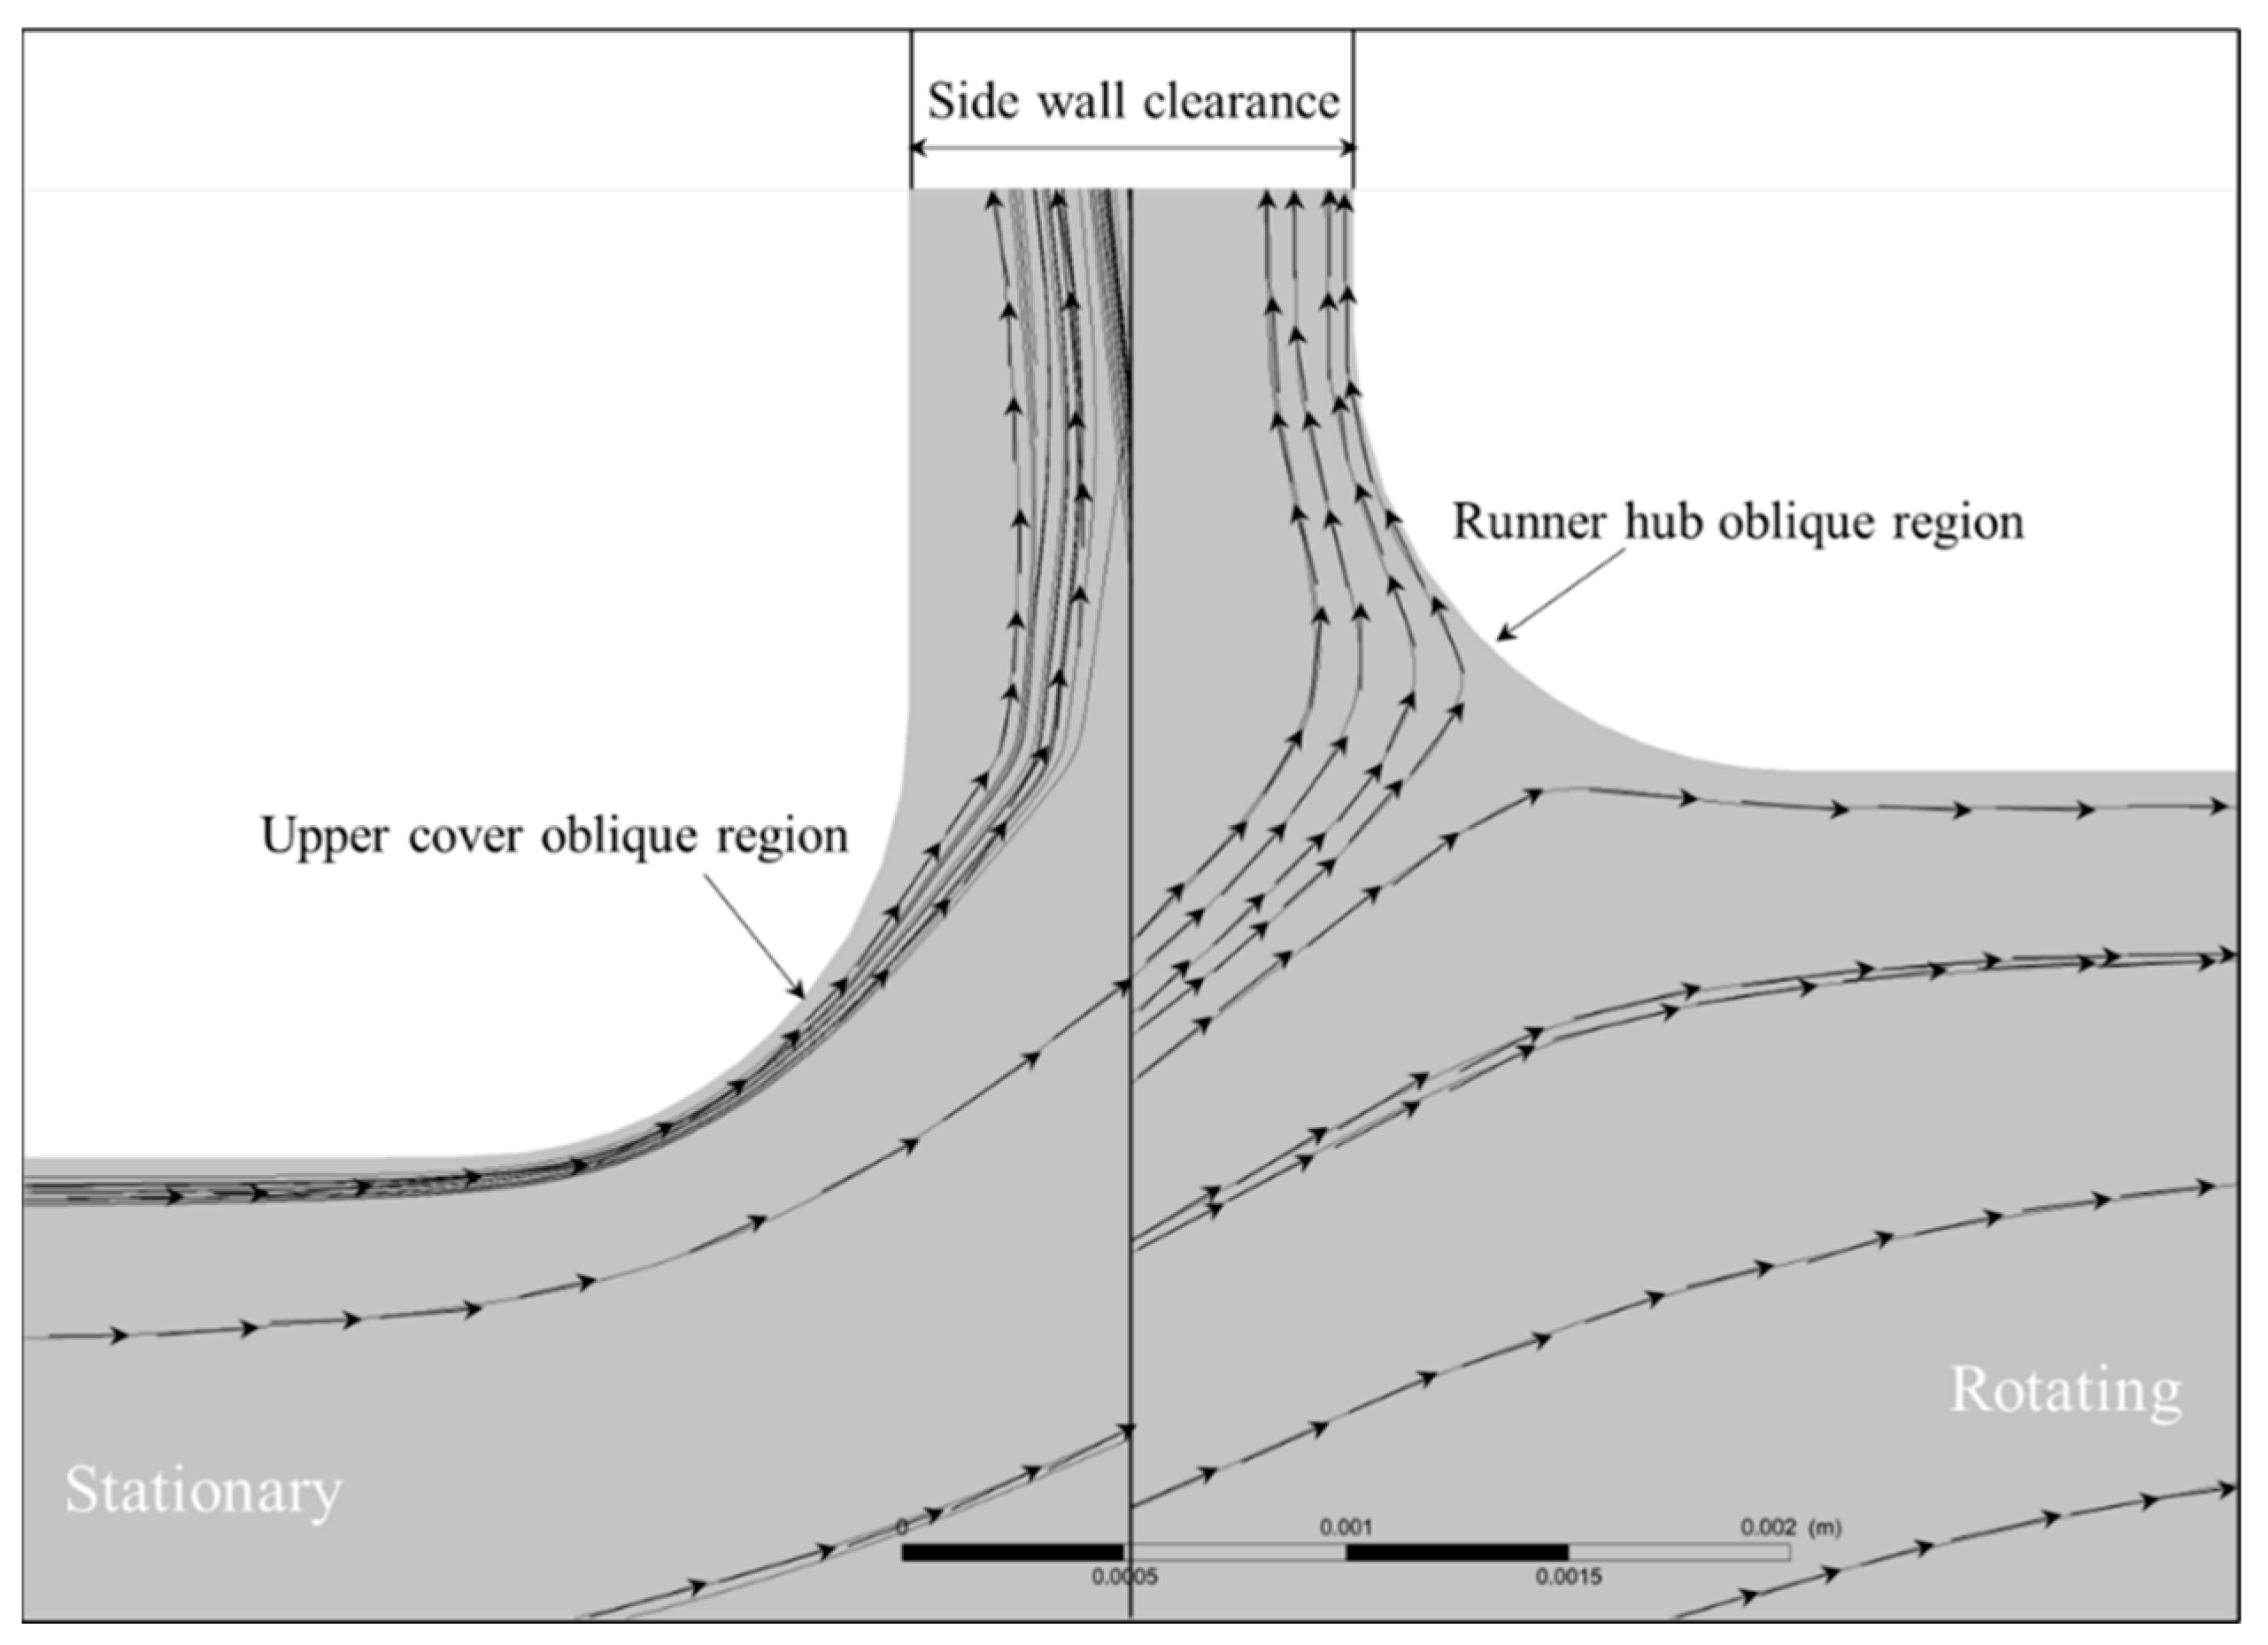
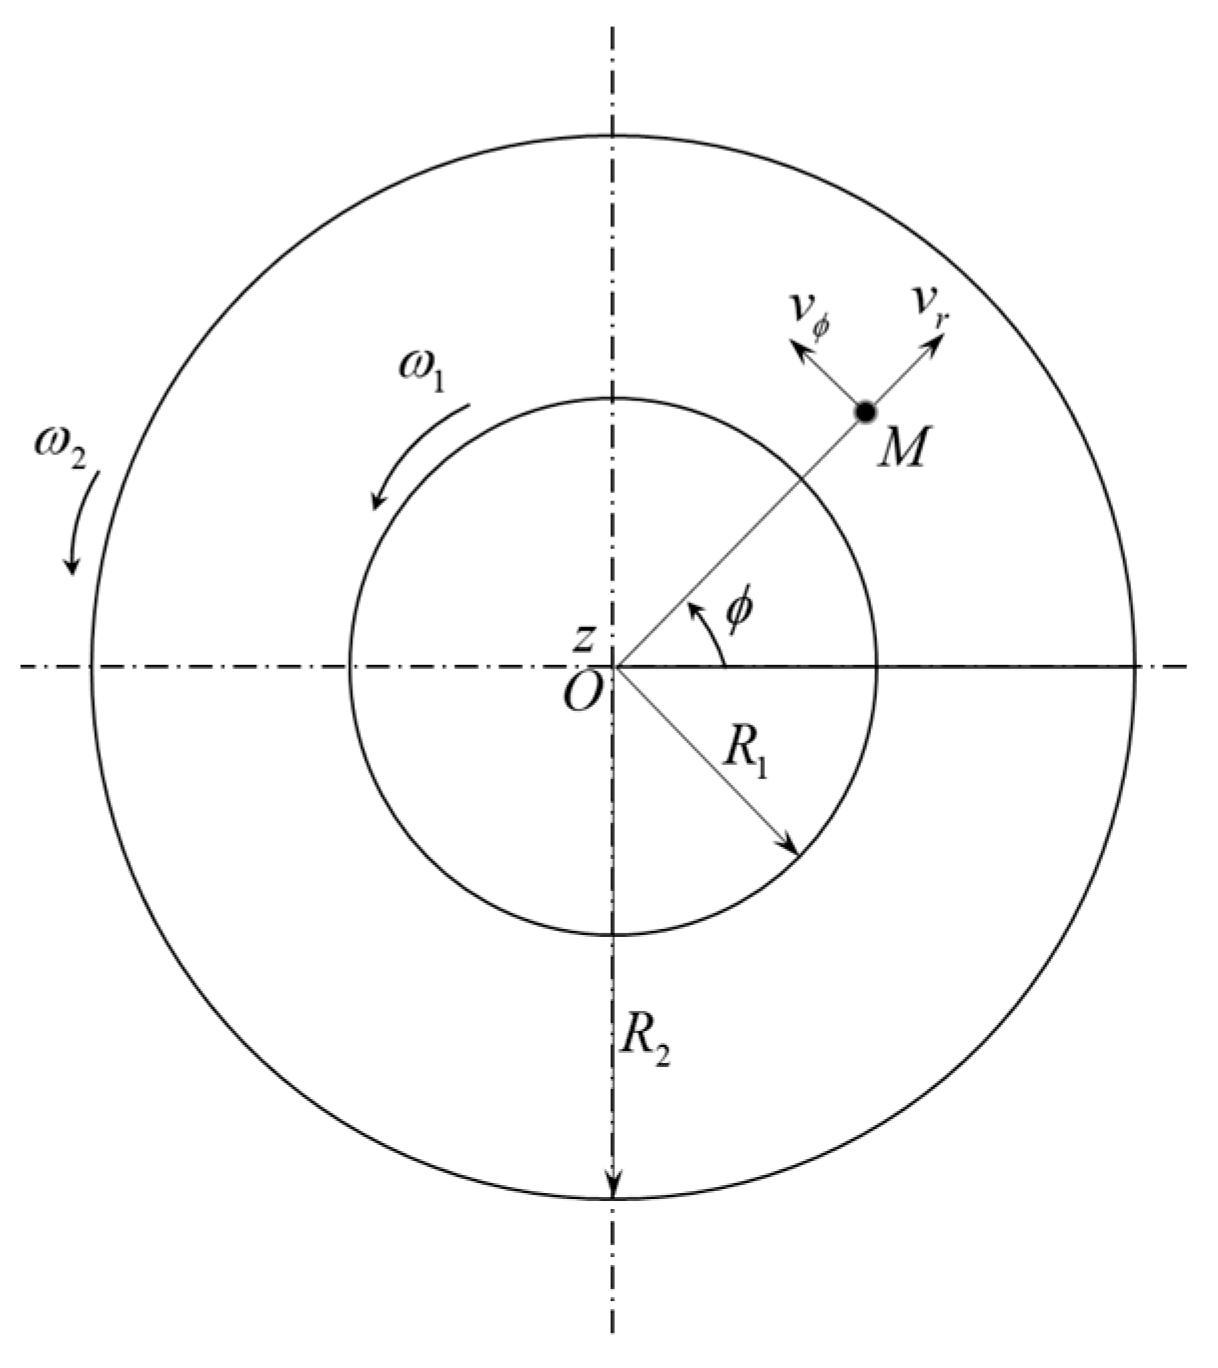
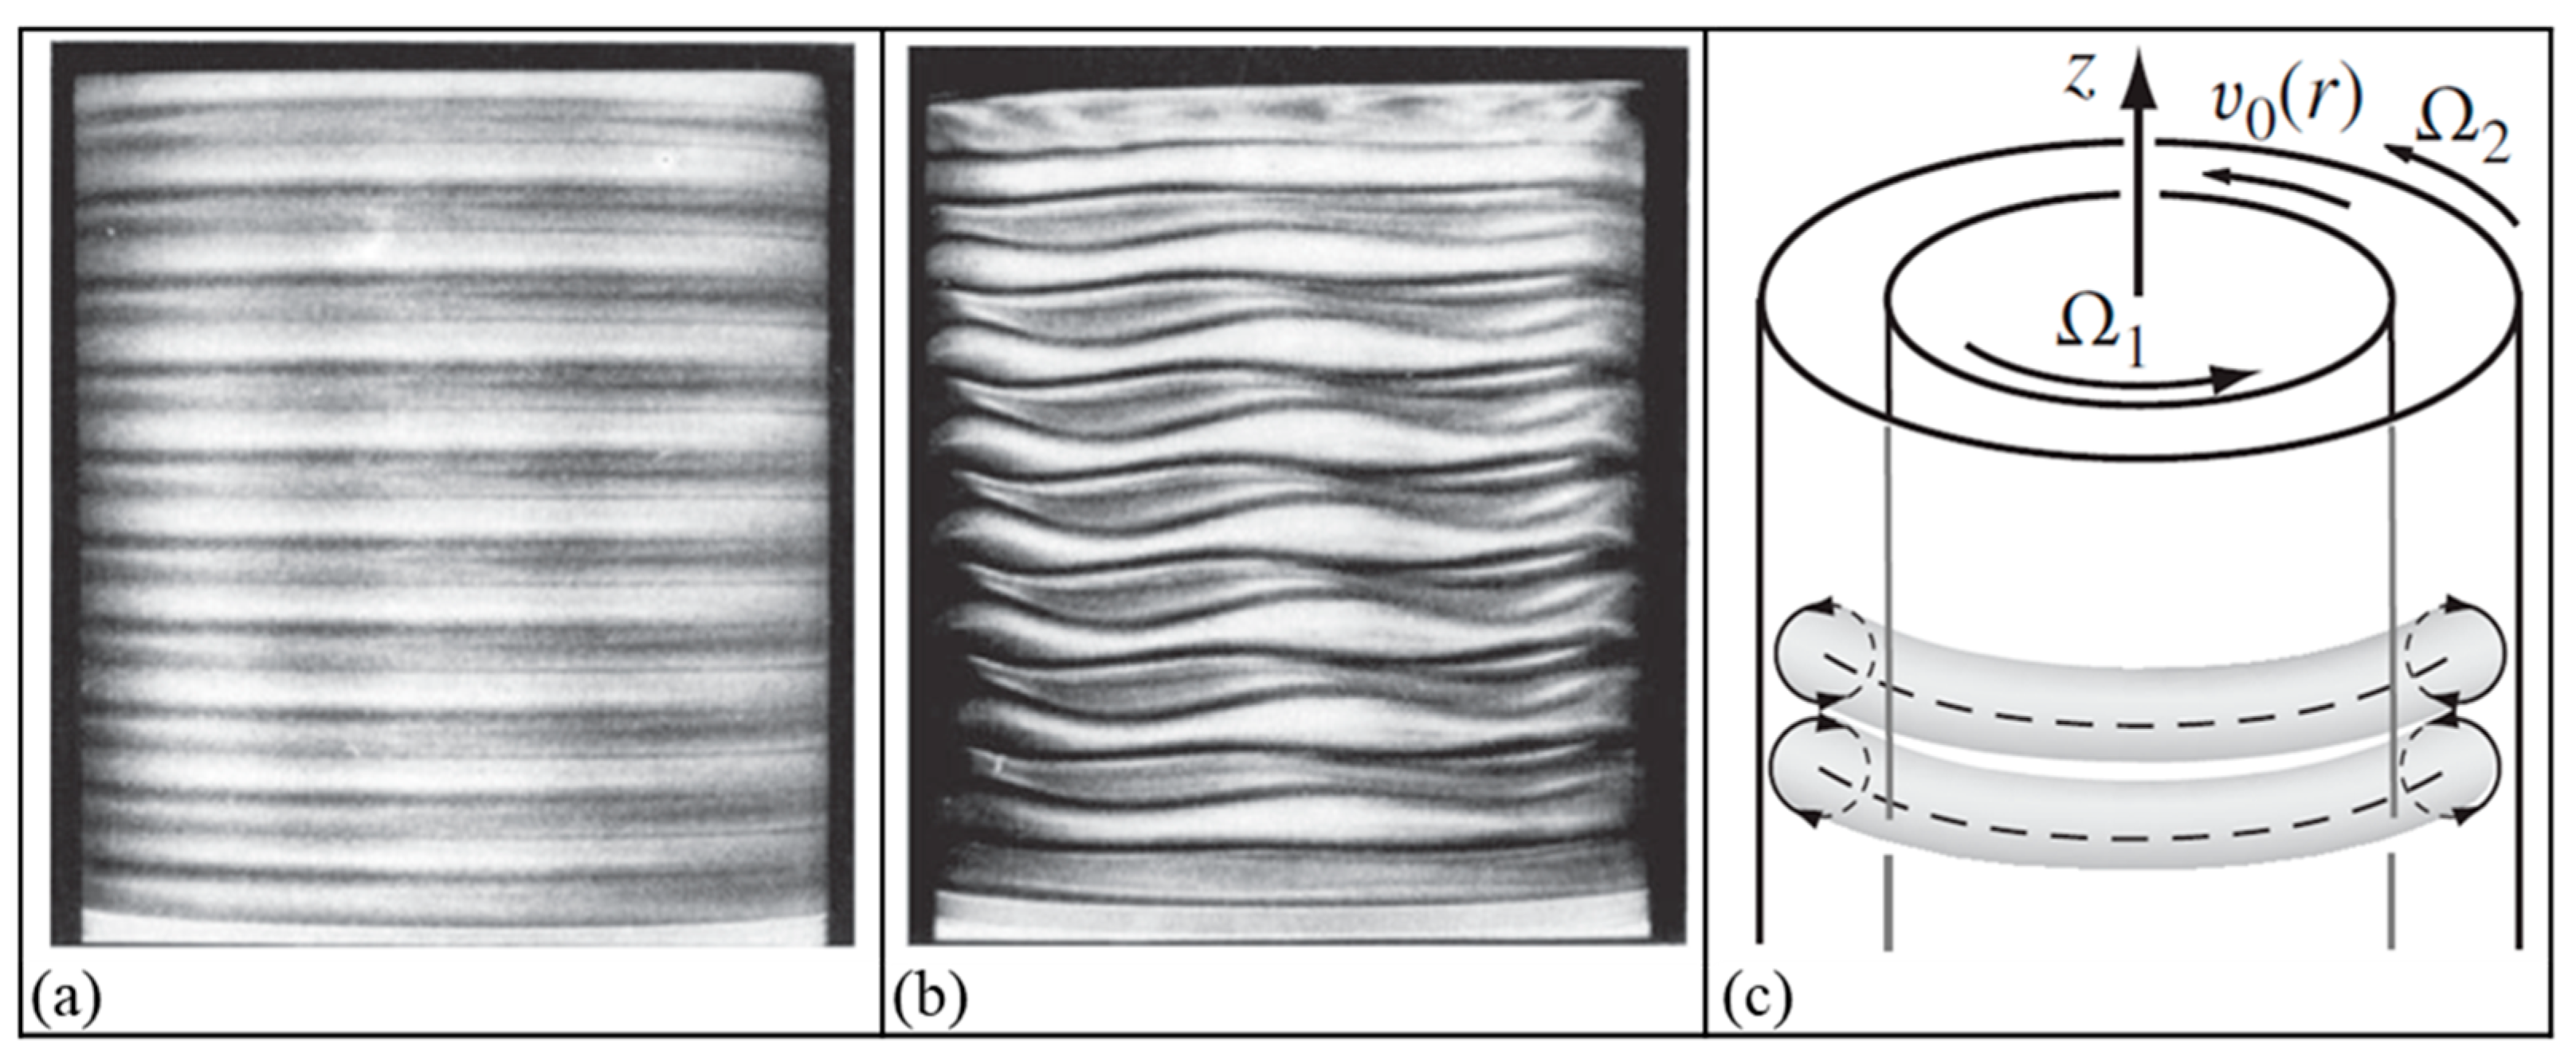
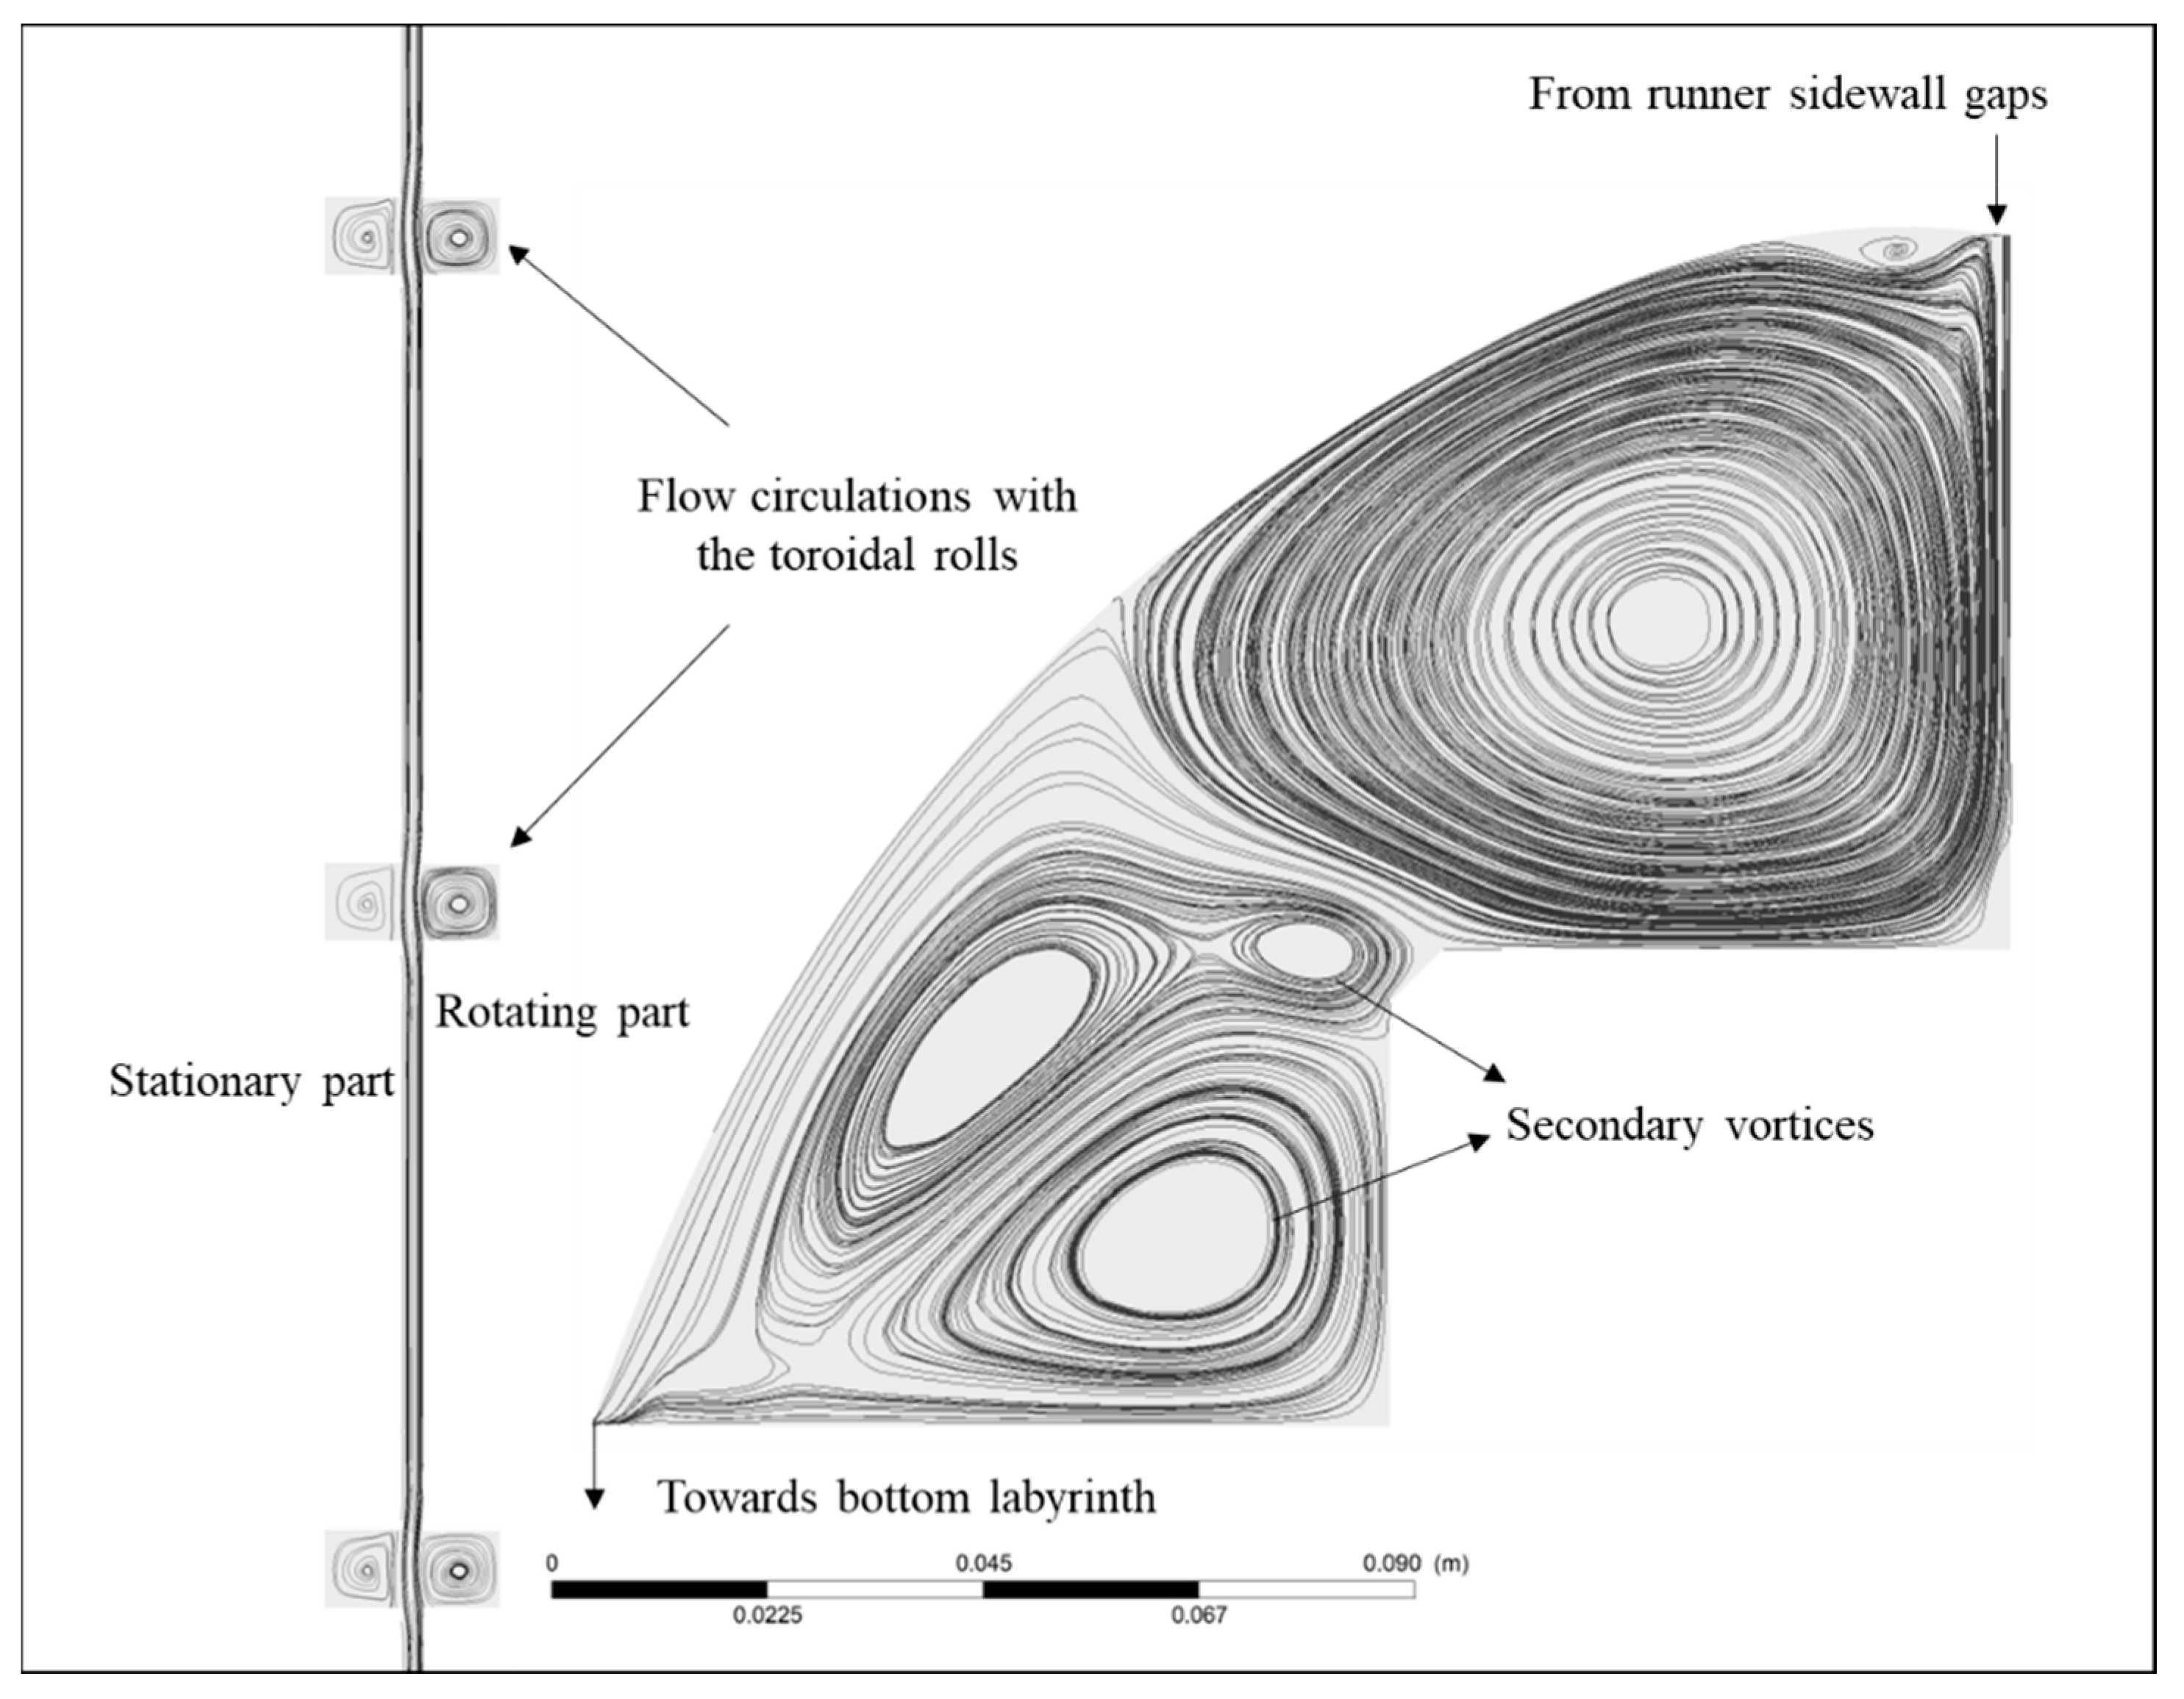
4.2.2. Runner Sidewall Gaps

When high-velocity fluid leaves the GV, a small portion of its flow escapes from the sidewall gaps. The nature of the fluid flow in the sidewall gaps can be investigated as a flow in the annular gap between two concentric cylinders where one cylinder is rotating at a certain angular speed and the other is stationary.
Figure 17 shows stream traces of the flow in the GV and RV. Since a clearance region is made in between these two components, a portion of the fluid escapes from this gap and moves toward the labyrinths, interacting with the near-wall surfaces. The velocity of fluid in these regions will be sufficiently higher toward the oblique fillet regions. Likewise, the angular speed of the runner also has a significant effect on the velocity of the escaping fluid. Therefore, toward the rotating end, the effect of the high-velocity fluid can be observed, while, toward the stationary end, the fluid velocity is comparatively small. This leakage flow reduces the overall efficiency of the turbine. Yan et al. reported the efficiency in a small-scale pump-turbine to be reduced by 5.56% and 6.05% with a clearance gap of 0.2 mm and 0.5 mm, respectively [28]. When fluid carrying sediment enters these gaps, due to the continuous effects of abrasion and erosion, the width of the gap also increases [29]. Hence, the reduction in the efficiency with the sediment-containing flow can be predicted in the case of the Francis turbine.

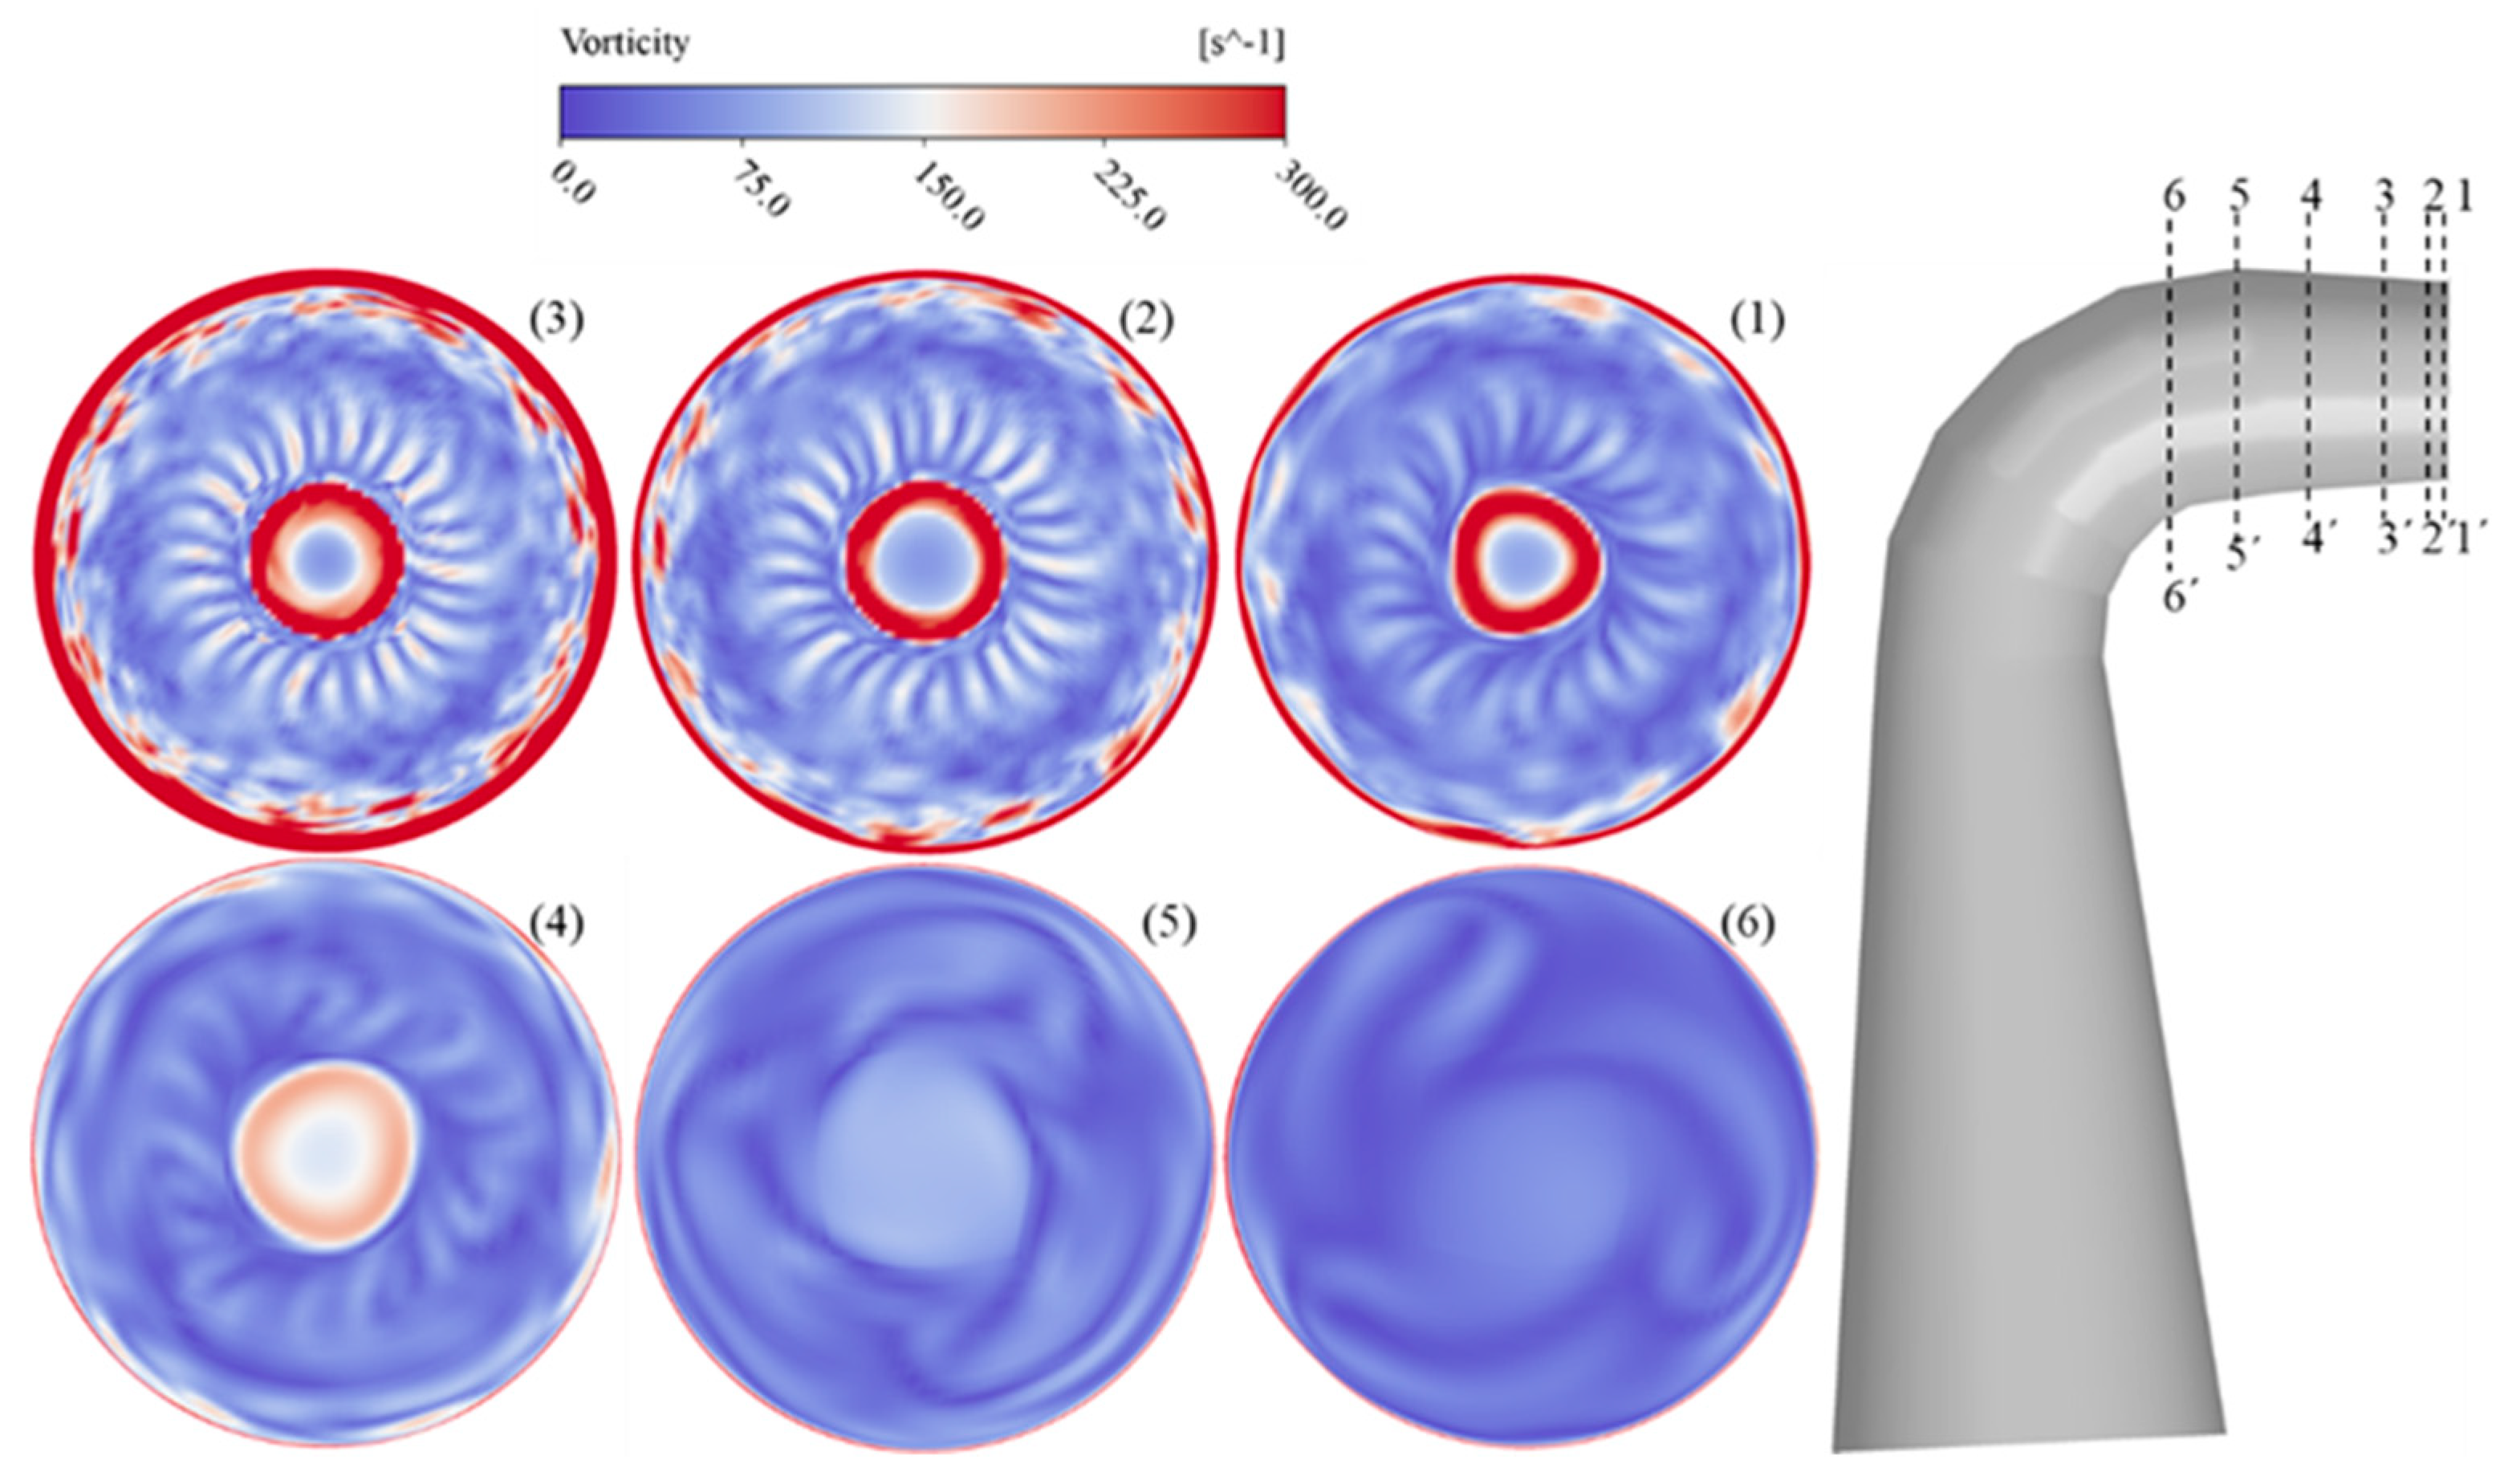
4.2.3. Upper and Lower Labyrinths

The labyrinths in Francis turbines are designed in such a way that they ensure minimum leakage flow with minimum impact on the turbine efficiency. In the labyrinths, the conversion of pressure energy into kinetic energy takes place and is then dissipated. Kinetic energy dissipation for the upper labyrinth occurs via the release of the leakage flow toward the atmosphere, while, in the case of bottom labyrinth seals, the leakage flow mixes with the flow in the draft tube. In an incompressible flow, the flow from the labyrinth is dependent on the number of teeth with cavities and the pressure difference across the inlet and the outlet of labyrinths. Along with these primary components, the geometry of the runner sidewall gaps also affects the flow field inside the labyrinths. In general, toward the runner crown and band side, the flow enters the labyrinth through an opening that can be a straight passage in the rotating and stationary sides. To minimize the losses due to the formation of corner vortices, a fillet is provided toward both crown and band geometries. In addition to this, the passage is also chamfered toward the crown side in the upper labyrinth seals. When the fluid enters the upper and bottom labyrinth regions shown in Figure 11 and Figure 12, the flow undergoes expansion and contraction. The fluid velocity increases in the contraction, and its kinetic energy dissipates to heat in the expansion area, thus lowering the pressure in each region.
There are two assumptions in the flow field inside the labyrinths that can be categorized based on the bottom and upper labyrinth seals. In the upper labyrinth seal, the flow field can be predicted as the flow enclosed between the stationary and rotating disks. This is one of the simplified models for predicting the flow inside the labyrinth and can mainly be applied to the upper labyrinth. In this study, there are only two stepped geometries toward the upper labyrinth, and the remaining regions can be assumed to be the closed disk regions. Flow in this region is affected by the rotor and stator components and may cause the instability of the boundary layer. More importantly, the flow is dependent on the Reynolds number. Since the flow in these machines has a high Reynolds number, it can be assumed that there is development of strong swirl and vortical flows in these regions and, as reported by Chitrakar et al. [27], the presence of strong swirls and vortices in hydraulic components is the main cause of erosion wear in Francis turbines operating with a high sediment load.
The second assumption for predicting the flow inside labyrinths that is well suited for modeling the flow in the bottom labyrinth is the Taylor–Couette Flow (see Figure 18), which is the flow between the annular gap of two rotating cylinders. In the case of a Francis turbine, flow between the rotor toward the runner side and the stator toward the guide vane is analogous to the Taylor–Couette Flow. Figure 19 depicts a typical fluid flow regime between the concentric cylinders where the cylinders are rotating at different angular velocities. The solution for this kind of flow, obtained by solving the Navier–Stokes equation in a cylindrical coordinate system, as presented in Figure 18, is
v ϕ = ω 2 R 2 2 ω 1 R 1 2 R 2 2 R 1 2 r + ( ω 1 ω 2 ) R 2 2 R 1 2 R 2 2 R 1 2 1 r
In the result above, the angular velocity of the outer cylinder (i.e., the stationary labyrinth) is zero (ω2 = 0); hence, the solution becomes unstable when ω1 is greater than critical speed ωc. In this case, the secondary flow is in the form of toroidal rolls. Since the flow inside the Francis turbine is turbulent, we may assume that the angular velocity of the runner has increased above the threshold where the Couette flow becomes unstable, consisting of secondary toroidal vortices, as shown in Figure 19b.
In addition to Taylor–Couette instability, other instabilities, such as Dean instability, can also be observed at different locations of the labyrinths. One of the regions where Dean instability could occur is the chamfered and fillet region in between the labyrinths and runner sidewall gaps. Figure 20 shows different regions in the upper labyrinth seal where secondary vortices occur, as inferred from this study. The secondary flow is developed toward the corner of the upper labyrinth geometry and is referred to as corner vortices. Likewise, toward the bend region, Dean vortices are developed. Similarly, flow recirculations may also occur before it escapes from the opening due to the mixing of secondary vortices in the corner with the main vortices. All these instabilities enhance the erosion effects in the upper labyrinth.
Figure 21 depicts the occurrence of secondary vortices in a closed chamber before leakage flow enters the bottom labyrinths. It can be seen that secondary flows are present in the passage, which then enters the bottom labyrinths. Though, in the simplified Couette flow at the beginning of this section, it is assumed that there is no axial component of the flow, and hence the magnitude of flow in the axial direction is zero, in the real case, while modeling the flow in the bottom labyrinths, both axial and radial flows occur, giving rise to the toroidal secondary flow. It can be generalized that this rotational flow significantly affects the labyrinth, eroding its surface mainly toward the corner. Moreover, since the bottom labyrinth itself is rotating at the axis of the rotation of the runner, the centrifugal forces act on the fluid sediment particles in a manner that is dependent on the distance from the axis of rotation. Since the rotating labyrinth is at a shorter distance compared to the stationary labyrinth, the sediment volume fraction toward the stationary side compared to the rotor side will be higher. Thus, there is higher erosion toward the stationary side than the rotating side (see Figure 11 and Figure 12).
The regions where significant flow changes occur are also affected more severely due to sediment erosion, and individual components of the turbine are affected by the erosion and abrasion of the turbine material due to sediment-laden complex flows. Erosion in the guide vane has a dominant effect in its clearance gap region, which also affects the flow and induces a leakage vortex. This leakage vortex hits the inlet geometry of the runner with high intensity and induces abrasive wear. In Figure 22, different erosion locations in the Francis turbine runner are presented with the corresponding prototype geometry of the runner. Abrasive wear at these locations is entirely due to the leakage vortex developed from the clearance gap of the GV, as exemplified by region 1 in the figure.
In region 2 in Figure 22, however, there is still significant erosion wear in the region despite there being no high-intensity pressure oscillations. This is due to the leakage of sediment-containing fluid in the sidewall clearance gaps and, thus, regions of erosive wear due to the fluid–solid interaction in the wall are observed. In regions 3 and 4, i.e., the labyrinth regions, erosion effects are predominant in the corners due to the presence of high-intensity secondary vortices. These secondary vortices can take the form of toroidal rolls or Dean secondary flow while the flow region is investigated.
The erosion at all these locations affects the overall performance of the turbine, and the gradual increase in the clearance gap region due to erosive and abrasive wear increases the leakage flow. Therefore, erosion and a reduction in efficiency are predicted to occur simultaneously. Likewise, gradual sediment-containing leakage flow from sidewall clearance regions also increases the width of this gap. This increase in leakage flow reduces the overall volume of fluid flow to be passed in the turbine and reduces the overall head and efficiency of the turbine [7,12,32]. In the labyrinth regions, the secondary vortices have a strong influence; hence, an increase in the width of the annular region in the labyrinth can be observed. Leakage flow from the labyrinth region, therefore, increases and also reduces the overall efficiency and head of the turbine because of the impact of sediment particles on the rotating and stationary wall of the labyrinths [21].

5. Conclusions

The nature of the fluid flow inside Francis turbine components significantly affects the performance of the turbine, particularly when sediment-containing flow occurs. This study examined several locations in a Francis turbine where the simultaneous effects of secondary flows and sediment erosion occur, and the following overall conclusions were drawn:
Clearance regions toward the guide vanes and runner sidewalls accelerate the sediment-containing fluid flow. Thus, these regions are highly affected due to the continuous effects of abrasive and erosive wear.
Toward the oblique regions of the runner crown and band side, erosion is due to both the leakage vortex propagating from guide vane clearance gaps and leakage from sidewall gaps.
In the labyrinth regions, the secondary vortical flows occur due to the formation of toroidal rolls, Dean vortices, corner vortices, and flow recirculation, accelerating the erosion wear.
The sizes of sidewall gaps and the labyrinth annular region increase gradually due to continuous abrasion and erosion. Thus, the leakage flow increases and the efficiency decreases.
Leakage flow from the bottom labyrinths mixes with the main flow in the draft tube, which changes the flow field in the draft tube regions and thus affects the overall performance of the turbine.

Author Contributions

Conceptualization, N.A.; methodology, N.A. and O.G.D.; software, N.A. and S.G.; validation, N.A. and I.I.; formal analysis, N.A.; investigation, N.A. and S.G.; resources, O.G.D. and S.C.; data curation, N.A., S.G. and I.I.; writing—original draft preparation, N.A.; writing—review and editing, N.A. and S.G.; visualization, N.A. and I.I.; supervision, O.G.D. and I.I.; project administration, O.G.D.; funding acquisition, O.G.D. All authors have read and agreed to the published version of the manuscript.

Funding

This work was conducted under the research project FME—HydroCen. This project (no. 90148312) was funded by the Norwegian Research Council and Norwegian Hydropower Industries.

Data Availability Statement

Data is contained within the article.

Acknowledgments

Authors would like to thank the personnel from the Turbine Testing Lab, KU and WaterPower Laboratory, NTNU, for their continuous help and support. Moreover, authors are also grateful with people from Bhilangana Hydropower Plant for providing the relevant data and pictures required to carry out this research work.

Conflicts of Interest

Authors declare no conflict of interest.

Nomenclature

List of symbols
CpNormalized pressure [-]
gAcceleration due to gravitym s−2
GCIfineGrid Convergence Index of fine mesh[-]
hSize of gridm
HHeadm
NsSpecific speedrpm
pApparent order for grid sensitivity study[-]
p ˜ Fluctuating pressurePa
p ¯ Mean pressurePa
QFlow ratem3 s−1
QedDischarge factor[-]
rGrid refinement factor [-]
y+Dimensionless wall space[-]
Greek Symbols
ωAngular velocity rad-s−1
δUncertainty in measurement%
ϕ Variable for GCI calculation[-]
ρDensity kg-m−3
τ Torque kN-m
η Efficiency%
Indices
1, 2Position indication: fine and medium mesh indication
cCritical value
List of Abbreviations
BEPBest Efficiency Point
CFDComputational fluid dynamics
GCIGrid Convergence Index
GVGuide vane
GV-CLGuide vane clearance
HPPHydropower Plant
IECInternational Electro-Technical Commission
LESLarge Eddy Simulation
MWMegawatt
NLSNo-Load Speed
RANSReynolds-Averaged Navier–Stokes
RPMRevolutions per Minute
RSIRotor–stator interaction
RVRunner vane
SASScale-Adaptive Simulation
SSTShear Stress Transport
3-DThree-dimensional

References

  1. IHA. Hydropower Status Report: Sector Trends and Insights; IHA: London, UK, 2018. [Google Scholar]
  2. Anup, K.C.; Thapa, B.; Lee, Y.H. Transient numerical analysis of rotor-stator interaction in a Francis turbine. Renew. Energy 2014, 65, 227–235. [Google Scholar] [CrossRef]
  3. Iliev, I.; Trivedi, C.; Dahlhaug, O.G. Variable-speed operation of Francis turbines: A review of the perspectives and challenges. Renew. Sustain. Energy Rev 2019, 103, 109–121. [Google Scholar] [CrossRef]
  4. Thapa, B.S.; Dahlhaug, O.G.; Thapa, B. Sediment erosion in hydro turbines and its effect on the flow around guide vanes of Francis turbine. Renew. Sustain. Energy Rev. 2015, 49, 1100–1113. [Google Scholar] [CrossRef]
  5. Gautam, S.; Neopane, H.P.; Acharya, N.; Chitrakar, S.; Thapa, B.S.; Zhu, B. Sediment erosion in low specific speed francis turbines: A case study on effects and causes. Wear 2020, 442, 203152. [Google Scholar] [CrossRef]
  6. Chitrakar, S.; Neopane, H.P.; Dahlhaug, O.G. Study of the simultaneous effects of secondary flow and sediment erosion in Francis turbines. Renew. Energy 2016, 97, 881–891. [Google Scholar] [CrossRef]
  7. Schiffer, J.; Benigni, H.; Jaberg, H. Analysis of the leakage behavior of Francis turbines and its impact on the hydraulic efficiency—A validation of an analytical model based on computational fluid dynamics results. J. Fluids Eng. Trans. ASME 2017, 139, 021106. [Google Scholar] [CrossRef]
  8. Standard No. IEC 60193: 1999-11; Hydraulic Turbines, Storage Pumps and Pump-Turbines—Model Acceptance Tests. IEC: Geneva, Switzerland, 1999.
  9. Iliev, I.; Trivedi, C.; Dahlhaug, O.G. Simplified hydrodynamic analysis on the general shape of the hill charts of Francis turbines using shroud-streamline modeling. J. Phys. Conf. Ser. 2018, 1042, 012003. [Google Scholar] [CrossRef]
  10. Zemanová, L.; Rudolf, P. Flow inside the sidewall gaps of hydraulic machines: A review. Energies 2020, 13, 6617. [Google Scholar] [CrossRef]
  11. Ayad, A.F.; Abdalla, H.M.; El-Azm, A.A. Study of the effect of impeller side clearance on the centrifugal pump performance using CFD. In Proceedings of the ASME International Mechanical Engineering Congress and Exposition. American Society of Mechanical Engineers, Houston, TX, USA, 13–19 November 2015; Volume 7A, pp. 1–10. [Google Scholar] [CrossRef]
  12. Schiffer, J.; Benigni, H.; Jaberg, H.; Schneidhofer, T. Numerical simulation of the flow in a Francis turbine including the runner seals on crown and band side. In Proceedings of the HYDRD International Conference and Exhibition, National Harbor, MD, USA, 16–19 March 2015; pp. 3–10. [Google Scholar]
  13. Zhao, W. Investigation of Seal Technology for Francis Turbine; Norwegian University of Science and Technology: Trondheim, Norway, 2012. [Google Scholar]
  14. Yonezawa, K.; Watamura, T. Experimental and Numerical Investigations of Erosion on Runner Seal of a Francis Turbine. IOP Conf. Ser. Earth Environ. Sci. 2021, 774, 012034. [Google Scholar] [CrossRef]
  15. Hou, X.; Cheng, Y.; Yang, Z.; Liu, K.; Zhang, X.; Liu, D. Influence of clearance flow on dynamic hydraulic forces of pump-turbine during runaway transient process. Energies 2021, 14, 2830. [Google Scholar] [CrossRef]
  16. Koirala, R.; Thapa, B.; Neopane, H.P.; Zhu, B.; Chhetry, B. Sediment erosion in guide vanes of Francis turbine: A case study of Kaligandaki Hydropower Plant, Nepal. Wear 2016, 362–363, 53–60. [Google Scholar] [CrossRef]
  17. Acharya, N.; Gautam, S.; Chitrakar, S.; Trivedi, C.; Dahlhaug, O.G. Leakage Vortex Progression through a Guide Vane’s Clearance Gap and the Resulting Pressure Fluctuation in a Francis Turbine. Energies 2021, 14, 4244. [Google Scholar] [CrossRef]
  18. Acharya, N.; Trivedi, C.; Wahl, N.M.; Gautam, S.; Chitrakar, S.; Dahlhaug, O.G. Numerical study of sediment erosion in guide vanes of a high head Francis turbine. J. Phys. Conf. Ser. 2019, 1266, 012004. [Google Scholar] [CrossRef]
  19. Koirala, R.; Zhu, B.; Neopane, H.P. Effect of guide vane clearance gap on Francis turbine performance. Energies 2016, 9, 275. [Google Scholar] [CrossRef]
  20. Gautam, S.; Neopane, H.P.; Thapa, B.S.; Chitrakar, S.; Zhu, B. Numerical investigation of the effects of leakage flow from guide vanes of francis turbines using alternative clearance gap method. J. Appl. Fluid Mech. 2020, 13, 1407–1419. [Google Scholar] [CrossRef]
  21. Mack, R.; Drtina, P.; Lang, E. Numerical prediction of erosion on guide vanes and in labyrinth seals in hydraulic turbines. Wear 1999, 233–235, 685–691. [Google Scholar] [CrossRef]
  22. Song, X.; Zhou, X.; Song, H.; Deng, J.; Wang, Z. Study on the effect of the guide vane opening on the band clearance sediment erosion in a Francis turbine. J. Mar. Sci. Eng. 2022, 10, 1396. [Google Scholar] [CrossRef]
  23. Guo, X.; Yang, M.; Li, F.; Zhu, Z.; Cui, B. Investigation on cryogenic cavitation characteristics of an inducer considering thermodynamic effects. Energies 2024, 17, 3627. [Google Scholar] [CrossRef]
  24. Brekke, H. A review on oscillatory problems in Francis turbines. In New Trends in Technologies: Devices, Computer, Communication and Industrial Systems; Sciyo: Rijeka, Croatia, 2010; p. 217e232. [Google Scholar]
  25. Chitrakar, S.; Thapa, B.S.; Dahlhaug, O.G.; Neopane, H.P. Numerical and experimental study of the leakage flow in guide vanes with different hydrofoils. J. Comput. Des. Eng. 2017, 4, 218–230. [Google Scholar] [CrossRef]
  26. Brekke, H. Design of Hydraulic Machinery Working in Sand Laden Water. In Abrasive Erosion and Corrosion of Hydraulic Machinery; Imperial College Press: London, UK, 2002; pp. 155–181. [Google Scholar]
  27. Chitrakar, S.; Dahlhaug, O.G.; Neopane, H.P. Numerical investigation of the effect of leakage flow through erosion-induced clearance gaps of guide vanes on the performance of francis turbines. Eng. Appl. Comput. Fluid Mech. 2018, 12, 662–678. [Google Scholar] [CrossRef]
  28. Yan, J.; Zuo, Z.; Guo, W.; Hou, H.; Zhou, X.; Chen, H. Influences of wear-ring clearance leakage on performance of a small-scale pump-turbine. Proc. Inst. Mech. Eng. Part A J. Power Energy 2020, 234, 454–469. [Google Scholar] [CrossRef]
  29. Schröder, T.R.; Dohmen, H.J.; Brillert, D.; Benra, F.K. Impact of leakage inlet swirl angle in a rotor-stator cavity on flow pattern, radial pressure distribution and frictional torque in a wide circumferential reynolds number range. Int. J. Turbomach. Propuls. Power 2020, 5, 7. [Google Scholar] [CrossRef]
  30. Hu, B.; Brillert, D.; Dohmen, H.J.; Benra, F.K. Investigation on the flow in a rotor-stator cavity with centripetal through-flow. Int. J. Turbomach. Propuls. Power 2017, 2, 18. [Google Scholar] [CrossRef]
  31. Trivedi, C. Time-dependent inception of vortex rings in a Francis turbine during load variation: Large eddy simulation and experimental validation. J. Hydraul. Res. 2020, 58, 790–806. [Google Scholar] [CrossRef]
  32. Trivedi, C. Compressible large eddy simulation of a Francis turbine during speed-no-load: Rotor stator interaction and inception of a vortical flow. J. Eng. Gas Turbines Power 2018, 140, 112601. [Google Scholar] [CrossRef]
  33. Trivedi, C.; Cervantes, M.J.; Dahlhaug, O.G. Numerical Techniques Applied to Hydraulic Turbines: A Perspective Review. Appl. Mech. Rev. 2016, 68, 010802. [Google Scholar] [CrossRef]
  34. Menter, F.R.; Kuntz, M.; Langtry, R. Ten Years of Industrial Experience with the SST Turbulence Model. Turbul. Heat Mass Transf. 2003, 4, 625–632. [Google Scholar]
  35. Celik, I.B.; Ghia, U.; Roache, P.J.; Freitas, C.J.; Coleman, H.; Raad, P.E. Procedure for estimation and reporting of uncertainty due to discretization in CFD applications. J. Fluids Eng. Trans. ASME 2008, 130, 0780011–0780014. [Google Scholar] [CrossRef]
  36. Trivedi, C. A systematic validation of a Francis turbine under design and off-design loads. J. Verif. Valid. Uncertain. Quantif. 2019, 4, 011003. [Google Scholar] [CrossRef]
  37. Trivedi, C.; Cervantes, M.J. State of the art in numerical simulation of high head Francis turbines. Renew. Energy Environ. Sustain. 2016, 1, 20. [Google Scholar] [CrossRef]
  38. KC, A.; Lee, Y.H.; Thapa, B. CFD study on prediction of vortex shedding in draft tube of Francis turbine and vortex control techniques. Renew. Energy 2016, 86, 1406–1421. [Google Scholar] [CrossRef]
  39. Acharya, N. Erosion in Francis Turbines Due to Geometrical Positioning of Runner and Guide Vanes. Ph.D. Thesis, Norwegian University of Science and Technology, Trondheim, Norway, 2022. [Google Scholar]
  40. Guyon, E.; Hulin, J.-P.; Petit, L.; Mitescu, C.D. Taylor–Couette instability. In Physical Hydrodynamics, 2nd ed.; Oxford University Press: Oxford, UK, 2001; pp. 126–127. [Google Scholar]
Figure 1. Erosion due to secondary flows at the clearance gap of GVs: (a) toward the bottom facing plate, (b) toward the upper facing plate, and (c) eroded GV toward the bottom end.
Energies 17 05961 g001
Figure 2. Erosion at different locations of runner inlet: locations 1–2 refer to the region affected by the leakage flow from guide vane clearance gaps, and locations 3–4 are regions affected by leakage flow from sidewall clearance gaps.
Energies 17 05961 g002
Figure 3. Erosion at bottom labyrinths: (a) toward rotating side and (b) toward stationary side.
Energies 17 05961 g003
Figure 4. Erosion at upper labyrinth: (a) toward rotating side and (b) toward stationary side.
Energies 17 05961 g004
Figure 5. Cross-section of the reference case with a detailed view of the regions in the upper and bottom labyrinths.
Energies 17 05961 g005
Figure 6. Mesh used for numerical study.
Energies 17 05961 g006
Figure 7. Computational domain.
Energies 17 05961 g007
Figure 8. Points inside the domain for GCI calculation.
Energies 17 05961 g008
Figure 9. Velocity inside bottom labyrinth with extrapolated values (a) and discretization error bars (b).
Energies 17 05961 g009
Figure 10. Validation of numerical solution with field measurement.
Energies 17 05961 g010
Figure 11. Flow field and corresponding sediment-averaged volume fraction in upper labyrinth at BEP.
Energies 17 05961 g011
Figure 12. (a) Flow field and (b) corresponding sediment-averaged volume fraction in bottom labyrinth at BEP.
Energies 17 05961 g012
Figure 13. Non-dimensional pressure (Cp [-]) inside the mid-span of rotating labyrinths: (a) upper labyrinth and (b) bottom labyrinth.
Energies 17 05961 g013
Figure 14. Change in sediment erosion rate in rotating and stationary parts with respect to guide vane opening.
Energies 17 05961 g014
Figure 15. Flow field inside draft tube.
Energies 17 05961 g015
Figure 16. Vortical flow inside draft tube at different locations.
Energies 17 05961 g016
Figure 17. Fluid flow between sidewall clearance gaps between rotary and stationary bodies [39].
Energies 17 05961 g017
Figure 18. Couette flow between rotating and stationary labyrinths (seen from the axial plane).
Energies 17 05961 g018
Figure 19. Taylor–Couette flow: (a) just above the threshold angular velocity, (b) further above the angular speed, and (c) rolls appearing in the Taylor–Couette instability [40].
Energies 17 05961 g019
Figure 20. Regions of different kinds of vortices occurring in upper labyrinths.
Energies 17 05961 g020
Figure 21. Regions of different kinds of vortices occurring in bottom labyrinths.
Energies 17 05961 g021
Figure 22. Erosive wear in the real geometry of a Francis turbine runner (major erosion locations are highlighted in the picture): (1) erosion at the leading-edge geometry of runner due to leakage vortex from clearance gap, (2) erosion at oblique location of runner due to leakage from sidewall clearance, (3) erosion at the upper labyrinth region, and (4) erosion at the bottom labyrinth.
Energies 17 05961 g022
Table 1. Physics set-up and solution parameters used in the numerical simulations.
ParametersDescription
Boundary conditionInlet: mass flow rate for runner rotational speed of 750 rpm
Outlet: 0 Pa relative pressure
Wall: no slip
Turbulence intensity 5% at the inlet
Fluid typeIncompressible, Newtonian fluid with density 1000 kg/m3
Analysis type Steady state
Transient state: initialization from steady-state solution, time step size 1 deg runner rotation, total time 0.4 s
Turbulence modelSST
Discretization and solution controlHigh-resolution advection scheme
Second-order backward Euler transient scheme
Convergence criteriaSingle precision, 1 × 10⁻⁴
Transient solution: inner loop iterations 1–10
Table 2. Physics setting for sediment.
ParametersDescription
Fluid flow with quartzHomogenous, incompressible
Sediment flowParticle transport fluid
Sediment propertiesSize: 150 µm; shape factor: 0.7; and concentration: 5000
Mass flow rate0.07 kg/s normal to the inlet
Turbulence dissipation forceSchiller–Naumann
Erosion modelTabakoff erosion model
Table 3. Constants used for Tabakoff and Grant erosion model.
VariableCoefficientValueDimension
k 12 k 12 3.52[-]
Velocity V 1 2375.14ms−1
V 2 153.17ms−1
V 3 19.16ms−1
Angle of maximum erosion γ 0 45(deg)
Table 4. Discretization error for numerical study.
Measurement Parameters (ɸ)CoarseMediumFine Extrapolated   Parameters   ( ϕ e x t 21 ) Approximate   Error   ( e a 21 ) G C I f i n e 21 (%)
Pressure at Point 1 (kPa)4634.024562.844566.344566.50.000760.004
Pressure at Point 2 (kPa)5002.65561.35512.15508.10.00890.0902
Pressure at Point 3 (kPa)4886.35119.65038.84999.50.01600.9747
Torque (kNm)120.1125.7126.2126.230.00480.0595
Efficiency (%)90.1293.4093.4693.460.000640.0011
Erosion Rate (kg/m2/s) (×10−7)3.411.011.281.310.21512.98
Disclaimer/Publisher’s Note: The statements, opinions and data contained in all publications are solely those of the individual author(s) and contributor(s) and not of MDPI and/or the editor(s). MDPI and/or the editor(s) disclaim responsibility for any injury to people or property resulting from any ideas, methods, instructions or products referred to in the content.

