Article

Factors Influencing Differences Between Computed and Measured Ground Resistance Values for Horizontal Tape Electrodes

Faculty of Engineering, Multimedia University, Persiaran Multimedia, Cyberjaya 63100, Malaysia
*
Author to whom correspondence should be addressed.
Energies 2024, 17(23), 5845; https://doi.org/10.3390/en17235845
Submission received: 7 October 2024 / Revised: 5 November 2024 / Accepted: 20 November 2024 / Published: 22 November 2024
(This article belongs to the Section F: Electrical Engineering)

Abstract

:
This paper investigates the steady-state resistance (RDC) of copper tape electrodes across eight configurations. The study evaluates both field measurements and simulations using CDEGS at two distinct sites with varying soil characteristics. It emphasizes the impact of electrode size, installation sequence, and soil disturbance caused by sequential installations. Specifically, the results reveal that the first configuration, which maintained a 100% tape-to-trench ratio with no disturbance, yielded computed values within the measured range at both sites. Subsequent configurations demonstrated varying degrees of soil disturbance, affecting RDC values, particularly in high-resistivity conditions. At the low-resistivity Site 1, as the tape-to-trench ratio increased, discrepancies between measured and computed RDC values decreased, highlighting a strong dependency on electrode size and soil cohesion after backfilling. In contrast, at the high-resistivity Site 2, RDC values remained relatively stable with increasing tape-to-trench ratio, likely due to lower soil cohesion and higher air void presence. These findings underscore the importance of considering soil disturbance effects in computational models to enhance the accuracy of RDC predictions and optimize grounding performance.

1. Introduction

Grounding systems are a fundamental component of electrical networks, providing a safe path for the dissipation of fault currents and stabilizing voltage during normal operation [1,2,3]. Besides the site’s soil resistivity, the configuration and size of these systems significantly impact two crucial parameters: resistance and ground potential rise (GPR) [4]. Commonly used configurations include vertical rods and horizontal tape electrodes, each with specific benefits and limitations. Vertical rods are suitable for installations with limited space and penetrate deeper soil layers, often with lower resistivity, making them effective in urban areas or where low-resistivity subsoils are available. However, they may be less effective in shallow, high-resistivity soils. In contrast, horizontal tape electrodes distribute current over a larger area, potentially lowering resistance and GPR, especially in high-resistivity soil conditions [5,6,7].
Horizontal tape electrodes are often combined with vertical rods in grounding grids to optimize current dissipation and reduce surge impedance [5,6,7,8,9,10]. Although this combination is effective in many settings, standalone horizontal tape electrodes are used in high-resistivity, rocky, or shallow soils where vertical rods face limitations. Nevertheless, specific research focusing on the performance and optimization of standalone horizontal tape electrodes remains limited, particularly regarding sensitivity to soil disturbance and installation practices.
Several studies have examined the impact of electrode size and configuration on grounding resistance. Increasing the length, thickness, and number of electrodes reduces overall resistance by providing a larger surface area for current dissipation [8]. Proper electrode spacing is also essential, as closely spaced electrodes can increase local GPR due to mutual coupling effects. In practical applications, electrodes, including tape electrodes, are generally buried at a depth of 30 cm, as recommended by grounding standards such as IEEE Standard 80 [11], IEC 62305-3 [12], and BS 7430 [13]. This depth balances effective grounding with ease of installation, providing a practical solution in standard soil conditions.
Further research has highlighted the benefits of combining horizontal electrodes with vertical rods, enhancing current dissipation, lowering surge impedance, and improving RDC values [5,6,7,8,9]. For example, Mousa et al. [8] found that grounding grids incorporating vertical rods perform significantly better in terms of current dissipation compared to grids without them. Studies by [5,6] demonstrated substantial RDC improvements when vertical rods were paired with cross- or star-shaped horizontal electrodes. Clark et al. [7] similarly noted enhanced performance with star-shaped horizontal electrodes. Although grid electrodes with vertical rods enhance current distribution, increase current dissipation, and lower surge impedance [8], many studies [9,10] reveal that in highly resistive subsoils, grids without corner rods are more effective, providing safety during fault conditions. Nevertheless, fewer studies focus on the unique characteristics of horizontal tape electrodes, including the impacts of soil compaction and disturbance.
The RDC value can be obtained through several approaches, such as field measurement, lab experiments, calculations through formulas, and computer simulations [7,14,15,16,17,18,19,20,21]. However, discrepancies often arise between measured and computed RDC values. For instance, inconsistencies between measured and computed values were identified in [22], attributed to the heterogeneous nature of soil, with immediate soil properties around the electrode having a more significant impact than the overall soil mass resistivity. Additionally, ref. [23] demonstrated that soil compaction during electrode installation affects measured resistance, suggesting a need for further study on the influence of soil conditions on horizontal configurations.
This study addresses these gaps by evaluating the steady-state resistance (RDC) of eight copper tape ground electrode configurations through field measurements and computational analysis using the Current Distribution, Electromagnetic Fields, Grounding, and Soil Structure Analysis (CDEGS) software version 18 [24]. By comparing empirical data with simulation results, we aim to identify key factors affecting the horizontal tape electrodes, particularly in high-resistivity and disturbed soils, thereby informing better grounding design practices.
This paper is structured as follows: Section 2 covers the materials and methods, including soil resistivity measurement, grounding system configurations, and resistance measurement techniques. Section 3 presents the results, focusing on soil profile, RDC across configurations, and the effects of electrode size and soil disturbance. Finally, Section 4 concludes with findings and recommendations for future research.

2. Materials and Methods

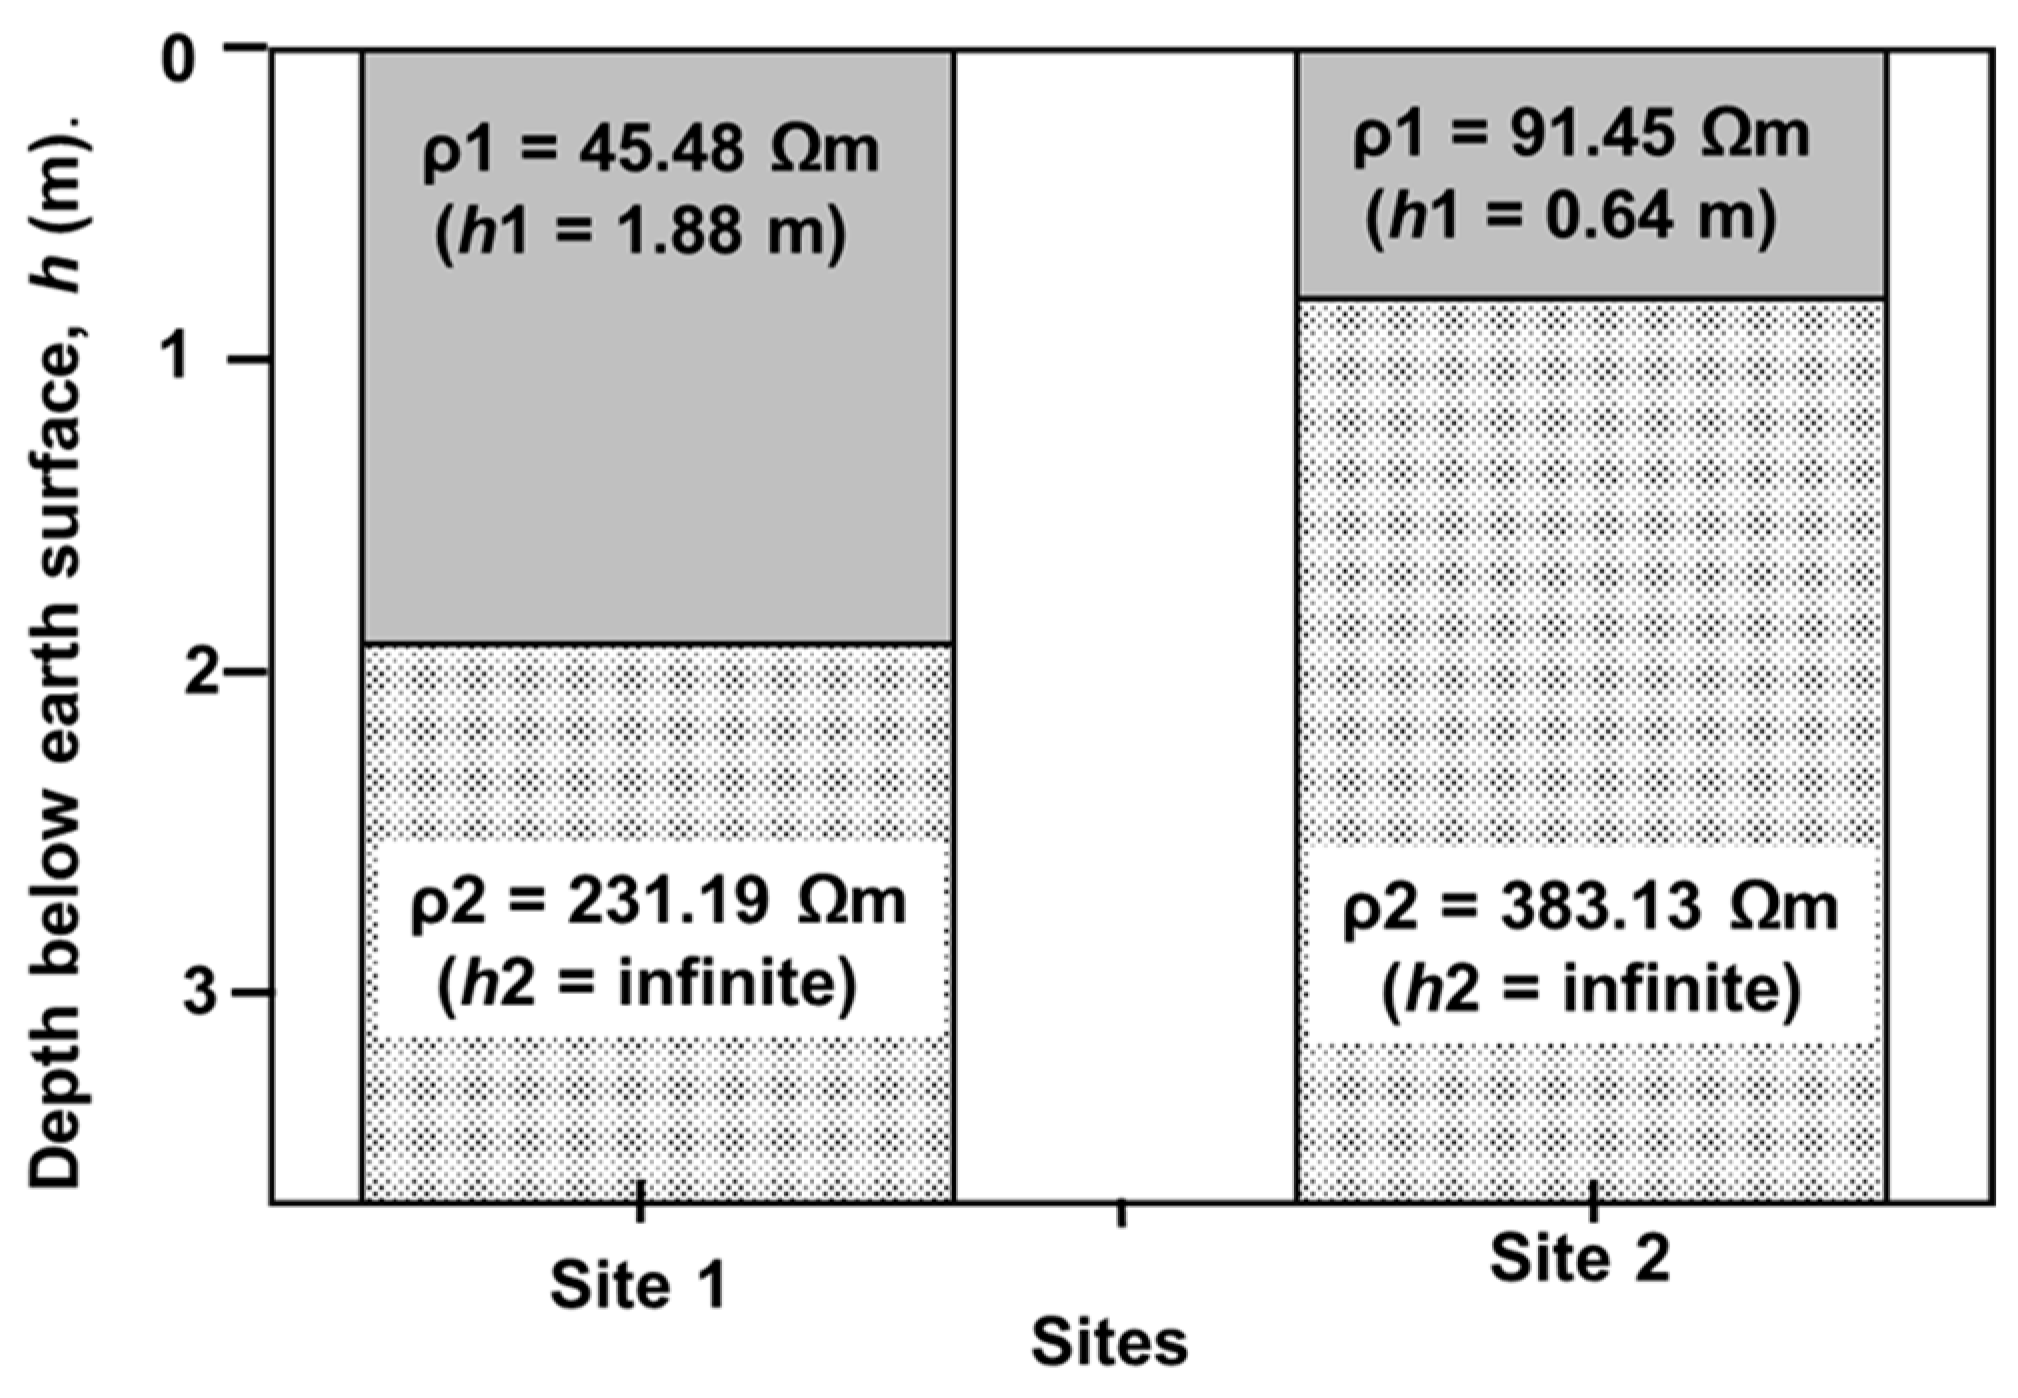
2.1. Soil Resistivity Measurement

Two different sites (Site 1 and Site 2) in the university’s campus were chosen, each with distinct soil resistivity characteristics. The Wenner 4-point method [13,25] was used to determine the soil resistivity at the two selected sites. Figure 1 shows multiple traverses used at each site to collect sufficient soil resistivity data. The apparent soil resistivity data were then entered into the RESAP module of the CDEGS software [24] for soil profiling.

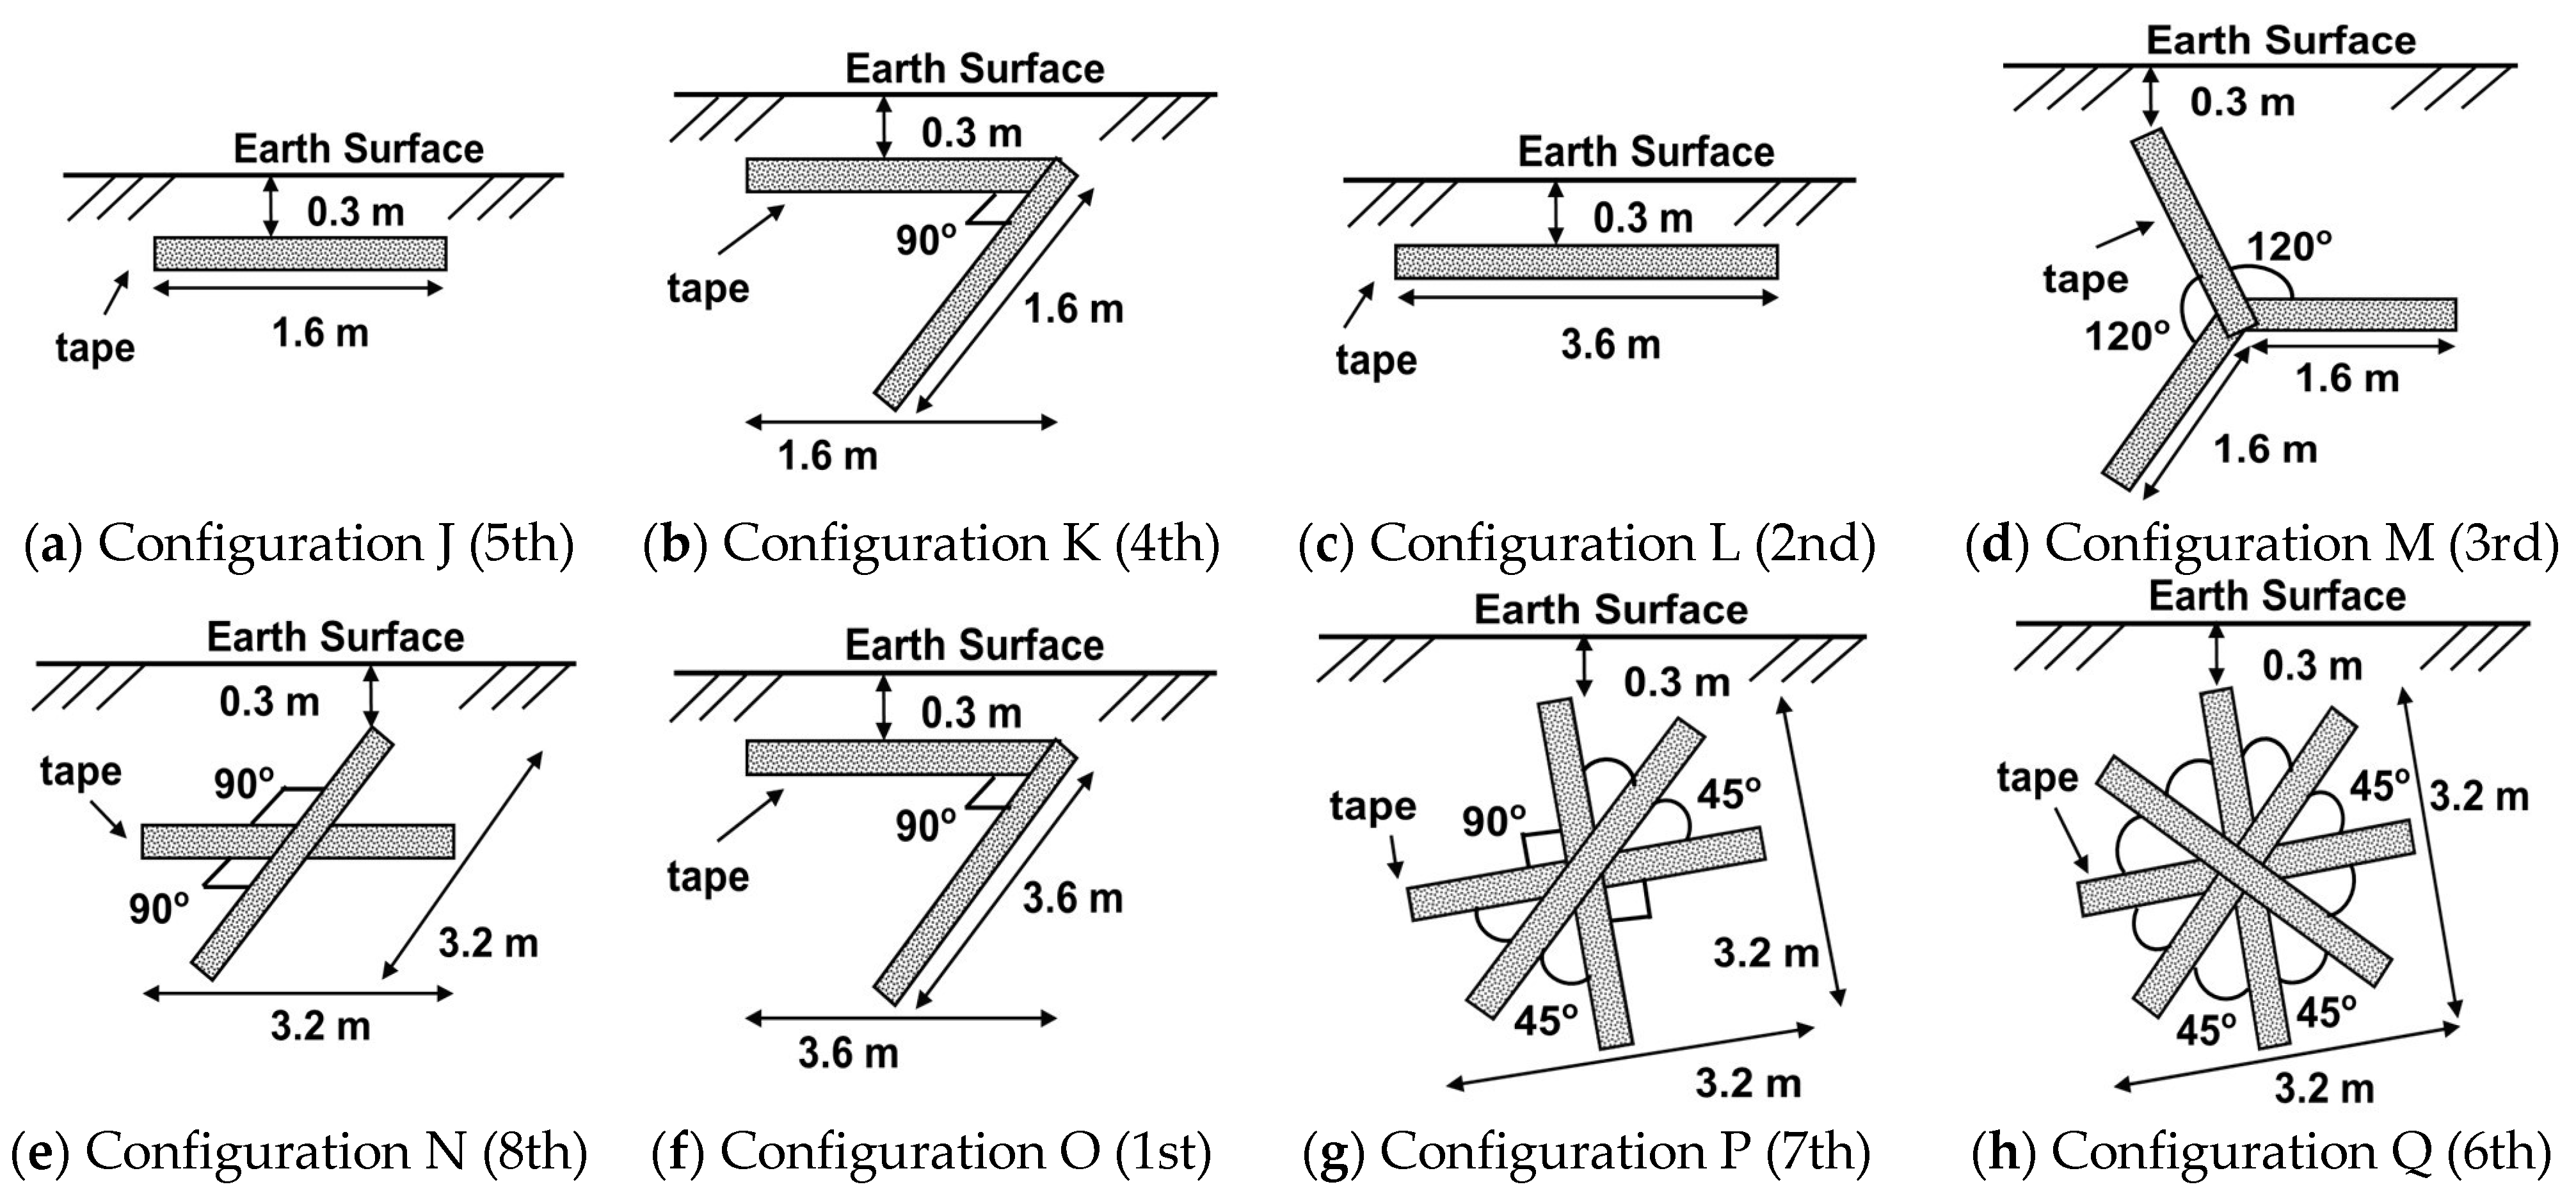
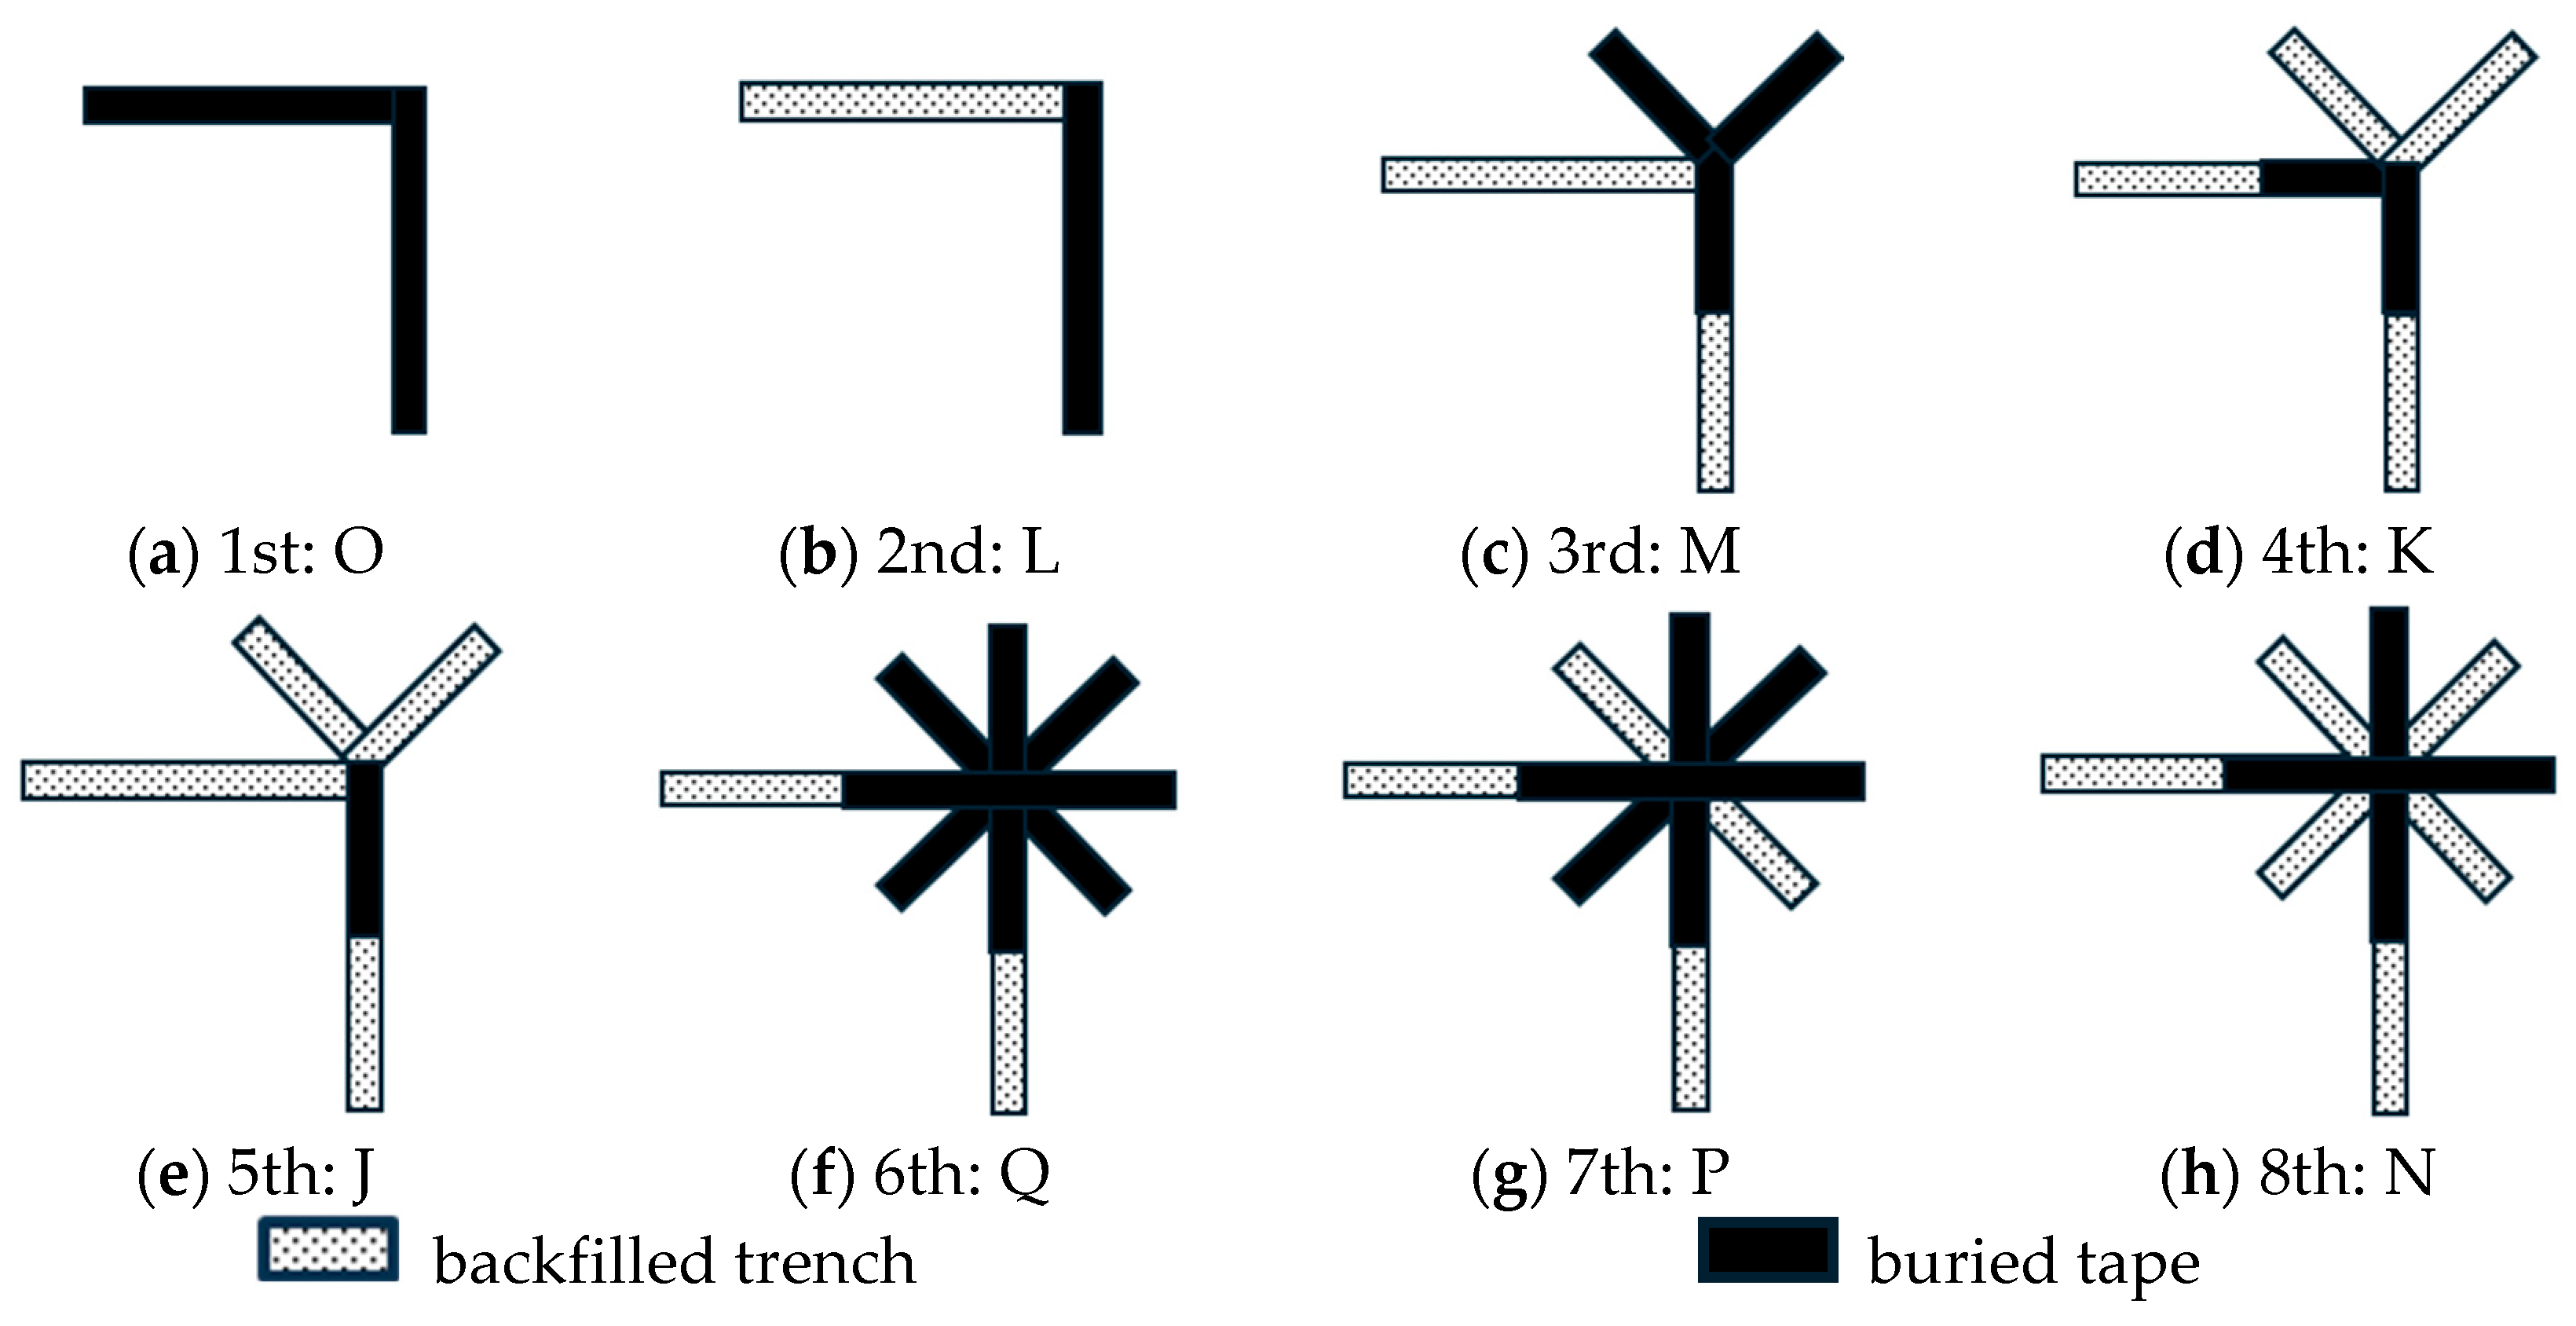
2.2. Grounding System Configurations

A total of eight ground electrode configurations, using only copper tape electrodes, were adopted in this study. As shown in Figure 2, all grounding systems were installed to a depth of 0.3 m below the earth surface, and the excavated soil was used as backfill in the trench to maintain consistent soil properties. The copper tapes used in configurations J to Q have the same cross-sectional dimensions of 25 mm by 3 mm. These configurations can be further categorized into horizontal (J and L), L-shape (K and O), and star (M, N, P, and Q) configurations. The configurations are labeled in alphabetical order, J to Q, based on increasing size (i.e., total area), as shown in Table 1.
During the field test installations, a specific sequence was followed, commencing with O, followed by L, M, K, J, Q, P, and N, as illustrated in Figure 3. This sequence was designed to progressively introduce soil disturbances within the critical resistance area of each ground electrode. This approach allowed us to study the impact of soil disturbance on resistance values, offering insights into how installation practices might influence grounding performance. Installation began by digging a 30 cm deep trench that followed the L-shape of configuration O, as shown in Figure 2f. After installing the tape electrodes, the trench was backfilled with the excavated soil and compacted before measurements were taken. This process was repeated for each configuration. The same trench was reused when possible (e.g., configuration L used the trench from configuration O). However, additional trenches were made when required, such as two and three new trenches required for configurations M and Q, respectively.

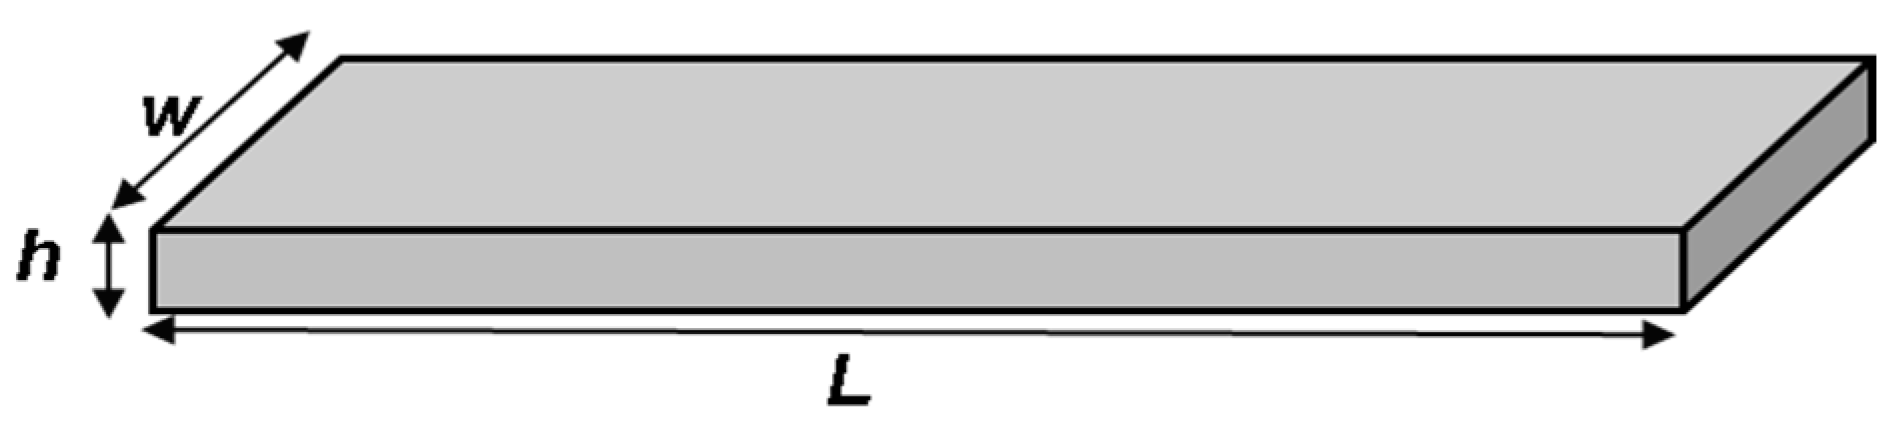
2.3. Grounding System Size

The size of the tape ground electrode is calculated based on the total surface area that will be in contact with the soil. The surface area of the tape electrode, A can be calculated by applying (1), i.e.,
A = 2(wh + wL + hL),
where w, h, and L are the width, height, and length of the copper tape, respectively, as illustrated in Figure 4. The calculated surface areas for the tape electrode configurations J to Q are provided in Table 1.

2.4. Field Measurement

The Fall-of-Potential (FOP) method [13,25] was used with the Fluke 1623-2 earth tester to determine the RDC value for each of the ground electrode configurations shown in Figure 2. All measured RDC values include error margins calculated based on the ±5% tolerance of the earth tester.

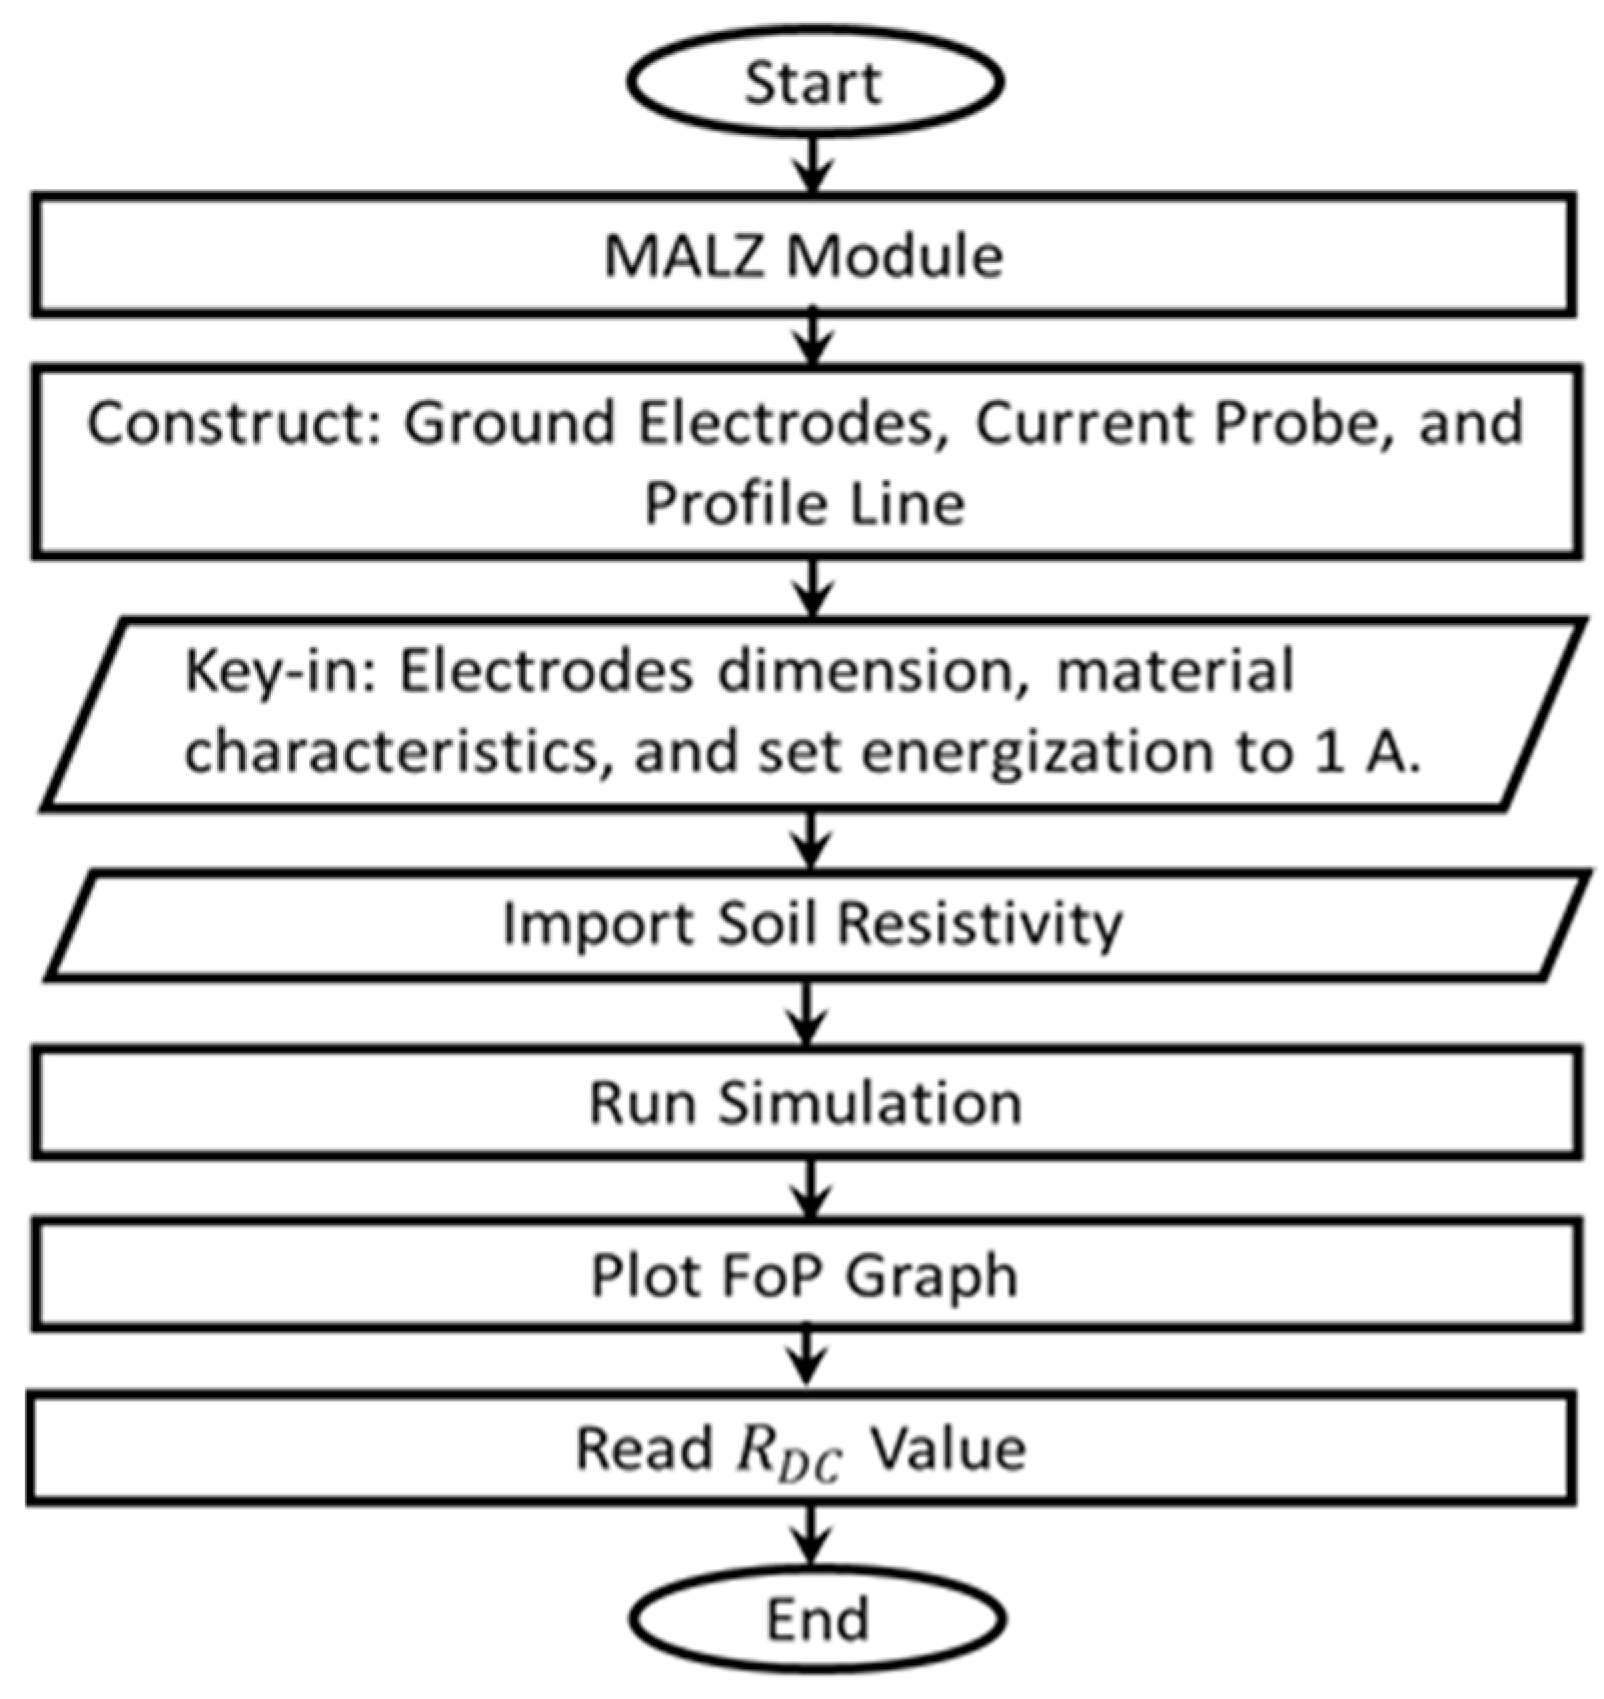
2.5. Computational Method

The MALZ module in CDEGS [24] is used to compute the RDC values for all configurations at both sites. Using MALZ, this study focuses exclusively on the grounding system under investigation, with no nearby grounding systems. The flow is depicted in Figure 5.

3. Results

3.1. Soil Resistivity

As shown in Table 2, the soil resistivity at both sites assumes a two-layer soil interpretation. This assumption aligns with IEEE Standard 80 [11], which suggests that this model closely approximates many soil structures. The thickness of the soil layers is represented by h1 and h2, where h1 denotes the height of the top layer and h2 indicates that the bottom layer extends to infinity, as illustrated in Figure 6. It can be seen that for both sites, the resistivity of the bottom layer (ρ2) is higher than the upper layer (ρ1). Additionally, the soil resistivity for Site 2 is considerably higher than that of Site 1, which can be seen from both upper and bottom layers.

3.2. Grounding Resistance (RDC)

Table 3 shows the measured and computed RDC values, along with the percentage difference (using midpoint of the measured RDC range) between the values for all grounding system configurations considered. The computed values fall outside the measured range, except for one configuration at each site; configurations L and O at sites 1 and 2, respectively. For the horizontal and L-shape configurations (i.e., J, K, L, and O), as expected, it can be observed that the RDC reduces as the area increases. Although the lengths of the tapes in configurations J and K are both extended by 2.25 times into configurations L and O, respectively, a significantly higher percentage reduction in the measured RDC is observed for horizontal electrodes (i.e., from J to L, 68% and 54.2% at Sites 1 and 2, respectively) and L-shape configurations (i.e., from K to O, 64% and 59.8% at Sites 1 and 2, respectively), compared to the respective CDEGS computed values (i.e., 39% and 36.7% from J to L at Sites 1 and 2, and 38% and 36.4% from K to O at Sites 1 and 2, respectively).
Similarly to the horizontal and L-shape configurations, the RDC for the star configurations M, N, P, and Q at both sites also reduces as the grounding system size increases, but at a lower rate. This could be due to the RDC value of configuration M already being in the low range, resulting in not much reduction as the surface area is further increased, approaching the effective area of the ground electrodes. The total area for configurations P and Q is twice larger than the total area of configurations M and N, respectively. Here, the effective area of the ground electrode is defined as the area that results in the same RDC, such that adding more electrodes does not change the RDC.
At Site 1, the reduction in RDC is more pronounced from M to P compared to the decrease from N to Q for both measured (i.e., from M to P: 25.76% and from N to Q: 24.14%) and computed values (i.e., from M to P: 17.54% and from N to Q: 14.54%). This is expected, as configurations M and P have a smaller total area than the pairs N and Q, hence a high RDC. As seen in [20,21,22], ground electrodes with high RDC have a more pronounced reduction with increasing rod/cross-sectional areas. Furthermore, the configuration has not yet reached the effective area for steady-state performance. A similar trend is observed for the computed values at Site 2 (i.e., M to P: 13.84%, and N to Q: 10.87%). However, for the measured values at Site 2, the reduction is slightly different, where configuration with higher RDC exhibits a lower percentage reduction (i.e., M to P: 14.76%, and N to Q: 16.22%).
It is also seen from Table 3 that the difference between the measured and computed RDC values at Site 2 remains consistent between 37% and 42% with increasing length, except for configurations L and O, with differences of 11% and 1.7%, respectively. Thus, we will further analyze the effects of the electrode size, the sequence of electrode installations, and the soil disturbance on the differences between measured and computed RDC.

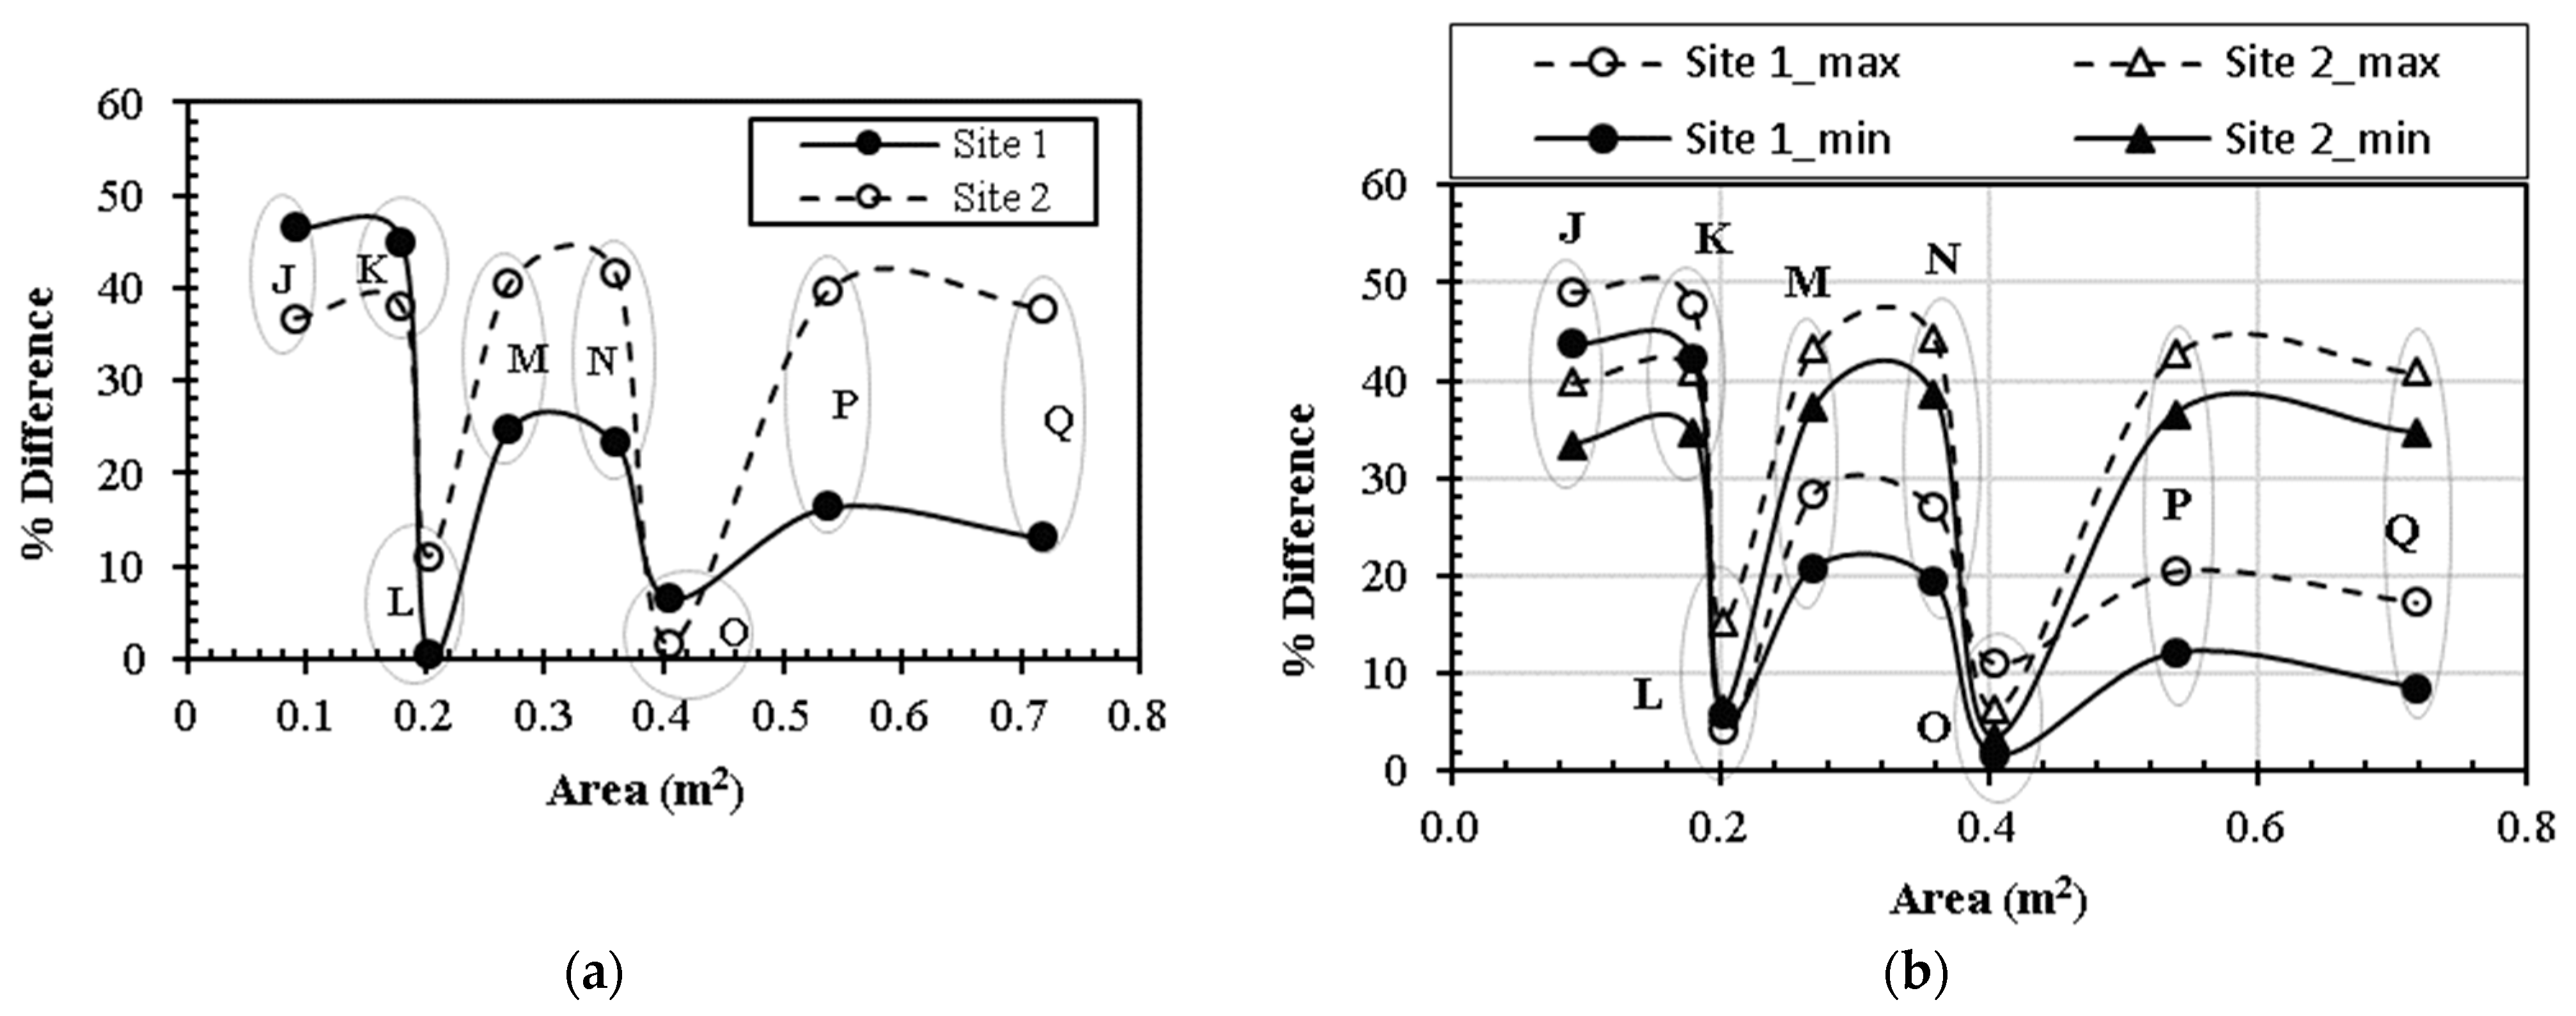
3.3. Effect of Ground Electrode Size

Figure 7a,b show the percentage difference between measured and computed RDC values against the area of the ground electrode, without (i.e., using midpoint of the measured RDC range) and with (i.e., using the min. and max. of the measured RDC range) consideration of the ±5% error tolerance, respectively.
In Figure 7a, at Site 1, configurations J and K exhibit high differences of 46.54% and 45.05%, respectively, despite their smaller electrode sizes than P and Q. Conversely, configuration L displays the lowest difference at 0.45%, followed by O, despite not having the largest size. Generally, at Site 1, the percentage difference partially decreases with the increasing size of the electrode. This decrease is particularly pronounced for configurations L and O compared to P and Q. This observation could be attributed to the many tape electrodes joined together in the star configurations, potentially leading to increased measured resistance, and could also be due to highly disturbed soil, as they are installed much later (i.e., sequence 6 and 7 for P and Q, respectively).
Similarly, at Site 2 (shown in Figure 7a), configurations L and O also have the lowest percentage difference. However, the percentage difference for the remaining configurations remains independent of the increasing size of the electrodes. The percentage difference at Site 1 shows a significant dependence on the size of the electrode, while the difference at Site 2 seems less dependent on the size of the electrode, except for configurations L and O. These observed patterns on both sites were also noted in [26], in which four to six ground rod configurations were compared at three distinct sites.
In Figure 7b, the difference between measured and computed resistance values shows a slight decrease across all configurations at both sites, except for configuration L at Site 1 and configuration O at Site 2, which show an increase when a −5% error tolerance is applied to the measured values. Conversely, with a +5% error tolerance, the difference between measured and computed resistance values increases across all configurations. Notably, even with the ±5% error tolerance, none of the configurations fall within this range, indicating that the percentage difference without the error tolerance (as shown in Figure 7a) is adequate for the analysis.
The percentage difference based on the size of the ground electrode shown in Figure 7 is not sufficient to draw a substantial conclusion. Therefore, the effect of soil disturbance on the measured RDC values due to the sequential installation of multiple ground electrode configurations at each site is investigated.

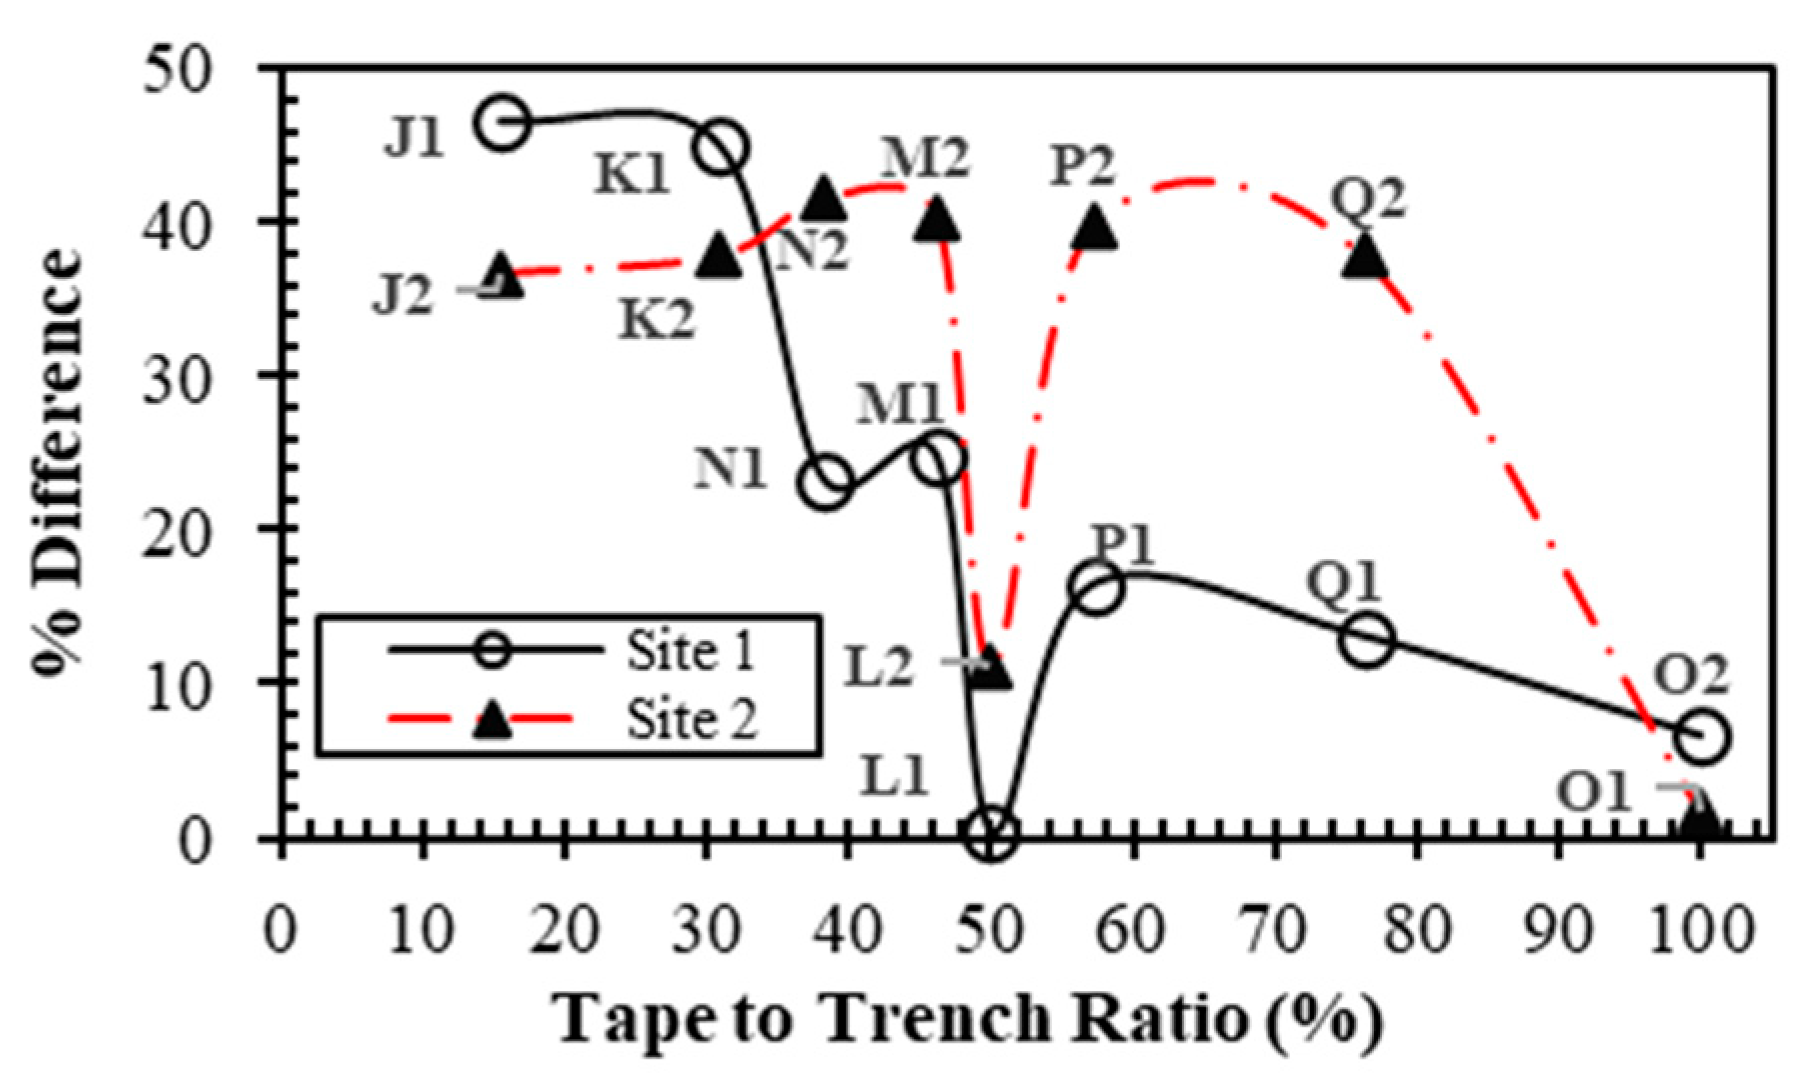
3.4. Effect of Soil Disturbance

As mentioned in Section 2.2, the tape ground electrodes were installed in one particular location of each site one after another in the following order: O, L, M, K, J, Q, P, and N. To gain a clear understanding of how the disturbed soil, specifically compacted backfilled trenches, may affect the measured resistance, a parameter called the tape-to-trench ratio was used. The tape-to-trench ratio refers to the ratio of the total length of the tape electrode under test to the total length of trenches within the vicinity of the installation area.
Since the first installation started with configuration O, its tape-to-trench ratio was calculated as 1, indicating that the entire dug trench was occupied by that L-shape tape electrode. For the second electrode, configuration L, the tape-to-trench ratio was 0.5, implying that only 50% of the total dug trench in the installation area was occupied by the electrode, while the remaining 50% of the trench was filled with backfilled soil. The tape-to-trench ratio for the rest of the tape configurations was calculated in the same manner. The values of the tape-to-trench ratio for all configurations and their corresponding percentage differences are presented in Table 4, with the plots as shown in Figure 8.
Figure 8 clearly shows that configurations J and K exhibit the highest percentage difference at Site 1, despite being the 5th and 4th configurations in the installation sequence, respectively. This observation could be attributed to their lower tape-to-trench ratio compared to others, indicating that the soil was more disturbed for these configurations relative to others. It can also be seen from the figure that the percentage difference decreased with increasing tape-to-trench ratio, except for the comparison between configurations N and M, where a slight increment in percentage difference was noted. Expectedly, configurations O and L with less disturbed soil due to being installed earlier have the lowest percentage difference compared to those installed later, i.e., in highly disturbed soil. The disturbed soil at Site 1 shows a significant dependency on the increase in electrode size compared to that at Site 2. This may be due to the fact that the soil resistivity at Site 1 is lower and the water content is higher compared to the soil at Site 2. This is because the total pore volume of the soil has sufficient water content, so even after backfilling the soil into the trench, it remains relatively compacted compared to dry soil, which may easily lose its cohesiveness. As a result, the backfilled trench will exhibit a stronger dependency on increases in the size of the ground electrode, as shown in Figure 8 (Site 1).
In contrast, at Site 2, once the soil is disturbed, it shows a weaker dependency on changes in the number of ground electrodes embedded in the trenches. This can be attributed to the soil’s lower cohesiveness and reduced shear strength compared to Site 1. Site 2 is significantly drier, leading to a greater presence of air voids and a loss of soil compaction when disturbed [27,28,29]. This reduction in cohesiveness increases the soil’s resistance to electric current, resulting in weaker conduction. This phenomenon may significantly increase the measured resistance at Site 2 [26]. Despite the increase in the size of the ground electrode in the trench, i.e., from J, K, M, N, P, to Q, there is no significant decrease in the percentage difference, except for O and L. The decrease observed in O and L can be attributed to their position in the installation sequence, i.e., the first and second, indicating that the soil was less disturbed and relatively more compacted by then (refer to Figure 8, Site 2).

4. Conclusions

The study reveals key insights into factors affecting discrepancies between measured and computed RDC values. Sequential testing of multiple electrode configurations within the same area suggests that soil disturbance from earlier installations can increase the measured resistance of subsequent electrodes. This disturbance notably amplifies the percentage difference between measured and computed RDC values, as current computational models typically do not account for such soil conditions. In undisturbed settings, differences are primarily influenced by soil work during installation.
The impact of soil disturbance is more significant at high-resistivity sites compared to low-resistivity sites. At Site 1, characterized by low resistivity and higher water content, there is a strong dependence on the size of electrodes embedded in the soil trenches, leading to a reduced difference between measured and computed RDC values. Conversely, at Site 2, with high-resistivity and drier soil, the lower soil cohesiveness and reduced shear strength result in a weaker dependency on electrode size.
These findings underscore the importance of accounting for soil disturbance in field measurements and computational simulations. When adequate space allows, testing different configurations with sufficient spacing between previous and current electrodes can help reduce the impact of soil disturbance within the critical resistance area of each electrode. However, spacing should not be excessive to prevent variability in soil resistivity across test points. In constrained testing spaces, thorough compaction after trench backfilling is essential to minimize soil disturbance effects. Using a rammer for compacting dry or high-resistivity soils is effective, though excessive compaction should be avoided. Additionally, software packages could benefit from a method—such as a mathematical factor—to account for soil disturbance in resistance measurements. Further investigation across sites with varied soil structures and layered profiles is recommended, as the two sites in this study had similar structures.

Author Contributions

Conceptualization, N.M.N.; methodology, U.M. and N.N.A.; validation, U.M. and N.M.N.; formal analysis, U.M., N.N.A. and N.M.N.; investigation, U.M., N.N.A. and F.A.; resources, N.M.N.; data curation, U.M. and N.M.N.; writing—original draft preparation, U.M.; writing—review and editing, N.M.N. and N.N.A.; visualization, U.M. and N.M.N.; supervision, N.N.A. and N.M.N.; project administration, N.M.N.; funding acquisition, N.M.N. All authors have read and agreed to the published version of the manuscript.

Funding

This research was funded by Telekom Malaysia Research and Development (TMR&D), grant number MMUE/240067.

Data Availability Statement

The original contributions presented in the study are included in the article.

Conflicts of Interest

The authors declare no conflicts of interest. The funder had no role in the design of the study; in the collection, analyses, or interpretation of data; in the writing of the manuscript; or in the decision to publish the results.

References

  1. Barker, P. Overvoltage considerations in applying distributed resources on power systems. In Proceedings of the IEEE Power Engineering Society Summer Meeting, Chicago, IL, USA, 21–25 July 2002; Volume 1, pp. 109–114. [Google Scholar] [CrossRef]
  2. Saleh, S.A.; Jewett, D.; Al-Durra, A.; Kanukollu, S. Experimental assessment of grounding system impacts on ground currents and transient overvoltage. IEEE Trans. Ind. Appl. 2022, 58, 5987–6001. [Google Scholar] [CrossRef]
  3. Obi, P.I.; Okoro, C.K.; Okonkwo, I.I. Electrocution, accidents and electrical injuries in Nigerian homes and work sites—Causes, Effects and Remedies. IOSR J. Elect. Electron. Eng. 2020, 15, 53–61. [Google Scholar]
  4. Muhammad, U.; Aman, F.; Mohamad Nor, N.; Abdullah, S. Determination of safety distances from ground electrodes subjected to impulse conditions. Adv. Elect. Electron. Eng. 2024, 22, 17–24. [Google Scholar] [CrossRef]
  5. Mousa, S.; Griffiths, H.; Harid, N.; Haddad, A. Current distribution under high frequency and transient conditions in earth electrode systems. In Proceedings of the 2012 International Conference on High Voltage Engineering and Application, Shanghai, China, 17–20 September 2012; pp. 150–153. [Google Scholar] [CrossRef]
  6. Mousa, S.; Harid, N.; Griffiths, H.; Haddad, A. Experimental investigation of high frequency and transient performance of earth rod systems. Electr. Power Syst. Res. 2014, 113, 196–203. [Google Scholar] [CrossRef]
  7. Clark, D.; Mousa, S.; Harid, N.; Griffiths, H.; Haddad, A. Lightning current performance of conventional and enhanced rod ground electrodes. IEEE Trans. Electromagn. Compat. 2021, 63, 1179–1188. [Google Scholar] [CrossRef]
  8. Mousa, S.; Harid, N.; Griffiths, H.; Haddad, M. Distribution of impulse current in earth grid electrodes. In Proceedings of the 2020 55th International Universities Power Engineering Conference (UPEC), Turin, Italy, 1–4 September 2020; pp. 1–4. [Google Scholar] [CrossRef]
  9. Dawalibi, F.; Mukhedkar, D. Influence of ground rods on grounding grids. IEEE Trans. Power Appl. Syst. 1979, PAS-98, 2089–2098. [Google Scholar] [CrossRef]
  10. Permal, N.; Osman, M.; Ariffin, A.M.; Kadir, M.Z.A.A. The impact of substation grounding grid design parameters in non-homogenous soil to the grid safety threshold parameters. IEEE Access 2021, 9, 37497–37509. [Google Scholar] [CrossRef]
  11. IEEE Std 80-2013; IEEE Guide for Safety in AC Substation Grounding. IEEE: Piscataway, NJ, USA, 2013.
  12. IEC 62305-3:2024; Protection Against Lightning-Part 3: Physical Damage to Structures and Life Hazard. International Electrotechnical Commission (IEC): Geneva, Switzerland, 2024.
  13. BS 7430:2011+A1:2015; Code of Practice for Protective Earthing of Electrical Installations. BSI: London, UK, 2015.
  14. Hizamul-din, H.H.; Mohamad Nor, N.; Ahmad, N.N.; Idris, N.F.; Mahmud, A. Investigations on the performance of various horizontal ground electrodes. Energies 2021, 14, 1036. [Google Scholar] [CrossRef]
  15. Mohamad Nor, N.; Trlep, M.; Abdullah, S.; Rajab, R. Investigations of earthing systems under steady-state and transients with FEM and experimental work. Int. J. Electr. Power Energy Syst. 2013, 44, 758–763. [Google Scholar] [CrossRef]
  16. Cvetković, N.N.; Jovanović, D.B.; Ristić, A.T.; Stojanović, M.S.; Krstić, D.D. Comparison of different models for determining the grounding rod resistance. Electrotech. Electron. E+E 2015, 50, 35–39. [Google Scholar]
  17. Abdullah, S.; Mohamad Nor, N.; Rajab, R.; Trlep, M. Analysis of 4 mesh grid grounding systems by FEM simulations and field tests. Appl. Mech. Mater. 2015, 793, 159–163. [Google Scholar] [CrossRef]
  18. Harid, N.; Griffiths, H.; Haddad, A. Effect of ground return path on impulse characteristics of earth electrodes. In Proceedings of the 2011 7th Asia-Pacific International Conference on Lightning, Chengdu, China, 1–4 November 2011; pp. 686–689. [Google Scholar] [CrossRef]
  19. Aman, F.; Mohamad Nor, N.; Ahmad, N.N. Impulse characteristics of ground electrodes over time (10 months). In Proceedings of the 2022 57th International Universities Power Engineering Conference (UPEC), Istanbul, Turkey, 30 August–2 September 2022; pp. 1–4. [Google Scholar] [CrossRef]
  20. Jovanović, D.B.; Cvetković, N.N.; Ristić, A.T.; Stanković, V.B. Different calculation methods and experimental validation for various ground electrode types. In Proceedings of the 2015 9th International Symposium on Advanced Topics in Electrical Engineering (ATEE), Bucharest, Romania, 7–9 May 2015; pp. 337–342. [Google Scholar] [CrossRef]
  21. Reffin, M.S.; Mohamad Nor, N.; Ahmad, N.N.; Abdullah, S. Performance of practical grounding systems under high impulse conditions. Energies 2018, 11, 3187. [Google Scholar] [CrossRef]
  22. Muhammad, U.; Aman, F.; Mohamad Nor, N. Effect of localised soil on the measured and calculated resistance values. In Proceedings of the 2023 4th International Conference on High Voltage Engineering and Power Systems (ICHVEPS), Denpasar Bali, Indonesia, 6–10 August 2023; pp. 604–608. [Google Scholar] [CrossRef]
  23. Muhammad, U.; Ahmad, N.N.; Mohamad Nor, N.; Aman, F. Measured and computed resistance values for vertical ground rods. In Proceedings of the 2024 Multimedia University Engineering Conference (MECON 2024), Cyberjaya, Malaysia, 23–25 July 2024. [Google Scholar]
  24. SafEngServices & Technologies Ltd. Current Distribution, Electromagnetic Fields, Grounding and Soil Structure Analysis (CDEGS); SafEngServices & Technologies Ltd.: Laval, QC, Canada, 1995; Available online: https://www.sestech.com/en/Product/Package/CDEGS (accessed on 10 January 2024).
  25. IEEE Std. 81-2012; Guide for Measuring Earth Resistivity, Ground Impedance, and Earth Surface Potentials of a Grounding System. IEEE: Piscataway, NJ, USA, 2012.
  26. Muhammad, U.; Zaid, H.; Ahmad, N.N.; Mohamad Nor, N.; Aman, F. Evaluation of steady-state ground resistance by field measurement and CDEGS computation. Bull. Electr. Eng. Inform. 2024, 13, 3033–3042. [Google Scholar] [CrossRef]
  27. de Melo, L.B.B.; Silva, B.M.; Peixoto, D.S.; Chiarini, T.P.A.; de Oliveira, G.C.; Curi, N. Effect of compaction on the relationship between electrical resistivity and soil water content in Oxisol. Soil Tillage Res. 2021, 208, 104876. [Google Scholar] [CrossRef]
  28. Hassan, A.A. Influence of compaction on electrical resistivity characteristics of fine-grained soil East of Baghdad City, Iraq. Earth Sci. Res. J. 2023, 27, 169–182. [Google Scholar] [CrossRef]
  29. Seladji, S.; Cosenza, P.; Tabbagh, A.; Ranger, J.; Richard, G. The effect of compaction on soil electrical resistivity: A laboratory investigation. Eur. J. Soil Sci. 2010, 61, 1043–1055. [Google Scholar] [CrossRef]
Figure 1. Multiple traverses on the test sites for soil resistivity test using Wenner 4-point method: (a) Site 1 (2°55′47″ N 101°38′19″ E), (b) Site 2 (2°55′32″ N 101°38′25″ E). Note: The ground electrode is installed in the black square area.
Energies 17 05845 g001
Figure 2. Tape ground electrode configurations: (a) 1.6 m horizontal, (b) 1.6 m by 1.6 m L-shape, (c) 3.6 m horizontal, (d) 3-star, (e) 4-star, (f) 3.6 m by 3.6 m L-shape, (g) 6-star, and (h) 8-star. Note: The installation sequence is shown next to the configuration name.
Energies 17 05845 g002
Figure 3. The sequence of installation (top-view) of eight tape configurations: (a) 1st, configuration O; (b) 2nd, configuration L; (c) 3rd, configuration M; (d) 4th, configuration K; (e) 5th, configuration J; (f) 6th, configuration Q; (g) 7th, configuration P; (h) 8th, configuration N. Note: Refer to Figure 2 for dimensions of each ground electrode configuration.
Energies 17 05845 g003
Figure 4. Illustration of the dimensions (width, w; height, h; length, L) of a copper tape electrode.
Energies 17 05845 g004
Figure 5. Flowchart of RDC simulation using MALZ-CDEGS [20]. Note: The abbreviation MALZ [24] refers to Mise à la Terre (French term for ‘grounding’), but with complex numbers (to account for conductor impedance). T is replaced with the label Z, commonly used for complex numbers.
Energies 17 05845 g005
Figure 6. Illustration of the two-layer soil structure at Sites 1 and 2.
Energies 17 05845 g006
Figure 7. The percentage difference between measured and computed RDC values against the area of tape electrode installed at both Site 1 and Site 2: (a) without ±5% error tolerance; (b) with ±5% error tolerance (i.e., using the min. and max. of the measured RDC range).
Energies 17 05845 g007
Figure 8. The percentage difference between measured and computed RDC values against the tape-to-trench ratio. Note: X1 and X2 represent the electrode configuration X installed at Site 1 and Site 2, respectively.
Energies 17 05845 g008
Table 1. Total surface areas for the tape grounding system configurations.
ConfigurationGrounding
System
Tape Length
(m)
Total Area
(m2)
Jhorizontal1.60.0898
KL-shape3.20.1795
Lhorizontal3.60.2018
M3-star4.80.2693
N4-star6.40.3590
OL-shape7.20.4035
P6-star9.60.5385
Q8-star12.80.7180
Table 2. Two-layer soil resistivity profile by CDEGS.
SiteSoil Resistivity Profile
ρ1 (Ωm)ρ2 (Ωm)h1 (m)h2 (m)
145.48231.191.88infinite
291.45383.130.64infinite
Table 3. Measured (including ±5% error tolerance) and CDEGS-computed RDC values of tape grounding system configurations at Sites 1 and 2.
Conf.Grounding
System
Site 1Site 2
RDC (Ω)% Diff.RDC (Ω)% Diff.
Measured ± 5% = [min., max.] CDEGSMeasured ± 5% = [min., max.]CDEGS
Jhorizontal61.30 ± 3.065 = [58.24, 64.37]32.7746.54125.90 ± 6.295 = [119.61, 132.20]79.6036.78
KL-shape39.20 ± 1.960 = [37.24, 41.16]21.5445.0588.60 ± 4.430 = [84.17, 93.03]55.0037.92
Lhorizontal19.90 ± 0.995 = [18.91, 20.90]19.99−0.4557.60 ± 2.880 = [54.72, 60.48]51.2011.11
M3-star22.90 ± 1.145 = [21.76, 24.05]17.2224.8075.20 ± 3.760 = [71.44, 78.96]44.8040.43
N4-star20.30 ± 1.015 = [19.29, 21.32]15.5623.3570.90 ± 3.545 = [67.36, 74.45]41.4041.61
OL-shape14.30 ± 0.715 = [13.59, 15.02]13.356.6435.60 ± 1.780 = [33.82, 37.38]35.001.69
P6-star17.00 ± 0.850 = [16.15, 17.85]14.2016.4764.10 ± 3.205 = [60.90, 67.31]38.6039.78
Q8-star15.40 ± 0.770 = [14.63, 16.17]13.3813.1259.40 ± 2.970 = [56.43, 62.37]36.9037.88
Table 4. Sequence of installations, % of tape-to-trench ratio, and corresponding % difference for all the tape electrode configurations.
Conf.Installation
Sequence
Total Length (m)Tape-to-Trench
Ratio (%)
% Difference
TapeTrenchSite 1Site 2
J5th1.6010.4015.3846.5436.78
K4th3.2010.4030.7745.0537.92
L2nd3.607.2050.000.4511.11
M3rd4.8010.4046.1524.8040.43
N8th6.4016.8038.1023.3541.61
O1st7.207.20100.006.641.69
P7th9.6016.8057.1416.4739.78
Q6th12.8016.8076.1913.1237.88
Disclaimer/Publisher’s Note: The statements, opinions and data contained in all publications are solely those of the individual author(s) and contributor(s) and not of MDPI and/or the editor(s). MDPI and/or the editor(s) disclaim responsibility for any injury to people or property resulting from any ideas, methods, instructions or products referred to in the content.

