Abstract
This paper presents a zero-dimensional dynamic model of redox flow batteries (RFBs) for the system-level analysis of energy loss. The model is used to simulate multi-cell systems considering the effect of design and operational parameters on energy loss and overall performance. The effect and contribution of stack losses (e.g., overpotential and crossover losses) and system losses (e.g., shunt currents and pumps) to total energy loss are examined. The model is tested by using literature data from a vanadium RFB energy storage. The results show that four parameters mainly affect RFB system performance: manifold diameter, stack current, cell standard potential, and internal resistance. A reduction in manifold diameter from 60 mm to 20 mm reduced shunt current loss by a factor of four without significantly increasing pumping loss, thus boosting round-trip efficiency (RTE) by 10%. The increase in stack current at a low flow rate increases power, while the cell standard potential and internal resistance play a crucial role in influencing both power and energy output. In summary, the modeling activities enabled the understanding of critical aspects of RFB systems, thereby serving as tools for system design and operation awareness.
1. Introduction
Demand for electric energy storage systems (ESSs) is constantly increasing to allow for greater penetration of stochastic renewable energy sources such as solar and wind in order to match the generation and demand of electricity. In this context, battery energy storage systems have demonstrated interesting features such as round-trip efficiency, scalability, fast response time, and adaptability to several applications, from small to large scales [1].
Redox flow batteries (RFBs) are one of the most promising battery energy storage technologies. The main advantage of the adoption of RFBs compared to different battery technologies is the ability to decouple power and energy, ensuring a cost-effective solution for stationary storage, especially for long discharge and storage systems [2].
The term “redox” refers to chemical reduction and oxidation reactions utilized by the RFB to store energy in liquid electrolyte solutions that flow through electrochemical cells during charging and discharging. The RFB system is made up of “stacked” individual cells with ion-exchange membranes that physically separate the electrolytes, avoiding species crossover but allowing for selective ion conduction to maintain the charge balance during operation [3,4]. Discharge is characterized by the release of electrons from the electrolytes into the circuit to perform useful work. Conversely, during charging, the reverse reaction captures electrons from an external power source to replenish the energy potential. The passive state of charge (SOC) balance subsists in both directions. The term SOC refers to the degree of charge (available energy) of an electrical battery relative to its maximum capacity.
Validated models for the simulation of the RFBs, with a suitable computational cost, are relevant tools to use to investigate the physical behavior of each component of the battery. Even though the scientific literature is rich in studies investigating RFBs, the authors identified few works dealing with the simulation of system-based models focused on the analysis of inherent losses in the system and its ancillaries.
Yu and Chen in [5] used a physics-based model to study the influence of some operating parameters (e.g., current, temperature, flow rate, state of charge) on the performance of RFBs considering the overpotential due to mass transfer and crossover effects. They found that the mass transfer and species crossover negatively affect the battery voltage response. König et al. in [6] developed an analytical model pointing out that shunt current loss and hydraulic loss depend strongly on the stack series connection in RFBs. They found that the choice of fewer stacks in series with optimal pipe diameters minimizes the shunt currents.
Several authors adopted models based on an equivalent circuit: Baccino et al. [7] stated that the RFB’s internal resistances depend on SOC and current density, while Qiu et al. [8] reported that the RFB system efficiency is dependent on stack current and SOC; as a result, the RFB round-trip efficiency is highly affected by the operating range, dropping dramatically at low charging rates. Ye et al. in [9] examined the effects of electrode thickness and aspect ratio, channel geometry, stack number, and branch geometry on system performance. They found that to tackle high shunt current loss in an RFB system containing a large number of single cells in series, the multi-stack configuration is the most suitable, as well as an optimized piping network. D‘Agostino et al. [10] proposed improvements in the control of RFB electrolyte flow that include more sophisticated pump management making the pumping rate dependent on the battery load and the current operating conditions. The aim is to improve the low system round-trip efficiency due to the significant pump energy consumption. Furthermore, Bhattacharjee and Saha [11] proposed an optimal range of variable electrolyte flow rates for varying SOC to ensure minimal RFB system power consumption during charging and maximum power output during discharging. Chen et al. [12] found that the number of cells is a key factor that dominates the shunt currents in a single stack: a cell number lower than 20 may keep the charge transfer efficiency higher than 0.9. Concerning shunt current loss, Barelli et al. [13] pointed out that they can be reduced by up to 60% by increasing the current density; the wider the manifold diameter (at channel diameter parity), the greater the shunt currents (and thus the corresponding loss) and the more sensitive to changes in grouping configuration. Turker et al. [14] adopted a simple black box technique to investigate the effect of different powers on RFB system performance. They found that high overvoltage loss causes lower efficiencies, and a strong dependency of voltage on SOC appears at high power.
Some authors adopted a phenomenological cell-based model: Xu et al. [15] highlighted the relevance of adopting a dependence between viscosity and SOC in order to simulate, in a more accurate way, RFB system efficiency and pump consumption. Delgado et al. [16] found that, to determine the concentration overpotential, an improvement in model accuracy could be achieved when the reactant concentration as well as the current density are calculated based on the surface area of the electrode fibers, instead of on the electrodes only. Nevertheless, this implies a considerable further complexity in the model not suitable for computationally light models.
In 2022 Delgado et al. [17] proposed a novel redox flow battery stack design with a high manifold resistance and a low flow frame channel resistance with the aim of reducing the shunt currents. When compared to a conventional stack, this new stack produced 24% lower shunt current loss, 33% lower pressure drop across the stack, and 19% higher nominal power output at 80 mA cm−2. Trovò et al. [18] investigated the impact of inherent losses on RFB system efficiency. They identified the critical factors for designing future high-efficiency systems based on compact stacks. As a compromise between shunt current and hydraulic losses, they strongly suggested longer and thinner flow paths, as the hydraulic loss was found to be largely dependent on the low efficiency of the electric motors and pumps. However, in order to reduce the effect of shunt currents on stack efficiency and temperature, Tang et al. in [19] warned that, with longer channels and smaller cross-sectional areas, more pumping power would be required to circulate the electrolyte through the stack. As a result, a trade-off between pumping power and shunt current loss must be considered in RFB systems in order to achieve maximum efficiency. Similarly, shunt currents and hydraulic pumping are significant sources of loss in RFB stacks. For example, Moro et al. [20] proposed an alternative stack configuration to address these issues. Though the authors stated that the alternative topology design had much lower losses than the conventional one, their findings clearly confirmed the dependence of shunt currents on manifold diameters in both designs.
It is worth noting that only a few of the presented studies are focused on identifying the share of cells, stack, and whole system design and operation impact on the round-trip efficiency (RTE). To date, there has not been enough attention devoted to the system-level analysis of RFBs with consideration of the associated energy loss and system performance. Simulating a multi-cell model, including the whole stack and ancillary systems, to tackle shunt currents, pumping loss, crossover loss, and cell overpotential is a relevant issue. In addition, the development of a valid model for such system-based analysis is missing in the available literature.
In this paper, a lumped-parameters (0-D) dynamic multi-cell model for system-level analysis of energy loss, including ancillaries, is presented. The aim is to upscale the results of RFBs from single-cell experimental/simulated data to the system level. The proposed model can be adopted to simulate different RFB technologies with various chemicals. The model verification is realized considering a Vanadium RFB (VRFB) due to the large availability of data.
The VRFBs are flow batteries that combine four different oxidation states of vanadium ions to form two distinct redox pairs as electrolytes, anolytes, and catholytes in a solution with sulfuric acid, with only vanadium serving as an active element on both sides [21,22]. In fact, the VRFB is one of the RFB technologies that has received significant interest due to its excellent electrochemical reversibility (sustainability), independent energy and power rating, life span, scalability, and minimal cross-contamination between positive and negative electrolytes [23]. The electrical energy is stored in the chemical form of a vanadium solution, transforming it within electrochemical cells and storing the electrolytes in two external tanks. In addition, it has previously proven its worth in a variety of grid and renewable integration applications, ranging from rated powers of hundreds of kW to multi-MW. Sumitomo Electric Industries in Japan, for example, has already built and commissioned RFB systems rated at 15 and 17 MW (60 and 51 MWh of energy stored) [24,25], and recently, Dalian Rongke Power has commissioned 100 MW power and 400 MWh energy VRFB in China [26].
The simulations are focused on a multi-cell RFB considering the effect of design and operational parameters on energy losses such as overpotential, crossover, shunt currents, and pumping loss, thus enabling a breakdown of loss contributions along with an evaluation of power delivered and RTE. Accordingly, the proposed model will be used to suggest design modifications and assess operating conditions with the aim of identifying the best operating points in terms of current and flow rate. This scalable model for the system-level analysis of RFBs is also a useful tool for techno–economic assessments.
2. Model Formulation
2.1. Balance Equations
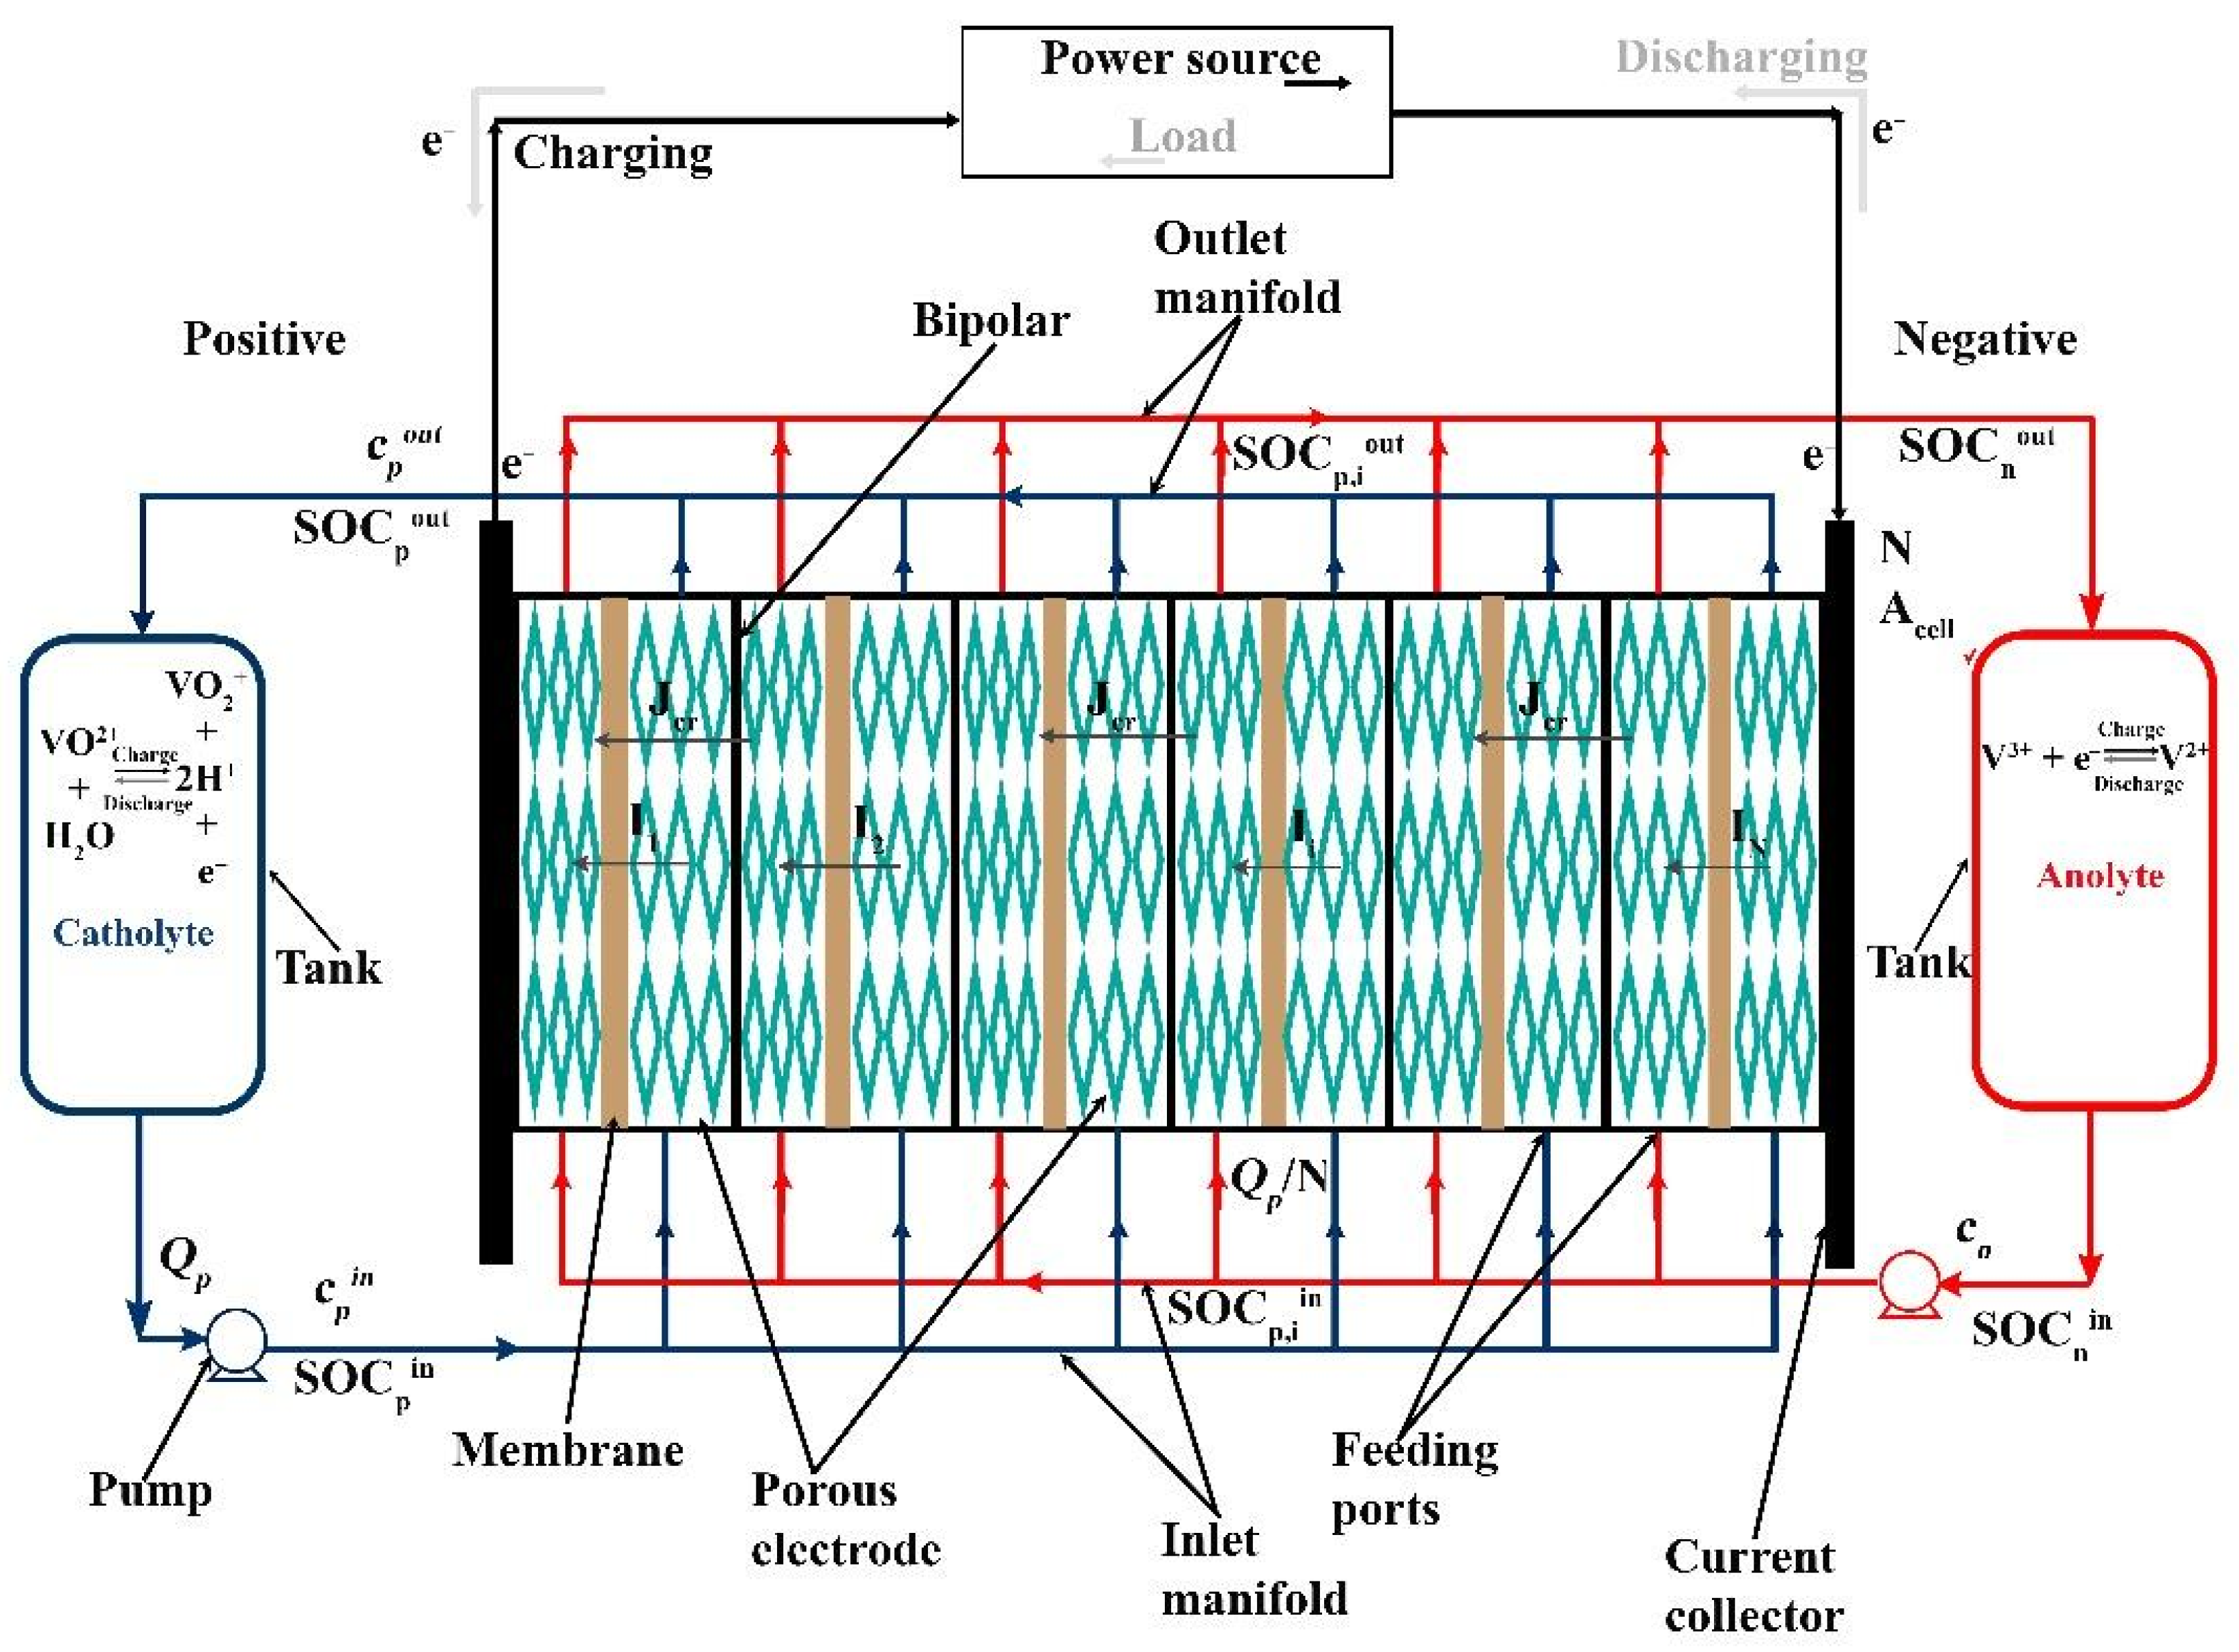
Figure 1 shows a schematic diagram of an RFB system, comprising a stack with N cells of area Acell, two tanks of volume Vtank, and two pumps to circulate the volumetric flow rate Q of positive and negative electrolytes (subscripts p and n, respectively). The figure indicates that the current experienced by each cell (I1, I2, … IN) can be different from the stack current I: this is due to the effect of shunt currents, as explained in Section 2.2. Each cell current Ii converts the active species in the electrolyte, changing the inlet state of charge to the outlet state of charge (, different for each cell i based on the corresponding current Ii). The crossover flux Jcr reduces the concentration of active species from the inlet (c) to the outlet (cout). Notably, while c refers to the total concentration of active species in the electrolyte (i.e., the sum of the concentration of oxidized and reduced species), c·SOC represents the molar concentration of the oxidized species in the positive electrolyte and of the reduced species in the negative electrolyte, respectively. The sign convention used in this work considers positive currents (I and Ii) during discharge and positive crossover flux Jcr to indicate species consumption via crossover.
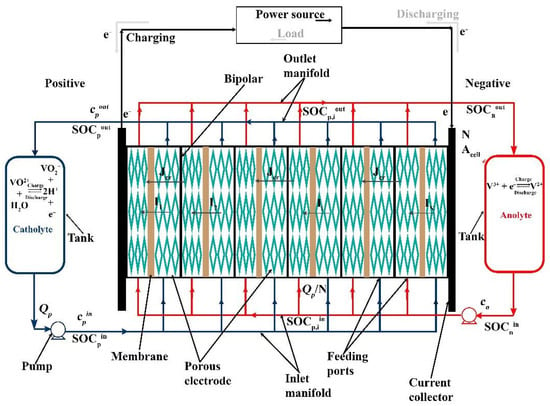
Figure 1.
Schematic diagram of a typical RFB system. While the current direction within the cells is displayed in discharge mode only, the movement of electrons in the external circuit is depicted with solid black lines during charge and grey arrows during discharge.
The model is based on species balance equations applied to the stack and the tanks. The temperature is assumed to be constant, consistent with the choice of not considering the cooling systems. In fact, temperature changes are expected to be in the order of a few Celsius degrees for the currents investigated in this study [27].
Here are the considered species balances:
- balance equations of total active species concentration:
- balance equations of active species:where we define the outlet SOCout as:
Equation (1) states that the inflow of total active species to the stack (Qc) is consumed (i.e., the total concentration of active species in the electrolyte decreases due to the crossover effect, which means that the capacity of the electrolyte and the energy it can release are both decreasing) in the outlet (Qcout) due to the crossover flux Jcr across the N cells of area Acell.
Equation (2) is a dynamic molar balance applied to the tank, which is considered well mixed at concentration c. The same rationale is used in Equation (4).
Equation (3) describes the molar balance of the active species in each cell i, where the inlet flow rate () is converted by the current circulating in the cell (Ii) according to the Faraday law, where n is the number of electrons exchanged per mole of active species and F is the Faraday constant, and is consumed by the crossover flux ().
Equation (4) is analogous to Equation (2) (as for Equations (1) and (3)) when applied to the active species rather than to the total concentration.
The currents Ii are evaluated according to the resistor network model presented by Trovò et al. in [18], which takes into account the polarization behavior of each cell linking the current Ii to the cell potential. Notably, in the model, the current is considered positive during discharge and negative during charge.
The dynamic model is implemented in COMSOL Multiphysics 6.1. In the following, the step-by-step procedure adopted in the software to compute the simulations is described:
- (1)
- the stack current is set as an input parameter at the beginning of each simulation.
- (2)
- The stack potential is calculated as the sum of the cell potentials (see Equation (6)) since cells are connected in electrical series and are evaluated at each instant t. The number of cells is forty.
- (3)
- Stack potential and current are combined to evaluate the electric power of the stack (positive for discharge, negative for charge).
- (4)
- The effective electric power produced or required by the system, denoted with Peff, is equal to the difference between the electric power Pel produced or required by the stack and the electric power Ppu required by the pumps.
- (5)
- Finally, the RTE is calculated: the round-trip efficiency is defined as the ratio between the effective electric energy released by the system during discharge (Weff,discharge) and the effective electric energy (in absolute value) required during charge (Weff,charge), both evaluated as the time integrals of the instantaneous effective powers during the discharge and charge times (tdischarge and tcharge, respectively):
As a side note, the AC–DC conversion efficiency of the stack electric power Pel, which is present when the system is used for stationary storage (while it is not strictly required when renewable energy sources are directly used in DC), is assumed to be unitary for simplicity; nevertheless, the effect of the AC–DC conversion efficiency is quantitatively discussed in the next sections.
The step-by-step process described above highlights the relevance of the calculation of the energy losses that affect the system’s effective output power. For this reason, it is necessary to model all the major energy losses related to the stack and the auxiliary components:
- overpotential loss (Wov) due to the sum of activation, concentration, and ohmic overpotentials in each cell;
- crossover loss (Wcr) due to the undesired species crossover across the membrane in each cell;
- shunt current loss (Wsh) arising from the parasitic currents within the electrolytes in the stack manifolds;
- pumping (or hydraulic) loss (Wpu) due to the electric energy required by the pumps to overcome the electrolyte pressure drop across the system.
Additional losses, such as the hydrogen evolution reaction [28] and other degradation phenomena, are not accounted for in the present study. In fact, taking into account these phenomena require advanced and chemistry-specific model equations [29], while this work aims at presenting a lumped and agnostic framework; moreover, including such specific phenomena would require a challenging parametrization with experimental data at the system level. The detailed description of the implementation of the four energy losses listed above is reported in the following sections.
2.2. Cell Overpotential Loss
In electrochemical cells such as the RFBs, the overpotential is the potential difference between the actual voltage under operating conditions and the theoretical equilibrium voltage. As such, the overpotential loss is evaluated from the polarization behavior of a single cell, which is based on the relationship between cell potential and current density. A simple but effective strategy to model the cell polarization behavior relies on the linearization of the current–voltage relationship, polarization curve, shown in Supplementary Materials “Benchmark scenario and parameters”, around the open circuit voltage with an internal area-specific resistance rin, which can be a function of SOC and of the area-specific flow rate q = Q/(N·Acell), i.e., rin(SOC,q). The open circuit voltage (OCV) is the maximum voltage of a battery when it is not connected to any load.
The limiting current densities during discharge (ilim,d) and charge (ilim,c), which represent the maximum current density that the cell can achieve due to mass transfer limitations, are also taken into account by setting the voltage to minus or plus infinity, respectively. In fact, at the limiting current, the concentration of a reacting species drops to zero at the electrode surface, so that, according to the Nernst law, the voltage changes abruptly, negatively or positively depending on whether the species is a reactant in the forward or backward reaction. Such an approximation is fairly accurate for representing the experimental polarization data of the RFB chemistries under consideration. Notably, experimental data on single cells obtained at a laboratory scale can be effectively used thanks to the area-specific normalization of current and flow rates.
Therefore, the voltage–current relationship of each cell in the stack is represented according to Ohm’s law:
with for and for , where the OCV is calculated according to the Nernst equation based on the inlet SOCs:
where E° is the standard potential of the redox couple, R is the universal gas constant, T is the operating temperature, and np and nn are the number of electrons exchanged by redox reactions at the positive and negative sides of the battery, respectively, both equal to 1 for a VRFB.
2.3. Crossover
The crossover takes into account the undesired flux of active species that cross the membrane and thus reduce the concentration of active species in the electrolytes. This is typical for vanadium-based chemistries due to molecule sizes [19]. In particular, for a constant crossover flux, the integration of Equations (1) and (2) gives:
which indicates a linear decrease in the total concentration of active species with time, thus implying a loss in capacity and in the available energy in the stored electrolyte.
Modeling the dependence of the crossover flux on operating conditions and membrane characteristics is arguably a complicated task; thus, a simplified approach, suitable for the present needs, consists of assuming the crossover flux as the sum of a constant factor b (equivalent to a constant crossover flux irrespective of system operation) and a term linearly dependent on the current density (regardless of its sign, so obtaining the same Jcr upon application of the same current density during charge or discharge) as follows:
Equation (13) provides a simplified empirical approach to account for species crossover induced by concentration gradients across the membrane (taken into account by factor b as long as the concentrations of active species c do not vary significantly) and species migration (i.e., related to the current density circulating across the membrane). This approach, however, is not meant to exactly describe the real physics of crossover, but rather to adopt an empirical framework to capture, in a nutshell, the effect of the main factors affecting the crossover flux. For VRFBs, by fitting the crossover loss measured by Trovò et al. [18] for different currents, the factors a and b are equal to a = 3.883 × 10⁻⁷ mol/C and b = 1.032 × 10⁻⁴ mol/(m2s). As a first approximation, these factors can be assumed to be constant also upon catholyte and anolyte rebalancing, provided that the total concentration of active species is restored on both sides of the system.
2.4. Shunt Currents
In a stack, shunt currents arise from the potential difference between cells arranged in electric series, which induce parasitic ionic currents circulating within the internal channels of the stack, which feed the electrolytes in parallel to each cell. Thus, the hydraulic circuit of the stack depicted in Figure 1 can be effectively reduced to a resistor network [20]. The potential difference across the cells is equal to the cell potential, determined as indicated in Equations (10) and (11), while Kirchhoff laws are used to solve for the current and potential distribution in each branch and node of the network, see Supplementary Materials, “Resistor network”. The abovementioned resistor network part of the RFB model is thus solved by using COMSOL Multiphysics 6.1, which provides all the unknown shunt currents at each time t.
2.5. Pumping Loss
Pumping loss takes into account the electric power required to pump the electrolyte in the stack and the pipes of the system. The calculation of pumping loss starts from the evaluation of the pressure drops in the hydraulic circuit of the positive and negative sides of the RFB and considers the efficiencies of all associated ancillary devices, namely the pump, electric motor, and inverter.
For negative and positive sides, the pressure drop ∆p is evaluated as a function of flow rate Q:
taking into account laminar contributions, which scale linearly with Q and depend on electrolyte viscosity , and turbulent contributions, which scale quadratically with Q and depend on electrolyte density . The factors α, β, and γ are dimensional constants whose values are specific to the stack and hydraulic system under consideration while being independent of electrolyte properties. For the 40-cell stack used in this work, the factors are equal to as obtained from the interpolation of the pressure drop data of the hydraulic circuit of the negative electrolyte of the VRFB system investigated by Trovò et al. [18]. In the Supplementary Materials “Pumping losses”, is show how starting from circuit pressure drop are determined electric losses related to the pump.
3. Model Verification
3.1. Reference VRFB
Among the various RFB technologies, vanadium redox flow batteries (VRFBs) are the most mature [30]. For this reason, VRFBs are utilized to calibrate and validate the model presented in this paper, suggesting the possibility of generalizing the modeling process to other chemistries [31].
Since the modeling framework is independent of battery chemistry and VRFBs are the more established RFB technology, the model has been calibrated to vanadium chemistry, including the crossover loss, and the selected size is a kW size widely deployable, as in the case of domestic applications from Trovò et al. [18]. The model verification is carried out by comparing the calculated and experimental data regarding energy loss.
3.2. Breakdown of Performance Loss
The ability of the model to correctly estimate the distribution of energy loss in an RFB system is assessed by comparing the breakdown of performance loss in a 40-cell stack used in the VRFB system analyzed by Trovò et al. [18]. The model shares the same parameterization as the reference experimental study in terms of stack and system geometry (reported in detail in Section 4.1), as well as for pumping and crossover losses, as already discussed in Section 2.3 and Section 2.5.
Figure 2 compares the pie charts of energy loss contributions in a charge/discharge cycle at 50 A. The RTE estimated by the model is 67.6%, which is reasonably close to the experimental value of 67.1% measured by Trovò et al. [18]. The distribution of energy loss is also in good agreement, with minor discrepancies that are considered acceptable due to the complexity of the system and the necessary model simplifications required to reduce the computational cost of the model. The model correctly predicts that overpotential loss Wov is the main contributor to energy loss and that the pumping loss Wpu represents a minor contribution, albeit still relevant.

Figure 2.
Comparison of the breakdown of energy loss between (a) experimental data and (b) simulated results for a charge/discharge cycle at 50 A for the 40-cell VRFB system investigated by Trovò et al. [18].
The satisfactory comparison between experimental and simulated results on the breakdown of the four energy losses considered by the model indicates that the model developed is sufficiently accurate to assess the performance of RFBs at the system level and can be used to investigate the effect of operational and design parameters in order to guide system design.
4. Results and Discussion
4.1. Stack and System Design
The results presented in the next section for the multi-cell RFB system refer to the design of the vanadium battery system reported in Table 1, which comes from the experimental work performed by Trovò et al. [18]. The system under consideration consists of a stack made of 40 cells of flat-type design with an active area of 600 cm2, with electrodes and membrane 5.7 mm and 50 µm thick, respectively. The manifold diameter is 60 mm, and the tanks used to store the electrolytes have a volume of 550 L. According to the simulations of Moro et al. [20], the equivalent resistance of the cells and feeding ports can be approximated as , where σ is the electrolyte conductivity and L and S are the length and cross-section area of the feeding port, respectively.

Table 1.
Parameters of the stack and system design.
The pumping loss in this system is calculated according to the expressions and parameters reported in Section 2.5, whose values come from [18]. For simplicity, a constant value of flow rate is considered during charge/discharge. Thus, the parameterization reported in this paper is used for vanadium and can also be used, to some extent, for other RFBs.
4.2. Manifold Diameter Effect
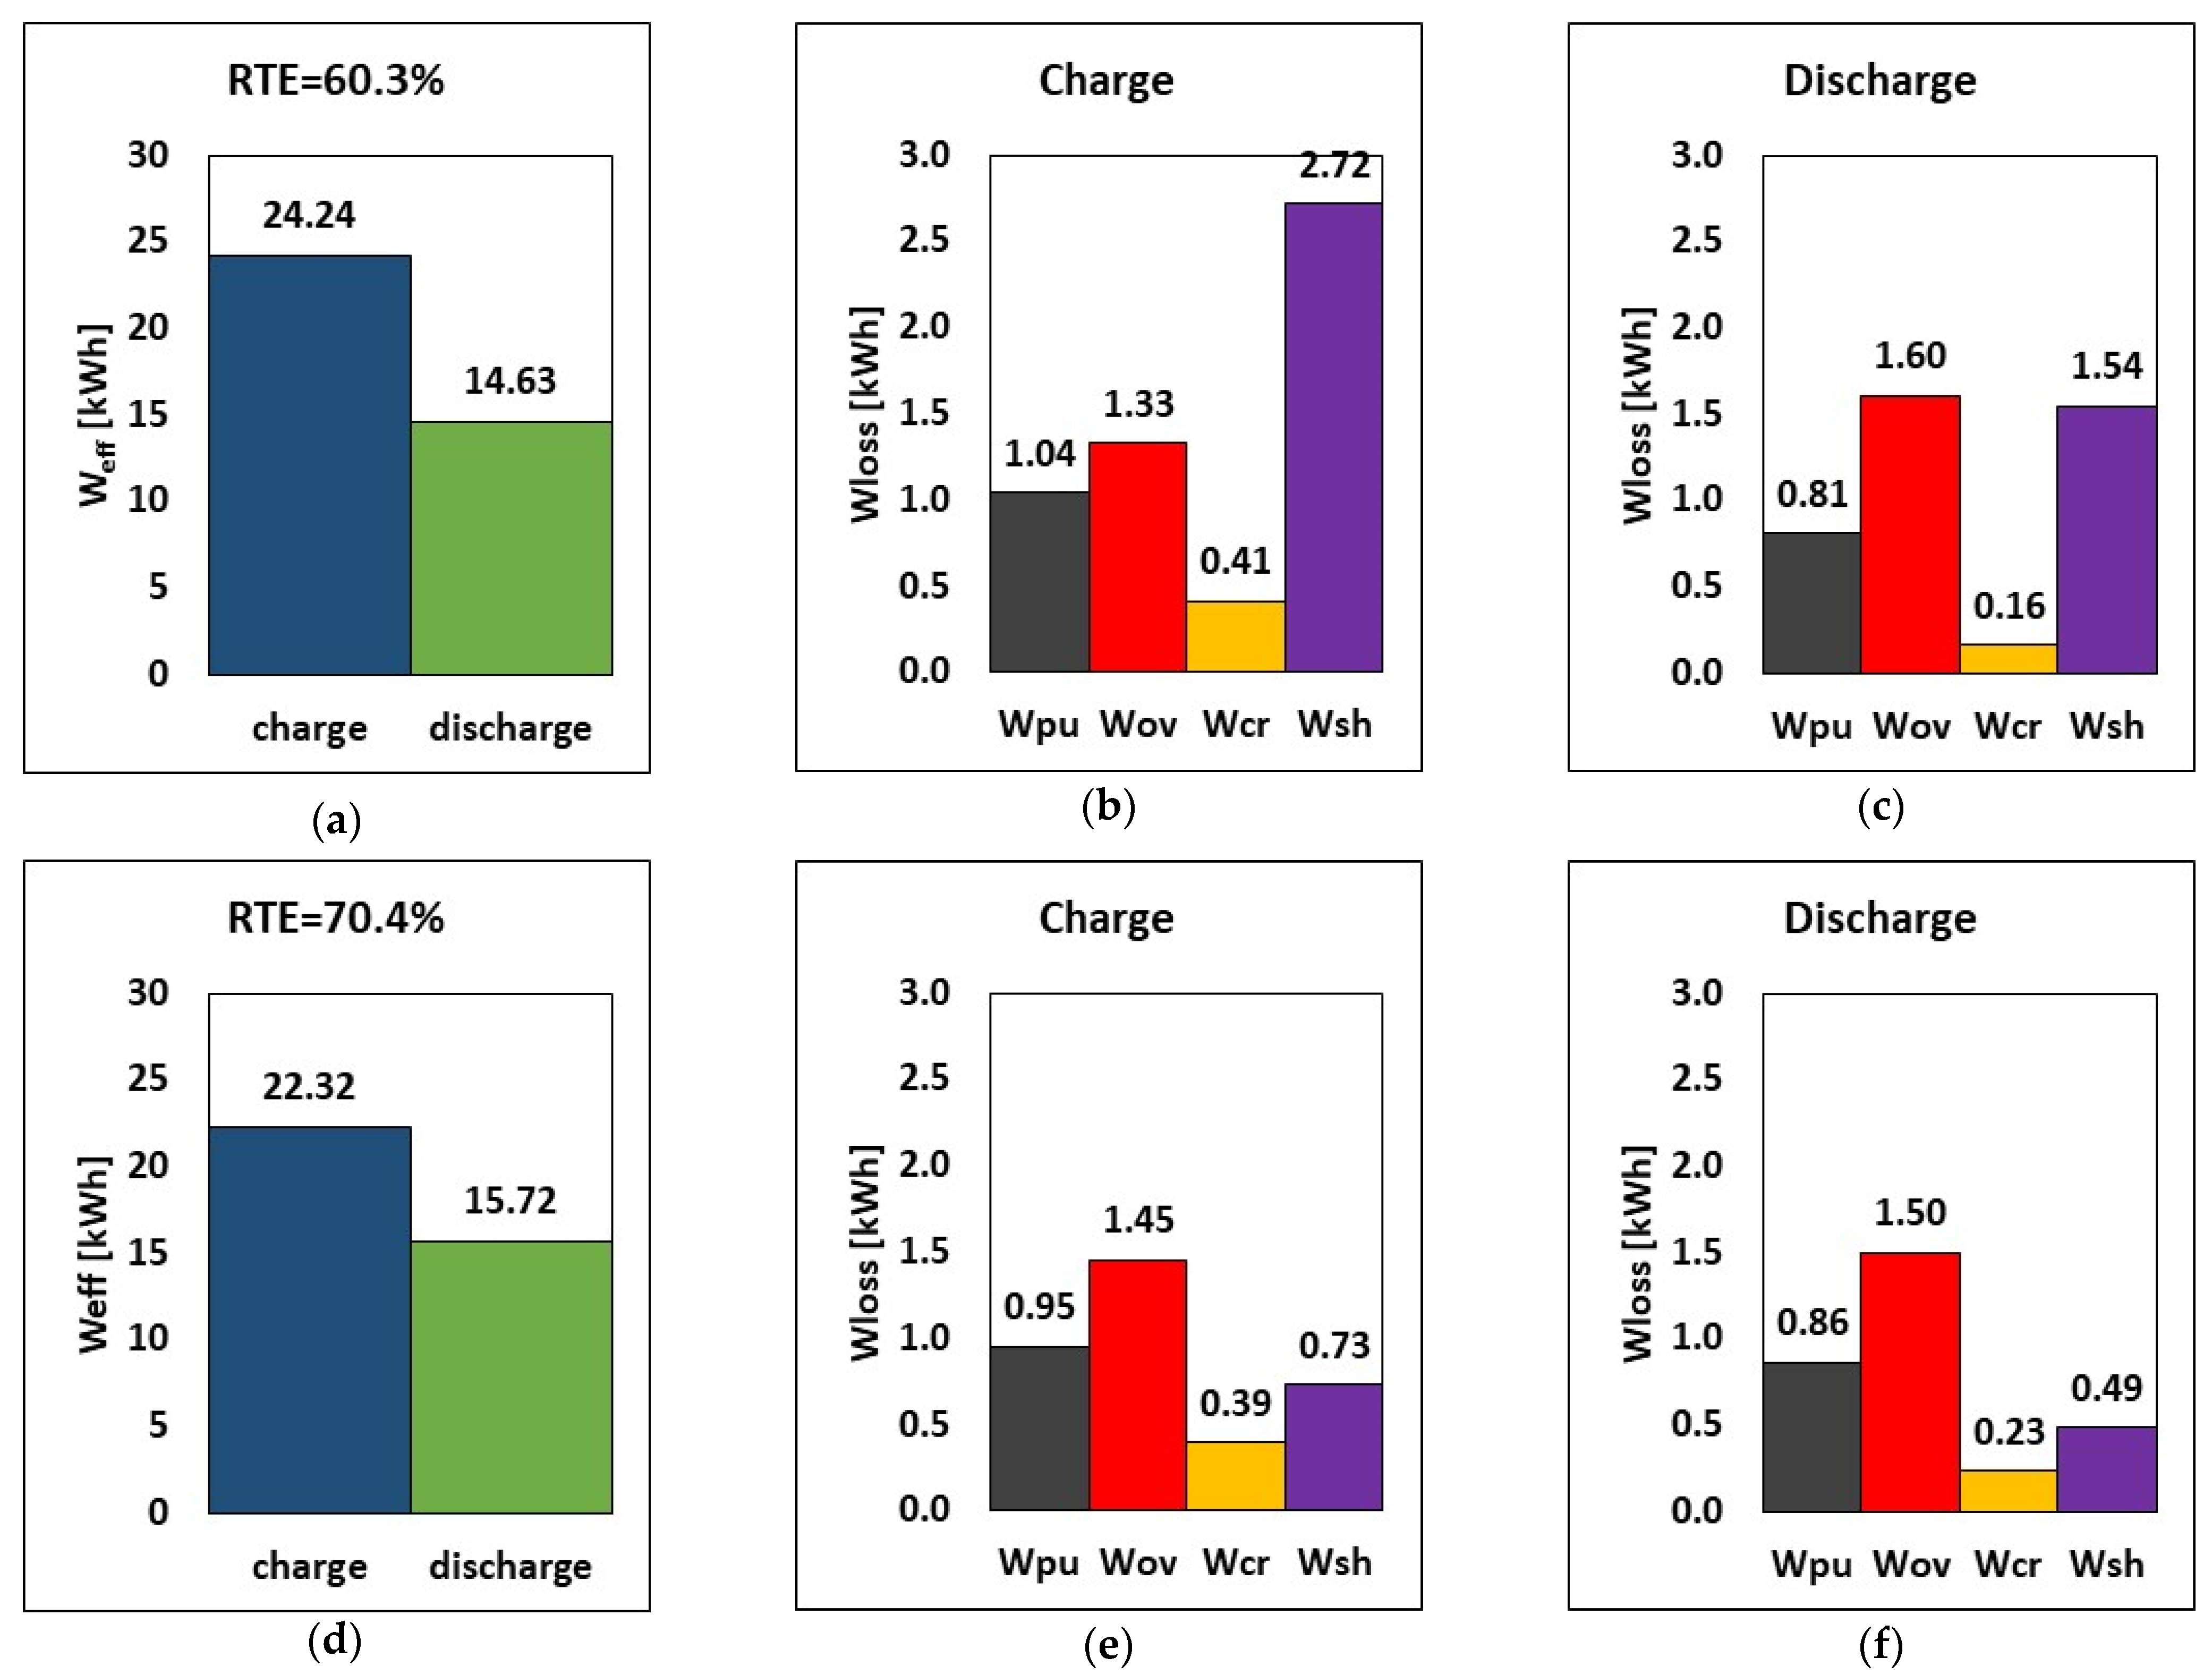
The first application of the model is devoted to the reduction in shunt current loss. The impact of manifold diameter on shunt current, overpotential, crossover, and hydraulic losses is investigated because of its large shunt current loss implications. Emphasis on design choice for manifold diameters is crucial to RFB performance. Based on these considerations, the effect of reducing the manifold diameter from 60 mm to 20 mm is evaluated by using the model presented in Section 2. The comparison of energy loss between the reference manifold diameter of 60 mm and the reduced one of 20 mm is shown in Figure 3 as the breakdown of energy loss during charge and the energy in the round-trip at I = 50 A and Q = 25 L/min.
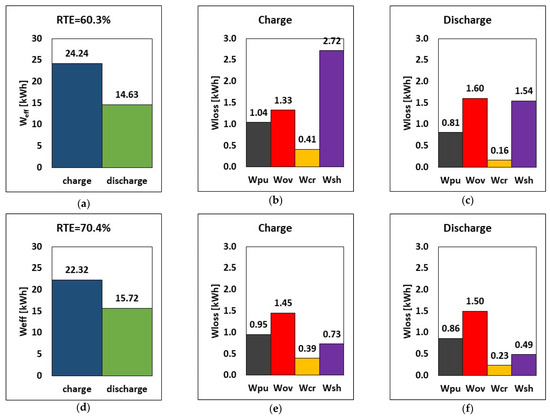
Figure 3.
RTE, energy, and breakdown of energy losses during charge and discharge at (a–c) 60 mm and (d–f) 20 mm manifold diameters, at I = 50 A and Q = 25 L/min.
The results show that using a smaller manifold diameter decreases shunt current loss by ca. 73% at constant charge and discharge currents of 50 A (Figure 3), from 2.72 kWh to 0.73 kWh. Since shunt currents lead to loss in active species, reducing the manifold diameter has a positive impact on the operation times: the charging time was reduced from 7.9 h to 7.2 h, and the discharge time was increased from 6.2 h to 6.6 h. This means that, due to the reduced charge time, the pumping and crossover losses are also reduced, as shown in Figure 3.
Consequently, reducing the manifold diameter from 60 mm to 20 mm leads to a significant increase in the RTE, from 60.3% to 70.4%, which corresponds to a relative increase of ca. 17%. Less energy is required during charge (22.32 kWh vs. 24.24 kWh), and more energy is provided by the battery during discharge (15.72 kWh vs. 14.63 kWh). This indicates that the stack released around 7.5% more stored energy when the manifold diameter was decreased, despite a slight reduction in cycle time. Pump loss decreased by about 8.6% when a smaller manifold diameter of 20 mm was used while charging, but it increased by about 6.2% while discharging. This effect, however, is negligible in comparison to the benefits of the reduced manifold diameter, which resulted in lower shunt current loss, improved RTE, and improved energy release.
These results indicate that an effective strategy to reduce shunt currents in an RFB stack consists of reducing the manifold diameter as much as possible, at least until a further reduction does not cause an increase in pressure drops high enough to nullify the benefits of the reduced shunt current loss. This has a beneficial effect on system operation, in that the RTE increased by more than 10 percentage points compared to the reference scenario. Thus, from now on, the manifold diameter considered in all the following simulations will be equal to 20 mm.
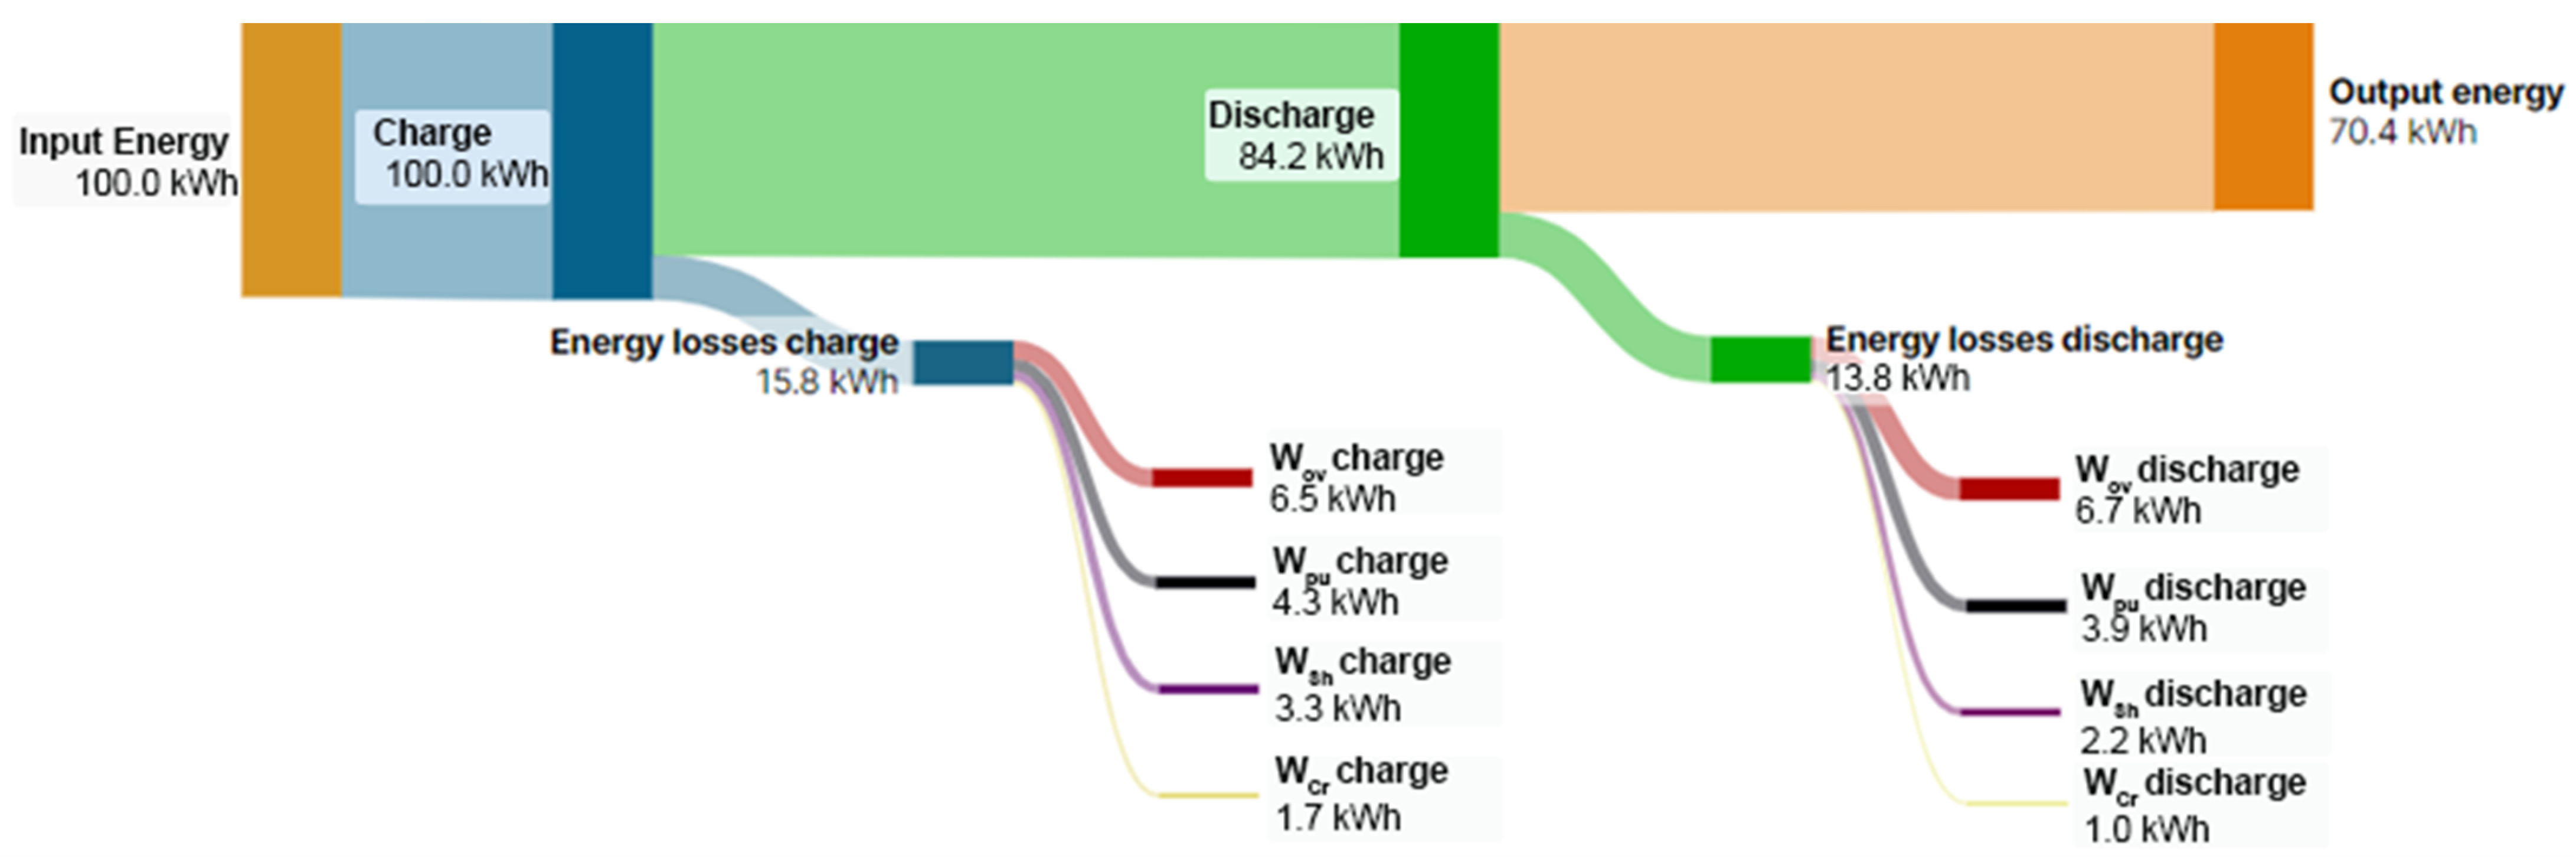
The results of Figure 3 underline that RFBs are energy systems with energy loss; for the sake of clearness, Figure 4 reports the Sankey diagram of energy flow and loss terms of the RFB system reported in Figure 3d considering 100 kWh as the input energy.

Figure 4.
Sankey diagram of energy flows and loss terms of a characteristic RFB.
4.3. Current and Nominal Flow Rate Effect
An RFB system can be operated in different conditions by varying some operational parameters, such as the current I and the flow rate Q. Broadly speaking, increasing the current leads to a general increase in rated power, although at the expense of larger overpotential loss [32], while increasing the flow rate leads to an increase in limiting current densities and thus an extension of the current range, despite requiring more pumping power. The optimal operation of an RFB system can target the maximization of the round-trip efficiency or the achievement of a desired rated power (or energy), just to name a few options.
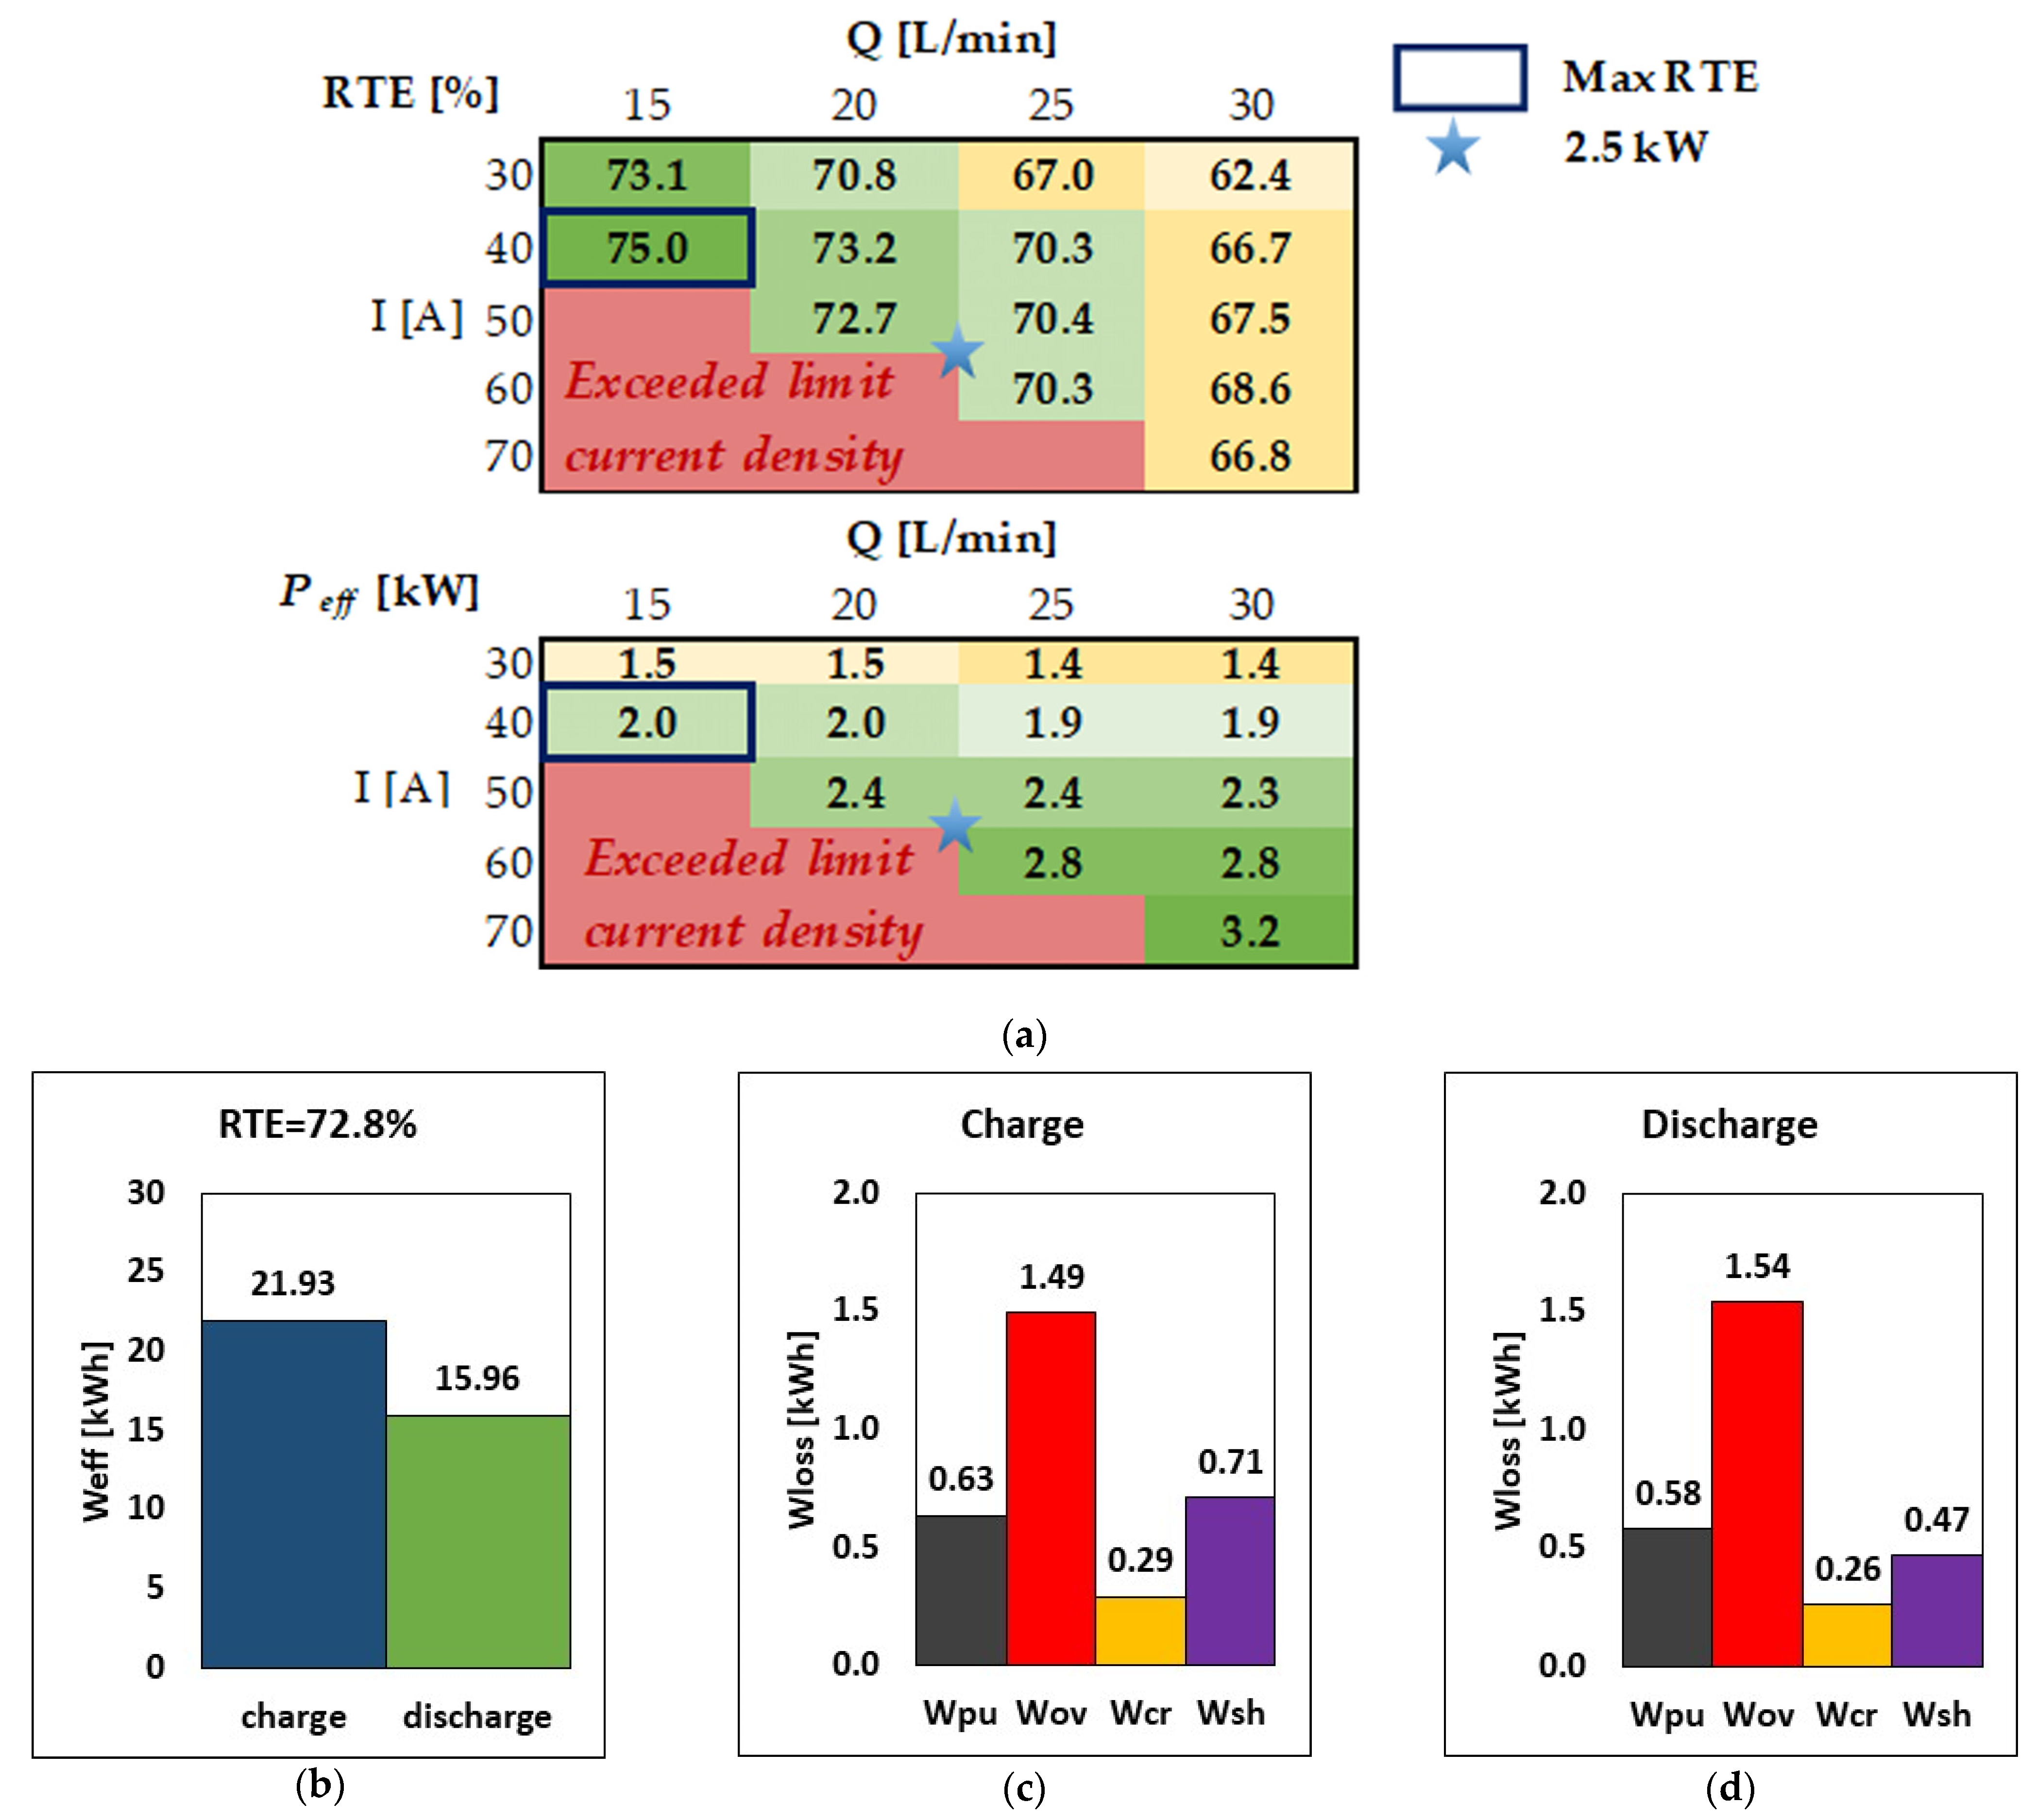
The effect of stack current and flow rate for the 40-cell VRFB system is examined in this section and summarized in Figure 5. For simplicity, in each charge/discharge round-trip, the same current and flow rate is used during charge and discharge, although the model can use even different operating conditions in the round-trip cycle. Figure 5a shows the RTE and the discharge power in matrix form for five values of stack current (from 30 A to 70 A) and four values of flow rate (from 15 L/min to 30 L/min). Each cell in the matrix is color-coded from green to yellow to emphasize data from high to low values; red cells indicate that the system cannot be operated in such a combination of current and flow rate since the limiting current density is exceeded during at least a fraction of operation.
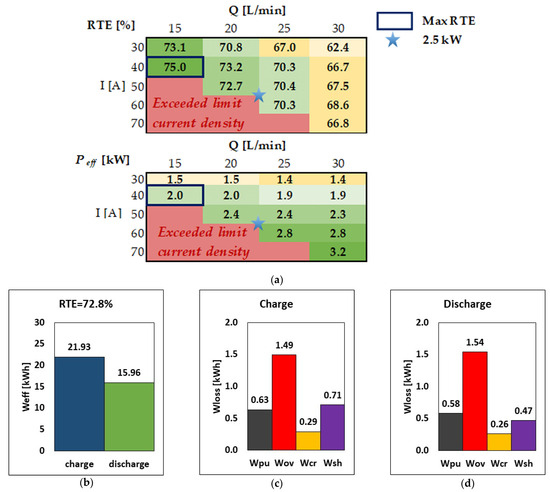
Figure 5.
(a) RTE and power discharged for different values of current and flow rates. (b–d) RTE, energy, and breakdown of energy losses during charge and discharge at the nominal operating point of 2.5 kW discharge power (i.e., I = 51.5 A, Q = 20.5 L/min).
Figure 5a shows that, given the current (i.e., moving from left to right in the matrix), both the RTE and Peff decrease as the flow rate increases due to the increase in pumping loss; on the other hand, increasing the flow rate expands the limiting current density window, so that higher currents can be accessed at a higher flow rate. This indicates that the flow rate can be tuned to operate the system at different currents [20]. Once the flow rate is selected (i.e., moving from top to bottom in the matrix), increasing the current causes an increase in the effective discharge power, while the RTE has generally a local maximum at intermediate currents.
Figure 5a shows that the maximum RTE, equal to 75%, is obtained at 40 A and 15 L/min, corresponding to an effective discharge power of 1.99 kW, marked with a blue box. Such a rated power is acceptable for some domestic use of RFBs [18,33,34,35], although one may want a system with higher power, e.g., 2.5 kW, which is denoted with a light blue star. More specifically, the 2.5 kW operation point corresponds to 51.5 A and 20.5 L/min, with an RTE of 72.8%, which is only marginally smaller than the maximum RTE identified above. Therefore, the nominal operation point of such a VRFB system can be considered to be the one indicated by the light blue star, corresponding to a nominal effective discharge power of 2.5 kW.
The figures indicate that the system delivers 15.96 kWh during discharge and requires 21.93 kWh during charge. The main source of energy loss is attributed to the cells’ overpotential, which dissipates 1.54 kWh during discharge, which is ca. 50% of the energy loss during discharge; the other contributions to energy loss are in the order of ca. 0.5 kWh each or below during discharge. A similar breakdown of energy loss is present in charge mode, although there is a decrease in overpotential loss and an increase in shunt current loss due to the larger stack voltage, which induces higher shunt currents and thus higher corresponding energy dissipations.
4.4. Energy-to-Power (E-P): Effect of Tank Sizing under Optimal Conditions
One of the favorable characteristics of RFBs is that energy and power can be easily decoupled by independently changing the tank and stack sizes, respectively, in order to achieve the desired nominal energy-to-power ratio. As shown in the previous section, the VRFB system under consideration can be operated at a nominal discharge power of 2.5 kW to deliver 15.96 kWh using tanks of 550 L each. This allows for 6.4 h of the nominal energy-to-power ratio. In this section, while the stack size and operating conditions are kept the same as indicated in the previous section, different tank sizes are explored to analyze the effect of the energy-to-power ratio on the RTE. In particular, the larger the tank size, the larger the amount of electrolyte stored in the system, thus resulting in higher capacity and higher energy theoretically stored in the tanks, with a corresponding increase in charge and discharge times.
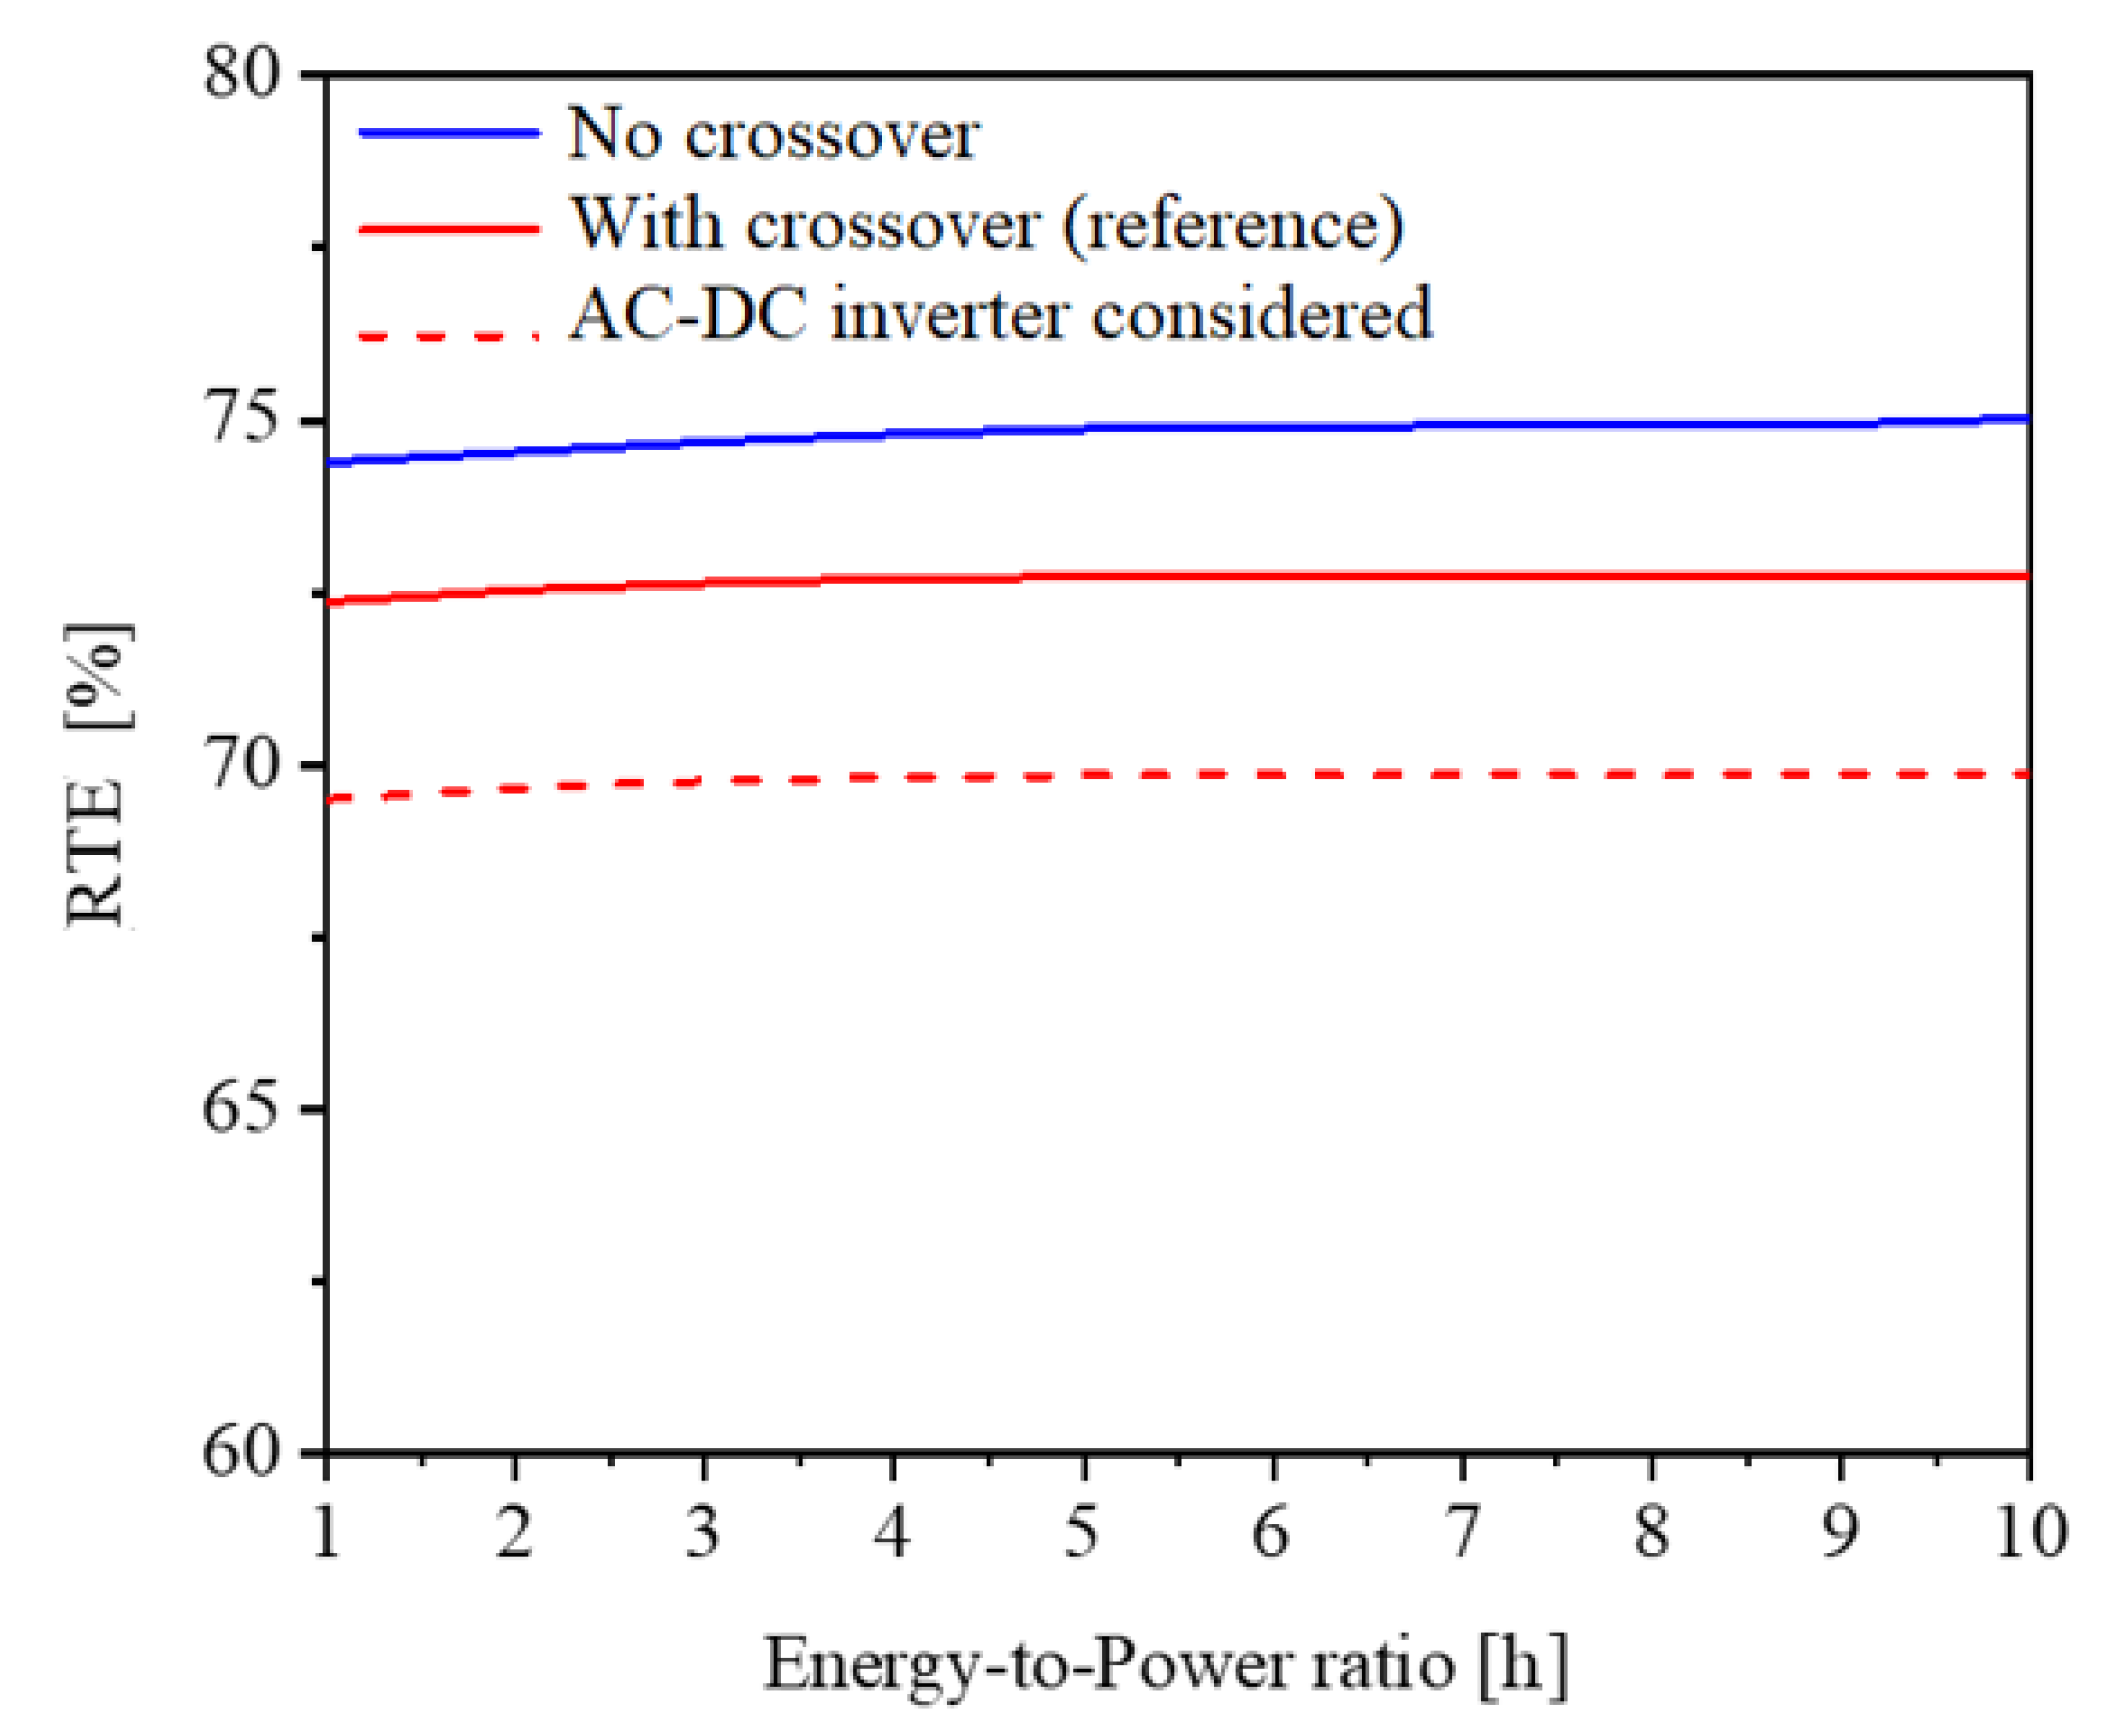
The numerical results are reported in Figure 6. The red solid curve indicates that, by changing the tank size within the energy-to-power range from 1 h to 10 h, the RTE remains constant at around 72.8%. The blue curve reports the RTE in the ideal scenario of no crossover (i.e., for Jcr = 0); crossover is typical for vanadium-based chemistries. Also, in this case, the RTE remains constant, being ca. 2–2.5% larger than the nominal case in red. While researchers typically assume inverter efficiency of 95% [17], practical implementations typically achieve much lower rates of performance. As a result, the load condition has a significant impact on inverter efficiency [32]. Finally, the dashed red curve introduces the loss due to the AC–DC inverter, assumed with an efficiency of 98%. Since the VRFB system requires and provides DC current, the efficiency of the AC–DC inverter considers the energy loss when the VRFB system is interfaced with the grid in AC both in input and in output, leading to a reduction in RTE by a factor equal to the inverter efficiency squared, as shown in Figure 6.
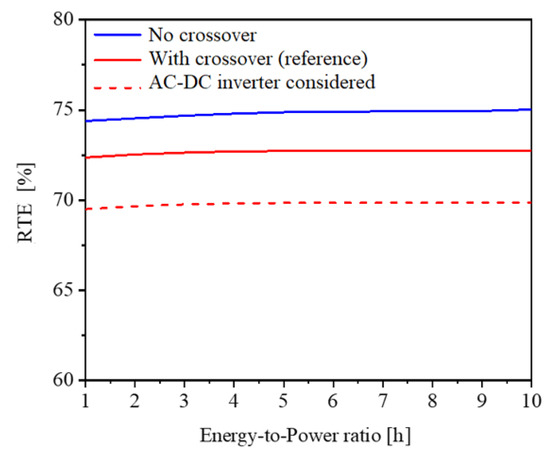
Figure 6.
RTE as a function of the energy-to-power ratio (i.e., tank size) at the nominal operating conditions of 51.5 A and 20.5 L/min.
4.5. Sensitivity to Electrolyte Viscosity and Density
Electrolytes serve as an energy storage medium in VRFBs, while pumps play an important role in electrolyte movement throughout the system. As a result of the electrolyte’s properties, electrochemical activity and stability have a substantial impact on the performance of VRFBs and pumps that consume energy. Therefore, the active electrolyte used in the VRFB must meet several criteria, including high solubility, superior electrochemical kinetics, good stability, and a broad operating potential, while being relatively inexpensive [2].
Here, an attempt to isolate the contribution to system performance of electrolyte viscosity and density is carried out. In particular, these properties are assumed to vary independently while keeping the others unaffected. Three test cases were realized:
- Case 1: density ρ = 1350 kg/m3, viscosity of positive electrolyte µp = 0.007 Pa·s and negative electrolyte µn = 0.0055 Pa·s
- Case 2: density ρ = 1350 kg/m3, viscosity of positive electrolyte µp = 0.014 Pa·s and negative electrolyte µn = 0.0011 Pa·s
- Case 3: density ρ = 1000 kg/m3, viscosity of positive electrolyte µp = 0.001 Pa·s and negative electrolyte µn = 0.001 Pa·s
Case 1 considers the design parameters, while Case 2 doubles the viscosity of the positive electrolyte. Case 3 is a hypothetical case in which we imagined the electrolyte properties to be similar to water.
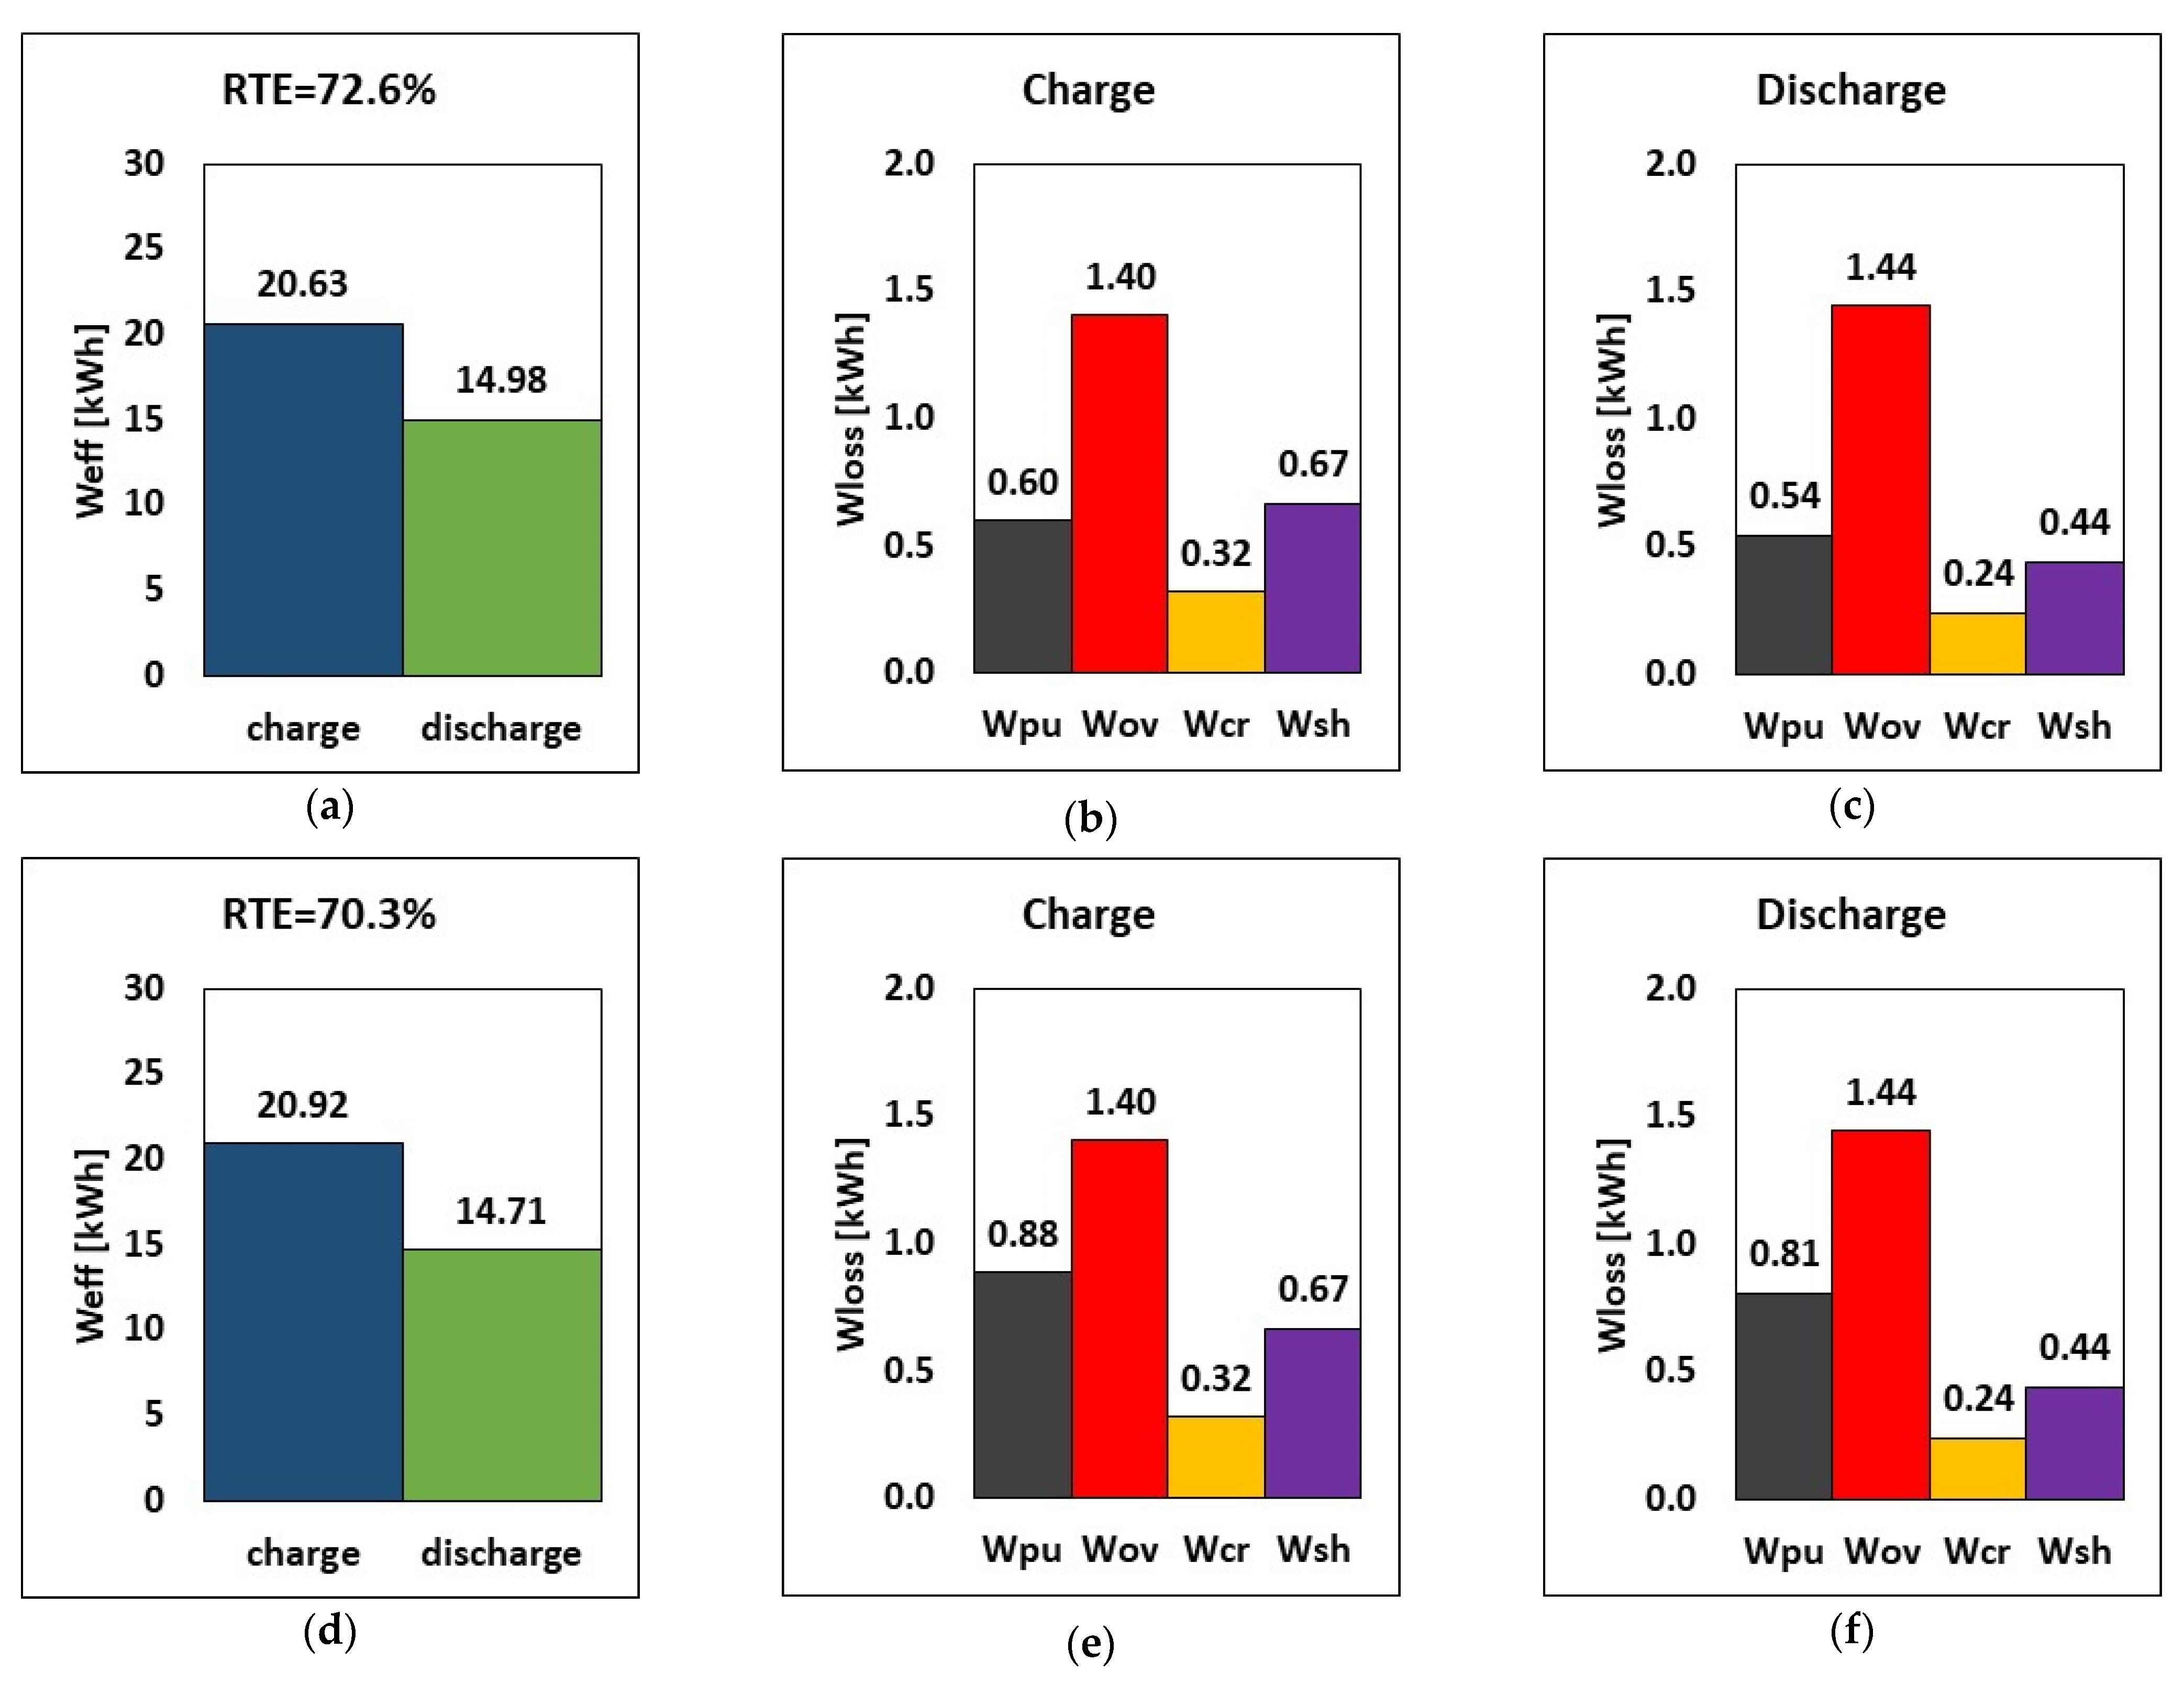
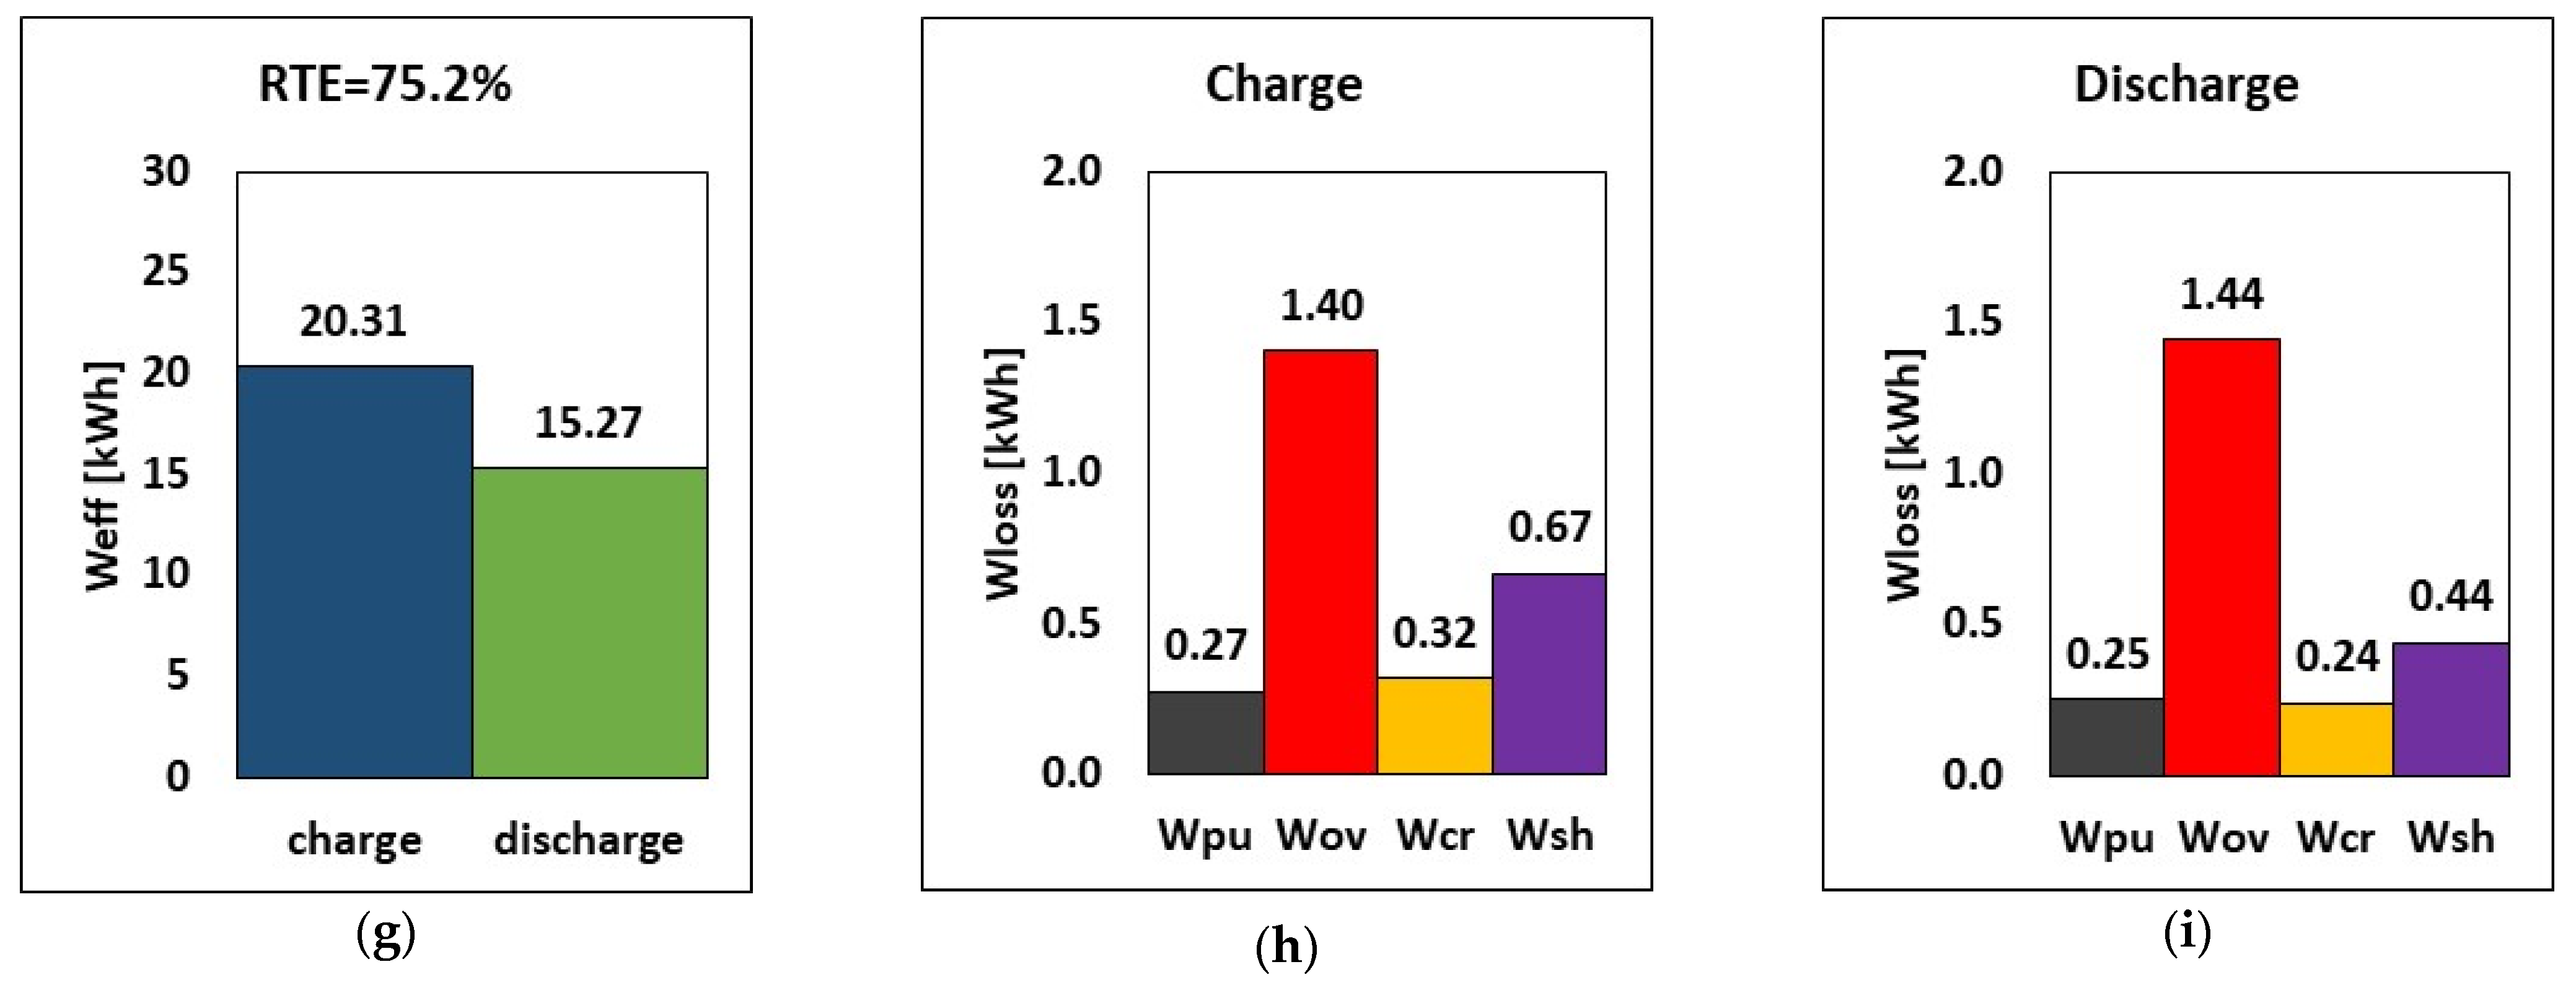
The results are reported in Figure 7 for 2.5 kW discharge power with an energy-to-power (E–P) ratio of 6 h (a representative time for RFB long discharge applications). Results show that only the pumping loss is greatly affected, with the hydraulic pump losses of 90.45 W, 134.43 W, and 41.75 W, respectively. In the third case, where the density is assumed to be that of water, the hydraulic energy loss is low thanks to the minimized pressure drop caused by the small viscosity. Conversely, the hydraulic energy loss increased by a factor of 1.5 when viscosity was doubled together with a drop in the RTE. As such, consciously improving the electrolyte properties by reducing the viscosity and density will greatly reduce pumping loss while significantly boosting the RTE of the RFB system.
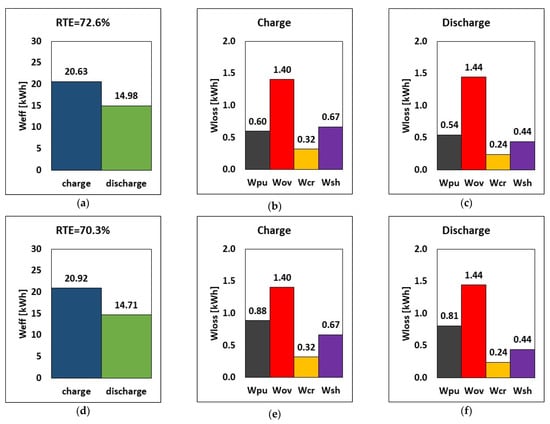
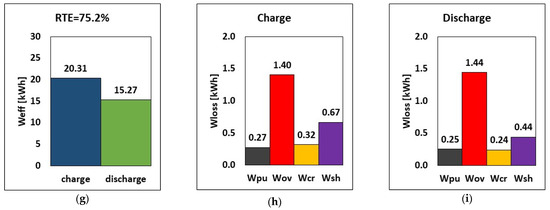
Figure 7.
RTE, energy, and breakdown of energy losses during charge and discharge for three couplings of electrolyte viscosity and density (a–c) µp = 0.007 Pa.s, µn = 0.0055 Pa.s, ρ = 1350 kg/m3 (d–f) µp = 0.014 Pa.s, µn = 0.011 Pa.s, ρ = 1350 kg/m3 (g–i) µp = µn = 0.001 Pa.s, ρ = 1000 kg/m3 at E–P ratio of 6 h for a 2.5 kW power discharge.
4.6. Sensitivity to Standard Potential
As previously stated, the performance of an RFB is determined by a variety of factors, including the standard potential. The cell voltage and energy density of an RFB are determined by the standard potential of ions on each electrode. The values can typically range from 1.1 V to 1.6 V depending on the chemistry, as explained in [36]. Therefore, this section evaluates the sensitivity of an RFB with vanadium-like properties to the standard potential, representing different values: 0.6 V, 1.0 V, and 1.37 V.
The three different potential voltages are simulated at the E–P ratio of 6 h for a 2.5 kW power discharge operated at a stack current and tank volume of 51.5 A and 516 L, respectively. As seen in Table 2, an increase in the standard potential results in a corresponding increase in the power and RTE. If the standard potential (E°) increases from 0.6 V to 1.37 V, the discharge power increases by over 170%, while the RTE increases by 31%. This means that, if the standard potential is raised, this can also be used to meet the power need during the design of the cell stack. Thus, a chemistry with higher standard potential is desirable, leading to enhanced efficiency and performance, as long as water electrolysis is prevented. As shown in Table 2, it can be seen that the standard potential also affects the energy losses due to crossover and shunt currents. Reducing the E° from 1.37 V to 0.6 V reduced the energy losses due to crossover and shunt currents by 58% and 84%, respectively. As a result, while lowering E° may benefit energy loss reduction, it does not benefit both power and energy output.

Table 2.
Parameters of the stack and system design.
4.7. Sensitivity to Internal Resistance and Limiting Current Window
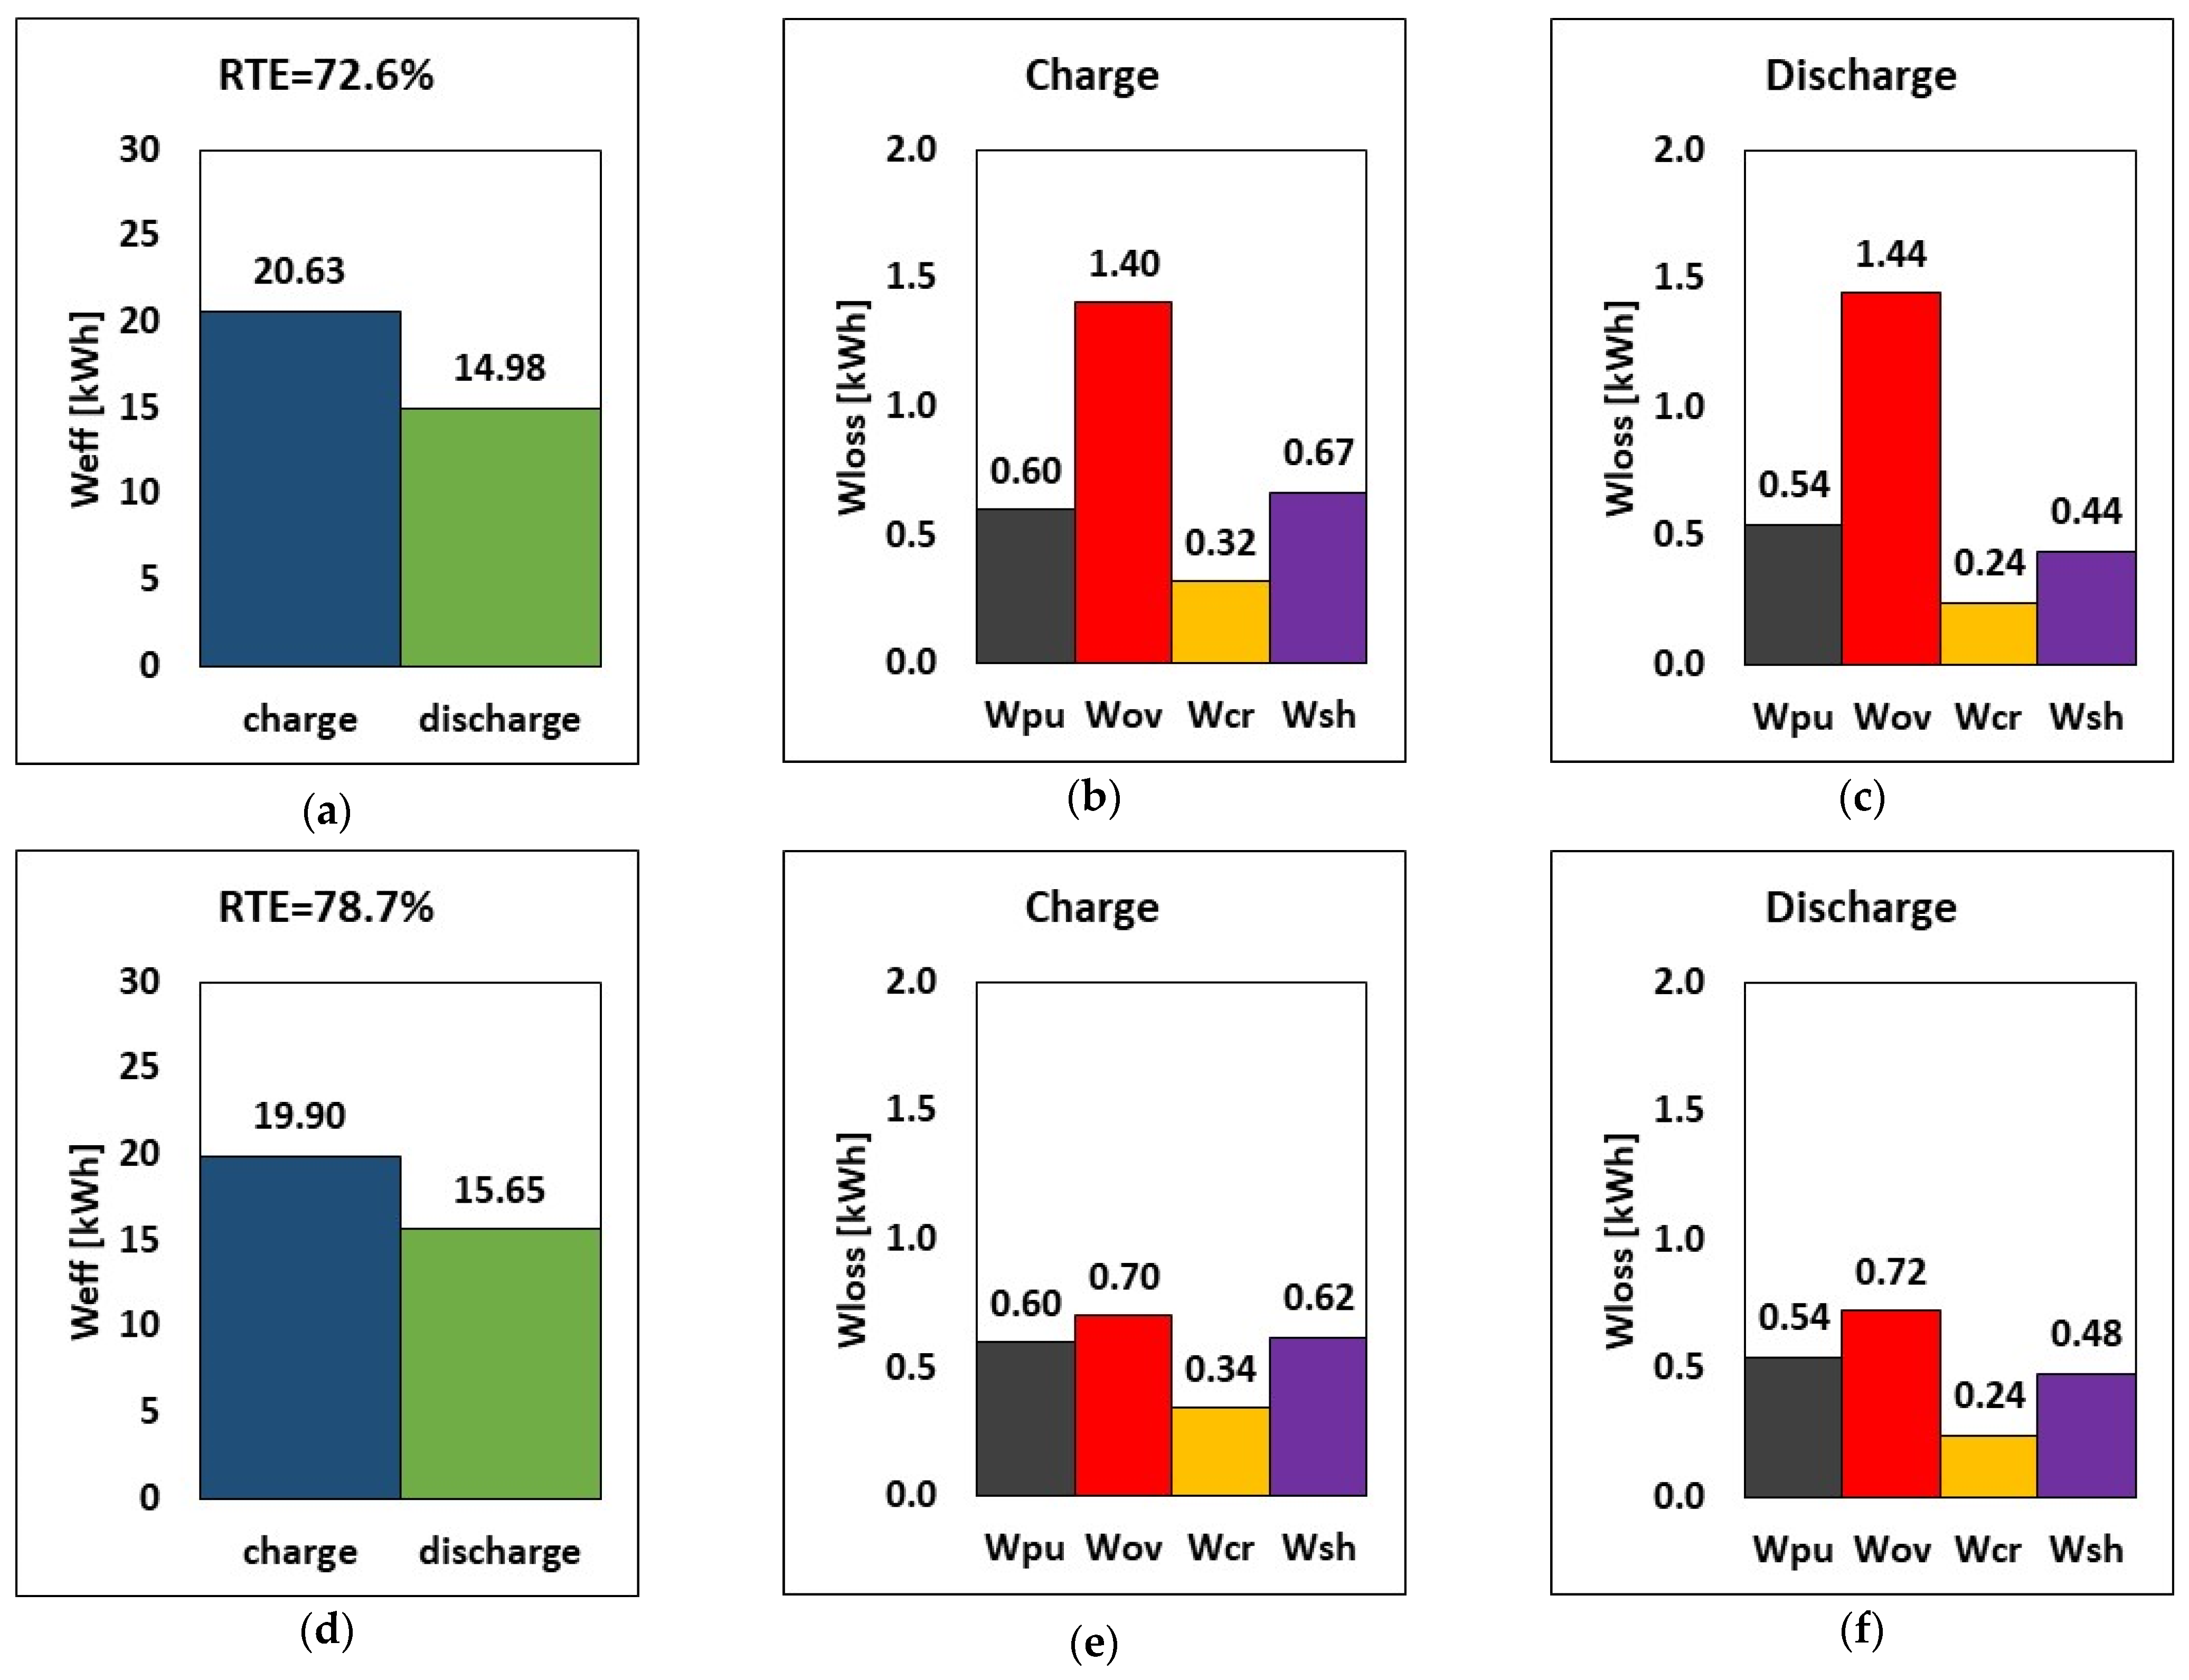
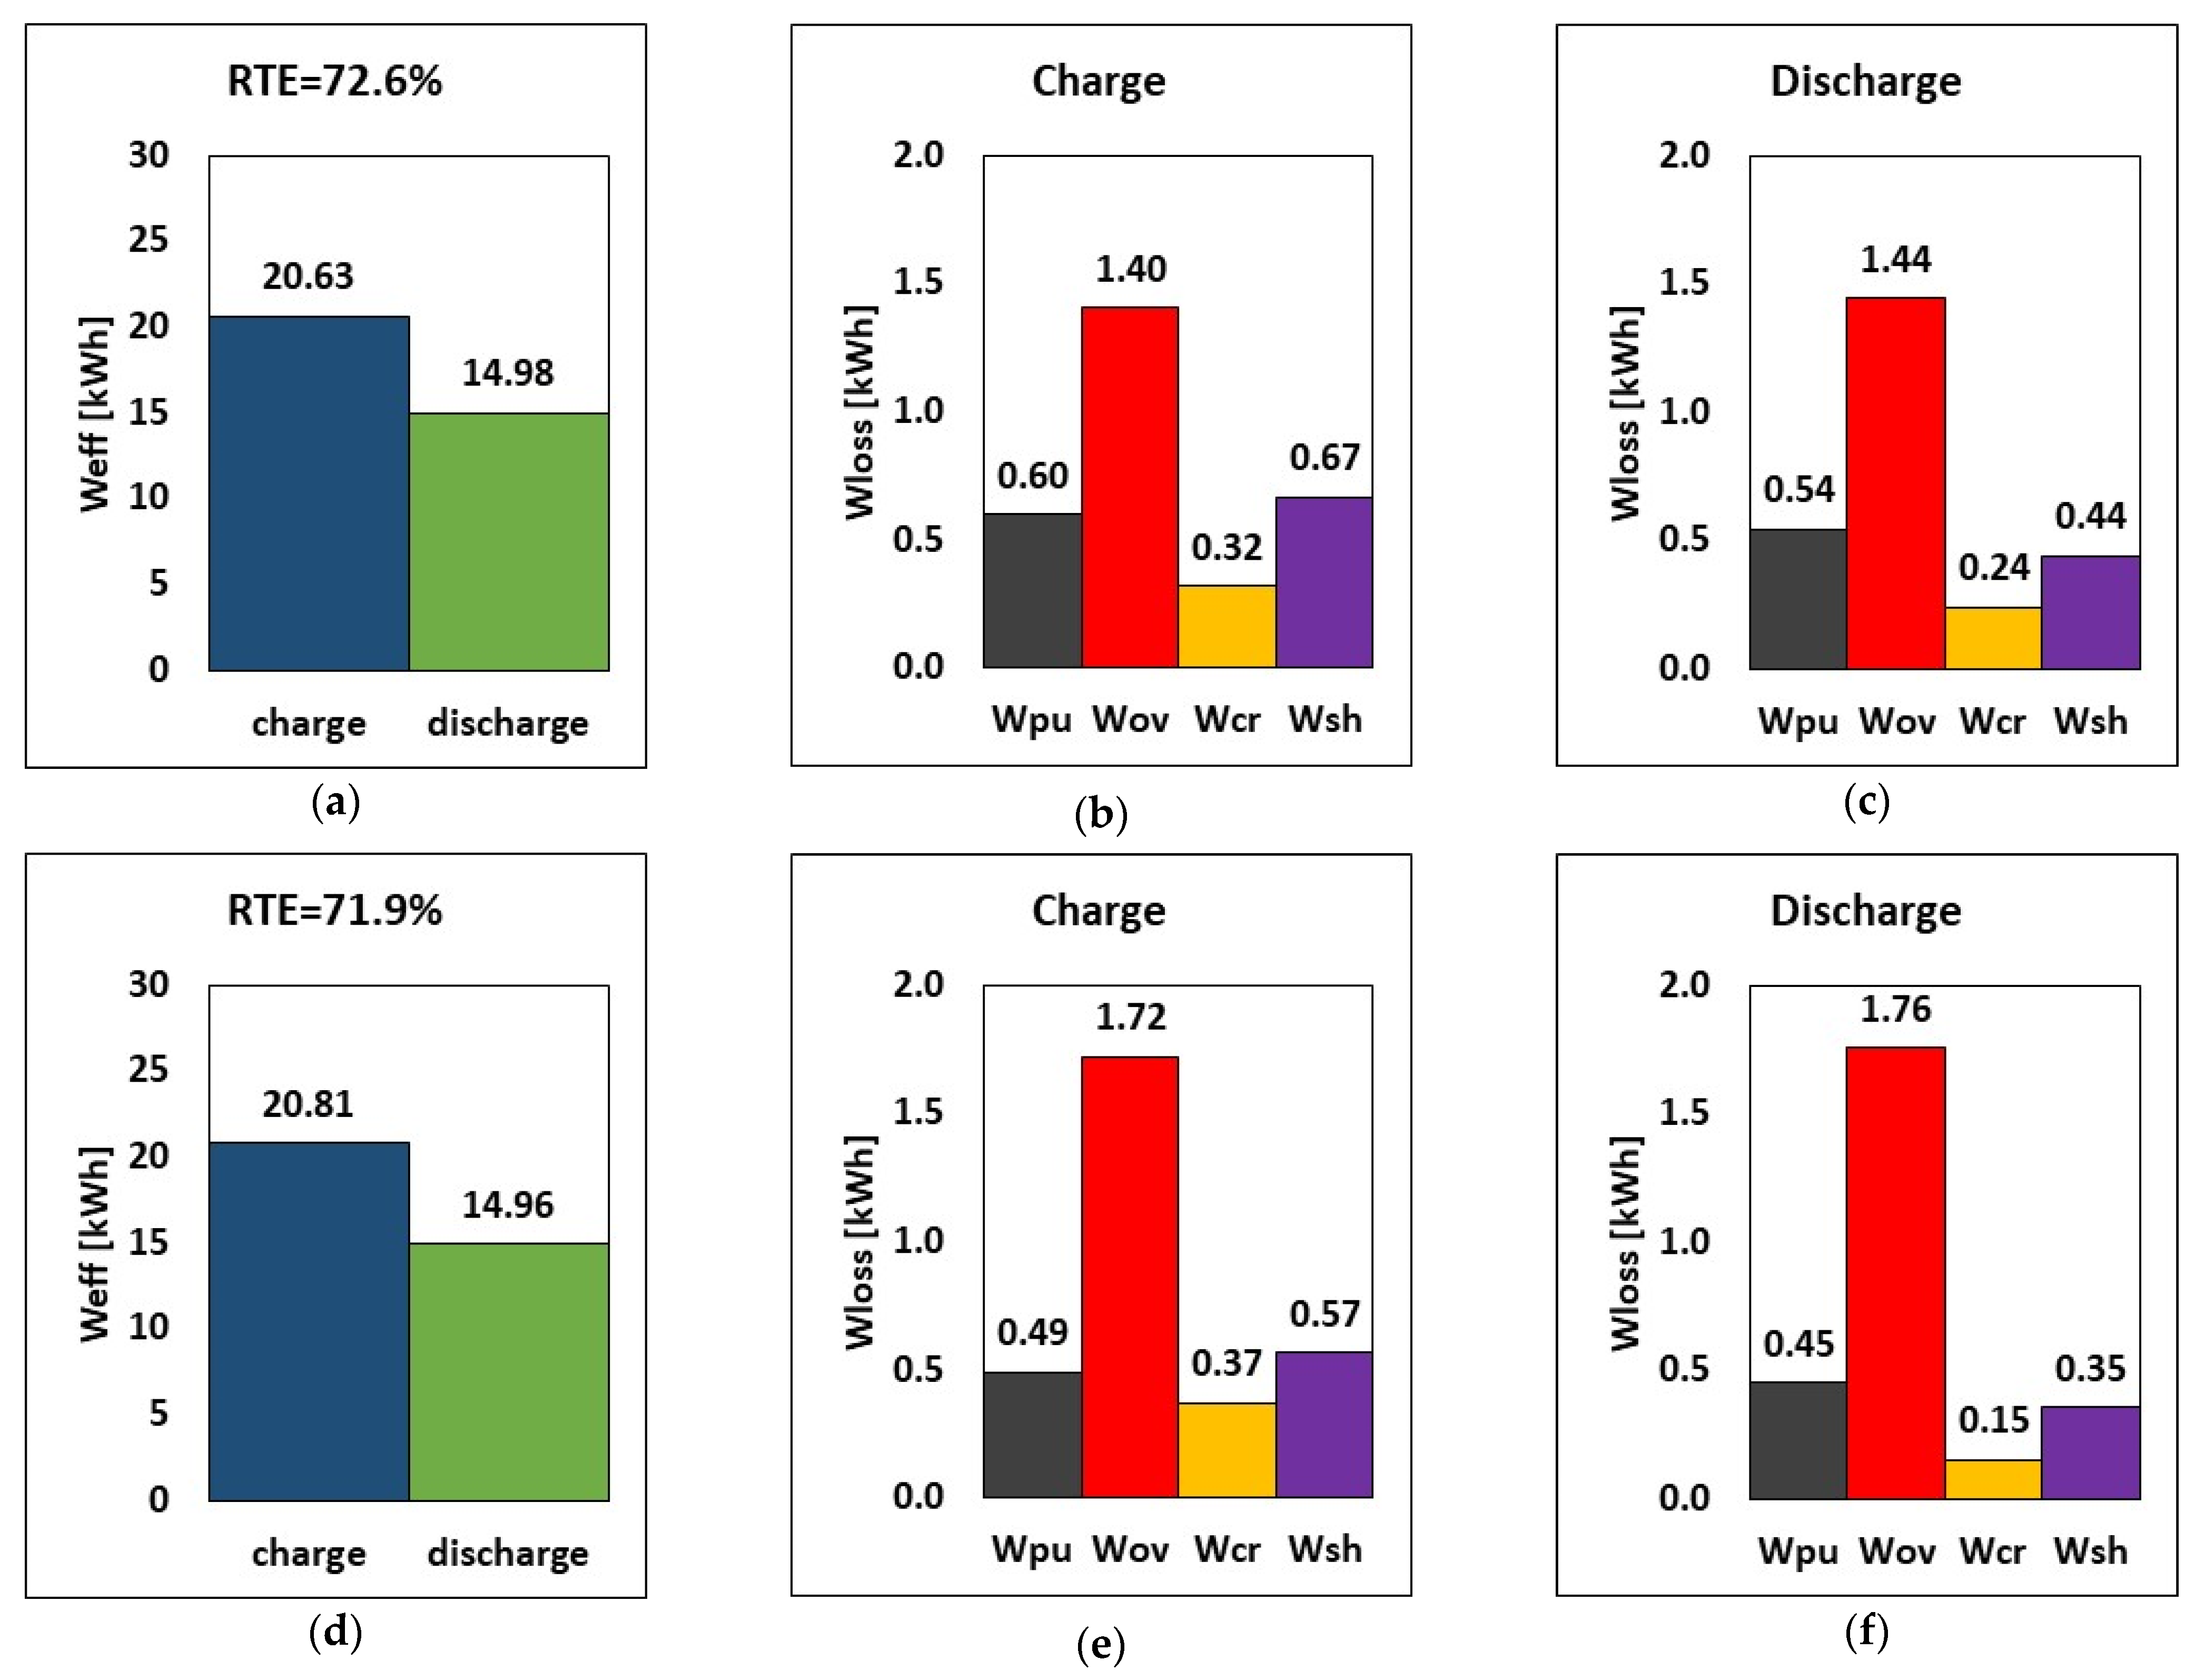
The variation of the internal resistance affects overpotential, shunt currents, charge and discharge power, stored energy, and RTE. Consequently, a comparison between design internal resistance and halved internal resistance is carried out. Practically, it is supposed to have a suitable chemistry or an improved electrode design for the halving of the internal resistance. The results are reported in Figure 8. By halving the internal resistance (rin), the energy required during charge dropped by approximately 3.5% (from 20.63 to 19.90 kWh), while during discharge, the amount of energy released increased by around 4.5% in relative terms. In addition, the overpotential loss was lowered by 50%, which can invariably increase the stack’s RTE. The RTE increased from 72.6% to 78.7% (a relative increase of 8.3%), suggesting that decreasing internal resistance while maintaining the same operating parameters and tank volume would increase overall performance.
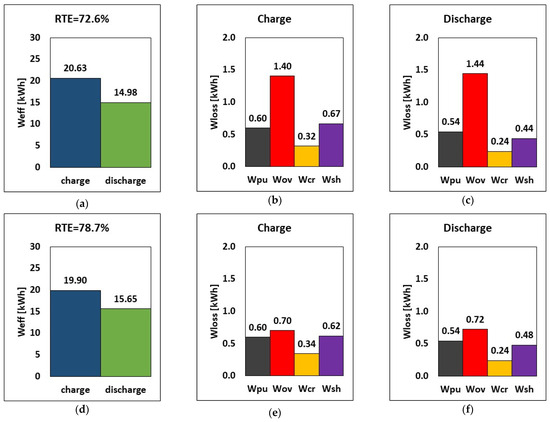
Figure 8.
RTE, energy, and breakdown of energy losses during charge and discharge at different internal resistances (a–c) default rin and (d–f) half rin at current, flow rate and E–P ratio of 51.5 A, 20.5 L/min and 6 h.
Figure 9 illustrates the effect of limiting the current density on the system performance by assuming, as an example, a hypothetical increase in species diffusivity by an order of magnitude, which results in an increase in the mass transfer coefficient (and thus in limiting current density) by a factor of 102/3 according to the scaling between the Sherwood number and the Schmidt number at the laminar boundary layer within the electrode fibers [37]. The limiting current density was therefore increased by a factor of 102/3 for two cases with stack currents of 51.5 A and 62.5 A, respectively, using the same tank volume of 516 L (energy-to-power = 6 h) and a flow rate of 20.5 L/min.
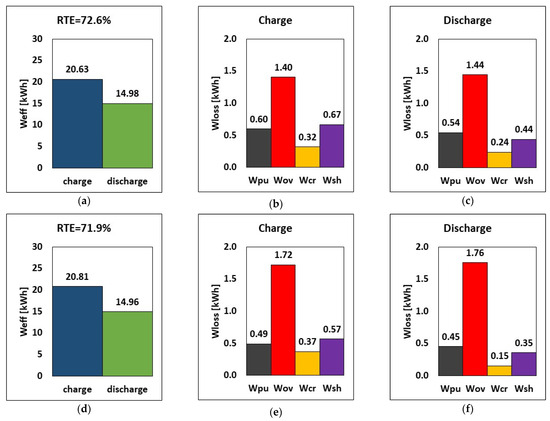
Figure 9.
RTE, energy, and breakdown of energy losses during charge and discharge for limiting the current window of ilim × 102/3 at current (a–c) 51.5 A and (d–f) 62.5 A based on flow rate and tank volume of 20.5 L/min and 516 L, respectively.
Increasing the stack current, as shown in Figure 9, increases energy during charging by 0.18 kWh while incurring little energy pump loss. However, the decline in RTE is due to the higher overpotential recorded during both charge and discharge.
5. Conclusions
A zero-dimensional multi-cell model for system-level analysis of energy loss was developed and implemented. The model considered the energy losses ranging from vanadium crossover and overpotential at the cell level, up to shunt currents at the stack level, and finally to pumping loss looking at the whole system, thus enabling a breakdown of loss contributions along with an evaluation of system energy, power, and round-trip efficiency. The model was verified at the system level with vanadium redox flow battery (VRFB) literature data on energy loss and round-trip efficiency (RTE), and an analysis of VRFB enabled the quantification of system performance and the effect of design and operational parameters. The selected VRFB is a kW size widely deployable in the case of domestic applications. The verification exhibits good agreement between simulated and experimental results.
The contribution of each loss to the total energy loss is also discussed. The main conclusions can be summarized as follows:
- The cell electrolyte distribution manifold diameter has a significant impact on minimizing shunt currents, despite a slight increase in pumping loss. As shown, the choice of a smaller manifold diameter (from 60 mm to 20 mm) increased the RTE by about 10% with a drastic drop in shunt current loss by factors of almost 4 and 3 during charge and discharge, respectively.
- The model can also be used to explore the impact of electrolyte properties on RFB performance, namely viscosity, density, standard potential, internal resistance, and limiting current density. The results indicate that, by synthesizing electrolytes with reduced viscosity (halved value) and density (water value), the RTE and energy output can be improved by ca. 3.6% and 2%, respectively.
- The results of sensitivity analyses show that tailoring the standard potential of the redox couple (from 0.6 V up to 1.37 V) would improve the overall performance of the stack (RTE increase of 31% compared to the lowest standard potential simulation), whereas cells with a lower internal resistance would considerably improve stack performance (the RTE changes from 72.6% to 78.7% by halving the internal resistance) due to reduced overpotential and increased energy release.
- It was possible to study the effect of current and flow rate on the system energy performance; the higher the charge/discharge current, the greater the power and, to some extent, the RTE. When the charge/discharge current is increased from 30 A to 50 A, the electrolyte can release up to about 3% more energy.
Overall, the developed modeling framework proved to be an effective tool for modeling RFB performance at the system level. This allows for the upscaling of data related to a single cell for an understanding of the key factors influencing battery performance as a whole. The analysis shows that the model can investigate the effect of different design conditions and guide the user to the selection of the operational scenario that achieves the desired target, such as a nominal power or the maximization of the RTE. In addition, the breakdown of energy losses is an effective tool to understand which phenomenon has the largest impact, thus complementing the characterization of the design point. Such a framework could be also adopted to investigate different RFB chemistries.
Supplementary Materials
The following supporting information can be downloaded at: https://www.mdpi.com/article/10.3390/en17215324/s1 [38,39], Figure S1: Polarisation behaviour of a single cell in the VRFB system for different SOCs at (a) Q = 10 L/min (i.e., q = 6.94 × 10⁻⁵ m3/(m2s)), (b) Q = 20 L/min (i.e., q = 1.39 × 10⁻⁴ m3/(m2s)) from experimental data (symbols) and linear fit (solid lines); Figure S2: RFB scheme and resistor network arrangement for the evaluation of shunt currents; Figure S3: Geometrical representation of the i-th cell in RFB stack and its resistor network analogue; Figure S4: Exploiting symmetry to simplify the network; Figure S5: Final resistor network with equivalent resistances; Figure S6: Current direction in cell stack and Kirchhoff laws for current distribution applied to the i-th cell; Figure S7: Pressure drop data of the 40-cells stack considered by Trovò et al. [18] for the negative electrolyte of VRFB at SOC = 50%, for which µ = 0.055 Pa·s and = 1350 kg/m3; Figure S8: Pump hydraulic efficiency ηhy as a function of flowrate as reported by Trovò et al. [18], along with the interpolating function used in this report; Figure S9: Pumping power losses as a function of flow rate at SOC = 50% in both positive and negative compartments for the 40-cells stack VRFB system investigated by Trovò et al. [18].
Author Contributions
I.S.A.: software, investigation, data curation, formal analysis, visualization, writing—original draft; F.B.: investigation, writing—original draft; P.P.: conceptualization, validation, supervision, funding acquisition; A.B. (Aldo Bischi): conceptualization, methodology, validation, investigation, writing—review and editing, supervision, project administration, funding acquisition; A.B. (Antonio Bertei): conceptualization, methodology, software, formal analysis, validation, investigation, writing—review and editing, supervision. All authors have read and agreed to the published version of the manuscript.
Funding
This research has received funding from the European Union’s Horizon 2020 research and innovation program under Grant Agreement No 875565 (CompBat: Computer-aided design for next-generation flow batteries. Project website: https://compbat.aalto.fi/, accessed on 1 August 2024). The content in this document represents the views of the authors, and the European Commission has no liability with respect to the content. The authors acknowledge funding from the European Union NextGenerationEU—National Recovery and Resilience Plan (NRRP)—MISSION 4 COMPONENT 2, INVESTMENT N. 1.3—CUP N. I53C22001450006, within the project Network 4 Energy Sustainable Transition (NEST). This manuscript reflects only the authors’ views and opinions; neither the European Union nor the European Commission can be considered responsible for them.
Data Availability Statement
Part of the data used for this publication can be found in “Report on multi-cells stack system and shunt current distribution modelling”, belonging to the CompBat EU project, https://doi.org/10.3030/875565.
Conflicts of Interest
The authors declare no conflicts of interest. The funders had no role in the design of the study; in the collection, analyses, or interpretation of data; in the writing of the manuscript; or in the decision to publish the results.
Nomenclature
| Abbreviations | Definition | Unit |
| Acell | Area of a cell | m2 |
| c | Concentration of active species | mol/m3 |
| ESS | Energy storage system | |
| E° | Standard potential | V |
| E–P | Energy-to-power-ratio | s |
| I | Current | A |
| i | Current density | A/m2 |
| Jcr | Crossover flux | mol/(m2s) |
| N | Number of the cells | - |
| OCV | Open circuit voltage | V |
| P | Power | W |
| Q | Flow rate | m3/s |
| rin | Internal area-specific resistance | Ω·m2 |
| R | Universal gas constant | K) |
| RFBs | Redox flow batteries | |
| RTE | Round-trip efficiency | |
| SOC | State of charge | |
| T | Operating temperature | K |
| Vtank | Volume of the tank | m3 |
| VRFBs | Vanadium redox flow batteries | |
| Wcr | Crossover loss | Wh |
| Wov | Overpotential loss | Wh |
| Wsh | Shunt current loss | Wh |
| Wpu | Pumping loss | Wh |
| Greek letters | ||
| Δp | Pressure drops | Pa |
| φtot | Stack potential | V |
| ρ | Density | kg/m3 |
| μ | Viscosity | |
| Subscripts and superscripts | ||
| eff | Effective | |
| el | Electric | |
| i | Cell i | |
| out | Outlet | |
| pu | Pumps | |
| tot | Total | |
References
- Ma, Z.; Jia, M.; Koltermann, L.; Blömeke, A.; De Doncker, R.W.; Li, W.; Uwe Sauer, D. Review on grid-tied modular battery energy storage systems: Configuration classifications, control advances, and performance evaluations. J. Energy Storage 2023, 74, 109272. [Google Scholar] [CrossRef]
- Sánchez-Díez, E.; Ventosa, E.; Guarnieri, M.; Trovò, A.; Flox, C.; Marcilla, R.; Soavi, F.; Mazur, P.; Aranzabe, E.; Ferret, R. Redox flow batteries: Status and perspective towards sustainable stationary energy storage. J. Power Sources 2021, 481, 228804. [Google Scholar] [CrossRef]
- Li, X.; Zhang, H.; Mai, Z.; Zhang, H.; Vankelecom, I. Ion exchange membranes for vanadium redox flow battery (VRB) applications. Energy Environ. Sci. 2011, 4, 1147. [Google Scholar] [CrossRef]
- Sun, C.; Negro, E.; Nale, A.; Pagot, G.; Vezzù, K.; Zawodzinski, T.; Meda, L.; Gambaro, G.; Di Noto, V. An efficient barrier toward vanadium crossover in redox flow batteries: The bilayer [Nafion/(WO3)x] hybrid inorganic-organic membrane. Electrochim. Acta 2021, 378, 138133. [Google Scholar] [CrossRef]
- Yu, V.; Chen, D. Dynamic model of a vanadium redox flow battery for system performance control. J. Sol. Energy Eng. 2013, 136, 021005. [Google Scholar] [CrossRef]
- König, S.; Suriyah, M.R.; Leibfried, T. Model based examination on influence of stack series connection and pipe diameters on efficiency of vanadium redox flow batteries under consideration of shunt currents. J. Power Sources 2015, 281, 272–284. [Google Scholar] [CrossRef]
- Baccino, F.; Marinelli, M.; Nørgård, P.; Silvestro, F. Experimental testing procedures and dynamic model validation for vanadium redox flow battery storage system. J. Power Sources 2014, 254, 277–286. [Google Scholar] [CrossRef]
- Qiu, X.; Nguyen, T.A.; Guggenberger, J.D.; Crow, M.L.; Elmore, A.C. A field validated model of a vanadium redox flow battery for microgrids. IEEE Trans. Smart Grid 2014, 5, 1592–1601. [Google Scholar] [CrossRef]
- Ye, Q.; Hu, J.; Cheng, P.; Ma, Z. Design trade-offs among shunt current, pumping loss and compactness in the piping system of a multi-stack vanadium flow battery. J. Power Sources 2015, 296, 352–364. [Google Scholar] [CrossRef]
- D’Agostino, R.; Baumann, L.; Damiano, A.; Boggasch, E. A Vanadium-Redox-Flow-Battery Model for Evaluation of Distributed Storage Implementation in Residential Energy Systems. IEEE Trans. Energy Convers. 2015, 30, 421–430. [Google Scholar] [CrossRef]
- Bhattacharjee, A.; Saha, H. Design and experimental validation of a generalised electrical equivalent model of Vanadium Redox Flow Battery for interfacing with renewable energy sources. J. Energy Storage 2017, 13, 220–232. [Google Scholar] [CrossRef]
- Chen, Y.S.; Ho, S.Y.; Chou, H.W.; Wei, H.J. Modeling the effect of shunt current on the charge transfer efficiency of an all-vanadium redox flow battery. J. Power Sources 2018, 390, 168–175. [Google Scholar] [CrossRef]
- Barelli, L.; Bidini, G.; Ciupageanu, D.A.; De Giorgi, M.; Gallorini, F.; Mazzoni, C.; Ottaviano, P.A.; Pelosi, D. Electrical performance analysis of an innovative Vanadium redox flow battery stack for enhanced power density applications. In Proceedings of the 2021 IEEE Madrid PowerTech, PowerTech 2021, Madrid, Spain, 27 June–2 July 2021. [Google Scholar]
- Turker, B.; Arroyo Klein, S.; Hammer, E.M.; Lenz, B.; Komsiyska, L. Modeling a vanadium redox flow battery system for large scale applications. Energy Convers. Manag. 2013, 66, 26–32. [Google Scholar] [CrossRef]
- Xu, Q.; Zhao, T.S.; Zhang, C. Effects of SOC-dependent electrolyte viscosity on performance of vanadium redox flow batteries. Appl. Energy 2014, 130, 139–147. [Google Scholar] [CrossRef]
- Delgado, N.M.; Monteiro, R.; Abdollahzadeh, M.; Ribeirinha, P.; Bentien, A.; Mendes, A. 2D-dynamic phenomenological modelling of vanadium redox flow batteries—Analysis of the mass transport related overpotentials. J. Power Sources 2020, 480, 229142. [Google Scholar] [CrossRef]
- Delgado, N.M.; Monteiro, R.; Cruz, J.; Bentien, A.; Mendes, A. Shunt currents in vanadium redox flow batteries—A parametric and optimization study. Electrochim. Acta 2022, 403, 139667. [Google Scholar] [CrossRef]
- Trovò, A.; Picano, F.; Guarnieri, M. Comparison of energy losses in a 9 kW vanadium redox flow battery. J. Power Sources 2019, 440, 227144. [Google Scholar] [CrossRef]
- Tang, A.; McCann, J.; Bao, J.; Skyllas-Kazacos, M. Investigation of the effect of shunt current on battery efficiency and stack temperature in vanadium redox flow battery. J. Power Sources 2013, 242, 349–356. [Google Scholar] [CrossRef]
- Moro, F.; Trovò, A.; Bortolin, S.; Del Col, D.; Guarnieri, M. An alternative low-loss stack topology for vanadium redox flow battery: Comparative assessment. J. Power Sources 2017, 340, 229–241. [Google Scholar] [CrossRef]
- Vinco, J.H.; da Cunha Domingos, A.E.E.; Espinosa, D.C.R.; Tenório, J.A.S.; Baltazar, M.D.P.G. Unfolding the Vanadium Redox Flow Batteries: An indeep perspective on its components and current operation challenges. J. Energy Storage 2021, 43, 103180. [Google Scholar] [CrossRef]
- Pugach, M.; Kondratenko, M.; Briola, S.; Bischi, A. Zero dimensional dynamic model of vanadium redox flow battery cell incorporating all modes of vanadium ions crossover. Appl. Energy 2018, 226, 560–569. [Google Scholar] [CrossRef]
- Skyllas-Kazacos, M.; Menictas, C. Vanadium Redox Flow Batteries. Encycl. Energy Storage 2022, 3, 407–422. [Google Scholar]
- Sumitomo Electric. Redox Flow Battery—Long Duration Energy Storage (LDES). Available online: https://sumitomoelectric.com/sites/default/files/2022-12/download_documents/rfb_e.pdf (accessed on 30 September 2024).
- Shigematsu, T. Recent development trends of redox flow batteries. SEI Tech. Rev. 2019, 85, 5–11. [Google Scholar]
- After 6 Years, the 100MW/400MWH Redox Flow Battery Storage Project in Dalian is Connected to the Grid. 2022. Available online: http://en.cnesa.org/new-blog/2022/7/19/after-6-years-the-100mw400mwh-redox-flow-battery-storage-project-in-dalian-is-connected-to-the-grid (accessed on 30 September 2024).
- Trovò, A.; Saccardo, A.; Giorno, M.; Guarnieri, M. Thermal modeling of industrial-scale vanadium redox flow batteries in high-current operations. J. Power Sources 2019, 424, 204. [Google Scholar] [CrossRef]
- Sun, C.N.; Delnick, F.M.; Baggetto, L.; Veith, G.M.; Zawodzinski, T.A. Hydrogen evolution at the negative electrode of the all-vanadium redox flow batteries. J. Power Sources 2014, 248, 560. [Google Scholar] [CrossRef]
- Shah, A.A.; Al-Fetlawi, H.; Walsh, F.C. Dynamic modelling of hydrogen evolution effects in the all-vanadium redox flow battery. Electrochim. Acta 2010, 55, 1125. [Google Scholar] [CrossRef]
- Yuan, C.; Xing, F.; Zheng, Q.; Zhang, H.; Li, X.; Ma, X. Factor analysis of the uniformity of the transfer current density in vanadium flow battery by an improved three-dimensional transient model. Energy 2020, 194, 116839. [Google Scholar] [CrossRef]
- Skyllas-Kazacos, M.; McCann, J.; Li, Y.; Bao, J.; Tang, A. The Mechanism and Modelling of Shunt Current in the Vanadium Redox Flow Battery. ChemistrySelect 2016, 1, 2249–2256. [Google Scholar] [CrossRef]
- Akpolat, A.N.; Dursun, E.; Siano, P. Inverter-based modeling and energy efficiency analysis of off-grid hybrid power system in distributed generation. Comput. Electr. Eng. 2021, 96, 107476. [Google Scholar] [CrossRef]
- Gundlapalli, R.; Jayanti, S. Comparative study of kilowatt-scale vanadium redox flow battery stacks designed with serpentine flow fields and split manifolds. Batteries 2021, 7, 30. [Google Scholar] [CrossRef]
- Pugach, M.; Parsegov, S.; Gryazina, E.; Bischi, A. Output feedback control of electrolyte flow rate for Vanadium Redox Flow Batteries. J. Power Sources 2020, 455, 227916. [Google Scholar] [CrossRef]
- Pugach, M.; Vyshinsky, V.; Bischi, A. Energy efficiency analysis for a kilo-watt class vanadium redox flow battery system. Appl. Energy 2019, 253, 113533. [Google Scholar] [CrossRef]
- Chakrabarti, M.H.; Dryfe, R.A.W.; Roberts, E.P.L. Evaluation of electrolytes for redox flow battery applications. Electrochim. Acta 2007, 52, 2189–2195. [Google Scholar] [CrossRef]
- Mauri, R. Transport Phenomena in Multiphase Flow; Springer: Berlin/Heidelberg, Germany, 2015; p. 290. ISBN 978-3-319-15793-1. [Google Scholar]
- Choi, C.; Kim, S.; Kim, R.; Choi, Y.; Kim, S.; Jung, H.; Yang, J.; Kim, H. A review of vanadium electrolytes for vanadium redox flow batteries. Renew. Sustain. Energy Rev. 2017, 69, 263–274. [Google Scholar] [CrossRef]
- Stevenson, K.; Pugach, M.; Kurilovich, A.; Ryzhov, A.; Gonzalez, G. Deliverable 3.1: Report on General Isothermal Cell Modelling. Computer Aided Design for Next Generation Flow Batteries (CompBat) Project, Grant Agreement ID: 875565. 2021. Available online: https://compbat.aalto.fi/wp-content/uploads/2023/06/CompBat-deliverable-D3.1.pdf (accessed on 1 August 2024).
Disclaimer/Publisher’s Note: The statements, opinions and data contained in all publications are solely those of the individual author(s) and contributor(s) and not of MDPI and/or the editor(s). MDPI and/or the editor(s) disclaim responsibility for any injury to people or property resulting from any ideas, methods, instructions or products referred to in the content. |
© 2024 by the authors. Licensee MDPI, Basel, Switzerland. This article is an open access article distributed under the terms and conditions of the Creative Commons Attribution (CC BY) license (https://creativecommons.org/licenses/by/4.0/).

