Article

Towards Sustainable Energy Solutions: Evaluating the Impact of Floating PV Systems in Reducing Water Evaporation and Enhancing Energy Production in Northern Cyprus

by
Youssef Kassem
1,2,3,4,*,
Hüseyin Gökçekuş
2,3 and
Rifat Gökçekuş
2
1
Department of Mechanical Engineering, Engineering Faculty, Near East University, via Mersin 10, Nicosia 99138, Cyprus
2
Department of Civil Engineering, Civil and Environmental Engineering Faculty, Near East University, via Mersin 10, Nicosia 99138, Cyprus
3
Energy, Environment, and Water Research Center, Near East University, via Mersin 10, Nicosia 99138, Cyprus
4
Research Center for Science, Technology, and Engineering (BILTEM), Near East University, via Mersin 10, Nicosia 99138, Cyprus
*
Author to whom correspondence should be addressed.
Energies 2024, 17(21), 5300; https://doi.org/10.3390/en17215300
Submission received: 6 September 2024 / Revised: 5 October 2024 / Accepted: 16 October 2024 / Published: 25 October 2024

Abstract

:
Floating photovoltaic systems (FPVSs) are gaining popularity, especially in countries with high population density and abundant solar energy resources. FPVSs provide a variety of advantages, particularly in situations where land is limited. Therefore, the main objective of the study is to evaluate the solar energy potential and investigate the techno-economic perspective of FPVSs at 15 water reservoirs in Northern Cyprus for the first time. Due to the solar radiation variations, solar power generation is uncertain; therefore, precise characterization is required to manage the grid effectively. In this paper, four distribution functions (Johnson SB, pert, Phased Bi-Weibull, and Kumaraswamy) are newly introduced to analyze the characteristics of solar irradiation, expressed by global horizontal irradiation (GHI), at the selected sites. These distribution functions are compared with common distribution functions to assess their suitability. The results demonstrated that the proposed distribution functions, with the exception of Phased Bi-Weibull, outperform the common distribution regarding fitting GHI distribution. Moreover, this work aims to evaluate the effects of floating photovoltaic systems on water evaporation rates at 15 reservoirs. To this aim, five methods were used to estimate the rate of water evaporation based on weather data. Different scenarios of covering the reservoir’s surface with an FPVS were studied and discussed. The findings showed that annual savings at 100% coverage can reach 6.21 × 10⁵ m3 compared to 0 m3 without PV panels. Finally, technical and economic assessment of FPVSs with various scales, floating assemblies, and PV technologies was conducted to determine the optimal system. The results revealed that a floating structure (North orientation-tilt 6°) and bifacial panels produced the maximum performance for the proposed FPVSs at the selected sites. Consequently, it is observed that the percentage of reduction in electricity production from fossil fuel can be varied from 10.19% to 47.21% at 75% FPV occupancy.

1. Introduction

Carbon emissions and the global need for energy are rising, causing environmental degradation [1]. By 2030, Sustainable Development Goal 7 (SDG 7) seeks to address ecological deterioration by achieving the goal of supplying “affordable, reliable, sustainable, and modern energy for all” [2]. Consequently, scientific researchers have been exploring alternative sources of renewable energy to replace fossil fuel-based generation systems [3].
Solar-powered photovoltaic (PV) systems play a critical role in achieving sustainable energy solutions for global growth [4]. In general, traditional PV systems are typically installed on land or rooftops. To address land scarcity, researchers propose installing solar-powered plants on artificial water bodies, known as floating photovoltaic (FPV) systems [5]. FPVSs increase solar panel power production through sunlight reflection and also conserve water and improve water quality [6,7]. According to Charles Lawrence Kamuyu [8], solar panels installed on water can produce up to 10% more electricity than those on land. Also, Choi et al. [9] found that floating solar PV systems have a higher generation efficiency of over 10% compared to ground-mounted systems. FPV systems can reduce water evaporation and save water [10]. Moreover, synergies can be developed by combining pumped-storage power systems with integrated FPV modules, which can minimize energy imbalance [11]. Additionally, Pringle et al. [12] proposed using water areas for floating solar energy and aquaculture to efficiently utilize water for food and energy generation. Furthermore, FPVSs can be combined with solar water heating systems for mining applications [13]. Also, FPV power plant pontoons can be used for compressed air energy storage [14]. In addition, combining FPV with wind and wave energy has been shown to improve power systems by smoothing power output [15]. Furthermore, several recent studies have examined various aspects of floating solar power systems, including total costs, environmental impacts, and energy generation efficiency. For instance, Durkovic and Djurisic [16] studied a large-scale FFV system in Montenegro. They found that there was a significant reduction in CO2 emissions of about 83.42 ktons/year as well as water evaporation savings of about 5.41 million m3/year. Sunny et al. [17] explored the potential installation of FPV systems in Bangladesh. The results indicated that the value of energy yield was 1564 kWh/kW.
Furthermore, implementing FPV technologies requires meticulous consideration of economic viability and environmental sustainability according to the previous studies. For instance, Ranjbaran et al. [18] studied various aspects of FPV systems, including design, power generation, evaporation reduction, economic assessment, and CO2 emission reduction. The authors concluded that FPV is a promising solution for generating clean energy, reducing water issues, and reducing CO2 emissions. Micheli et al. [19] estimated the economic viability of FPVSs and compared them with land-based PV systems in Europe. The results showed that the energy yields from FPVs can be up to 2% higher than land-based PV systems, particularly in the Mediterranean region. Islam et al. [20] investigated the techno-economic feasibility of a 10 MW FPV in Malaysia. The results indicated that the proposed system was economically feasible and significantly reduced carbon emissions by 11.135 ktons/year. Islam et al. [21] studied the feasibility of the FPV system at Hatirjheel Lake in Dhaka, Bangladesh. The results indicated that the development of FPVs is economically feasible, as it provides about 12.5% of the total domestic energy demand in addition to reducing environmental pollution by 6685 tons per year. Fereshtehpour et al. [22] evaluated the FPV systems’ performance in Iran. The results showed that installing an FPV system produces between 194 GWh and 257 GWh annually, as well as significantly reducing CO2 emissions, with a value of 118 ktons/year.

1.1. Energy Situation in Northern Cyprus

The demand for energy in Northern Cyprus is increasing due to the growth of educational institutions and the growth of the economy across various sectors. Generally, the rising need for energy in Northern Cyprus and the absence of local resources to meet the demands of the country represent two significant challenges for the energy sector. According to Akçaba and Eminer [23], insufficient generation and high demand contribute to shortages in Northern Cyprus, particularly in the summer. Approximately 30% and 20% of energy is used by the commercial and residential sectors, respectively [
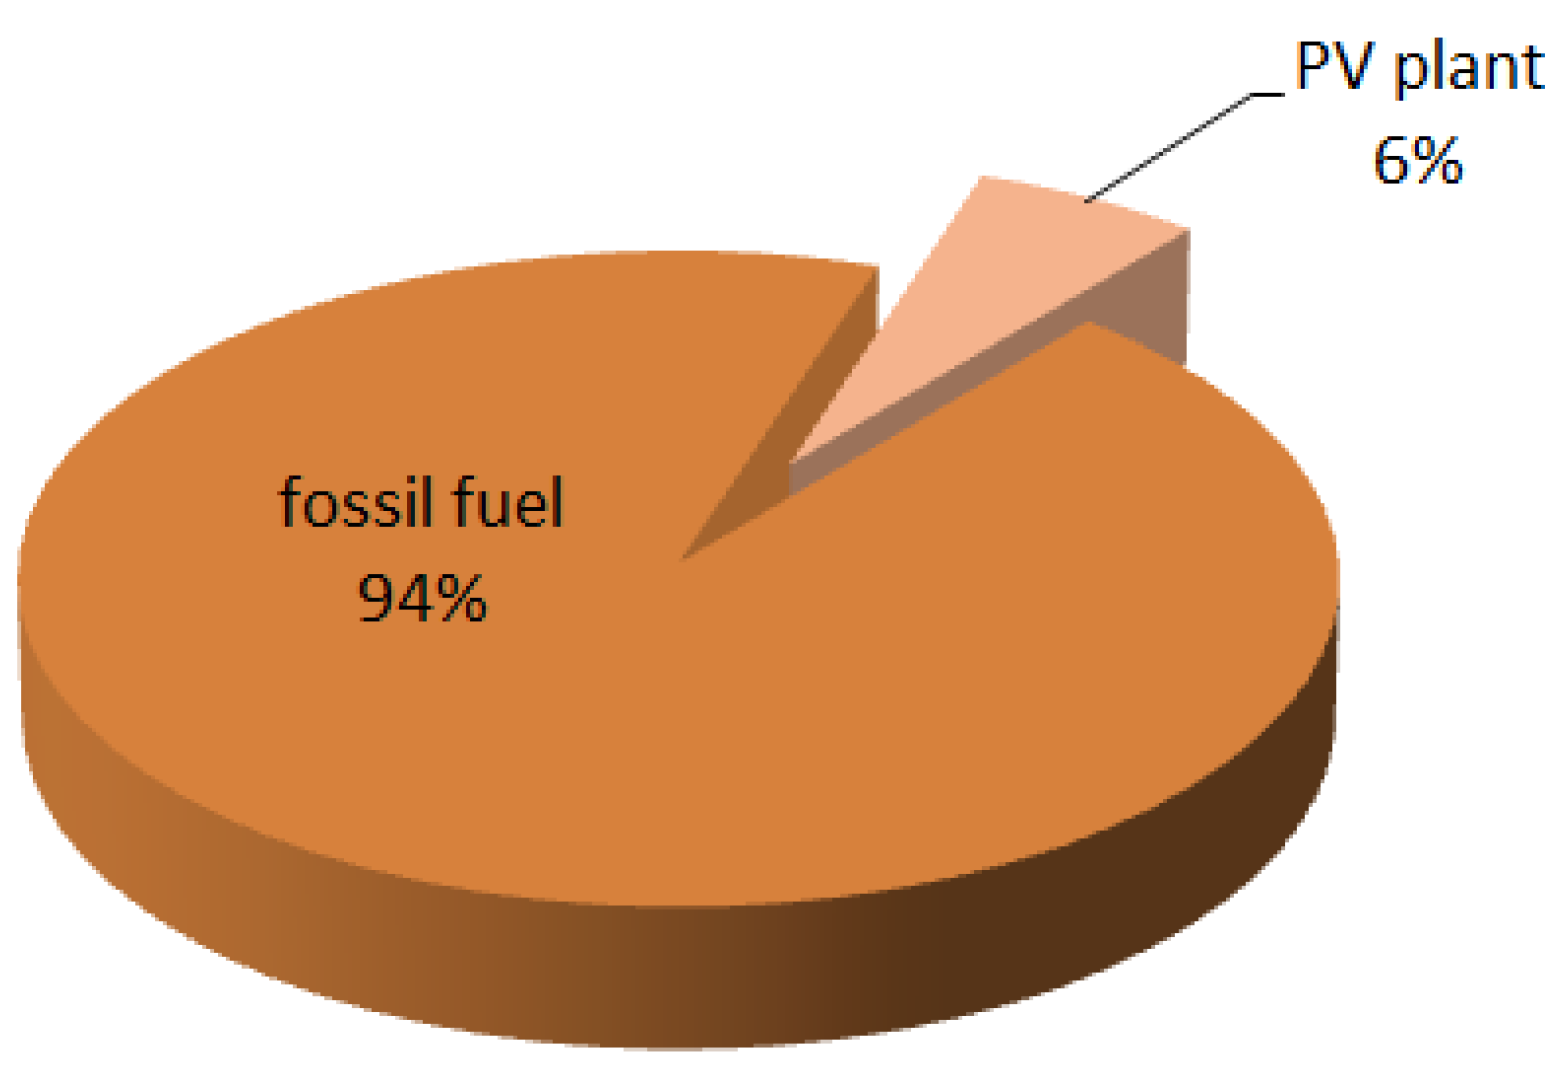
23]. Moreover, according to the Cyprus Turkish Electricity Authority (KIB-TEK), 94% of the power generated in Cyprus is generated from fossil fuels, with the remaining 6% sourced from renewable sources, as shown in Figure 1 [24].
Given the rise of commercial, educational, and industrial sectors, as well as the increasing cost of imported fuel and the resulting greenhouse gas emissions, the country’s decision makers have made it their primary goal to provide clean, affordable, and sustainable energy. The country’s main priorities now include implementing energy efficiency measures as well as pursuing the development of renewable energy sources, particularly solar energy.
Northern Cyprus is blessed to have an average of 320 sunny days per year and 5.6 to 6.13 kWh/m2/day of direct solar radiation according to the Global Solar Atlas [25]. The annual global solar irradiation on a horizontal surface varies between 5 kW/m2/day and 5.38 kW/m2.
Moreover, based on the annual value of global horizontal irradiation and direct irradiation, the solar resources in Northern Cyprus can be categorized as good and excellent according to Prăvălie et al. [26]. The electricity generation capacity from solar plants can be within the range of 4.481–4.826 kWh/kWp/day.
Generally, most of the residences use solar water heaters in Cyprus. According to Refs. [27,28], solar water heating systems are installed on the rooftops of more than 90% of residences. Moreover, five solar PV plants can be found in Northern Cyprus: (1) a 1.3 MW solar PV power plant installation in 2011 in the Serhatköy region [29]; (2) a 1 MW PV power plant installation in 2015 at Middle East Technical University Northern Cyprus Campus; (3) a 1.3 MW PV power plant installation in 2016 at Cyprus International University; (4) a 50 kW PV system installation in 2017 at KKTCell Main Building; and (5) a 120 kW PV system installation in 2018 at Levent College [30,31]. Furthermore, KIB-TEK allows customers to produce and export excess energy from the PV system to the utility grid using a net metering system [32]. However, this mechanism has faced challenges with the increase in PV installations because the grid system remains isolated in Northern Cyprus [32]. According to the renewable energy board (Yek-Kurulu), single-phase grid-connected customers can currently install up to 5 kW of PV systems, while three-phase grid-connected customers can install up to 8 kW of PV systems [32]. Additionally, based on estimates from Kib-Tek and Yek-Kurulu, the total power generated by photovoltaic power plants in Northern Cyprus is around 74.3 MW [24,33].
Further, several researchers [34,35,36,37,38,39,40,41,42,43,44,45,46,47,48,49,50,51,52,53,54,55,56,57,58,59,60,61,62] have examined the solar energy potential and the technological-economic viability of photovoltaic systems in various Northern Cyprus regions, as tabulated in Table S1 of the Supplementary Materials. The following can be concluded:
  • Installing a solar power plant could solve the country’s energy crisis and reduce the dependency on fossil fuel.
  • Using a photovoltaic system can achieve sustainable development goals by generating useful renewable energy without harming the land and the environment.
  • According to the authors’ review, only one study has compared the technical and economic aspects of a 1 MW grid-connected land-based PV plant and a floating PV system.

1.2. Water Resources in Northern Cyprus

Cyprus’s water resources can be divided into four categories [63]: groundwater resources (75.5%), semi-perennial low-discharge springs (0.3%), various surface-water reservoirs (20.4%), and a limited number of small-scale desalination plants (3.8%). Moreover, Yildiz and Çakmak [64] reported that the total capacity of surface and groundwater in the region is approximately 173.18 MCM (million m3). Additionally, there are three small private desalination plants located in Bafra, Eastern Mediterranean University, and Girne, with capacities of 730,000, 365,000, and 545,000 m3/year, respectively [65]. The Güzelyurt basin’s groundwater, situated in the western part of Northern Cyprus, is found under unconfined aquifer conditions [66,67,68]. The major aquifer in the region consists of quaternary deposits, while the pre-quaternary formations serve as the basement and impermeable or semi-permeable aquifer boundaries [61,62]. Previous research indicates a decline in groundwater levels by 45–50 m below sea level [69,70,71]. The Güzelyurt aquifer supplies water for irrigation as well as other purposes in the region and hosts some 920 mm3 as its water reserve [72]. Typically, the economy of Northern Cyprus benefits considerably from the major agricultural activities primarily located in the Güzelyurt district [67,68,69]. The general agricultural production in the region is affected by the uneven distribution of rainfall and the water resource situation, including water deficit for agriculture [73]. In addition, 75% of all water withdrawals are for crop irrigation, and since the 1970s there has been a problem with drought and salinization [68,69,70,72,74]. Moreover, the region of Güzelyurt, which has plenty of farming areas, is now experiencing acute water problems, because of which water supplies have dropped drastically and produce quality has been reduced [75,76,77]. Furthermore, agriculture is divided into rain-fed and irrigated systems, producing various crops, with almond the most-grown crop [70,76].

1.3. Literature Review Related to Floating PV System (FPVS)

Due to a decrease in the cost of producing photovoltaic (PV) modules, solar energy has grown dramatically over the last decade [78]. PV modules are now being installed directly on water using FPVSs, a developing application compared to the conventional rooftop and ground-mounted alternatives [79,80]. According to Skoploki and Palyvos [81], the primary benefit of PV is the cooling impact of water on solar cells, which enhances energy conversion efficiency. In fact, according to Nisar et al. [82], Choi et al. [83], and Boduch et al. [84], solar water panels can produce up to 11% more electricity compared to those on the ground. Previous studies have indicated that the temperatures of floating PV modules were 2–10 °C lower than those of ground PV modules [84,85,86,87]. The capacity to scale the system from microwatts to megawatts, the abundance of water for cleaning the modules, the decrease in the development of algae caused by the modules’ shade, and the decrease in natural evaporation in water reservoirs are additional benefits of this renewable energy technology [80].
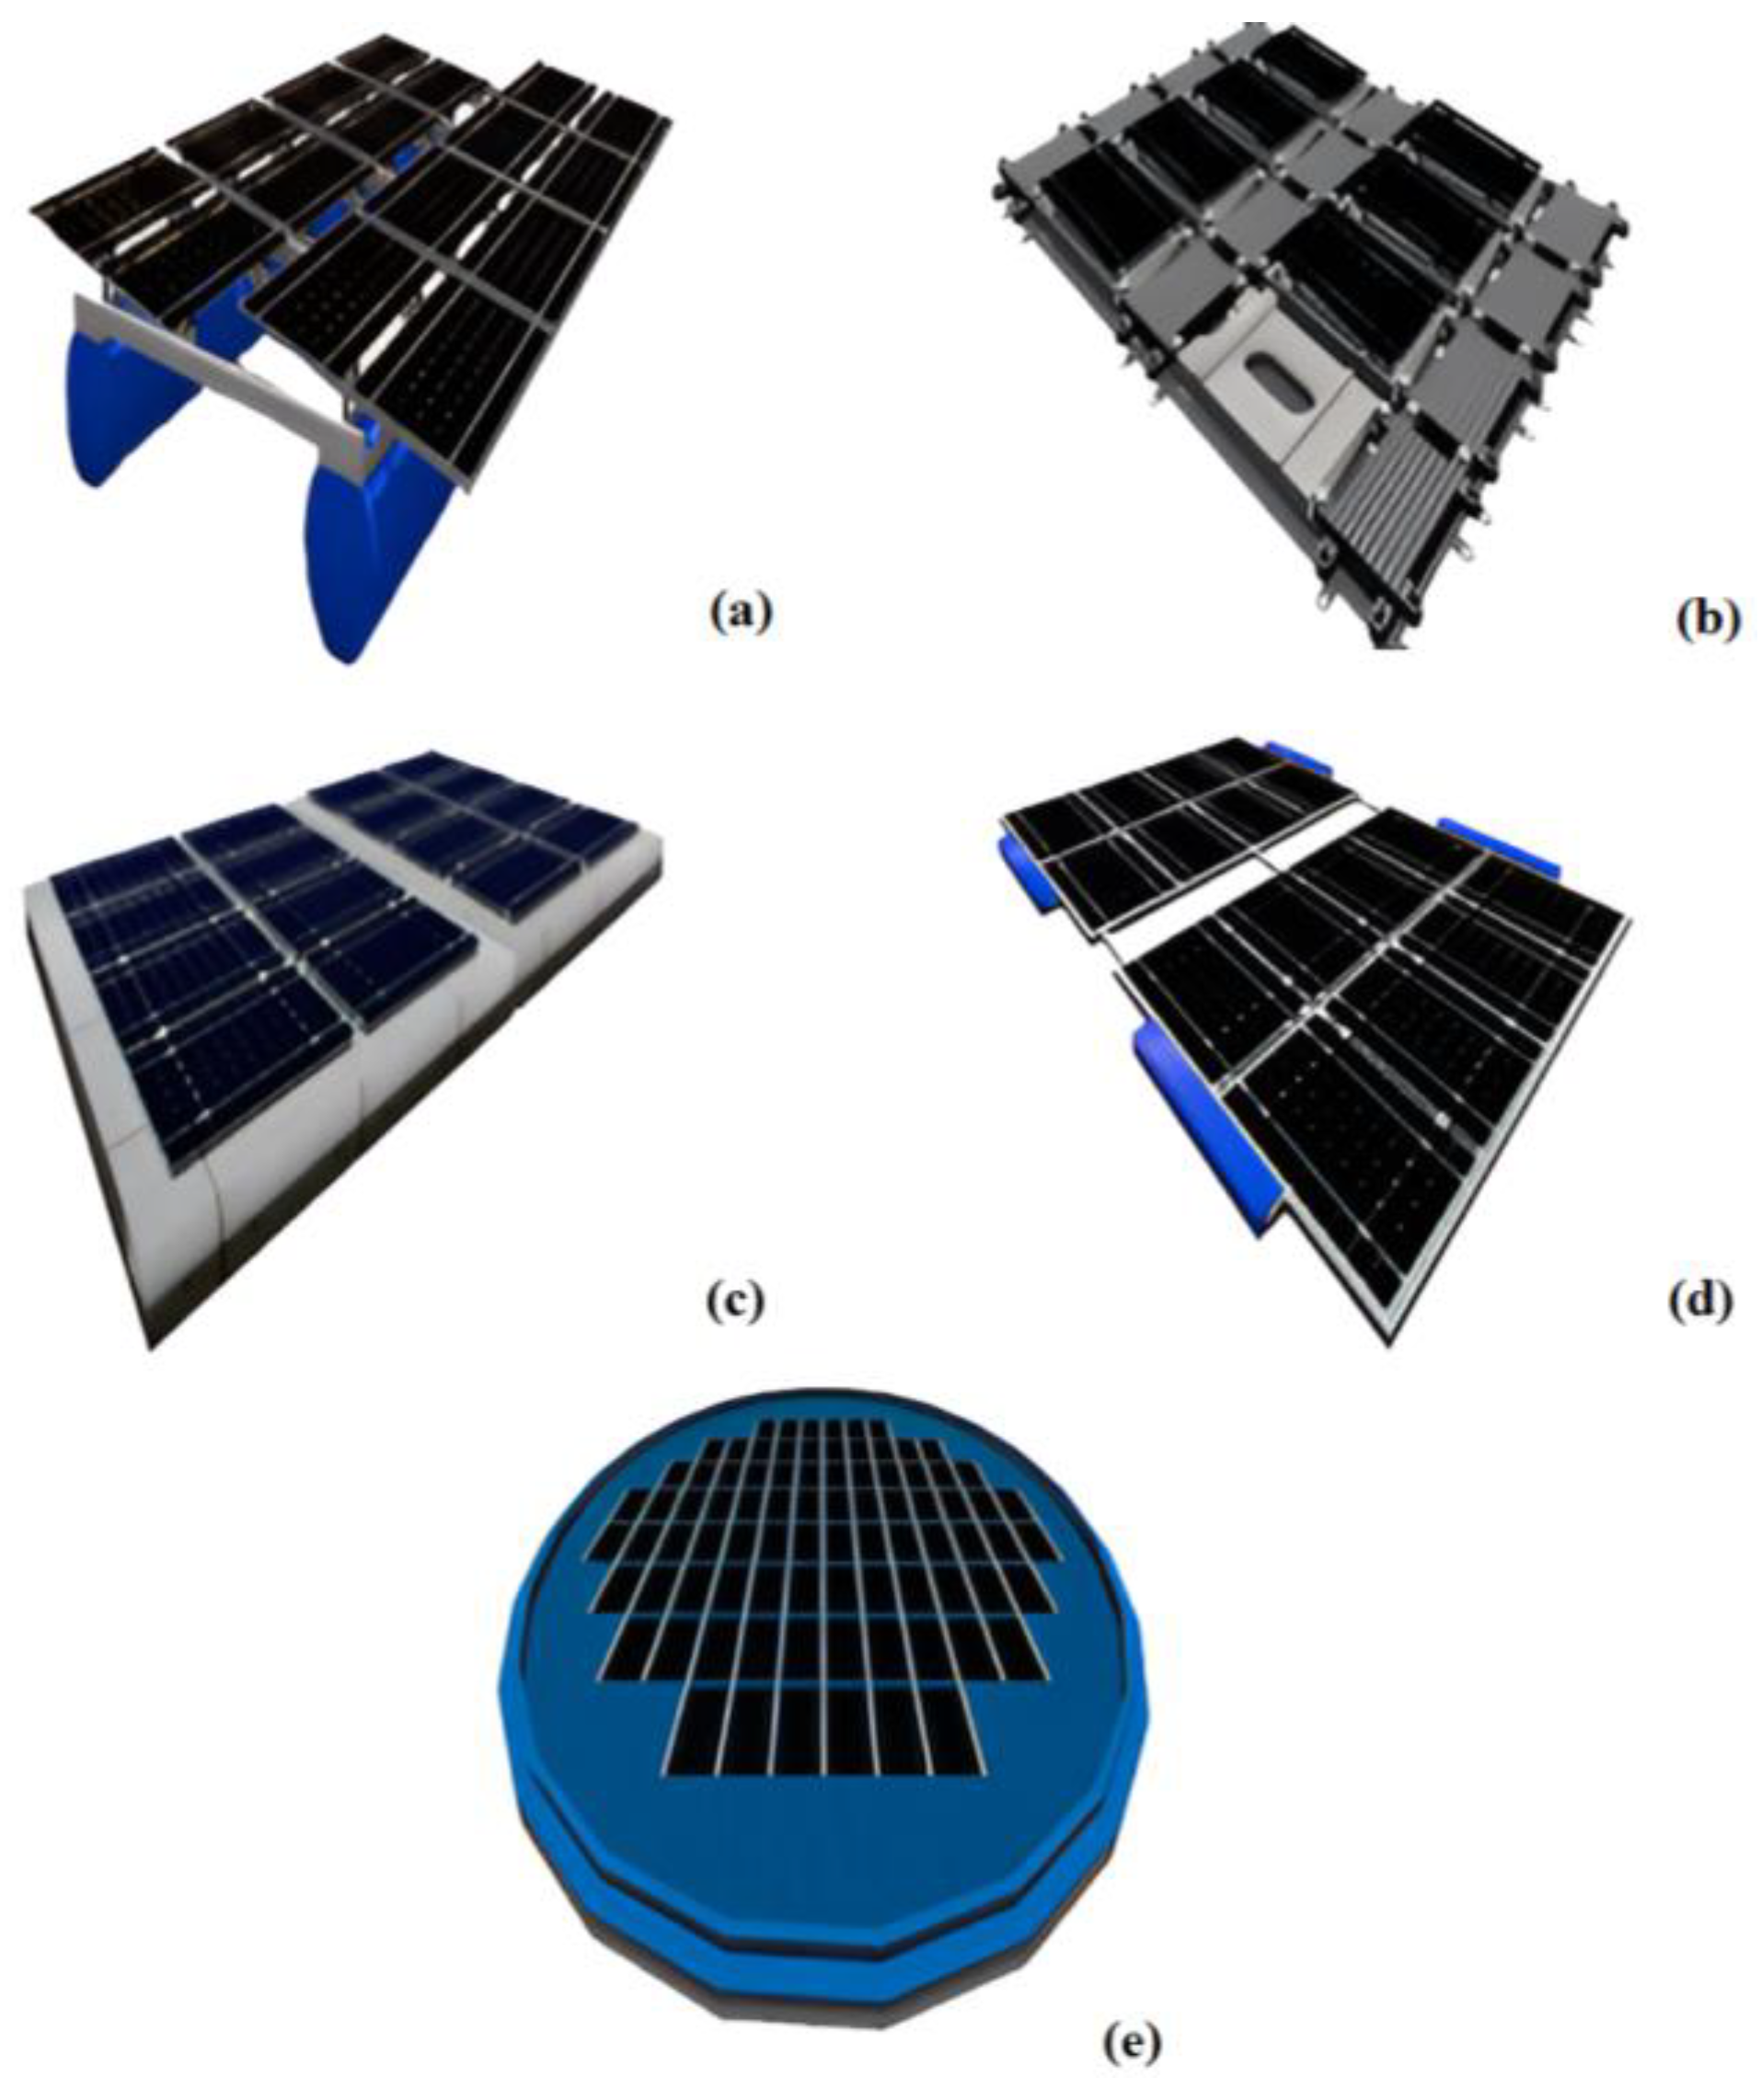
The major components of FPVSs essentially consist of PV panels with their supporting electrical components and body construction that involves floats, mooring systems, waterproof materials, and buoyant force [88,89,90]. Figure 2 depicts a typical standalone FPV system.
PV panels typically stand on an array of connected floats that are moored and fastened. These floats are usually made of lightweight materials such as Polyethylene (mostly HDPE), Hydro-Elastic Membranes, Polystyrene foam, Ferrocements, or Fiber-Reinforced Plastics with Aluminum or Steel rafts [90,93,94]. Meanwhile, electrical wires wrapped in thermoset rubber or polyurethane are commonly employed in FPVSs because of their water resistance [95]. Rubber matting protects the structure in the end [90]. Moreover, based on the previous studies [90,95,96], Figure 3 displays five common FPVS structure categories.
Generally, the geological and climatic conditions of the site should be taken into account during installation according to Ramanan et al. [90]. Other factors to consider during installation include array size, tilt angle, and solar panel type [90]. According to Ravichandran et al. [100], the surface area and depth of the water body affect the size of the matrix, which affects the ability of the floating structure to anchor and moor as well as its production capacity. The type of solar panels used must be carefully studied, as they have an important impact on the economic viability of FPVSs [101,102,103,104].
Furthermore, concrete block anchors were placed on the bottom of the water body and connected to the areas surrounding the PV array by mooring lines [105,106]. In addition, an effective anchoring system should be implemented to keep the floating structure stable in the presence of wind currents [100]. According to Ravichandran et al. [100], the floating structure is moored based on the reservoir’s soil type and water level. Furthermore, based on the position of the FPV array, anchoring on the reservoir embankment or a nearby land area can be accomplished [100,104,105]. The mooring lines allow the FPV system to continue to adapt and stabilize in the presence of strong winds and waves. The flexible mooring lines are used to increase the flexibility of the FPV hull during water level deviation during monsoon and empty reservoir conditions [106]. Generally, underwater cables are employed to transport the electrical energy generated by the PV array mounted on the floating structure to the substation. In order to prevent resistance losses, the inverter station is either on the ground or on a separate floating platform following the PV array, depending on the distance between the substation and the FPV array [107].

1.4. Research Gap, Motivations, and Contributions

Previous research indicates that FPV devices can help lower surface evaporation in water bodies and are a viable alternative to conventional energy generation techniques. There is a lack of academic literature on FPV uses in Northern Cyprus; hence, further research is desperately needed in this field.
The present investigation provides a useful framework for assessing the various benefits of utilizing FPV systems, considering their unique features. To achieve this aim, the main contributions of this study are outlined as follows.
  • An extensive and comprehensive analysis of solar energy potential is necessary as solar energy is intended as Northern Cyprus’s main source of electricity. In this work, the distribution of solar radiation is analyzed using several distribution functions. In this paper, Johnson SB distribution, pert distribution, Phased Bi-Weibull distribution, and Kumaraswamy distribution are newly introduced to fit the solar radiation data, expressed by global solar radiation, and the probability distribution of Northern Cyprus sites. The selected distribution models are compared with the common distribution functions, including Normal, Gamma, Generalized Extreme Value, Log-normal, Weibull, and Logistics. Parameter estimation for distributions is conducted with the maximum likelihood estimation method.
  • Investigating the utilization of floating photovoltaic systems for producing clean energy and minimizing water evaporation loss from selected water reservoirs is the main objective of the current paper. In this work, evaporation was estimated using Priestley–Taylor, deBruin–Keijman, Makkink, Penman–Monteith, Mass transfer, and Hamon methods. Various scenarios for using an FPVS to cover the reservoir’s surface were investigated.
  • The design process of various scales of floating photovoltaic systems and their technical and economic assessment were carried out in this paper, considering that there is no analysis addressing the application of this technology under the conditions of Northern Cyprus. Various floating assemblies and PV technologies were examined in order to determine the most suitable option.
The results will assist future FPV project developers and supporters in estimating the energy generated and identifying the most suitable places to implement this innovative technology to reduce electricity and water shortages in Northern Cyprus.

2. Materials and Methods

2.1. Case Study of Floating Solar PV Plant in Northern Cyprus

Cyprus, with a 9251 km2 area, is the third largest island in the Mediterranean. It is situated in the Mediterranean’s eastern region. Cyprus has a typical Mediterranean climate, meaning there are distinct seasons and substantial variations in temperature, precipitation, and overall weather patterns. The weather is hot and dry in summer, from mid-May to mid-September, and wet and volatile from early November to mid-March, divided by two brief seasons, spring and fall. During the summer, the island experiences high temperatures caused by the Great Continent passing over Central Asia. It is regarded as a season of high temperatures and nearly clear skies. In winter, Cyprus is subject to a few successive depressions that cross the Mediterranean Sea from west to east between Eurasia and the African belt. These depressions cause atmospheric disturbances, leading to the most rainfall of the year taking place in this season. The average annual rainfall is about 500 mm, with the maximum and minimum values of 759 mm and 182 mm recorded in 1968–1969 and 1972–1973, respectively. Generally, dams are constructed across rivers to recharge aquifers, store surface runoff for use during future dry seasons, and occasionally minimize hazardous flooding. Northern Cyprus experienced a shortage of water in 1960, which prompted the construction of dams. After realizing the importance of dams and ponds as renewable water resources, Turkey’s State Hydraulic Works (DSI) rapidly established 41 reservoirs with varying capacities. Of these, eighteen were constructed for irrigation and twenty-three were constructed to prevent temporary streams from going straight into the Mediterranean Sea. Consequently, these infrastructures have accomplished the tasks for which they were designed. Over 27 million cubic meters (MCM) of water are taken annually from 28 streams in Northern Cyprus. About 43 MCM of water is also released annually by ten seasonal streams that rise from the Troodos Mountains in Southern Cyprus. However, these rivers’ upstream portions have since been dammed in the southern part of the island. In this study, 15 reservoirs/dams have been considered to assess the potential of floating photovoltaic installations. Table 1 tabulates the selected reservoirs/dams, and Figure 4 shows the locations of the selected reservoirs/dams. Moreover, Figure S1 in the Supplementary Materials presents the long-term averages of solar resources, including Global Horizontal Irradiation (GHI), Global Tilted Irradiation (GTI), Direct Normal Irradiation (DNI), Air temperature (AT), and Global Tilted Irradiation (GTI) as generated by Global Solar Atlas, the principal phenomena of climate that determine solar power generation.

2.2. Dataset

Generally, it is challenging to design solar energy systems in a location where the measurement data are not available. The number of stations and data is limited in Northern Cyprus. It is considered a major problem for working with the observed rainfall records. Thus, it is necessary to evaluate the satellite climate dataset products with locally measured data before utilizing these products as sources for evaluating the performance of solar energy systems at the specific location. In the literature, NASA, a leader in space technology, provides model-based and satellite products via its network of satellite systems, which are essential for addressing agricultural needs, increasing energy efficiency, and studying climate dynamics [108,109,110]. The NASA Earth Science Research Program’s POWER (Prediction of Worldwide Energy Resources) Project made this possible. With a spatial resolution of 0.5° × 0.5°, this worldwide grid offers solar and meteorological data from 1981 onward and covers areas without surface meteorological observations [108,109,110]. The POWER data from NASA is freely available to users. Several studies evaluated the potential for solar energy in different regions using the NASA database [111,112,113]. Moreover, a robust association between observed data (GHI) and the NASA database was shown by Belkilani et al. [114], Gairaa and Bakelli [115], and Tahir et al. [116]. Moreover, solar radiation can be considered constant over large areas, ignoring the effect of cloud absorption, according to Bhatia [117].
Therefore, the daily meteorological data for the selected dams were collected between 1982 and 2023 using the NASA POWER dataset. For estimating water losses, the NASA power dataset was employed. A selection of reservoirs and dams’ evaporation was determined using daily temperature, solar radiation, relative humidity, and wind speed data spanning from 1982 to 2023.

2.3. Solar Radiation

2.3.1. Characteristics of Global Solar Irradiation (GHI)

The most fundamental factor that determines the feasible locations for solar power plants and floating PV systems is GHI [118,119]. According to Castillo et al. [120], GHI can be defined as the solar energy (light) arriving at the surface of the Earth every year. Therefore, finding the location of SI is essential for evaluating the performance of the system [121]. According to Gökmener et al. [122], Suh and Brownson [123], and Wang [124], PV systems give better performances in sunnier regions.
Moreover, examining the characteristics of GHI data using probability distribution functions, such as the gamma, Weibull, and normal distribution functions, is crucial for evaluating PV systems. Several probability distribution functions (PDFs) have been utilized for analyzing the characteristics of SI, as shown in Table 2.
In this study, Johnson SB distribution, pert distribution, Phased Bi-Weibull distribution, and Kumaraswamy distribution are proposed for the first time for solar irradiation modeling. The proposed PDF and common distribution functions for analyzing the characteristics of SI at the selected reservoir/dam in Northern Cyprus are listed in Table 3.

2.3.2. Solar Radiation Incident on Tilted Surface

Solar radiation generally consists of radiant radiation as well as diffuse radiation and radiation reflected from the Earth [133,134]. Because few measurement tools and methods are available, it is rare to find data recorded on an inclined surface [133,135]. In general, there are three aspects to the incident global solar irradiance ( G S I i ) on an inclined surface [133,134]:
(i)
The beam component from direct sunlight on the tilted surface ( G b );
(ii)
The diffuse component ( G d );
(iii)
A reflected component that measures the radiation reflected from the ground to the tilted surface ( G r ).
It can be calculated using the following equation [134].
G S I i = G b + G d + G r
The incidence angle between the sun’s rays and the surface normal can be utilized for calculating the G b . It can be expressed as Equation (2) [134].
G b = G D H c o s θ z c o s θ i
where G D H is the direct horizontal solar irradiance, θ z is the solar zenital angle (Equation (3)), and θi is the incidence angle of the beam radiation on the tilted surface (Equation (4)).
c o s θ z = s i n ϕ · s i n δ + c o s ϕ · c o s δ · c o s ω
c o s θ i = s i n δ · s i n ϕ · c o s β s i n δ · c o s ϕ · s i n β · c o s α + c o s δ · c o s ϕ · c o s β                                                                         · c o s ω + c o s δ · c o s ϕ · s i n β · c o s α · c o s ω + c o s δ · s i n β · s i n α · s i n ω
where δ is the solar declination angle, ϕ is the location’s latitude, ω is the hour angle, β   is the surface tilt angle concerning the horizontal plane, and α is the surface azimuth angle.
The ω is computed using the local apparent time (LAT) [133,136]. Two modifications can be made to the normal time shown on a clock to accomplish this: The location’s longitude and the meridian that serves as the basis for standard time disagree, which leads to the first correction. For every degree of longitude variation, the adjustment has a magnitude of 4 min. The Earth’s orbit and rotational speed are prone to minute fluctuations, which is why the second correction is known as the equation of time (EOT). Equation (5) is used to calculate the ω [133].
ω = 15 12 L A T
L A T = s t a n d a r d   t i m e   c l o c k   t i m e ± 4 s t a n d a r d   t i m e   l o n g i t u d e l o n g i t u d e   o f   l o c a t i o n + E O T
E O T = 229.18 0.000075 + 0.001868 · c o s B 0.032077 · s i n 2 · B 0.014615 · c o s 2 · B 0.04089 · s i n 2 · B
B = 360 · N 1 365
where N is the day of the year.
It should be noted that the first correction for LAT applies to the eastern hemisphere in the negative sign, while the western hemisphere applies to the positive sign.

2.4. Electricity Generated by PV System

Energy generation represents one of the most important factors in the assessment of the floating PV system (FPV). Equation (9) is used to estimate the energy generation (EG) by the FPV system [80].
E G = i = 1 n η P V P S T C G G S T C 1 α p T C T S T C N t i
where η P V is the individual PV module derating factor, which accounts for wiring losses, inverter inefficiency, component failures, soiling, and aging, among other effects ( η P V = 0.85 here); P S T C is the nominal power of an individual PV module in terms of power output under Standard Test Conditions (STCs); G is the effective, or plane-of-array irradiance, i.e., the incident irradiance less self-shading losses; G S T C is the reference plane of-array (POA) irradiance under STC = 1 kW/m2; α p is the PV panel temperature coefficient of power; T C is the operating cell temperature; T S T C is the STC operating cell temperature = 25 °C; N is the number of installed PV modules; and t i is the duration of the n time steps considered.
Generally, the amount of EG is a function of the solar radiation, the system’s efficiency, and the total area of the panels. Moreover, the energy output is not much affected by variations in water level according to Ref. [137]. Moreover. According to Fereshtehpour et al. [22], the optimal angle of floating solar panels mounted on the water’s surface can be significantly affected by variations in water level. This kind of situation is avoided by anchoring floating solar panels using mooring systems. This technique allows the system to be kept facing the Sun while adjusting for variations in the water level. Furthermore, the minimum water depth in the range of water level changes should not be less than a suitable value for the seamless installation and functioning of the floating PV.

2.5. Water Depth

According to Gökmener et al. [122], the reservoir/dam must have enough water depth to support a floating photovoltaic system, as the water depth directly impacts the floating panels on the water’s surface. The setup and maintenance of the panels on the water’s surface are also significantly impacted by the depth of the water. Generally, the dead water level of each reservoir is subtracted from the water level to determine the water depth. The fluctuation of water levels, seasonal variations, and the inflow of debris floating around are all related to water depth. The recommended water depth for a reservoir can be 8–10 cm [138], 2 m [139], 1–5 m [140], and 2–4 m [141], based on previous scientific studies.

2.6. Local Average Wind Speed

In general, FPV system performance may be positively or negatively impacted by the average wind speed in the region. According to previous studies, wind speed is one of the most important variables that should be taken into account when designing floating photovoltaic systems [142,143]. Furthermore, Golroodbari et al. [143] concluded that wind speed can lower a PV module’s temperature, indicating that wind speed can significantly affect the production of power. Furthermore, high wind speeds have been shown to destabilize and harm floating photovoltaic (PV) systems [144,145]. Furthermore, Habib et al. [145] found that wind speed contributes to the removal of dust deposition from PV cell surfaces.

2.7. Evaporation Estimation

In general, the floating PV system protects the entire reservoir/dam’s surface from evaporation, not simply the area covered after installation. The decline in water evaporation can be attributed to two main reasons. The first reason, which directly affects the decrease in evaporation, is the reduction in air and water contact from the covered area [119]. The second reason is that the power plant’s construction changes the lake’s heat balance, resulting in a decrease in total evaporation across the lake’s surface and a colder temperature [119,146].
Thus, precise evaporation estimation is essential. Generally, air saturation deficit above the surface, wind speed, solar radiation reaching the water’s surface, air pressure, and the chemical makeup of the water are all significant factors that influence the process of estimating water evaporation, according to Fereshtehpour et al. [22].
In the literature, various methods are utilized to estimate water evaporation, such as Penman’s method and the bulk aerodynamic method. Table 4 lists the methods that can be used for estimating the evaporation rate (E).

2.8. Water Volume Lost by Evaporation Estimation

The daily average of the evaporation rate ( E d a i l y ) was used to compute the volume of water lost due to evaporation every day. Equation (10) is utilized to calculate the daily volume of water lost ( V D a i l y ) [149,151].
V D a i l y = E d a i l y × A
where A is the surface area of the reservoir/dam in km2.

2.9. Relation between Evaporation and Water Depth

According to Abd-Elhamid et al. [149] and Wong et al. [152], Equation (11) shows the relationship between water loss ( E   V ) and water depth ( d ). It is noticed that the evaporation rate increases exponentially at lower depths.
E   V = 10 0.8 0.48 d

2.10. Reduction in Evaporation

The floating photovoltaic system is one of the potential techniques that may be utilized to mitigate evaporation from open water surfaces [149,153]. In this research, a floating photovoltaic system was implemented to reduce the evaporation rate. This study investigated four different covering ratios of the reservoir/dam’s surface: 25%, 50%, 75%, and 100%. The surface area of the reservoir/dam is calculated with Google Maps. The water savings from installing a floating PV system are estimated using Equation (12) [149,154].
A n n u a l   w a t e r   s a v i n g = A n n u a l   e v a p o r a t i o n × P e r c e n t a g e   o f   i n s u l a t e d   a r e a × 0.70

2.11. Techno-Economic Analysis

In the literature, several methods and techniques are used for evaluating the performance of floating PV (FPV) systems. For instance, Islam et al. [21] evaluated the performance of a floating PV system in Bangladesh using PVsyst software. Febrian et al. [153] evaluated the performance of floating PV systems with various types of solar panels in Indonesia using RETScreen software. Yashas et al. [155] analyzed floating PV system technology to harness sustainable energy in India using RETScreen, PVWatts, and PVGIS. Semeskandeh et al. [156] utilized RETScreen software to evaluate the techno-economic-environmental feasibility performance of a 5 kW floating PV system and ground PV power plant in Iran. Mittal et al. [157] evaluated the feasibility performance of installing a floating PV system in India utilizing RETScreen software. Alhassan et al. [158] used RETScreen software to analyze the feasibility of a floating PV-Hydro hybrid plant system. Nagababu et al. [159] and Taye et al. [160] used mathematical modeling to calculate the performance of a floating PV system in India.
Based on the above, RETScreen, developed by Natural Resources Canada, has been a popular tool for assessing the viability of various renewable energy systems [57]. Its goal is to calculate the risk, costs, emissions reduction, financial viability, and energy production and savings of different renewable energy solutions. The National Aeronautics and Space Administration (NASA) database’s long-term monthly average meteorological data are used by the RETScreen to obtain meteorological data for a particular location. It is a quick and effective method for assessing the energy efficiency and environmental impact reduction of the renewable energy system. RETScreen software was utilized in this study to assess the grid-connected PV development’s techno-economic viability. The impact of the orientation angles on the output PV and capacity factor power (Equation (13)) was investigated. Furthermore, the economic feasibility indicators, including net present value (Equation (14)), Levelized cost of energy (Equation (15)), simple payback (Equation (16)), equity payback (Equation (17)), annual life cycle savings (Equation (18)), annual greenhouse gas (GHG) emissions (Equation (19)), GHG emission reduction cost (GHG-E-RC) (Equation (20)), and Benefit–cost ratio (B–C) (Equation (21)) were calculated using RETScreen software. It should be mentioned that the predicted values of these economic feasibility indicators were used to evaluate the floating PV project’s profitability and return on investment. Furthermore, RETScreen can estimate these indicators.
Capacity factor (CF)
C F = P o u t P × 8760
Net present value (NPV)
N P V = n = 0 N C n 1 + r n
Levelized cost of energy (LCOE)
L C O E = s u m   o f   c o s t   o v e r   l i f e t i m e s   o f   e l e c t r i c i t y   g e n e r a t e d   o v e r   t h e   l i f e t i m e
Simple payback (SP)
S P = C I G C e n e r + C c a p a + C R E + C G H G C o & M + C f u e l
Equity payback (EP)
E P = n = 0 N C n
Annual life cycle savings (ALCS)
A L C S = N P V 1 r 1 1 1 + r N
Annual GHG emission reduction (A-GHG)
A G H G = B a s e   c a s e   G H G   e m i s s i o n   f a c t o r P r o p o s e d   c a s e   G H G   e m i s s i o n   f a c t o r × E n d   u s e   e n e r g y   d e l i v e r e d  
GHG emission reduction cost (GHG-E-RC)
G H G E R C = A L C S G H G  
Benefit–cost ratio (B–C)
B C = N P V + 1 f d C 1 f d C
where P o u t is the energy generated per year,   P is installed capacity, N is the project life in years, C n is the after-tax cash flow in year n, and r is the discount rate. C is the total initial cost of the project, f d is the debt ratio, B is the total benefit of the project, I G is the incentives and grants, a n d     C e n e r is the annual energy savings or income. C c a p a is the annual capacity savings or income, C R E is the annual renewable energy (RE) production credit income, C G H G is the GHG reduction income, a n d     C o & M is the yearly operation and maintenance costs incurred by the clean energy project. C f u e l is the annual cost of fuel, which is zero for renewable projects, and G H G is the annual GHG emission reduction.

3. Results

3.1. Solar Energy Assessment

The average value of GHI, DNI, and AT of the chosen dams/reservoirs are within the range of 1875.8–1963.6 kWh/m2, 1964.4–2210.7 kWh/m2, and 19.2–20.5 °C, respectively, as shown by Table 1 and Figure S1 in the Supplementary Materials. Furthermore, Bhatia [117] claimed that solar radiation can be considered constant over large areas by ignoring the effect of cloud absorption. 
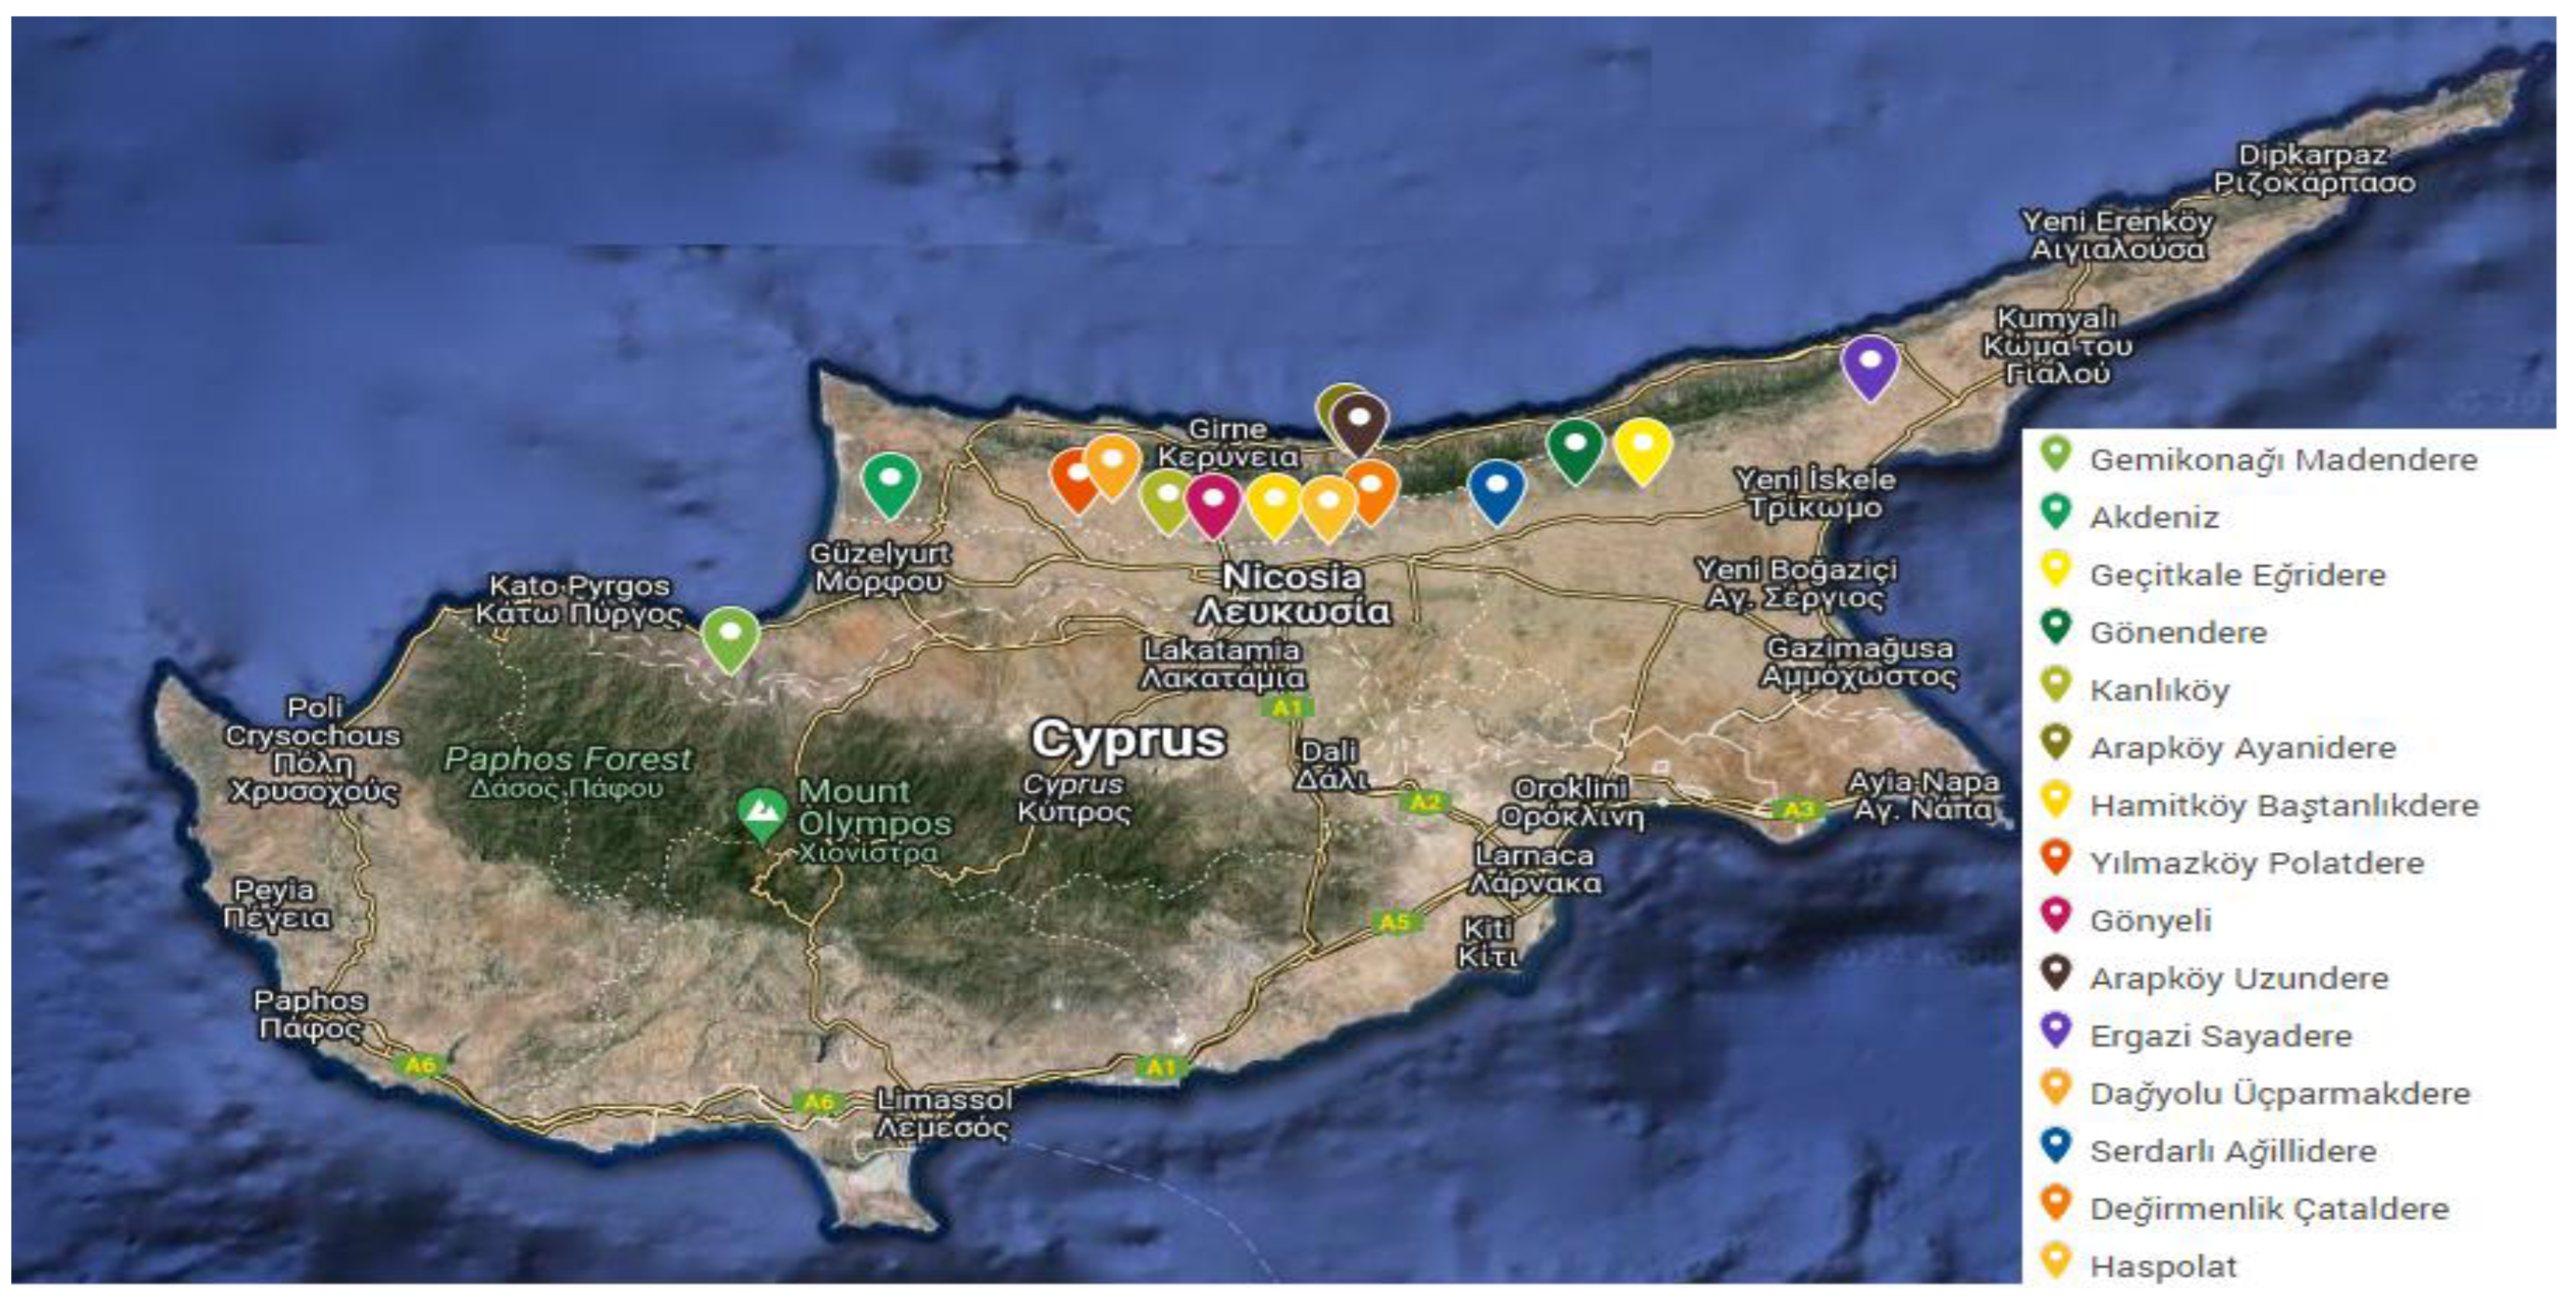
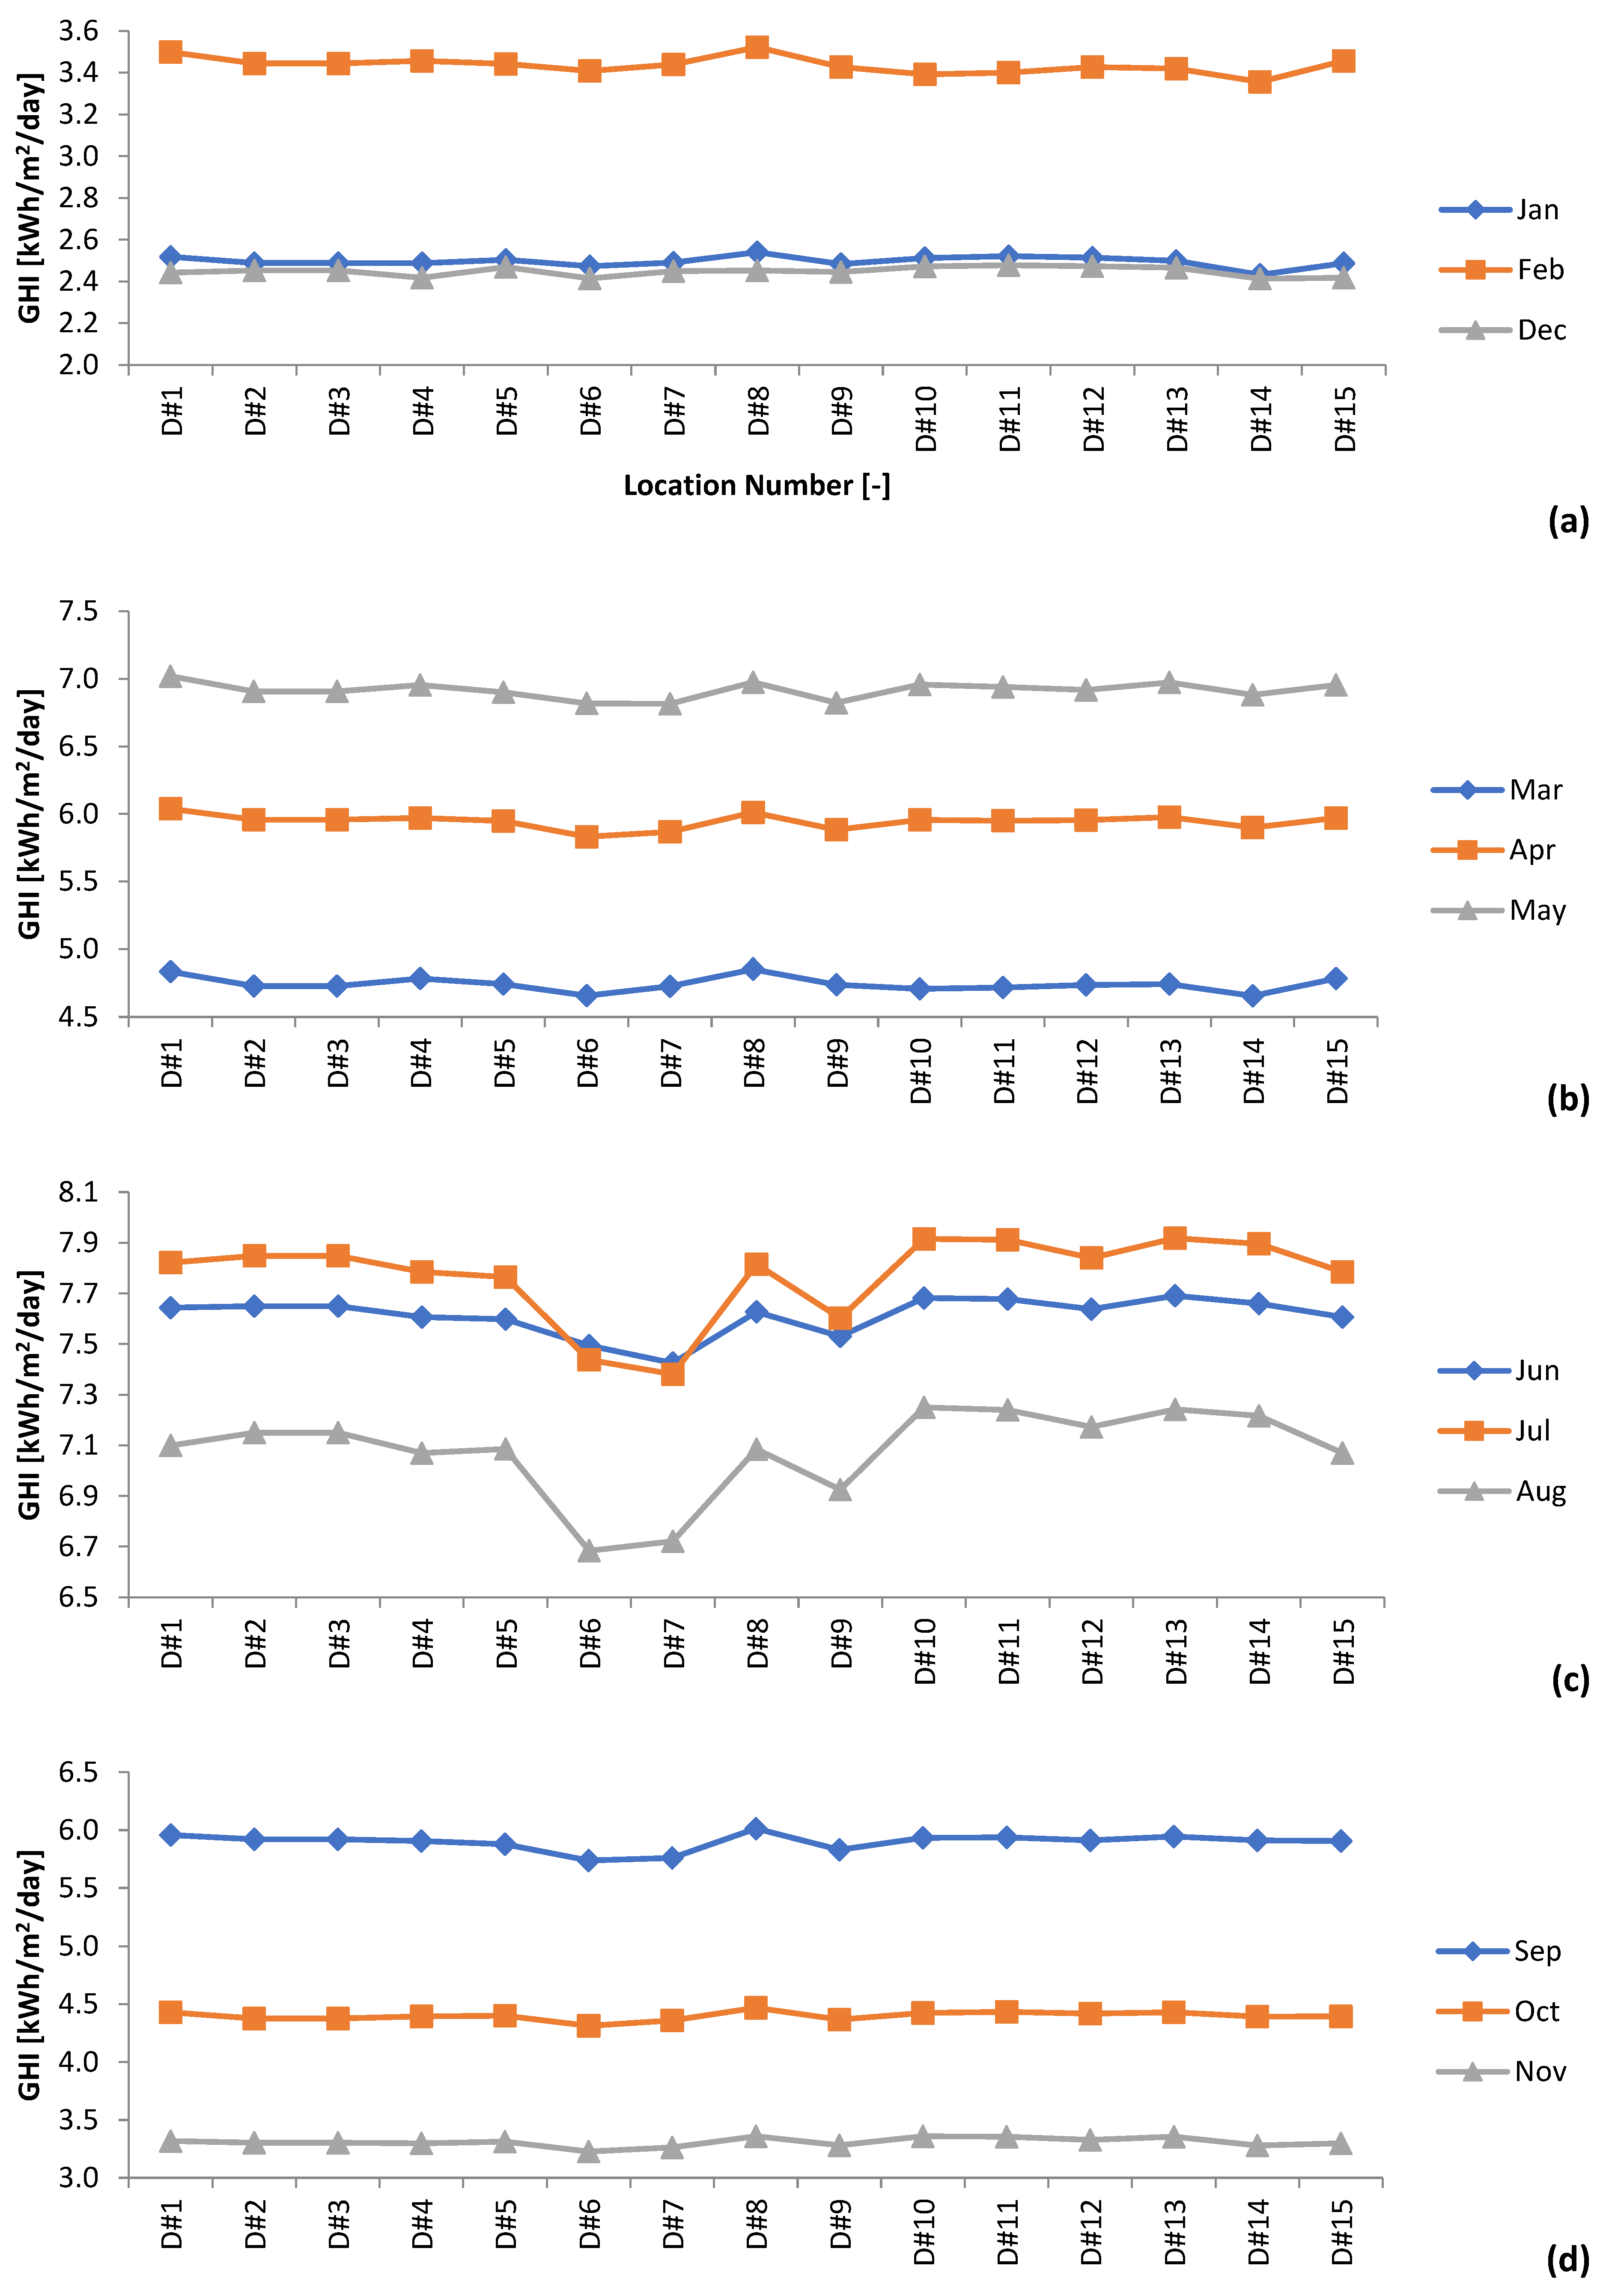
Figure 5 illustrates the monthly variation of GHI for all selected dams/reservoirs located in Northern Cyprus. It is observed that the amount of solar energy received remains constant across the specified areas, with slight deviations. In considering this, the solar radiation analysis of particular selected dams/reservoirs (Gemikonağı Madendere, Hamitköy Baştanlıkdere, and Ergazi Sayadere) was made using different distribution functions. Figure 6 shows the mean daily solar radiation (SR) for Gemikonağı Madendere, Hamitköy Baştanlıkdere, and Ergazi Sayadere. It was found that the maximum and minimum average daily season values of SR are recorded in summer in Ergazi Sayadere and in winter in Gemikonağı Madendere, as 9.80 kWh/m2/day and 3.06 kWh/m2/day, respectively (see Figure 6a–c). As shown in Figure 6d, the highest and lowest value of mean daily variation SR is recorded at Hamitköy Baştanlıkdere, with the value of 7.06 kWh/m2/day and 6.28 kWh/m2/day, respectively.
Furthermore, all locations’ solar resources are categorized as excellent (class 5) according to the assessment of solar potential based on annual GHI and DNI [26]. Consequently, all locations are suitable for installing PV/flat-plate systems.
To determine the appropriate statistical distribution that best represents the GHI characteristics associated with the dams and reservoirs, we use several distribution functions. In this study, the efficiency of the Johnson SB distribution, pert distribution, Phased Bi-Weibull distribution, and Kumaraswamy distribution are employed to analyze the GHI data.
Tables S2–S4 in the Supplementary Materials include comprehensive details on the distribution functions that are most effective when taking into account aspects related to shape, scale, and location. The fitted probability density function (PDF) models for Gemikonağı Madendere and Ergazi Sayadere are presented as examples in Figures S2 and S3 in the Supplementary Materials, respectively. It was noticed that when the values of the Anderson–Darling (AD) and Kolmogorov–Smirnov (K–S) tests are near zero, the distribution function more closely resembles the real data. Based on the K–S and A–D tests, Table 5 provides the distribution models’ ranking for the selected dams/reservoirs. Therefore, JSB has the lowest value according to the K–S test, and this distribution function has been considered to be the most appropriate for analyzing solar radiation at all dams/reservoirs in spring and autumn.
Moreover, it is found that JSB, GEV, and P are identified as the most efficient and secondarily successful overall among all distributions for all dams/reservoirs when analyzing the average daily solar radiation. It is found that K is the best overall for the winter season in Hamitköy Baştanlıkdere, whereas PBW is listed as the best overall for the winter season in Gemikonağı Madendere and Ergazi Sayadere. Furthermore, the most suitable distribution function for the summer season is determined to be L, GEV, and K for Gemikonağı Madendere, Ergazi Sayadere, and Hamitköy Baştanlıkdere, respectively.
Based on AD tests, the GEV, JBS, and K distributions show higher compatibility with the observed data when compared with other researched distribution functions. Based on the categories of data, these distributions were determined to be the most accurate statistical distribution to predict the solar radiations of the locations in the study.
In conclusion, distribution models provide valuable insights into solar radiation patterns during specific seasons while having no direct impact on PV system performance. The size and orientation angles of the photovoltaic system can be intelligently adjusted to maximize its overall efficiency by positioning the solar panels to capture the most sunlight.

3.2. Results of Average Monthly Evaporation

Because the study location’s particular characteristics may have significant impacts on the expected evaporation rates, it is crucial to select an approach that includes these variables. If the region experiences significant variations in wind and humidity, for example, the Penman methodology or the Mass transfer method might produce more accurate predictions. When radiation is the primary contributor, on the other hand, the Priestley–Taylor or Makkink techniques would be more suitable.

3.2.1. Monthly Variation of Climate Data

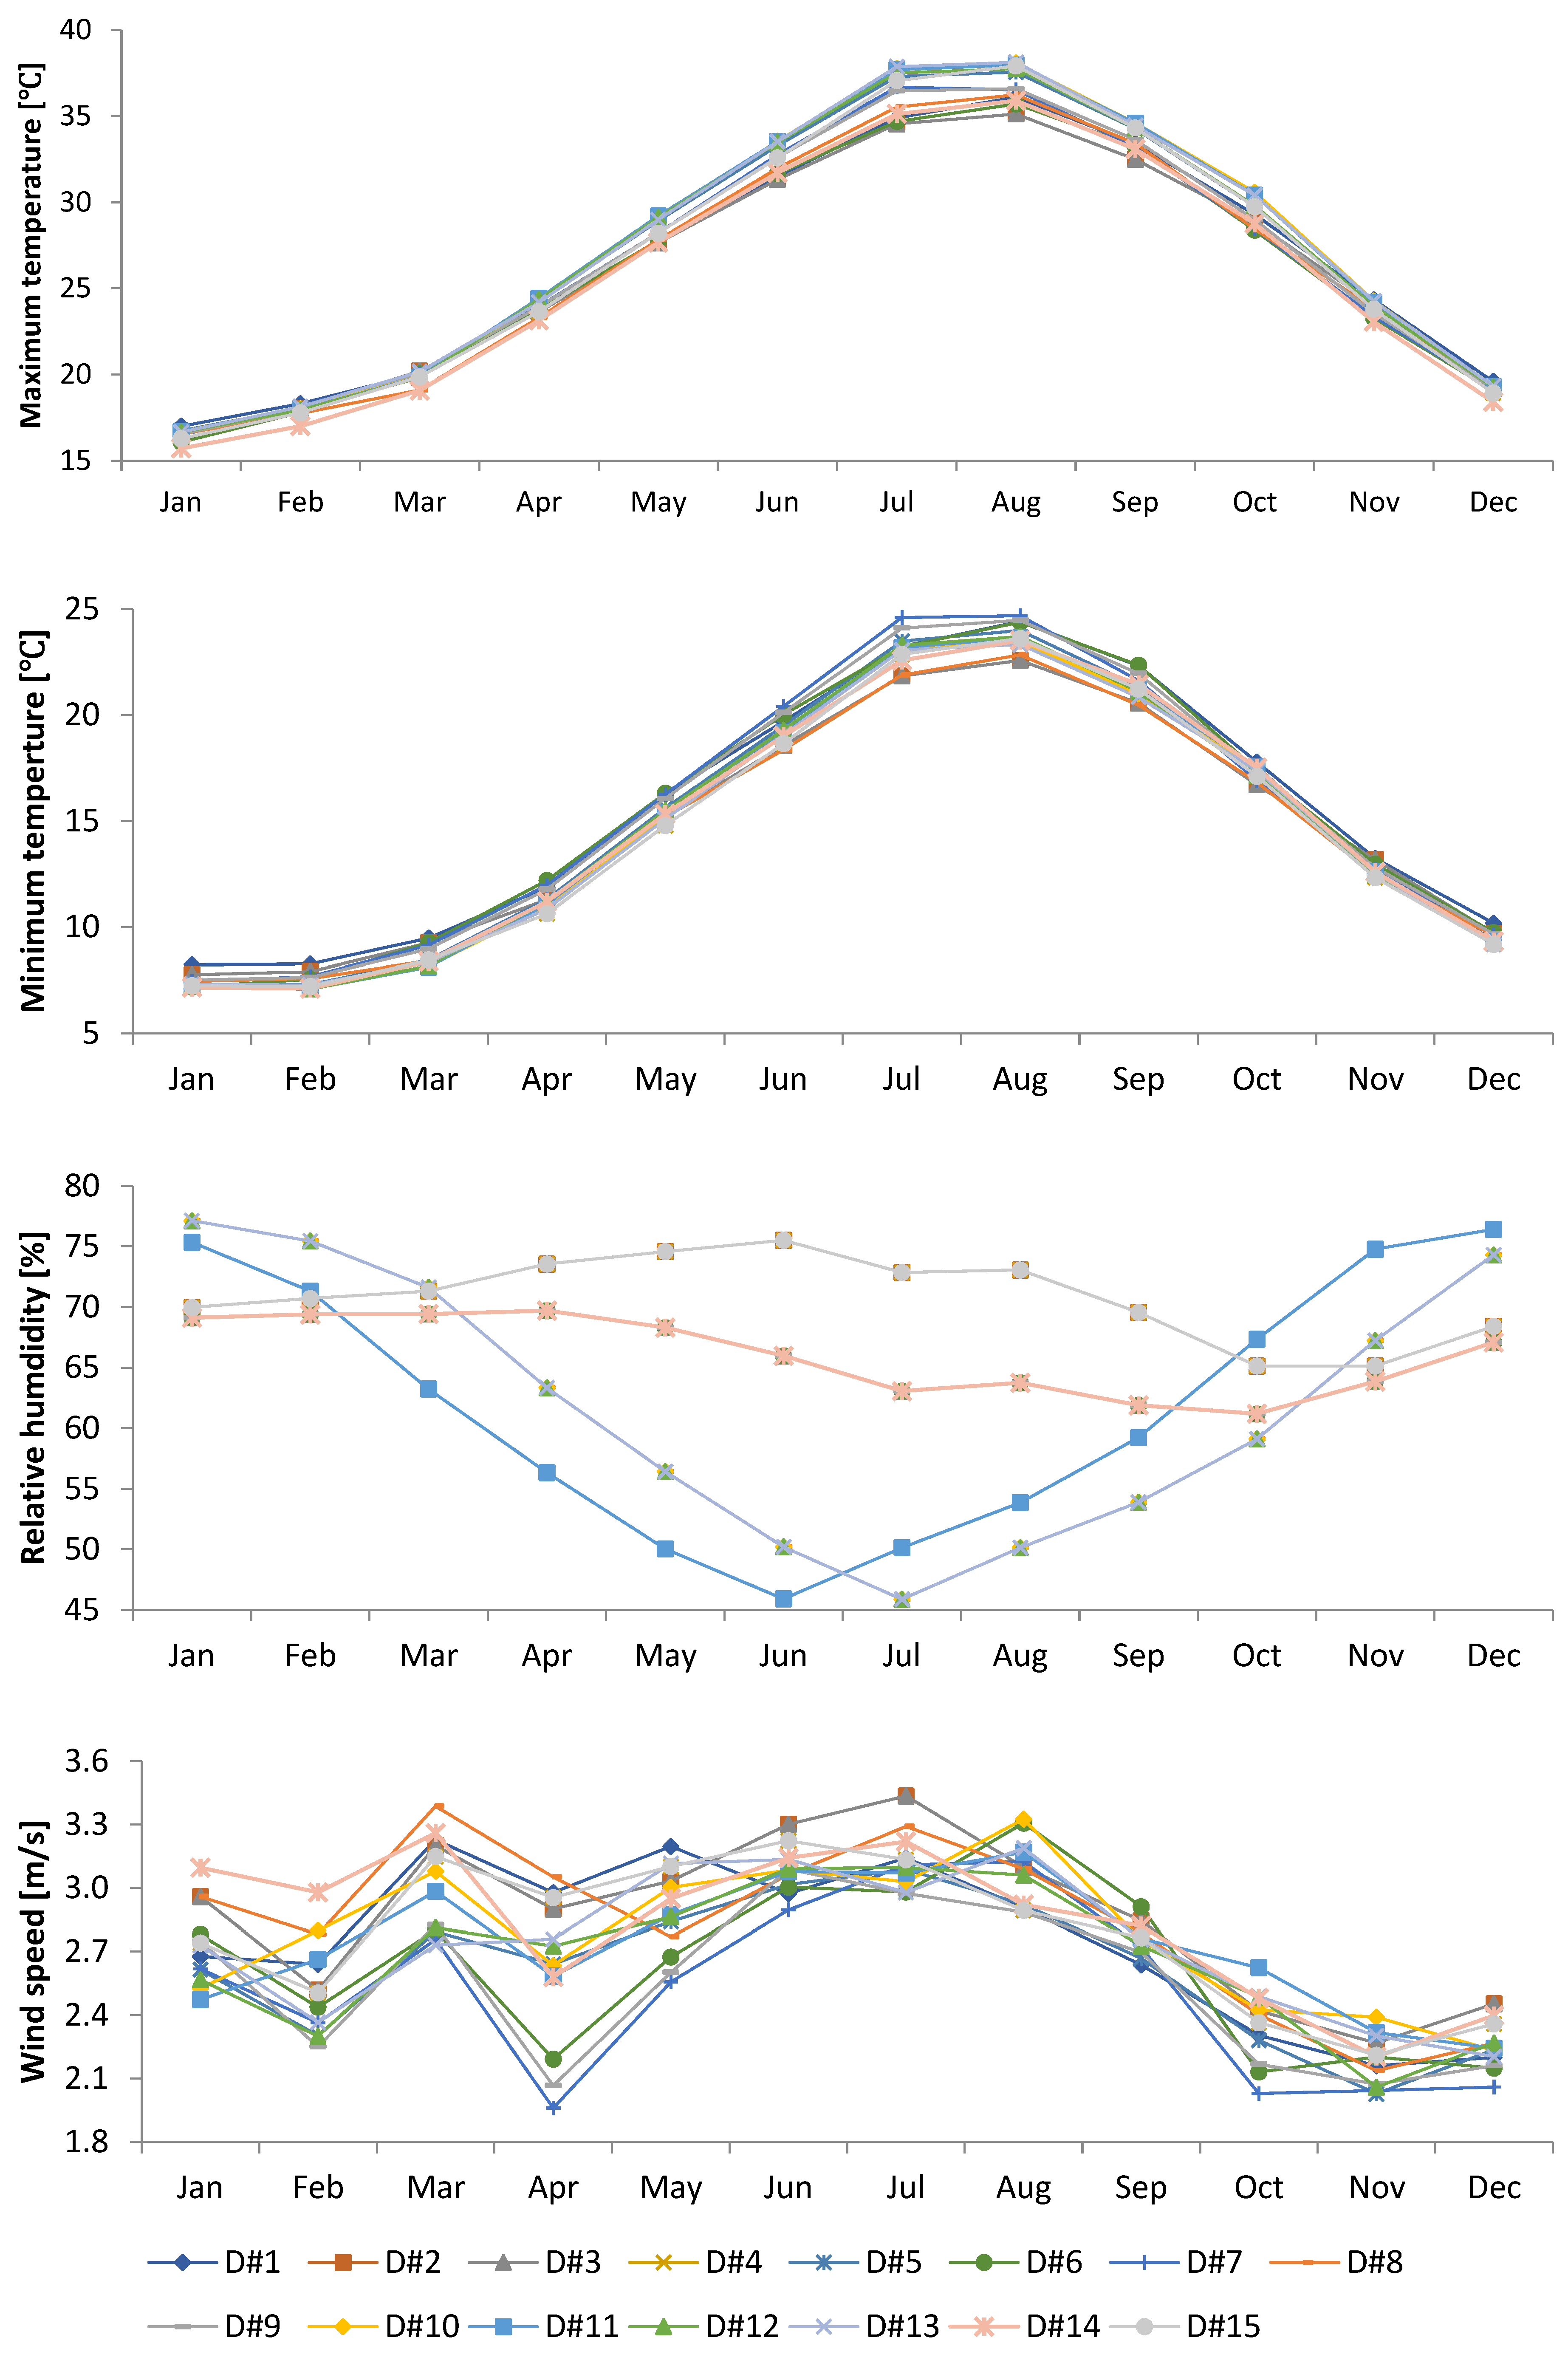
In this work, the monthly variations of evaporation from a chosen dam, reservoir, or lake from 2010 to 2023 were computed using mean monthly meteorological data, including temperature (maximum temperature and minimum temperature), relative humidity, wind speed, and solar radiation. The average monthly variation of meteorological data is illustrated in Figure 7. The following can be observed:
It is found that the mean maximum temperature is within the range of 15.71–38.11 °C, with an average value of 26.51 °C. The highest and lowest value of mean maximum temperature is recorded in August at D#13 (Kanlıköy), with a value of 38.11 °C, and in January at D#14 (Serdarlı Ağillidere), with a value of 15.71 °C.
The highest value of mean monthly minimum temperature is found to be 24.69 °C, which was recorded in August at D#7 (Geçitkale Eğridere), while the lowest value of 7.08 °C was recorded in February at D#12 (Haspolat).
The relative humidity value at D#12 (Haspolat) and D#13 (Kanlıköy) reaches a high value of 77.13% in January. The minimum mean relative humidity occurs at D#10 (Gönyeli) during July, at 45.87%.
The highest value of wind speed is recorded at D#2 (Arapköy Ayanidere) and D#3 (Arapköy Uzundere), with a value of 3.44 m/s in July. The minimum wind speed of 1.96 m/s is recorded at D#7 (Geçitkale Eğridere) in April.

3.2.2. Monthly Variation of Evaporation

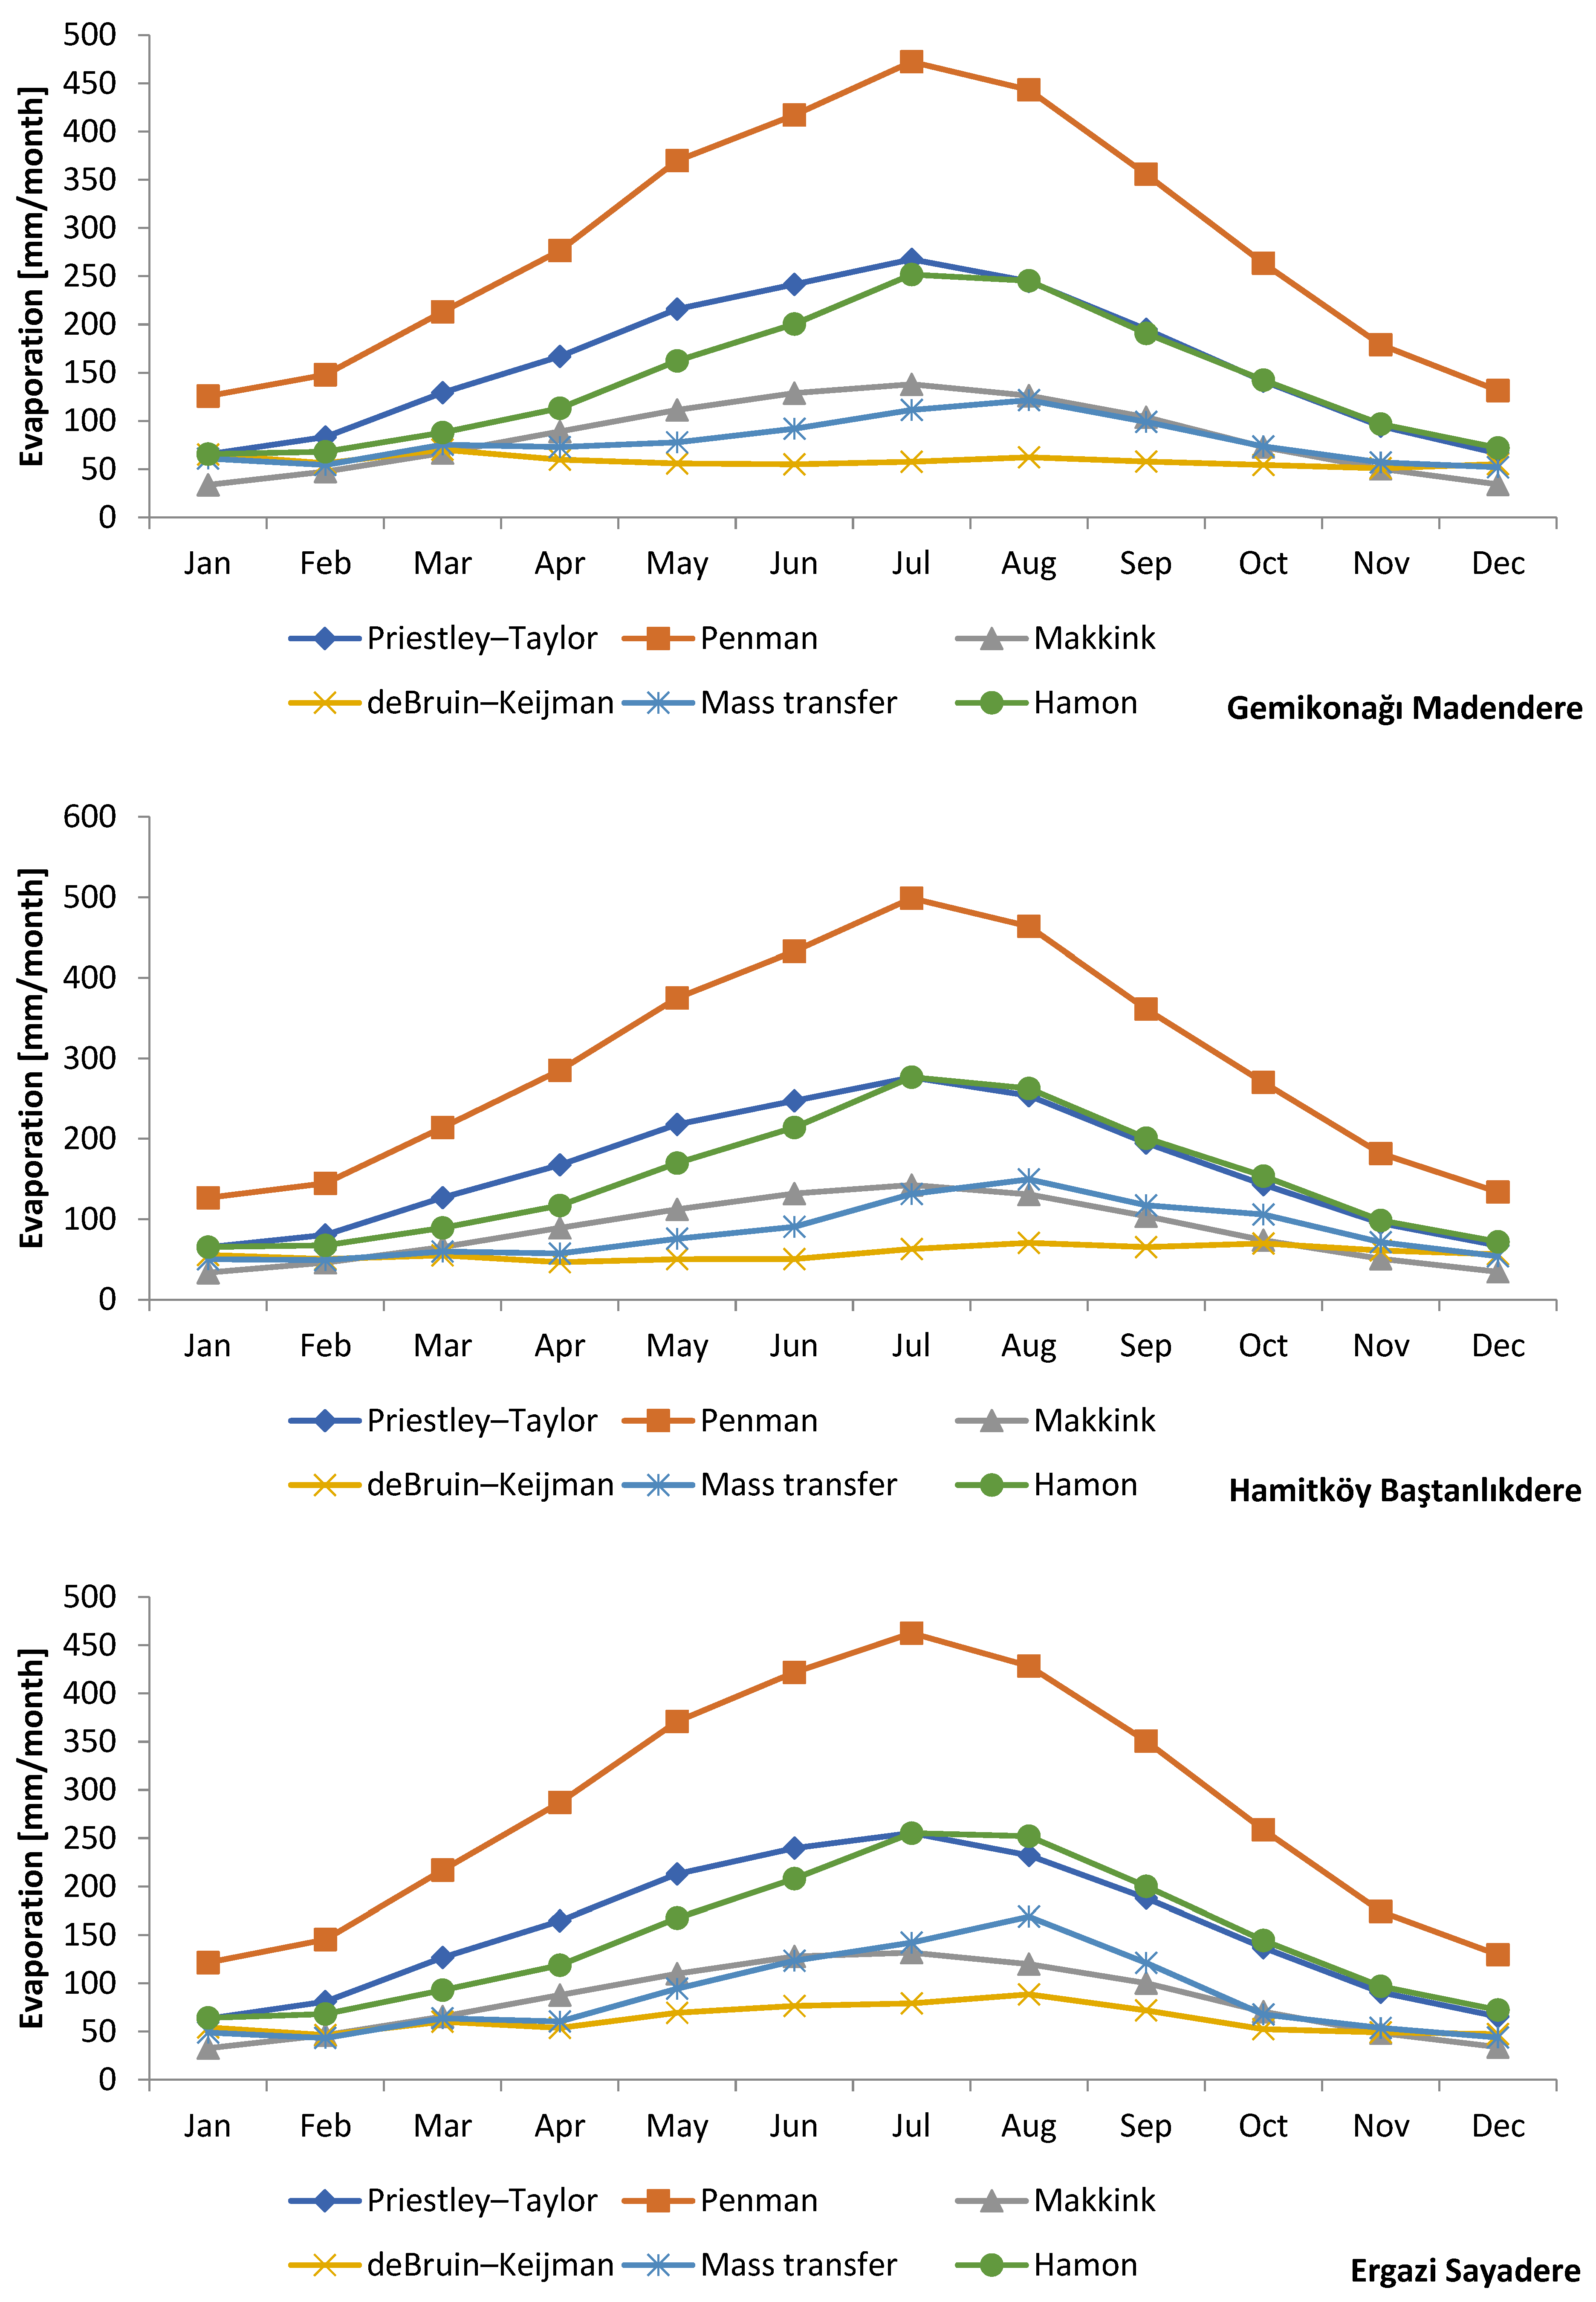
Table S5 in the Supplementary Materials displays the average monthly evaporation for all selected sites using six different estimation methods (Priestley–Taylor, Penman, Makkink, deBruin–Keijman, Hamon, and Mass transfer). Furthermore, Figure 8 shows the monthly variation of E as an example for some of the selected locations.
It is found that all approaches show higher evaporation rates in the warmer months (May to August) and the colder months (December to February). The various methods’ evaporation rates (E) varied significantly. According to the Priestley–Taylor method, E is highest in July at D#10 (Gönyeli), with a value of 276.61 mm/month, and the lowest value of E (64.70 mm/month) is in December at D#14 (Serdarlı Ağillidere). Based on the Penman technique, the highest and lowest values are reported at D#11 (Hamitköy Baştanlıkdere) and D#15 (Yılmazköy Polatdere), with a value of 498.70 mm/month in July and 125.04 mm/month in December, respectively. According to the de Bruin–Keijman and Makkink methods, July has the maximum value of E at D#11 (Hamitköy Baştanlıkdere) and D#13 (Kanlıköy), with a value of 142.60 mm/month and 142.84 mm/month, respectively. Additionally, the Mass Transfer method indicates fluctuation; D#15 (Yılmazköy Polatdere) had the highest E (201.94 mm/month) in July. Based on the Hamon method, the highest E for July is at D#10 (276.40 mm/month).
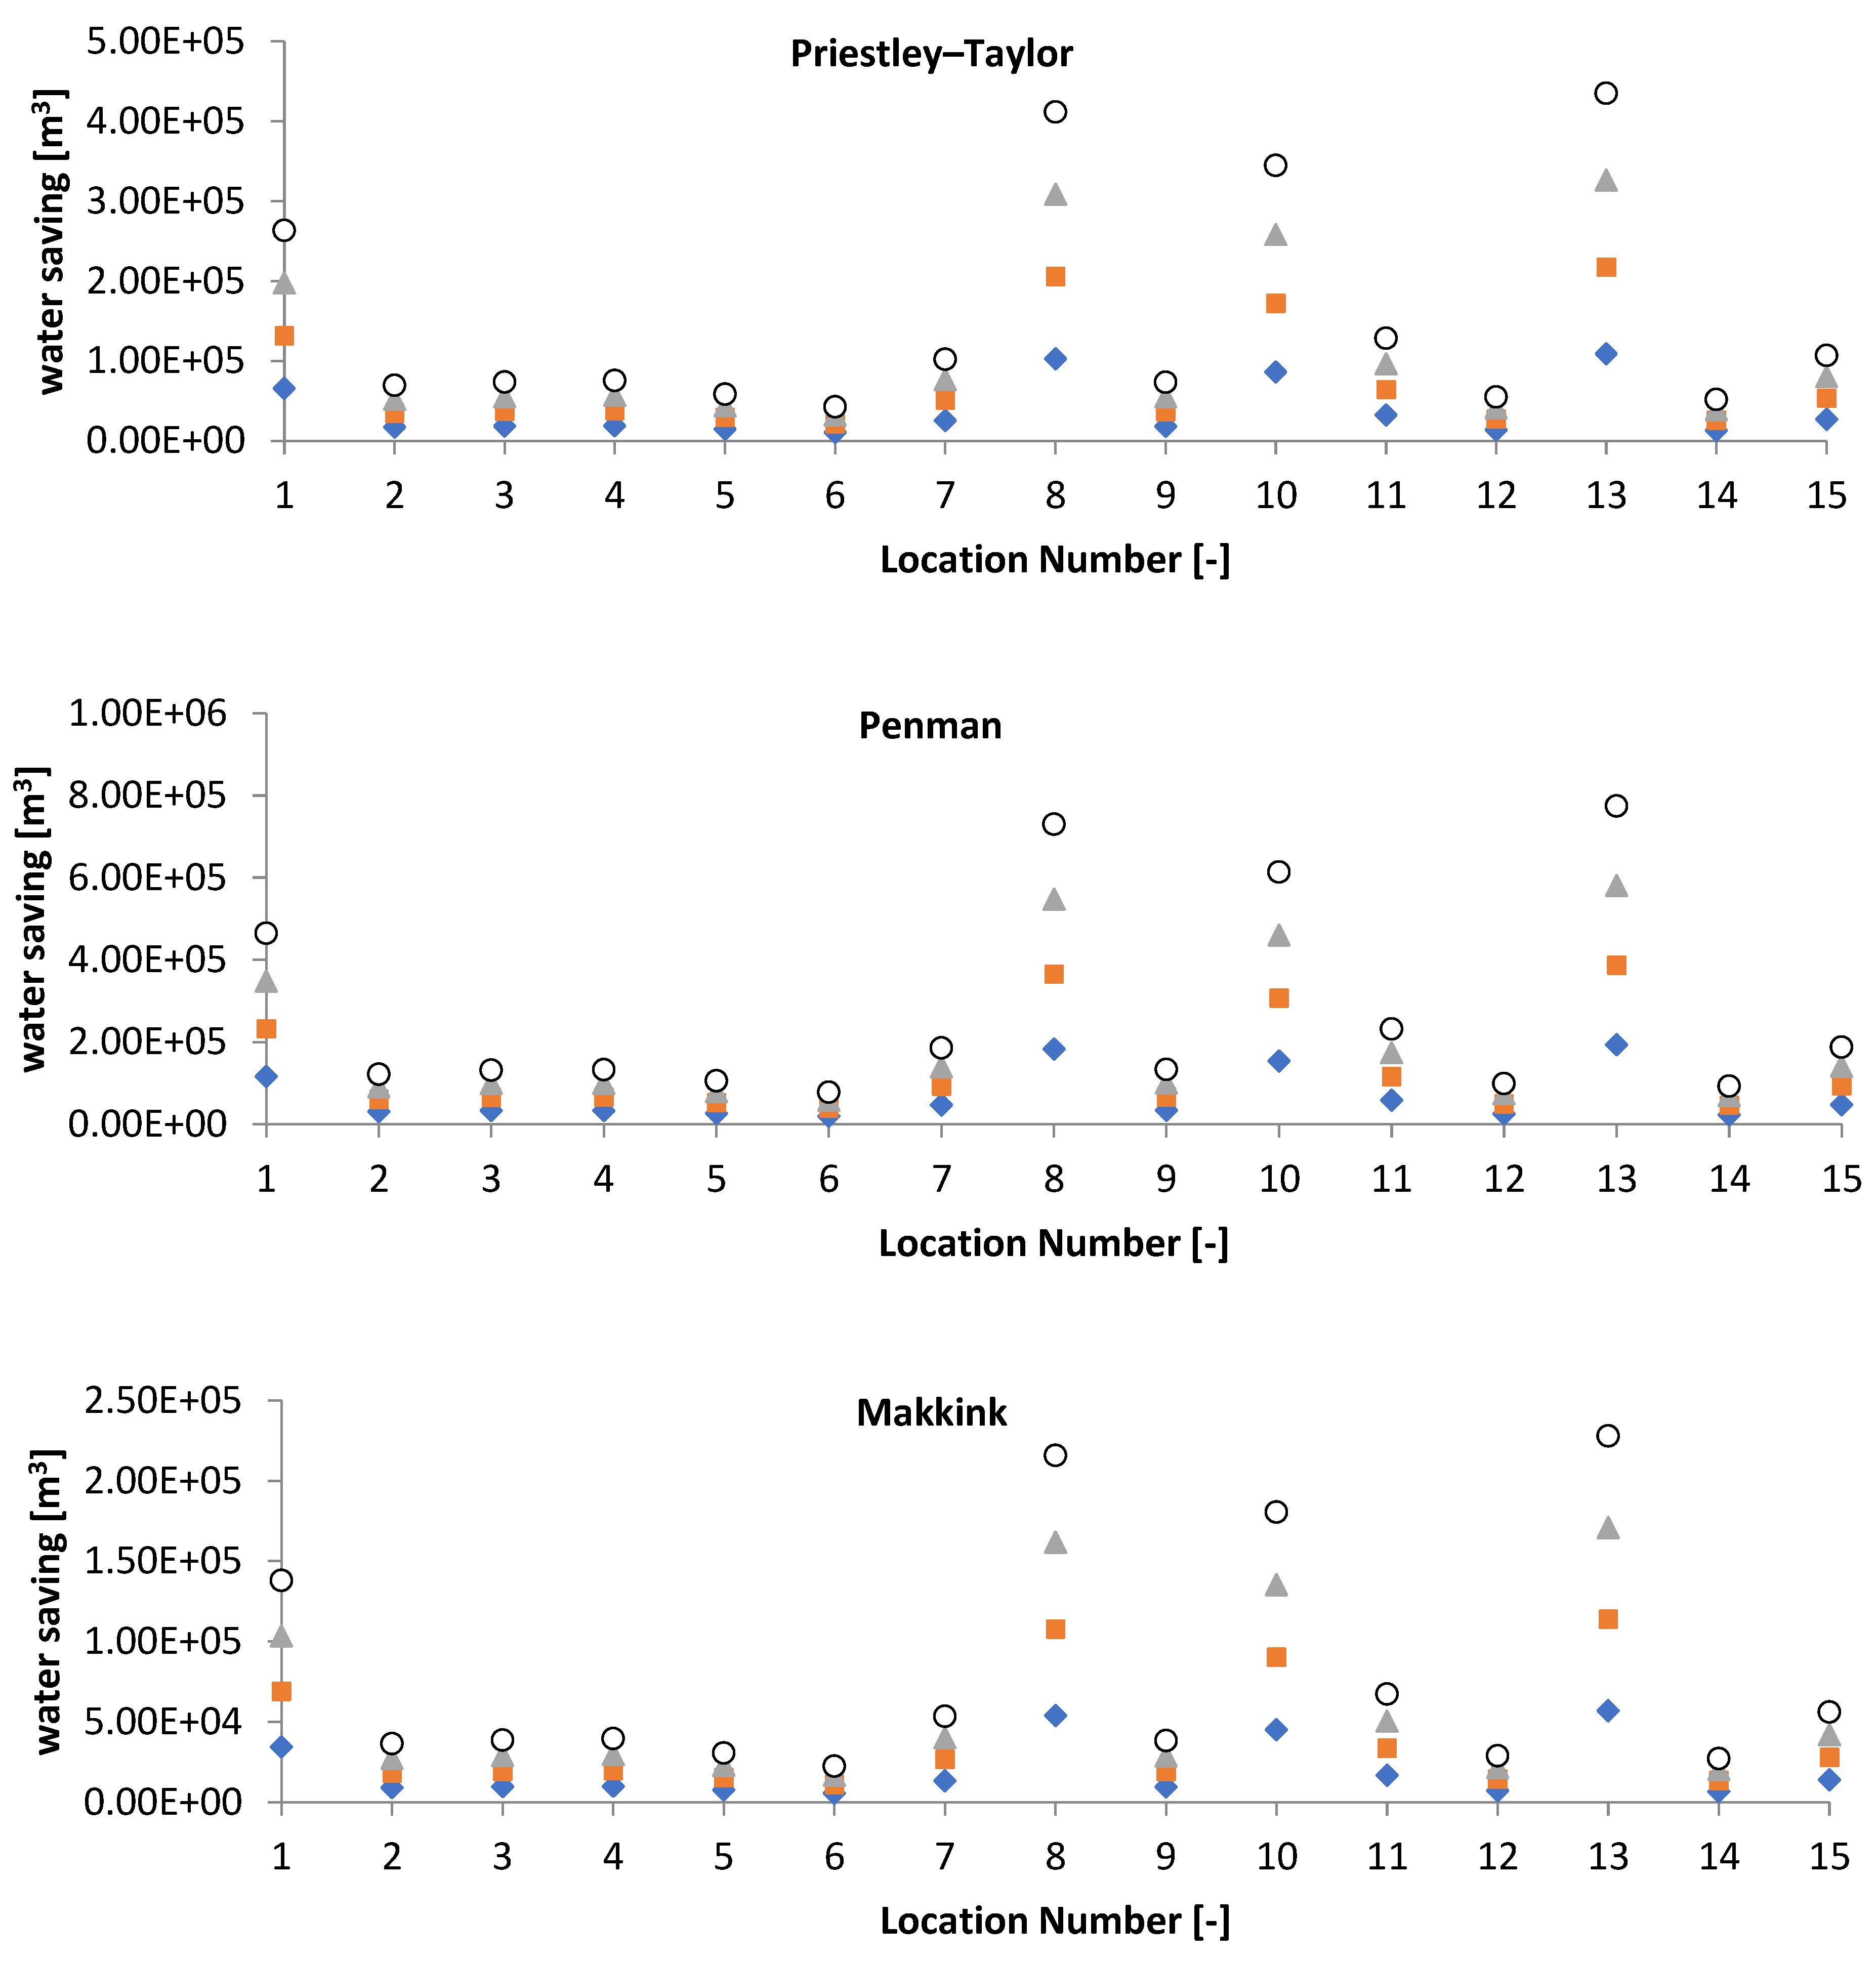
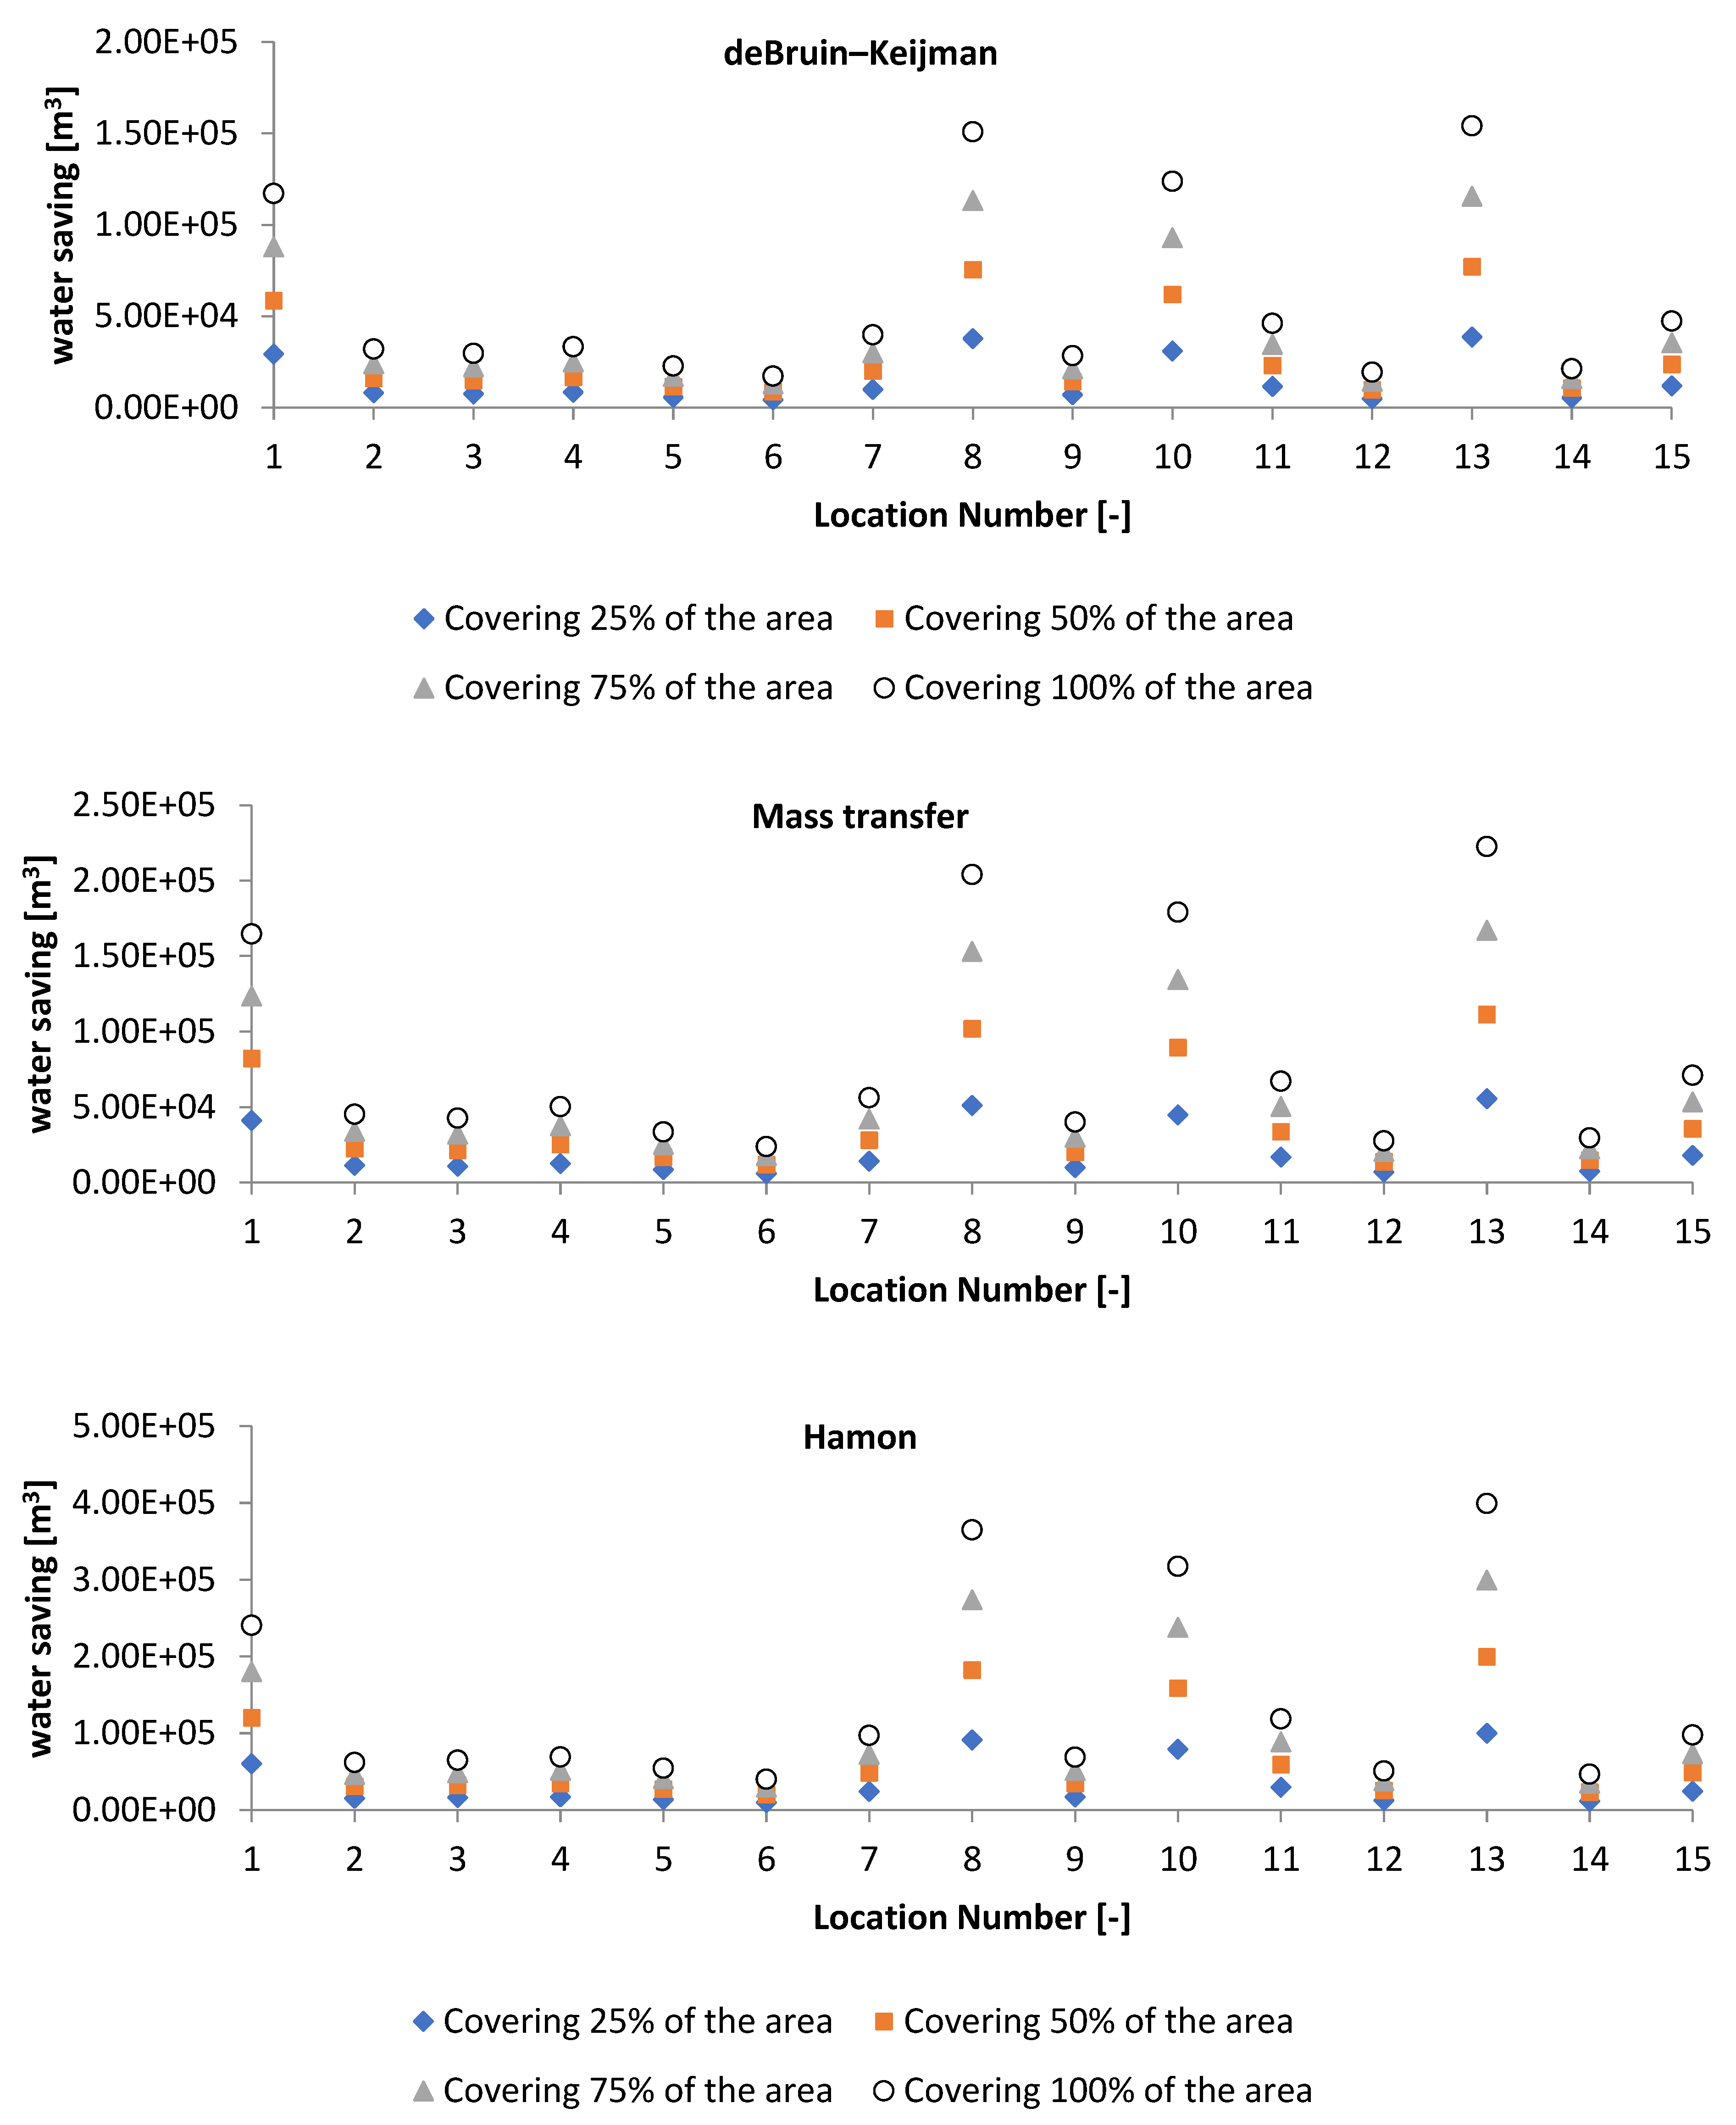
Moreover, various scenarios of the reservoir’s covered area were examined, including 25%, 50%, 75%, and 100% covered areas. It should be noted that the Google Earth engine was used to determine the surface area of the lake, reservoir, and dams (see Figure S4 in the Supplementary Materials). The annual water saving is estimated using Equation (7). Figure S5 in the Supplementary Materials illustrates the annual water losses from the selected water reservoirs with different percentages of the reservoir’s covered area. The system’s effectiveness in reducing evaporation is demonstrated by the fact that the water savings increase significantly as coverage rises from 0% to 100%. The findings showed that, depending on the reservoir’s surface area, the annual water losses ranged from 2.47 × 10⁴ m3 to 1.11 × 10⁶ m3, as shown in Figure S5 in the Supplementary Materials, while the annual water savings for the 0% covered area were estimated to be 0 m3. For instance, annual savings at 100% coverage can reach 6.21 × 10⁵ m3 (Location D#13) compared to 0 m3 in the absence of PV panels, as shown in Figure 9.
This trend highlights the clear correlation between evaporation reduction and covering area. Controlling water resources in reservoirs and dams can benefit from floating photovoltaic systems because of their potential as an achievable option for water conservation, as seen by the notable savings that increase with higher coverage.

3.3. Best Floating Structure

The economic viability of developing different scale grid-connected FPV systems was examined in this paper by mathematical modeling, taking into account technical, financial, and environmental points of view.

3.3.1. Proposed FPV System

Considering that the N-type Mono-crystalline module from Jinko Solar Company is one of the most efficient PV modules on the market currently, it was selected for the recommended FPV systems. The detailed specifications of the selected module are presented in Table S6 in the Supplementary Materials. Additionally, Central 850CP XT central inverters with a 954 kW capacity were used. Table S7 in the Supplementary Materials provides the used inverter’s specifications. The cost of the inverter and PV panel was found to be USD 155,647 and USD 173, respectively. Moreover, four floating structural variations were taken into consideration in this study, as shown in Table 6.

3.3.2. Economic Model

As mentioned previously, the study employed mathematical modeling to assess the techno-economic feasibility of the proposed floating photovoltaic plant. In this study, different important economic measures were used to evaluate the performance of the developed FPV system. Table 7 lists the assumptions used in this study.

3.3.3. Technical Viability

According to Owolabi et al. [113], the annual energy production (AEP) by solar photovoltaic plants and its capacity factor (CF) are both influenced by the solar radiation of the location and the number of clear sunny days. In this study, three different scenarios of covering ratios of the reservoir/dam’s surface (25%, 50%, and 75%) were considered for technical feasibility. 
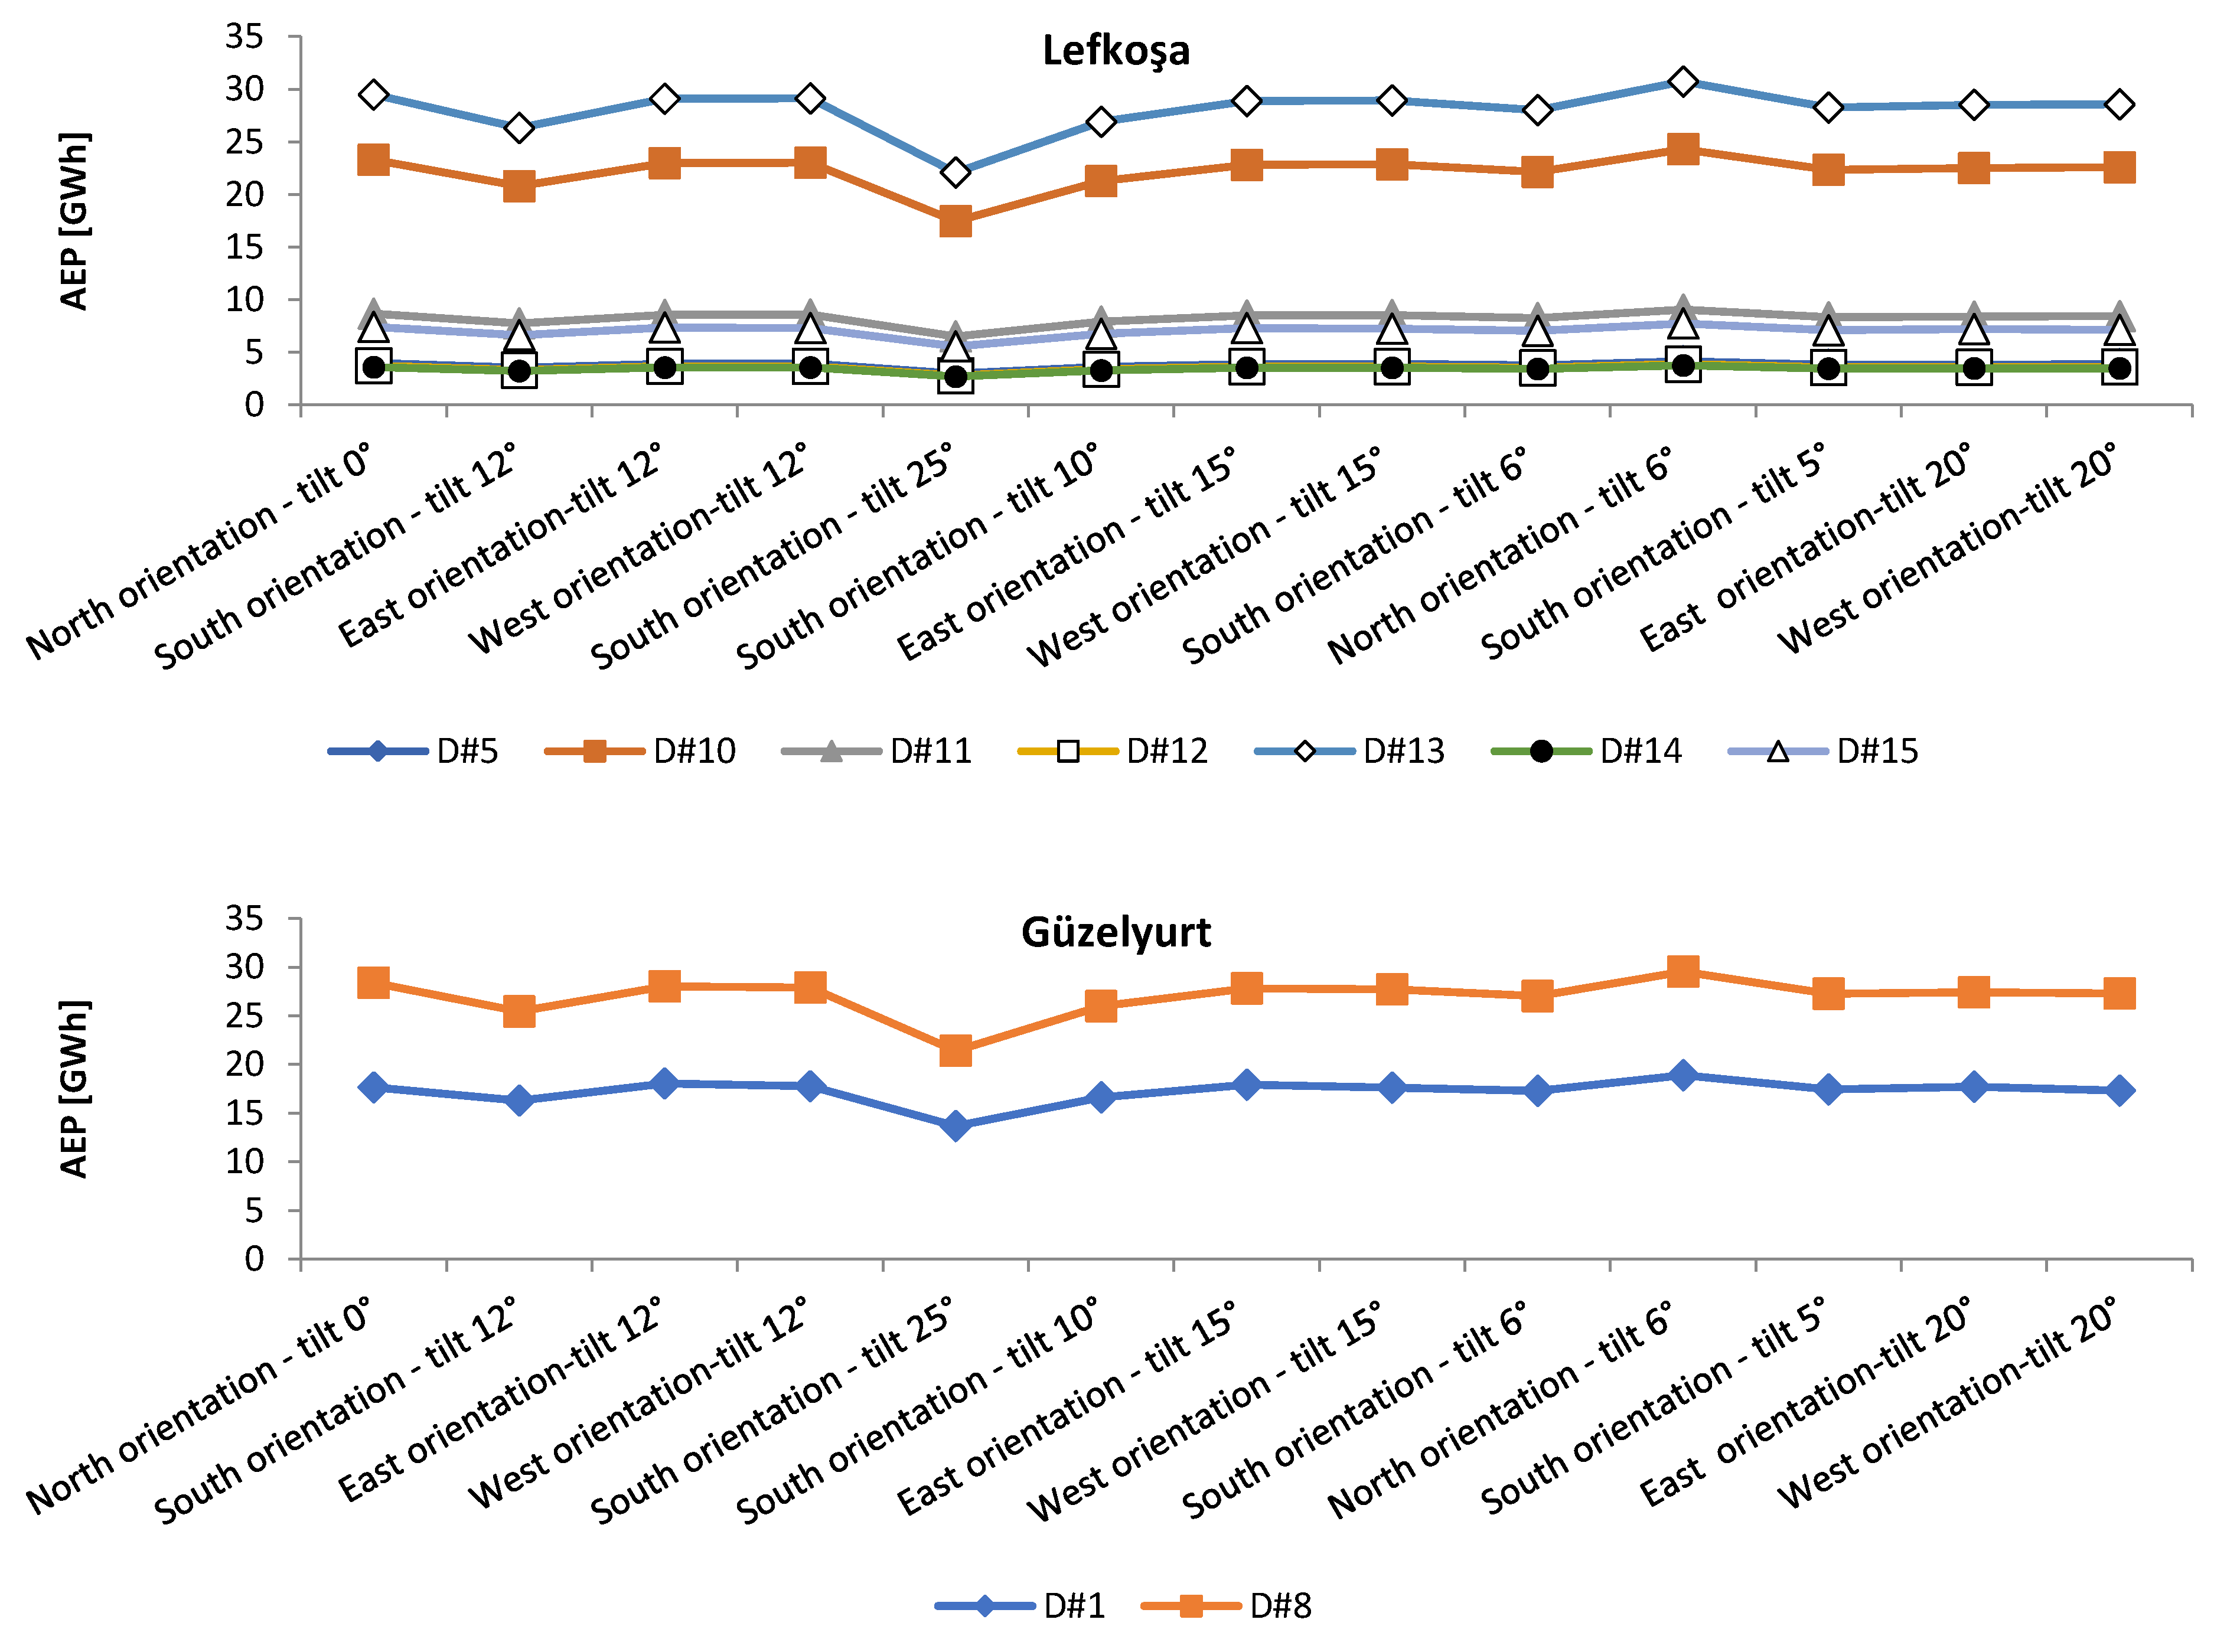
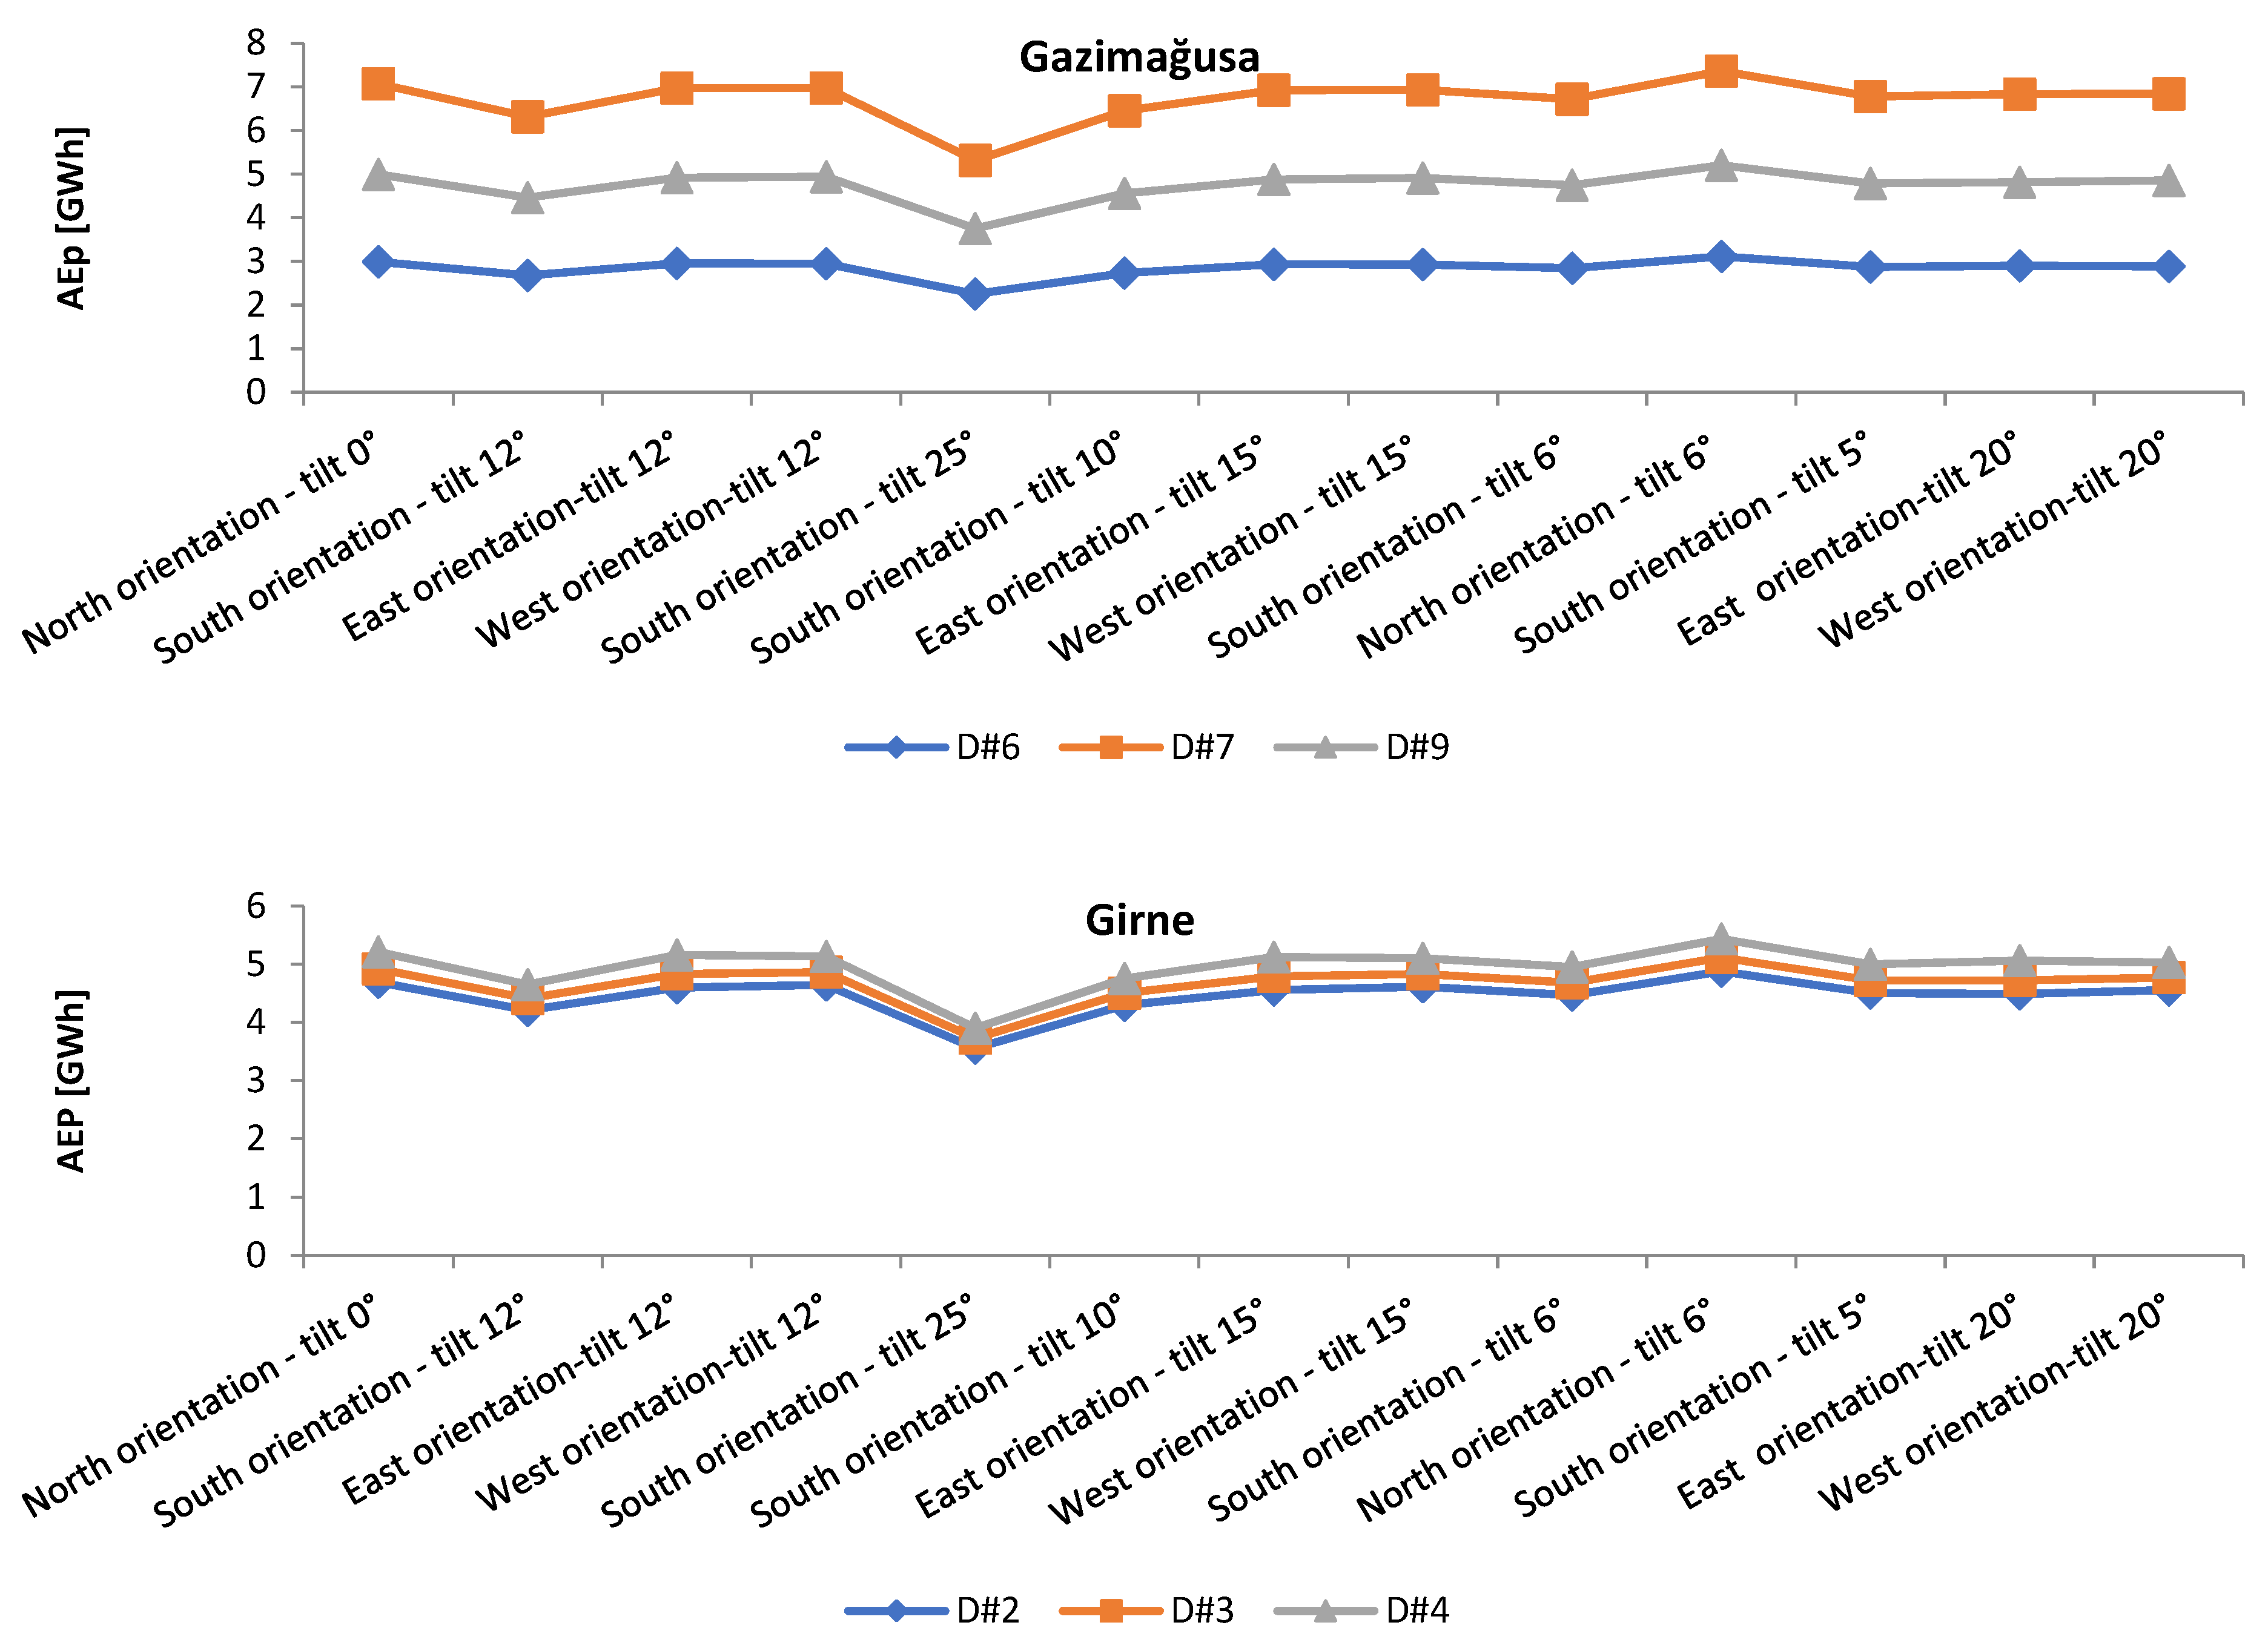
Figure 10 illustrates the annual energy production from the proposed FPVS at various orientations angles for the first scenario (covered area 25%). It is found that the AEP varies between 2.25 GWh and 30.73 GWh. The maximum and minimum values of AEP are recorded at D#13 (Kanlıköy) and D#6 (Ergazi Sayadere), respectively. Further, it was found that the floating structure (North orientation—tilt 6°) produced the maximum AEP for all sites. Figures S6 and S7 in the Supplementary Materials show the annual energy production from the proposed FPV at various orientations angles for the second (covered area 50%) and third (covered area 75%) scenarios, respectively. It was observed that the covered area of an FPV increases with power generation. This is because more solar panels can be fitted due to the greater covered area, which instantly increases the production and capacity of the system. Moreover, it is found that the CF value is within the range of 13.87–19.81%, as shown in Table 8.
When utilizing the OceanSun S6 floating PV system structure, which is specified with a north orientation and a tilt angle of 6°, the maximum value of CF is observed at D#1 (Akdeniz). The SolSyn S25 floating PV system structure, which is designed with a south orientation and a tilt angle of 25°, records the highest value of CF at D#2 (Arapköy Ayanidere), as shown in Table 8. It should be noted that the CF of a solar power system is simply an assessment of the system’s efficiency in producing electricity relative to its maximum output potential during a specific duration. CF is dependent on the overall performance of the system, shade, system orientation, and solar radiation availability. The CF is independent of the surface area covered by PV panels. The surface area changes the overall amount of electricity produced but does not affect the value of CF.

3.4. Performance Assessment of FPV with Various PV Technologies

After finding the best floating PV system structure (OceanSun S6), which is specified with a north orientation and a tilt angle of 6°, the performance of various scaled FPV systems with four PV technologies in terms of AEP, CF, SPP, energy production cost, and annual GHG emission reduction was evaluated using mathematical modeling. Table 9 lists the PV technologies used in this study.
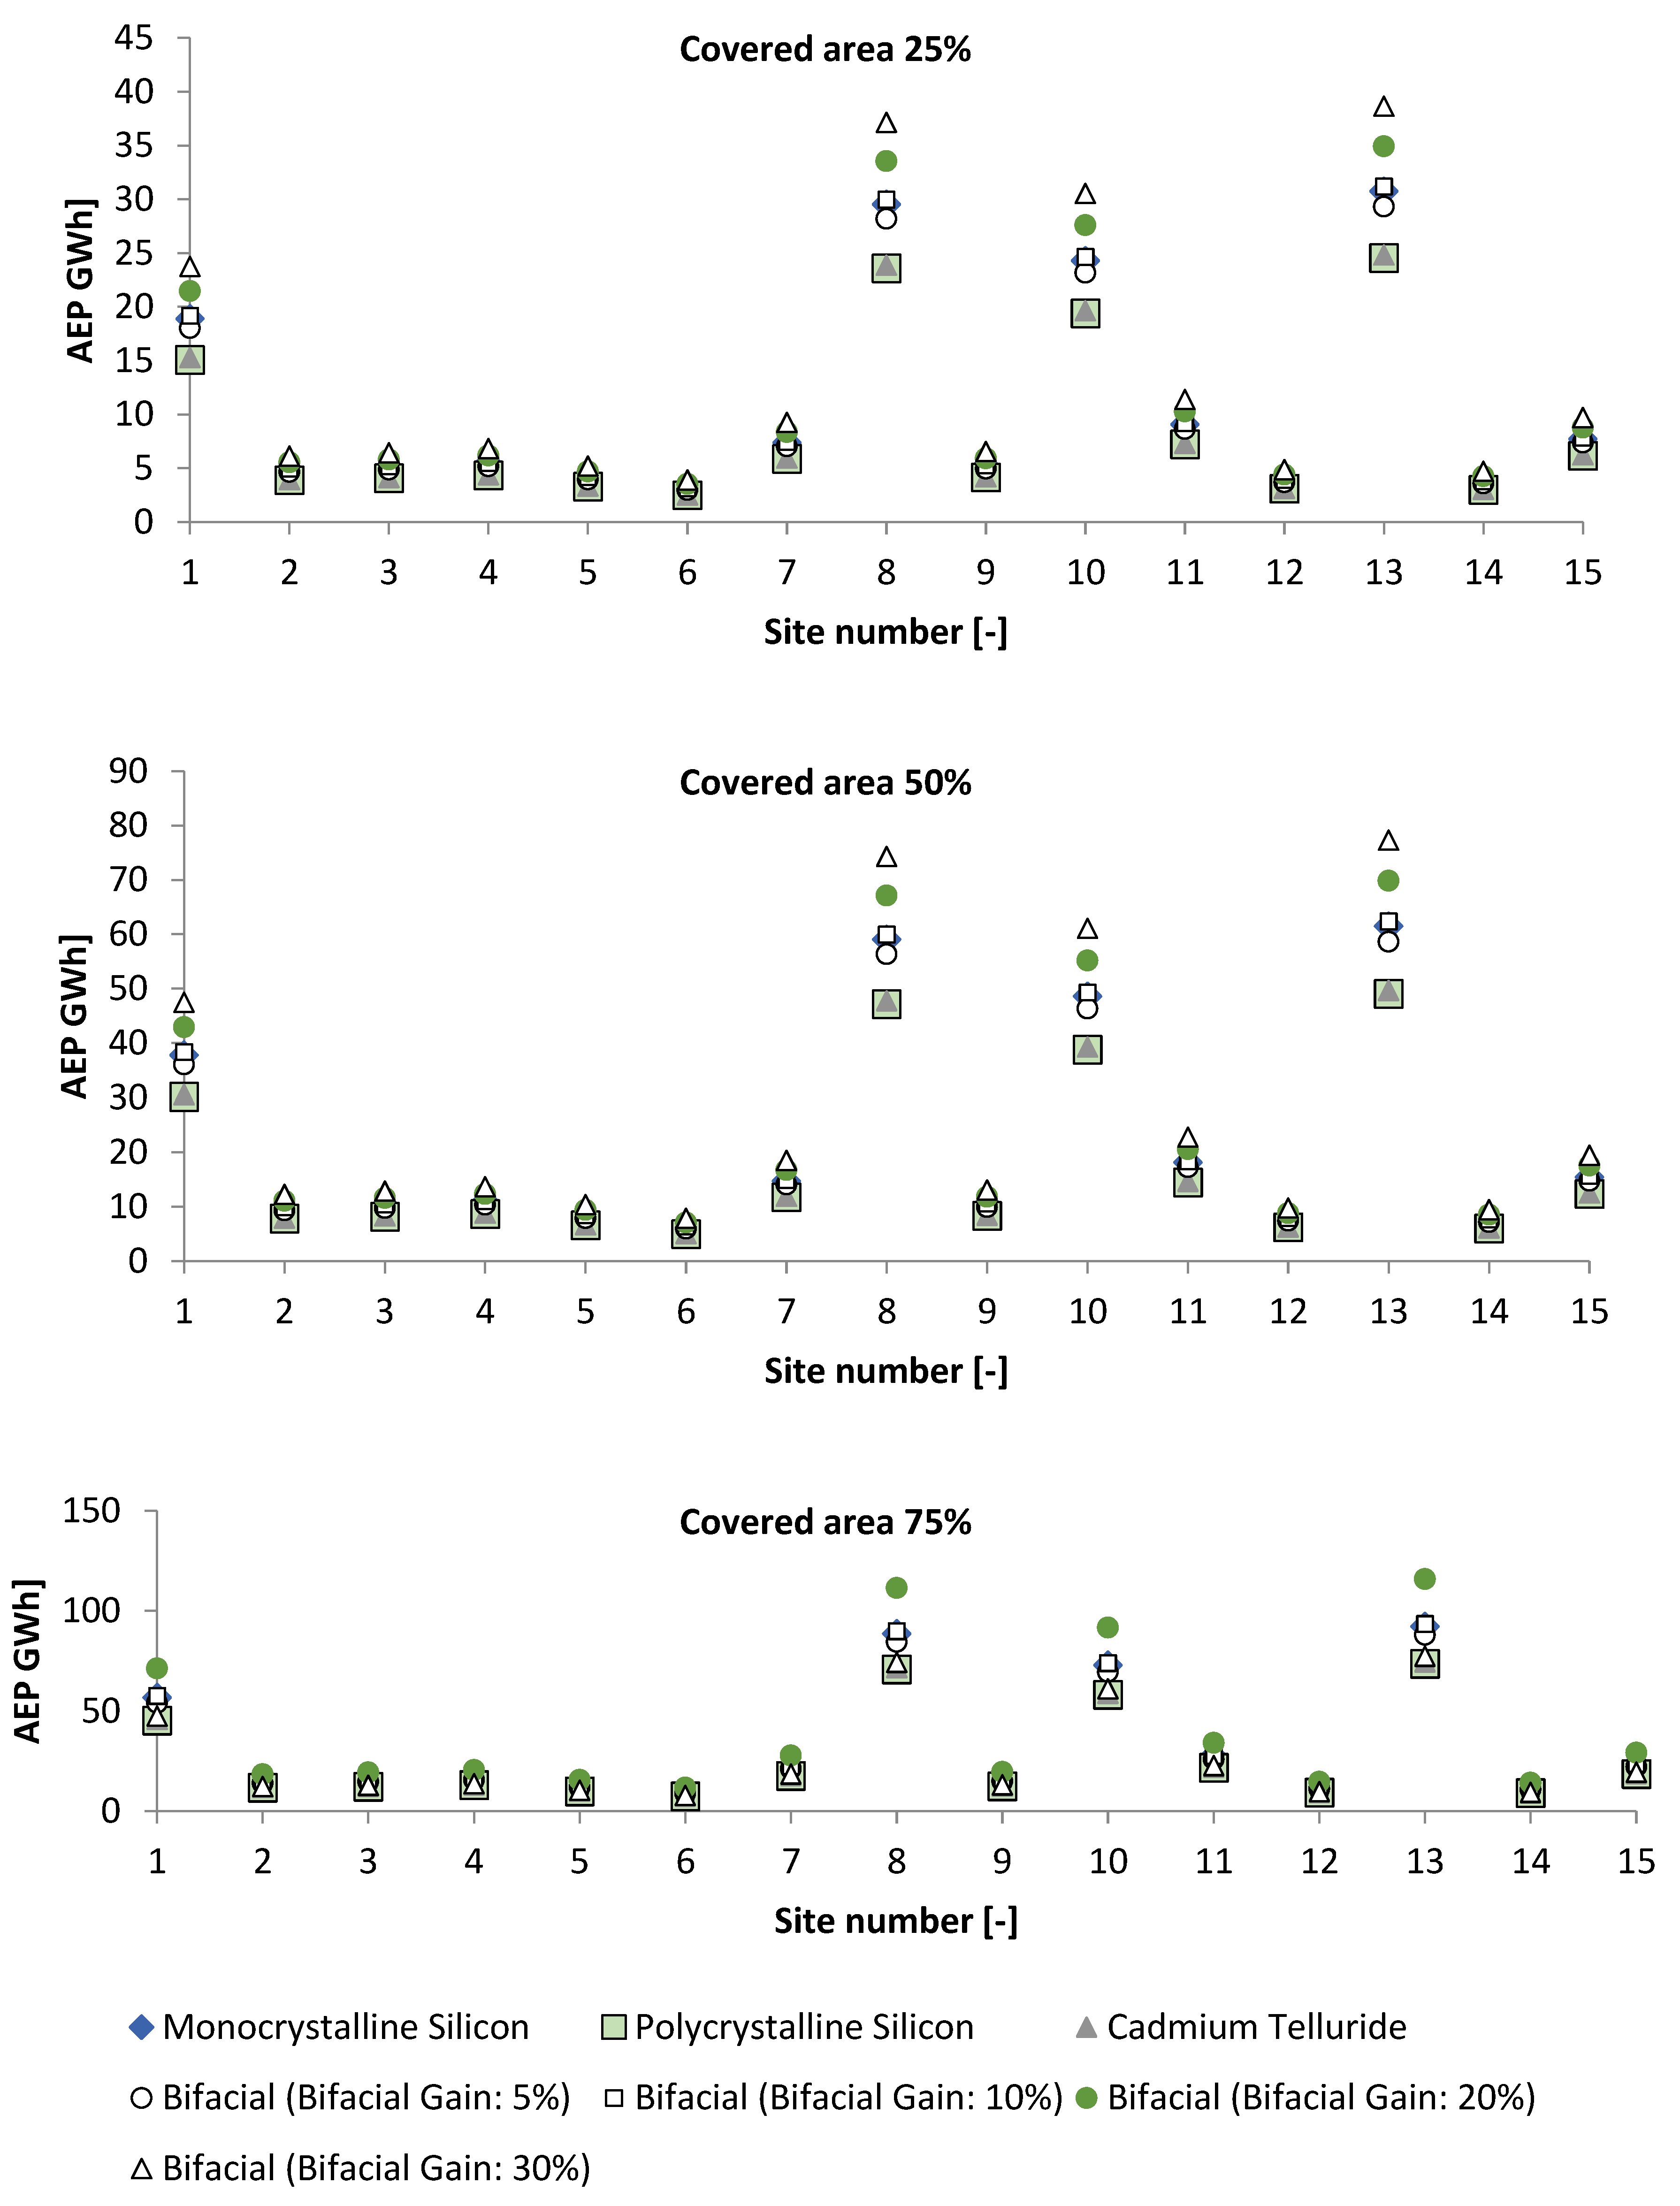
The suggested systems’ annual electricity generation (AEP) is displayed in Figure 11. The range of AEP values is found to be 2.5–38.7 GWh for a 25% covered area, 5.0–77.3 GWh for a 50% covered area, and 7.5–116.0 GWh for a 75% covered area. Moreover, it is observed that the highest AEP is recorded when the bifacial panel (Bifacial Gain: 30%) is employed. Additionally, using polycrystalline silicon panels results in the lowest AEP.
Furthermore, it is noticed that bifacial panels have a clear advantage over traditional panel technologies, particularly those with significant bifacial gains. Making effective utilization of reflected light increases the total quantity of energy produced. In terms of performance, high-bifacial-gain panels outperform monocrystalline silicon panels. Polycrystalline silicon and cadmium telluride panels have lower AEPs and are less effective at maximizing energy production, despite being considerably less costly to manufacture.
As previously stated, the percentage of surface area covered by PV panels has no impact on the CF. It does change the overall quantity of the power produced. Table 10 summarizes the annual value of CF for all proposed floating PV systems. It is found that the CF values of FPV systems varied from 18.60% (D#2: Arapköy Uzundere) to 27.37% (D#15: Yılmazköy Polatdere). Additionally, it is found that Cadmium telluride panels are more inefficient than monocrystalline, polycrystalline, and bifacial panels, as shown in Table 10. By using reflected light to maximize energy output, bifacial panels significantly raise capacity factors, with greater bifacial gains.
Furthermore, the main results regarding the economic performance of the proposed floating PV systems are tabulated in Table 11. It is found that the maximum (6.24 years) and minimum values (4.07 years) of SPP are recorded in D#2 (Arapköy Uzundere) and D#1 (Akdeniz), respectively, as shown in Table 11. Furthermore, when a Cadmium Telluride panel is employed in D#2 (Arapköy Uzundere), the maximum value of 0.025 USD/kWh is found, while the lowest value of LCOE is found in D#1 (Akdeniz) at 0.0163 USD/kWh when the Monocrystalline Silicon panel is used.
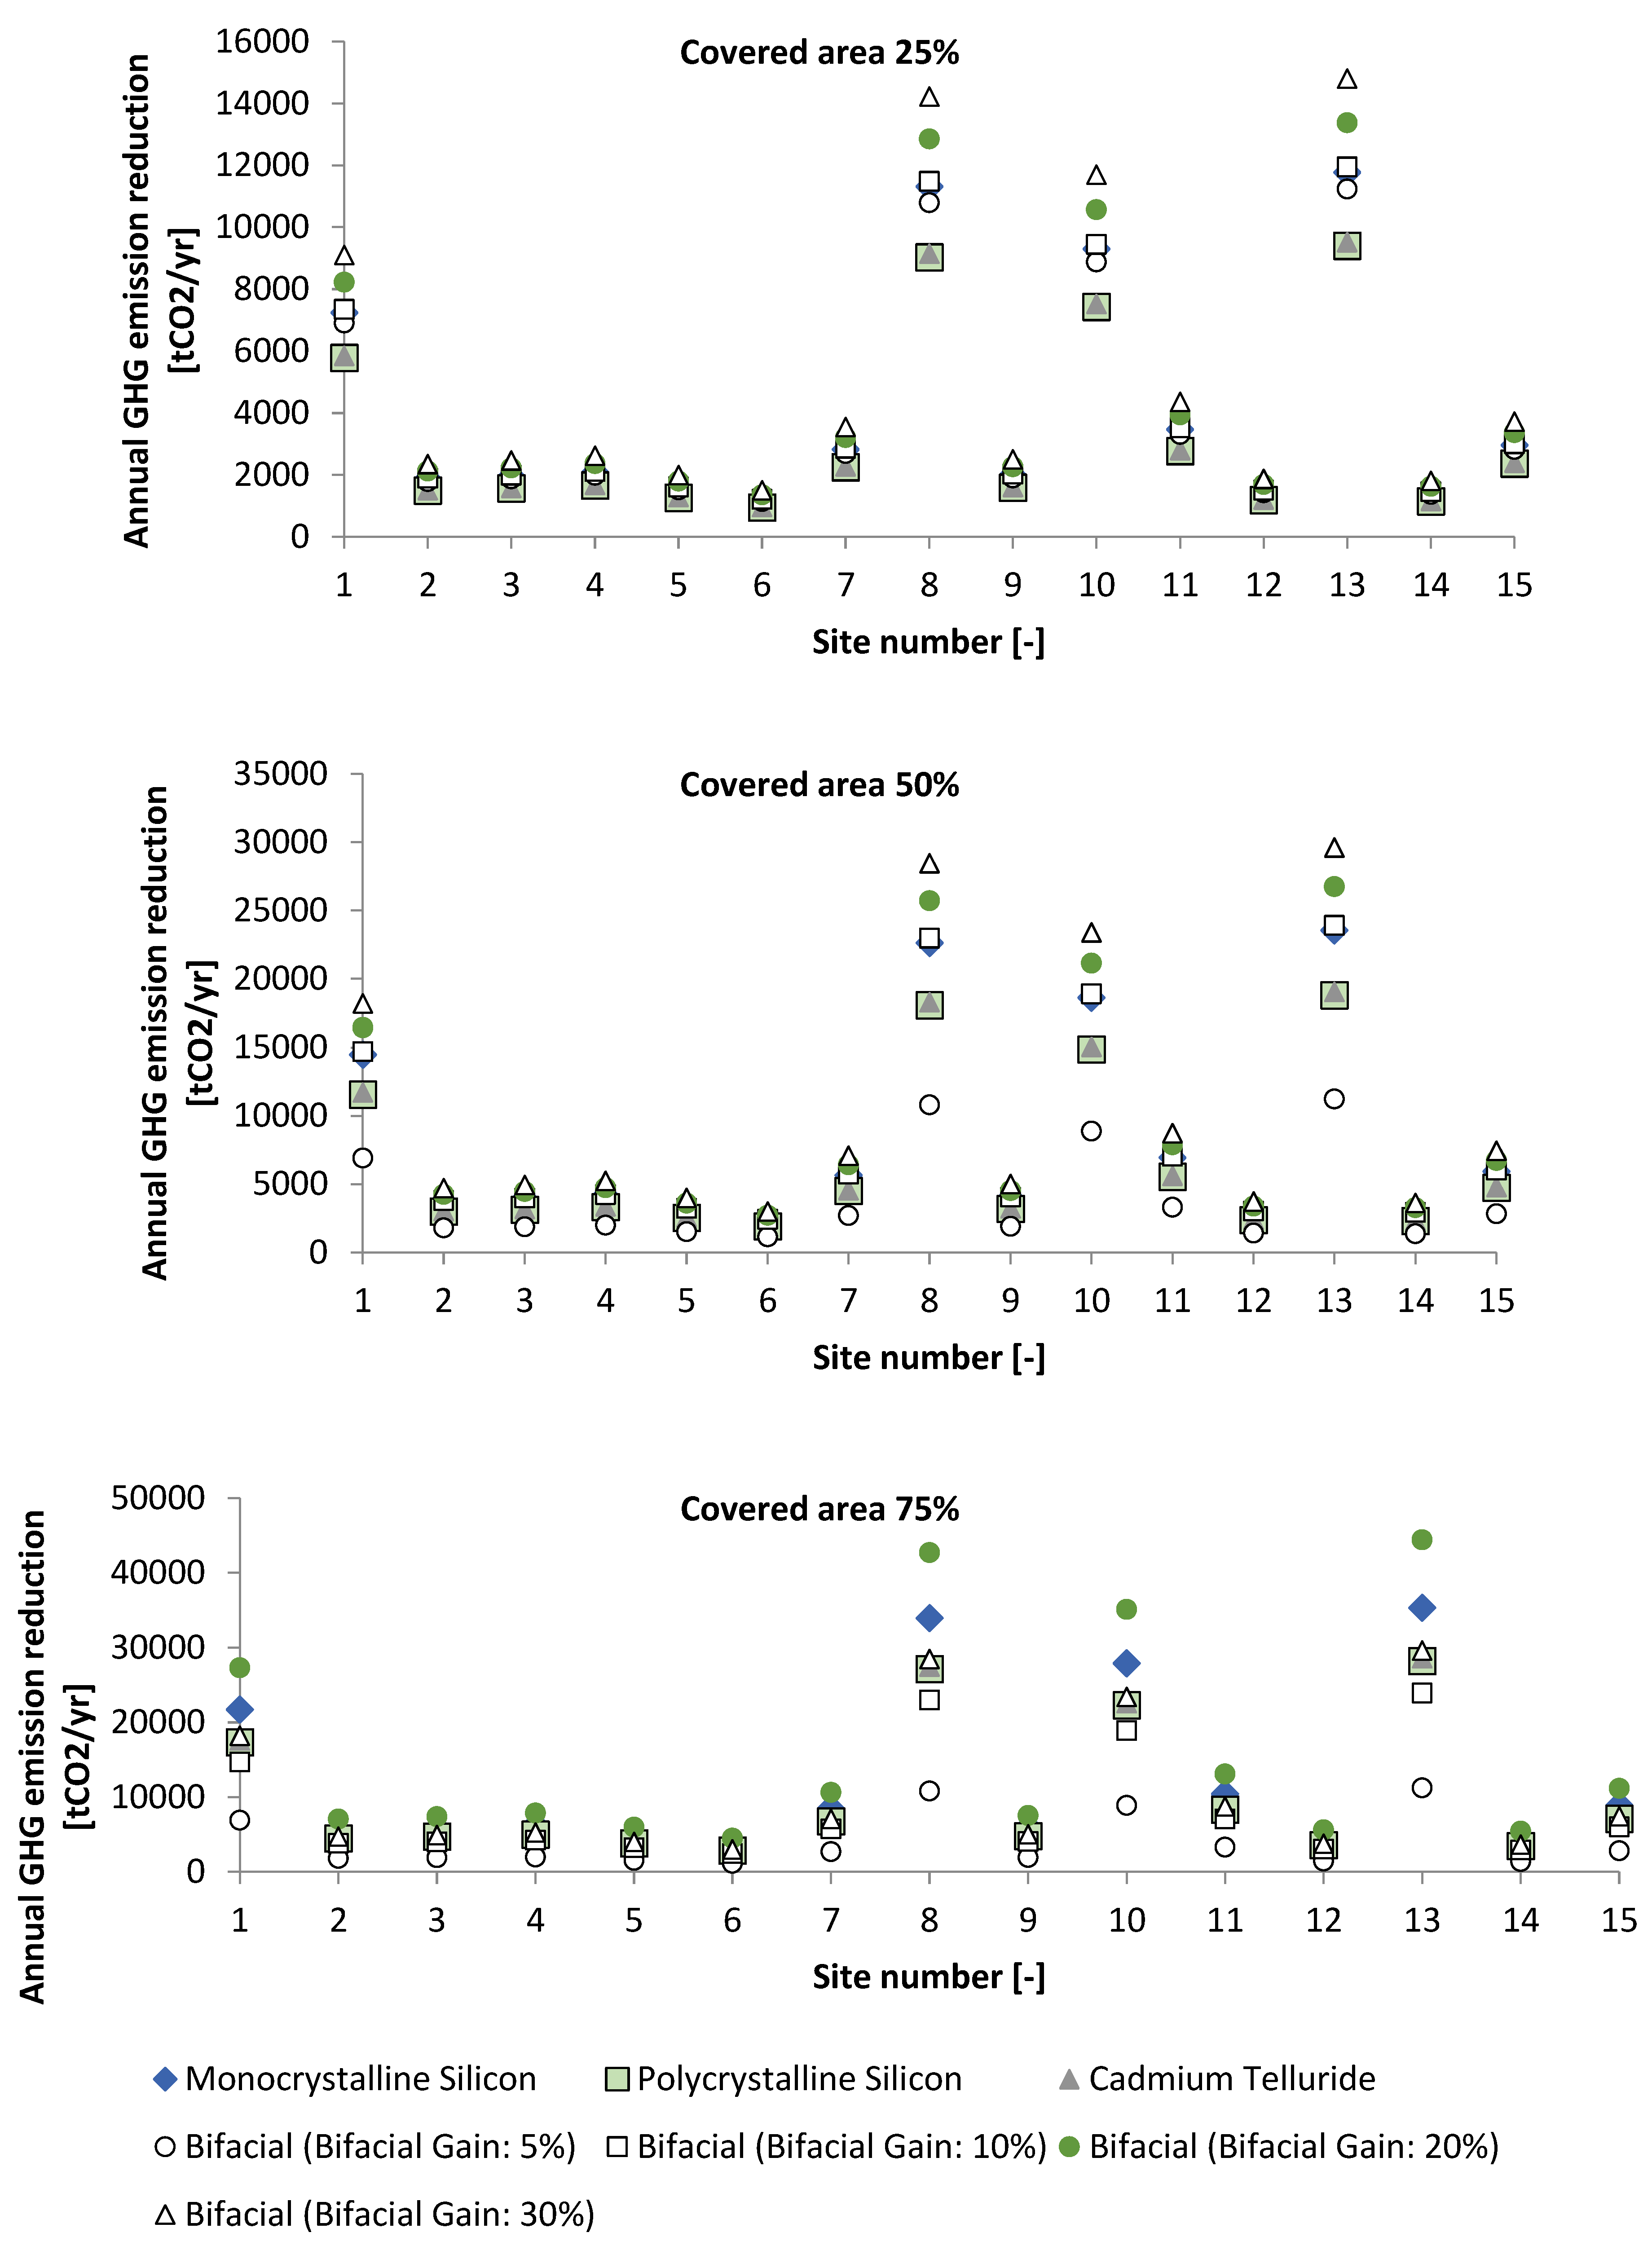
Figure 12 illustrates the total annual reduction of GHG emissions for each site. The floating PV system in D#13 (Kanlıköy) was found to have the highest overall GHG emission reduction, with reductions of 14804.63, 29609.27, and 44413.90 tCO2/year for covered areas of 25%, 50%, and 75%, respectively. This is followed by the D#8 (Gemikonağı Madendere) site project, with the lowest GHG reduction resulting from the D#6 (Ergazi Sayadere) site project.

4. Discussion and Conclusions

In general, the growth of higher education in Northern Cyprus has resulted in a significant increase in energy consumption and the need for infrastructure to support this development [55,161]. Therefore, a solar energy system such as the FPV system can be an acceptable solution to produce green and clean energy that covers energy demand and achieves sustainable development goals. In the literature, understanding the distribution of solar radiation is crucial for effectively implementing solar power systems at particular locations. In general, A floating/fixed-tilt PV plant’s performance is greatly influenced by the quantity and distribution of solar radiation at a particular location. Thus, an accurate comprehension of these variables facilitates the estimation of energy yield and the optimization of PV system design. According to Kebede [162], global horizontal irradiation (GHI) is the essential parameter to assess the energy generation for flat-plate photovoltaic systems. Frequency analysis can be utilized to determine the probability that different quantities of solar radiation will occur [163].
Therefore, the Johnson SB distribution, Pert distribution, Phased Bi-Weibull distribution, and Kumaraswamy distribution are added to the pool of parametric distributions for fitting the solar radiation data for the first time in this study, which was inspired by the list of PDFs used to analyze the characteristics of solar radiation (Table 2). These distribution functions are compared with common distribution functions (Normal, Gamma, Generalized Extreme Value, Log-normal, Weibull, and Logistic) to assess their suitability. The best-fit result of each site was taken as the distribution with the lowest value from the Kolmogorov–Smirnov (K–S) test and the Anderson–Darling (A–D) test. The results showed that the Johnson SB distribution, Burt distribution, and Coomaraswamy distribution performed better than the common distribution in terms of fitting performance and modeling of solar radiation statistics. Langat et al. [164] indicated that the frequency regime of the data series influences whether the distribution function is optimal. Therefore, the authors believe that the current results encourage further research to take these distributions into account when fitting global solar radiation data.
Moreover, the floating photovoltaic system for reservoirs is an emerging and novel technology that has the potential to significantly reduce evaporation, according to prior studies. Several models have been used in the literature to study the evaporation rate on the water’s surface. Hence, Priestley–Taylor, deBruin–Keijman, Makkink, Penman–Monteith, mass transfer, and Hamon methods were employed to estimate the rate of evaporation at the selected reservoirs. The evaporation rate was estimated using the following data: temperature, humidity, wind speed, and solar radiation. It is crucial to note that the site’s conditions play a role in identifying the best approach. It is found that the Priestley–Taylor and Hamon methods are expected to yield similar results because they are simple and highly sensitive to temperature and radiation. In contrast, the Penman method considers wind speed and vapor pressure deficits, resulting in higher evaporation estimates. The Penman method integrates mass transfer and energy balance approaches and is widely used for estimating evaporation, especially in the summer, producing greater estimates [165,166]. On the other hand, the Priestley–Taylor method assumes constant humidity, resulting in lower estimations, particularly in aerodynamically significant situations [167]. The Makkink and de Bruin–Keijman approaches also produce lower estimations due to their potential inability to consider humidity and wind speed variations [168,169]. The Hamon method, due to its temperature-based methodology, gives little consideration to meteorological factors like wind speed, humidity, or radiation, leading to different evaporation patterns than other methods [170]. These findings suggest that future studies should compare model data with measured data to evaluate the model’s accuracy. A deeper comprehension of the data’s applicability and dependability for assessing the evaporation rate in Northern Cyprus can be attained through this comparison analysis, which can also help reveal the constraints and uncertainties surrounding the data.
Furthermore, different scenarios of covering the reservoir’s surface with an FPVS were studied and discussed. It was found that water savings grow dramatically as coverage increases from 0% to 100%, indicating that the system is successful in minimizing evaporation. For example, annual savings with 100% coverage can be as high as 6.21 × 10⁵ m3, as opposed to 0 m3 in the absence of photovoltaic panels. This pattern makes the obvious relationship between covering area and evaporation decrease evident. Floating PV systems can be a useful tool for managing water resources in reservoirs and dams, since they represent a feasible choice for water conservation, as demonstrated by the significant savings that rise with increased coverage. These results can be supported by previous studies. For instance, according to Abd-Elhamid et al. [149], areas of the lake that are covered by 25%, 50%, 75%, and 100% can save around 2.1, 4.2, 6.3, 7.0, and 8.4 × 10⁹ m3/year. Ilgen et al. [171] estimated water savings of up to 5.9 billion m3/year and a 49.7% evaporation reduction at 90% FPV occupancy.
Moreover, a technical and financial assessment was conducted on the installation of FPV systems with various PV technologies, floating structures, and capacity, taking into account that the covering area (25, 50, and 75 percent) of the reservoir determines the FV system’s capacity. The results indicated that the floating PV system structure (OceanSun S6), which is specified with a north orientation and a tilt angle of 6°, produced the maximum performance compared to other floating PV system structures. It is found that the AEP values are within the range of 2.5–38.7 GWh for a 25% covered area, 5.0–77.3 GWh for a 50% covered area, and 7.5–116.0 GWh for a 75% covered area. Also, it is found that the FPV systems’ annual CF values range from 18.50% to 27.37%. These findings can be confirmed by several scientific researchers, who examined the techno-economic performance of FPV systems in terms of CF. For instance, López et al. [141] found the CF value for the proposed FPV system in mainland Spain varied between 13.64% and 21.97%. Lopes et al. [172] found that the annual CF value for proposed FPV systems in Brazil is within the range of 18.8–20.0%. Al Saadi and Ghosh [
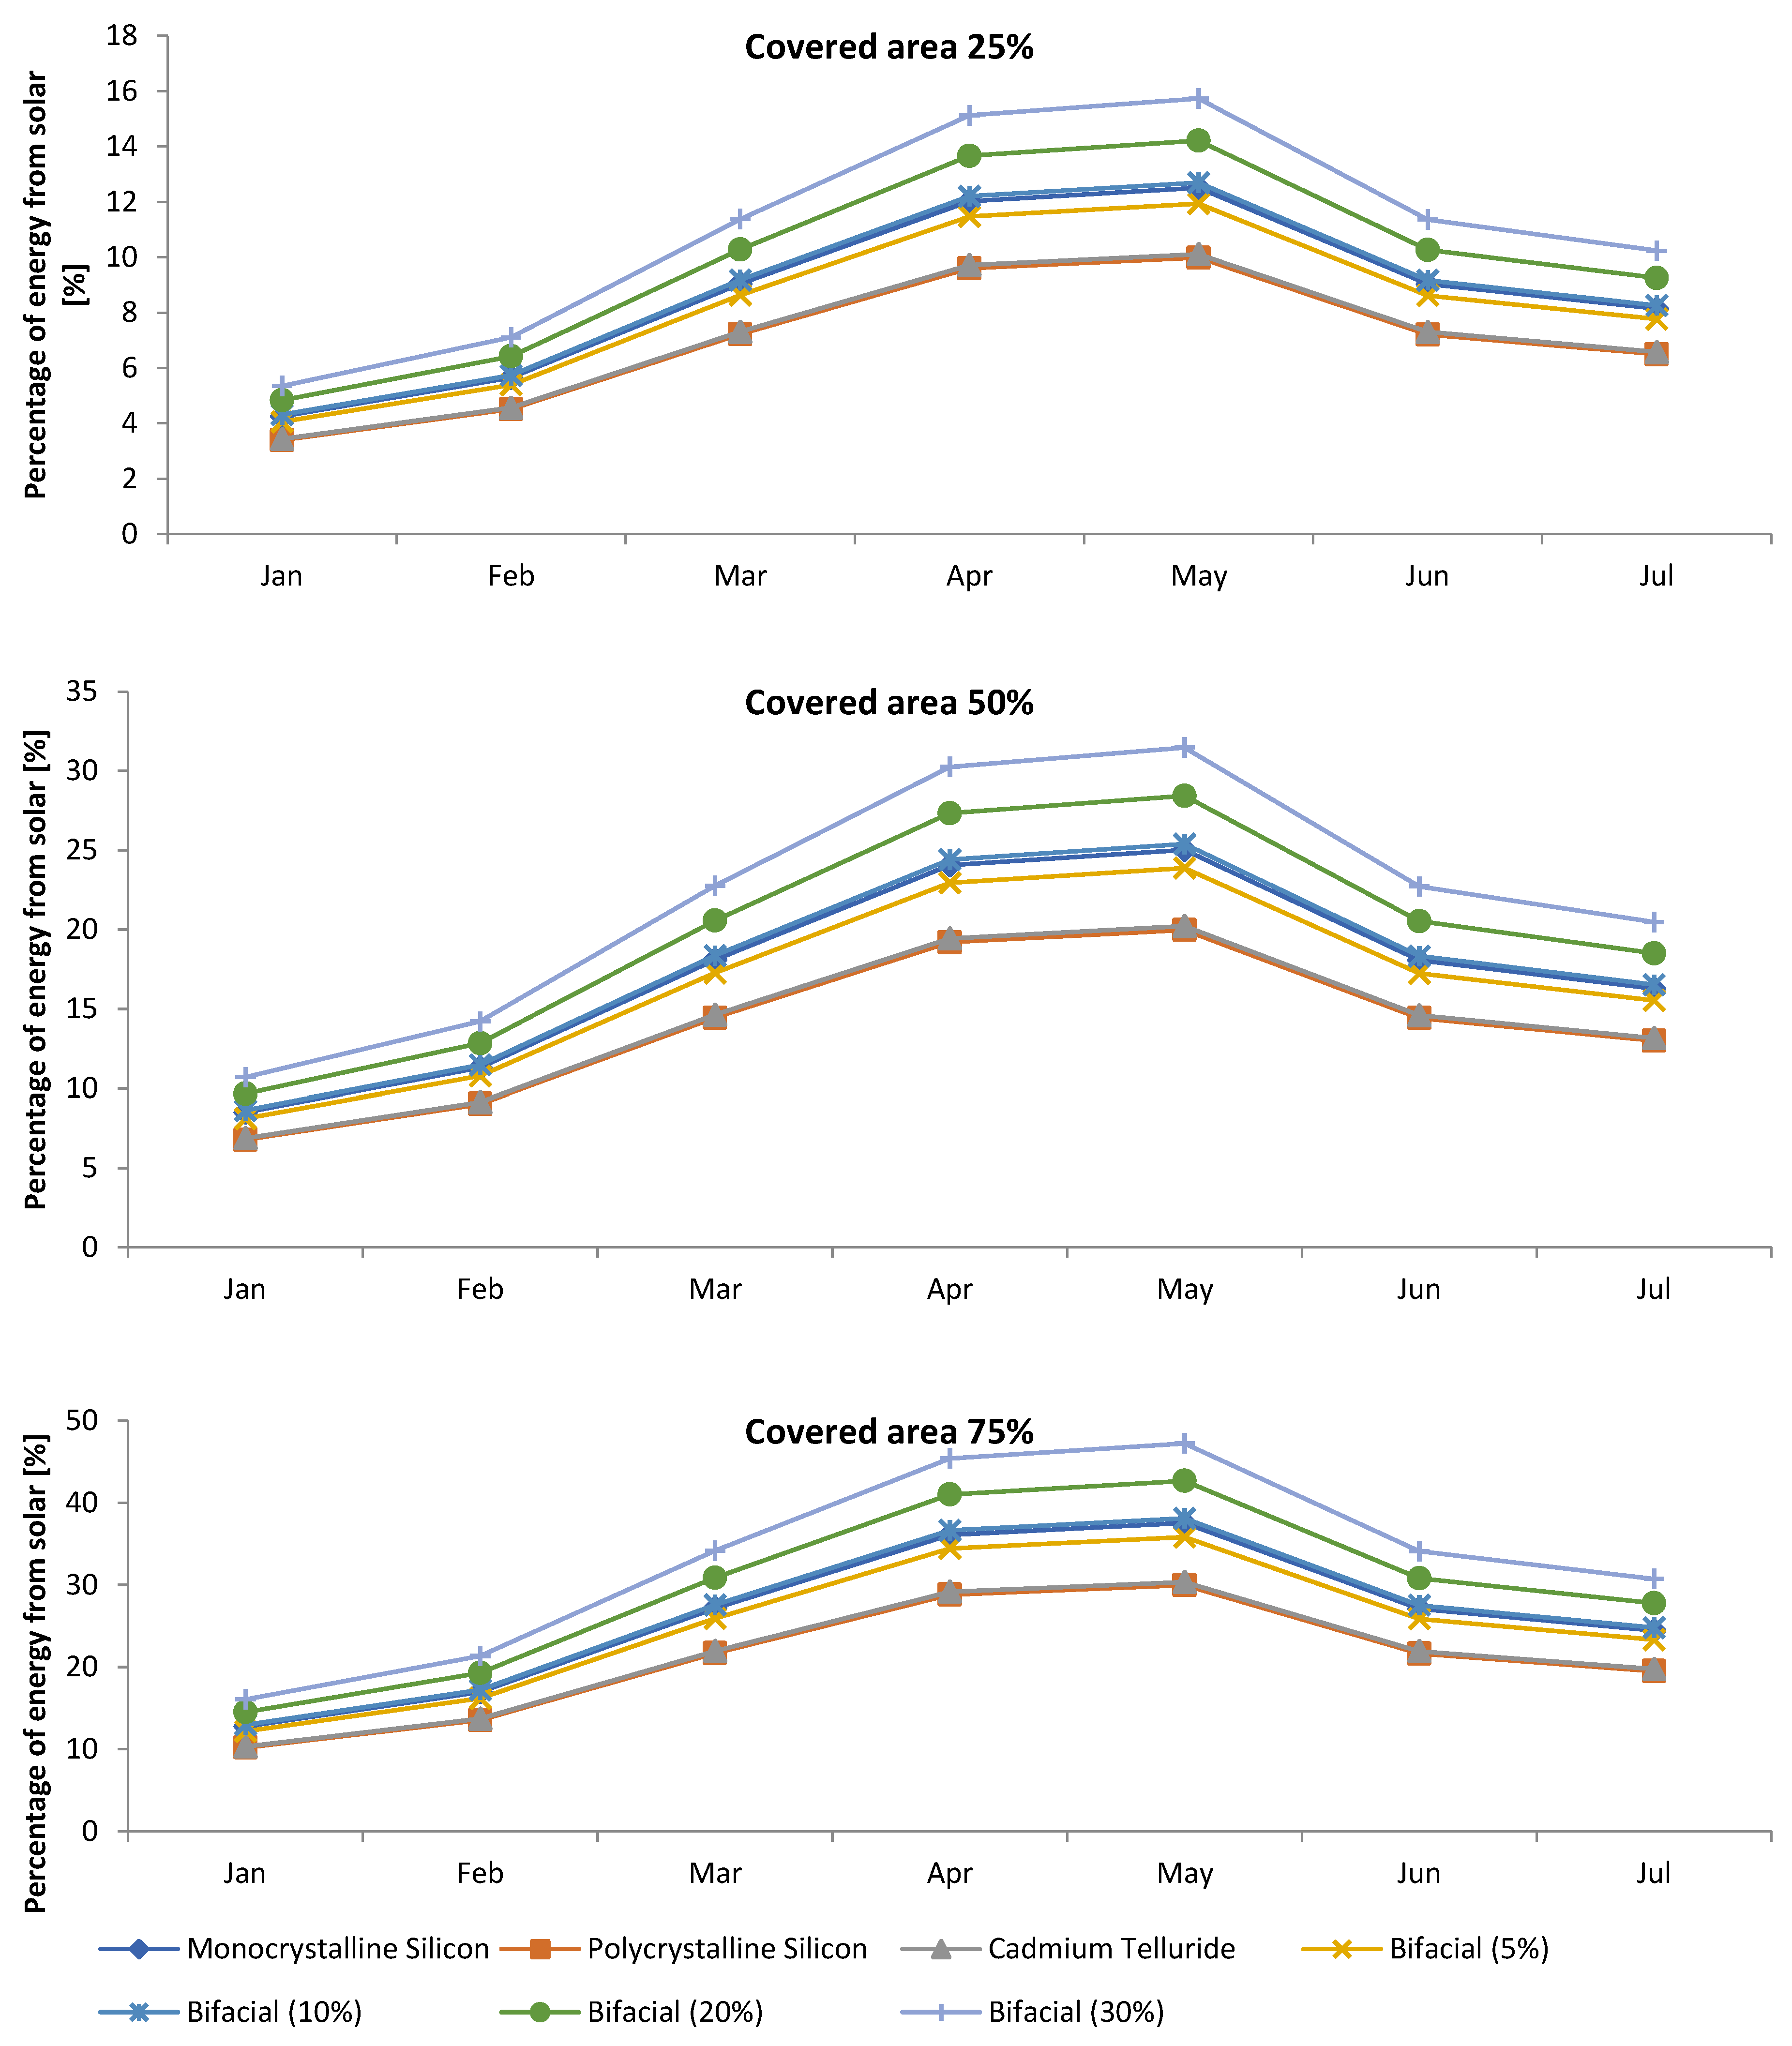
173] estimated that the value of CF for the proposed FPV system in Oman was 23.3%. Consequently, based on the technical viability of the solar system, it is technically feasible to construct a floating solar photovoltaic system in each of the 15 sites in Northern Cyprus, since the values of AEP and CF there are compatible with the acceptable values. Based on the analysis, the percentage of reduction in electricity production from fossil fuels due to solar energy production from the proposed FPV system is illustrated in Figure 13. It is observed that the percentage of reduction in electricity production from fossil fuels can vary from 10.19% to 47.21% at 75% FPV occupancy. It should be noted that the monthly electrical consumption for the period of January–July 2024 is estimated to be 169.52, 153.49, 144.87, 128.27, 141.31, 214.33, and 247.70 GWh, respectively, according to the Cyprus Turkish Electricity Authority (KIB-TEK).
Furthermore, the feasibility of floating PV systems in Northern Cyprus was studied. It is found that, depending on the PV technology employed, the SPP value ranged between 4.07 and 6.24 years, while the value of energy production cost varied between 0.0163 and 0.025 USD/kWh. The annual reduction in GHG was estimated at 44,413.90 tons at 75% FPV occupancy.
In summary, this study is the first attempt to illustrate the importance of implementing an FPV system on the reservoir surfaces of Northern Cyprus by focusing on the most significant factors. The FPV system ultimately creates a new investment avenue, where several variables contribute to cost savings and environmental improvement.

Supplementary Materials

The following supporting information can be downloaded at: https://www.mdpi.com/article/10.3390/en17215300/s1, Figure S1. Long-term averages of solar resource [25]; Figure S2. Probability density function for solar radiation data at Gemikonağı Madendere; Figure S3. Probability density function for solar radiation data at Ergazi Sayadere; Figure S4. Surface area of the selected lake, reservoir, and dams; Figure S5. Annual water losses at the selected locations; Figure S6. Annual energy production with various floating PV structures at different locations for first scenario (covered area 50%); Figure S7. Annual energy production with various floating PV structures at different locations for first scenario (covered area 75%); Table S1. Summary of previous studies focusing on solar energy potential in Northern Cyprus; Table S2. The most efficient distribution functions (DF) fitting the average daily GHI data at Gemikonağı Madendere; Table S3. The most efficient distribution functions (DF) fitting the average daily GHI data at Hamitköy Baştanlıkdere; Table S4. The most efficient distribution functions (DF) fitting the average daily GHI data at Ergazi Sayadere; Table S5. Monthly average evaporation [mm/month] at various water body storage durign the period of 2010–2023; Table S6. Main specifications of the selected PV modules; Table S7. Main specifications of the selected inverter.

Author Contributions

Conceptualization, Y.K. and R.G.; methodology, Y.K. and R.G.; software, Y.K.; validation, Y.K. and R.G.; investigation, Y.K. and H.G.; writing—original draft preparation, Y.K. and R.G.; writing—review and editing, Y.K. and H.G.; supervision, Y.K. and H.G. All authors have read and agreed to the published version of the manuscript.

Funding

This research received no external funding.

Data Availability Statement

The original contributions presented in the study are included in the article/Supplementary Material, further inquiries can be directed to the corresponding author.

Acknowledgments

The authors would like to thank the Civil and Environmental Engineering Faculty at Near East University for their support and encouragement.

Conflicts of Interest

The authors declare no conflicts of interest.

References

  1. Jawad, A.; Hasan, M.S.; Faruqui, M.F.I. Small-scale floating photovoltaic systems in university campus: A pathway to achieving SDG 7 goals in Bangladesh. Energy Convers. Manag. 2023, 297, 117722. [Google Scholar] [CrossRef]
  2. Sánchez, A.; Zhang, Q.; Martín, M.; Vega, P. Towards a new renewable power system using energy storage: An economic and social analysis. Energy Convers. Manag. 2022, 252, 115056. [Google Scholar] [CrossRef]
  3. Holechek, J.L.; Geli, H.M.; Sawalhah, M.N.; Valdez, R. A global assessment: Can renewable energy replace fossil fuels by 2050? Sustainability 2022, 14, 4792. [Google Scholar] [CrossRef]
  4. Obaideen, K.; Olabi, A.G.; Al Swailmeen, Y.; Shehata, N.; Abdelkareem, M.A.; Alami, A.H.; Sayed, E.T. Solar energy: Applications, trends analysis, bibliometric analysis and research contribution to sustainable development goals (SDGs). Sustainability 2023, 15, 1418. [Google Scholar] [CrossRef]
  5. Vivar, M.; Sharon, H.; Fuentes, M. Photovoltaic system adoption in water related technologies—A review. Renew. Sustain. Energy Rev. 2024, 189, 114004. [Google Scholar] [CrossRef]
  6. Du, S.; Liang, C.; Sun, H.; Wang, K.; Wang, J.; Li, H.; Zhang, W. Evaluating the potential benefits of float solar photovoltaics through the water footprint recovery period. J. Clean. Prod. 2024, 446, 141399. [Google Scholar] [CrossRef]
  7. Jin, Y.; Hu, S.; Ziegler, A.D.; Gibson, L.; Campbell, J.E.; Xu, R.; Zeng, Z. Energy production and water savings from floating solar photovoltaics on global reservoirs. Nat. Sustain. 2023, 6, 865–874. [Google Scholar] [CrossRef]
  8. Charles Lawrence Kamuyu, W.; Lim, J.R.; Won, C.S.; Ahn, H.K. Prediction model of photovoltaic module temperature for power performance of floating PVs. Energies 2018, 11, 447. [Google Scholar] [CrossRef]
  9. Choi, Y.K.; Lee, Y.G. A study on development of rotary structure for tracking-type floating photovoltaic system. Int. J. Precis. Eng. Manuf. 2014, 15, 2453–2460. [Google Scholar] [CrossRef]
  10. Abdelgaied, M.; Kabeel, A.E.; Zeleňáková, M.; Abd-Elhamid, H.F. Floating Photovoltaic Plants as an Effective Option to Reduce Water Evaporation in Water-Stressed Regions and Produce Electricity: A Case Study of Lake Nasser, Egypt. Water 2023, 15, 635. [Google Scholar] [CrossRef]
  11. Liu, L.; Sun, Q.; Li, H.; Yin, H.; Ren, X.; Wennersten, R. Evaluating the benefits of integrating floating photovoltaic and pumped storage power system. Energy Convers. Manag. 2019, 194, 173–185. [Google Scholar] [CrossRef]
  12. Pringle, A.M.; Handler, R.M.; Pearce, J.M. Aquavoltaics: Synergies for dual use of water area for solar photovoltaic electricity generation and aquaculture. Renew. Sustain. Energy Rev. 2017, 80, 572–584. [Google Scholar] [CrossRef]
  13. Taboada, M.E.; Cáceres, L.; Graber, T.A.; Galleguillos, H.R.; Cabeza, L.F.; Rojas, R. Solar water heating system and photovoltaic floating cover to reduce evaporation: Experimental results and modeling. Renew. Energy 2017, 105, 601–615. [Google Scholar] [CrossRef]
  14. Cazzaniga, R.; Cicu, M.; Rosa-Clot, M.; Rosa-Clot, P.; Tina, G.M.; Ventura, C. Compressed air energy storage integrated with floating photovoltaic plant. J. Energy Storage 2017, 13, 48–57. [Google Scholar] [CrossRef]
  15. Oliveira-Pinto, S.; Stokkermans, J. Assessment of the potential of different floating solar technologies–Overview and analysis of different case studies. Energy Convers. Manag. 2020, 211, 112747. [Google Scholar] [CrossRef]
  16. Durković, V.; Đurišić, Ž. Analysis of the potential for use of floating PV power plant on the Skadar Lake for electricity supply of aluminium plant in Montenegro. Energies 2017, 10, 1505. [Google Scholar] [CrossRef]
  17. Sunny, M.R.; Kabir, M.A.; Sarker, M.S.Z.; Aghaloo, K.; Ali, T. Feasibility study of floating solar photovoltaic systems using techno-economic assessment and multi-criteria decision-making method: A case study of Bangladesh. Energy 2024, 310, 133202. [Google Scholar] [CrossRef]
  18. Ranjbaran, P.; Yousefi, H.; Gharehpetian, G.B.; Astaraei, F.R. A review on floating photovoltaic (FPV) power generation units. Renew. Sustain. Energy Rev. 2019, 110, 332–347. [Google Scholar] [CrossRef]
  19. Micheli, L.; Talavera, D.L.; Tina, G.M.; Almonacid, F.; Fernández, E.F. Techno-economic potential and perspectives of floating photovoltaics in Europe. Sol. Energy 2022, 243, 203–214. [Google Scholar] [CrossRef]
  20. Islam, M.I.; Jadin, M.S.; Mansur, A.A.; Kamari, N.A.M.; Jamal, T.; Hossain Lipu, M.S.; Shihavuddin, A.S.M. Techno-economic and carbon emission assessment of a large-scale floating solar Pv system for sustainable energy generation in support of Malaysia’s renewable energy roadmap. Energies 2023, 16, 4034. [Google Scholar] [CrossRef]
  21. Islam, M.I.; Maruf, M.H.; Al Mansur, A.; Ashique, R.H.; ul Haq, M.A.; Shihavuddin, A.S.M.; Jadin, M.S. Feasibility analysis of floating photovoltaic power plant in Bangladesh: A case study in Hatirjheel Lake, Dhaka. Sustain. Energy Technol. Assess. 2023, 55, 102994. [Google Scholar] [CrossRef]
  22. Fereshtehpour, M.; Sabbaghian, R.J.; Farrokhi, A.; Jovein, E.B.; Sarindizaj, E.E. Evaluation of factors governing the use of floating solar system: A study on Iran’s important water infrastructures. Renew. Energy 2021, 171, 1171–1187. [Google Scholar] [CrossRef]
  23. Akçaba, S.; Eminer, F. Sustainable energy planning for the aspiration to transition from fossil energy to renewable energy in Northern Cyprus. Heliyon 2022, 8, e09813. [Google Scholar] [CrossRef] [PubMed]
  24. Kibris Türk Elektrik Kurumu. Available online: https://www.kibtek.com/ (accessed on 5 August 2024).
  25. Solargis. Global Solar Atlas. Available online: https://globalsolaratlas.info/ (accessed on 5 June 2024).
  26. Prăvălie, R.; Patriche, C.; Bandoc, G. Spatial assessment of solar energy potential at global scale. A geographical approach. J. Clean. Prod. 2019, 209, 692–721. [Google Scholar] [CrossRef]
  27. Agathokleous, R.A.; Kalogirou, S.A. PV roofs as the first step towards 100% RES electricity production for Mediterranean islands: The case of Cyprus. Smart Energy 2021, 4, 100053. [Google Scholar] [CrossRef]
  28. Shemshaki, M.S. Efficiency of Solar Domestic Hot Water System: The Case of Famagusta Northern Cyprus. Master’s Thesis, Eastern Mediterranean University (EMU)-Doğu Akdeniz Üniversitesi (DAÜ), Gazimağusa, Turkey, 2016. [Google Scholar]
  29. Maltini, F.; Minder, R. The Serhatköy photovoltaic power plant and the future of renewable energy on the Turkish Republic of Northern Cyprus: Integrating Solar Photovoltaic and Wind Farms into Electricity Transmission and Distribution Networks. In Eco-Friendly Innovation in Electricity Transmission and Distribution Networks; Woodhead Publishing: Cambridge, MA, USA, 2015. [Google Scholar]
  30. Egelioglu, F.; Mohamad, A.; Guven, H. Economic variables and electricity consumption in Northern Cyprus. Energy 2001, 26, 355–362. [Google Scholar] [CrossRef]
  31. Al-Ghussain, L.; Taylan, O.; Samu, R.; Fahrioglu, M. Techno-economic analysis of photovoltaic-hydrogen fuel cell/pumped hydro storage system for micro grid applications: Case study in Cyprus. In Proceedings of the 2018 International Conference on Photovoltaic Science and Technologies (PVCon), Ankara, Turkey, 4–6 July 2018; pp. 1–6. [Google Scholar]
  32. Dakyen, M.M.; Dagbasi, M.; Özdenefe, M. Energy models for cost-optimal analysis: Development and calibration of residential reference building models for Northern Cyprus. Indoor Built Environ. 2022, 31, 657–681. [Google Scholar] [CrossRef]
  33. Northern Cyprus Renewable Energy Board (YEKKurulu). Announcements. Available online: http://yek.gov.ct.tr (accessed on 2 May 2024).
  34. Abbasoglu, S. Techno-economic and environmental analysis of PV power plants in Northern Cyprus. Energy Educ. Sci. Technol. Part A 2011, 28, 357–368. [Google Scholar]
  35. Yenen, M.; Ercan, F.; Fahrioglu, M. Solar thermal system analysis of Northern Cyprus. In Proceedings of the EECS’12—7th International Symposium on Electrical and Computer Systems, Lefke, Northern Cyprus, 29–30 November 2012. [Google Scholar]
  36. Okoye, C.O.; Atikol, U. A parametric study on the feasibility of solar chimney power plants in North Cyprus conditions. Energy Convers. Manag. 2014, 80, 178–187. [Google Scholar] [CrossRef]
  37. Maltini, F.; Minder, R. The Serhatköy photovoltaic power plant and the future of renewable energy on the Turkish Republic of Northern Cyprus. In Eco-Friendly Innovation in Electricity Transmission and Distribution Networks; Woodhead Publishing: Cambridge, UK, 2015; pp. 377–402. [Google Scholar]
  38. Ozerdem, O.C.; Tackie, S.; Biricik, S. Performance evaluation of Serhatkoy (1.2 MW) PV power plant. In Proceedings of the 9th International Conference on Electrical and Electronics Engineering (ELECO 2015), Bursa, Turkey, 26–28 November 2015. [Google Scholar]
  39. Kamali, S. Feasibility analysis of standalone photovoltaic electrification system in a residential building in Cyprus. Renew. Sustain. Energy Rev. 2016, 65, 1279–1284. [Google Scholar] [CrossRef]
  40. Dagbasi, M.; Bamisile, O.; Adii, C. The techno-economic comparison of solar power generation methods for Turkish Republic of North Cyprus. In Proceedings of the 2016 HONET-ICT, Nicosia, Cyprus, 13–14 October 2016; pp. 17–23. [Google Scholar]
  41. Cabacaba, N.; Abbasoğlu, S. Evaluation of Wind–Solar Hybrid System for a Household in Northern Cyprus. In Towards 100% Renewable Energy; Springer: Cham, Switzerland, 2017; pp. 313–321. [Google Scholar]
  42. Kassem, Y.; Gökçekuş, H.; Çamur, H. Economic assessment of renewable power generation based on wind speed and solar radiation in urban regions. Glob. J. Environ. Sci. Manag. 2018, 4, 465–482. [Google Scholar]
  43. Kassem, Y.; Gökçekuş, H. GHG Emissions and Energy Performance of 1MW Grid-Connected Solar PV Plant at Lefke in Northern Cyprus: Case Study. Disaster Sci. Eng. 2018, 4, 90–98. [Google Scholar]
  44. Ouria, M.; Sevinc, H. Evaluation of the potential of solar energy utilization in Famagusta, Cyprus. Sust. Cities Society 2018, 37, 189–202. [Google Scholar] [CrossRef]
  45. Al-Ghussain, L.; Abujubbeh, M.; Fahrioglu, M. Assessment of PV investments in Northern Cyprus. In Proceedings of the 16th International Conference on Clean Energy, Famagusta, Cyprus, 9–11 May 2018; pp. 9–11. [Google Scholar]
  46. Hastunç, M.; Tekbıyık-Ersoy, N. Optimizing Residential Renewable Energy Utilization in North Cyprus: Case Study of Solar Energy. In Proceedings of the 16th International Conference on Clean Energy, Famagusta, Cyprus, 9–11 May 2018. [Google Scholar]
  47. Kassem, Y.; Al Zoubi, R.; Gökçekuş, H. The possibility of generating electricity using small-scale wind turbines and solar photovoltaic systems for households in Northern Cyprus: A comparative study. Environments 2019, 6, 47. [Google Scholar] [CrossRef]
  48. Kassem, Y.; Gokcekus, H.; Alsayas, S.M. Freestanding PV solar system—Example of Lefke town in Northern Cyprus. Int. J. Appl. Eng. Res. 2019, 14, 2522–2526. [Google Scholar]
  49. Ogbeba, J.; Hoskara, E. The Evaluation of Single-Family Detached Housing Units in terms of Integrated Photovoltaic Shading Devices: The Case of Northern Cyprus. Sustainability 2019, 11, 593. [Google Scholar] [CrossRef]
  50. Kassem, Y.; Gökçekuş, H.; Güvensoy, A. Solar Potential assessment in Near East University, Northern Cyprus. Int. J. Eng. Res. Technol. 2019, 12, 3061–3069. [Google Scholar]
  51. Gökçekuş, H.; Kassem, Y.; Abdi, S. Simulation and performance analysis of 110 KWP grid-connected photovoltaic (PV) systems for residential building in Northern Cyprus. Int. J. Innov. Technol. Explor. Eng. 2019, 8, 3082–3091. [Google Scholar]
  52. Oner, H. Economic Feasibility Assessment of Solar Powered Seawater Desalination Plants: Unconventional Fresh Water Supply for Guzelyurt, Northern Cyprus. Master’s Thesis, Middle East Technical University, Nicosia, Cyprus, 2019. [Google Scholar]
  53. Al-Ghussain, L.; Taylan, O. Sizing methodology of a PV/wind hybrid system: Case study in cyprus. Environ. Prog. Sustain. Energy 2019, 38, e13052. [Google Scholar] [CrossRef]
  54. Kassem, Y.; Gokcekus, H.; Filitoglu, Ü.B. Performance Characteristics of Building Integrated and Freestanding Photovoltaic System with Various PV Technologies and Angles: A Case Study in NEU Grand Library, North Nicosia. J. Eng. Appl. Sci. 2020, 15, 1027–1042. [Google Scholar] [CrossRef]
  55. Kassem, Y.; Çamur, H.; Alhuoti, S.M.A. Solar energy technology for Northern Cyprus: Assessment, statistical analysis, and feasibility study. Energies 2020, 13, 940. [Google Scholar] [CrossRef]
  56. Al-Turjman, F.; Qadir, Z.; Abujubbeh, M.; Batunlu, C. Feasibility analysis of solar photovoltaic-wind hybrid energy system for household applications. Comput. Electr. Eng. 2020, 86, 106743. [Google Scholar] [CrossRef]
  57. Kassem, Y.; Gökçekuş, H.; Güvensoy, A. Techno-economic feasibility of grid-connected solar PV system at Near East University hospital, Northern Cyprus. Energies 2021, 14, 7627. [Google Scholar] [CrossRef]
  58. Kassem, Y.; Gökçekuş, H.; Gökçekuş, R. Economic Feasibility of Large-Scale Renewable Energy Projects in Mountain Location, Northern Cyprus. In International Conference on Natural Resources and Sustainable Environmental Management; Springer International Publishing: Cham, Switzerland, 2021; pp. 66–71. [Google Scholar]
  59. Kassem, Y.; Gökçekuş, H.; Iravanian, A.; Gökçekuş, R. Predictive suitability of renewable energy for desalination plants: The case of güzelyurt region in northern Cyprus. Model. Earth Syst. Environ. 2022, 8, 1–21. [Google Scholar] [CrossRef]
  60. Kassem, Y.; Gokcekus, H.; Aljatlawe, A. Utilization of Solar Energy for Electric Vehicle Charging and the Energy Consumption of Residential Buildings in Northern Cyprus: A Case Study. Eng. Technol. Appl. Sci. Res. 2023, 13, 11598–11607. [Google Scholar] [CrossRef]
  61. Kassem, Y.; Gokcekus, H.; Hamad, O.A.M.; Fayid, F.M.B. Economic viability of a 6.5 kW off-grid solar PV with various sun-tracking systems in Northern Cyprus: A case study. Eng. Technol. Appl. Sci. Res. 2023, 13, 10608–10621. [Google Scholar] [CrossRef]
  62. Ünlükuş, U.A. Economic Feasiblity of Floating Solar pv and Land-Based Solar pv in Northern Cyprus. Master’s Thesis, Middle East Technical University, Ankara, Türkiye, 2023. [Google Scholar]
  63. Elkiran, G.; Aslanova, F.; Hiziroglu, S. Effluent water reuse possibilities in Northern Cyprus. Water 2019, 11, 191. [Google Scholar] [CrossRef]
  64. Yildiz, D.; Çakmak, C. Peace River to Cyprus from Turkey; Hydropolitics Academy: Ankara, Turkey, 2014; pp. 1–34. [Google Scholar]
  65. Gökçekuş, H.; Olgun, E. Cenozoic stratigraphy of the Güzelyurt Basin, Turkish Republic of Northern Cyprus. TAPG Bull. 1993, 5, 57–68. [Google Scholar]
  66. Gökçekuş, H.; Doyuran, V. Evaluation of hydrochemical data from Güzelyurt Aquifer (Turkish Republic of Northern Cyprus) through Cluster Analysis. Turk. J. Earth Sci. 1995, 4, 1–10. [Google Scholar]
  67. Gökçekuş, H.; Doyuran, V. Groundwater budget for the Güzelyurt basin (North Cyprus). Proc. Int. Conf. Water Probl. Mediterr. Ctries. 1997, 11, 779–787. [Google Scholar]
  68. Gökçekuş, H.; Nourani, V. Lessons from Groundwater Quantity and Quality Problems in the Güzelyurt Coastal Aquifer, North Cyprus. In Advances in Environmental Research; Nova Science Publishers, Inc.: New York, NY, USA, 2018; Volume 64. [Google Scholar]
  69. Gökçekuş, H.; Doyuran, V. Evaluation of domestic and agricultural quality of the groundwater in the Güzelyurt Basin (North Cyprus). Proc. Int. Conf. Water Probl. Mediterr. Ctries. 1997, 11, 1305–1314. [Google Scholar]
  70. Arslan, B.; Akün, E. Management, contamination, and quality evaluation of groundwater in North Cyprus. Agric. Water Manag. 2019, 222, 1–11. [Google Scholar] [CrossRef]
  71. Gökçekuş, H.; Doyuran, V. Groundwater budget for the Güzelyurt Aquifer: An example for an overdraft. In Proceedings of the International Conference on Water Problems in the Mediterranean Countries; NEU: Lefkoşa, Cyprus, 1998; Volume 5, pp. 779–787. [Google Scholar]
  72. Gökçekuş, H.; Türker, U.; Sözen, S.; Orhon, D. Water management difficulties with limited and contaminated water resources. In Proceedings of the International Conference on the Environmental Problem of the Mediterranean Region, Nicosia, Cyprus, 12–15 April 2002; pp. 1241–1249. [Google Scholar]
  73. Payab, A.H.; Türker, U. Comparison of standardized meteorological indices for drought monitoring at northern part of Cyprus. Environ. Earth Sci. 2019, 78, 309. [Google Scholar] [CrossRef]
  74. Park, E.J. Strategy of Water Distribution for Sustainable Community: Who Owns Water in Divided Cyprus? Sustainability 2020, 12, 8978. [Google Scholar] [CrossRef]
  75. Kahramanoğlu, I.; Usanmaz, S.; Alas, T. Water footprint and irrigation use efficiency of important crops in Northern Cyprus from an environmental, economic and dietary perspective. Saudi J. Biol. Sci. 2020, 27, 134–141. [Google Scholar] [CrossRef]
  76. Elkiran, G.; Ongul, Z. Implications of excessive water withdrawals to the environment of Northern Cyprus. Water Environ. J. 2009, 23, 245. [Google Scholar] [CrossRef]
  77. Sofroniou, A.; Bishop, S. Water Scarcity in Cyprus: A Review and Call for Integrated Policy. Water 2014, 6, 2898–2928. [Google Scholar] [CrossRef]
  78. Feldman, D.; Barbose, G.; Margolis, R.; Bolinger, M.; Chung, D.; Fu, R.; Wiser, R. Photovoltaic System Pricing Trends: Historical, Recent, and Near-Term Projections 2015 Edition. 2015. Available online: https://escholarship.org/content/qt9pc3x32t/qt9pc3x32t.pdf (accessed on 15 October 2024).
  79. El Hammoumi, A.; Chalh, A.; Allouhi, A.; Motahhir, S.; El Ghzizal, A.; Derouich, A. Design and construction of a test bench to investigate the potential of floating PV systems. J. Clean. Prod. 2021, 278, 123917. [Google Scholar] [CrossRef]
  80. Marion, W.F. Overview of the PV Module Model in PVWatts; National Renewable Energy Laboratory: Golden, CO, USA, 2010. [Google Scholar]
  81. Skoplaki, E.; Palyvos, J.A. On the temperature dependence of photovoltaic module electrical performance: A review of efficiency/power correlations. Sol. Energy 2009, 83, 614–624. [Google Scholar] [CrossRef]
  82. Nisar, H.; Janjua, A.K.; Hafeez, H.; Shahzad, N.; Waqas, A. Thermal and electrical performance of solar floating PV system compared to on-ground PV system-an experimental investigation. Sol. Energy 2018, 241, 231–247. [Google Scholar] [CrossRef]
  83. Choi, Y.K.; Choi, W.S.; Lee, J.H. Empirical research on the efficiency of floating PV systems. Sci. Adv. Mater. 2016, 8, 681–685. [Google Scholar] [CrossRef]
  84. Boduch, A.; Mik, K.; Castro, R.; Zawadzki, P. Technical and economic assessment of a 1 MWp floating photovoltaic system in Polish conditions. Renew. Energy 2022, 196, 983–994. [Google Scholar] [CrossRef]
  85. Liu, H.; Krishna, V.; Lun Leung, J.; Reindl, T.; Zhao, L. Field experience and performance analysis of floating PV technologies in the tropics. Prog. Photovolt. Res. Appl. 2018, 26, 957–967. [Google Scholar] [CrossRef]
  86. Goswami, A.; Sadhu, P.K. Degradation analysis and the impacts on feasibility study of floating solar photovoltaic systems. Sustain. Energy Grids Netw. 2021, 26, 100425. [Google Scholar] [CrossRef]
  87. Junianto, B.; Dewi, T.; Sitompul, C.R. Development and Feasibility Analysis of Floating Solar Panel Application in Palembang, South Sumatra. In Journal of Physics: Conference Series; IOP Publishing: Cambridge, MA, USA, 2020; Volume 1500, p. 012016. [Google Scholar]
  88. Essak, L.; Ghosh, A. Floating photovoltaics: A review. Clean Technol. 2022, 4, 752–769. [Google Scholar] [CrossRef]
  89. Badhoutiya, A. Advancements in PV Technology-Floating Photovoltaics. In Proceedings of the 2023 5th International Conference on Smart Systems and Inventive Technology (ICSSIT), Tirunelveli, India, 23–25 January 2023; pp. 382–385. [Google Scholar]
  90. Ramanan, C.J.; Lim, K.H.; Kurnia, J.C.; Roy, S.; Bora, B.J.; Medhi, B.J. Towards sustainable power generation: Recent advancements in floating photovoltaic technologies. Renew. Sustain. Energy Rev. 2024, 194, 114322. [Google Scholar]
  91. Koondhar, M.A.; Albasha, L.; Mahariq, I.; Graba, B.B.; Touti, E. Reviewing floating photovoltaic (FPV) technology for solar energy generation. Energy Strategy Rev. 2024, 54, 101449. [Google Scholar] [CrossRef]
  92. Ghigo, A.; Faraggiana, E.; Sirigu, M.; Mattiazzo, G.; Bracco, G. Design and analysis of a floating photovoltaic system for offshore installation: The case study of Lampedusa. Energies 2022, 15, 8804. [Google Scholar] [CrossRef]
  93. Li, Z.; Chen, D.; Feng, X.; Chen, J.F. Hydroelastic analysis and structural design of a modular floating structure applying ultra-high performance fiber-reinforced concrete. Ocean Eng. 2023, 277, 114266. [Google Scholar] [CrossRef]
  94. Ravichandran, N.; Ravichandran, N.; Panneerselvam, B. Review on the structural components of floating photovoltaic covering systems. In Intelligent Manufacturing and Energy Sustainability: Proceedings of ICIMES 2021; Springer: Singapore, 2021; pp. 125–133. [Google Scholar]
  95. Rosa-Clot, M. Floating PV Plants; Academic Press: Cambridge, MA, USA, 2020. [Google Scholar]
  96. Claus, R.; López, M. A methodology to assess the dynamic response and the structural performance of floating photovoltaic systems. Sol. Energy 2023, 262, 111826. [Google Scholar] [CrossRef]
  97. Claus, R.; López, M. Key issues in the design of floating photovoltaic structures for the marine environment. Renew. Sustain. Energy Rev. 2022, 164, 112502. [Google Scholar] [CrossRef]
  98. Ghosh, A. A comprehensive review of water based PV: Flotavoltaics, under water, offshore & canal top. Ocean Eng. 2023, 281, 115044. [Google Scholar]
  99. Delacroix, S.; Bourdier, S.; Soulard, T.; Elzaabalawy, H.; Vasilenko, P. Experimental modelling of a floating solar power plant array under wave forcing. Energies 2023, 16, 5198. [Google Scholar] [CrossRef]
  100. Ravichandran, N.; Fayek, H.H.; Rusu, E. Emerging floating photovoltaic system—Case studies high dam and Aswan reservoir in Egypt. Processes 2021, 9, 1005. [Google Scholar] [CrossRef]
  101. Chiang, C.H.; Young, C.H. An engineering project for a flood detention pond surface-type floating photovoltaic power generation system with an installed capacity of 32,600.88 kWp. Energy Rep. 2022, 8, 2219–2232. [Google Scholar] [CrossRef]
  102. Trapani, K.; Millar, D.L. Proposing offshore photovoltaic (PV) technology to the energy mix of the Maltese islands. Energy Convers. Manag. 2013, 67, 18–26. [Google Scholar] [CrossRef]
  103. Kim, S.H.; Yoon, S.J.; Choi, W. Design and construction of 1 MW class floating PV generation structural system using FRP members. Energies 2017, 10, 1142. [Google Scholar] [CrossRef]
  104. Sukarso, A.P.; Kim, K.N. Cooling effect on the floating solar PV: Performance and economic analysis on the case of west Java province in Indonesia. Energies 2020, 13, 2126. [Google Scholar] [CrossRef]
  105. Cazzaniga, R.; Rosa-Clot, M.; Rosa-Clot, P.; Tina, G.M. Integration of PV floating with hydroelectric power plants. Heliyon 2019, 5, e01918. [Google Scholar] [CrossRef]
  106. Huang, G.; Tang, Y.; Chen, X.; Chen, M.; Jiang, Y. A comprehensive review of floating solar plants and potentials for offshore applications. J. Mar. Sci. Eng. 2023, 11, 2064. [Google Scholar] [CrossRef]
  107. Lopes, M.P.C.; de Andrade Neto, S.; Branco, D.A.C.; de Freitas, M.A.V.; da Silva Fidelis, N. Water-energy nexus: Floating photovoltaic systems promoting water security and energy generation in the semiarid region of Brazil. J. Clean. Prod. 2020, 273, 122010. [Google Scholar] [CrossRef]
  108. Setiya, P.; Singh, M.; Nain, A.S. Evaluating the performance of Grid IMD, NASA POWER, and MarkSim timeseries weather dataset for Uttarakhand Climatic Condition. Theor. Appl. Climatol. 2024, 155, 2657–2668. [Google Scholar] [CrossRef]
  109. Quansah, A.D.; Dogbey, F.; Asilevi, P.J.; Boakye, P.; Darkwah, L.; Oduro-Kwarteng, S.; Mensah, P. Assessment of solar radiation resource from the NASA-POWER reanalysis products for tropical climates in Ghana towards clean energy application. Sci. Rep. 2022, 12, 10684. [Google Scholar] [CrossRef] [PubMed]
  110. Aboelkhair, H.; Morsy, M.; El Afandi, G. Assessment of agroclimatology NASA POWER reanalysis datasets for temperature types and relative humidity at 2 m against ground observations over Egypt. Adv. Space Res. 2019, 64, 129–142. [Google Scholar] [CrossRef]
  111. Ferreira, M.M.; Santos, J.A.; da Silva, L.R.; Abrahao, R.; Gomes FDS, V.; Braz, H.D.M. A new index to evaluate renewable energy potential: A case study on solar, wind and hybrid generation in Northeast Brazil. Renew. Energy 2023, 217, 119182. [Google Scholar] [CrossRef]
  112. Hamad, J.; Ahmad, M.; Zeeshan, M. Solar energy resource mapping, site suitability and techno-economic feasibility analysis for utility scale photovoltaic power plants in Afghanistan. Energy Convers. Manag. 2024, 303, 118188. [Google Scholar] [CrossRef]
  113. Owolabi, A.B.; Nsafon, B.E.K.; Roh, J.W.; Suh, D.; Huh, J.S. Validating the techno-economic and environmental sustainability of solar PV technology in Nigeria using RETScreen Experts to assess its viability. Sustain. Energy Technol. Assess. 2019, 36, 100542. [Google Scholar] [CrossRef]
  114. Belkilani, K.; Ben Othman, A.; Besbes, M. Assessment of global solar radiation to examine the best locations to install a PV system in Tunisia. Appl. Phys. A 2018, 124, 122. [Google Scholar] [CrossRef]
  115. Gairaa, K.; Bakelli, Y. Solar energy potential assessment in the Algerian south area: Case of Ghardaïa region. J. Renew. Energy 2013, 2013, 496348. [Google Scholar] [CrossRef]
  116. Tahir, Z.R.; Asim, M. Surface measured solar radiation data and solar energy resource assessment of Pakistan: A review. Renew. Sustain. Energy Rev. 2018, 81, 2839–2861. [Google Scholar] [CrossRef]
  117. Bhatia, S.C. Advanced Renewable Energy Systems; Woodhead: New Delhi, India, 2014. [Google Scholar]
  118. Jiang, Z.; Li, R.; Li, A.; Ji, C. Runoff forecast uncertainty considered load adjustment model of cascade hydropower stations and its application. Energy 2018, 158, 693–708. [Google Scholar] [CrossRef]
  119. Karipoğlu, F.; Koca, K.; İlbahar, E. Convenient Site Selection of a Floating PV Power Plant in Türkiye by using GIS-Fuzzy Analytical Hierarchy Process. Environ. Sci. Pollut. Res. 2024, 31, 23193–23210. [Google Scholar] [CrossRef] [PubMed]
  120. Yilmaz, O.S.; Ateş, A.M.; Gülgen, F. A novel approach suggestion for assessing the impact of topographic shading on the estimation of the floating photovoltaic technical potential. Energy 2023, 283, 128479. [Google Scholar] [CrossRef]
  121. Noorollahi, E.; Fadai, D.; Akbarpour Shirazi, M.; Ghodsipour, S.H. Land suitability analysis for solar farms exploitation using GIS and fuzzy analytic hierarchy process (FAHP)—A case study of Iran. Energies 2016, 9, 643. [Google Scholar] [CrossRef]
  122. Gökmener, S.; Oğuz, E.; Deveci, M.; Göllü, K. Site selection for floating photovoltaic system on dam reservoirs using sine trigonometric decision making model. Ocean Eng. 2023, 281, 114820. [Google Scholar] [CrossRef]
  123. Suh, J.; Brownson, J.R. Solar farm suitability using geographic information system fuzzy sets and analytic hierarchy processes: Case study of Ulleung Island, Korea. Energies 2016, 9, 648. [Google Scholar] [CrossRef]
  124. Wang, Y. Application of TOPSIS and AHP in the Multi-Objective Decision-Making Problems. In MATEC Web of Conferences; EDP Sciences: Les Ulis, France, 2018; Volume 228, p. 05002. [Google Scholar]
  125. Arthur, Y.D.; Gyamfi, K.B.; Appiah, S.K. Probability distributional analysis of hourly solar irradiation in Kumasi-Ghana. Int. J. Bus. Soc. Res. (IJBSR) 2013, 3, 63–75. [Google Scholar]
  126. Ayodele, T.R. Determination of probability distribution function for modelling global solar radiation: Case study of Ibadan, Nigeria. Int. J. Appl. Sci. Eng. 2015, 13, 233–245. [Google Scholar]
  127. Chang, T.P. Investigation on frequency distribution of global radiation using different probability density functions. Int. J. Appl. Sci. Eng. 2010, 8, 99–107. [Google Scholar]
  128. Dukkipati, S.; Sankar, V.; Varma, P.S. Forecasting of solar irradiance using probability distributions for a PV System: A case study. Int. J. Renew. Energy Res. (IJRER) 2019, 9, 741–748. [Google Scholar]
  129. Ettoumi, F.Y.; Mefti, A.; Adane, A.; Bouroubi, M.Y. Statistical analysis of solar measurements in Algeria using beta distributions. Renew. Energy 2002, 26, 47–67. [Google Scholar] [CrossRef]
  130. Kam, O.M.; Noël, S.; Ramenah, H.; Kasser, P.; Tanougast, C. Comparative Weibull distribution methods for reliable global solar irradiance assessment in France areas. Renew. Energy 2021, 165, 194–210. [Google Scholar] [CrossRef]
  131. Abiodun, C.I.; Anisiji, O.E. Performance Probability Distribution Function for Modelling Solar Radiation in South Southern Nigeria: A Case Study of Yenagoa. J. Energy Res. Rev. 2019, 2, 1–8. [Google Scholar] [CrossRef]
  132. Abdulkarim, A.; Abdelkader, S.M.; John Morrow, D. Statistical analyses of wind and solar energy resources for the development of hybrid microgrid. In Proceedings of the 2nd International Congress on Energy Efficiency and Energy Related Materials (ENEFM2014) Proceedings, Oludeniz, Fethiye/Mugla, Turkey, 16–19 October 2015; pp. 9–14. [Google Scholar]
  133. Shukla, K.N.; Rangnekar, S.; Sudhakar, K. Mathematical modelling of solar radiation incident on tilted surface for photovoltaic application at Bhopal, MP, India. Int. J. Ambient Energy 2016, 37, 579–588. [Google Scholar] [CrossRef]
  134. Demain, C.; Journée, M.; Bertrand, C. Evaluation of different models to estimate the global solar radiation on inclined surfaces. Renew. Energy 2013, 50, 710–721. [Google Scholar] [CrossRef]
  135. Othman, A.B.; Belkilani, K.; Besbes, M. Global solar radiation on tilted surfaces in Tunisia: Measurement, estimation and gained energy assessments. Energy Rep. 2018, 4, 101–109. [Google Scholar] [CrossRef]
  136. Yahyaoui, I. Chapter 2-Modeling of the photovoltaic irrigation plant components. In Specifications of Photovoltaic Pumping Systems in Agriculture; Elsevier: Amsterdam, The Netherlands, 2017; pp. 15–57. [Google Scholar]
  137. Castillo, C.P.; e Silva, F.B.; Lavalle, C. An assessment of the regional potential for solar power generation in EU-28. Energy Policy 2016, 88, 86–99. [Google Scholar] [CrossRef]
  138. Spencer, R.S.; Macknick, J.; Aznar, A.; Warren, A.; Reese, M.O. Floating photovoltaic systems: Assessing the technical potential of photovoltaic systems on man-made water bodies in the continental United States. Environ. Sci. Technol. 2018, 53, 1680–1689. [Google Scholar] [CrossRef]
  139. Kim, S.M.; Oh, M.; Park, H.D. Analysis and prioritization of the floating photovoltaic system potential for reservoirs in Korea. Appl. Sci. 2019, 9, 395. [Google Scholar] [CrossRef]
  140. Nebey, A.H.; Taye, B.Z.; Workineh, T.G. GIS-Based Irrigation Dams Potential Assessment of Floating Solar PV System. J. Energy 2020, 2020, 1268493. [Google Scholar] [CrossRef]
  141. López, M.; Soto, F.; Hernández, Z.A. Assessment of the potential of floating solar photovoltaic panels in bodies of water in mainland Spain. J. Clean. Prod. 2022, 340, 130752. [Google Scholar] [CrossRef]
  142. Liu, J.; Xu, F.; Lin, S. Site selection of photovoltaic power plants in a value chain based on grey cumulative prospect theory for sustainability: A case study in Northwest China. J. Clean. Prod. 2017, 148, 386–397. [Google Scholar] [CrossRef]
  143. Golroodbari, S.Z.; van Sark, W. Simulation of performance differences between offshore and land-based photovoltaic systems. Prog. Photovolt. Res. Appl. 2020, 28, 873–886. [Google Scholar] [CrossRef]
  144. Deveci, M.; Pamucar, D.; Oguz, E. Floating photovoltaic site selection using fuzzy rough numbers based LAAW and RAFSI model. Appl. Energy 2022, 324, 119597. [Google Scholar] [CrossRef]
  145. Habib, S.M.; Suliman AER, E.; Al Nahry, A.H.; Abd El Rahman, E.N. Spatial modeling for the optimum site selection of solar photovoltaics power plant in the northwest coast of Egypt. Remote Sens. Appl. Soc. Environ. 2020, 18, 100313. [Google Scholar] [CrossRef]
  146. Meng, X.; Liu, H.; Du, Q.; Xu, L.; Liu, Y. Evaluation of the performance of different methods for estimating evaporation over a highland open freshwater lake in mountainous area. Water 2020, 12, 3491. [Google Scholar] [CrossRef]
  147. Moazed, H.; Ghaemii, A.A.; Rafiee, M.R. Evaluation of Several Reference Evapotranspiration Methods: A Comparative Study of Greenhouse and Outdoor Conditions. Trans. Civ. Eng. 2014, 38, 421. [Google Scholar]
  148. Dlouhá, D.; Dubovský, V.; Pospíšil, L. Optimal calibration of evaporation models against Penman–Monteith equation. Water 2021, 13, 1484. [Google Scholar] [CrossRef]
  149. Abd-Elhamid, H.F.; Ahmed, A.; Zeleňáková, M.; Vranayová, Z.; Fathy, I. Reservoir management by reducing evaporation using floating photovoltaic system: A case study of Lake Nasser, Egypt. Water 2021, 13, 769. [Google Scholar] [CrossRef]
  150. Ghumman, A.R.; Ghazaw, Y.M.; Alodah, A.; Rauf, A.U.; Shafiquzzaman, M.; Haider, H. Identification of parameters of evaporation equations using an optimization technique based on pan evaporation. Water 2020, 12, 228. [Google Scholar] [CrossRef]
  151. Junzeng, X.U.; Qi, W.E.I.; Shizhang PEN, G.; Yanmei, Y.U. Error of saturation vapor pressure calculated by different formulas and its effect on calculation of reference evapotranspiration in high latitude cold region. Procedia Eng. 2012, 28, 43–48. [Google Scholar] [CrossRef]
  152. Wong, C.P.; Jiang, B.; Bohn, T.J.; Lee, K.N.; Lettenmaier, D.P.; Ma, D.; Ouyang, Z. Lake and wetland ecosystem services measuring water storage and local climate regulation. Water Resour. Res. 2017, 53, 3197–3223. [Google Scholar] [CrossRef]
  153. Febrian, H.G.; Supriyanto, A.; Purwanto, H. Calculating the energy capacity and capacity factor of floating photovoltaic (FPV) power plant in the cirata reservoir using different types of solar panels. In Journal of Physics: Conference Series; IOP Publishing: Bristol, UK, 2023; Volume 2498, p. 012007. [Google Scholar]
  154. Sahu, A.; Yadav, N.; Sudhakar, K. Floating photovoltaic power plant: A review. Renew. Sustain. Energy Rev. 2016, 66, 815–824. [Google Scholar] [CrossRef]
  155. Yashas, V.; Aman, B.; Dhanush, S. Feasibility study of floating solar panels over lakes in Bengaluru City, India. Proc. Inst. Civ. Eng.-Smart Infrastruct. Constr. 2021, 174, 1–10. [Google Scholar] [CrossRef]
  156. Semeskandeh, S.; Hojjat, M.; Hosseini Abardeh, M. Techno–economic–environmental comparison of floating photovoltaic plant with conventional solar photovoltaic plant in northern Iran. Clean Energy 2022, 6, 353–361. [Google Scholar] [CrossRef]
  157. Mittal, D.; Saxena, B.K.; Rao, K.V.S. Potential of floating photovoltaic system for energy generation and reduction of water evaporation at four different lakes in Rajasthan. In Proceedings of the 2017 International Conference on Smart Technologies for Smart Nation (SmartTechCon), Bengaluru, India, 17–19 August 2017; pp. 238–243. [Google Scholar]
  158. Alhassan, M.O.; Opoku, R.; Uba, F.; Obeng, G.Y.; Sekyere, C.K.; Nyanor, P. Techno-economic and environmental estimation assessment of floating solar PV power generation on Akosombo dam reservoir in Ghana. Energy Rep. 2023, 10, 2740–2755. [Google Scholar] [CrossRef]
  159. Nagababu, G.; Patil, P.; Bhatt, T.N.; Srinivas, B.A.; Puppala, H. Floating solar panels: A sustainable solution to meet energy demands and combat climate change in offshore regions. J. Therm. Anal. Calorim. 2024, 13, 1–8. [Google Scholar] [CrossRef]
  160. Taye, B.Z.; Nebey, A.H.; Workineh, T.G. Design of floating solar PV system for typical household on Debre Mariam Island. Cogent Eng. 2020, 7, 1829275. [Google Scholar] [CrossRef]
  161. Katircioğlu, S.T. Estimating higher education induced energy consumption: The case of Northern Cyprus. Energy 2014, 66, 831–838. [Google Scholar] [CrossRef]
  162. Kebede, K.Y. Viability study of grid-connected solar PV system in Ethiopia. Sustain. Energy Technol. Assess. 2015, 10, 63–70. [Google Scholar] [CrossRef]
  163. Khamees, A.K.; Abdelaziz, A.Y.; Eskaros, M.R.; Attia, M.A.; Badr, A.O. The mixture of probability distribution functions for wind and photovoltaic power systems using a metaheuristic method. Processes 2022, 10, 2446. [Google Scholar] [CrossRef]
  164. Langat, P.K.; Kumar, L.; Koech, R. Identification of the most suitable probability distribution models for maximum, minimum, and mean streamflow. Water 2019, 11, 734. [Google Scholar] [CrossRef]
  165. Sumner, D.M.; Jacobs, J.M. Utility of Penman–Monteith, Priestley–Taylor, reference evapotranspiration, and pan evaporation methods to estimate pasture evapotranspiration. J. Hydrol. 2005, 308, 81–104. [Google Scholar] [CrossRef]
  166. McKenney, M.S.; Rosenberg, N.J. Sensitivity of some potential evapotranspiration estimation methods to climate change. Agric. For. Meteorol. 1993, 64, 81–110. [Google Scholar] [CrossRef]
  167. Xiaoying, L.; Erda, L. Performance of the Priestley–Taylor equation in the semiarid climate of North China. Agric. Water Manag. 2005, 71, 1–17. [Google Scholar] [CrossRef]
  168. Jansen, F.A.; Teuling, A.J. Evaporation from a large lowland reservoir–(dis) agreement between evaporation models from hourly to decadal timescales. Hydrol. Earth Syst. Sci. 2020, 24, 1055–1072. [Google Scholar] [CrossRef]
  169. Liu, X.; Xu, C.; Zhong, X.; Li, Y.; Yuan, X.; Cao, J. Comparison of 16 models for reference crop evapotranspiration against weighing lysimeter measurement. Agric. Water Manag. 2017, 184, 145–155. [Google Scholar] [CrossRef]
  170. Nagananthini, R.; Nagavinothini, R. Investigation on floating photovoltaic covering system in rural Indian reservoir to minimize evaporation loss. Int. J. Sustain. Energy 2021, 40, 781–805. [Google Scholar] [CrossRef]
  171. Ilgen, K.; Schindler, D.; Armbruster, A.; Ladwig, R.; Eppinger Ruiz de Zarate, I.; Lange, J. Evaporation reduction and energy generation potential using floating photovoltaic power plants on the Aswan High Dam Reservoir. Hydrol. Sci. J. 2024, 47, 709–720. [Google Scholar] [CrossRef]
  172. Lopes, M.P.C.; Nogueira, T.; Santos, A.J.L.; Branco, D.C.; Pouran, H. Technical potential of floating photovoltaic systems on artificial water bodies in Brazil. Renew. Energy 2022, 181, 1023–1033. [Google Scholar] [CrossRef]
  173. Al Saadi, K.; Ghosh, A. Investigating the integration of floating photovoltaics (FPV) technology with hydrogen (H2) energy for electricity production for domestic application in Oman. Int. J. Hydrogen Energy 2024, 80, 1151–1163. [Google Scholar] [CrossRef]
Figure 1. Structure of primary energy source for electricity generation in Northern Cyprus in 2023 [24].
Energies 17 05300 g001
Figure 2. Typical standalone FPV system [91,92].
Energies 17 05300 g002
Figure 3. FPV types: (a) Type 1: Class 1 pontoon structure, (b) Type 2: Class 2 pontoon structure, (c) Type 3: Class 3 pontoon structure (d) Type 4: Superficial rigid structure, and (e) Type 5: Superficial flexible structure [97,98,99].
Energies 17 05300 g003
Figure 4. Locations of the selected reservoirs/dams.
Energies 17 05300 g004
Figure 5. Mean monthly variation of GHI at selected dams during the studied periods: (a) winter (Jan: January; Feb: February; and Dec: December), (b) spring (Mar: March; Apr: April; and May), (c) summer (Jun: June; Jul: July; and Aug: August) and (d) autumn (Sep: September; Oct: October; and Nov: November).
Energies 17 05300 g005
Figure 6. Daily variation of GHI at selected dams during the studied periods: (a) seasonal variation at Ergazi Sayadere, (b) seasonal variation at Gemikonağı Madendere, (c) seasonal variation at Hamitköy Baştanlıkdere. and (d) mean daily variation for all locations.
Energies 17 05300 g006
Figure 7. Monthly variation of meteorological data at selected dams/reservoirs/lakes during the studied period.
Energies 17 05300 g007
Figure 8. Monthly variation of E at some selected sites during the studied periods.
Energies 17 05300 g008
Figure 9. Annual water savings at the selected locations.
Energies 17 05300 g009aEnergies 17 05300 g009b
Figure 10. Annual energy production with various floating PV structures at different locations for the first scenario (covered area of 25%).
Energies 17 05300 g010aEnergies 17 05300 g010b
Figure 11. Annual energy production with various PV technologies and covered areas.
Energies 17 05300 g011
Figure 12. Annual GHG emission reduction with various PV technologies and covered area.
Energies 17 05300 g012
Figure 13. Monthly percentage of total energy production from FPV systems with various PV technologies and covered areas.
Energies 17 05300 g013
Table 1. Selected reservoirs/dams in Northern Cyprus.
Location
No.
Dam/Reservoir/Lake Dam/Reservoir LocationYear of ConstructionLatitude [°N]Longitude [°E]Capacity [m3]GHI
[kWh/m2]
DNI
[kWh/m2]
AT
[ ]
D#1AkdenizGüzelyurt198835.2632.981.47 × 1061963.62203.519.9
D#2Arapköy AyanidereGirne199035.3233.436.09 × 1051894.42038.320.4
D#3Arapköy UzundereGirne199035.3233.444.44 × 1051885.32000.720.1
D#4Dağyolu ÜçparmakdereGirne199435.2733.23.92 × 1051944.72194.919.2
D#5Değirmenlik ÇataldereLefkoşa199035.2533.462.97 × 1051898.7206719.9
D#6Ergazi SayadereGazimağusa198935.3733.944.05 × 10518561964.420.3
D#7Geçitkale EğridereGazimağusa198935.2933.721.36 × 1061875.82028.520.4
D#8Gemikonağı MadendereGüzelyurt198835.1132.834.12 × 10619262111.320.5
D#9GönendereGazimağusa198735.2933.669.39 × 1051878.22033.420.3
D#10GönyeliLefkoşa196235.2433.34.54 × 1051932.12168.519.9
D#11Hamitköy BaştanlıkdereLefkoşa199235.2433.365.29 × 1051920.62137.319.9
D#12HaspolatLefkoşa196435.2333.411.17 × 1051910.82117.219.9
D#13KanlıköyLefkoşa196335.2433.267.30 × 1051939.92180.919.6
D#14Serdarlı AğillidereLefkoşa199235.2533.583.92 × 1051881.72035.320.3
D#15Yılmazköy PolatdereLefkoşa199435.2633.175.17 × 1051952.32210.719.3
GHI: global horizontal irradiation; DNI: direct normal irradiation; AT: air temperature.
Table 2. List of PDFs used for analyzing the SI characteristics.
Ref.Region/CountryDistribution Function Used
[125]Kumasi/GhanaExponential Distribution, Normal Distribution, Weibull Distribution, Gamma Distribution, Lognormal Distribution, Beta Distribution
[126]Ibadan, NigeriaGamma Distribution, Extreme Value Distribution, Generalized Extreme Value Distribution, Weibull Distribution, Lognormal Distribution, Logistic Distribution, Normal Distribution
[127]Taipei, Taichung, Tainan, Kaohsiung, Hualien, TaitungWeibull Distribution, Logistic Distribution, Normal Distribution, Lognormal Distribution
[128]IndiaNormal distribution, Rayleigh distribution, Weibull distribution, Lognormal Distribution
[129]AlgeriaBeta Distribution
[130]France areasWeibull distribution
[131]Yenagoa/NigeriaNormal Distribution, Lognormal Distribution, Lognormal Distribution, Logistic Distribution, Extreme Value Distribution, Weibull Distribution
[132]-Weibull Distribution, Logistics Distribution, Lognormal Distribution, Beta Distribution, Gamma Distribution
Table 3. Expression of the probability density function used to analyze the distribution of GHI data.
Distribution FunctionProbability Density FunctionParameters
Kumaraswamy (K) f S = a b S a 1 1 S a b 1 a Shape parameters
b Shape parameters
Johnson SB (JSB) f S = δ λ 2 π 1 1 + S ξ λ 2 e x p 1 2 γ + δ s i n h 1 S ξ λ 2 δ Location parameter
λ Scale parameter
γ Shape parameter
ξ Shape parameter
Normal (N) f S = 1 2 π σ 2 e x p S μ 2 σ 2 σ Standard deviation
μ Mean parameter
Gamma (G) f S = S α 1 β α Γ α e x p S β β Shape parameter
α Scale parameter
Generalized Extreme Value (GEV) f S = 1 σ 1 + ζ S μ σ 1 / ζ ζ + 1 e x p 1 + ζ S μ σ 1 / ζ   k 0 1 σ e x p S μ σ ζ + 1 e x p e x p S μ σ   k = 0 α Scale parameter
ζ Shape parameter
Log-normal (LN) f S = 1 S σ 2 π e x p 1 2 l n S μ σ 2 σ Shape parameter
μ Scale parameter
Weibull (W) f S = α σ S σ α 1 e x p S σ α α Shape parameter
σ Scale parameter
Logistic (L) f S = e x p S μ σ σ 1 + e x p S μ σ 2 μ Location parameter
σ Scale parameter
Phased Bi-Weibull (PBW) f S = β 1 η 1 S η 1 β 1 1 e x p S η 1 β 1     0 S < τ β 2 η 2 S τ η 2 β 1 1 e x p S τ η 2 β 2     S τ β 1 Shape parameter of the first Weibull distribution phase
η 1 Scale parameter of the first Weibull distribution phase
β 2 Shape parameter of the second Weibull distribution phase
η 2 Scale parameter of the second Weibull distribution phase
τ Transition point
Pert (P) f S = S a 1 + 4 b a c a c S 1 + 4 c b c a B 1 + 4 b a c a 1 + 4 c b c a c a 1 + 4 b a c a + 1 + 4 c b c a 1 a Minimum
b Most likely
c Maximum
S: global solar irradiation.
Table 4. Methods used for estimating E [mm/day].
Method NameEquationReference
Priestley–Taylor E = α · Δ + γ R n Q λ ρ w · D [146]
deBruin–Keijman E = Δ 0.85 · + 0.63 · γ R n Q λ ρ w · D [146]
Makkink E = 0.61 · + γ · R n λ 0.012 [147]
Penman Monteith E = 0.047 · · R n + γ · 900 T + 273 · U 2 e s e a + γ · 1 + 0.34 · U 2 [148]
Mass transfer E = 10 · N U 2 e s e a [149]
Hamon E = 35.8 · K · N · e s T + 273.3 [150]
α : Priestley–Taylor empirically derived constant, dimensionless ( α = 1.26 ). ρ w : density of water (1000 kg m−3). R n : the net radiation [W/m2]. Q : the heat storage change in the water body [W/m2]. γ : Psychrometric “constant” (depends on temperature and atmospheric pressure) [Pa 1 ]; γ = 0.665 × 10 3 · P . P : Atmospheric pressure [kPa]. e s : saturated vapor pressure at temperature of the air [kPa]; e s = 1 2 · 0.6108 · e x p 17.27 T m a x T m a x + 237.3 + 0.6108 · e x p 17.27 T m i n T m i n + 237.3 . e a : vapor pressure at temperature and relative humidity of the air [kPa]; e a = R H 100 · e s . : the slope of saturated vapor pressure–air temperature curve [kPa/ ]. λ : the latent heat of vaporization (2.45 × 10⁶ J/kg). R H : Relative humidity [%].
Table 5. Ranking of distribution functions based on the K–S and A–D tests.
SeasonLocationRank of the Distribution Function Based on K–S
12345678910
WinterGemikonağı MadenderePBWGEVKJSBPLNGWLN
Hamitköy BaştanlıkdereKLJSBGEVPNPBWGWLN
Ergazi SayaderePBWKGEVJSBLPNGWLN
SpringGemikonağı MadendereJSBKGEVWNPGLNL*
Hamitköy BaştanlıkdereJSBGEVKGNLNPLWPBW
Ergazi SayadereJSBKPGEVWNGLNL*
SummerGemikonağı MadendereLJSBKNGLNWGEVPPBW
Hamitköy BaştanlıkdereGEVJSBKWNLGLNPPBW
Ergazi SayadereKJSBGEVWPLNGLNPBW
AutumnGemikonağı MadendereJSBKNGEVWGLNLPPBW
Hamitköy BaştanlıkdereJSBGEVGLNPNLWKPBW
Ergazi SayadereJSBGEVNGKLNPLWPBW
YearlyGemikonağı MadendereJSBGEVPWPBWNGLNKL
Hamitköy BaştanlıkdereGEVPJSBWNGLNLKPBW
Ergazi SayadereJSBPWGEVKNGLNLPBW
SeasonLocationRank of the Distribution function based on A–D
12345678910
WinterGemikonağı MadenderePBWKPLNGWLNGEVJSB
Hamitköy BaştanlıkdereGEVPJSBKLNWGLNPBW
Ergazi SayadereKPLPBWNGWLNGEVJSB
SpringGemikonağı MadendereGEVNWPGLNLJSBK*
Hamitköy BaştanlıkdereJSBGEVNWGPLNPBWLK
Ergazi SayadereGEVWPNGLNLJSBK*
SummerGemikonağı MadendereKLNWGLNPGEVJSBPBW
Hamitköy BaştanlıkdereGEVJSBWLNGLNPKPBW
Ergazi SayadereKJSBWLNPGLNGEVPBW
AutumnGemikonağı MadendereJSBGEVGNLNPWLKPBW
Hamitköy BaştanlıkdereGEVJSBLNGNPLWKPBW
Ergazi SayadereJSBGEVGNLNPWLPBWK
YearlyGemikonağı MadendereGEVPWJSBNGLNLKPBW
Hamitköy BaştanlıkdereJSBGEVWNPGLNLKPBW
Ergazi SayadereGEVKJSBNGLNPLWPBW
* PBW = No fit.
Table 6. Different types of floating structures considered in this study.
CompanyTypeCharacteristics
Ciel&TerreHydrelio® Floating Solar North   orientation tilt   0 °
C&T S12 South   orientation tilt   12 °
C&T EW12 East / west   orientation tilt   12 °
Solaris SynergySolSyn S25 South   orientation tilt   25 °
SwimsolSwimsol S10 South   orientation tilt   10 °
IsigenereIsifloating EW15 East / west   orientation tilt   15 °
Ocean SunOceanSun S6 North / south   orientation tilt   6 °
SeaflexSeaflex S5 South   orientation tilt   5 °
Eco Wave PowerEWP EW20 East / west   orientation tilt   20 °
Table 7. List of assumptions taken into account in this study.
Assumption UnitValue
PV’s lifetime Year25
Discount rate %6
Inflation rate %8
Engineering cost%2
Civil work%5
Installation cost%8
Cost of transport%2
Cost of the electrical connection%7
Miscellaneous costs %1
Cost of a unit of inverter USD155,647
Electricity priceUSD0.10
Cost of FPV USD/Watt1.2
Table 8. Annual capacity factor [%] with various floating PV structures at different locations.
SiteS#1S#2S#3S#4S#5S#6S#7S#8S#9S#10S#11S#12S#13
D#118.4817.0418.8918.6214.3117.4118.7818.4518.1119.8018.2718.5418.14
D#218.3116.4217.9418.1413.8716.7717.7918.0217.4319.0417.5917.5117.79
D#318.3316.4418.0018.1313.8816.7917.8618.0117.4519.0717.6017.6017.78
D#418.9216.8818.7218.6414.1517.2518.6018.5117.9719.7318.1318.3818.27
D#518.6316.6218.3318.4413.9416.9918.1918.3317.6919.4317.8617.9318.11
D#618.5716.6118.3618.2913.9816.9718.2318.1617.6619.3417.8218.0117.92
D#718.5316.5618.2918.2913.9216.9218.1618.1717.6119.3117.7717.9317.95
D#818.9116.9318.6618.5914.2417.3018.5218.4517.9919.6718.1518.2618.18
D#918.4716.5018.1918.2813.8716.8618.0518.1717.5419.2517.7117.8017.97
D#1018.7716.7418.5118.5414.0417.1218.3718.4217.8219.5717.9918.1318.20
D#1118.7416.7118.4718.5314.0117.0818.3418.4117.7919.5417.9518.1018.20
D#1218.6416.6218.3618.4113.9416.9918.2218.2917.6919.4317.8617.9718.07
D#1318.8416.8018.5818.6014.0917.1818.4418.4817.8919.6418.0618.2018.25
D#1418.8416.8018.5818.6014.0917.1818.4418.4817.8919.6418.0618.2018.25
D#1519.0016.9518.8218.6914.2017.3218.7018.5518.0419.8118.2118.4918.29
S: Structure of FPV; S#1: North orientation—tilt 0°; S#2: South orientation—tilt 12°; S#3: East orientation—tilt 12°; S#4: West orientation—tilt 12°; S#5: South orientation—tilt 25°; S#6: South orientation—tilt 10°; S#7: East orientation—tilt 15°; S#8: West orientation—tilt 15°; S#9: South orientation—tilt 6°; S#10: North orientation—tilt 6°; S#11: South orientation—tilt 5°; S#12: East orientation—tilt 20°; S#13:West orientation—tilt 20°.
Table 9. Specification of various PV technologies.
PV TechnologiesModelPower [W]Efficiency [%]Frame Area [m2]Cost
[USD/W]
Monocrystalline SiliconJKM445N-54HL4R-V44522.271.9980.39
Polycrystalline SiliconAS-P72 310-345W34517.781.9400.43
Cadmium TellurideFS-6445/FS-6445A44518.002.4570.50
Bifacial (Bifacial Gain: 30%)CS3W-445MB-AG44525.92.2340.70
Bifacial (Bifacial Gain: 20%)CS3W-445MB-AG44523.92.2340.65
Bifacial (Bifacial Gain: 10%)CS3W-445MB-AG44521.92.2340.60
Bifacial (Bifacial Gain: 5%)CS3W-445MB-AG44520.92.2340.55
Table 10. Annual value of CF [%] for all selected sites with various PV technologies.
PV TechnologyD#1D#2D#3D#4D#5D#6D#7D#8D#9D#10D#11D#12D#13D#14D#15
Monocrystalline19.4618.7118.7419.3819.0919.0018.9719.3318.9119.2219.2019.0919.3019.3019.46
Polycrystalline19.4618.7118.7319.3819.0919.0018.9719.3318.9119.2219.1919.0919.2919.2919.46
Cadmium Telluride19.3418.6018.6219.2718.9718.8918.8619.2118.8019.1119.0818.9819.1819.1819.34
Bifacial (5%)20.7619.9719.9920.6820.3720.2820.2420.6320.1820.5120.4820.3720.5920.5920.77
Bifacial (10%)22.0821.2421.2622.0021.6621.5721.5321.9421.4621.8221.7821.6721.9021.9022.09
Bifacial (20%)24.7223.7823.8024.6324.2524.1424.1124.5624.0324.4224.3924.2624.5224.5224.73
Bifacial (30%)27.3726.3126.3527.2626.8426.7226.6827.1826.6027.0326.9926.8527.1327.1327.37
Table 11. Values of simple payback period and energy production costs for all selected sites with various PV technologies.
PV Technology D#1D#2D#3D#4D#5D#6D#7D#8D#9D#10D#11D#12D#13D#14D#15
Simple payback period [Year]
Monocrystalline4.074.234.234.094.154.174.184.104.194.124.134.154.114.114.07
Polycrystalline 4.374.544.534.384.454.474.484.394.494.424.434.454.404.404.37
Cadmium Telluride6.006.246.236.026.126.146.156.046.176.076.086.126.056.056.00
Bifacial (5%)5.445.665.665.475.555.585.585.485.605.515.525.555.495.495.44
Bifacial (10%)5.465.685.675.485.575.595.605.505.625.535.545.575.515.515.46
Bifacial (20%)5.185.395.385.205.285.315.315.225.335.245.255.285.235.235.18
Bifacial (30%)4.965.155.154.985.055.085.084.995.105.025.025.055.005.004.96
Energy production cost [USD/kWh]
Monocrystalline0.01630.01690.01690.01640.01660.01670.01670.01640.01680.01650.01650.01660.01640.01640.0163
Polycrystalline 0.01750.01820.01810.01750.01780.01790.01790.01760.01800.01770.01770.01780.01760.01760.0175
Cadmium Telluride0.02400.02500.02490.02410.02450.02460.02460.02420.02470.02430.02430.02450.02420.02420.0240
Bifacial (5%)0.02180.02260.02260.02190.02220.02230.02230.02190.02240.02200.02210.02220.02200.02200.0218
Bifacial (10%)0.02180.02270.02270.02190.02230.02240.02240.02200.02250.02210.02210.02230.02200.02200.0218
Bifacial (20%)0.02070.02160.02150.02080.02110.02120.02130.02090.02130.02100.02100.02110.02090.02090.0207
Bifacial (30%)0.01980.02060.02060.01990.02020.02030.02030.02000.02040.02010.02010.02020.02000.02000.0198
Disclaimer/Publisher’s Note: The statements, opinions and data contained in all publications are solely those of the individual author(s) and contributor(s) and not of MDPI and/or the editor(s). MDPI and/or the editor(s) disclaim responsibility for any injury to people or property resulting from any ideas, methods, instructions or products referred to in the content.

