1. Introduction
Buildings are responsible for the consumption of 51.2% of electricity in Brazil [
1]. According to the technical note EPE 030/2018 [
2] of the Brazilian Ministry of Mines and Energy, 32% of the electricity consumption of residential buildings and 33% of non-residential buildings is consumed by air conditioning systems for ambient cooling. These data demonstrate that the thermal comfort of buildings demands a substantial amount of electrical energy from the country’s energy matrix, especially for cooling environments, due to the hot and humid climate of tropical countries.
Given the climate, thermal comfort in tropical climate buildings is directly correlated with thermal performance [
3]. Therefore, a better thermal performance of the building, considering passive strategies, can directly influence the thermal comfort of the occupants, as well as the energy consumption to meet human needs.
Among the theses strategies, considering the building systems, the envelope has a major influence on its thermal performance [
4,
5,
6,
7]. Therefore, developing technologies capable of improving the thermal performance of envelopes can contribute to the thermal comfort of environments and a reduction in electricity consumption for cooling buildings. A technology applied to the envelope, already successfully used in several countries to improve thermal performance, is the phase-change material (PCM). This technology increases the thermal inertia of the building, due to the increase in the latent heat value of the envelopes [
8,
9,
10,
11]. The operating principle of the PCM is the absorption of thermal energy without increasing the temperature, in one of its phases, varying between sensible heat and latent heat, also allowing the storage of this energy. The melting point of a PCM is the temperature where the heat gain passes from sensible to latent, or the reverse, in the case of heat loss.
PCMs further contribute passively to reducing consumption for heating buildings in cold and temperate climates [
8,
12,
13], which makes it possible to use these materials for these locations. In the case of cooling demand, for hot regions, PCMs can contribute to the thermal comfort of environments when used with a higher melting point [
9,
10,
14,
15,
16]. The disadvantages of PCMs must also be considered. The high cost of the materials, limited availability, and the complexity of their integration are significant barriers to their widespread adoption. However, as technology advances and new suppliers enter the market, these challenges are beginning to be mitigated, making the use of PCMs more feasible for future energy-efficient building projects [
17].
Considering the advantages and characteristics of PCMs used in buildings, both the melting point and the thickness of the PCM layer are critical factors that influence the thermal performance of building envelopes [
18]. Using parametric simulations, Kishore et al. [
19] observed that the thermal load of the building is greater the more internally that the PCM is placed in the wall, and the melting temperature of the material is the most influential parameter in the internal room temperature. In addition, computational simulations, similar to those conducted by Ferster et al. [
14], can be instrumental in identifying the optimal parameters for phase-change materials (PCMs) and their most effective location within the building envelope.
According to Beltran et al. [
20], PCM performance also depends on the climate, because climate variation is correlated with the operating temperature of the material. For regions with an equatorial climate, PCM performs better when associated with HVAC systems. When designing a building with PCM technology, not only the climate classification must be considered, but other geographic and climatic factors, such as sea level, solar irradiance, and wind profile must also be considered [
21].
In the context of Brazil’s predominantly tropical climate, PCM can be particularly advantageous in reducing energy consumption for cooling buildings with lightweight construction envelopes. As a passive strategy within the building system, PCMs can be complemented by other measures, such as night ventilation or solar shading, further improving their thermal performance [
22].
Research with PCMs as a passive cooling strategy for buildings is scarce for the climatic regions of the southern hemisphere, which may be related to the lack of material suppliers for these locations [
23] Another contributing factor in Brazil is the requirement to consider sub-regional climatic characteristics when applying materials in civil construction, owing to the country’s vast and diverse geographic expanse.
The objective of this study is to analyze the performance of PCMs in tropical regions of the southern hemisphere, focusing on Brazil, and their behavior according to the construction system used. Given the vast territorial extent of the country, which encompasses a wide range of climatic conditions, from temperate to hot climates, it is anticipated that the material’s behavior will vary significantly across different microregions. Therefore, it is essential to understand these variations to optimize the application of PCMs effectively.
1.1. Application of PCMs in the Thermal Performance of Buildings
Table 1 lists the abbreviations and symbols used in this work for reference.
There are three classifications for thermal energy storage (TES) materials: sensible heat, latent heat, and thermochemical. Only the first two are passively applied in civil construction, and the thermochemical variety is used in active systems [
24].
Sensible heat is the heat transferred between bodies, capable of causing a variation in their temperature, however, without causing a change in the state of aggregation of the molecules; unlike this, latent heat, in addition to possibly changing the temperature of a body, causes a change in the state of aggregation of molecules (i.e., state of matter). PCM is a latent heat storage TES, which is seen as a new solution to reduce cooling/heating loads in buildings [
25].
De Gracia et al. [
26], with their mathematical model for ventilated wall systems with PCM boards, report that the performance in passive cooling is correlated with the vertical solar irradiation of the location. PCM has better thermal performance for buildings located in cold/temperate climates when compared to arid/equatorial climates [
20,
26,
27].
Bre et al. [
28] proposed the utilization of PCMs with varying melting temperatures within the same design, analyzing European climates. The findings indicate that, regardless of the climatic zone under consideration, it is preferable to employ multiple PCMs with different melting temperatures rather than a single PCM. Furthermore, the optimal performance of a PCM is achieved in climatic zones where both heating and cooling loads are present.
Tabares-Velasco et al. [
29] conducted a validation of the EnergyPlus software (version 24-1-0) for simulating opaque walls incorporating PCM. Their study concluded that the simulation results are most accurate when the following conditions are applied: a time step of 3 min; reduced accuracy with increasing material hysteresis; and the use of the CondFD algorithm as the default, which provides shorter computation times than those typically required. Additionally, their research highlighted that the thermal performance of PCM is influenced by multiple factors, including the material properties and its placement within the building envelope.
Mohseni et al. [
30] performed a parametric analysis of computer simulations of buildings with lightweight walls using PCM. The authors observed that, for this case, increasing the thickness of the PCM can reduce energy consumption for both heating and cooling. Furthermore, lower melting temperatures performed better in winter (for heating), and higher melting temperatures performed better in summer (for cooling). Models with PCM perform better when temperature peaks are moderate (summer) as well as during temperature drops (winter).
The location of the PCM layer on the wall influences thermal performance. According to Jin et al. [
31], based on the inner face, 1/5 of the wall thickness is the best location to obtain the longest thermal delay time. This variation in performance by location is related to the melting of the PCM, because depending on the location, the PCM may not fully enter its liquid state [
32].
1.2. PCM in Tropical Regions
The location within the walls, thickness, and melting point of the PCM, associated with the local climate, are the variables that influence the thermal performance of the PCM envelopes [
18,
30,
31,
32]. Therefore, associating variables correctly can define the type of PCM to be applied in each region/climate.
Lei et al. [
9], through parametric analysis, identified that the use of PCM in tropical regions can reduce the energy consumption for cooling from 21 to 32% in their models. This performance correlates with the melting temperature (i.e., 28 °C) of the applied material. The authors also point out that the models with PCM applied to the outer layers of the envelope showed the best thermal performance.
A passive cooling system is an important tool in controlling ambient temperature peaks. Studies with PCMs in tropical regions are less common but are important to understand their behavior in tropical climates [
33]. Oliveira et al. [
22] corroborate this lack, highlighting several gaps in their systematic literature review, such as the association of lightweight construction buildings, thermal bridges, thermal comfort, and others. These studies encourage the need for further investigations on the use of PCM for certain climates, like those found in Brazil.
The strategic integration of PCMs in Brazilian buildings, alongside HVAC systems, plays a significant role in reducing electricity consumption while ensuring thermal comfort indoors. Given Brazil’s extensive geographical area, it is essential to use PCMs with varying melting points that are suitable for the bioclimatic zone of each region [
34,
35].
Oliveira et al. [
34] carried out simulations across five Brazilian cities with diverse climatic conditions, focusing on assessing the impact of boundary conditions and construction parameters related to PCM installation on building thermal comfort. The study found that climate and the installation layer were the most influential factors affecting outcomes. Moreover, the research identified a correlation between the PCMs’ melting temperature and the specific local climate conditions.
In a thermal comfort analysis, Almeida et al. [
36] found that prefabricated naturally ventilated social housing can benefit from the thermal properties of PCM. Their findings were particularly positive in regions with significant temperature variations, where the use of PCM significantly enhanced thermal comfort.
By considering the melting point, PCMs can be incorporated into lightweight walls to passively improve thermal comfort, even in Brazil’s warmer regions. Research indicates that the melting point greatly influences PCM performance throughout Brazil, due to the country’s vast and varied climatic conditions [
34,
35,
36].
2. Materials and Methods
This work used building performance simulation using the EnergyPlus
TM program, considering different PCM parameters applied to building systems for different climates in Brazil. The method is divided into climates and case studies; characteristics of PCMs; computer modeling; and performance indicators.
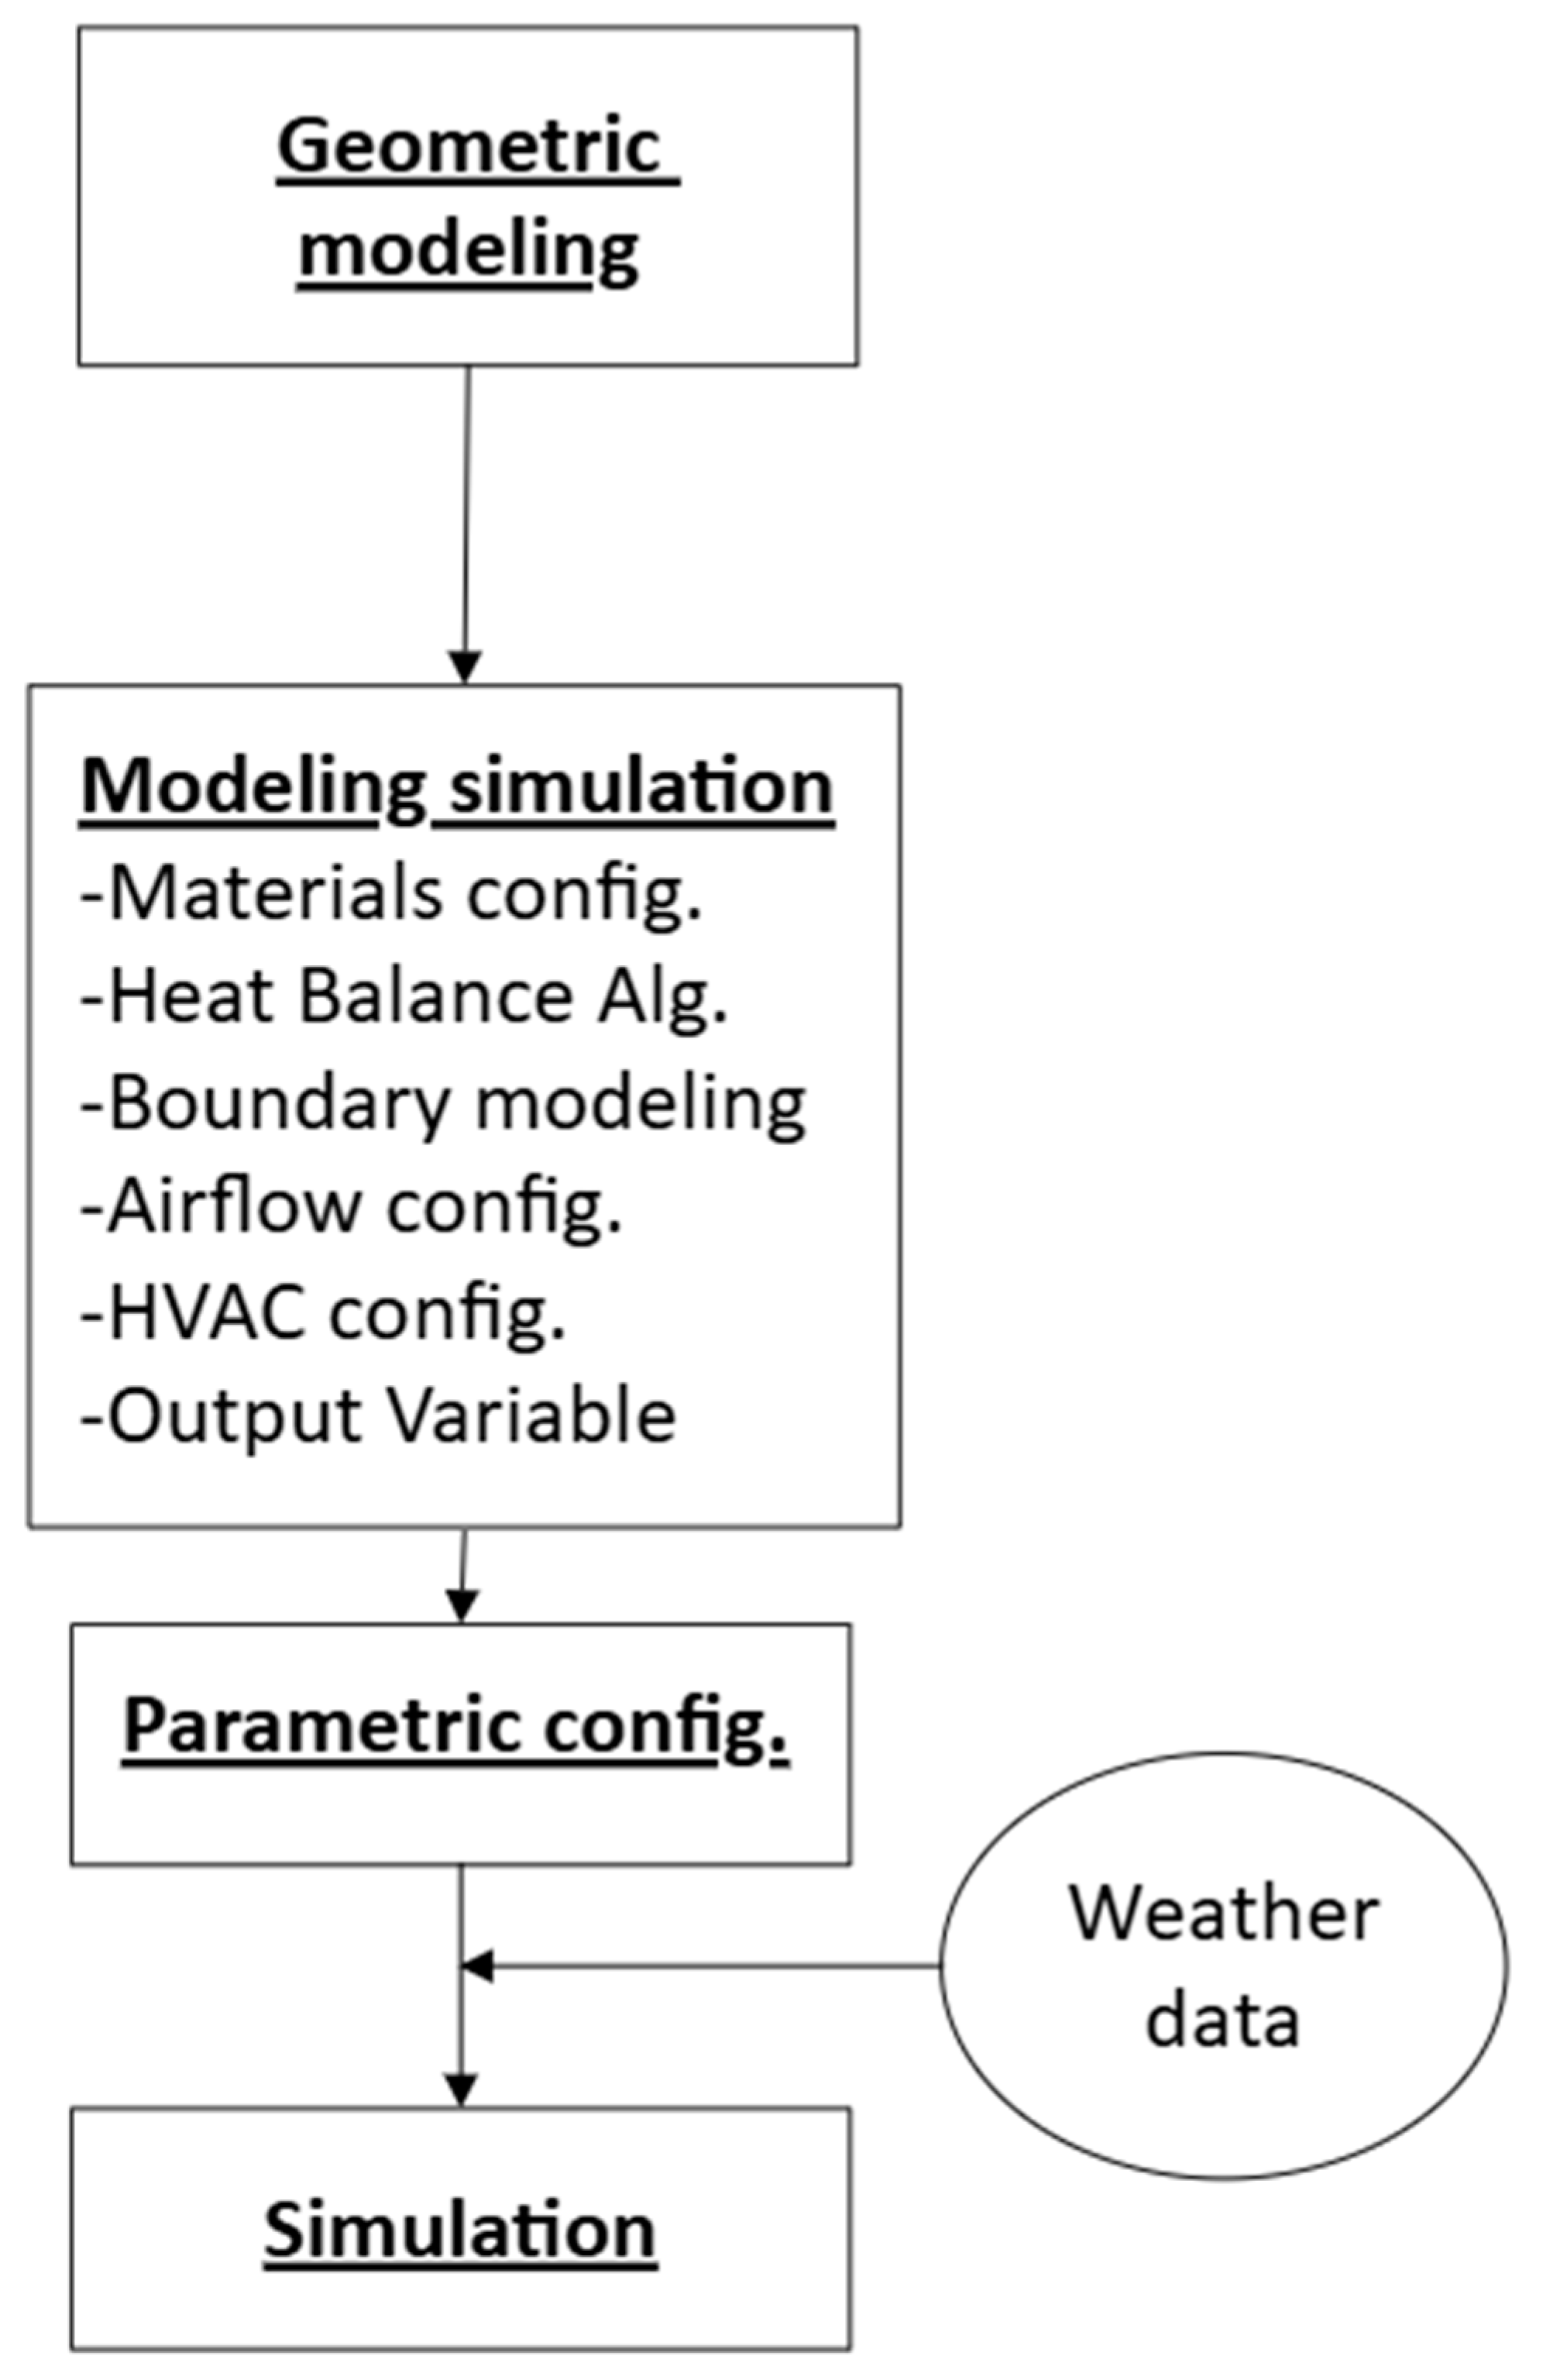
Figure 1 illustrates a brief sequence of steps for configuring the simulations.
2.1. Climates and Case Study
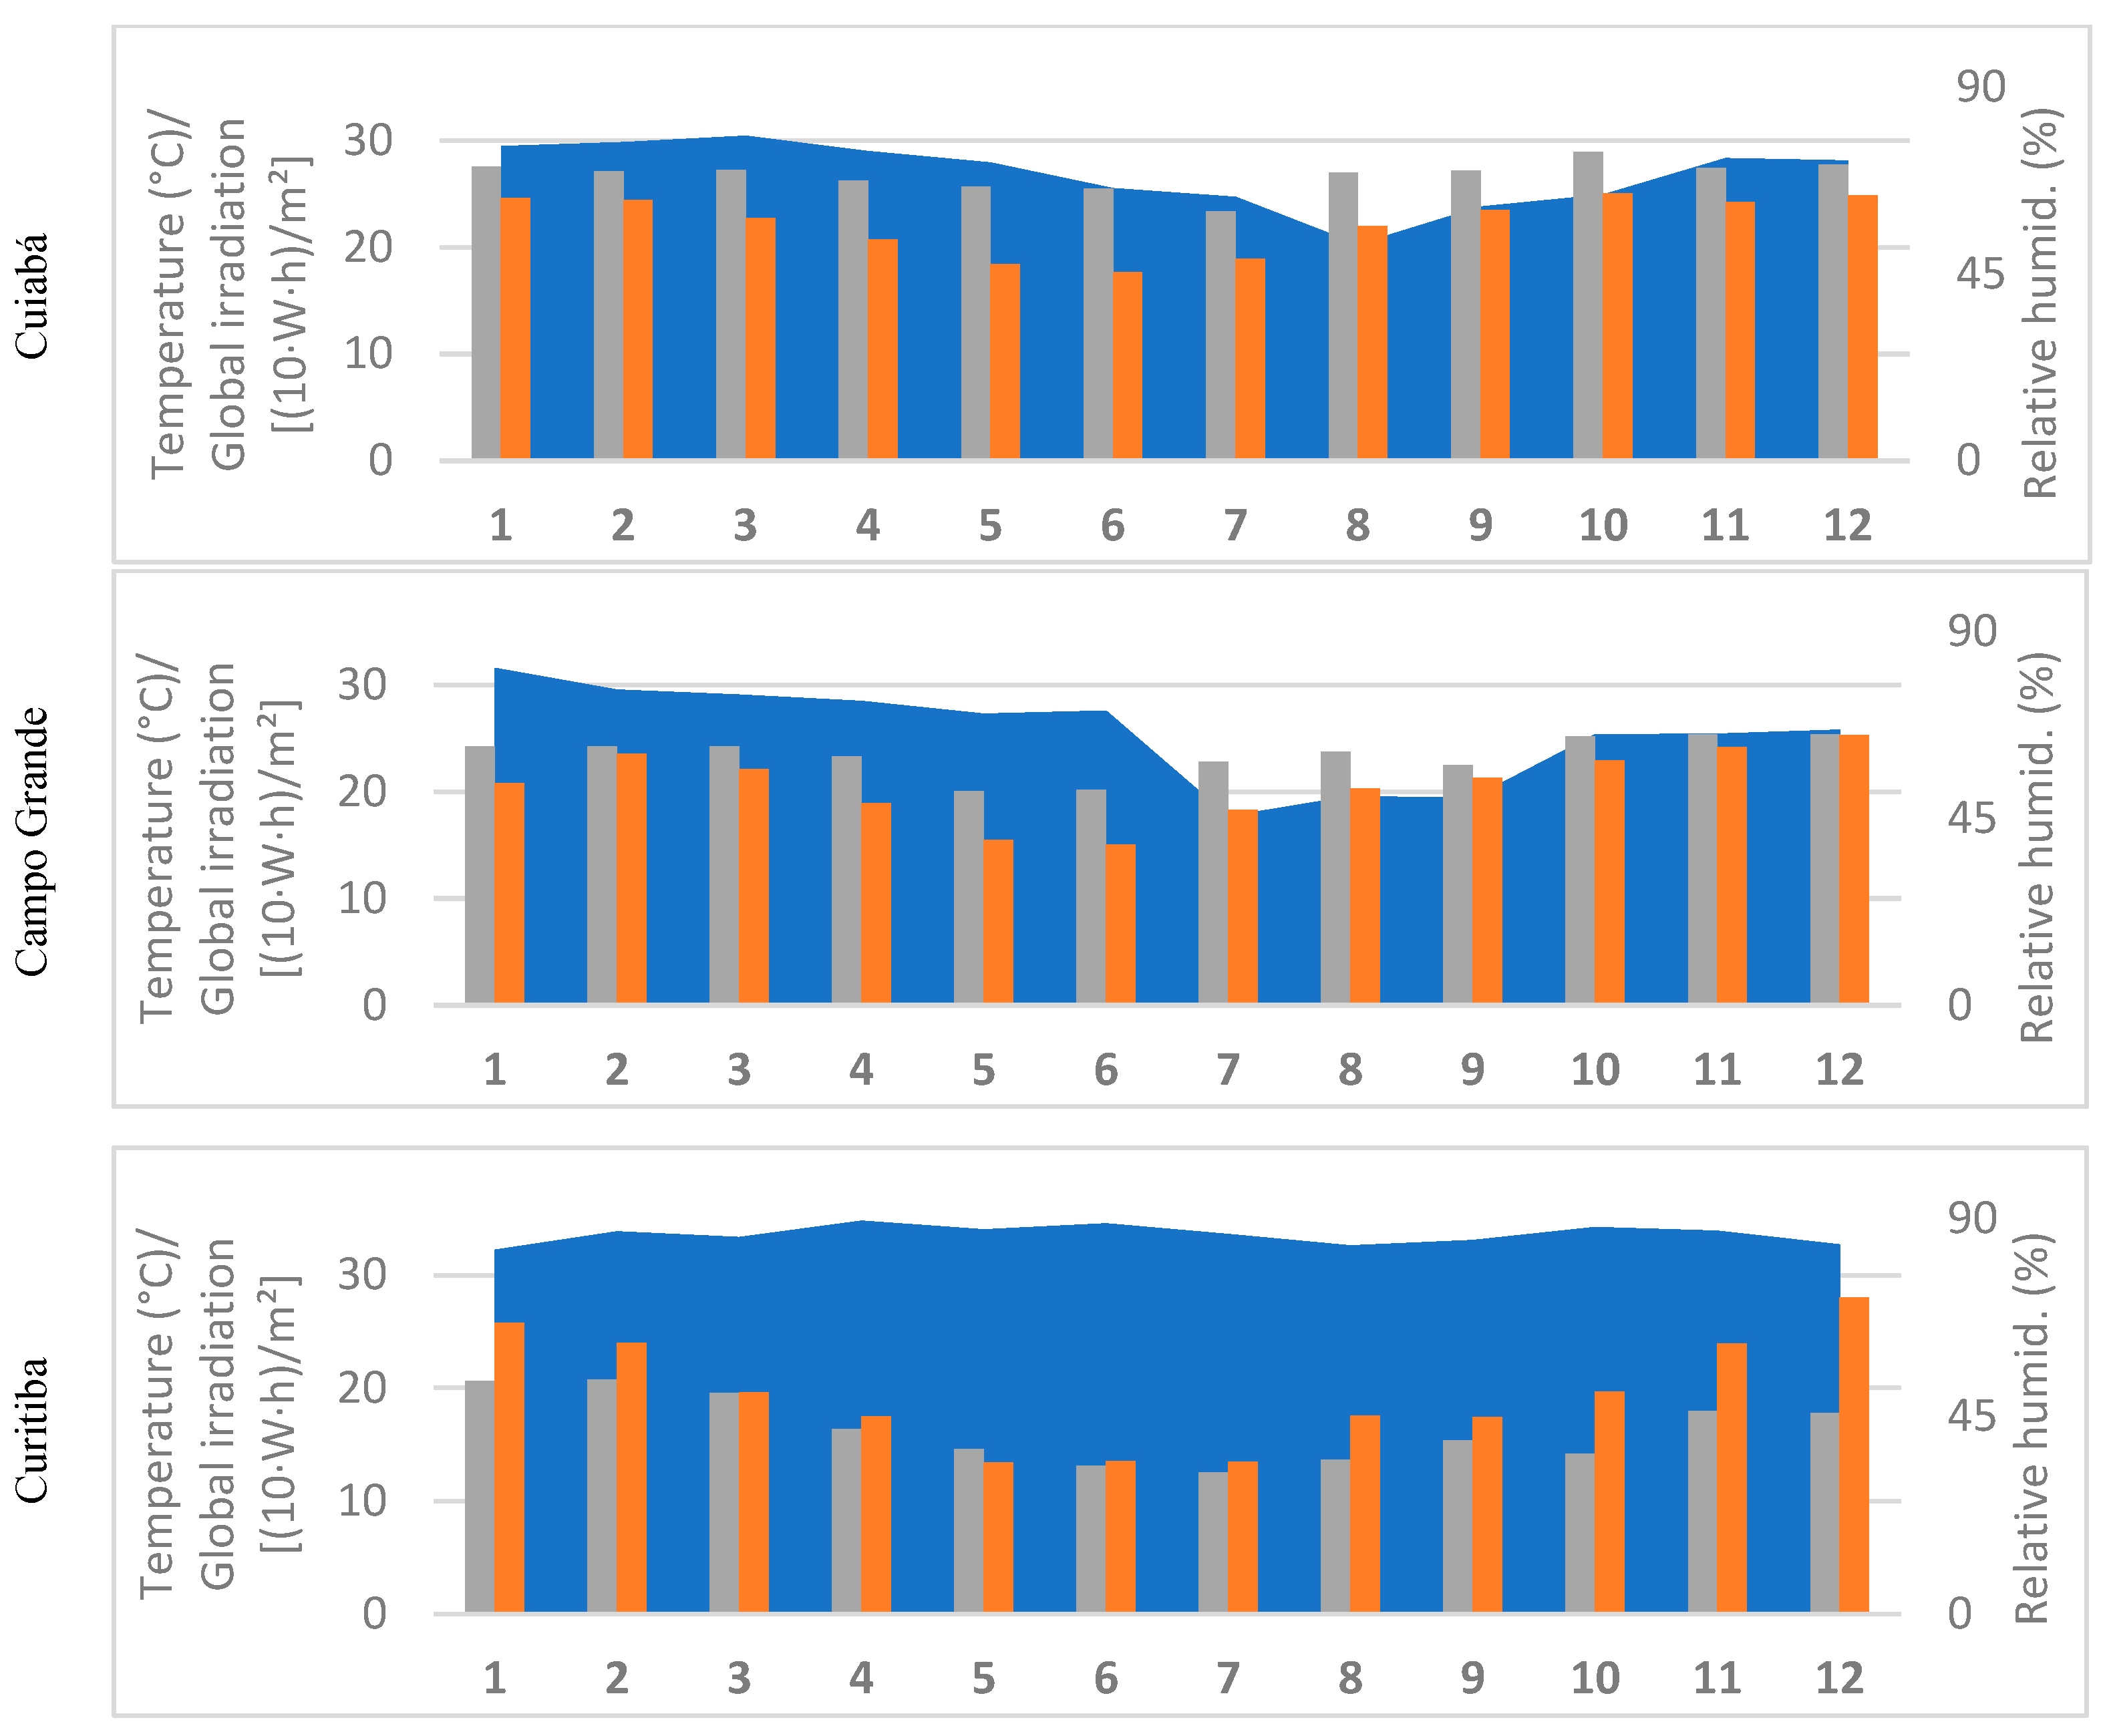
The case study was performed with a low-income residential project already built in many regions of Brazil. The climates of six capitals of the country, from the midwest, southeast, and south of Brazil were selected, as shown in
Figure 2. The climate files for each city were obtained from the EnergyPlus—Weather Data (
https://energyplus.net/weather) webpage.
According to
Table 2, the climatic classification of the cities based on the Köppen–Geiger [
37] system is as follows: Campo Grande—MS and Cuiabá—MT are characterized by a tropical savanna climate with a dry season (Aw), though they occupy distinct climatic zones. Curitiba—PR exhibits a humid subtropical highland climate (Cfb). Florianópolis—SC and Porto Alegre—RS both have a humid subtropical climate (Cfa), marked by evenly distributed rainfall throughout the year and high relative humidity. São Paulo—SP is classified as having a Cfa/Cwa climate, which is a humid subtropical climate with a concentration of rainfall during the summer months. In alignment with the bioclimatic zone classification outlined in NBR 15.220-3 [
38], Florianópolis, São Paulo, and Porto Alegre are categorized as zone 3, Curitiba as zone 1, Campo Grande as zone 6, and Cuiabá as zone 7.
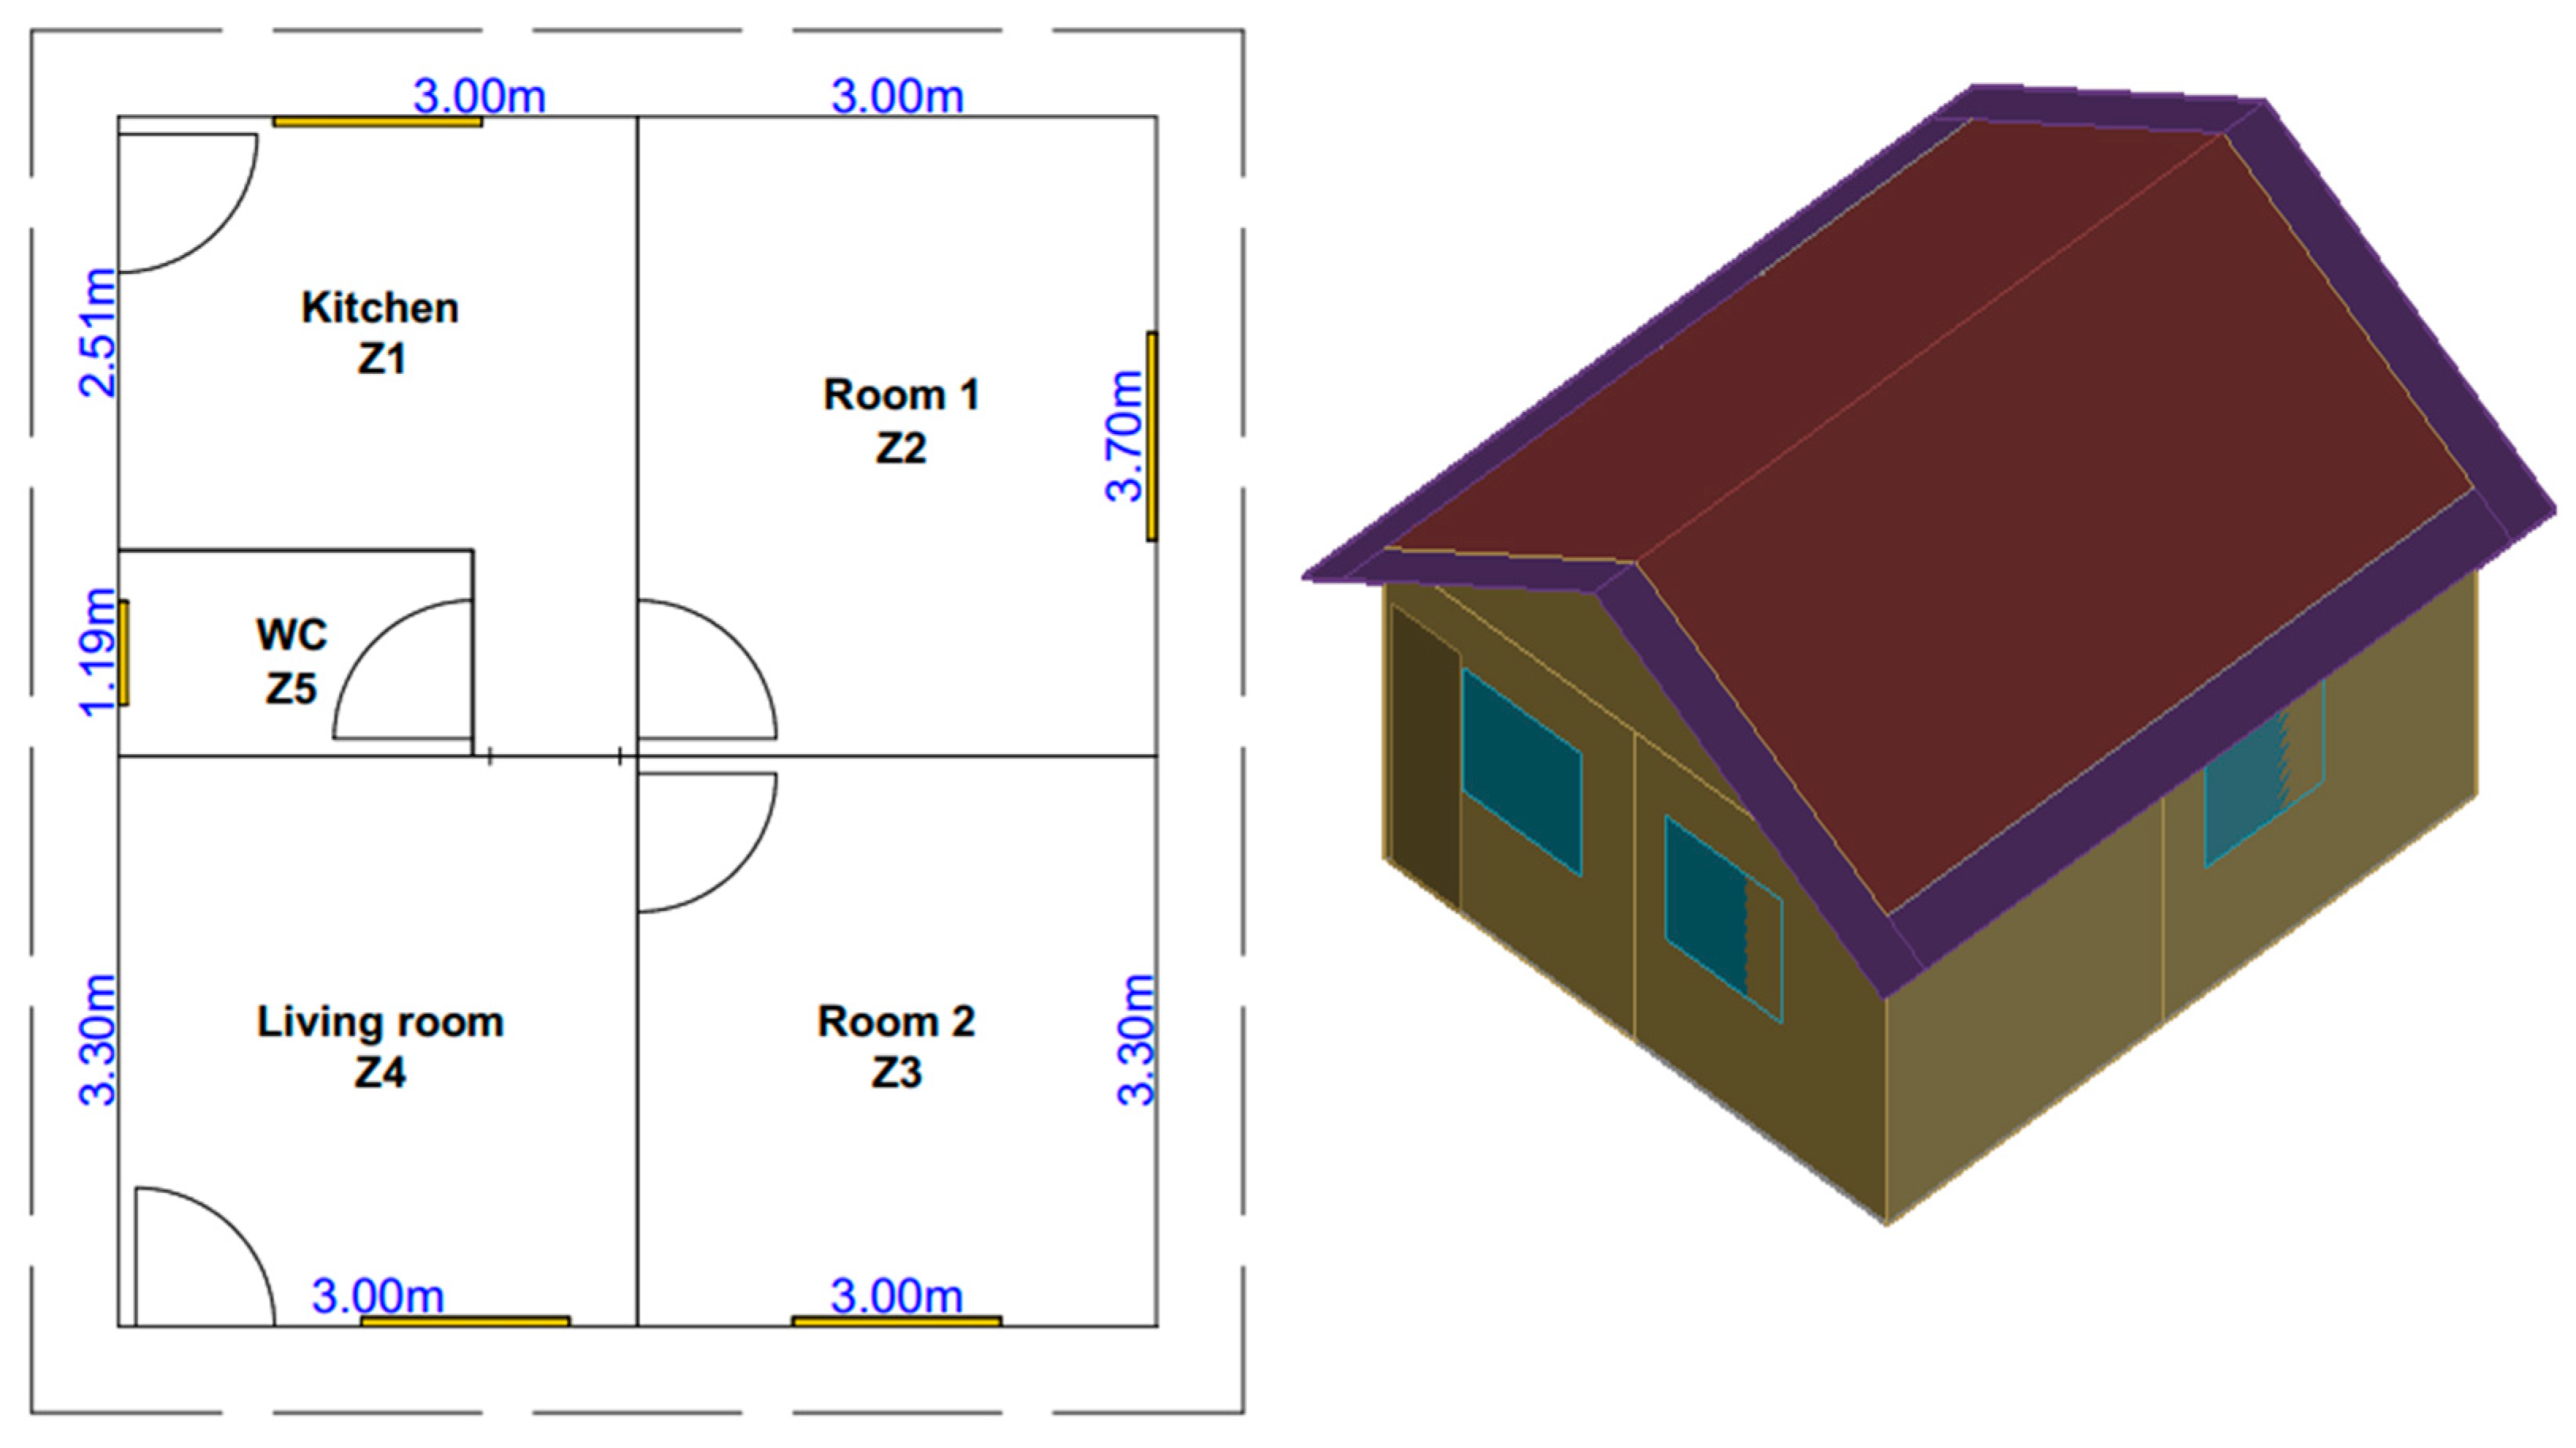
Concerning the building model, the low-income building project used in the simulations has 41.87 m
2 of floor space, with two bedrooms, one bathroom, a kitchen, and a living room. The layout of the environments is shown in
Figure 3. This design is a typical social housing project built in several regions of the country, despite the climate difference.
2.2. Characteristics of PCMs
The phase-change materials (PCMs) adopted in the simulations were BioPCM™, manufactured by the Phase Change Energy Solutions Company (813 Winston St Greensboro, North Carolina 27405, USA). The melting temperatures considered were 21 °C (Q21), 23 °C (Q23), 25 °C (Q25), 27 °C (Q27), and 29 °C (Q29), for two different surface densities, namely 2.7 kg/m
2 (M51) and 4.9 kg/m
2 (M91). The enthalpy functions are presented in
Figure 4, based on Feustel’s model [
39], the x-axis presents the increase in material temperature, and the y-axis the accumulation of heat energy. The thermal conductivity of the material is 0.22 W/m·K, and the latent heat varies between 190 and 200 kJ/kg. The thickness varies between 0.5, 1 and 2 cm. From the graph, it can be noticed that PCM Q21, for example, starts melting from 20 °C, approximately, and becomes liquid at a temperature of 21 °C, with a large accumulation of thermal energy; the same behavior appears in the other PCMs.
The study considers different melting points to evaluate PCM performance across varying climates, given the significant differences in hourly temperatures across regions and seasons. The analysis of varying thicknesses aims to elucidate the relationship between thermal performance and the material’s total mass, considering the associated economic implications.
2.3. Computer Modeling
The software used for the building performance simulation was EnergyPlusTM version 24.1. Through parameterization, it was possible to analyze the behavior of the PCM by varying the type of wall, type of PCM, thickness of the PCM, and the location of its implementation in the project. EnergyPlusTM is a complete software, widely used by engineers, architects, and researchers, who model a building’s geometry and analyze its behavior within a climate scenario.
For this research, two computer models were created, according to the two types of light and heavyweight walls, and the combination of the other parameters was made for all six selected capitals, thus totaling 384 simulations. The various simulations are presented in
Table 3.
To represent heavyweight walls, structural concrete insulated panels (SCIP) were employed due to their significant thermal mass. For lightweight walls, the container wall system was selected, reflecting its increasing use in Brazilian construction. This system utilizes containers as wall structures, with enhancements made to improve thermal and acoustic performance, thereby rendering the construction method viable and effective. The ceiling adopted in the environments was plasterboard, which was considered a layer of PCM according to the PCM used in the sample. For the reference simulations, the PCM was removed. The composition scheme of the walls is shown in
Figure 5, and
Table 4 presents the data of the materials used in the simulation.
The object “MaterialProperty:PhaseChange” from the EnergyPlus
TM program was used to configure the PCM, and the “timestep” was considered equal to 20 (i.e., calculation for each 3 min). The finite difference algorithm (CondFD) was used to simulate the PCM, as in Saffari et al. [
21], through the “HeatBalanceAlgorithm” object. This algorithm allowed us to simulate the thermal conductivity in a temperature- and PCM-dependent way. The “GroundDomain” object was used to process the contact with the ground, when calculating different ground–floor interface configurations, through the finite difference model, to obtain the temperature and influence of the soil in the environments [
40].
The configuration of natural ventilation was performed in the “AirflowNetwork” object group. The algorithm of these objects calculates the airflow considering the direction and speed of the wind, the surroundings of the building, and the characteristics of the internal environments, such as the external and internal openings, including their cracks [
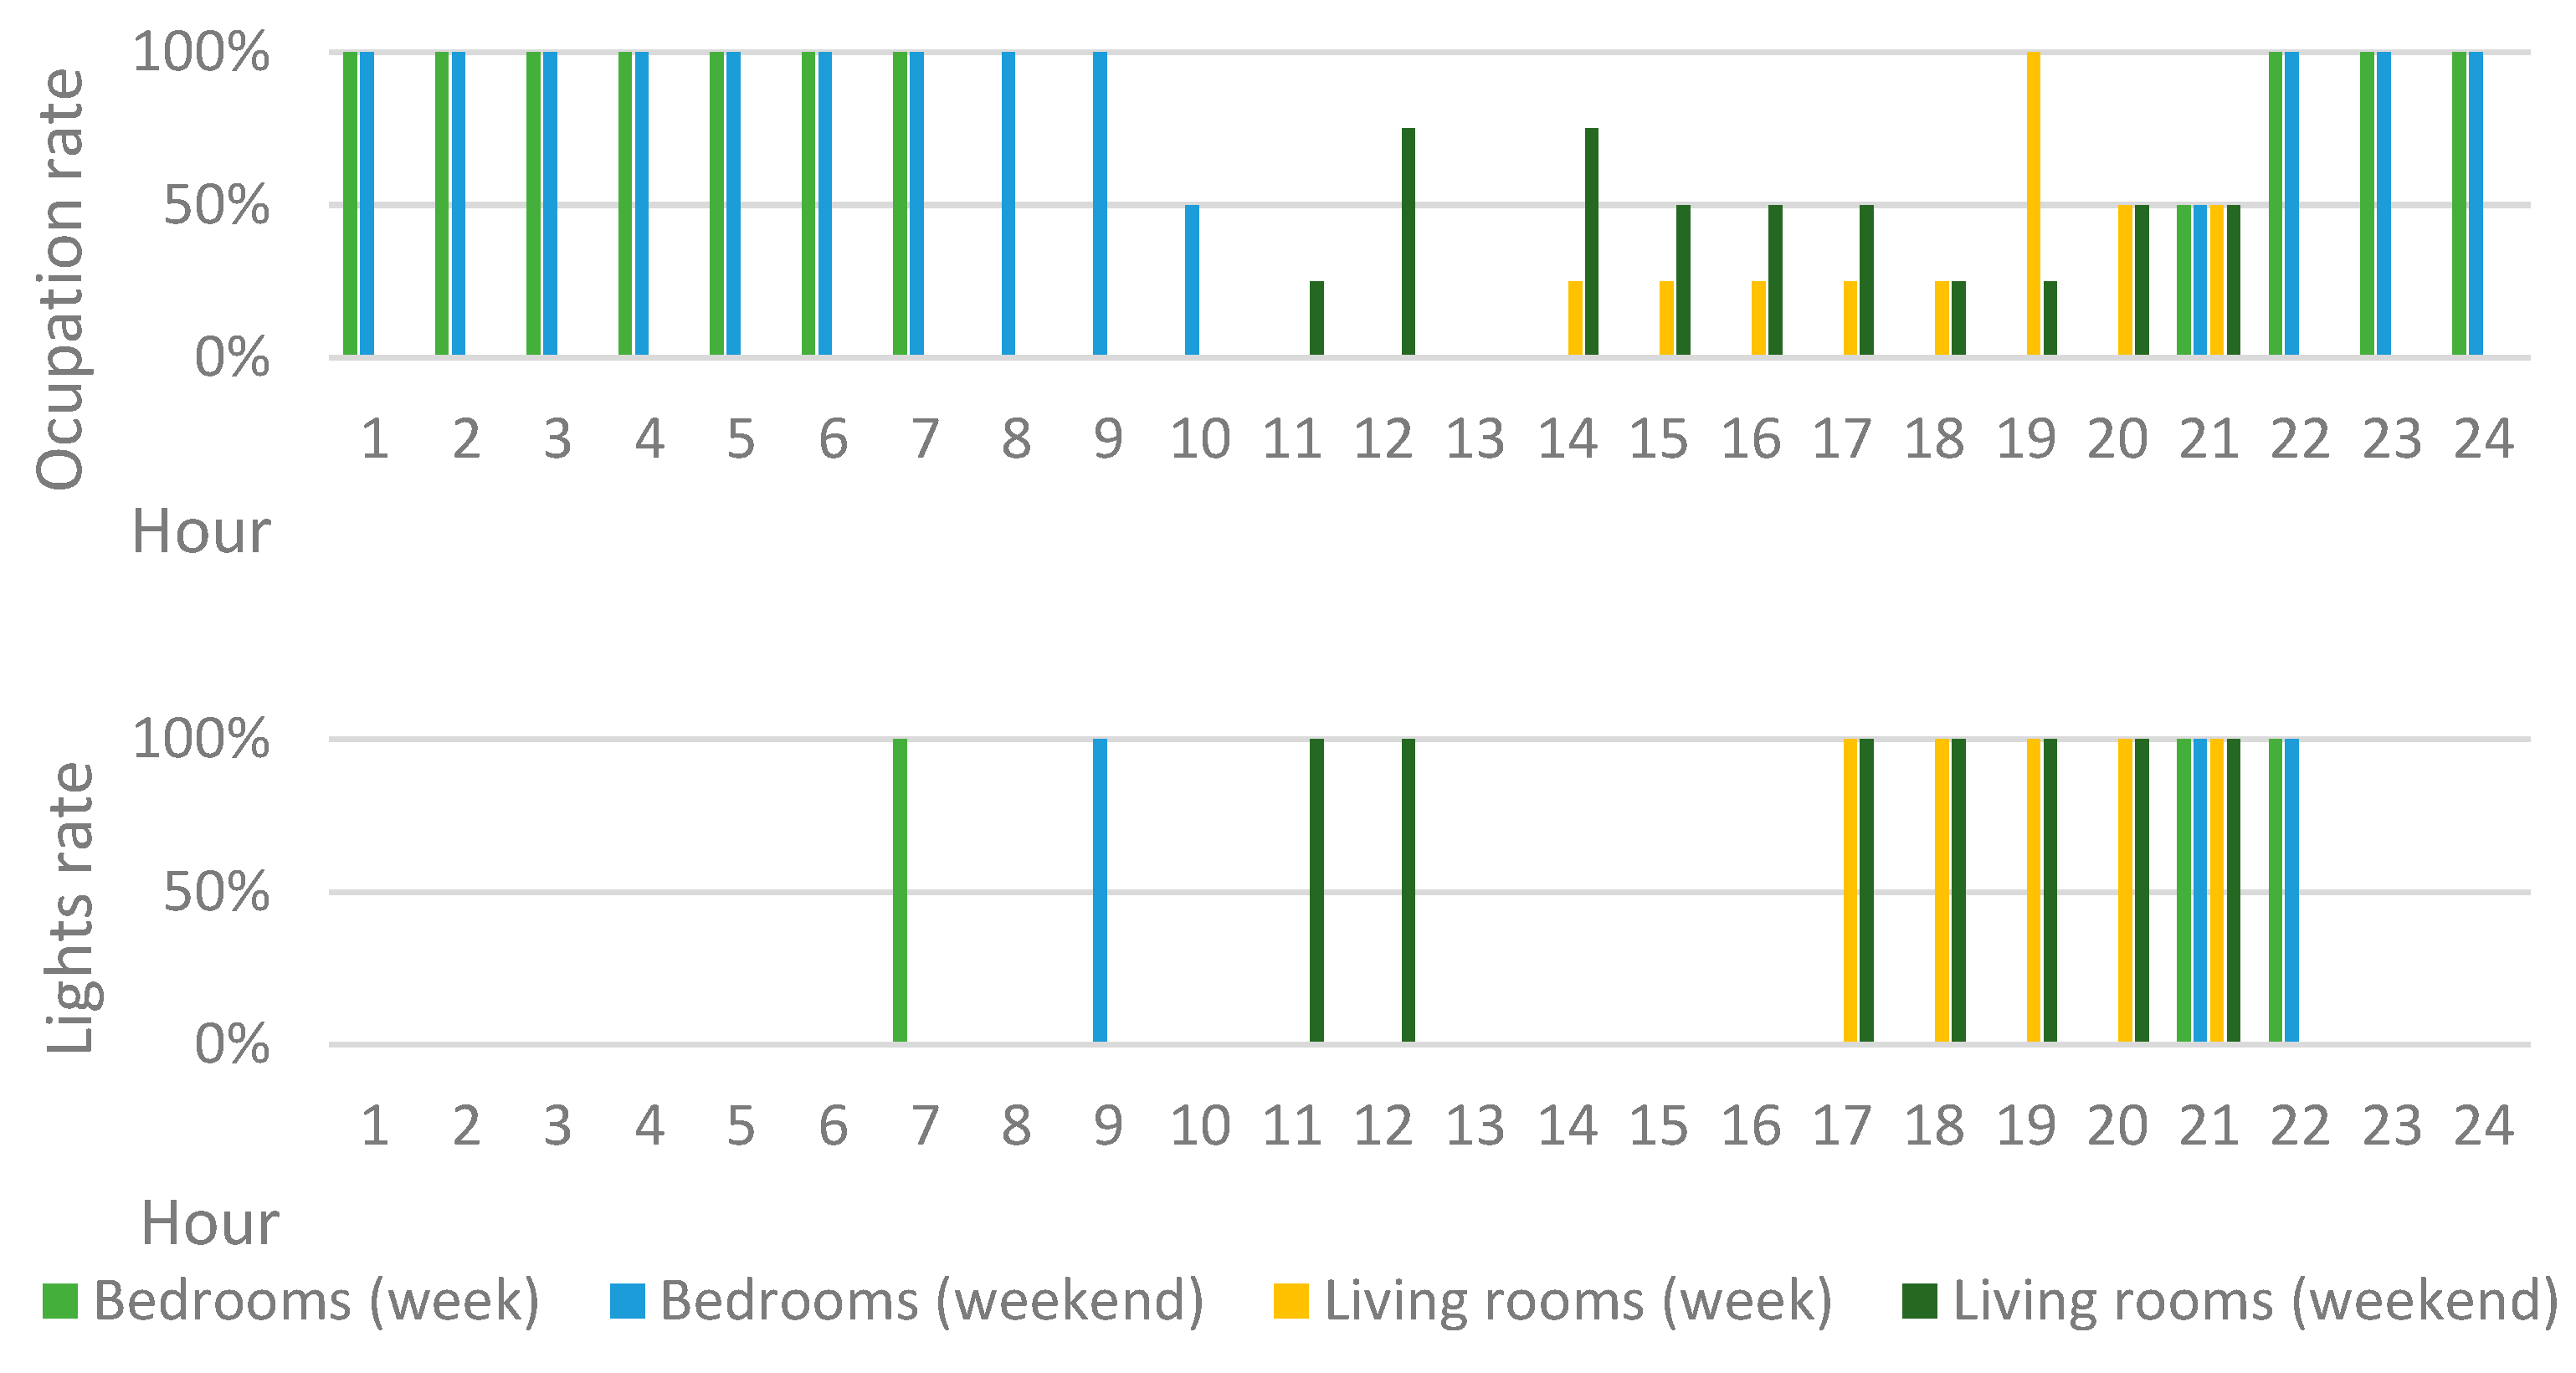
41]. The ventilation opening fractions were calculated based on the classification of the type of opening specified in Annex II of the Technical Quality Regulation (RTQ) for the Energy Efficiency Level of Residential Buildings in Brazil. The internal gains were configured according to the guidelines of the same regulation and are detailed in
Figure 6.
Two mechanisms for ambient cooling were considered. The first is the natural ventilation and the second is the air conditioning system (HVAC). In the natural ventilation configuration, the windows were allowed to open when the internal temperature was higher than the external one, with a minimum limit of 20 °C. In the second case, the configuration was performed in the “HVACTemplate:Zone:IdealLoadsAirSystem” object. The HVAC system was configured to be activated when the internal temperature was higher than the external one, and there was an occupant in the room, considering a thermostat with a cooling temperature of 24 °C.
In the configuration of the HVAC system, the cooling system was configured to work all year round. As for heating, the equipment could only be activated in winter (from 21/06 to 21/09), when the thermostat reached 18 °C, whenever there was an occupant in the room.
2.4. Performance Indicators
Two indicators were used to analyze the performance of the models, the cooling/heating degree-hours (DH) and the cooling/heating thermal loads (TL), considering the different cooling mechanisms as defined below:
Degree-hours (DH): The number of hours in which there would be a need for cooling/heating to decrease/increase the operating temperature were added, with limits of 26 °C for cooling and 18 °C for heating, thus determining the degree-hour of each environment, according to Equations (1) and (2). This indicator is calculated when the building is naturally ventilated. Equations (1) and (2) are as follows:
where
Ti is the operative temperature ranging in
i from 1 to 8760;
DHc is the degree-hour for cooling;
DHh is the degree-hours for heating;
i is the simulation number.
Thermal load (TL): In the case of thermal load, the thermal energy required for annual cooling or heating of all environments was added, thus determining the TL of each model for cooling (TLc) or heating (TLH). This indicator is used when the building has air conditioning.
The simulations were performed for 8760 h of the year in the climate file, for each city and for each long-stay room, i.e., bedroom 1 (Z2), bedroom 2 (Z3), and the living room (Z4). The results in the simulations were obtained for the three rooms; however, in the case of the DHc and DHh indicators, the weighted average was calculated with the area of the rooms to define the indicator that represented the model, represented by DHcm and DHhm. For the analysis of the difference ratio, the simulation without a PCM was used as a reference for each city. The indicator was initially calculated by determining the difference between the reference and the sample of each city for each of the indicators (DHcm/DHhm and TLc/TLh), and by subsequently expressing this difference as a ratio relative to the reference samples.
3. Results and Discussion
Initially, the behavior of the EnergyPlus functions and the PCM under the specified boundary conditions is verified. Subsequently, the thermal performance simulation results are presented, accompanied by the corresponding correlation analyses. Finally, a brief economic analysis is conducted, establishing financial benchmarks that determine the feasibility of material application.
3.1. Simulation and PCM Verification
To validate the simulations, two representative samples were tested: one without HVAC and the other with HVAC. For the non-HVAC case, the requested output variables included external dry-bulb air temperature, air exchange rate, occupant count, and average indoor air temperature. In the HVAC case, the obtained variables were external dry-bulb air temperature, HVAC system thermal load, occupant count, and average indoor air temperature.
The verification was conducted in one of the bedrooms of the residence over a 48-= h period, on April 1st and 2nd, using weather data from São Paulo, SP.
Figure 7 presents the hourly behavior of the variables for the non-HVAC scenario, while
Figure 8 illustrates the HVAC scenario. The tests demonstrated the functioning of natural ventilation in the occupied spaces during the simulations without HVAC. In the HVAC cases, the system was activated when the spaces were occupied and the indoor temperature reached 24 °C.
To verify the effective performance of the PCM, simulations were conducted in which the material was evaluated without its latent heat storage capability, while maintaining its thickness and other thermal properties.
Figure 9 and
Figure 10 illustrate the temperature differences in the test case, comparing ambient temperatures between the model with fully functioning PCM and the model with PCM lacking the latent heat storage capacity. The results showed that the material worked effectively, as expected.
3.2. Thermal Performance of the PCM Container Wall
The results are presented separately for each type of wall to enable the analysis relating the results with and without PCM, with “without PCM” being described as 0 (zero) on the x-axis. For the interpretation of the results, the lower the values of the indicators (DH and TL), the better the thermal performance of the building, since there is less need for energy for cooling/heating or thermal load.
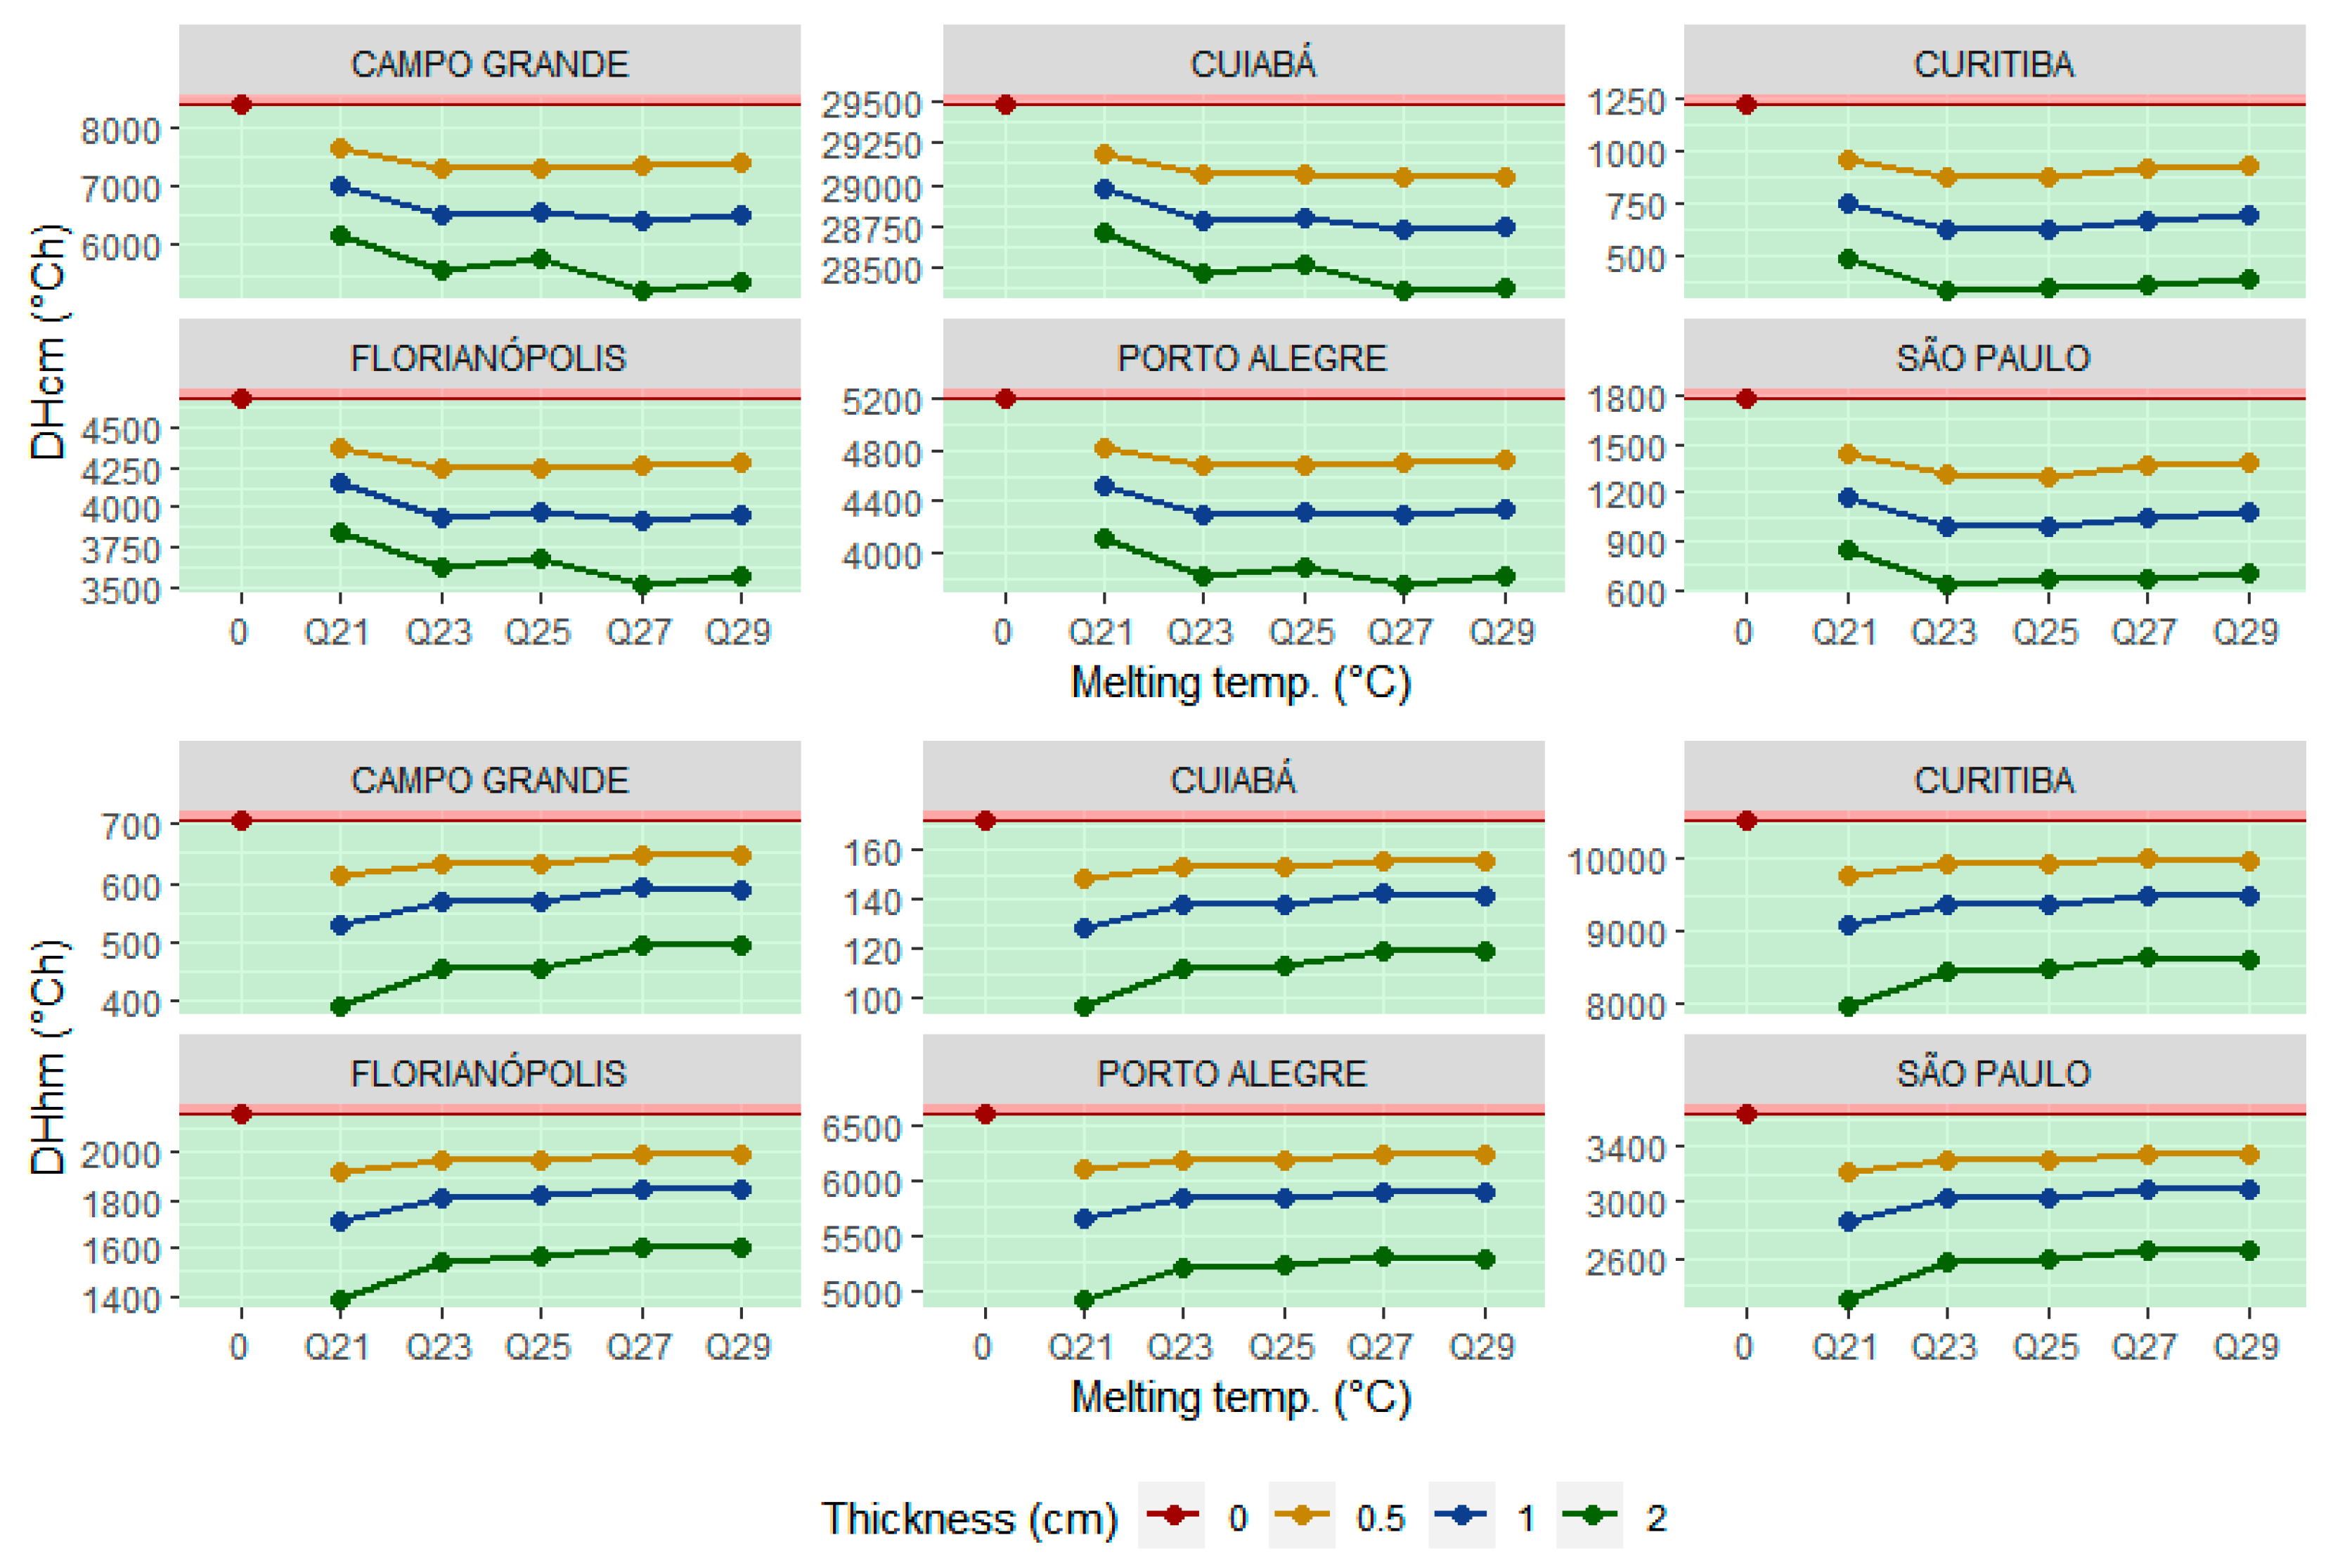
Figure 11 presents the degree-hours for cooling (DHc) and heating (DHh) across six distinct climates, considering various PCM melting temperatures and layer thicknesses for the model with the container walls. The results demonstrate that the thermal performance varied according to the specific indicators used, as well as the climate conditions, whether hot or cold. Initially examining lightweight walls, the degree-hours for cooling (DHcm) indicator consistently shows that models incorporating a 2 cm PCM layer exhibited superior thermal performance in all scenarios. The performance for DHcm improves with an increase in PCM melting temperature. Conversely, for the degree-hours for heating (DHhm) indicator, the results indicate optimal performance, with the PCM having a melting temperature of 21 °C.
It should be noted that the y-axis was kept compatible with the degree-hours value achieved in each climate for visual purposes. In Cuiabá, for example, the DHcm reaches values greater than 29,000 °Ch, while in São Paulo the values are much lower (<1800 °Ch), which shows a great difference between the climates. The same occurred for Curitiba in the case of the DHhm indicator, which reached high values (above 8000 °Ch) compared to the other cities. Regardless of the scale, the DHcm and DHhm values of the samples with PCM were more efficient when compared to their respective reference values without PCM.
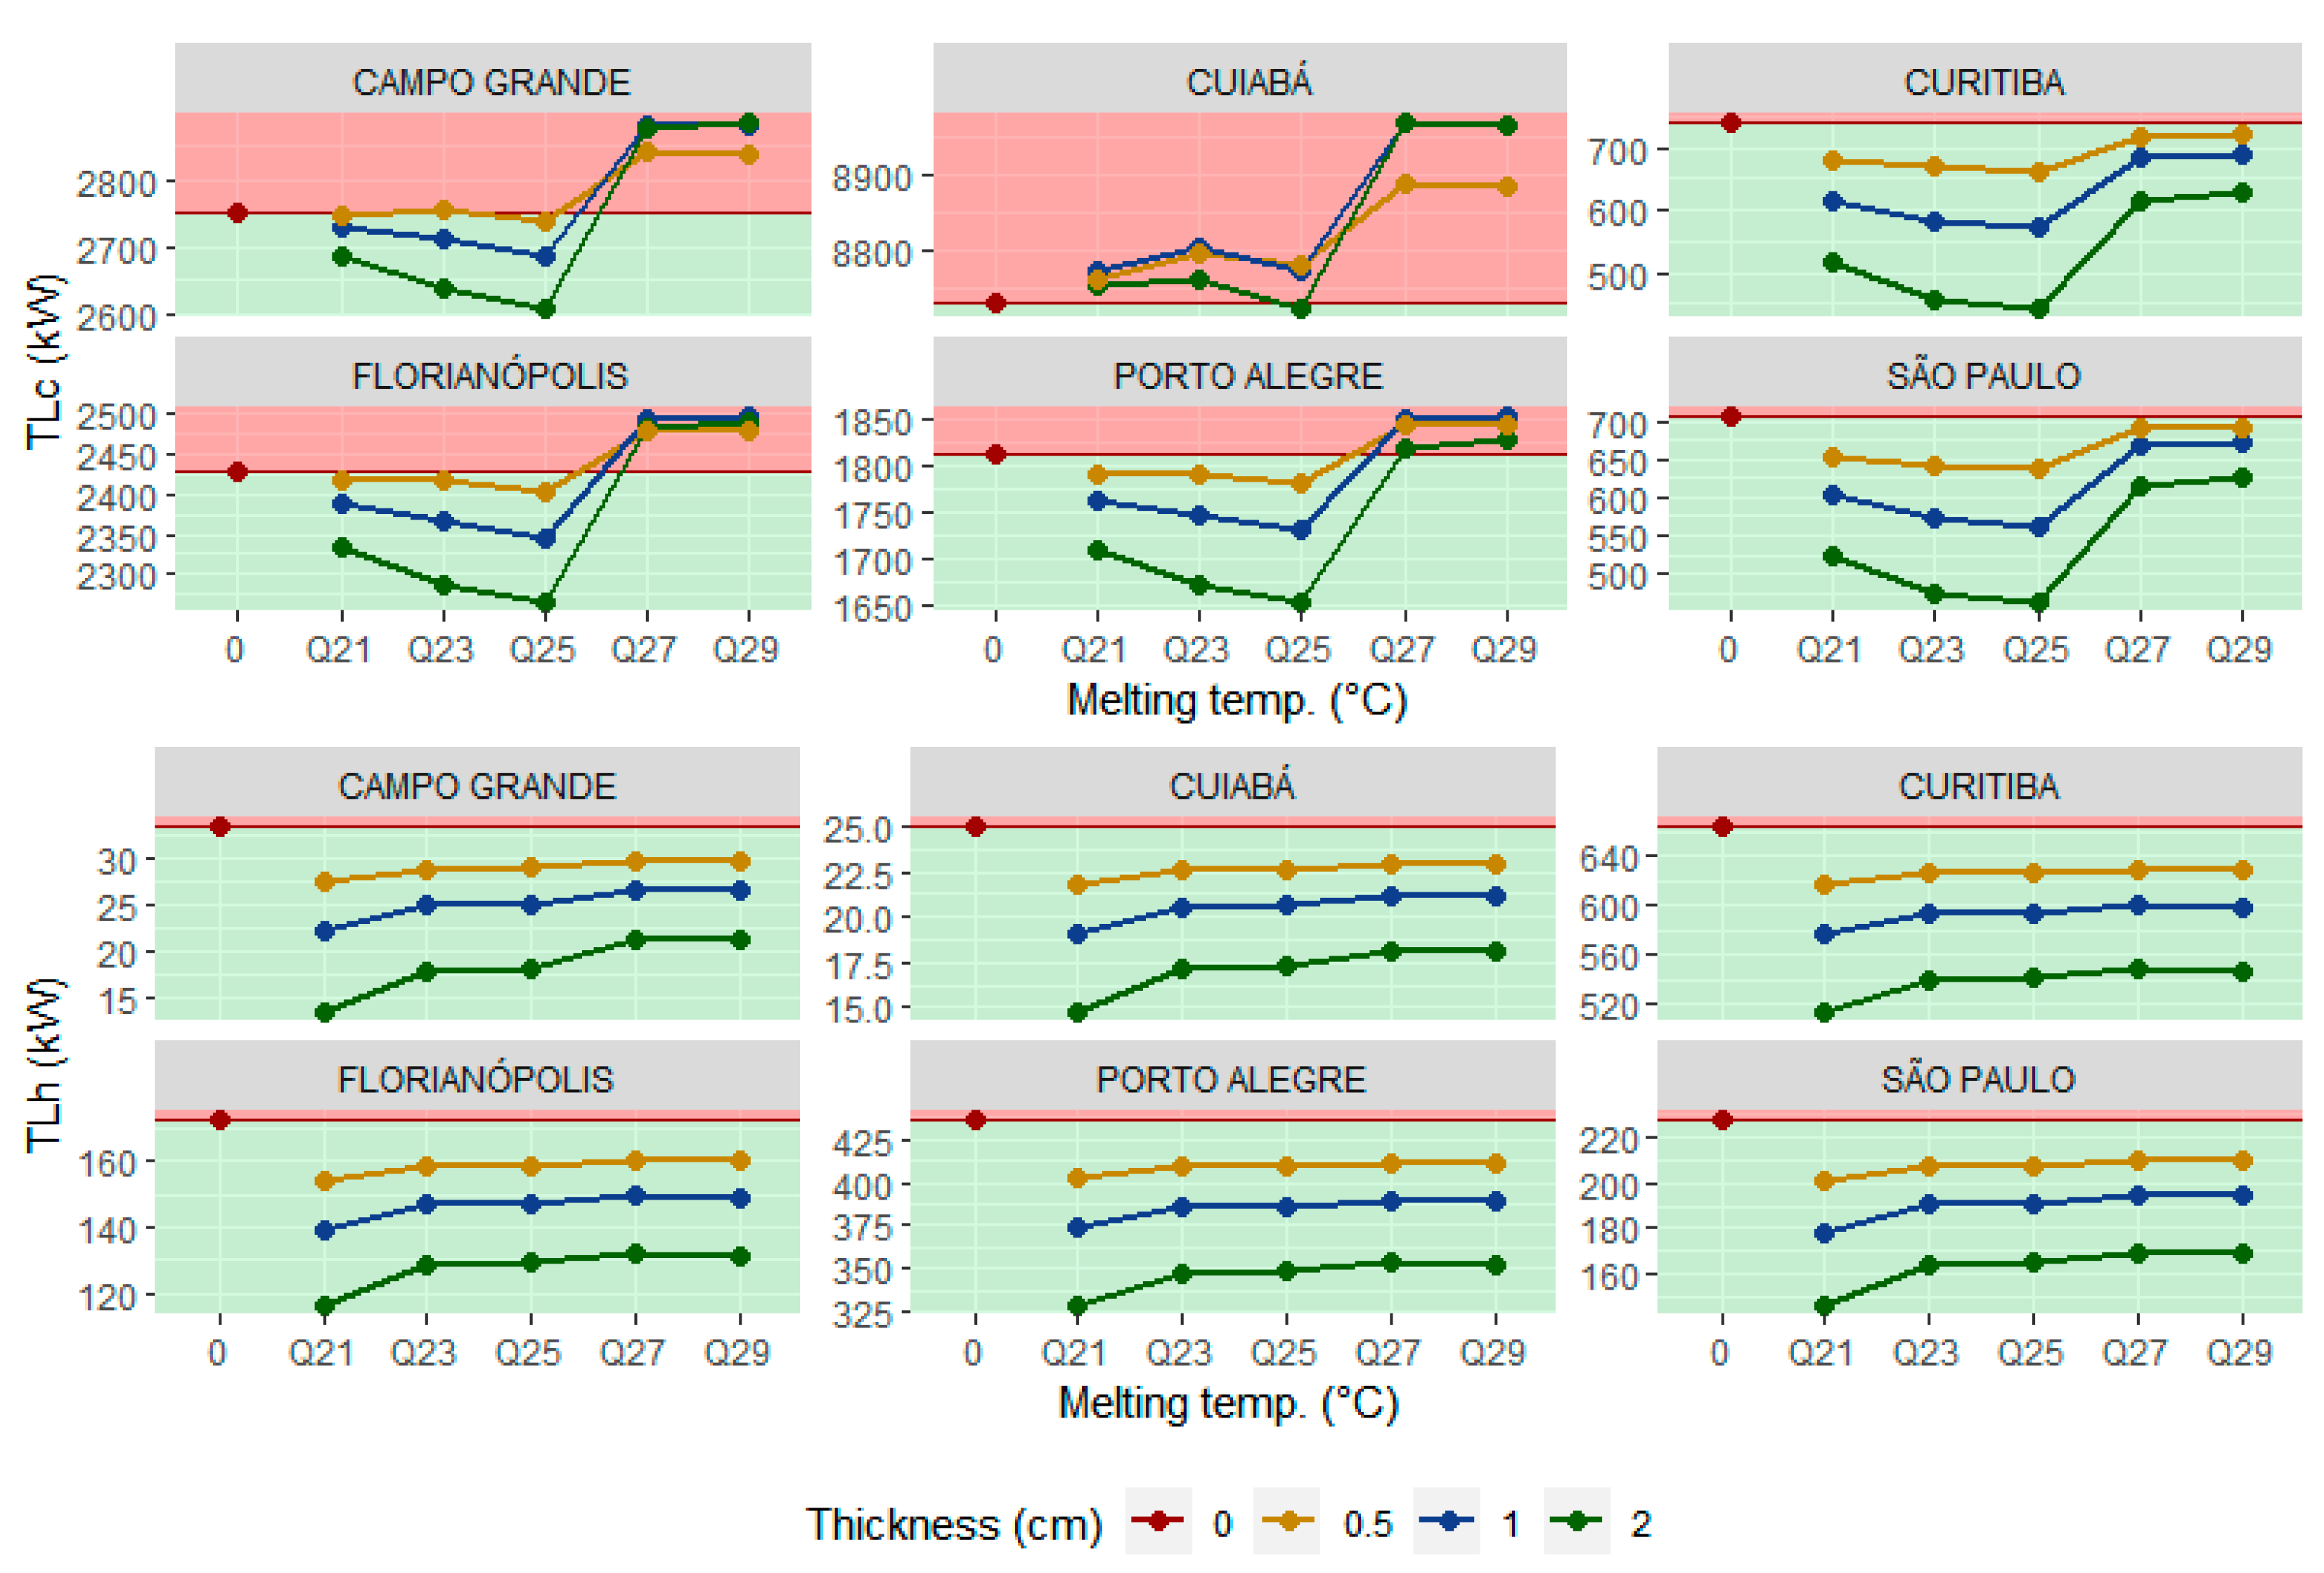
The behavior of thermal loads for cooling and heating are shown in
Figure 12. Beginning with the analysis of the cooling thermal load (TLc), positive results occurred for the colder cities, such as Curitiba and São Paulo. In this case, the influence of the climate on performance was greater, demonstrating the relationship between thermal load and climate. The PCMs Q27 and Q29 showed worse performances, including negative results for all cities with negative outcomes. It is worth noting that the city of Cuiabá has only one positive result for the PCM, in the sample with Q25 and 2.0 cm thickness.
When analyzing the heating load results, in general, the samples with PCM performed better than the references without PCM. Similarly to the cooling load results, materials with lower melting temperatures achieved better performance. Observing the load values reached in the simulations, the difference in load is evident when comparing hot cities, such as Campo Grande and Cuiabá, with colder cities, such as Curitiba and Porto Alegre.
3.3. Thermal Performance of PCM Structural Concrete Insulated Panels (SCIP)
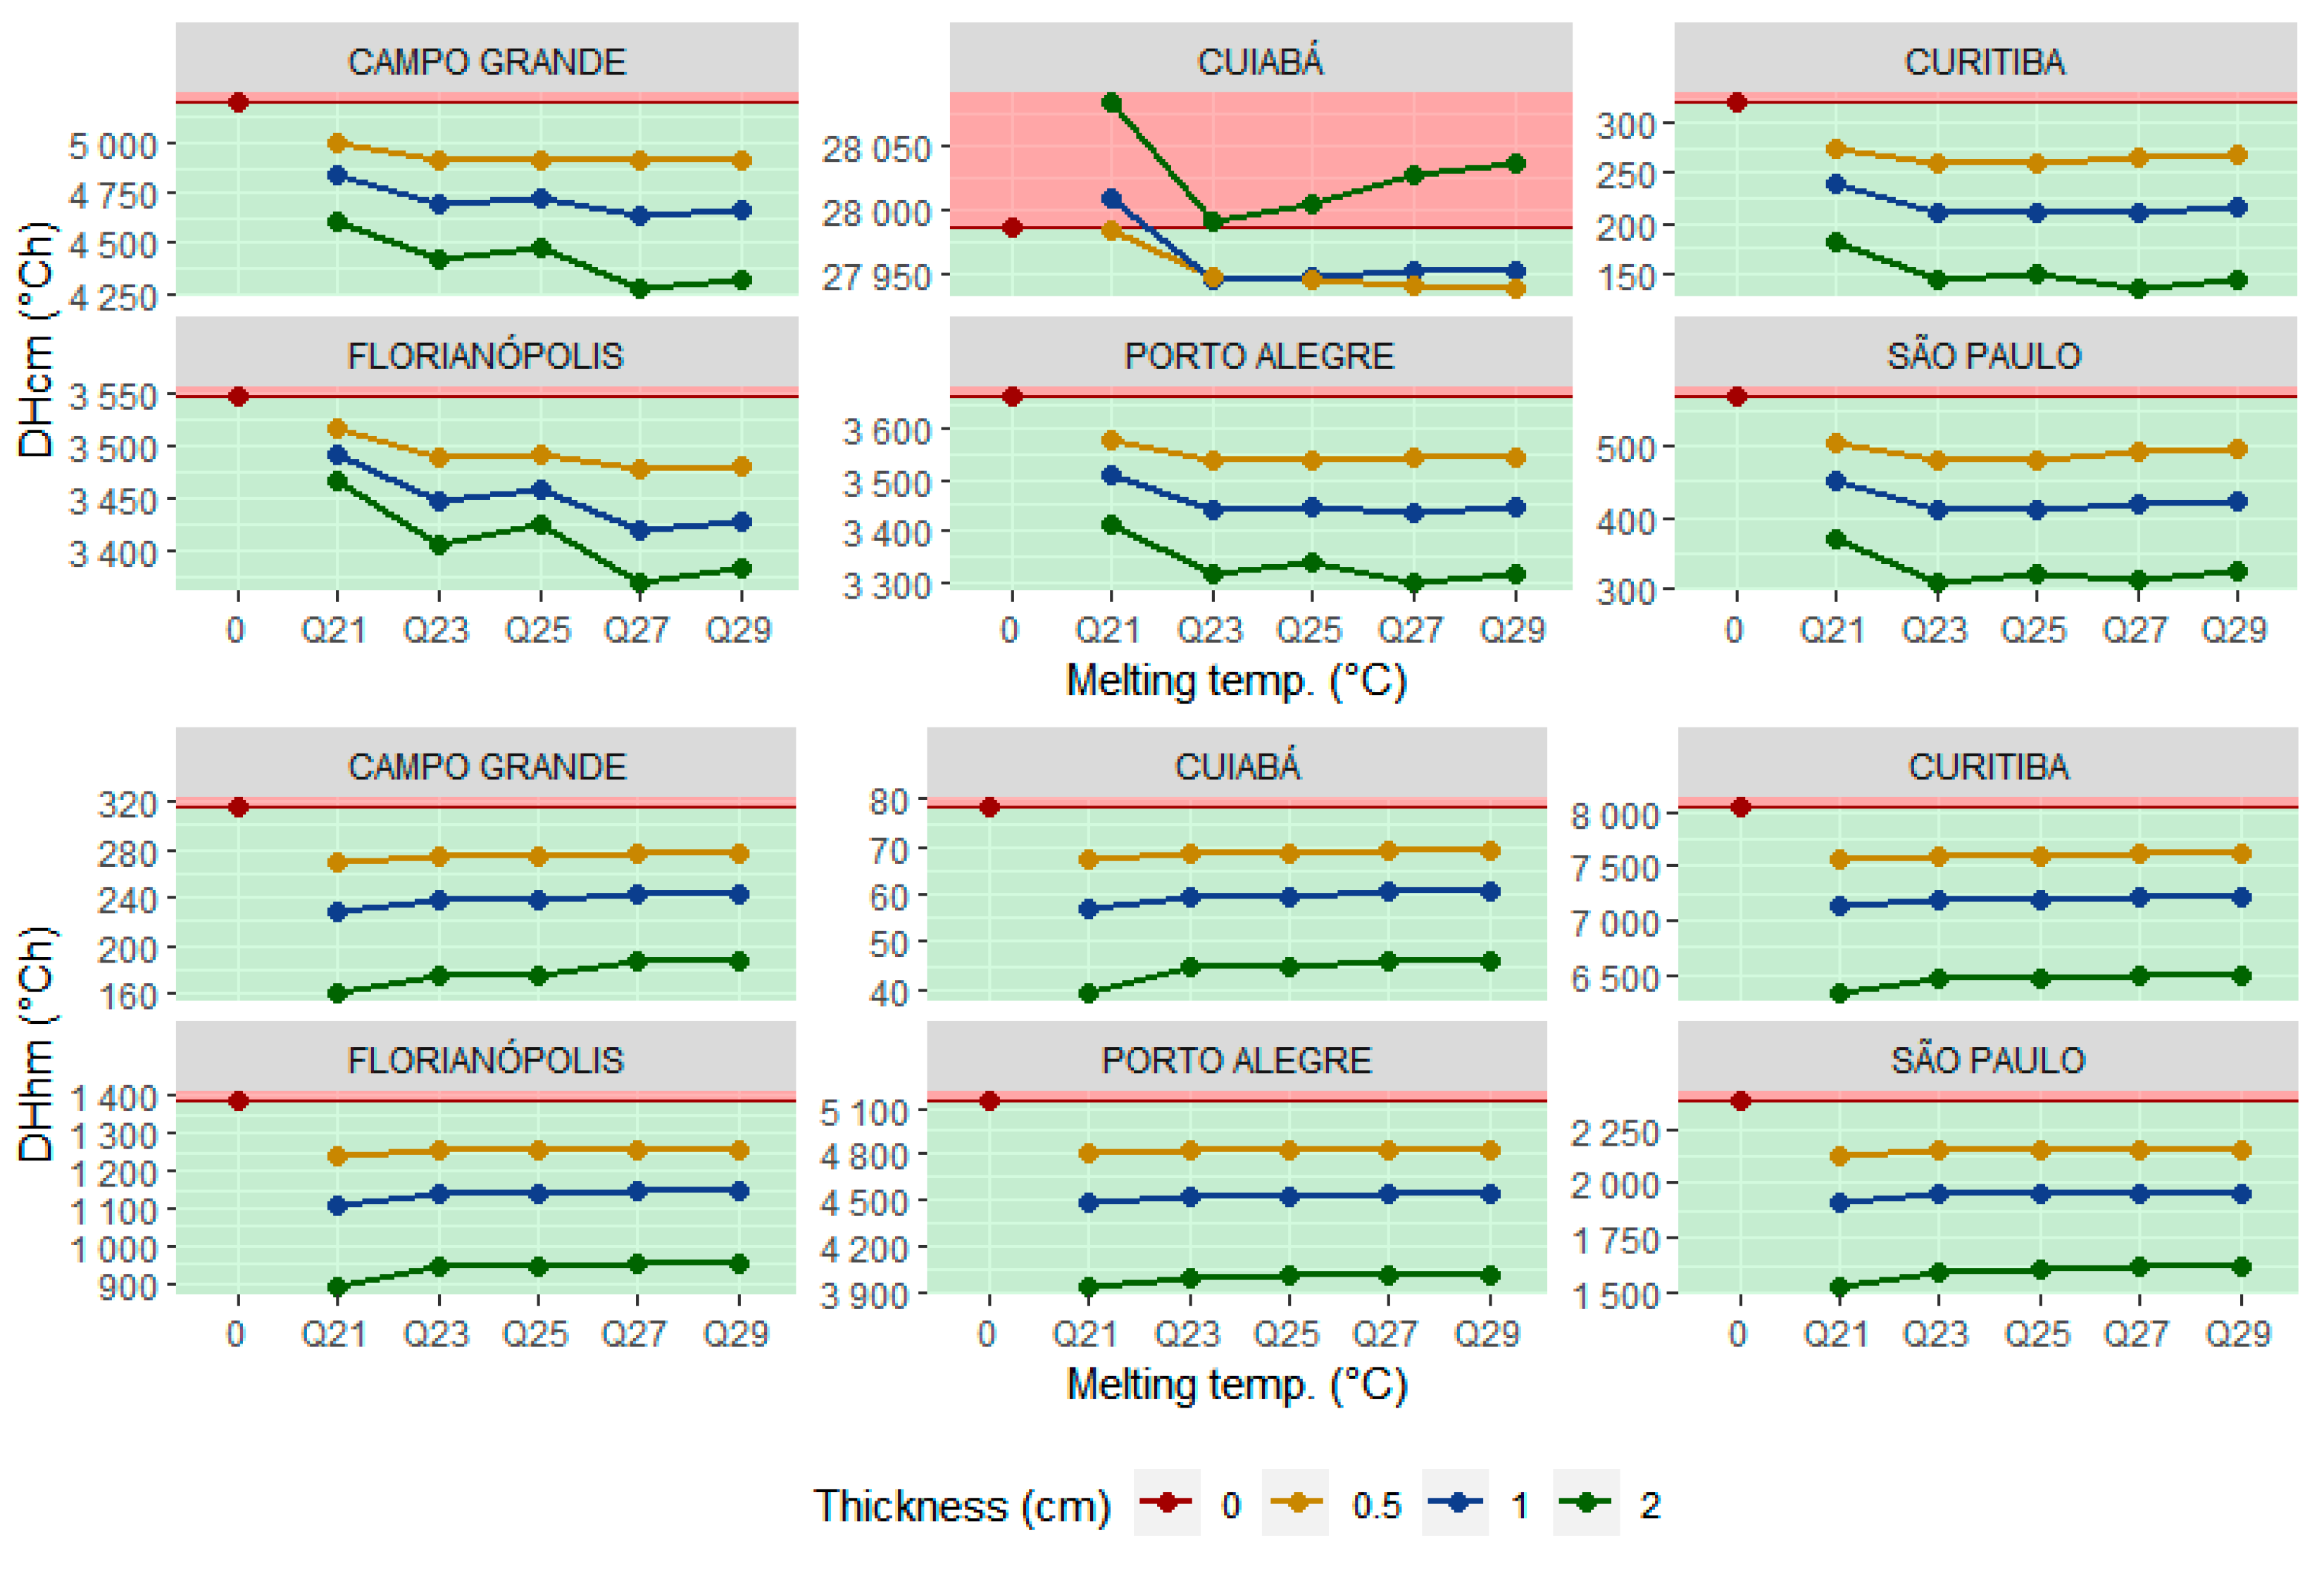
The analysis of the models with SCIP envelopes was conducted in the same logical sequence as for the container walls, starting with degree-hours. The results of the cooling analysis showed low variations yet remained positive for the models with PCM in most cities. The SCIP walls exhibited lower DHcm values compared to the cases with lightweight walls (i.e., container walls). The DHcm results for Cuiabá exhibited a divergent behavior from the general trend, with samples containing 2.0 cm thick PCM showing the least favorable performance. Only the city of Cuiabá presented negative values for all samples, with 0.5 and 1 cm PCM and the Q21 sample with a thickness of 2 cm. The DHhm results displayed behavior consistent with those for lightweight walls; however, they demonstrated less variation between the melting temperatures of the PCMs. Additionally, the DHhm values were lower, indicating a reduced need for degree-hours of heating for the heavy walls. The tabulation of the data is in
Figure 13.
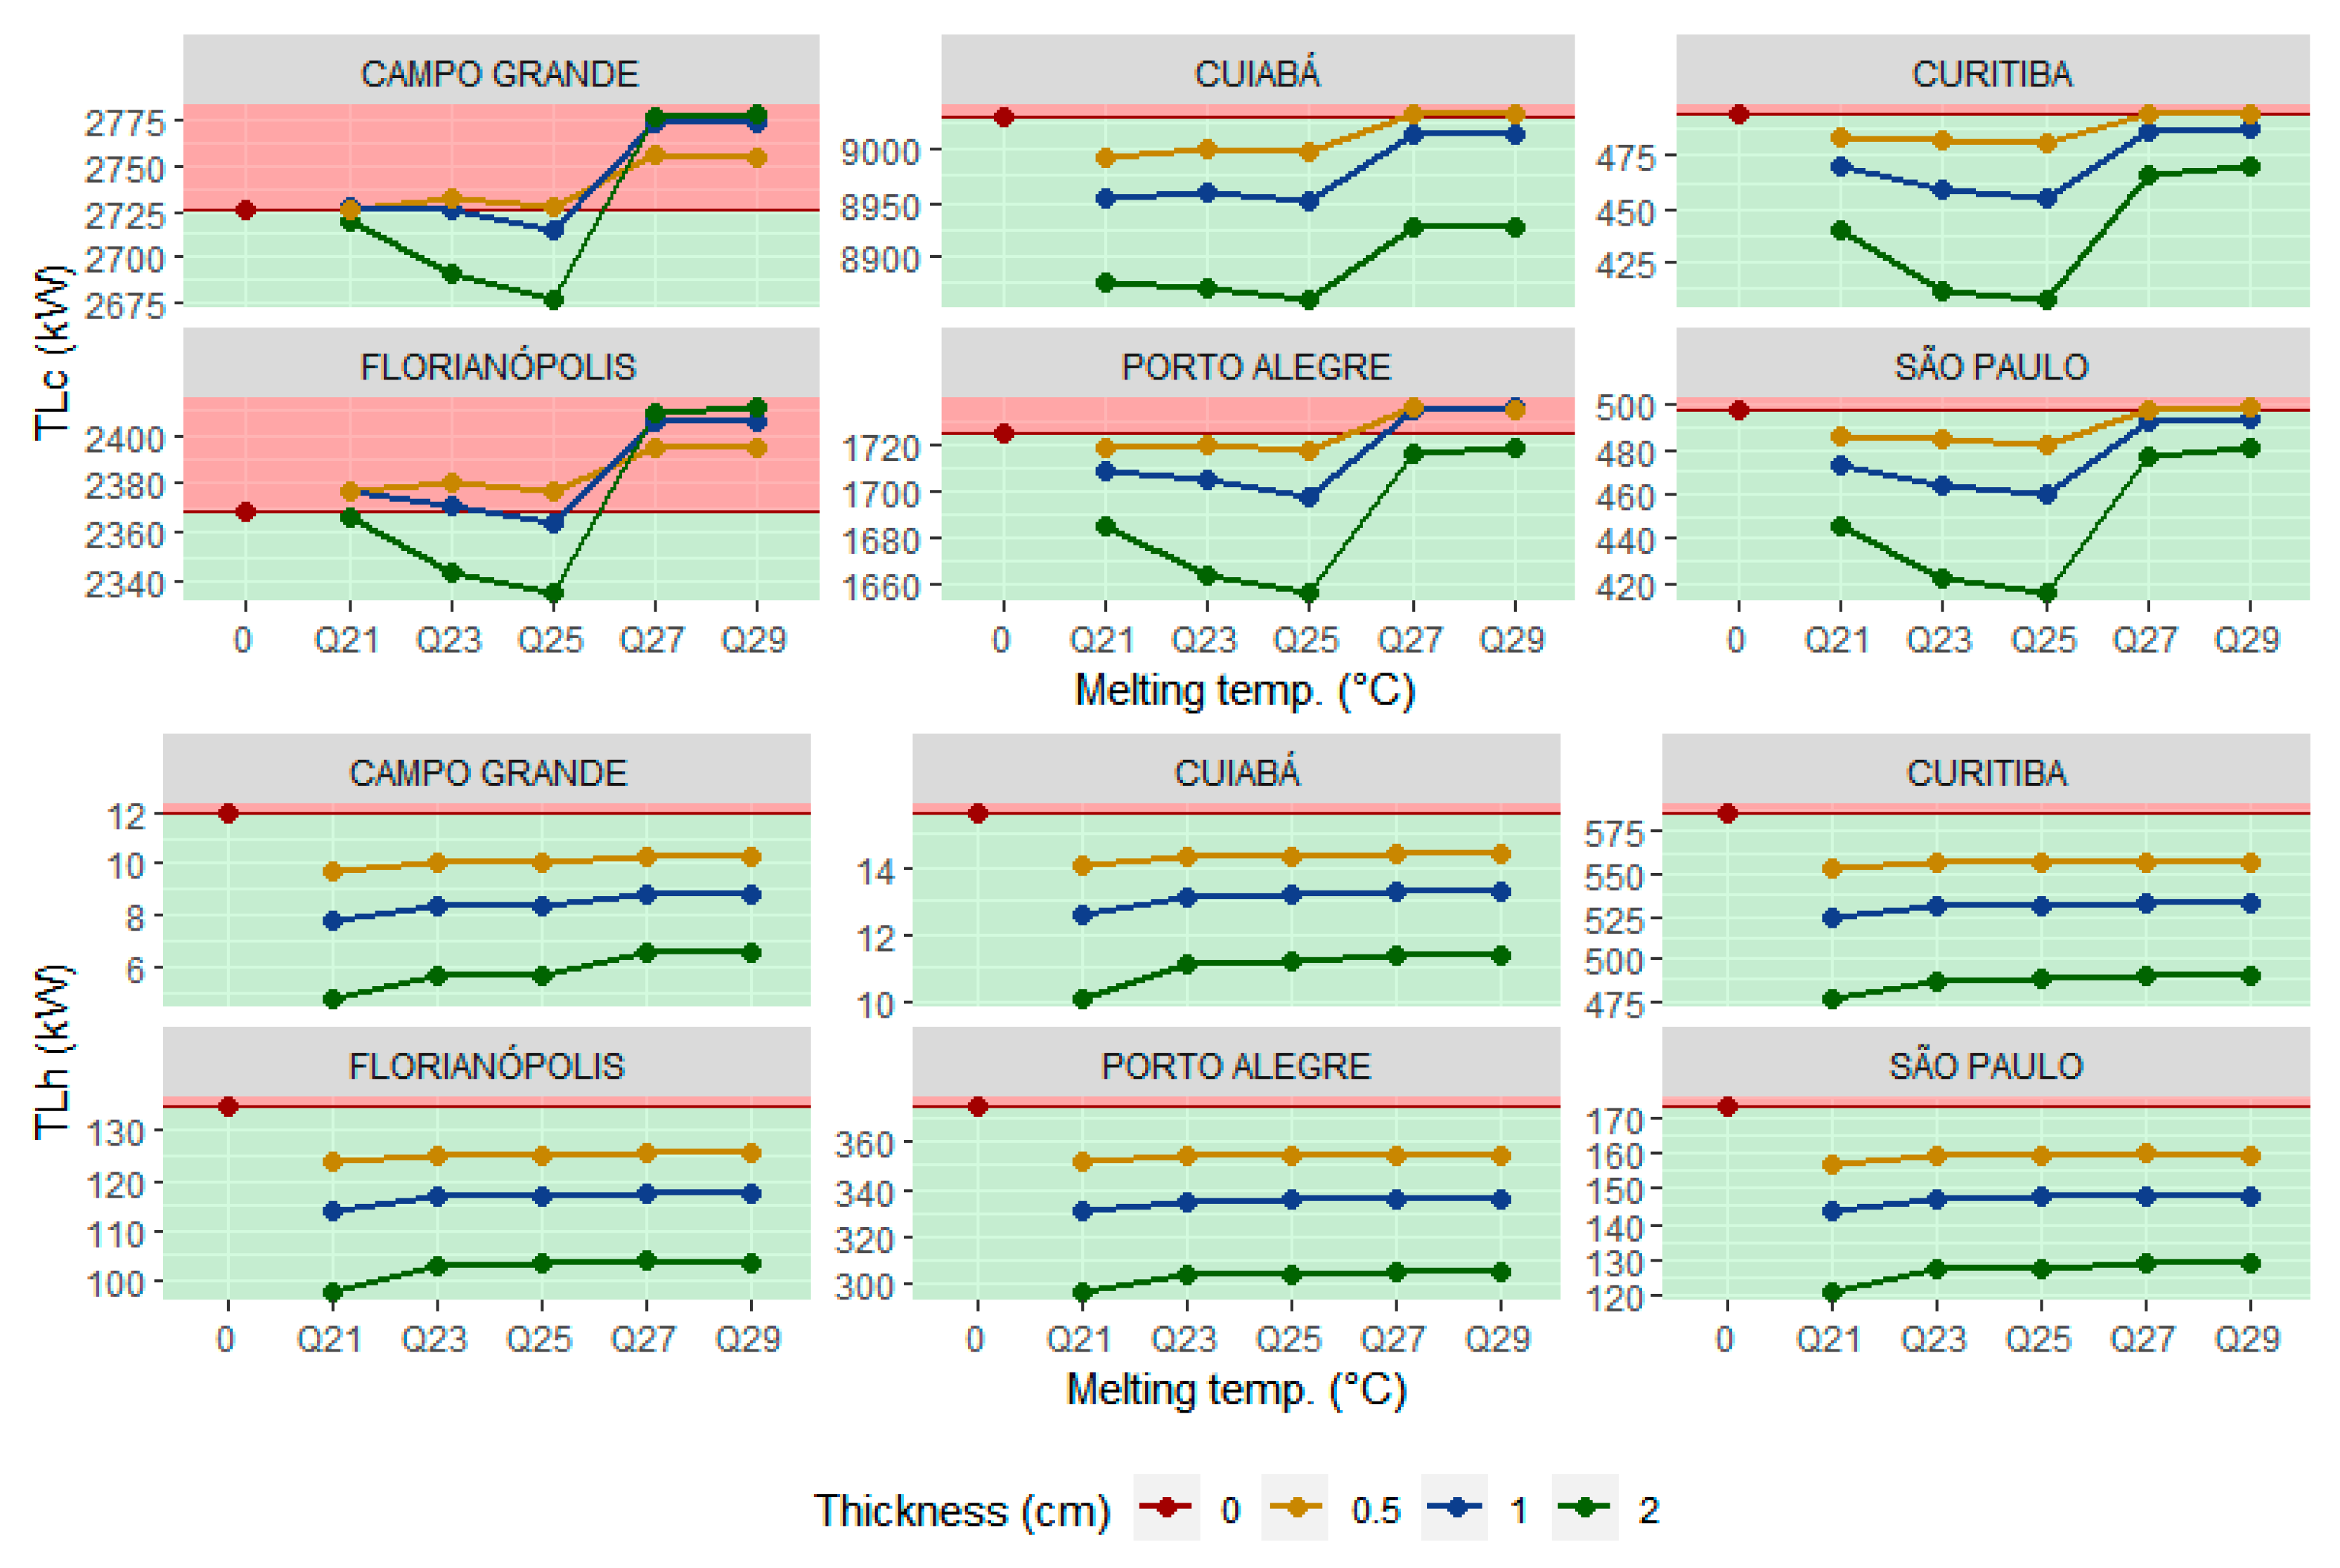
Figure 14 presents the cooling/heating load results for the samples with heavy walls. Overall, the behavior of the results was consistent with the samples with lightweight walls; however, the DHm values were lower, and, notably, there were more positive results for the city of Cuiabá.
3.4. Ratio Difference
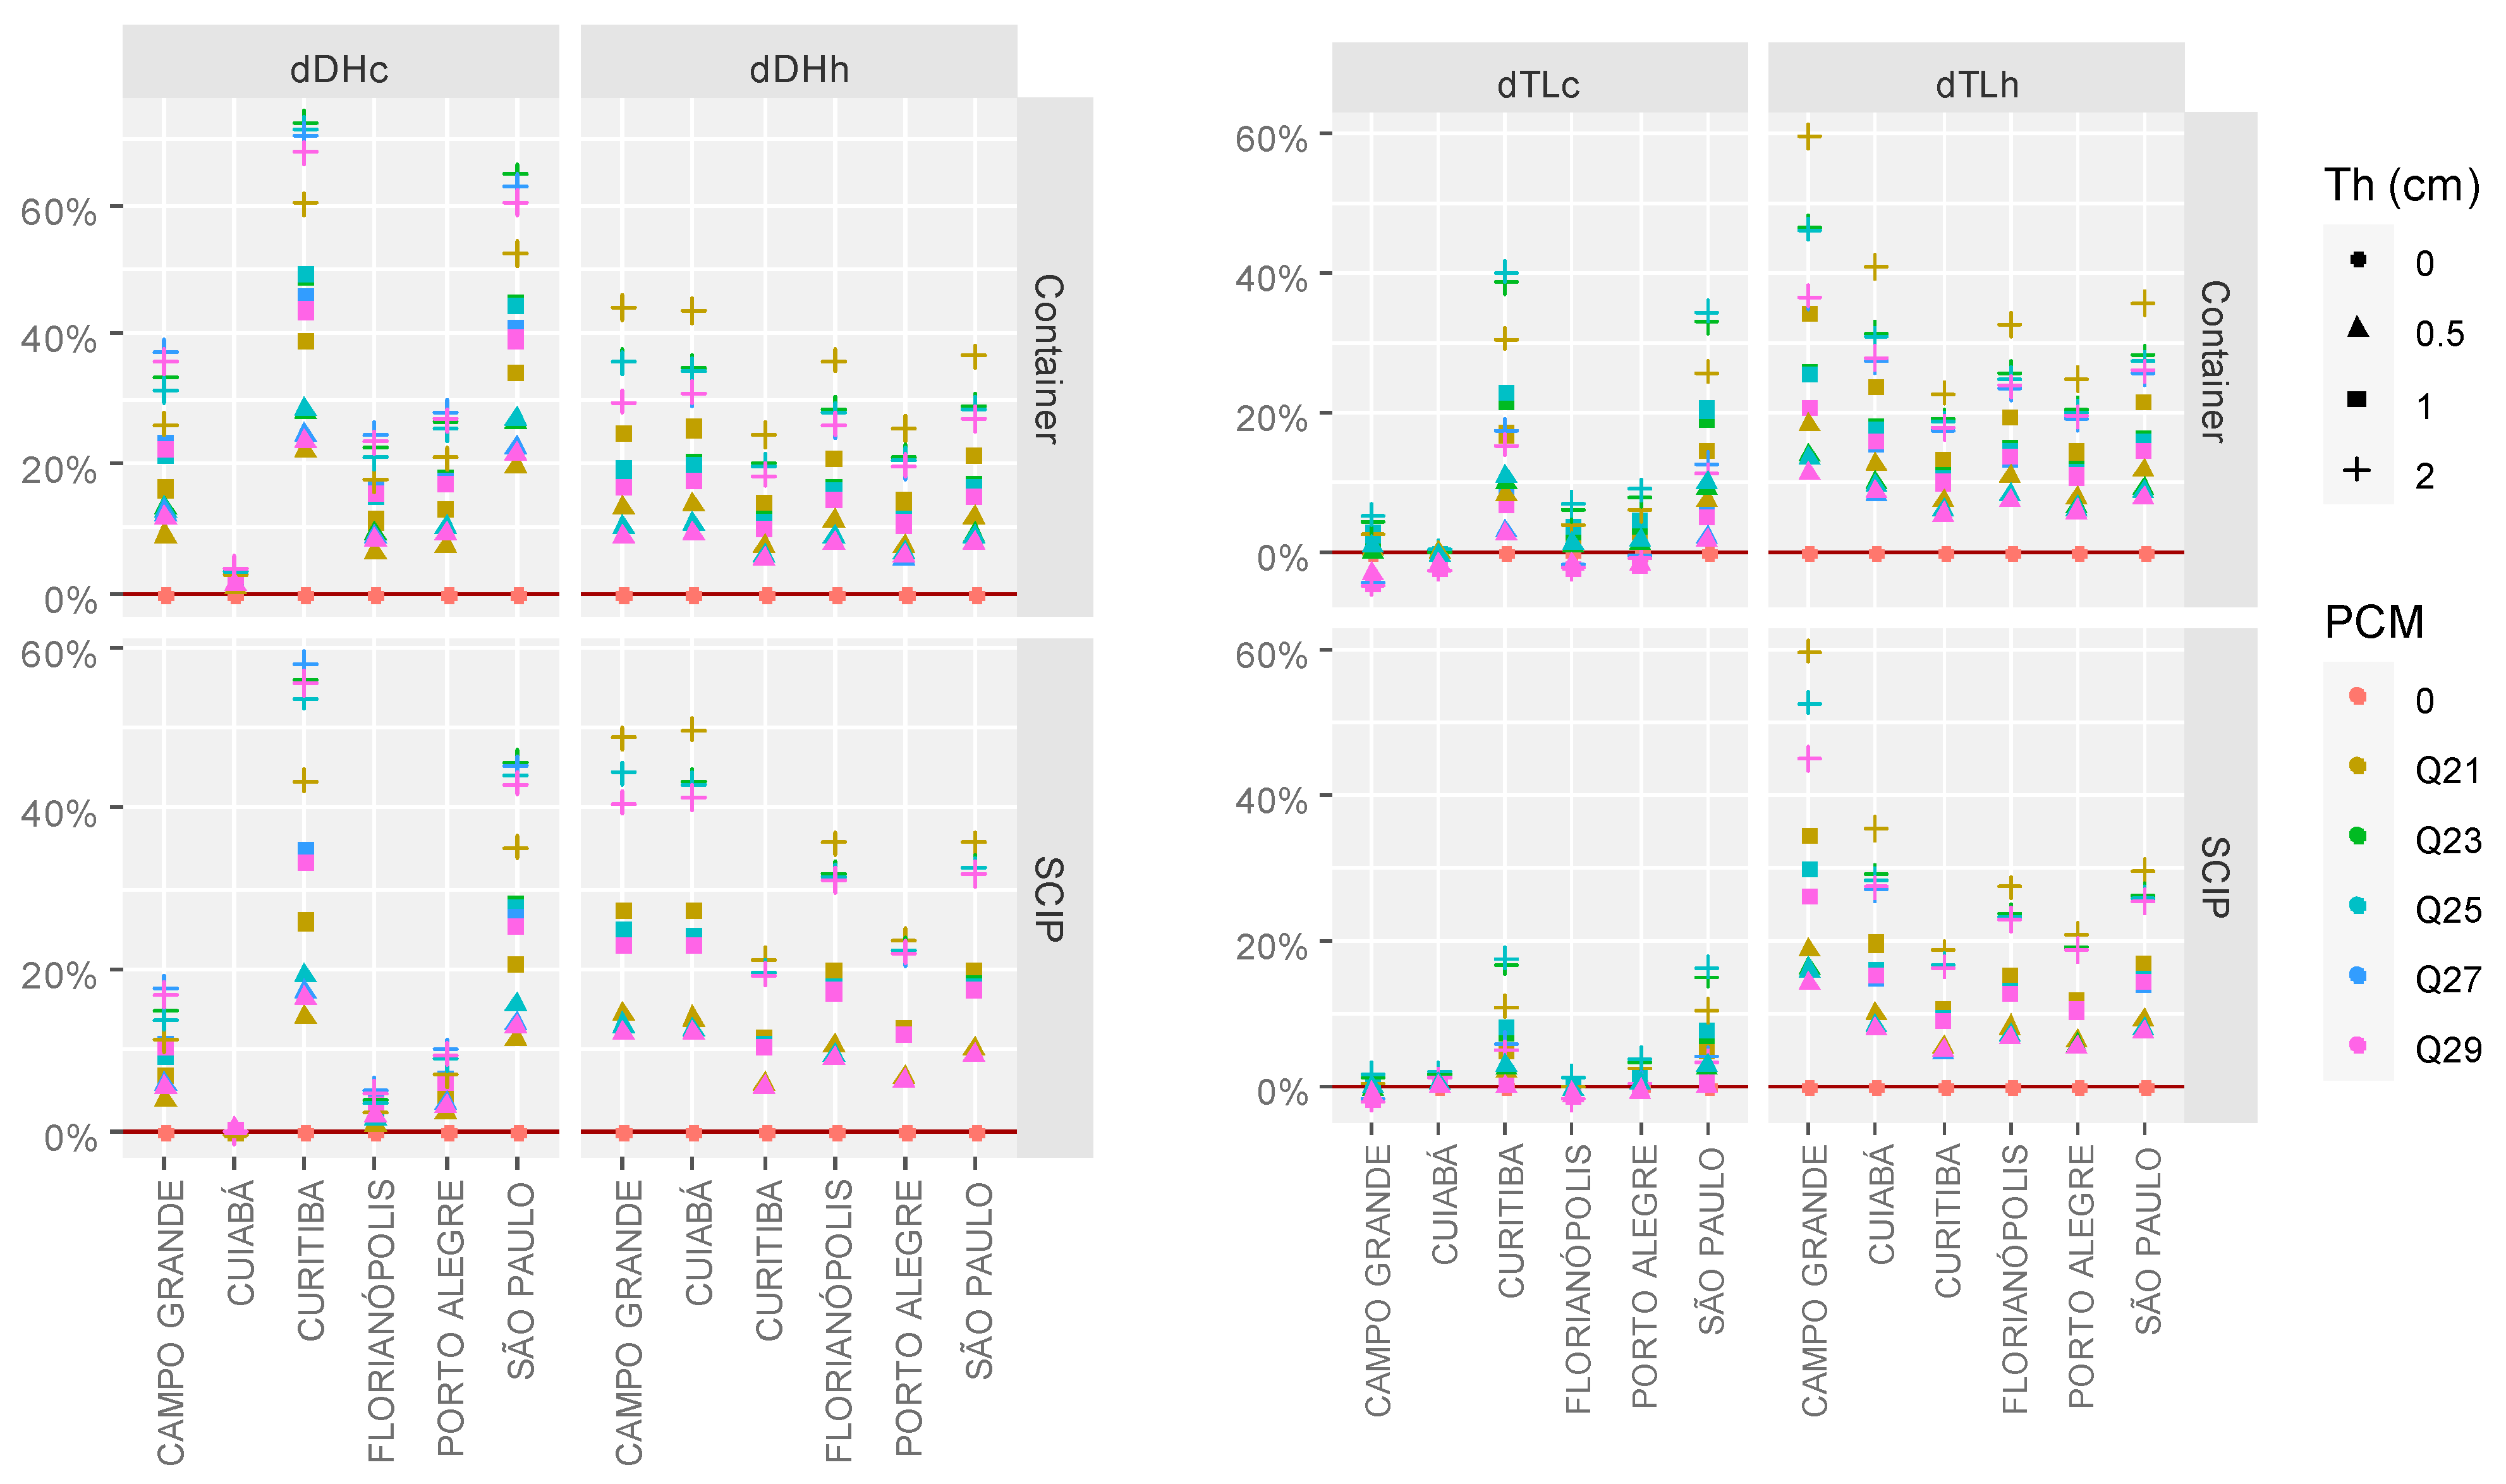
Based on the average values of DH and TL, a comparative analysis was conducted between the reference simulations of each city, expressed as a ratio of the differences. This approach allowed for the evaluation of the relative performance of the samples in comparison to the reference condition. The performance results are depicted in
Figure 15, with the indicators labeled with the letter ‘d’.
The results for DH highlight the superior performance of the samples with a 2 cm PCM layer. It is worth noting that although some DHh percentage values for Cuiabá exceed 40%, the absolute values of this property are significantly lower than the absolute DHc values, which exceed 20,000, with positive variations below 10%.
The TL results confirm the patterns observed for DH, showing that the samples with a 2 cm thickness perform better. Additionally, a significant difference is observed between the results obtained for lightweight and heavyweight walls. Overall, it is evident that lightweight walls exhibit superior performance in terms of cooling, for both DH and TL. However, SCIP samples demonstrate superior performance only in heating scenarios under natural ventilation conditions.
When evaluating the performance relative to melting point temperatures, distinct behaviors were observed for cooling and heating demands. For DHc, the most optimal outcomes were obtained with samples incorporating PCMs Q23 and Q27, with Q27 demonstrating superior performance in samples with heavyweight walls. In the case of TLc, the highest efficiency was noted in samples containing PCM Q25, which may be attributable to the HVAC thermostat setting of 24 °C. Lastly, for both DHh and TLh, the most effective performance was observed in samples utilizing PCM Q21.
3.5. Corelation Analysis
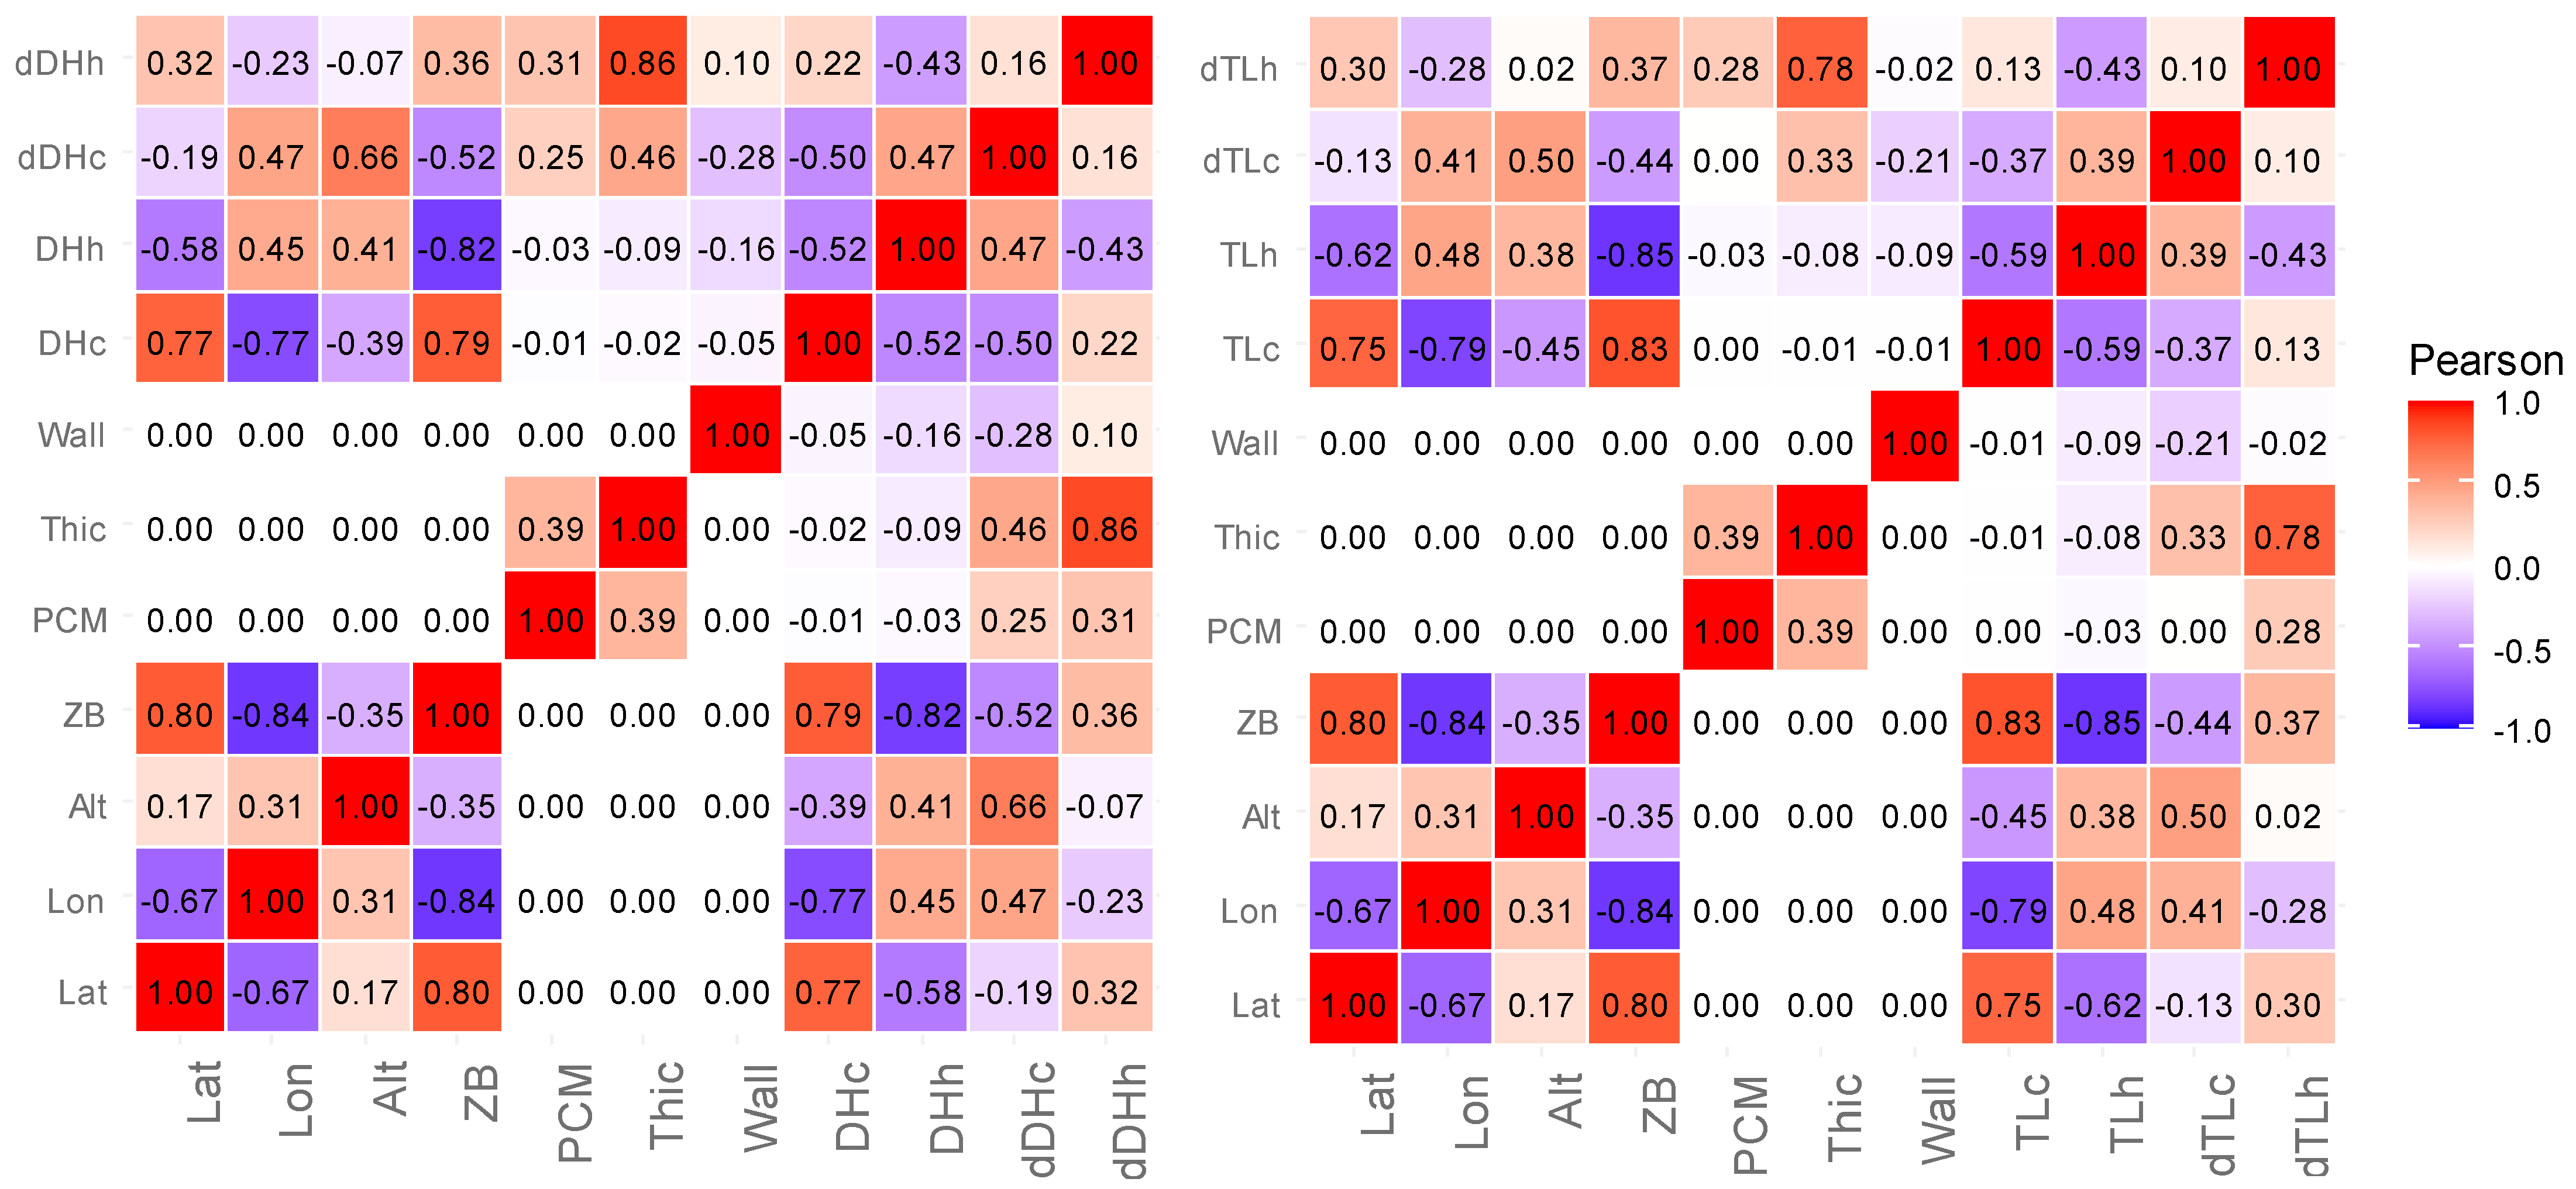
Figure 16 presents the correlation analysis between variables, employing Pearson’s analysis. A similar pattern is observed for both DH and TL cases. In the context of cooling, the most influential variable was the bioclimatic zone (BZ), while the least influential was longitude (Lon). Conversely, for heating, longitude emerged as the most significant variable, with the bioclimatic zone being the least influential.
In contrast, the indicators for the difference ratio exhibited a different behavior, not following the same pattern. For both dDHc and dTLc, altitude was identified as the most influential variable, whereas PCM thickness was the most significant for dDHh and dTLh. Additionally, the melting temperature presented a most notable influence when compared to the DH and TL indicators.
3.6. Economic Analysis
Following the thermal performance evaluation of the samples, a preliminary economic analysis was conducted to provide a broader perspective on the feasibility of using phase-change materials (PCMs) in Brazil. This analysis was limited to samples with HVAC systems, considering both cooling and heating, based on annual energy consumption, energy tariffs, and specific taxes for each city. The reference samples (without PCMs) were used as a baseline, accounting for the local wall type and comparing them to the sample that exhibited the lowest energy consumption.
Energy tariffs in Brazil are defined by contracts with the energy distribution companies and are subject to federal and state taxes. For this analysis, public lighting fees, which vary according to municipal legislation and consumption brackets, were disregarded.
Table 5 presents local data, including tariffs, tax rates, and the final energy price in U.S. dollars (as of September 2024).
The annual energy consumption for the operation of the HVAC system in each simulated model was calculated by summing the thermal loads for cooling and heating. Following this summation, the electrical energy consumption for the HVAC operation was determined using a seasonal energy efficiency ratio (SEER) from an average-performing supplier, rated as Class C by INMETRO (
https://www.gov.br/inmetro/pt-br/assuntos/avaliacao-da-conformidade/programa-brasileiro-de-etiquetagem/tabelas-de-eficiencia-energetica/condicionadores-de-ar (accessed on 1 March 2024)), with a nominal SEER value of 3.03. Equation (3) presents the calculation used to determine the electrical consumption for the HVAC operation, as follows:
where
EC is electrical consumption,
TL is the thermal load sum, and SEER is the seasonal cooling performance index.
The annual cost was calculated based on the annual electricity consumption of each sample, considering the final energy tariff for each state. From these data, the sample containing PCM with the best performance compared to the non-PCM references was identified. The difference in annual energy cost between each reference and the sample with the lowest energy consumption in each location, categorized by wall type, was determined. Based on this consumption difference, the economic advantages of using PCMs in each city were evaluated.
Regarding the financial analysis, considering the variations in electricity tariffs in Brazil due to inflation, the estimated payback period was calculated for 5- and 10-year horizons, using the country’s historical inflation rates for periods equivalent to twice the analyzed timeframe. For the 5-year scenario, the 10-year historical average inflation rate of 5.937% per year was used. In the 10-year scenario, the 20-year historical average of 5.905% per year was applied, according to data from the Central Bank of Brazil (
https://www.bcb.gov.br/controleinflacao/historicometas (accessed on 1 September 2024)).
Due to the absence of PCM suppliers in Brazil, cost estimates were developed based on the specific characteristics of the project, considering the applicable usable area of the material, namely the surfaces of external walls, excluding openings (doors and windows). In this case, the total area of the external walls was 65 m
2, with openings totaling 9.24 m
2, resulting in a usable area of 55.76 m
2. This allowed for the estimation of the maximum cost that would enable the financial viability of PCM application.
Table 6 presents the financial analyses, highlighting the cost difference per square meter for each sample.
The financial analysis supported the previously presented thermal performance results, indicating that samples with 2 cm thick PCM demonstrated the best performance. Notably, the samples with a melting temperature of 25 °C stood out, exhibiting the largest differences in annual costs compared to the reference samples in each location. The “10 Y. Diff/m2” column provides a reference parameter for the maximum cost per square meter of material application, establishing the threshold required to economically justify its implementation. Therefore, the higher the cost ceiling, the more advantageous the application of PCM becomes, as demonstrated in the table, with Curitiba and São Paulo standing out.
4. Conclusions
The objective of this work was to analyze the performance of PCMs in regions of Brazil with different climates and their behavior according to different construction systems. It is interesting to note that, regardless of the type of construction system, whether heavy or lightweight walls, the use of PCMs generally resulted in better performance when comparing cases with and without the materials.
The cities of Curitiba and São Paulo demonstrated positive results in all samples containing PCM, with cooling ratio differences above 60%. This superior performance may be attributed to the lower average temperatures and higher altitudes characteristic of these cities. These findings align with previous studies, which suggest that colder regions tend to achieve better thermal performance in buildings utilizing PCM. This evidence further substantiates the efficacy of PCM in enhancing thermal efficiency in cold climates.
All heating results, both in terms of thermal load and degree-hours, were positive in the performance of samples containing PCM. Furthermore, this performance is enhanced in colder cities, based on the actual values of these indicators. Certain cities, such as Campo Grande and Cuiabá, presented lower indicators, both in samples with and without PCM, attributed to the high average monthly dry-bulb temperatures of these cities, always above 20 °C.
The study also demonstrated that thermal performance is closely related to the thickness of the applied PCM. In most analyses, the samples with a thickness of 2 cm exhibited significantly superior results compared to the samples with a thickness of 0.5 or 1.0 cm. PCMs with lower melting temperatures showed better performance in heating simulations, as was the case with PCM Q 21, with better performance for both DHh and TLh, while materials with higher melting temperatures achieved the best results in non-HVAC cooling scenarios. In the cooling simulations with HVAC, the most effective results were observed in samples containing PCM Q25, whereas materials with higher melting temperatures exhibited the least favorable performances.
In summary, the investigation demonstrates that PCM has significant potential to enhance the thermal performance of building envelopes in temperate/tropical climates, encompassing both colder and warmer regions, provided that the melting temperature of the material is carefully selected according to the local climate. It is important to note that, in most parts of Brazil, the hot seasons are longer and more intense compared to the cold seasons. Therefore, selecting a melting temperature that provides better performance under cooling conditions can result in improved thermal performance and greater energy efficiency of buildings.
The economic analysis provided a deeper understanding of the cost reduction associated with increased thermal comfort in the environments. Additionally, it identified the cities with the greatest financial advantage in applying PCM, with Curitiba and São Paulo standing out, showing maximum cost values per square meter (10 years) of USD 4.67 and USD 3.39, respectively.
For future work, it is recommended to investigate materials with the best thermal performance by microregion, considering local climates. In the case of Brazil, a country of continental dimensions, some standards specify the ideal thermal characteristics of construction systems for various regions. This highlights the importance of studying the optimal properties of this technology according to the building’s location.
Author Contributions
Conceptualization, T.L.d.S., A.S.S., and D.D.d.R.; methodology, T.L.d.S.; software, T.L.d.S.; validation, T.L.d.S., A.S.S., and D.D.d.R.; formal analysis, T.L.d.S., A.S.S., and D.D.d.R.; investigation, T.L.d.S., Silva.; resources, T.L.d.S.; data curation, T.L.d.S., A.S.S., and D.D.d.R.; writing—original draft preparation, T.L.d.S.; writing—review and editing, T.L.d.S., A.S.S., and D.D.d.R.; visualization, T.L.d.S., A.S.S., and D.D.d.R.; supervision, A.S.S. and D.D.d.R.; project administration, T.L.d.S., A.S.S., and D.D.d.R.; funding acquisition, T.L.d.S., A.S.S., and D.D.d.R. All authors have read and agreed to the published version of the manuscript.
Funding
This study was financed in part by the Coordenação de Aperfeiçoamento de Pessoal de Nível Superior—Brasil (CAPES)—Finance Code 001.
Data Availability Statement
The original contributions presented in this study are included in this article.
Acknowledgments
This work was carried out with the support of the Federal University of Mato Grosso do Sul—UFMS/MEC—Brazil; Coordenação de Aperfeiçoamento de Pessoal de Nível Superior—Brasil (CAPES).
Conflicts of Interest
The authors declare no conflicts of interest.
References
- Empresa de Pesquisa Energética—EPE. Balanço Energético Nacional 2021: Ano Base 2020; EPE: Rio de Janeiro, Brazil, 2021.
- Empresa de Pesquisa Energética—EPE. NOTA TÉCNICA EPE 030/2018—Uso de Ar Condicionado No Setor Residencial Brasileiro: Perspectivas e Contribuições Para o Avanço Em Eficiência Energética; EPE: Rio de Janeiro, Brazil, 2018.
- Santos, T.L.D.; Porto, F.H.F.D.S.; Silva, A.S. Análise Da Correlação Entre Conforto e Desempenho Térmico Em Habitações de Interesse Social Por Simulação Computacional. Ambiente Construído 2020, 20, 211–229. [Google Scholar] [CrossRef]
- Mirrahimi, S.; Mohamed, M.F.; Haw, L.C.; Ibrahim, N.L.N.; Yusoff, W.F.M.; Aflaki, A. The Effect of Building Envelope on the Thermal Comfort and Energy Saving for High-Rise Buildings in Hot-Humid Climate. Renew. Sustain. Energy Rev. 2016, 53, 1508–1519. [Google Scholar] [CrossRef]
- Ioannou, A.; Itard, L.C.M. Energy Performance and Comfort in Residential Buildings: Sensitivity for Building Parameters and Occupancy. Energy Build. 2015, 92, 216–233. [Google Scholar] [CrossRef]
- Pereira, C.D.; Ghisi, E. The Influence of the Envelope on the Thermal Performance of Ventilated and Occupied Houses. Energy Build. 2011, 43, 3391–3399. [Google Scholar] [CrossRef]
- Nobahar, A.; Mojib, S.; Moharrami, M. Combined Use of Design of Experiment and Dynamic Building Simulation in Assessment of Energy Efficiency in Tropical Residential Buildings. Energy Build. 2015, 86, 525–533. [Google Scholar] [CrossRef]
- Socaciu, L.; Pleşa, A.; Ungureşan, P.; Giurgiu, O. Review on Phase Change Materials for Building Applications. Leonardo Electron. J. Pract. Technol. 2014, 13, 179–194. [Google Scholar]
- Lei, J.; Yang, J.; Yang, E.H. Energy Performance of Building Envelopes Integrated with Phase Change Materials for Cooling Load Reduction in Tropical Singapore. Appl. Energy 2016, 162, 207–217. [Google Scholar] [CrossRef]
- Rathore, P.K.S.; Shukla, S.K. An Experimental Evaluation of Thermal Behavior of the Building Envelope Using Macroencapsulated PCM for Energy Savings. Renew. Energy 2020, 149, 1300–1313. [Google Scholar] [CrossRef]
- Saxena, R.; Rakshit, D.; Kaushik, S.C. Experimental Assessment of Characterised PCMs for Thermal Management of Buildings in Tropical Composite Climate. In Proceedings of the World Congress on Mechanical, Chemical, and Material Engineering; Avestia Publishing: Orléans, ON, Canada, 2018. [Google Scholar]
- Li, W.; Chen, W. Numerical Analysis on the Thermal Performance of a Novel PCM-Encapsulated Porous Heat Storage Trombe-Wall System. Sol. Energy 2019, 188, 706–719. [Google Scholar] [CrossRef]
- Nurlybekova, G.; Memon, S.A.; Adilkhanova, I. Quantitative Evaluation of the Thermal and Energy Performance of the PCM Integrated Building in the Subtropical Climate Zone for Current and Future Climate Scenario. Energy 2021, 219, 119587. [Google Scholar] [CrossRef]
- Ferster, B.; Shen, H.; Rendali, J.D. PCM (Phase Change Material) Optimization Modeling for Passive Cooling in South Texas. In Proceedings of the Building Simulation Conference Proceedings, San Francisco, CA, USA, 7–9 August 2017; Volume 1, pp. 241–247. [Google Scholar]
- Sovetova, M.; Memon, S.A.; Kim, J. Thermal Performance and Energy Efficiency of Building Integrated with PCMs in Hot Desert Climate Region. Sol. Energy 2019, 189, 357–371. [Google Scholar] [CrossRef]
- Kharbouch, Y.; Mimet, A.; El Ganaoui, M.; Ouhsaine, L. Thermal Energy and Economic Analysis of a PCM-Enhanced Household Envelope Considering Different Climate Zones in Morocco. Int. J. Sustain. Energy 2018, 37, 515–532. [Google Scholar] [CrossRef]
- Shchegolkov, A.; Shchegolkov, A.; Demidova, A. The Use of Nanomodified Heat Storage Materials for Thermal Stabilization in the Engineering and Aerospace Industry as a Solution for Economy. In Proceedings of the MATEC Web of Conferences, Sevastopol, Russia, 10–14 September 2018; EDP Sciences: Ulis, France, 2018; Volume 224. [Google Scholar]
- Solgi, E.; Hamedani, Z.; Fernando, R.; Mohammad Kari, B.; Skates, H. A Parametric Study of Phase Change Material Behaviour When Used with Night Ventilation in Different Climatic Zones. Build. Environ. 2019, 147, 327–336. [Google Scholar] [CrossRef]
- Kishore, R.A.; Bianchi, M.V.A.; Booten, C.; Vidal, J.; Jackson, R. Parametric and Sensitivity Analysis of a PCM-Integrated Wall for Optimal Thermal Load Modulation in Lightweight Buildings. Appl. Therm. Eng. 2021, 187, 116568. [Google Scholar] [CrossRef]
- Beltran, D.; Martínez-Gómez, J.; Lobato-Cordero, A. Effect of Environment on the Selection of Phase Change Materials for Building Wallboards Using Multi-Criteria Decision Methods and Building Energy Simulations. In Proceedings of the Building Simulation Conference Proceedings, San Francisco, CA, USA, 7–9 August 2017; Volume 1, pp. 1359–1369. [Google Scholar]
- Saffari, M.; de Gracia, A.; Fernández, C.; Cabeza, L.F. Simulation-Based Optimization of PCM Melting Temperature to Improve the Energy Performance in Buildings. Appl. Energy 2017, 202, 420–434. [Google Scholar] [CrossRef]
- de Oliveira, R.B.; Gonzales, T.S.; Marques, M.T. Uso De Pcm Para Edificações Em Região De Clima Quente: Uma Revisão Sistemática. PARC Pesqui. Em. Arquitetura E Construção 2021, 12, 1–15. [Google Scholar] [CrossRef]
- Brito, A.C.D.; Akutsu, M.; Salles, E.M.; Castro, G.M. Características Térmicas de Materiais de Mudança de Fase Adequados Para Edificações Brasileiras. Ambiente Construído 2017, 17, 125–145. [Google Scholar] [CrossRef]
- Navarro, L.; de Gracia, A.; Niall, D.; Castell, A.; Browne, M.; McCormack, S.J.; Griffiths, P.; Cabeza, L.F. Thermal Energy Storage in Building Integrated Thermal Systems: A Review. Part 2. Integration as Passive System. Renew Energy 2016, 85, 1334–1356. [Google Scholar] [CrossRef]
- Singh Rathore, P.K.; Shukla, S.K.; Gupta, N.K. Potential of Microencapsulated PCM for Energy Savings in Buildings: A Critical Review. Sustain. Cities Soc. 2020, 53, 101884. [Google Scholar] [CrossRef]
- de Gracia, A.; Navarro, L.; Castell, A.; Cabeza, L.F. Energy Performance of a Ventilated Double Skin Facade with PCM under Different Climates. Energy Build. 2015, 91, 37–42. [Google Scholar] [CrossRef]
- Alam, M.; Jamil, H.; Sanjayan, J.; Wilson, J. Energy Saving Potential of Phase Change Materials in Major Australian Cities. Energy Build. 2014, 78, 192–201. [Google Scholar] [CrossRef]
- Bre, F.; Lamberts, R.; Flores-Larsen, S.; Koenders, E.A.B. Multi-Objective Optimization of Latent Energy Storage in Buildings by Using Phase Change Materials with Different Melting Temperatures Energy-Efficient Building Latent Energy Storage Phase Change Material Multiple Melting Temperatures Multi-Objective Optimization Climate-Representative Locations. Appl. Energy 2023, 336, 120806. [Google Scholar] [CrossRef]
- Tabares-Velasco, P.C.; Christensen, C.; Bianchi, M. Verification and Validation of EnergyPlus Phase Change Material Model for Opaque Wall Assemblies. Build. Environ. 2012, 54, 186–196. [Google Scholar] [CrossRef]
- Mohseni, E.; Tang, W. Parametric Analysis and Optimisation of Energy Efficiency of a Lightweight Building Integrated with Different Configurations and Types of PCM. Renew. Energy 2021, 168, 865–877. [Google Scholar] [CrossRef]
- Jin, X.; Medina, M.A.; Zhang, X. On the Importance of the Location of PCMs in Building Walls for Enhanced Thermal Performance. Appl. Energy 2013, 106, 72–78. [Google Scholar] [CrossRef]
- Jin, X.; Zhang, S.; Xu, X.; Zhang, X. Effects of PCM State on Its Phase Change Performance and the Thermal Performance of Building Walls. Build. Environ. 2014, 81, 334–339. [Google Scholar] [CrossRef]
- Jurizat, A.; Wonorahardjo, S. A Review on the Application of Phase Change Material for Indoor Temperature Management in Tropical Area. In Proceedings of the IOP Conference Series: Earth and Environmental Science, Bandung, Indonesia, 11 November 2017; Volume 152. [Google Scholar]
- Oliveira, M.M.; de Carvalho Lucarelli, C.; Carlo, J.C. Influência Do Uso de PCMs Em Escritório Nos Climas Brasileiros. PARC Pesqui. Em. Arquitetura E Construção 2024, 15, e024006. [Google Scholar] [CrossRef]
- Pons, V.; Stanescu, G. Materiais Com Mudança de Fase: Análise de Desempenho Energético Para o Brasil. PARC Pesqui. Em. Arquitetura E Construção 2017, 8, 127. [Google Scholar] [CrossRef]
- da Silva Almeida, F.; Brandalise, M.P.; Mizgier, M.O. Materiais de Mudança de Fase Como Sistema de Resfriamento Passivo Em Habitações de Interesse Social Pré-Fabricadas Leves. PARC Pesqui. Em. Arquitetura E Construção 2022, 13, e022027. [Google Scholar] [CrossRef]
- Koeppen, W. Das geographische System der Klimate, Handbuch der Klimatologie [The Geographical System of the Climate, Handbook of Climatology]; Borntraeger: Berlin, Germany, 1936; Bd. 1, Teil. C. [Google Scholar]
- Associação Brasileira de Normas Técnicas (ABNT). NBR 15220-3: Desempenho Térmico de Edificações—Zoneamento Bioclinático Brasileiro e Diretrizes Construtivas Para Habitações Unifamiliares de Interesse Social; ABNT: Rio de Janeiro, Brasil, 2005; p. 30. [Google Scholar]
- Feustel, H.E. Simplified Numerical Description of Latent Storage Characteristics for Phase Change Wallboard, Indoor Environment Program, Energy and Environment Division; Lawrence Berkeley Laboratory, University of California: California, LA, USA, 1995. [Google Scholar]
- Mazzaferro, L.; Melo, A.P.; Lamberts, R. Manual De Simulação Computacional De Edifícios Com O Uso Do Objeto Ground Domain No Programa Energyplus; Laboratório de Eficiência Energética de Edificações do Departamento de Engenharia Civil da UFSC: Florianópolis, Brazil, 2015. [Google Scholar]
- Pereira, H.A.d.C.; Melo, A.P.; Versage, R.; Sorgato, M.; Lamberts, R. Manual De Simulação Computacional De Edifícios Naturalmente Ventilados No Programa Energyplus, Version 8.0; Laboratório de Eficiência Energética em Edificações: Florianópolis, Brazil, 2013.
Figure 1.
Logical illustration of the simulation sequences.
Figure 1.
Logical illustration of the simulation sequences.
Figure 2.
Cities’ climate data.
Figure 2.
Cities’ climate data.
Figure 3.
Layout and geometry (measurements in meters).
Figure 3.
Layout and geometry (measurements in meters).
Figure 4.
Enthalpy functions from the different PCMs.
Figure 4.
Enthalpy functions from the different PCMs.
Figure 5.
Wall layouts. (a) Container wall without PCM; (b) container wall with PCM; (c) EPS wall without PCM; (d) EPS wall with PCM. Note: measurements in centimeters.
Figure 5.
Wall layouts. (a) Container wall without PCM; (b) container wall with PCM; (c) EPS wall without PCM; (d) EPS wall with PCM. Note: measurements in centimeters.
Figure 6.
Internal gains rate schedules (people and lights).
Figure 6.
Internal gains rate schedules (people and lights).
Figure 7.
Non-HVAC simulation test.
Figure 7.
Non-HVAC simulation test.
Figure 8.
HVAC simulation test.
Figure 8.
HVAC simulation test.
Figure 9.
Difference with HVAC off.
Figure 9.
Difference with HVAC off.
Figure 10.
Difference with HVAC on.
Figure 10.
Difference with HVAC on.
Figure 11.
Results for degrees-hours of cooling/heating (container).
Figure 11.
Results for degrees-hours of cooling/heating (container).
Figure 12.
Thermal loads for cooling/heating (container).
Figure 12.
Thermal loads for cooling/heating (container).
Figure 13.
Results for degrees-time of cooling/heating (SCIP).
Figure 13.
Results for degrees-time of cooling/heating (SCIP).
Figure 14.
Thermal loads for cooling/heating (SCIP).
Figure 14.
Thermal loads for cooling/heating (SCIP).
Figure 15.
Ratio difference analysis.
Figure 15.
Ratio difference analysis.
Figure 16.
Pearson’s analysis.
Figure 16.
Pearson’s analysis.
Table 1.
Abbreviations and symbols.
Table 1.
Abbreviations and symbols.
| Symbol | Description |
|---|
| °C | Degrees Celsius |
| c | Specific heat |
| cm | Centimeters |
| CO2 | Carbon dioxide |
| dDHc | Average degree hours for cooling ratio difference |
| dDHh | Average degree hours for heating ratio difference |
| DH | Degree hours |
| DHcm | Average degree hours for cooling |
| DHhm | Average degree hours for heating |
| dTLc | Cooling thermal loads ratio difference |
| dTLh | Heating thermal loads ratio difference |
| EPS | Expanded polystyrene |
| h | Hour |
| HVAC | Heating, ventilation, and air conditioning |
| INMETRO | National Institute of Metrology, Quality and Technology (Brazil) |
| J | Joule |
| K | Kelvin |
| kg | Kilogram |
| kJ | Kilojoule |
| m | Meters |
| m2 | Square meter |
| PCM | Phase-change material |
| RTQ | Energy efficiency level of residential buildings in Brazil |
| SCIP | Structural concrete insulated panels |
| SEER | Seasonal energy efficiency ratio |
| TES | Thermal energy storage |
| TL | Thermal loads |
| TLc | Cooling thermal loads |
| TLh | Heating thermal loads |
| W | Watts |
| λ | Thermal conductivity |
| ρ | Density |
Table 2.
Geographic location of cities.
Table 2.
Geographic location of cities.
| City | Latitude
(Degrees) | Longitude
(Degrees) | Time Zone | Elevation
(m) | Climate Zone | Köppen–Geiger Classification |
|---|
| Campo Grande | −20.44 | −54.65 | −4 | 530 | 6 | Aw |
| Cuiabá | −15.65 | −56.10 | −4 | 182 | 7 | Aw |
| Curitiba | −25.52 | −49.18 | −3 | 910 | 1 | Cfb |
| Florianópolis | −27.67 | −48.55 | −3 | 7 | 3 | Cfa |
| Porto Alegre | −30.03 | −51.23 | −3 | 47 | 3 | Cfa |
| São Paulo | −23.85 | −46.64 | −3 | 792 | 3 | Cfa/Cwa |
Table 3.
Input variables for the simulations.
Table 3.
Input variables for the simulations.
| Variable | Unit | Levels |
|---|
| Weather data | - | Cuiabá; Campo Grande; Curitiba; Florianópolis; Porto Alegre; São Paulo {6} |
| PCM (melting point) | °C | 21; 23; 25; 27; 29 {5} |
| Envelope | - | SCIP; container {2} |
| PCM thickness | cm | 0.5; 1; 2 {3} |
| HVAC | - | On; off {2} |
Table 4.
Data of materials.
Table 4.
Data of materials.
| Material | ρ (kg/m3) | λ [W/(m·K)] | c [kJ/(kg·K)] |
|---|
| Cement materials | 2000 | 1.150 | 1.00 |
| Container | 7800 | 55.000 | 0.46 |
| Plasterboard | 1300 | 0.500 | 0.84 |
| Mineral wool | 90 | 0.045 | 0.75 |
Table 5.
City, company, price (MWh), federal tax, state tax information, and final price.
Table 5.
City, company, price (MWh), federal tax, state tax information, and final price.
| City | Company | Price (MWh) | F. Tax | S. Tax | Final Price (kWh) |
|---|
| Campo Grande | Energisa | USD 154.12 | 9.25% | 17.00% | USD 0.1946 |
| Cuiabá | Energisa | USD 150.09 | 9.25% | 17.00% | USD 0.1895 |
| Curitiba | COPEL | USD 111.58 | 9.25% | 19.50% | USD 0.1437 |
| Florianópolis | CELESC | USD 109.44 | 9.25% | 17.00% | USD 0.1382 |
| Porto Alegre | CEEE | USD 113.89 | 9.25% | 17.00% | USD 0.1438 |
| São Paulo | Enel—SP | USD 112.69 | 9.25% | 18.00% | USD 0.1434 |
Table 6.
Difference in annual cost per square meter for 5 and 10 years.
Table 6.
Difference in annual cost per square meter for 5 and 10 years.
| City | Wall | PCM | Annual Cost | No PCM | Diff | 5 Years Diff | 5 Y. Diff/m2 | 10 Years Diff | 10 Y. Diff/m2 |
|---|
| Campo Grande | Container | Q25-2cm | USD 168.72 | USD 178.78 | USD 10.06 | USD 56.61 | USD 1.02 | USD 131.95 | USD 2.37 |
| Campo Grande | SCIP | Q25-2cm | USD 172.32 | USD 175.78 | USD 3.46 | USD 19.47 | USD 0.35 | USD 45.38 | USD 0.81 |
| Cuiabá | Container | Q25-2cm | USD 546.71 | USD 547.69 | USD 0.98 | USD 5.54 | USD 0.10 | USD 12.91 | USD 0.23 |
| Cuiabá | SCIP | Q25-2cm | USD 554.80 | USD 565.78 | USD 10.98 | USD 61.81 | USD 1.11 | USD 144.05 | USD 2.58 |
| Curitiba | Container | Q25-2cm | USD 46.76 | USD 66.62 | USD 19.87 | USD 111.85 | USD 2.01 | USD 260.68 | USD 4.67 |
| Curitiba | SCIP | Q25-2cm | USD 42.44 | USD 51.23 | USD 8.79 | USD 49.48 | USD 0.89 | USD 115.32 | USD 2.07 |
| Porto Alegre | Container | Q25-2cm | USD 94.96 | USD 106.63 | USD 11.67 | USD 65.70 | USD 1.18 | USD 153.12 | USD 2.75 |
| Porto Alegre | SCIP | Q25-2cm | USD 93.01 | USD 99.60 | USD 6.59 | USD 37.11 | USD 0.67 | USD 86.49 | USD 1.55 |
| Florianópolis | Container | Q25-2cm | USD 109.20 | USD 118.69 | USD 9.49 | USD 53.42 | USD 0.96 | USD 124.52 | USD 2.23 |
| Florianópolis | SCIP | Q25-2cm | USD 111.22 | USD 114.16 | USD 2.94 | USD 16.54 | USD 0.30 | USD 38.55 | USD 0.69 |
| São Paulo | Container | Q25-2cm | USD 29.72 | USD 44.12 | USD 14.40 | USD 81.06 | USD 1.45 | USD 188.92 | USD 3.39 |
| São Paulo | SCIP | Q25-2cm | USD 25.73 | USD 31.71 | USD 5.99 | USD 33.71 | USD 0.60 | USD 78.57 | USD 1.41 |
| Disclaimer/Publisher’s Note: The statements, opinions and data contained in all publications are solely those of the individual author(s) and contributor(s) and not of MDPI and/or the editor(s). MDPI and/or the editor(s) disclaim responsibility for any injury to people or property resulting from any ideas, methods, instructions or products referred to in the content. |
© 2024 by the authors. Licensee MDPI, Basel, Switzerland. This article is an open access article distributed under the terms and conditions of the Creative Commons Attribution (CC BY) license (https://creativecommons.org/licenses/by/4.0/).
