Article

Phase Field Modeling of Hydraulic Fracturing with Length-Scale Insensitive Degradation Functions

1
College of Basic Courses, Shanxi Institute of Energy, Jinzhong 030600, China
2
Key Laboratory of In-Situ Property Improving Mining of Ministry of Education, Taiyuan University of Technology, Taiyuan 030024, China
3
Laboratory for Multiscale Mechanics and Medical Science, State Key Laboratory for Strength and Vibration of Mechanical Structures, School of Aerospace, Xi’an Jiaotong University, Xi’an 710049, China
4
State Key Laboratory of Hydraulic Engineering Simulation and Safety, Tianjin University, Tianjin 300350, China
5
College of Mechanical and Vehicle Engineering, Taiyuan University of Technology, Taiyuan 030024, China
*
Authors to whom correspondence should be addressed.
Energies 2024, 17(20), 5210; https://doi.org/10.3390/en17205210
Submission received: 6 September 2024 / Revised: 30 September 2024 / Accepted: 30 September 2024 / Published: 20 October 2024
(This article belongs to the Section H: Geo-Energy)

Abstract

:
A length-scale insensitive degradation function is applied to extend the cracks during hydraulic fracturing under stress boundary conditions in this study. The phase field method is an effective modeling technique that has great potential for use in hydraulic fracturing. Nonetheless, current hydraulic fracturing research is still concentrated on small scales. The phase field model employs a degradation function that is insensitive to length scale, allowing for the decoupling of the phase field length scale from the physical length scale. This facilitates the simulation of hydraulic fracturing crack extensions in larger structures with a consistent mesh density. The correctness of the phase field method is verified firstly by comparing with the experimental results, and the accuracy and efficiency of the proposed method are further verified through a series of numerical calculations.

1. Introduction

Hydraulic fracturing is a widely promising measure to increase the production of oil and gas wells, and the problem of fracture extension of hydraulic fracturing in porous media has been a challenging dilemma. On the one hand, hydraulic fracturing applies pressurized fluids to form highly permeable fractures in rock formations, and well network of fractures facilitates the connectivity of the wellbore to the intended natural resources. On the other hand, hydraulic fracturing can also cause a certain degree of environmental contamination, and accidental fractures may also be affected and extend into nearby rock formations [1], resulting in contamination of groundwater resources [2]. Moreover, hydraulic fractures along major faults may trigger seismic activity, threatening the entire geologic system [3]. Therefore, there is an urgent need for an accurate and efficient numerical tool to predict the propagation of complex hydraulic fracturing cracks [4], in order to further promote clean and efficient production in the energy extraction industry and advance green development.
In recent years, numerous computational methods have been developed to simulate the fracturing process in rocks, broadly categorized into discontinuous and continuous methods. The most commonly used discontinuous methods [5] introduce discontinuities in displacements based on linear elastic fracture mechanics [6,7]. These include cohesive zone models [8], extended finite element methods [9], element erosion methods [10], boundary element methods [11], generalized finite element methods [12], and the stress numerical search method [13].
However, when dealing with dynamic crack propagation, branching, or merging, traditional BEM and FEM usually need to define the crack geometry separately and manually adjust the mesh at each crack evolution, which leads to computational inefficiency. Especially for some complex cases, the real behavior of the crack may not be effectively captured. Moreover, these discontinuous methods require additional criteria, such as stress intensity factors, to track crack initiation and propagation paths, making it challenging to simulate crack branching and merging. In addition, hydraulic fracturing simulations typically require consideration of the complex interactions between solid fluids, fracture network morphology, and different boundary conditions, which is a complex multi-field coupling problem requiring with a large number of calculations.
The difficulties associated with discrete crack modeling have motivated the creation of other continuous methods [14]. Among them, the phase field method [15] is the most representative. It unifies the initiation, propagation, and merging processes of cracks in a theoretical framework, which simplifies the modeling process and does not require the path of the crack to be defined in advance. Furthermore, it is easily coupled with other physical fields, which provides convenience for studying the crack behavior under the influence of multiple factors. In addition, through the variational method, the phase field method can achieve a high accuracy of energy minimization, so as to predict the material failure behavior more accurately. It offers unparalleled advantages in modeling complex crack geometries [16] and has been widely used in uranium mining, natural hydrogen mining [17], CO2 geological storage [18], and so on.
The phase field method uses a scalar field ϕ [ 0 , 1 ] to represent the extent of fracture, where ϕ = 0 indicates intact material and ϕ = 1 indicates fully fractured material. The concept of the phase field length scale was initially suggested by Bourdin et al. [19,20] to control crack width. Previous studies have highlighted how the diffuse fracture zone surrounding cracks is closely linked to the physical length scale. This length scale is often much smaller than the size of the component or structure under consideration. Therefore, precise results require resolving the length scale, which entails using an extensively refined mesh, which leads to high computational costs. To address this issue, Lo et al. [21] devised a new, insensitivity function for length scales to amplify the phase field modeling framework, which facilitates linear elastic fracture mechanics. Due to its ability to accommodate larger phase field length scales than the physical length scale, the mesh density can be extensively reduced.
Consequently, to enhance the efficiency of hydraulic fracture extension simulation, a length-scale insensitive degradation function is applied in this study. The governing equations for the displacement and phase field are derived from a variational method, and the coupling between fluid pressure and displacement field is based on the Biot poro-elasticity theory, whereas the phase field characterizes the fluid properties across the intact and complete fracture domains. This study presents some two-dimensional examples to showcase the impact of in situ stress on hydraulic fracture extensions. Additionally, numerical calculations vouch for the efficacy of the novel degradation function in enhancing the hydraulic fracture simulation. The numerical illustrations further establish the precision of the newly developed method in improving the simulation of hydraulic fracture extensions.
This manuscript can be summarized as follows: Section 2 presents the mathematical theoretical model. Section 3 solves the nonlinear coupled equations using the staggered algorithm. In Section 4, the efficiency and accuracy of the proposed method are demonstrated with several 2D examples by comparing with experimental results and traditional numerical results. Lastly, the concluding remarks are provided in the final section.

2. Mathematical Modeling in Porous Medias

2.1. The Theory of New Energy Functional

The cracked poro-elastic domain Ω n dim ( n dim = 1 , 2 , 3 ) is considered here as shown in Figure 1, where Ω n dim 1 denotes its boundary, while its traction boundary condition is on Ω t Ω and its displacement boundary condition is on Ω u Ω \ Ω t . The porous elastic domain is assumed to be homogeneous and isotropic, with a compressible, viscous fluid in the pores, assuming that the initial fluid pressure is set to 0. The fluid pressure is caused by the relative displacement during hydraulic fracturing and the injection of fluid [22].
Ignoring the body force, the mathematical model is to construct an energy functional consisting of the elastic energy, the initial stress field, the energy contributed by the fluid pressure, the fracture energy, and the work of the external force [23].
L ( u , p , Γ ) = Ω Γ ψ ε ( ε ) d Ω + Ω Γ σ 0 : ε d Ω Ω α p ( u ) d Ω + Γ G c d Γ Ω h f t u d S
where the displacement, fluid pressure, and stress are u , p , σ , respectively; ψ ε ( ε ) denotes the elastic energy density; α is the Biot coefficient; p is the fluid pressure; G c represents the fracture energy density; and f t is the external force. The linear strain tensor ε is expressed as follows:
ε i j = 1 2 u i x j + u j x i
The elastic energy needs to be decomposed into compressive and tensile components to ensure that the crack expands only in the tensile condition [19].
ε ± = a = 1 d ε a ± n a n a
The above variables correspond to the tensile and compressive strain tensor, respectively. In addition, ε a , n a represent its principal strain tensor and its direction [24], respectively. The operator ± can be defined by
± = ( ± | | ) / 2
After the strain tensor is decomposed, it is easy to derive the energy contribution of the tensile part and compressive part:
ψ ε + ( ε ) = λ 2 t r ( ε ) + 2 + μ t r ε + 2 ψ ε ( ε ) = λ 2 t r ( ε ) 2 + μ t r ε 2
with λ , μ > 0 are the Lamé constants.
Hence, the elastic energy [19] (the first term in Equation (1)) can be rewritten as follows:
Ψ ε = Ω Γ ψ ε ( ε ) d Ω = Ω g ( ϕ ) ψ ε + ( ε ) + ψ ε ( ε ) d Ω
The energy of the initial stress field (the second term in Equation (1)) could also be subjected to the energy degradation function:
Ω Γ σ 0 : ε d Ω Ω g ( ϕ ) σ 0 : ε d Ω
where the energy degradation function g ( ϕ ) is described in the next subsection.

2.2. The Energy Degradation Function

The classical degradation function often takes the following form:
g ( ϕ ) = ( 1 k ) ( 1 ϕ ) 2
where k = 10 9 is used to prevent numerical singularities.
The uniaxial peak stress σ c of homogeneous tension, as expressed by the classical degradation function given by
σ c = 27 G c E 0 256 l 0
It can be seen that the length scale of the phase field l 0 is determined by the fracture energy density G c , Young’s modulus E 0 and peak stress σ c , which can be derived as
l 0 = 27 G c E 0 / 256 σ c 2
However, previous studies have defaulted to physical length scales being numerically equivalent to physical length scales; i.e., the phase field scale length l 0 is set as the physical process zone size l p . This can be computationally intensive, limiting application to large engineering structures.
Lo et al. [21] has proposed the following degradation function to separate the phase field length scale from physical length scale:
g ( ϕ ) = s 1 s 1 s ( 1 ϕ ) 2
The parameters s and φ govern the energy degradation function, and when s = 200, this function degrades to the classical degradation function.
σ c * = 27 G c E 0 256 l 0 ( s 1 ) ln s s 1
σ c * represents the peak stress calculated using the novel degradation function, and its relationship with l p and l 0 is as follows:
l p = ( s 1 ) ln s s 1 l 0
By substituting Equation (13) into Equation (12), σ c * can be represented as follows:
σ c * = 27 G c E 0 256 l p
By adjusting the parameter s, different proportional relationships between l 0 and l p can be obtained. In other words, decoupling the length-scale parameter and the phase field length-scale parameter.
For example, when s = 200, l p = l 0   , and the peak stress σ c * = σ c , in which case the function degenerates into the classical degradation function. However, if we maintain the peak stress constant, setting s ≈ 1.025, l 0 = 10 l p can be obtained through Equation (13). For further details, refer to Yang et al. [25].
With the same mesh density, a smaller s value in the novel degradation function allows for the simulation of larger model scales, leading to reduced computational time and costs, which is illustrated with detailed data in the subsequent Section 4.1.

2.3. Phase Field

The sharp crack surface Γ is diffused into crack bands controlled by the length scale l 0 , and the phase field ϕ ( x , t ) is introduced to characterize the fracture of the crack surface [26], with ϕ = 0 indicating that the material is sound and ϕ = 1 indicating that the material is completely fractured, and we follow the crack surface density function per unit volume given by Miehe et al. [24].
γ ( ϕ , ϕ ) = ϕ 2 2 l 0 + l 0 2 ϕ x i ϕ x i
The fracture energy can be rewritten in the following form:
Γ G c d S = Ω G c ϕ 2 2 l 0 + l 0 2 ϕ x i ϕ x i d Ω
As a result of these efforts, the total energy functional can be rewritten as
L = Ω s 1 s 1 s ( 1 ϕ ) 2 ψ ε + ( ε ) + ψ ε ( ε ) d Ω Ω α p ( u ) d Ω + Ω G c ϕ 2 2 l 0 + l 0 2 ϕ x i ϕ x i d Ω Ω b i u i d Ω Ω h i f i u i d S
Applying the variational approach [27], crack initiation, extension, and branching occurs at the minimum value of the total potential energy; thus,
δ L = Ω h σ i j e + s 1 s 1 s ( 1 ϕ ) 2 σ 0 i j α p δ i j m j f t i δ u i d S Ω σ i j e + s 1 s 1 s ( 1 ϕ ) 2 σ 0 i j α p δ i j , j δ u i d Ω Ω g ( ϕ ) ψ ε + + σ 0 i j ε i j + G c ϕ l 0 G c l 0 2 ϕ x i 2 δ ϕ d Ω + Ω ϕ x i m i δ ϕ d S = 0
σ i j is the effective stress tensor, and σ is expressed as follows:
σ i j = s 1 s 1 s ( 1 ϕ ) 2 ψ ε + ε i j + ψ ε ε i j
σ = s 1 s 1 s ( 1 ϕ ) 2 λ t r ( ε ) + I + 2 μ ε + + λ t r ( ε ) I + 2 μ ε
Due to the arbitrary character of the variation, the following control equations are obtained:
σ i j p o r x j + b i = 0 2 l 0 ( 1 k ) ψ ε + G c + 1 ϕ l 0 2 2 ϕ x i 2 = 2 l 0 ( 1 k ) ψ ε + G c , in   Ω × ( 0 , T ]
Once the crack expands, it will be irreversible, so the historical strain field H ( x , t ) is introduced here as follows:
H ( x , t ) = max s [ 0 , t ]   ψ ε + ( ε ( x , s ) ) ,   in Ω × ( 0 , T ]
The strong form of the control equation is obtained:
σ i j p o r x j + b i = 0 2 l 0 ( 1 k ) H G c + 1 ϕ l 0 2 2 ϕ x i 2 = 2 l 0 ( 1 k ) H G c , in   Ω × ( 0 , T ]
The boundary conditions are defined as follows:
σ i j p o r m j = f i ,   on Ω h i × ( 0 , T ] ϕ x i m i = 0 ,   on Ω × ( 0 , T ]

2.4. Fluid Pressure Field

We divide the domain into three regions, the reservoir domain, the transition domain, and the fracture domain, and use two phase field thresholds c 1 , c 2 to distinguish between them. When ϕ c 1 , the material is in the reservoir domain, when c 1 ϕ c 2 , the material is in the transition domain, and when ϕ c 2 , the material is in the fracture domain. Following the previous work of some scholars, a linear interpolation between the reservoir and fracture domains is used for the flow field to establish the following indicator function χ r , χ f , where c 1 , c 2 are two independent scalar values [28].
χ r ( , ϕ ) = 1 , ϕ c 1 c 2 ϕ c 2 c 1 c 1 < ϕ < c 2 , 0 , ϕ c 2 χ f ( , ϕ ) = 0 , ϕ c 1 ϕ c 1 c 2 c 1 c 1 < ϕ < c 2 1 , ϕ c 2
We then apply Darcy’s law as follows:
ρ S p t + ( ρ v ) = q m ρ α χ r ε vol t
where ρ , S , v , q m , α , ε vol denote the fluid density, storage coefficient, flow velocity, source term, Biot coefficient, and volumetric strain, respectively. Note that by applying the interpolation function, we are able to further represent the above parameters, ρ = ρ r χ r + ρ f χ f , and α = α r χ r + α f χ f , and the storage coefficient is expressed as follows:
S = ε p c + α ε p ( 1 α ) K V r
where ε p , c , K V r are the porosity of the porous medium, the fluid compression coefficient, and the bulk modulus of the storage domain, respectively, and similarly, c = c r χ r + c f χ f and ε p = ε p r χ r + ε p f χ f .
The flow velocity in Darcy’s law is expressed as
v = K e f f μ e f f p
where K e f f ,   μ e f f are the effective permeability and viscosity, respectively. They can be expressed as
K e f f = k r χ r + k f χ f μ e f f = μ r χ r + μ f χ f
The following fluid flow control equations are finally obtained:
ρ S p t ρ K e f f μ e f f p = q m ρ α χ r ε v o l t
The Dirichlet boundary Ω D and Norman boundary Ω N can be expressed as follows:
p = p D   on   Ω D n ρ v = M N   on   Ω N

3. Implementation of the Finite Element Method

The staggered algorithm is adopted in this work to address all nonlinear coupled equations, and the weak forms of all control equations are as follows:
Ω σ e + g ( ϕ ) σ 0 α p I : δ ε d Ω = Ω h f t δ u d S
Ω g ( ϕ ) ( 1 k ) H δ ϕ d Ω + Ω G c l 0 ϕ δ ϕ + 1 l 0 ϕ δ ϕ d Ω = 0
Ω ρ S p t δ p d Ω Ω ρ v δ p d Ω = Ω N M n d S + Ω q m ρ α χ R ε v o l t d Ω
The displacement field, phase field, and fluid field are discretized as follows:
u = i n N i u i , ϕ = i n N i ϕ i , p = i n N i p i
with the gradients of the three fields expressed as follows:
ε = i n B i u u i , ϕ = i n B i ϕ ϕ i , p = i n B i p p i
where B i u , B i ϕ , B i p represent the derivatives of the shape functions:
B i u = N i , x 0 0 N i , y 0 N i , z 0 N i , y 0 N i , x N i , z 0 0 0 N i , z 0 N i , y N i , x T , B i ϕ = B i p = N i , x N i , y N i , z
The inner force F i u , int and external force F i u , e x t of the displacement field are expressed as follows:
F i u , e x t = Ω h N i f t d S + Ω B i u T α p I d Ω Ω B i u T g ( ϕ ) σ 0 d Ω F i u , int = Ω B i u T σ d Ω
The inner force associated with the phase field is formulated as follows:
F i ϕ , i n t = Ω g ( ϕ ) ( 1 k ) H N i + G c l 0 B i ϕ T ϕ + 1 l 0 ϕ N i d Ω
The inner force, viscous force, and external force of the pressure field are expressed as follows:
F i p , int = Ω B i p T ρ K e f f μ e f f   p d Ω F i p , v i s = Ω N i ρ S p t d Ω F i p , e x t = Ω N i q m ρ α χ R ε v o l t d Ω + Ω N N i M N d S
The residual equations are expressed as follows:
R i u = F i u , e x t F i u , int R i ϕ = F i ϕ , i n t R i p = F i p , e x t F i p , int F i p , v i s
The tangent lines of the elements are represented as follows:
K i j u u = F i u , int u j = Ω B i u T D e B j u d Ω K i j ϕ ϕ = F i ϕ , i n t ϕ j = Ω B i ϕ T G c l 0 B j ϕ + N i 2 ( 1 k ) H + G c l 0 N j d Ω K i j p p = F i p , int p j = Ω B i p T ρ K e f f μ e f f B j p d Ω

4. Numerical Examples

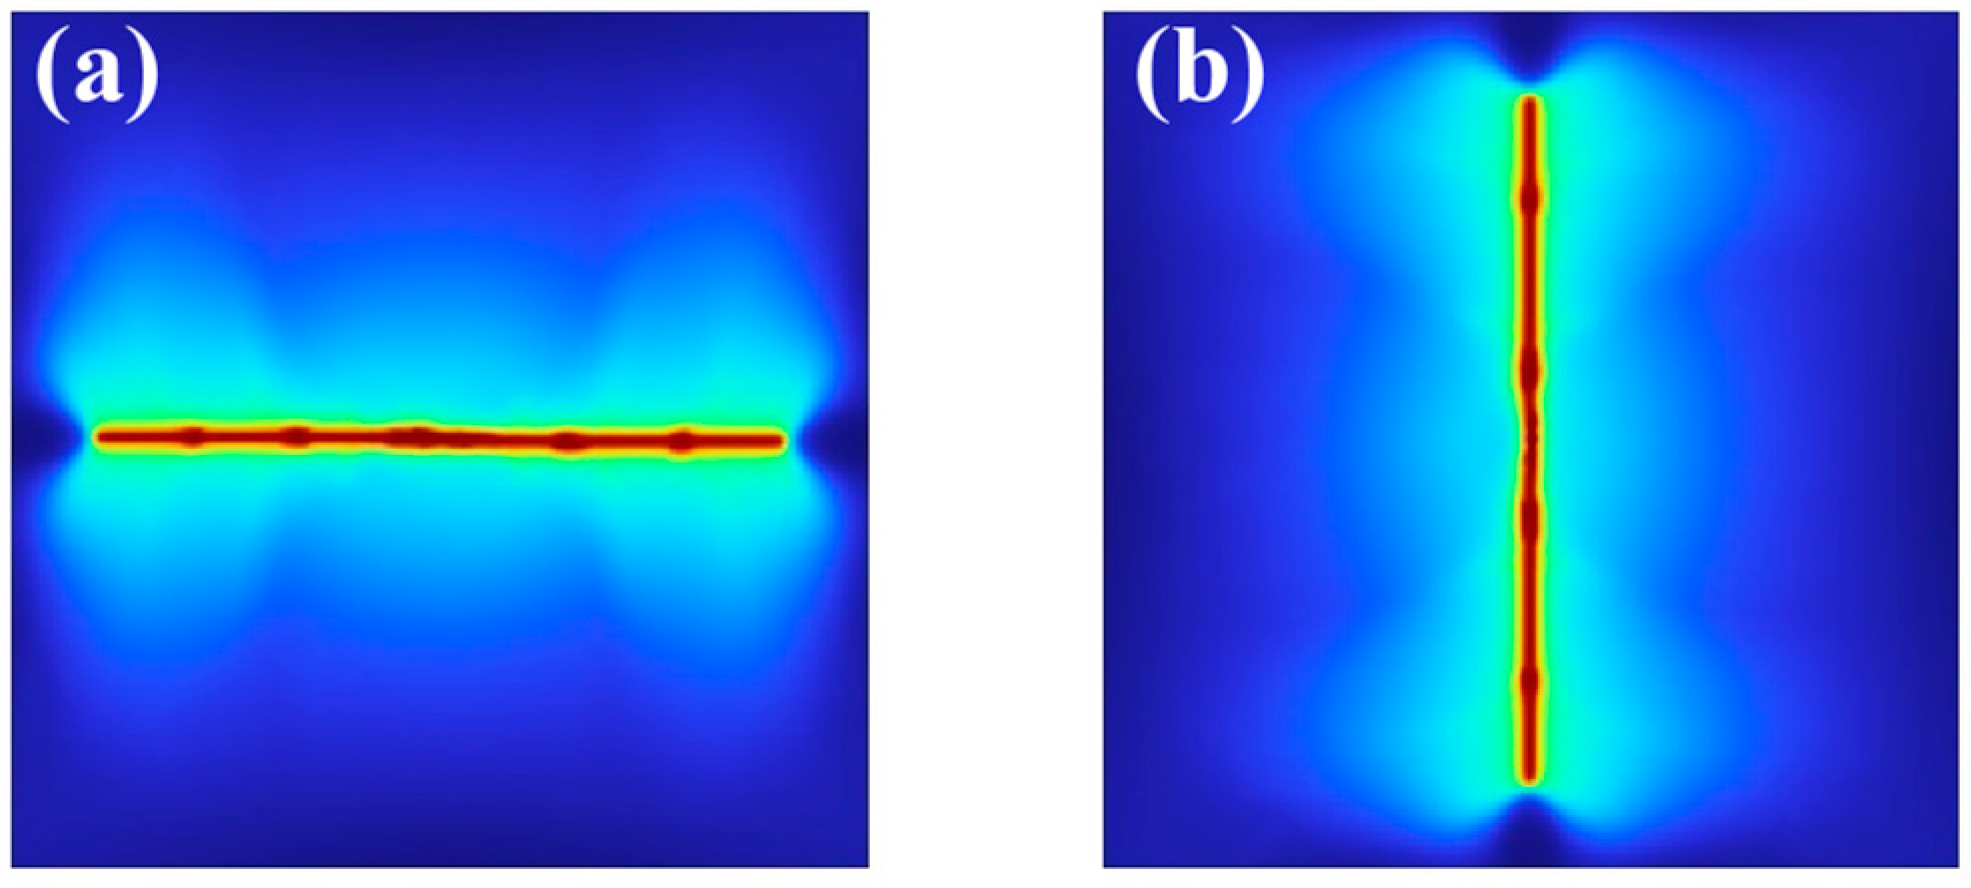
This work mainly explores the situation as shown in Figure 2a: The prefabricated cracks are through holes connecting the upper and lower surfaces of the specimen. In this case, the crack propagation in each cross section parallel to the x-o-y plane is roughly similar. Therefore, the 3D problem is simplified to a 2D problem in this paper. The geometry and boundary conditions are depicted in Figure 2b,c, splitting grids using planar quadrilateral elements. An adaptive technique is used to encrypt the mesh within a rectangular area near the prefabricated crack.
This section primarily showcases the superiority of the proposed degradation function in the extension of quasi-static hydraulic fractures in porous media through several 2D numerical examples. Pre-existing fractures are represented using a relative higher history field [19], and the source term in the notch is set to q m = 10   kg / ( m 3 s ) . The length of the notch is 0.8 m and the width value is the length scale of the phase field l 0 . To eliminate the influence of rigid body displacement, the fluid pressure at all external boundaries of the computational domain is set to 0, and the tangential displacement is set to zero. The relevant parameters are presented in Table 1.
The framework here is programmed using COMSOL and runs on a PC with an Intel (R) Core (TM) i9-10900 CPU and 128 GB RAM (Intel, Santa Clara, CA, USA). In this work, the length-scale decoupling of the phase field is achieved by adding a length-scale insensitive degradation function to the phase field model. This is mainly reflected in the COMSOL 6.2 software by the change made to the calculation formula for the physical field definition component. In addition, the meshing of the specimen and the adaptive mesh refinement module in the surrounding area of the prefabricated crack should also be replaced accordingly.

4.1. Fracture from Inclined Notch

To verify the effectiveness of the proposed numerical model, a 300 mm × 300 mm purple sandstone with precast crack is modeled from reference [29]. The boundary conditions were consistent with the experimental conditions. The length of prefabricated crack is 45 mm and the crack angle is 45°. The fracturing fluid is a high-viscosity oil with a viscosity of 70 mPa s. The stress ratio is set as σ x 0 / σ y 0 = 6 / 4 . The experimental result is shown in Figure 3a. The hydraulic fractures propagation in the numerical simulation is shown in Figure 3b.
It can be found that the final fracture propagation morphology is similar, which verified the accuracy of the phase field method. The fracture invariably propagates from the crack tip, initially extending along the direction of the prefabricated crack and then reorienting toward to the direction of the maximum horizontal stress.
We refrained from applying the degradation function s = 1.025 to the square domain with a side length of 10 m because the phase field length scale l 0 increased by a factor of 10, reaching a value of 1.0 m, making the phase field length scale 1/10 that of the side length. Consequently, numerical convergence became unattainable. Instead, we increased the model’s side length by a factor of 10 from the original 10 m and conducted a comparative experiment between s = 200 and s = 1.025 to showcase the advantages of the enhanced phase field method with increased phase field length scale.
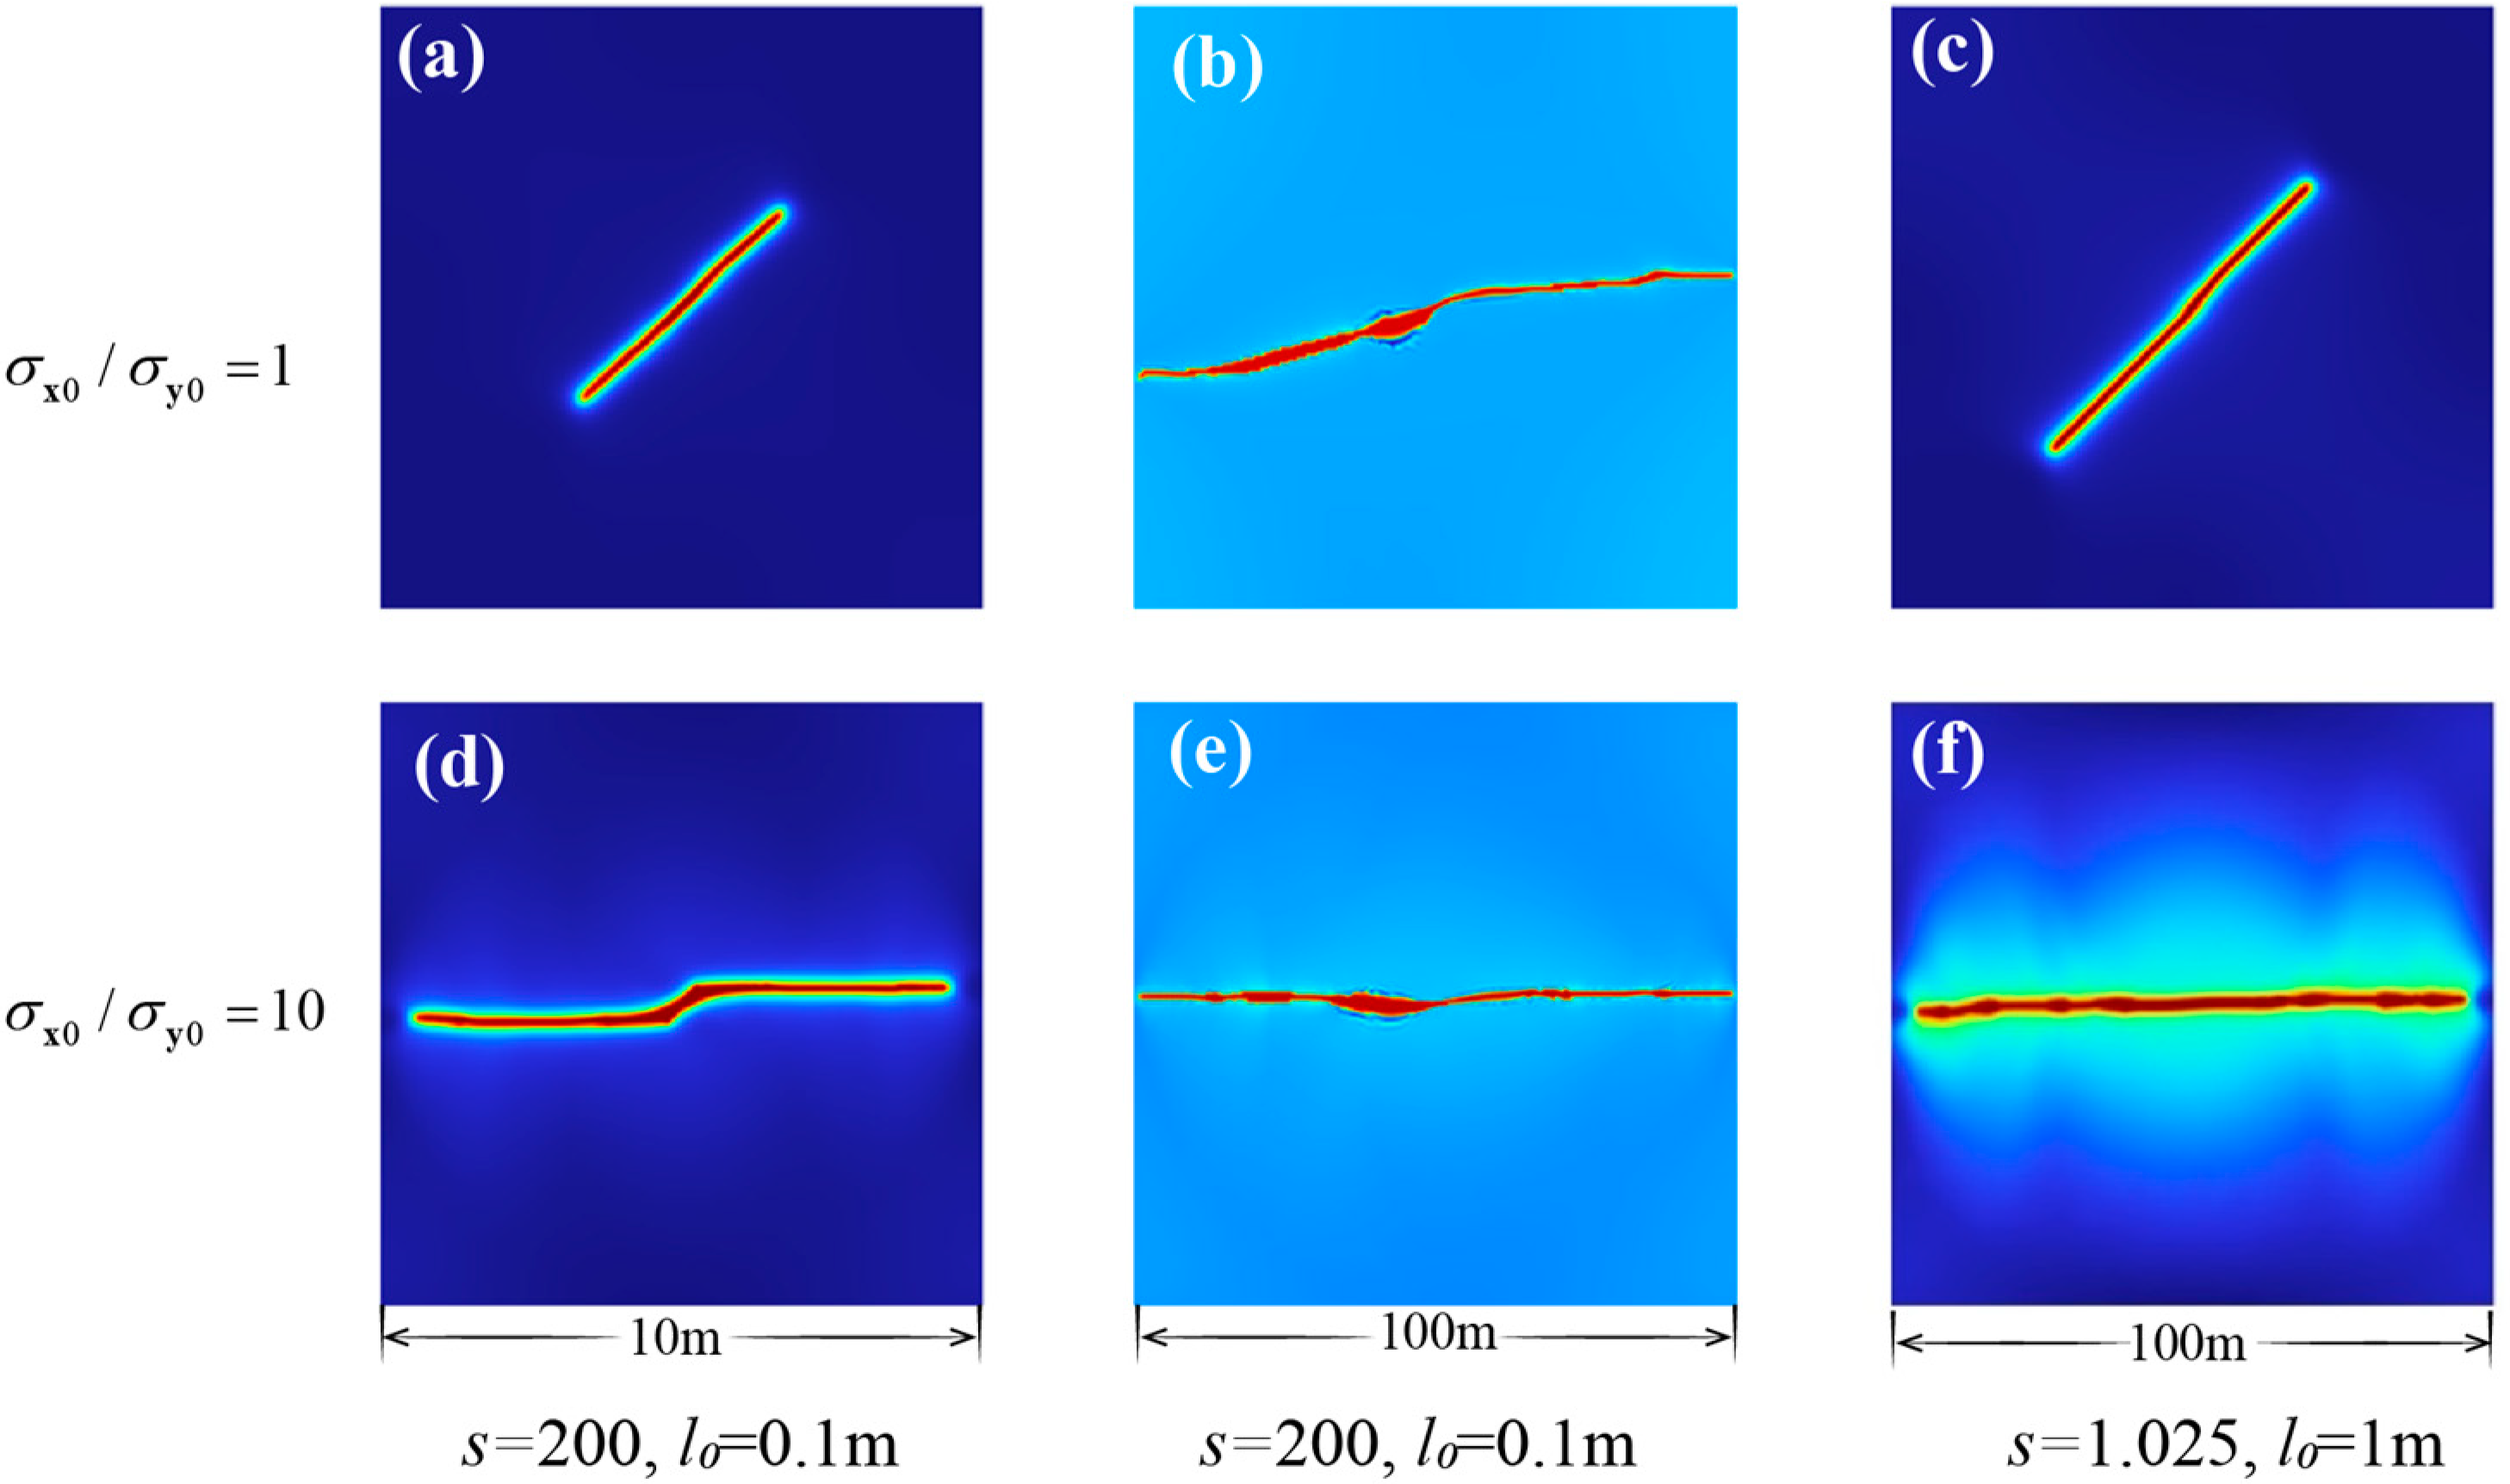
The applied stress σ x 0 / σ y 0 = { 1 ,   10 } and the vertical stress σ y 0 = 0.5   Mpa remain constant. The illustration depicts the impact of stress contrast on the extension of an inclined notch fracture.
Figure 4 illustrates the crack extension in different cases at s = 200: when σ x 0 / σ y 0 = 1 , the fracture extends along the initial notch direction; when σ x 0 / σ y 0 = 10 , there is a deviation toward the notch direction. It is easy to conclude that the crack deflection angle is positively correlated with the magnitude of the stress contrast; however, there is something surprising about the crack extension in the degradation function with s = 1.025 when applied to a rectangular domain with a side length of 100 m. At s = 1.025, when σ x 0 / σ y 0 = 1 , the fracture extends along the initial notch direction, and when σ x 0 / σ y 0 = 10 , the fracture extends almost horizontally. We speculate that this may be due to the fact that the crack extension pattern does not change when the model is enlarged by a factor of 100, due to the fact that the phase field scale is much smaller than the model scale, thus resulting in an unclear observation.
In order to obtain an accurate solution, the mesh density is generally taken as about 1/5 of the length scale of the phase field, the advantage of choosing a smaller s for simulating the same model size is that the corresponding proportion of the length scale of the phase field can be obtained, so the simulation time is greatly reduced, and the correct crack extension distribution law can be obtained more quickly. In this example, there are a total of 18,762 domain cells and 640 boundary cells with 150,564 degrees of freedom after gridding. The time interval was taken as 0.05 s to calculate the crack growth up to the 50 s. When s = 200, it is the original numerical simulation method, and the required time is 3 h 17 min 10 s. However, with the same number of grids, the required time is only 2 h when s = 1.025 is adopted. The computational efficiency is improved by 34.2%.
The fluid pressure at the center of the notch with time for different stress ratio conditions are discussed here. The center fluid pressure is positively correlated with the stress ratio for s = 200 acting on 10 m square domain, as shown in Figure 5a,b, and the relatively smaller fluid pressure is finally obtained at the midpoint at larger stress ratio conditions. While s = 1.025 and the length of the side is 100 m, as shown in Figure 5c, the center fluid pressure is negatively correlated with the stress ratio, and eventually, larger stress ratios yield a relatively higher fluid pressure at the midpoint.

4.2. Fracture Occurs at a Horizontal Notch

Figure 6a below shows the model with a notch length of 0.8 m and an inclination angle of 0 degrees, and Figure 6b shows its finite element discrete mesh. The simulation parameters remain consistent with those outlined in Section 4.1.
The initial stress state is set to σ x 0 = 0.5   Mpa , σ y 0 = 0.5   Mpa , and σ z 0 = ν σ x 0 + σ y 0 , where ν is the Poisson’s ratio. We applied various degradation functions and compared them. The crack propagation is illustrated in the following figures.
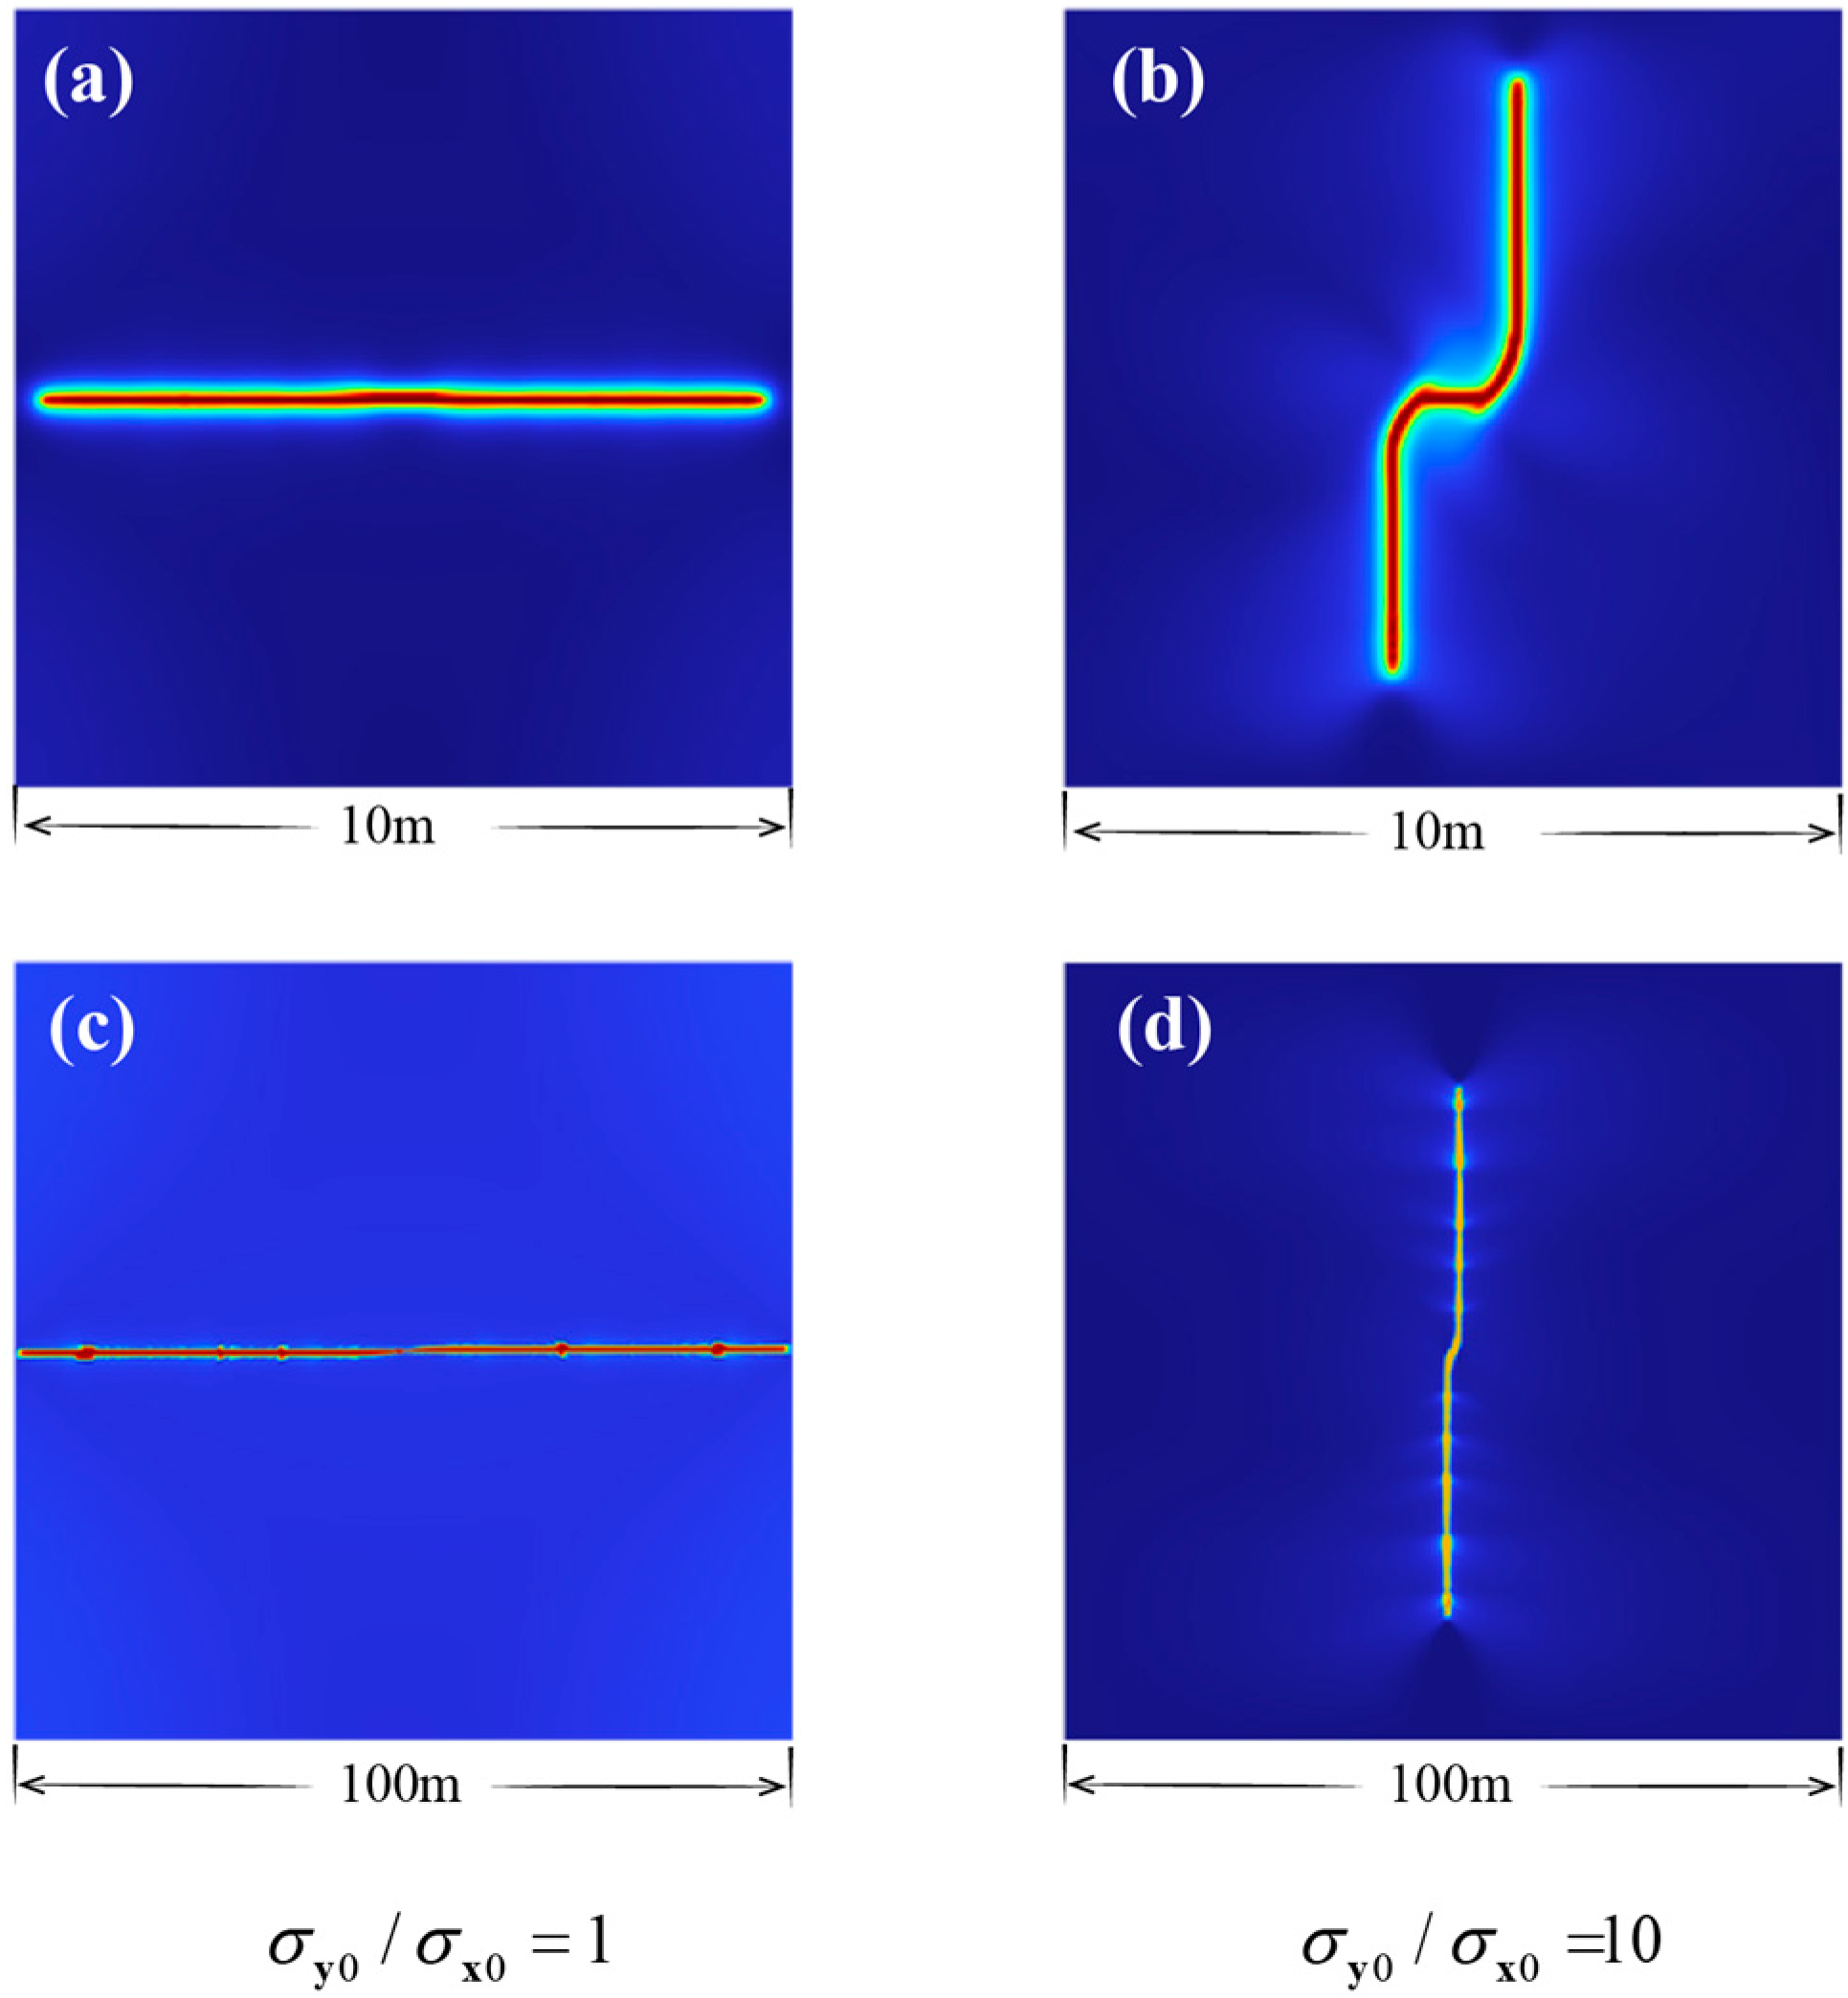
Firstly, s = 200 and l 0 = 0.1 were fixed, and the effects of different stress ratios and specimen sizes on the crack propagation direction was investigated. As shown in Figure 7, the model side length is set as 10 m or 100 m. When σ y 0 / σ x 0 = 1 , the cracks expand horizontally from the direction of the initial notch, while when σ y 0 / σ x 0 = 10 , the fracture deflection is along the direction of the maximum in situ stress.
When the length scale of the phase field l 0 is 1.0 m, it can be seen from Figure 8 that the crack expansion trend is the same for s = 200 and s = 1.025. The reason may be that the width l 0 of the rectangular notch has exceeded the notch length of 0.8 m, and the cracks are more likely to expand along the vertical direction. We further set up the stress ratio σ y 0 / σ x 0 = 0.5 and observed that the cracks expanded horizontally, verifying our assumption.
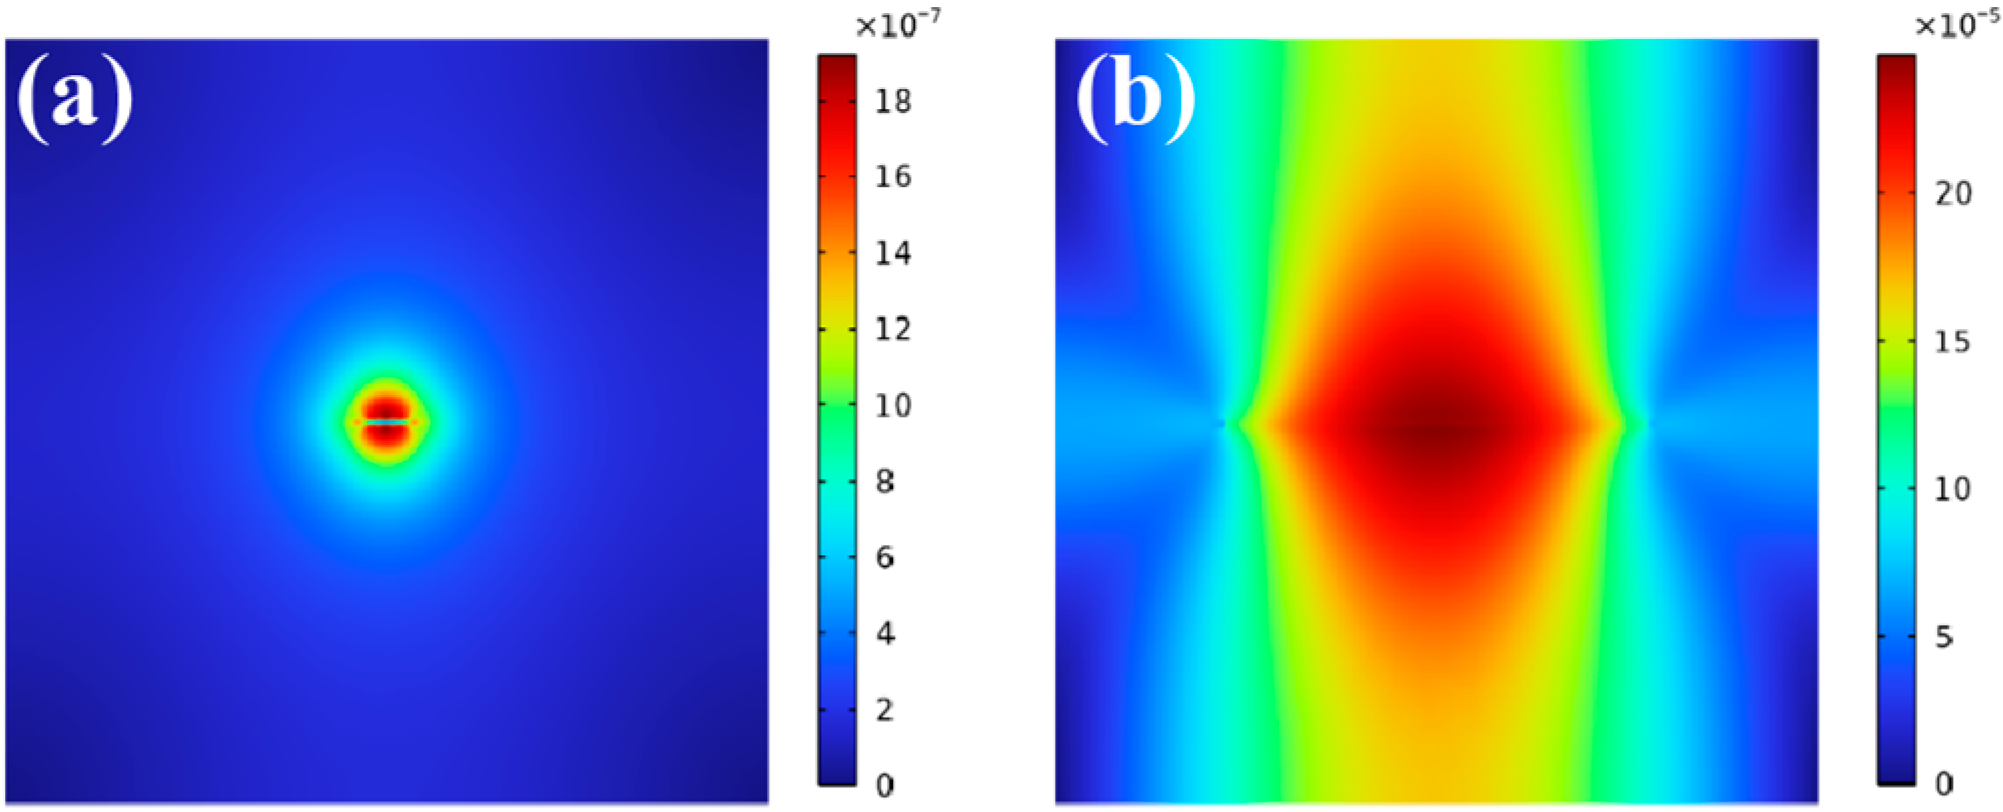
Taking the loading condition σ y 0 / σ x 0 = 1 as an example, the evolution of the displacement field is shown in Figure 9 and Figure 10, where the maximum displacement is occurred at the initial notch due to excavation or hydraulic fracturing, and increases accordingly as the crack evolves. This is consistent with the observation of crack extension displacement distribution in porous media with stress boundary conditions in engineering, which further confirms the superiority of our proposed phase field method.

4.3. Fractures along Two Vertically Intersected Notches

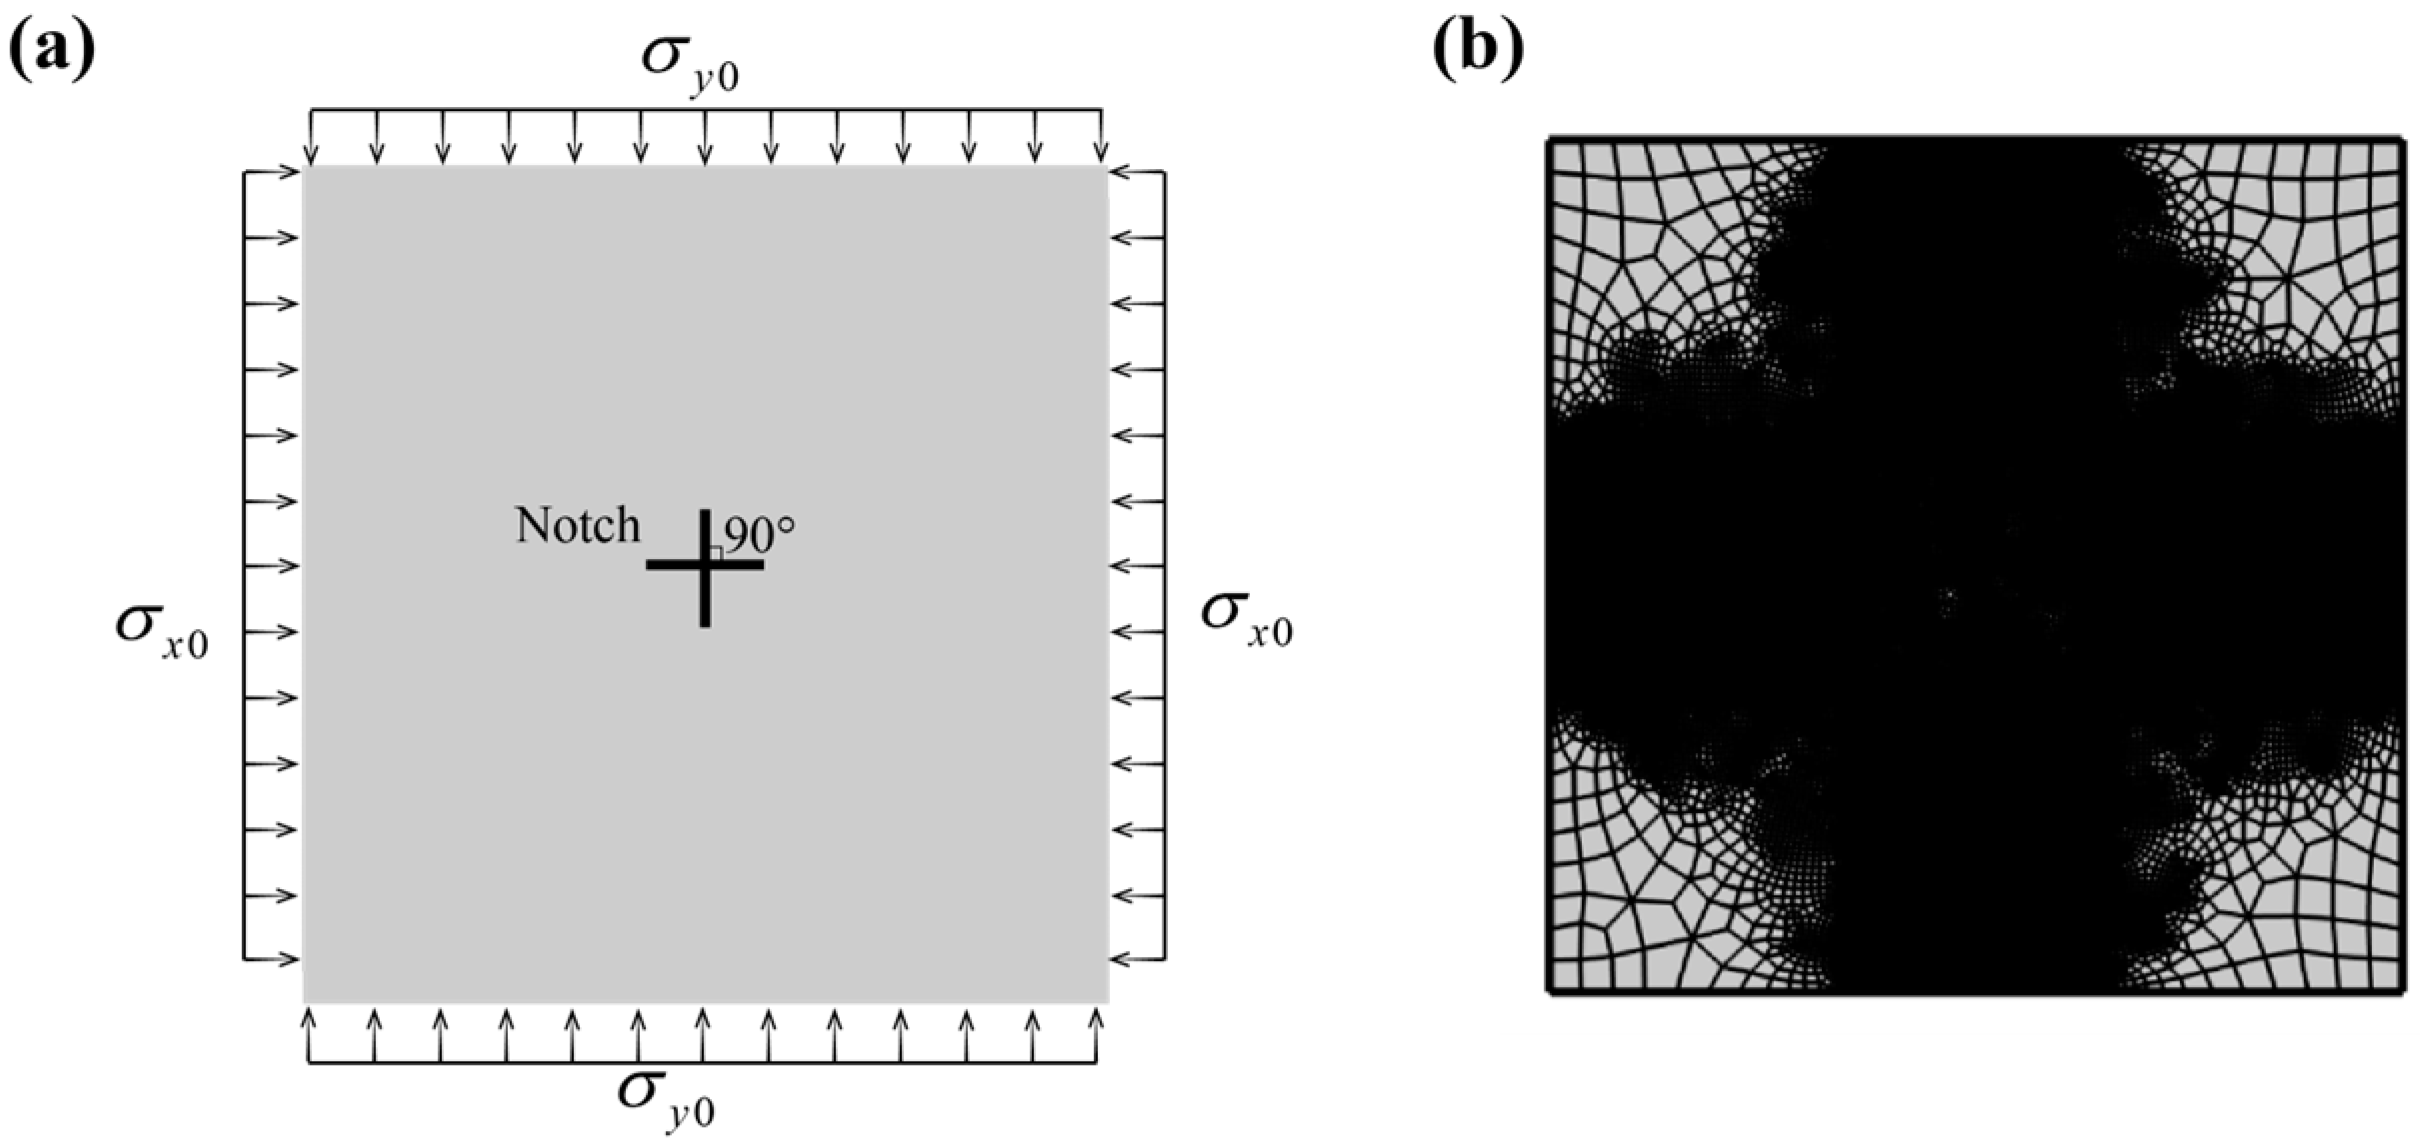
The numerical example in Figure 11 investigates the extension of cracks along two intersecting notches in a vertical manner. The crack notches are positioned at the center of the geometric model, each with a length of 0.8 m. Following the settings outlined in Section 4.1, we will examine the propagation of cracks under σ x 0 / σ y 0 = 10 and σ y 0 / σ x 0 = 10 .
Figure 12 and Figure 13 illustrates the crack extension in different cases; the graphical representation validates the engineering observational outcomes, indicating that under both classical and novel degradation functions, cracks perpendicular to the direction of minimum principal stress are more prone to initiation and propagation.
The curves of the central fluid pressure with time for different working conditions are shown in Figure 14. It is easy to observe that there is very little difference between the fluid pressure curves in the two sets of graphs for different stress ratios, which is due to the fact that the maximum and minimum ground stresses are the same, even though the stress ratios are different.

5. Conclusions

In this study, a length-scale insensitive degradation function is applied to porous hydraulic fracture crack extension under stress boundary conditions, which decouples the phase field length scale from the physical length scale by an order of magnitude. At the same mesh scale, the new degradation function has a significant advantage in simulating models with larger scales, and efficiently captures the hydraulic fracture extension to the stress boundary conditions while obtaining the correct displacement distribution. Numerical examples show that the computational efficiency of the proposed method can be improved by 34% compared with the traditional phase field method. In addition, for the precast crack problem, the fracture invariably propagates from the crack tip, initially extending along the direction of the prefabricated crack and then reorienting toward to the direction of the maximum horizontal stress.
The numerical examples provided in this paper demonstrate the efficacy of the proposed phase field method in accurately capturing complex hydraulic crack growth patterns in a 2D framework. We anticipate that the algorithm can be effectively applied in 3D scenarios. A limitation of this study is that the phase field length scale has only been decoupled by one order of magnitude. In future studies, we aim to further explore the decoupling of phase field length scales to facilitate the 3D simulation of water–force–thermal multi-field coupling.

Author Contributions

L.Y.: Conceptualization, Methodology, Software, Validation, Formal analysis, Investigation. Y.M.: Writing, Software, Validation, Investigation. G.Y.: Writing, Methodology, Formal analysis. Z.L. and K.K.: Conceptualization, Data Curation. M.Z. and Z.W.: Writing, Supervision, Acquisition of the financial support. All authors have read and agreed to the published version of the manuscript.

Funding

This research was funded by the National Natural Science Foundation of China (NSFC) (Nos. 52174123; 52274222; 52309166; 12272257).

Data Availability Statement

The data that support the findings of this study are available from the corresponding author upon reasonable request.

Conflicts of Interest

The authors declare no conflicts of interest.

References

  1. Vidic, R.D.; Brantley, S.L.; Vandenbossche, J.M.; Yoxtheimer, D.; Abad, J.D. Impact of shale gas development on regional water quality. Science 2013, 340, 1235009. [Google Scholar] [CrossRef] [PubMed]
  2. Ren, F.; Ma, G.; Fan, L.; Wang, Y.; Zhu, H. Equivalent discrete fracture networks for modelling fluid flow in highly fractured rock mass. Eng. Geol. 2017, 229, 21–30. [Google Scholar] [CrossRef]
  3. Sonntag, A.; Wagner, A.; Ehlers, W. Dynamic hydraulic fracturing in partially saturated porous media. Comput. Methods Appl. Mech. Eng. 2023, 414, 116121. [Google Scholar] [CrossRef]
  4. Figueiredo, B.; Tsang, C.-F.; Rutqvist, J.; Niemi, A. The effects of nearby fractures on hydraulically induced fracture propagation and permeability changes. Eng. Geol. 2017, 228, 197–213. [Google Scholar] [CrossRef]
  5. Ingraffea, A.R.; Saouma, V.E. Numerical modeling of discrete crack propagation in reinforced and plain concrete. In Fracture Mechanics of Concrete: Structural Application and Numerical Calculation; Springer: Dordrecht, The Netherlands, 1985; pp. 171–225. [Google Scholar]
  6. Griffith, A.A. The Phenomena of Rupture and Flow in Solids. Philos. Trans. R. Soc. Lond. Ser. A Contain. Pap. A Math. Or Phys. Character 1921, 221, 163–198. [Google Scholar]
  7. Irwin, G.R. Analysis of Stresses and Strains Near the End of a Crack Traversing a Plate. J. Appl. Mech. 2021, 24, 361–364. [Google Scholar] [CrossRef]
  8. Barenblatt, G.I. The Mathematical Theory of Equilibrium Cracks in Brittle Fracture. In Advances in Applied Mechanics; Dryden, H.L., Von Kármán, T., Kuerti, G., Eds.; Elsevier: Amsterdam, The Netherlands, 1962; pp. 55–129. [Google Scholar]
  9. Moës, N.; Belytschko, T. Extended finite element method for cohesive crack growth. Eng. Fract. Mech. 2002, 69, 813–833. [Google Scholar] [CrossRef]
  10. Belytschko, T.; Lin, J.I. A three-dimensional impact-penetration algorithm with erosion. Int. J. Impact Eng. 1987, 5, 111–127. [Google Scholar] [CrossRef]
  11. Uddin, M.; Kamran, A.A. A localized transform-based meshless method for solving time fractional wave-diffusion equation. Eng. Anal. Bound. Elem. 2018, 92, 108–113. [Google Scholar] [CrossRef]
  12. Fries, T.P.; Belytschko, T. The extended/generalized finite element method: An overview of the method and its applications. Int. J. Numer. Methods Eng. 2010, 84, 253–304. [Google Scholar] [CrossRef]
  13. Cong, Z.; Li, Y.; Liu, Y.; Xiao, Y. A new method for calculating the direction of fracture propagation by stress numerical search based on the displacement discontinuity method. Comput. Geotech. 2021, 140, 104482. [Google Scholar] [CrossRef]
  14. Peerlings, R.H.; de Borst, R.; Brekelmans, W.A.M.; Geers, M.G. Gradient-enhanced damage modelling of concrete fracture. Mech. Cohesive-Frict. Mater. Int. J. Exp. Model. Comput. Mater. Struct. 1998, 3, 323–342. [Google Scholar] [CrossRef]
  15. Zhou, S.; Zhuang, X.; Zhu, H.; Rabczuk, T. Phase field modelling of crack propagation, branching and coalescence in rocks. Theor. Appl. Fract. Mech. 2018, 96, 174–192. [Google Scholar] [CrossRef]
  16. Kar, S.; Chaudhuri, A.; Singh, A.; Pal, S. Phase field method to model hydraulic fracturing in saturated porous reservoir with natural fractures. Eng. Fract. Mech. 2023, 286, 109289. [Google Scholar] [CrossRef]
  17. Zhang, T.; Zhang, Y.; Katterbauer, K.; Al Shehri, A.; Sun, S.; Hoteit, I. Deep learning–assisted phase equilibrium analysis for producing natural hydrogen. Int. J. Hydrog. Energy 2024, 50, 473–486. [Google Scholar] [CrossRef]
  18. Li, Y.; Peng, G.; Tang, J.; Zhang, J.; Zhao, W.; Liu, B.; Pan, Y. Thermo-hydro-mechanical coupling simulation for fracture propagation in CO2 fracturing based on phase-field model. Energy 2023, 284, 128629. [Google Scholar] [CrossRef]
  19. Borden, M.J.; Verhoosel, C.V.; Scott, M.A.; Hughes, T.J.; Landis, C.M. A phase-field description of dynamic brittle fracture. Comput. Methods Appl. Mech. Eng. 2012, 217, 77–95. [Google Scholar] [CrossRef]
  20. Hofacker, M.; Miehe, C. A phase field model of dynamic fracture: Robust field updates for the analysis of complex crack patterns. Int. J. Numer. Methods Eng. 2013, 93, 276–301. [Google Scholar] [CrossRef]
  21. Lo, Y.-S.; Hughes, T.J.R.; Landis, C.M. Phase-field fracture modeling for large structures. J. Mech. Phys. Solids 2023, 171, 105118. [Google Scholar] [CrossRef]
  22. Zhou, S.; Zhuang, X.; Rabczuk, T. A phase-field modeling approach of fracture propagation in poroelastic media. Eng. Geol. 2018, 240, 189–203. [Google Scholar] [CrossRef]
  23. Zhou, S.; Zhuang, X.; Rabczuk, T. Phase field method for quasi-static hydro-fracture in porous media under stress boundary condition considering the effect of initial stress field. Theor. Appl. Fract. Mech. 2020, 107, 102523. [Google Scholar] [CrossRef]
  24. Miehe, C.; Hofacker, M.; Welschinger, F. A phase field model for rate-independent crack propagation: Robust algorithmic implementation based on operator splits. Comput. Methods Appl. Mech. Eng. 2010, 199, 2765–2778. [Google Scholar] [CrossRef]
  25. Yang, G.; Yang, L.; Liu, Z.; Li, H.; Zhang, J.; Lian, H. Phase field simulation of hydrogen-assisted cracking with length-scale insensitive degradation function. Comput. Mater. Sci. 2023, 228, 112309. [Google Scholar] [CrossRef]
  26. Zhou, S.; Rabczuk, T.; Zhuang, X. Phase field modeling of quasi-static and dynamic crack propagation: COMSOL implementation and case studies. Adv. Eng. Softw. 2018, 122, 31–49. [Google Scholar] [CrossRef]
  27. Francfort, G.A.; Marigo, J.J. Revisiting brittle fracture as an energy minimization problem. J. Mech. Phys. Solids 1998, 46, 1319–1342. [Google Scholar] [CrossRef]
  28. Shiozawa, S.; Lee, S.; Wheeler, M.F. The effect of stress boundary conditions on fluid-driven fracture propagation in porous media using a phase-field modeling approach. Int. J. Numer. Anal. Methods Geomech. 2019, 43, 1316–1340. [Google Scholar] [CrossRef]
  29. Liu, Z.; Ren, X.; Lin, X.; Lian, H.; Yang, L.; Yang, J. Effects of confining stresses, pre-crack inclination angles and injection rates: Observations from large-scale true triaxial and hydraulic fracturing tests in laboratory. Rock Mech. Rock Eng. 2020, 53, 1991–2000. [Google Scholar] [CrossRef]
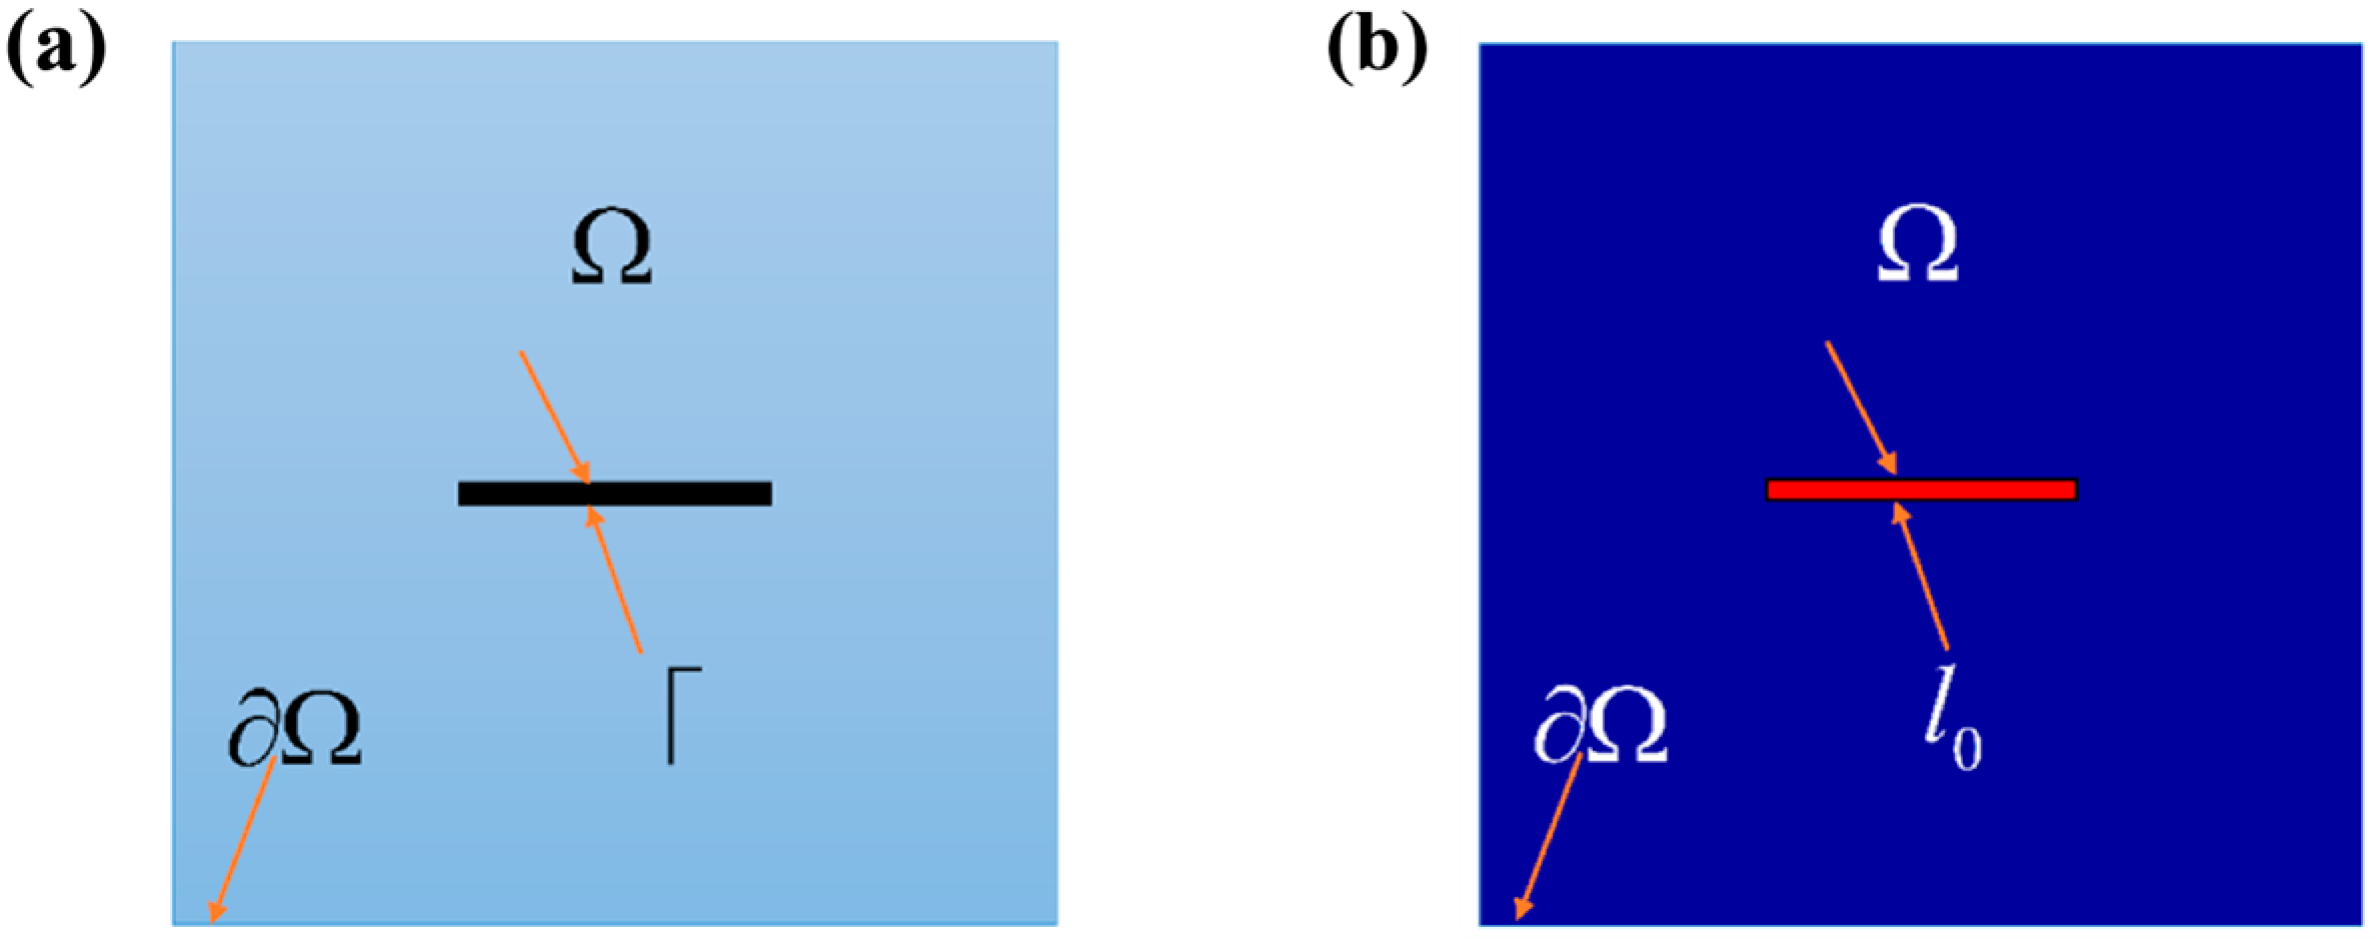
Figure 1. Sharp and diffusive fracture in the poro-elastic domain. (a) Sharp crack; (b) diffusive crack.
Energies 17 05210 g001
Figure 2. The initial computational model with prefabricated cracks: (a) schematic diagram of pre-cracked specimens; (b) simplified 2D numerical model diagram; (c) finite element mesh diagram in COMSOL.
Energies 17 05210 g002
Figure 3. Results of hydraulic fracturing: (a) experimental results [29]; (b) numerical simulation results (s = 200).
Energies 17 05210 g003
Figure 4. Results of numerical simulation of precast inclined crack growth using different degradation functions: (a) σ x 0 / σ y 0 = 1 , s = 200, l0 = 0.1 m, 10 m; (b) σ x 0 / σ y 0 = 1 , s = 200, l0 = 0.1 m, 100 m; (c) σ x 0 / σ y 0 = 1 , s = 1.025, l0 = 1 m, 100 m; (d) σ x 0 / σ y 0 = 10 , s = 200, l0 = 0.1 m, 10 m; (e) σ x 0 / σ y 0 = 10 , s = 200, l0 = 0.1 m, 100 m; (f) σ x 0 / σ y 0 = 10 , s = 1.025, l0 = 1 m, 100 m.
Energies 17 05210 g004
Figure 5. The mid-point fluid pressure of inclined notch under different stress contrasts. (a) s = 200, l0 = 0.1 m, 10 m; (b) s = 200, l0 = 0.1 m, 100 m; (c) s = 1.025, l0 = 1 m, 100 m.
Energies 17 05210 g005
Figure 6. Numerical model diagram (a) and finite element mesh diagram (b) of the computational domain.
Energies 17 05210 g006
Figure 7. Values: s = 200 , l 0 = 0.1 m. Images show cracks extending from horizontal notches. (a) σ y 0 / σ x 0 = 1 , 10 m; (b) σ y 0 / σ x 0 = 10 , 10 m; (c) σ y 0 / σ x 0 = 1 , 100 m; (d) σ y 0 / σ x 0 = 10 , 100 m.
Energies 17 05210 g007
Figure 8. The cracks extending from horizontal notches with the length of the side fixed at 100 m. (a) σ y 0 / σ x 0 = 0.5 , s = 200, l0 = 1.0 m; (b) σ y 0 / σ x 0 = 1 , s = 200, l0 = 1.0 m; (c) σ y 0 / σ x 0 = 10 , s = 200, l0 = 1.0 m; (d) σ y 0 / σ x 0 = 0.5 , s = 1.025, l0 = 1.0 m; (e) σ y 0 / σ x 0 = 1 , s = 1.025, l0 = 1.0 m; (f) σ y 0 / σ x 0 = 10 , s = 1.025, l0 = 1.0 m.
Energies 17 05210 g008
Figure 9. Values: σ y 0 / σ x 0 = 1 , s = 200 , l 0 = 0.1 m. The length of the side is 10 m. Evolution of displacements extending from the horizontal notch: (a) t = 0 s; (b) t = 5 s.
Energies 17 05210 g009
Figure 10. Values: σ y 0 / σ x 0 = 1 , s = 1.025 , l 0 = 1.0 m. The length of the side is 100 m. Evolution of displacements extending from the horizontal notch: (a) t = 0 s; (b) t = 5 s.
Energies 17 05210 g010
Figure 11. Numerical model diagram (a) and finite element mesh diagram (b) of the vertically intersected notches.
Energies 17 05210 g011
Figure 12. Values: s = 200 , l 0 = 0.1 m. The length of the side is 10 m. Images show cracks extending from two vertically intersecting notches: (a) σ x 0 / σ y 0 = 10 ; (b) σ x 0 / σ y 0 = 0.1 .
Energies 17 05210 g012
Figure 13. Values: s = 1.025 , l 0 = 1.0 m. The length of the side is 100 m. Images show cracks extending from two vertically intersecting notches: (a) σ x 0 / σ y 0 = 10 ; (b) σ x 0 / σ y 0 = 0.1 .
Energies 17 05210 g013
Figure 14. Diagrams of mid-point fluid pressure with time for different stress contrasts. (a) s = 1.025, l0 = 1.0 m, 100 m; (b) σ y 0 / σ x 0 = 1 , s = 200, l0 = 0.1 m, 10 m.
Energies 17 05210 g014
Table 1. The relevant parameters adopted in COMSOL.
ParameterValueParameterValue
μ 23.08 GPa G c 500 N/m
l 0 Value varies with s c 1 0.4
c 2 1.0 ρ R , ρ F 1 × 10³ kg/m3
q F , q R 0 kg/(m3 s) k F 8.344 × 10⁻⁴ m2
k R 1 × 10⁻¹⁵ m2 c F 1 × 10⁻¹⁵ 1/Pa
c R 1 × 10⁻⁸ 1/Pa μ F 1 × 10⁻³ Pa s
μ R 1 × 10⁻³ Pa s λ 34.62 GPa
k1 × 10−9 α R , ε p R 0.05
Disclaimer/Publisher’s Note: The statements, opinions and data contained in all publications are solely those of the individual author(s) and contributor(s) and not of MDPI and/or the editor(s). MDPI and/or the editor(s) disclaim responsibility for any injury to people or property resulting from any ideas, methods, instructions or products referred to in the content.