Heating Industrial Buildings with Heat Pump Air Systems: Is It Always the Most Advantageous Option?
Abstract
1. Introduction
- Energy Performance of Buildings Directive (EPBD-2024/1275), which promotes the improvement of the energy efficiency of EU buildings by 2030 [6];
- Energy Efficiency Directive (EED-2023/1791), which aims to reduce final energy consumption at the EU level by 11.7% in 2030, compared to projections made in 2020 [7];
- Renewable Energy Directive (RED-2023/2413) to increase the EU-wide target to at least 40% of renewable energy sources in the overall energy mix by 2030 [8].
Motivations and Novelty of the Study
- The heat pump must produce water at 50–55 °C to feed the air heaters or the distribution channels. The coefficient of performance (COP) is, therefore, penalized compared to typical applications of HP in other types of building in which terminals fed by low-temperature water can be used (radiant floors, fan coils);
- If radiant floors are used, all issues related to the thermal inertia of the system (difficulty in controlling the air temperature) and the lack of flexibility in the layout of the factory (difficulty in covering the available radiant surface with equipment and production systems) should be considered;
- Given the significant heights of the rooms to be air-conditioned, air heating systems induce strong stratification of the air inside the warehouse, which is greater the less insulated it is and the colder the external climate;
- Air systems are not very suitable for partial operation, i.e., with localized operation in zones, as their operating principle is based on the mixing of the hot air introduced with that of the air-conditioned environment. In warehouses, where there is less and less presence of people due to the ever-increasing automation of production processes, this determines a level of energy consumption of the system that is difficult to reduce because of its operating principle, unlike for radiant heating.
- Climate. The performance of both heat pumps and PVs strongly depends on the air temperature and solar radiation. This study shows the necessity of checking the effectiveness of heat pump + air heater systems before their application in a specific resort by considering, as an example, two climatic zones in Italy;
- Characteristics of the shed (less or more thermal insulation, which corresponds to existing rather than new buildings);
- Peak power of the PV system.
- Condensing radiant tubes (CRT). This is a radiant tubes system coupled to an air heating system with terminals (air heaters) placed inside the building, the latter fed, via a decoupling storage tank, by the heat derived from the condensation of the exhaust from the radiant tubes in a dedicated heat exchanger. The air part assists the radiant part, which represents the main heating system;
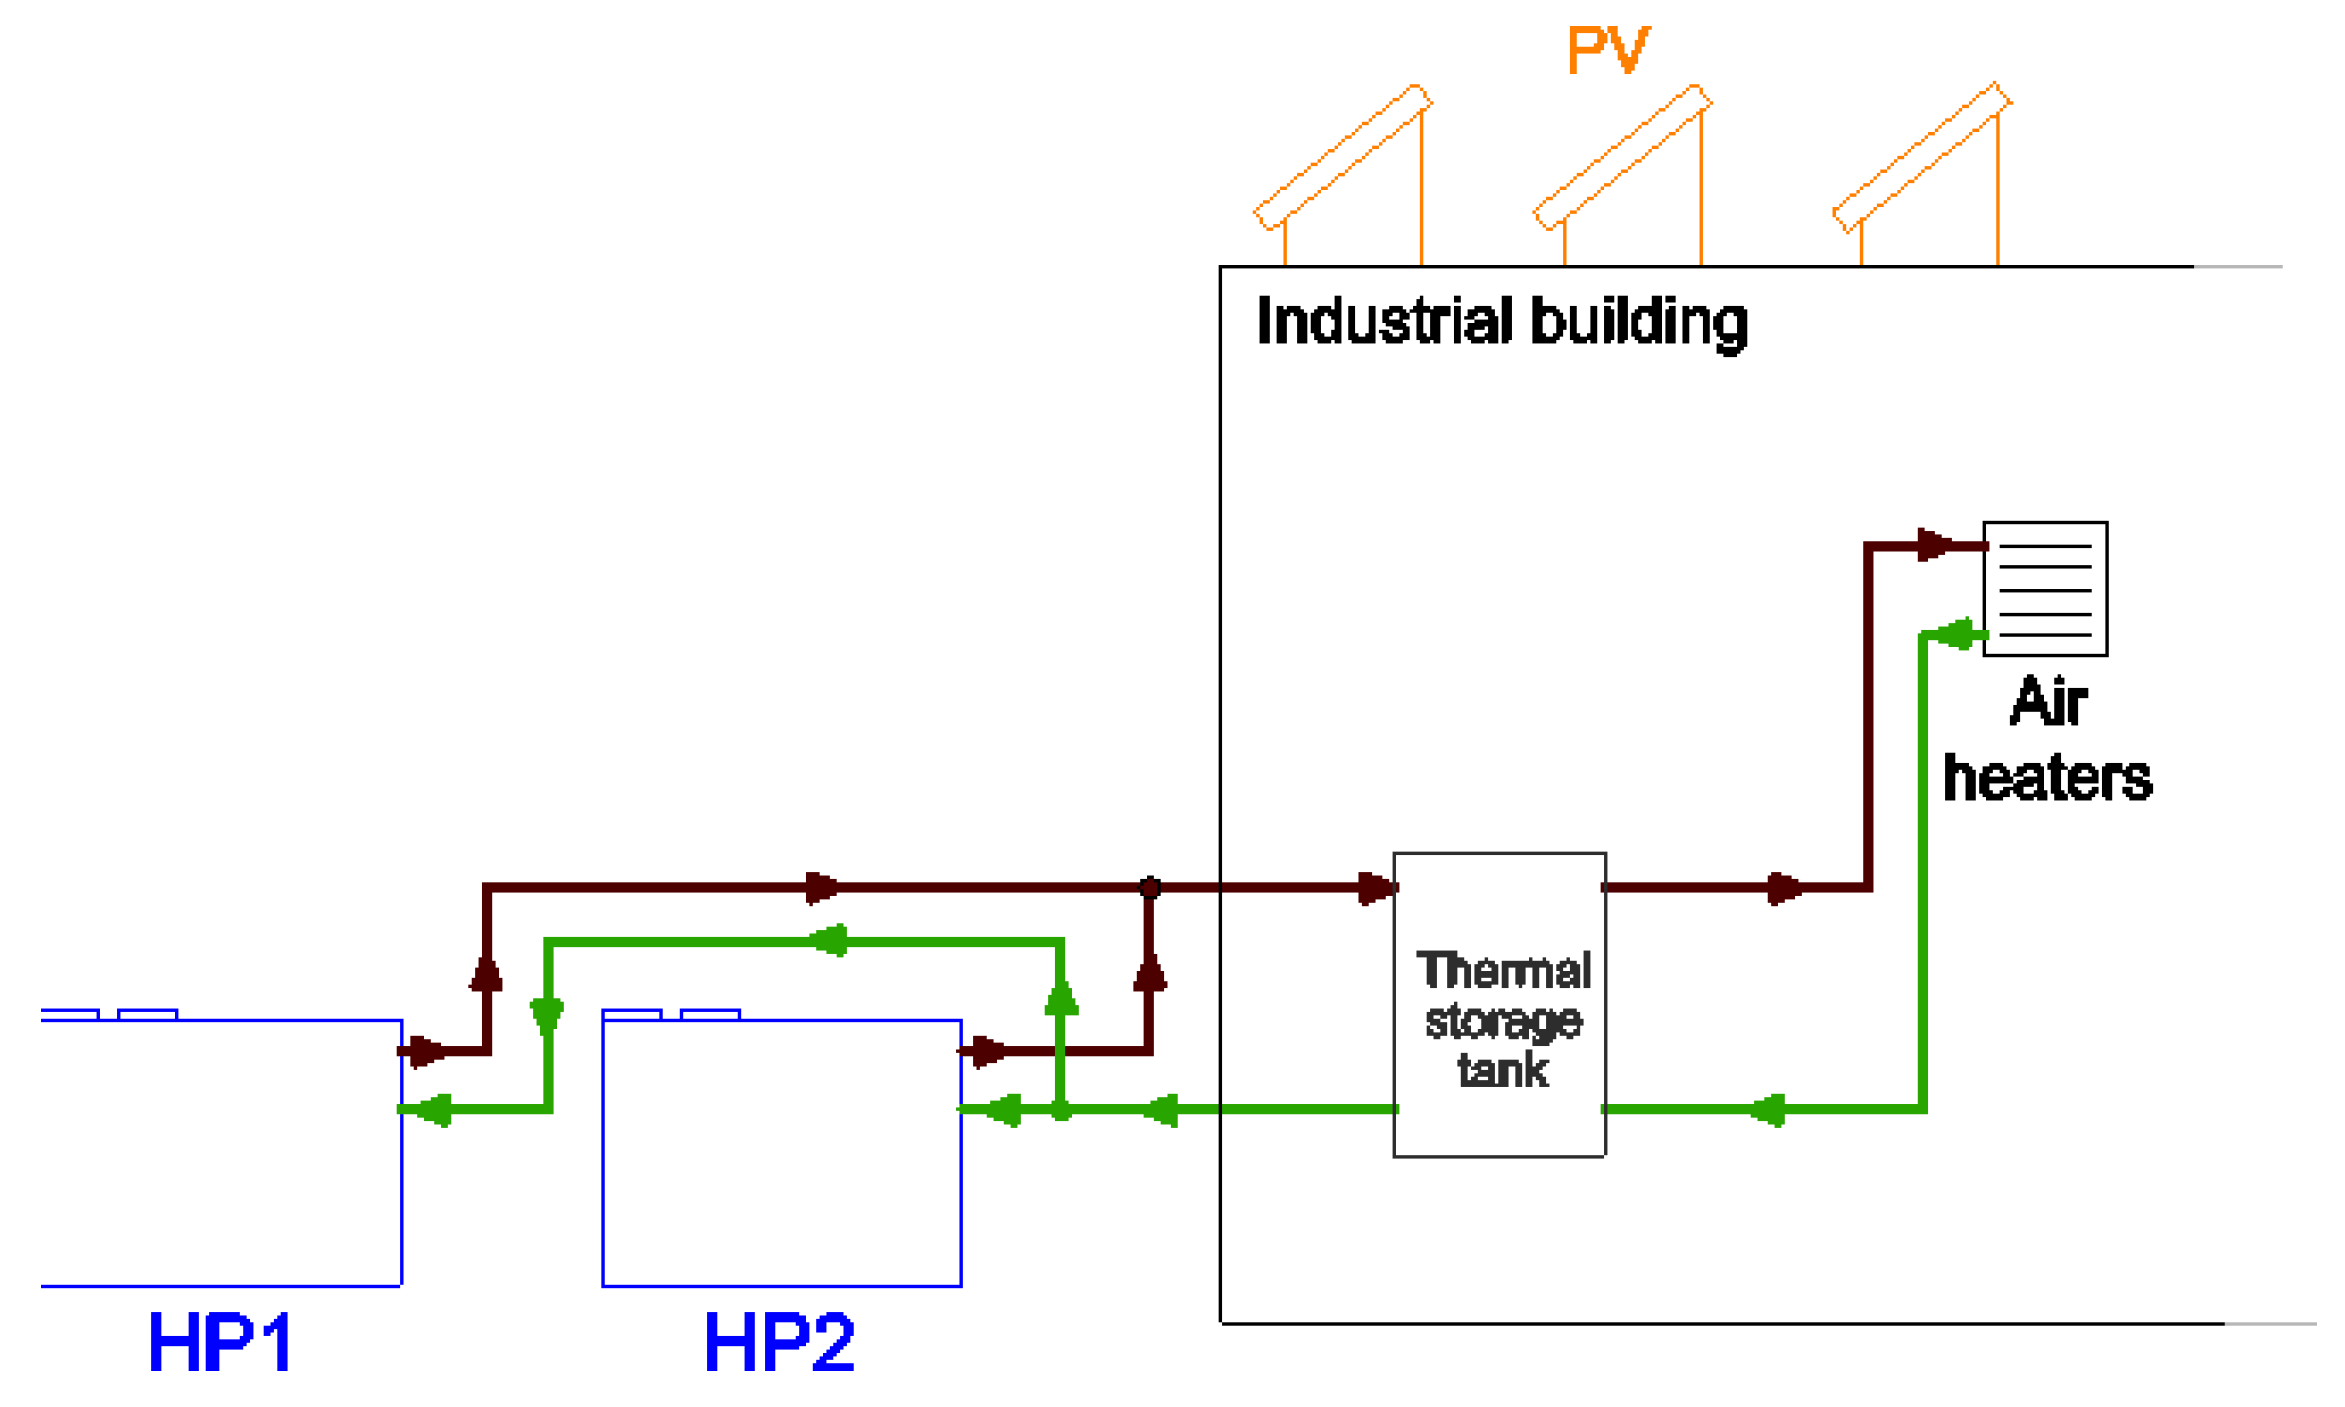
- Air/water heat pump serving an air heating system with terminals placed inside the building (air heaters) (hereafter heat pump + air, HP-Air), the latter fed via a decoupling storage tank.
2. Materials and Methods
2.1. Organization of the Study
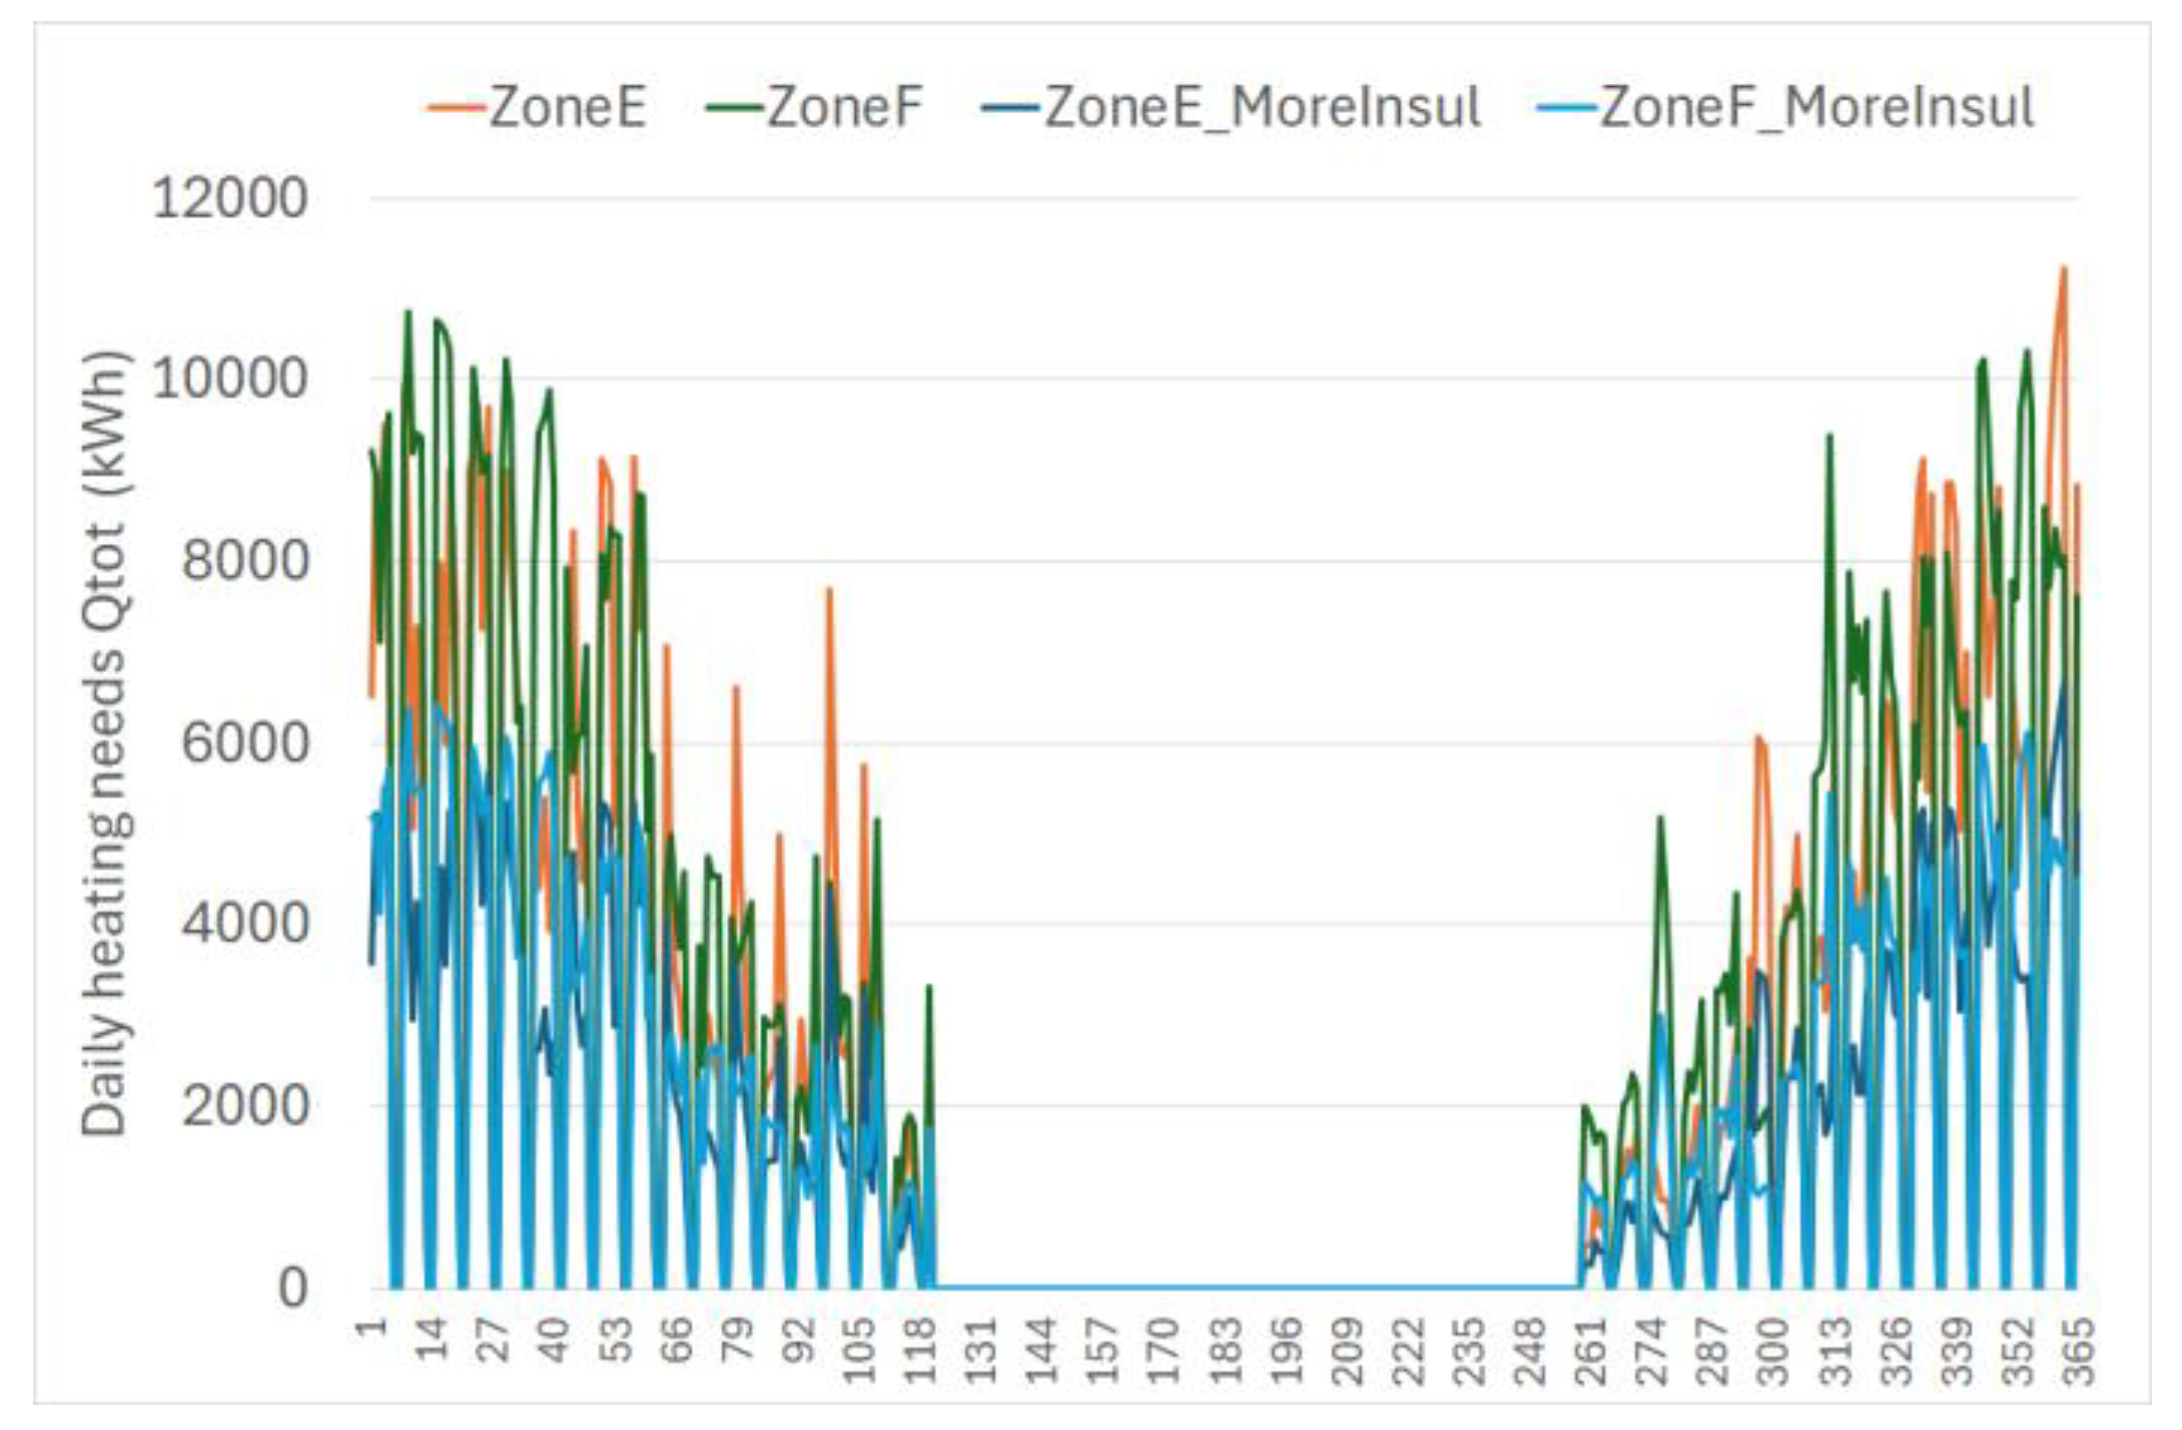
- Modeling and simulation with Trnsys® of a typical industrial building based on the overall characteristics from the literature [10,21] relating to the envelope of the building (in terms of size and exposure characteristics, windows, insulation and air exchange). The purpose of this phase was to determine the heating thermal loads of the building in two different locations (one in the Italian climate zone E and one in the climate zone F, colder than the zone E). The analysis was then extended by varying some of the parameters of the shed to simulate a more insulated building, therefore with lower heating needs;
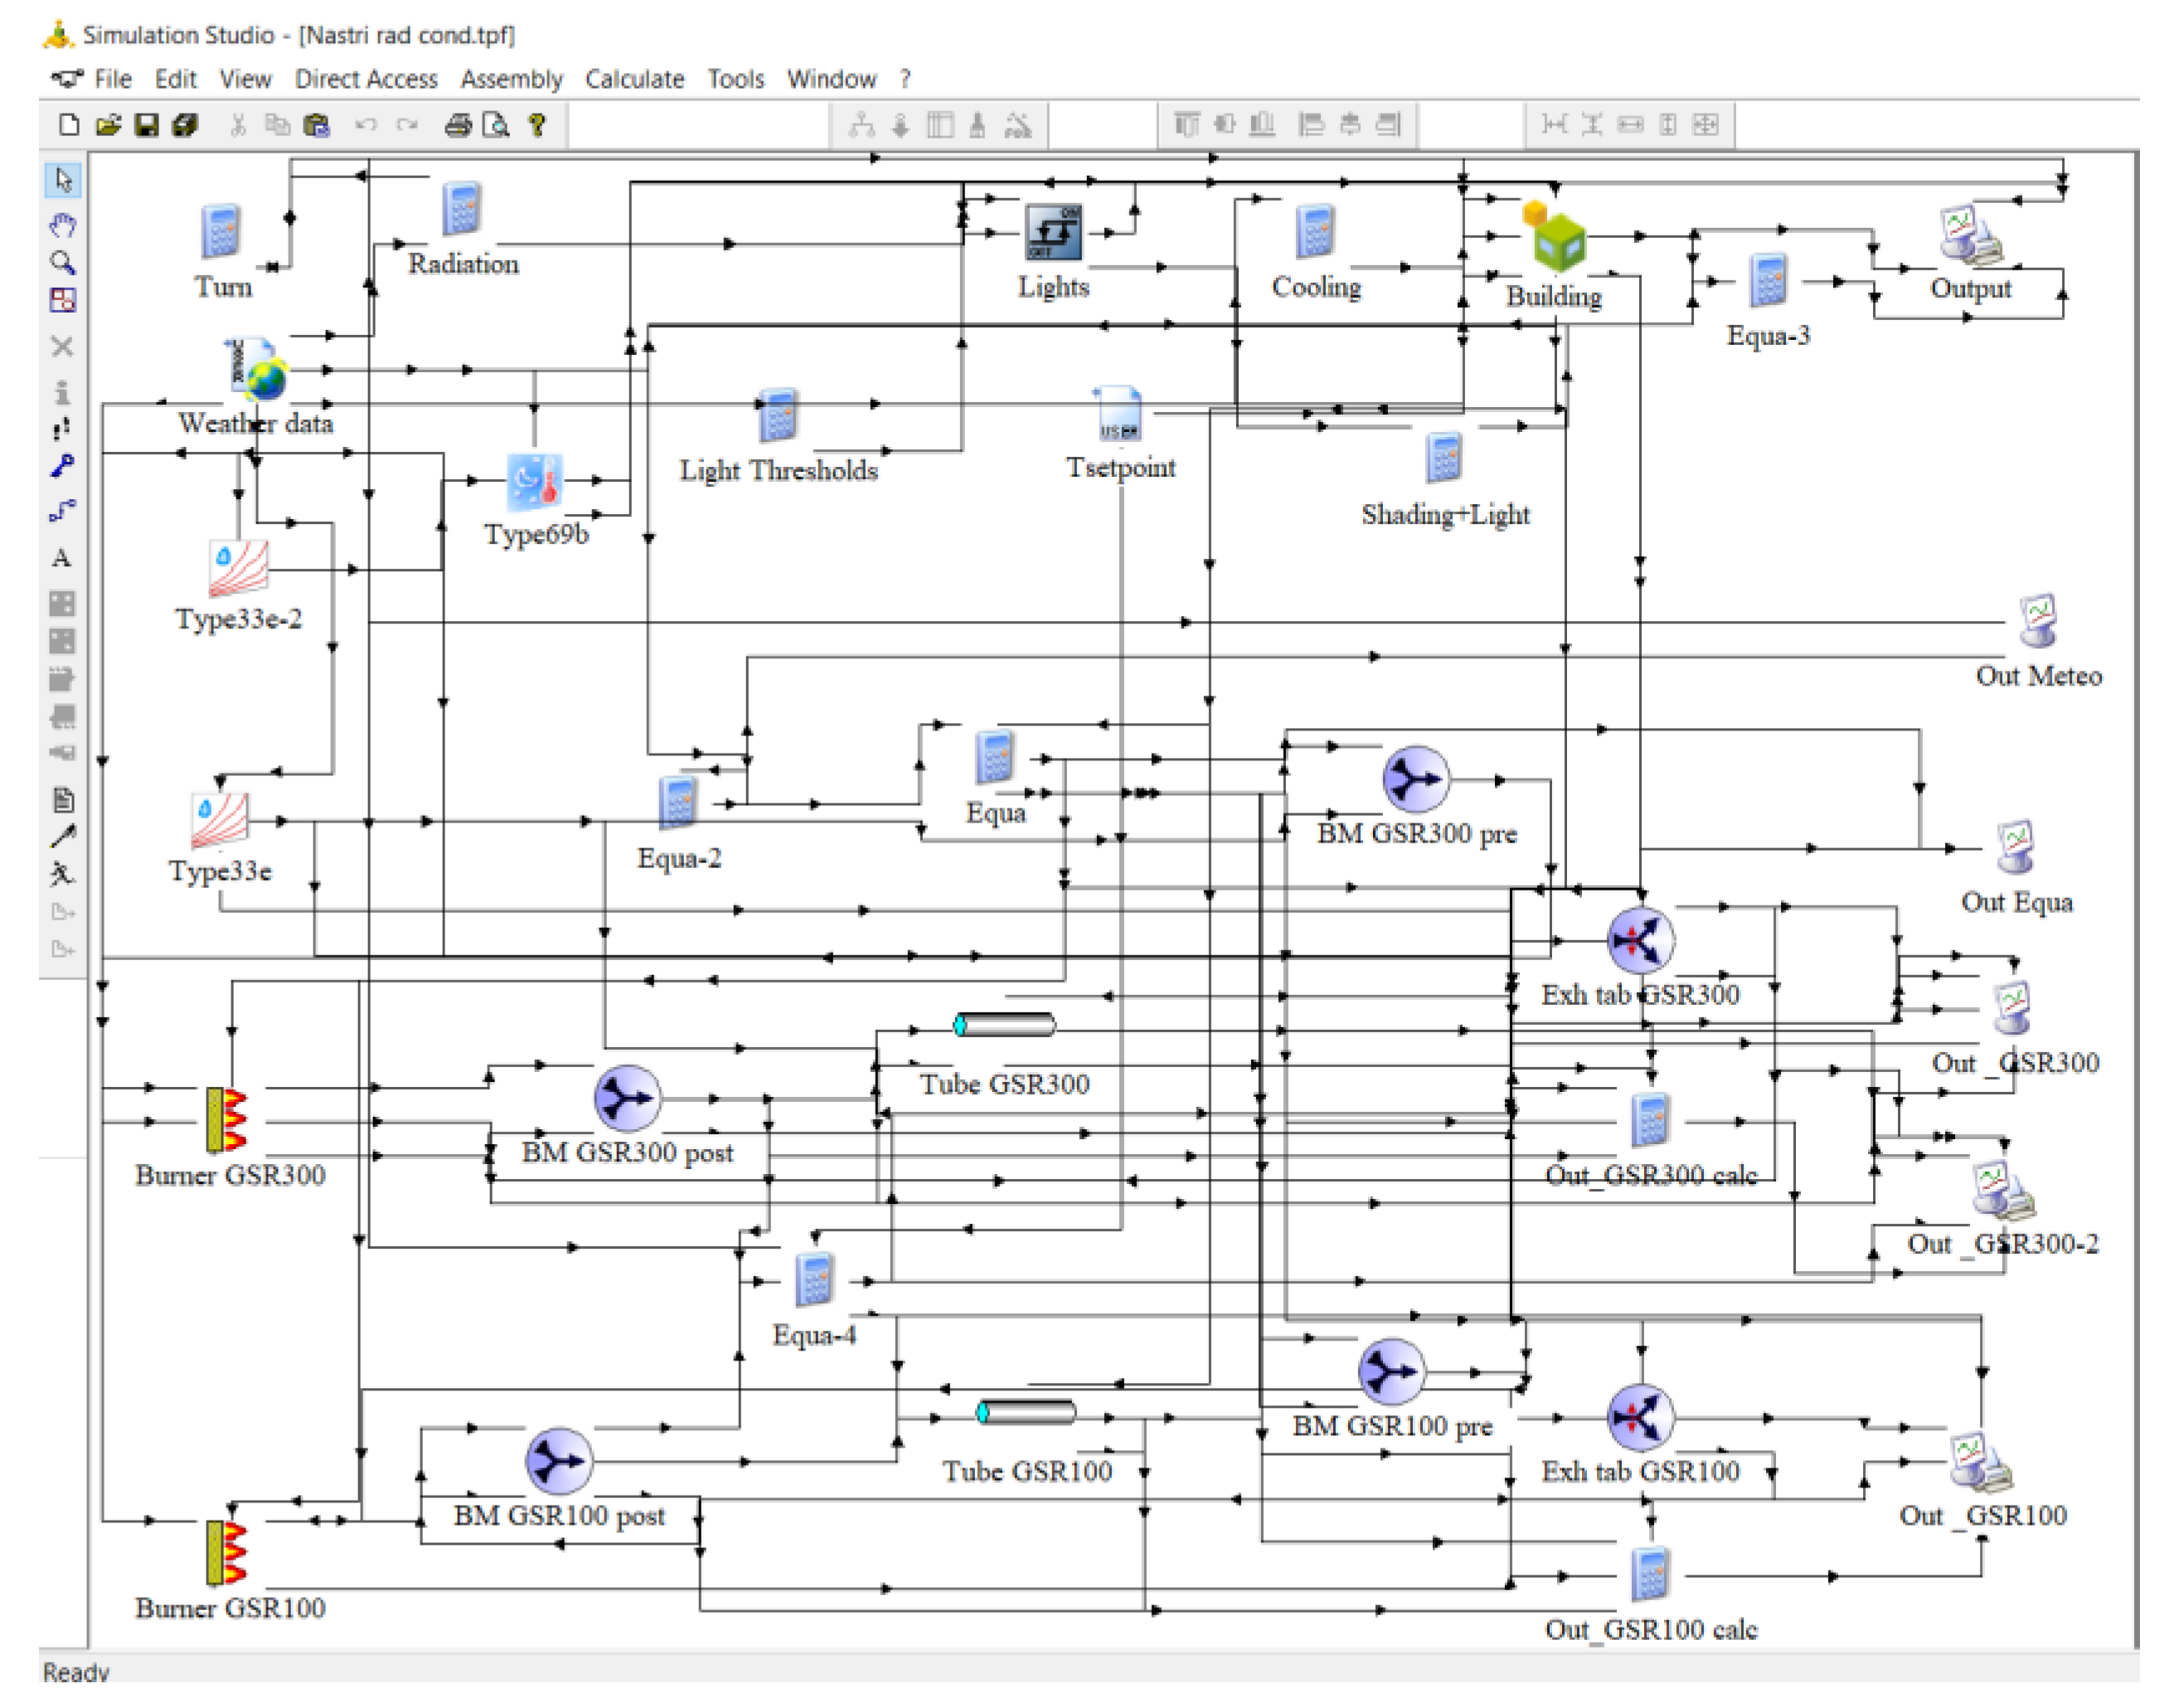
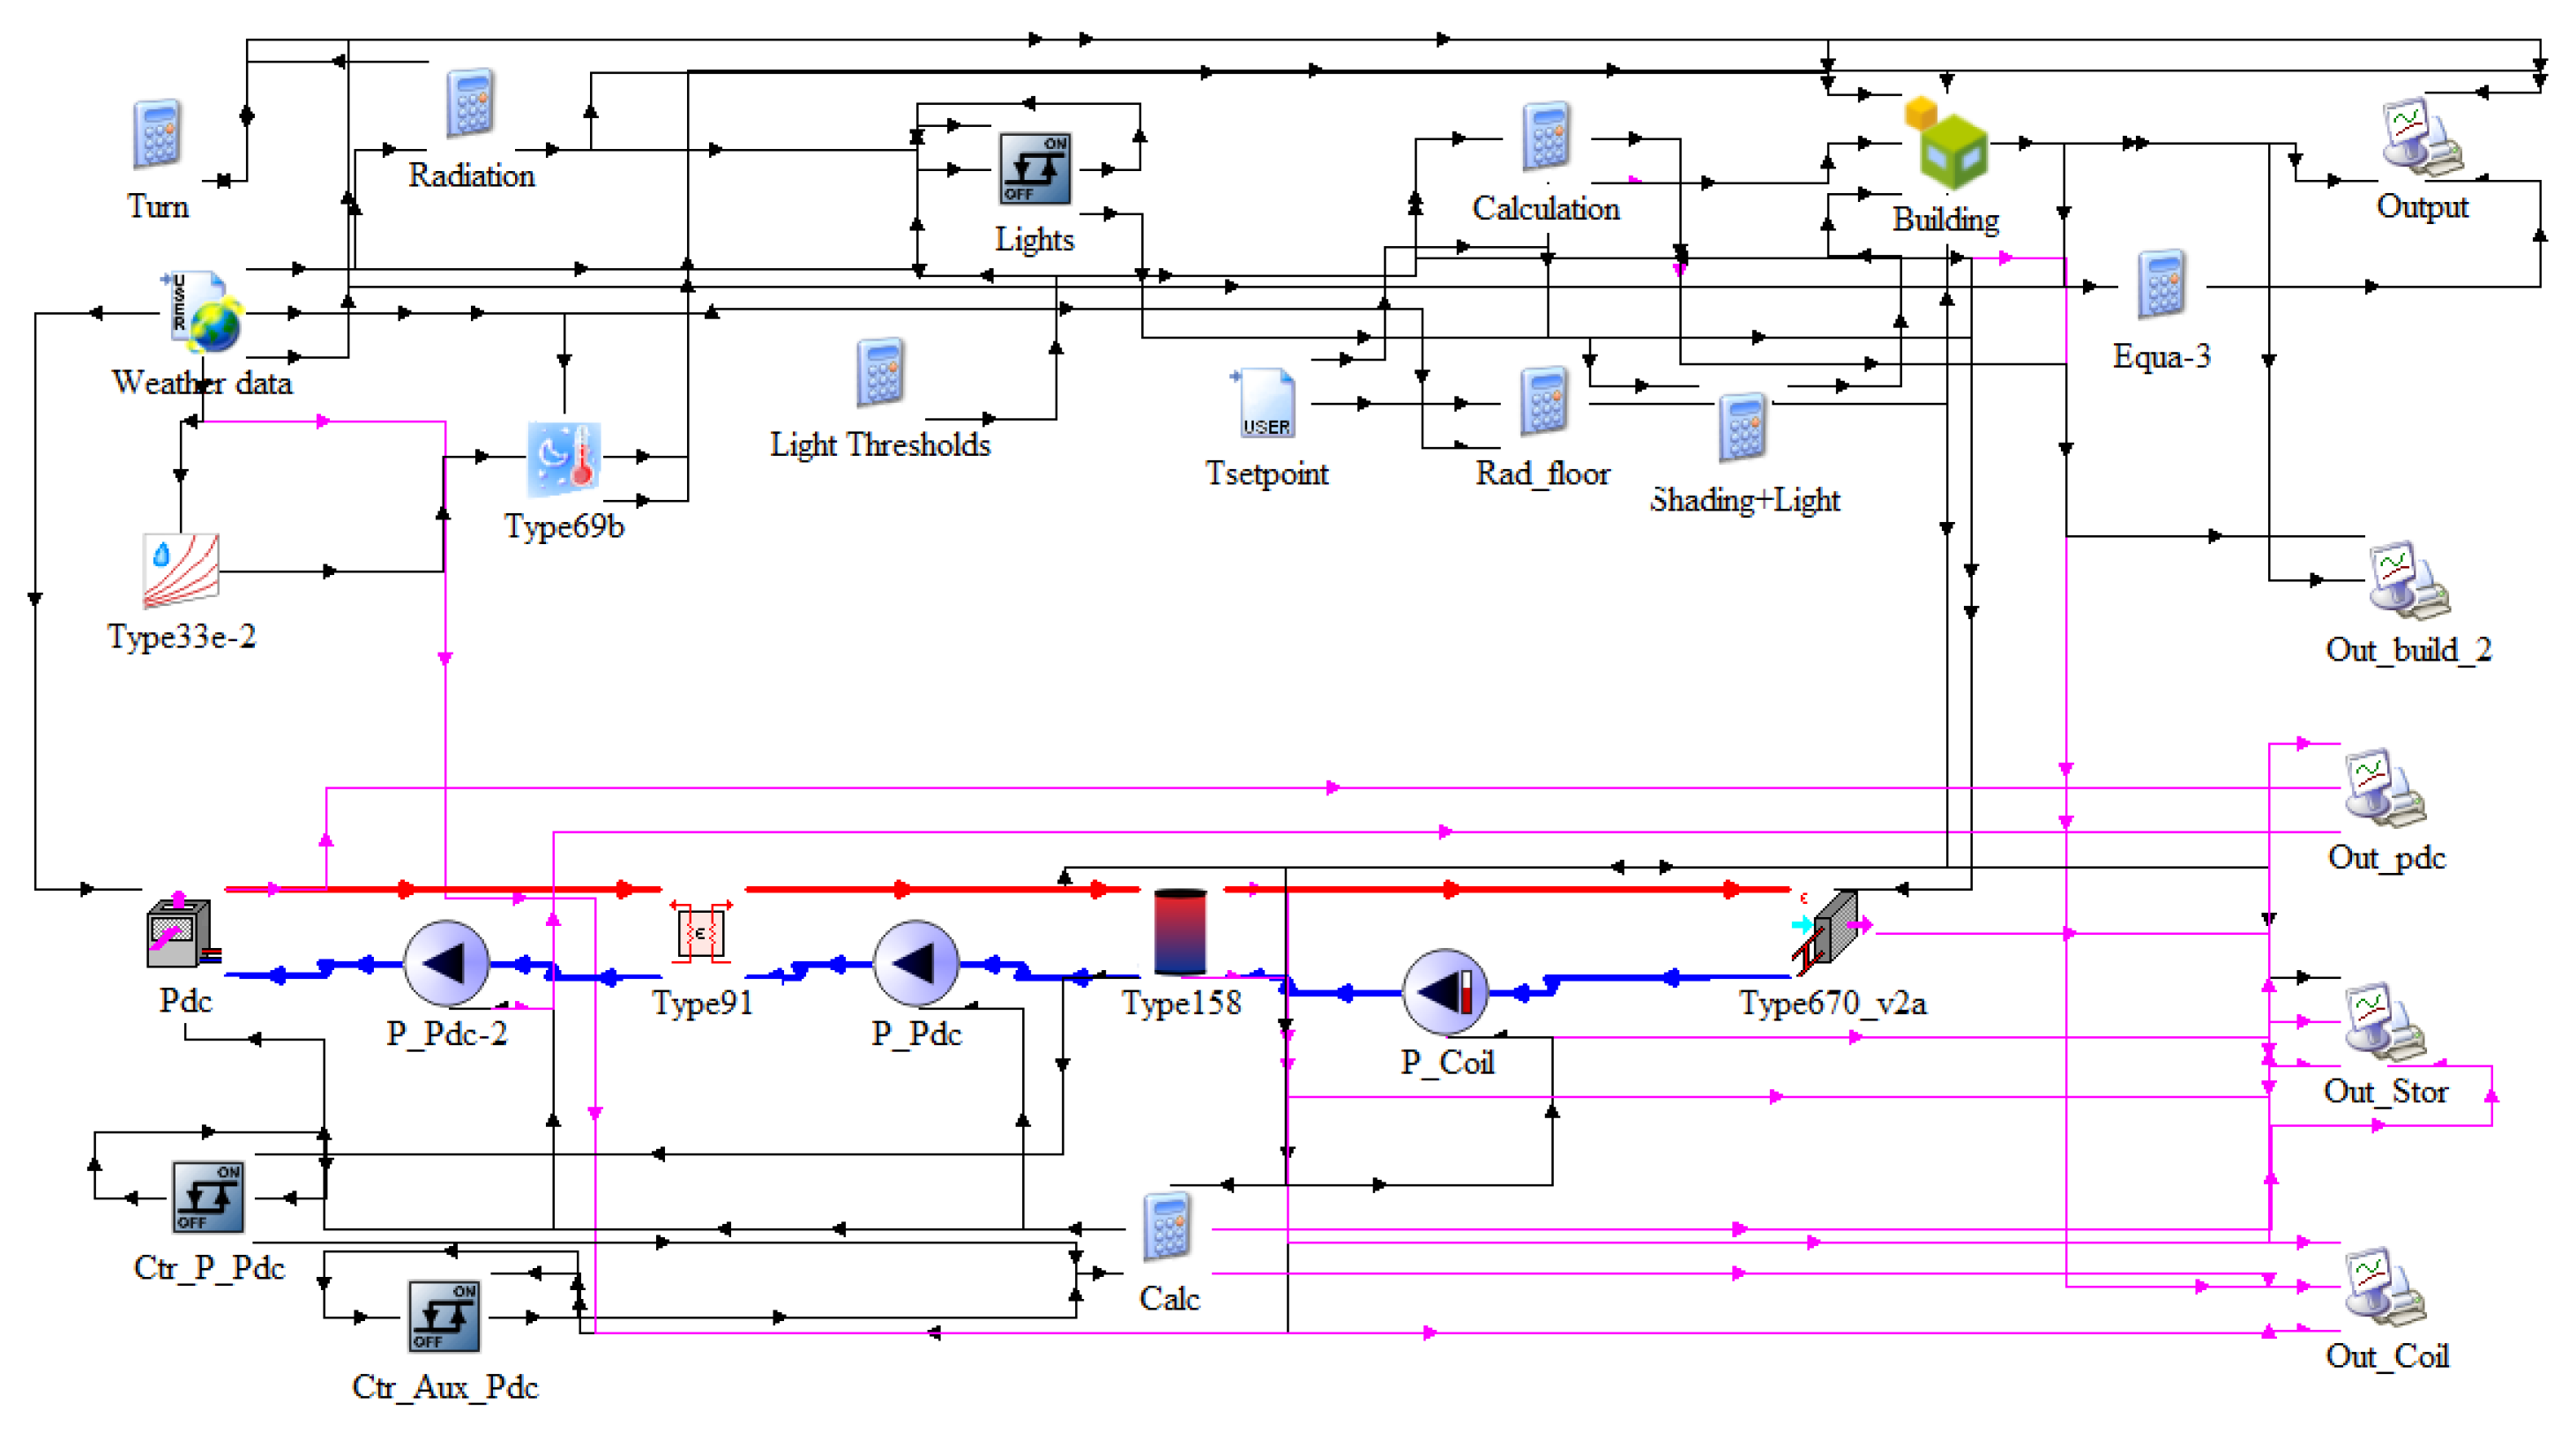
- The satisfaction of the heating thermal loads was analyzed through dynamic simulation in Trnsys® of the condensing radiant tubes system (data relating to the extension and positioning of the radiant tubes were provided by [20]);
- A dynamic study was also conducted with respect to the air/water heat pump coupled to air heaters placed in the building in order to quantify the possible advantages of one or the other system when some parameters vary.
- the climate;
- the size of the heat pump;
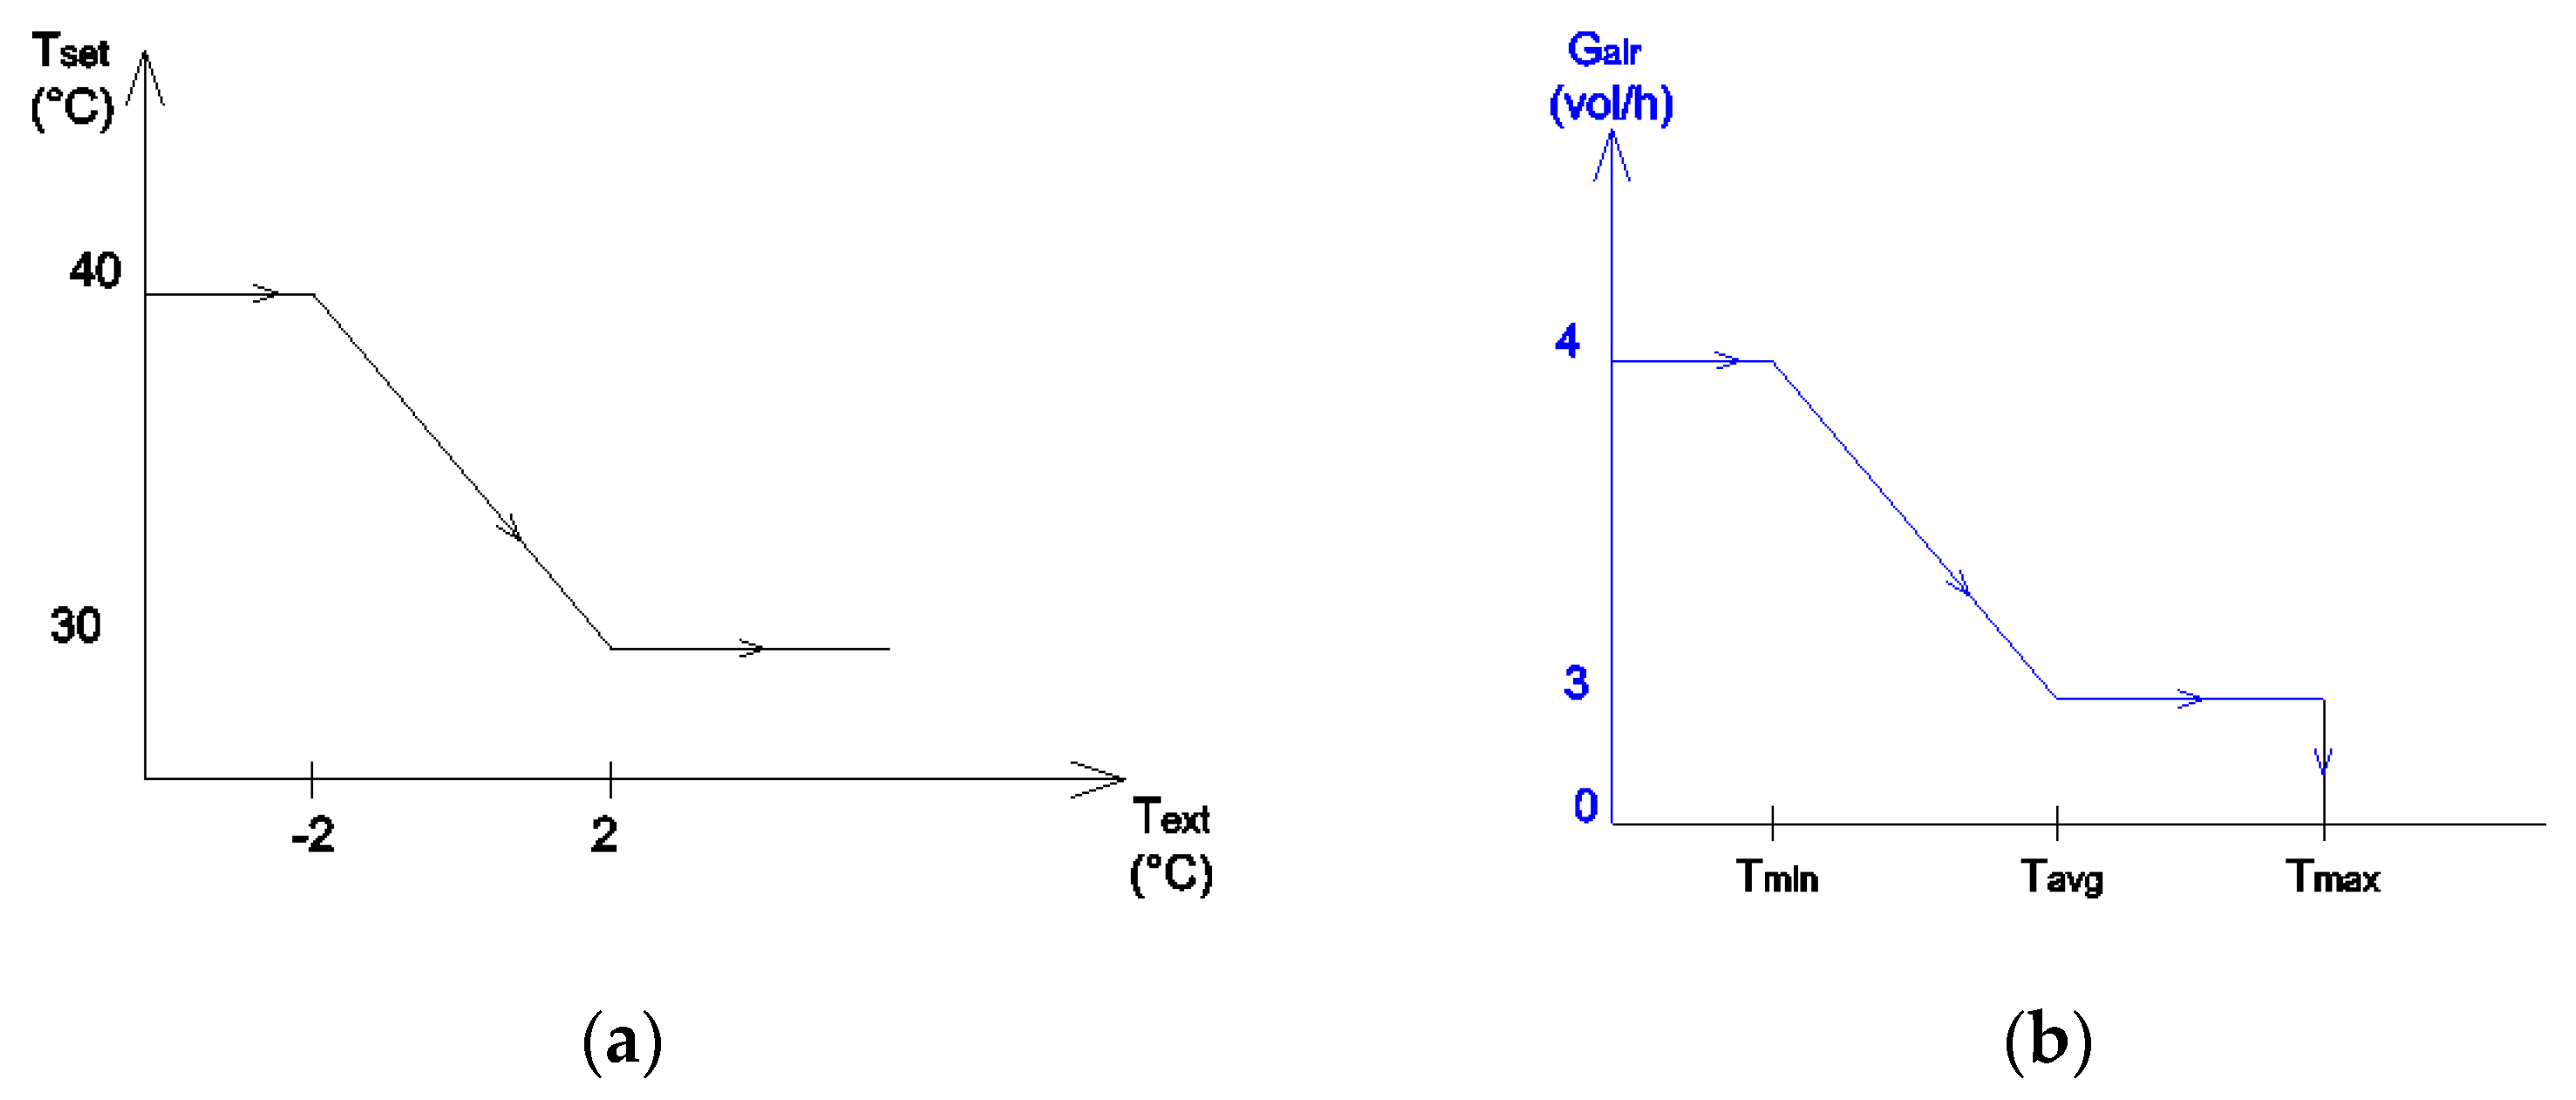
- the temperature of the hot water produced and the performance of the heat pump as a function of the external air temperature;
- the peak power of the photovoltaic system with monocrystalline silicon panels installed on the roof of the shed;
- PEnren,tot (annual total non-renewable primary energy consumed). This is given by the natural gas consumed by the radiant tubes for the CRT system, and by the non-renewable share of the electricity imported from the grid in the case of the HP-Air system, calculated using, respectively, the conversion factors into non-renewable primary energy fp,nren,NG and fp,nren,el reported in Section 2.3.
- PESnren,tot (annual savings of total non-renewable primary energy of the CRT system compared to the HP-Air heating system). A positive value of this index indicates an actual saving of the CRT system compared to HP-Air, and vice versa, a negative value indicates a greater advantage of the heat pump system.
- Specific CO2 emissions: annual emissions per square meter of floor area of the building emitted during the operation of the system.
- Renewable Quota (Quota Rinnovabile in Italian, QR): in the case of the HP-Air system, the share of energy from renewable sources. It is defined as the ratio between the annual quantities of primary energy as follows:
- a.
- In the numerator, the sum over all the services considered of the renewable primary energy used (renewable primary energy delivered or produced on-site), calculated using the conversion factors into renewable primary energy (fp,ren) for each energy vector delivered/produced on-site (electricity from the grid, electricity from the photovoltaic system, thermal energy from the external environment; see Table 5);
- b.
- In the denominator, the sum over all the services considered of the total primary energy used (renewable + non-renewable) (total primary energy delivered/produced on-site, calculated using the conversion factors into total primary energy (fp,tot = fp,ren + fp,nren) for each energy vector delivered/produced on-site, see Table 5).
- 5.
- NPW (Net Present Worth: an index which takes into account, given the interest rate i and the time period of the economic analysis n, both the investment costs (CAPital EXpenditure, CAPEX) and the operating costs (OPerative EXpenditure, OPEX)):where (P⁄A,i,n) = ((1 + i)n − 1)/(i∙(1 + i)n) is the discount factor of a series of annual payments.NPW = CAPEX + OPEX∙(P⁄A,i,n)
- 6.
- DPP (Discounted Payback Period: an index which takes into account, given the fixed interest rate i and the time period of the economic analysis n, the time necessary for the annual cash flows to set the NPW to zero. It is the time necessary to compensate, through the possible annual savings S that the HP-Air system allows compared to the CRT system, for the initial extra investment P of the former compared to the latter. The DPP is calculated using the following formula:
2.2. Industrial Building Modeling
2.3. CRT and HP-Air Systems Modeling
3. Results and Discussion
- 0 kWp (no PV installed);
- 250 kWp (occupation of approximately half of the available roof surface equal to approximately 7800 m2, considering appropriate spacing between the rows of panels to avoid mutual shading)
- 500 kWp (substantial saturation of the available roof surface)
3.1. Energy Analysis
- Figure 8: Total non-renewable primary energy consumed annually by the CRT and HP-Air systems (PEnren,tot) in the two climate zones and for the two types of building. The main result is that the condensing radiant tubes system allows for a lower annual consumption than the system with heat pump and air heater units (case without photovoltaic system, PV = 0 kWp). In relative terms, the advantage of the CRT system in terms of non-renewable primary energy consumption increases from climate zone E to F of the order of 3% (case without PV) to 20% (case with 500 kWp PV), and from the least insulated building to the most insulated one.The reasons are to be found in the following aspects:
- –
- a greater incidence of heat losses from the building in areas with colder climates in the case of air heating systems compared to radiant ones. This is due to the higher operating temperature in the CRT case compared to HP-Air due to the operating principle of the two heating systems;
- –
- a lower COP of the heat pump in colder climates.
- Figure 9: Specific CO2 emissions in the two climate zones and for the two types of buildings. In the base case (without PV), the CRT system allows for lower emissions than the HP-Air, especially in the case of more insulated buildings. The installation of a 250 kWp photovoltaic system, and even more so of a 500 kWp system, allows for lower emissions than the solution with a heat pump, thanks to the reduction in electricity consumption from the grid.
- Figure 10: Total non-renewable primary energy consumed monthly by the CRT and HP-Air systems in the two climatic zones, in the case of both the least and the most insulated building (Table 2). What was already highlighted in the previous point is confirmed—the presence of the photovoltaic system allows a lower consumption of non-renewable primary energy of the HP-Air system, which otherwise performs worse than the radiant tubes system. In particular, the primary energy savings allowed by the CRT are greater in the coldest months, when the HP-Air system has a more penalized performance (for the same reasons mentioned above).
- Figure 11: The figure summarizes the annual total non-renewable primary energy savings (PES) and CO2 emission savings of the CRT system compared to the HP-Air one. The highest PES (17.9%) is in the case of zone F and a new building, while an existing building in zone E still produces significant savings in primary energy (8.9%). The savings become negative (that is, the system with the heat pump and the air heaters consumes less primary energy) when the photovoltaic system is installed. Similar considerations can be made in relation to the savings in CO2 emissions.
3.2. Economic Analysis
3.3. Economic Sensitivity Analysis
3.4. Case of Differentiated Zones Heating
4. Conclusions
- the condensing radiant tubes system allows for a lower annual consumption of non-renewable primary energy than the heat pump and air heaters system when no photovoltaic system is installed. The advantage of the CRT system increases from climate zone E to F and from the least insulated building to the most insulated, with values between 9% and 18%. These values are surely precautionary as they can be significantly higher (even double) due to the high stratification of the air caused by air heating systems in environments of significant heights, such as industrial buildings;
- only the presence of the photovoltaic system allows for a lower consumption of non-renewable primary energy of the HP-Air, which otherwise performs worse than the CRT system;
- in the base case (without photovoltaic), the CRT system allows lower CO2 emissions than the HP-Air, especially in the case of a more insulated building (emission savings between 5% and 28%);
- in the base case, the HP-Air solution is unable to satisfy the 60% value of the renewable quota, with values well below 50%. The 60% renewable quota is exceeded only if adequate photovoltaic power is installed and to a greater extent in the case of a more insulated building;
- the economic analysis reveals that the CRT system is significantly more advantageous in almost all the cases analyzed: the NPW is much higher than the HP-Air system. The installation of the photovoltaic field, although determining an initial outlay of the HP-Air solution that is decidedly higher than the base case, allows the heat pump + air heater system to be more advantageous only in very few of the cases considered (in particular: 250 kWp PV system, natural gas cost 1.5 € Sm−3, electricity cost 0.3 kWh−1). In all other cases the CRT system is more advantageous;
- the increase in the cost of electricity from the grid makes the CRT solution even more advantageous than HP-Air. The presence of the 250 kWp PV system mitigates this advantage;
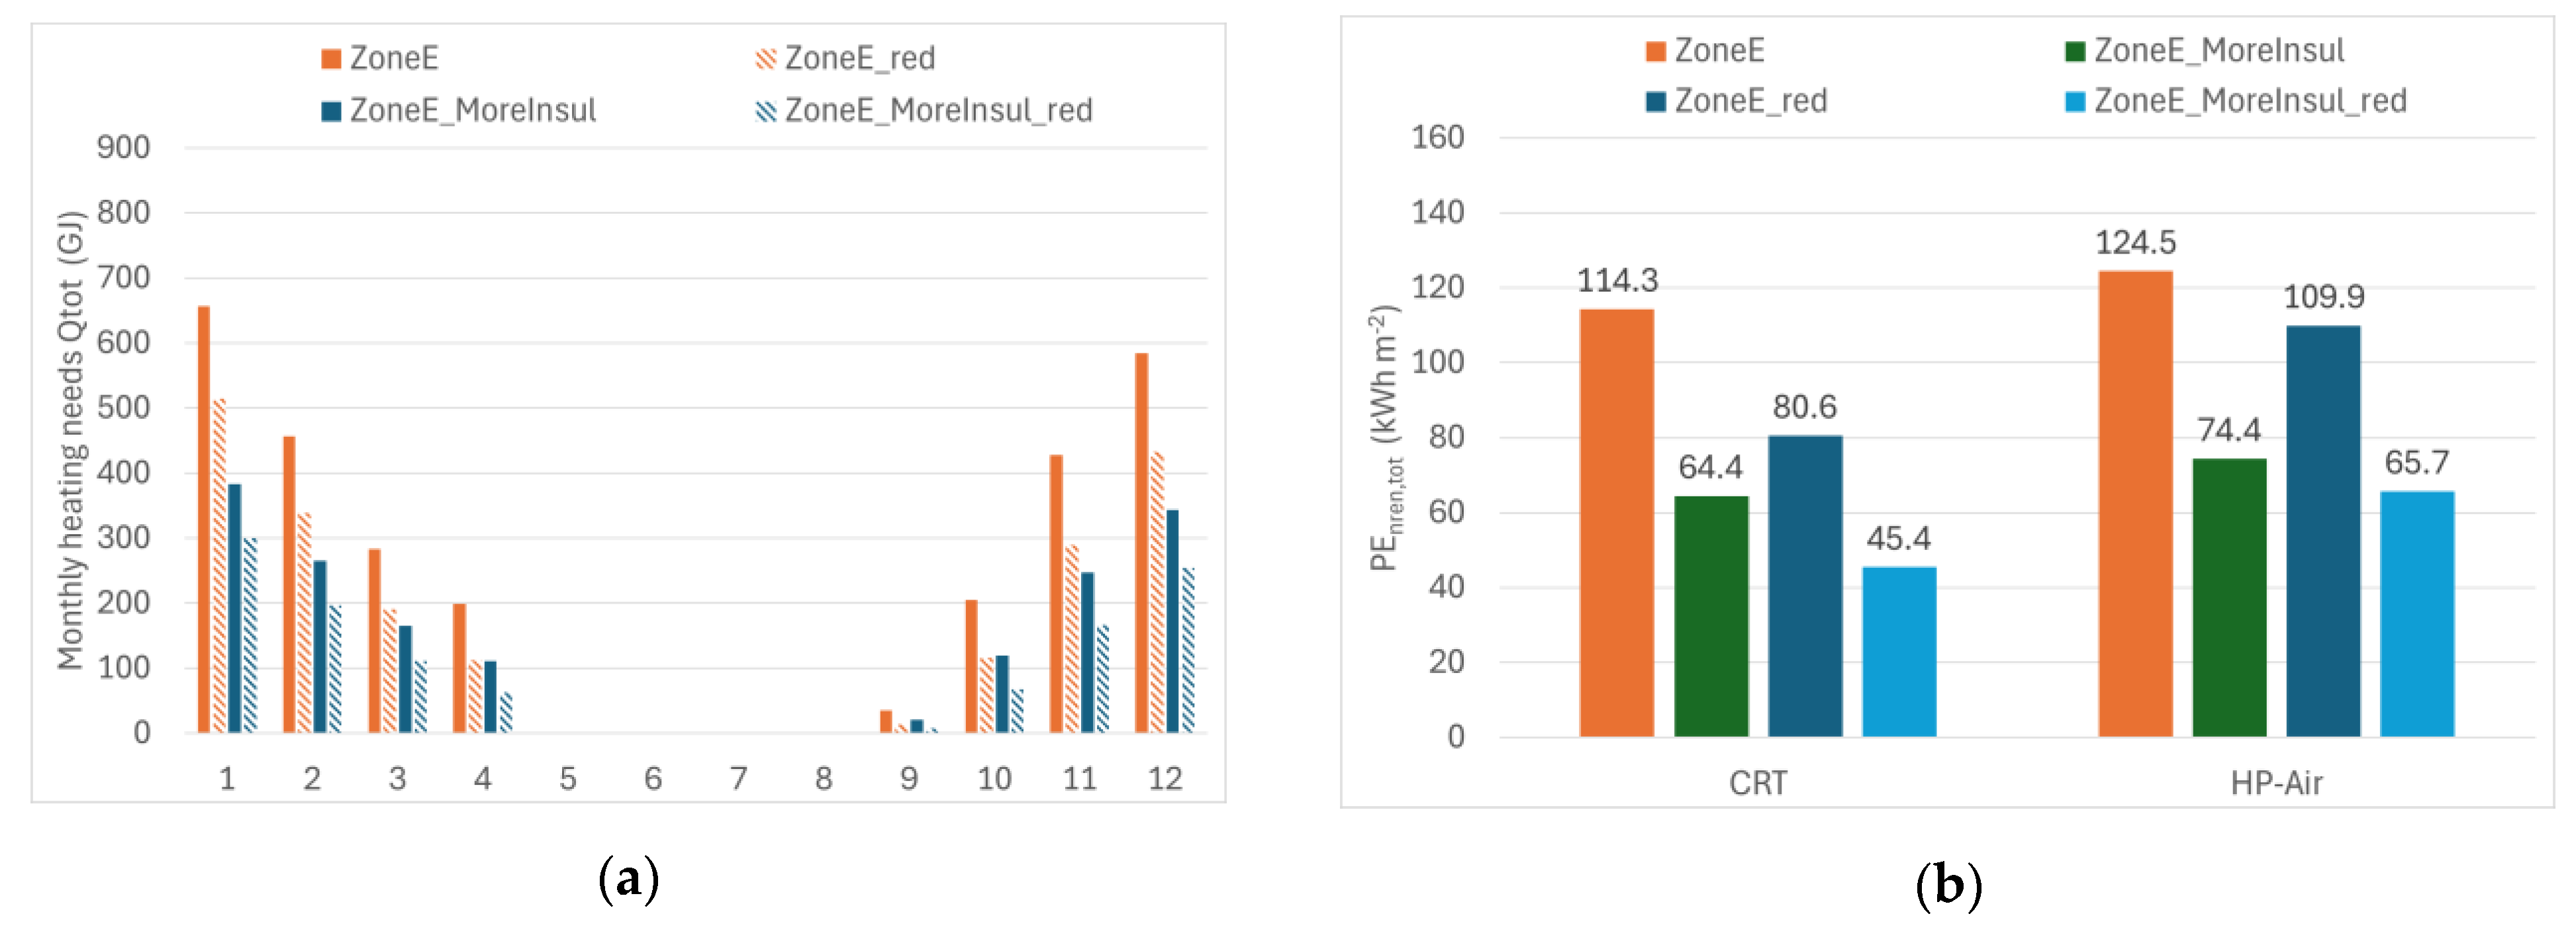
- the CRT system is much better suited, compared to HP-Air, to use with differentiated heating set points based on the real use of the building area. The savings of non-renewable primary energy and CO2 emissions increase significantly (up to 4–5 times in the best case).
Funding
Data Availability Statement
Acknowledgments
Conflicts of Interest
Nomenclature
| Symbol | Meaning | Unit |
| COP | Coefficient of performance | - |
| DPP | Discounted payback period | y |
| fp | Primary energy factor | - |
| i | Interest rate | - |
| n | Period of the analysis | y |
| NPW | Net present worth | € |
| PE | Primary energy | kWh, J |
| PES | Primary energy saving | - |
| QR | Renewable quota | - |
| Subscript | Meaning | |
| el | Electricity from the grid | |
| nren | Non-renewable | |
| ren | Renewable | |
| tot | Total | |
| Acronym | Meaning | Unit |
| CAPEX | Capital expenditure | € |
| CRT | Condensing radiant tubes | - |
| EU | European Union | - |
| HP | Heat pump | - |
| HP-Air | Heat pump coupled to air heater unit | - |
| HVAC | Heating, ventilation, air conditioning | - |
| NG | Natural gas | - |
| nZEB | Nearly zero energy building | - |
| OPEX | Operative expenses | € |
| PV | Photovoltaic | |
| PV-T | Photovoltaic-Thermal | |
| RED | Renewable energy directive |
References
- U.S. Energy Information Administration (2023); Energy Institute—Statistical Review of World Energy (2024)—With Major Processing by Our World in Data. Available online: https://www.energyinst.org/statistical-review (accessed on 6 September 2024).
- Du, S.S.; Cui, Y.; Sun, Q.H.; Deng, Y.; Zhang, W.W. Performance analysis of ground source heat pump systems for constant temperature and humidity air conditioning in industrial buildings: A case study. IOP Conf. Ser. Earth Environ. Sci. 2024, 1372, 012020. [Google Scholar] [CrossRef]
- Raimundo, A.M.; Oliveira, A.V.M. Assessing the Impact of Climate Changes, Building Characteristics, and HVAC Control on Energy Requirements under a Mediterranean Climate. Energies 2024, 17, 2362. [Google Scholar] [CrossRef]
- Wang, M.; Hu, E.; Chen, L. TRNSYS Simulation of a Bi-Functional Solar-Thermal-Energy-Storage-Assisted Heat Pump System. Energies 2024, 17, 3376. [Google Scholar] [CrossRef]
- European Union. Regulation (EU) 2021/1119 of the European Parliament and of the Council of 30 June 2021 Establishing the Framework for Achieving Climate Neutrality and Amending Regulations (EC) No 401/2009 and (EU) 2018/1999 (‘European Climate Law’). Available online: https://eur-lex.europa.eu/legal-content/EN/TXT/HTML/?uri=CELEX:32021R1119 (accessed on 6 September 2024).
- European Union. Directive (EU) 2024/1275 of the European Parliament and of the Council of 24 April 2024 on the Energy Performance of Buildings (Recast). Available online: https://eur-lex.europa.eu/legal-content/EN/TXT/HTML/?uri=OJ:L_202401275 (accessed on 6 September 2024).
- European Union. Directive (EU) 2023/1791 of the European Parliament and of the Council of 13 September 2023 on Energy Efficiency and Amending Regulation (EU) 2023/955 (Recast). Available online: https://eur-lex.europa.eu/legal-content/EN/TXT/HTML/?uri=CELEX:32023L1791 (accessed on 6 September 2024).
- European Union. Directive (EU) 2023/2413 of the European Parliament and of the Council of 18 October 2023 Amending Directive (EU) 2018/2001, Regulation (EU) 2018/1999 and Directive 98/70/EC as Regards the Promotion of Energy from Renewable Sources, and Repealing Council Directive (EU) 2015/652. Available online: https://eur-lex.europa.eu/legal-content/EN/TXT/HTML/?uri=OJ:L_202302413 (accessed on 6 September 2024).
- European Union. Regulation (EU) 2024/1735 of the European Parliament and of the Council of 13 June 2024 on Establishing a Framework of Measures for Strengthening Europe’s Net-Zero Technology Manufacturing Ecosystem and Amending Regulation (EU) 2018/1724. Available online: https://eur-lex.europa.eu/legal-content/EN/TXT/HTML/?uri=OJ:L_202401735 (accessed on 6 September 2024).
- Noro, M.; Mancin, S.; Cerboni, F. High Efficiency Hybrid Radiant and Heat Pump Heating Plants for Industrial Buildings: An Energy Analysis. Int. J. Heat Technol. 2022, 40, 863–870. [Google Scholar] [CrossRef]
- Bac, U.; Alaloosi, K.A.M.S.; Turhan, C. A comprehensive evaluation of the most suitable HVAC system for an industrial building by using a hybrid building energy simulation and multi criteria decision making framework. J. Build. Eng. 2021, 37, 102153. [Google Scholar] [CrossRef]
- Stamponi, E.; Lattanzi, N.; Giorgini, F.; Serpilli, F.; Montelpare, S.; Moretti, E. Energy analysis, numerical simulations and intervention proposals for a NZEB industrial building: The Loccioni Leaf Lab case study. E3S Web Conf. 2021, 238, 060042020. [Google Scholar] [CrossRef]
- Herrando, M.; Elduque, D.; Javierre, C.; Fueyo, N. Life Cycle Assessment of solar energy systems for the provision of heating, cooling and electricity in buildings: A comparative analysis. Energy Convers. Manag. 2022, 257, 115402. [Google Scholar] [CrossRef]
- Herrando, M.; Coca-Ortegón, A.; Guedea, I.; Fueyo, N. Experimental validation of a solar system based on hybrid photovoltaic-thermal collectors and a reversible heat pump for the energy provision in non-residential buildings. Renew. Sustain. Energy Rev. 2023, 17, 113233. [Google Scholar] [CrossRef]
- Coca-Ortegón, A.; Simón-Allué, R.; Guedea, I.; Brun, G.; Villén, R. Operational performance of trigeneration PVT-assisted HP system. Energy Build. 2023, 296, 113383. [Google Scholar] [CrossRef]
- Winskel, M.; Heptonstall, P.; Gross, R. Reducing heat pump installed costs: Reviewing historic trends and assessing future prospects. Appl. Energy 2024, 375, 124014. [Google Scholar] [CrossRef]
- Lazzarin, R. Intervista Sul Riscaldamento Degli Ambienti Nell’industria (Interview on Space Heating in Industry), 2nd ed.; SGE Editoriali: Padova, Italy, 2022; ISBN 8886281757. (In Italian) [Google Scholar]
- Brunello, P.; De Carli, M.; Polito, A.; Zecchin, R. Comfort criteria and design aspects in high temperature radiant heating. In Proceedings of the Indoor Air 2002, Monterey, CA, USA, 30 June–5 July 2002. [Google Scholar]
- Kim, K.W.; Olesen, B.W. Radiant heating and cooling systems. ASHRAE J. 2015, 57, 28–37. [Google Scholar]
- Noro, M.; Lazzarin, R. Energy analysis of industrial climatization by an innovative radiant condensing system. AIP Conf. Proc. 2019, 2191, 020121. [Google Scholar] [CrossRef]
- Noro, M.; Mancin, S.; Busato, F.; Cerboni, F. Innovative Hybrid Condensing Radiant System for Industrial Heating: An Energy and Economic Analysis. Sustainability 2023, 15, 3037. [Google Scholar] [CrossRef]
- Italian Government. DECRETO LEGISLATIVO 3 Marzo 2011, n. 28 Attuazione della Direttiva 2009/28/CE Sulla Promozione Dell’uso Dell’energia da Fonti Rinnovabili, Recante Modifica e Successiva Abrogazione delle Direttive 2001/77/CE e 2003/30/CE. (In Italian). Available online: https://www.gazzettaufficiale.it/eli/gu/2011/03/28/71/so/81/sg/pdf (accessed on 9 September 2024).
- Italian Economic Development Ministry. Decreto Interministeriale 26 Giugno 2015—Adeguamento Linee Guida Nazionali per la Certificazione Energetica Degli Edifici. (In Italian). Available online: https://www.mimit.gov.it/it/normativa/decreti-interministeriali/decreto-interministeriale-26-giugno-2015-adeguamento-linee-guida-nazionali-per-la-certificazione-energetica-degli-edifici (accessed on 9 September 2024).
- UNI/TS 11300-5:2016; Prestazioni Energetiche Degli Edifici—Parte 5: Calcolo Dell’energia Primaria e Della Quota di Energia da Fonti Rinnovabili. Italian Standard Organization: Milan, Italy, 2016. (In Italian)
- Italian Government. DECRETO LEGISLATIVO 8 Novembre 2021, n. 199 Attuazione della Direttiva (UE) 2018/2001 del Parlamento Europeo e del Consiglio, Dell’11 Dicembre 2018, Sulla Promozione Dell’uso Dell’energia da Fonti Rinnovabili. (In Italian). Available online: https://www.gazzettaufficiale.it/eli/id/2021/11/30/21G00214/sg (accessed on 9 September 2024).
- European Union. Directive (EU) 2018/2002 of the European Parliament and of the Council of 11 December 2018 Amending Directive 2012/27/EU on Energy Efficiency. Available online: https://eur-lex.europa.eu/legal-content/EN/TXT/?uri=uriserv%3AOJ.L_.2018.328.01.0210.01.ENG (accessed on 6 September 2024).
- Italian Government. Decreto del Presidente Della Repubblica 26 Agosto 1993, n. 412 Regolamento Recante Norme per la Progettazione, L’installazione, L’esercizio e la Manutenzione degli Impianti Termici Degli Edifici ai Fini del Contenimento dei Consumi di Energia, in Attuazione Dell’art. 4, Comma 4, Della Legge 9 Gennaio 1991, n. 10. (In Italian). Available online: https://www.gazzettaufficiale.it/eli/id/1993/10/14/093G0451/sg (accessed on 9 September 2024).
- ASSOTERMICA. Impianti Termici. Concetti Innovativi Dalla Normativa Vigente. Linee Guida per il Rinnovo Degli Impianti Esistenti, la Realizzazione di Nuovi Impianti e la Scelta dei Componenti, 2001. (Thermal Systems. Innovative Concepts from Current Legislation. Guidelines for the Renovation of Existing Systems, the Construction of New Systems and the Choice of Components, In Italian). Available online: http://www.cornaviera.it/public/DOCUMENTI/normativa_tecnica/impianti_termici1.pdf (accessed on 6 September 2024).
- Brunello, P.; De Carli, M.; Magagnin, P.; Polito, A.; Zecchin, R. Riscaldamento Radiante a Gas in Ambienti Industriali: Fenomenologia, Progettazione, Verifica (Radiant Gas Heating in Industrial Environments: Phenomenology, Design, Verification, in Italian). In Proceedings of the AiCARR Conference “Progettare L’involucro Edilizio: Correlazioni Trail Sistema Edificio e i Sistemi Impiantistici” (Designing the Building Envelope: Correlations between the Building System and the Plant Systems, in Italian), Bologna, Italy, 18 October 2001; pp. 183–204. [Google Scholar]
- Caputo, A.C.; Pelagagge, P.M. Upgrading mixed ventilation systems in industrial conditioning. Appl. Therm. Eng. 2009, 29, 3204–3211. [Google Scholar] [CrossRef]
- Chinese, D.; Nardin, G.; Saro, O. Multi-criteria analysis for the selection of space heating systems in an industrial building. Energy 2011, 36, 556–565. [Google Scholar] [CrossRef]
- De Carli, M.; Polito, A. Radiant air conditioning systems. In Proceedings of the AiCARR Conference “Riduzione dei Fabbisogni, Recupero di Efficienza e Fonti Rinnovabili per il Risparmio Energetico Nel Settore Industriale” (Reduction of Requirements, Recovery of Efficiency and Renewable Sources for Energy Saving in the Industrial Sector, in Italian), Padova, Italy, 17 June 2010; pp. 43–80. [Google Scholar]
- Noro, M.; Mancin, S.; Calati, M. Energy performance of water strip modules for industrial heating in real operation conditions: Steady-state and CFD analyses. Sustain. Environ. 2023, 9, 2236844. [Google Scholar] [CrossRef]





| Climatic Zone | E | F |
|---|---|---|
| Type of building use | E.8 Building for industrial activity | |
| Resort (Province–State) | Manta (Cuneo–Italy) | Agordo (Belluno–Italy) |
| Altitude a.s.l. | 400 | 610 |
| Latitude North | 44°36′ | 46°17′ |
| Longitude East | 7°29′ | 12°00′ |
| Degree days | 2814 | 3376 |
| Design external air temperature | −9.3 °C | −12 °C |
| Parameter (Unit) | Base Building | Most Insulated Building |
|---|---|---|
| Thermal transmittance (W m−2 K−1) | ||
| External wall | 0.389 | 0.136 |
| Door | 3.50 | 2.50 |
| Main door | 3.50 | 2.50 |
| Wall facing offices | 2.954 | 2.954 |
| Base facing wall | 3.220 | 3.220 |
| Floor facing ground | 0.128 | 0.128 |
| Ceiling | 4.086 | 1.754 |
| Ceiling shed | 0.208 | 0.062 |
| Window | 5.0 | 5.0 |
| Thermal bridge wall–floor facing ground (W m−1 K−1) | 0.353 | 0.25 |
| Thermal bridge wall–ceiling (W m−1 K−1) | 0.262 | 0.15 |
| Thermal Zone 1 | Thermal Zone 2 | |
|---|---|---|
| Floor area (m2) | 7119 | 716.5 |
| Net height (m) | 8.24 | 8.22 |
| Indoor air temp. (°C) | 18 | 18 |
| Net volume (m3) | 58669 | 5886.2 |
| Presence of people | 40 | 8 |
| Operation heating plant scheduling | from 6.00 am to 6.00 pm | |
| Presence of people and lighting scheduling + heating gain fixed at 5 W m−2 | from 8.00 am to 6.00 pm | |
| Degree of activity | 2 met | |
| Degree of clothing | 1 clo | |
| Air infiltration | 0.5 vol h−1 | |
| Tw,out = 45 °C | Tw,out = 50 °C | Tw,out = 55 °C | COP at Tw,out (°C) | |||||||
|---|---|---|---|---|---|---|---|---|---|---|
| TDB (°C) | TWB (°C) | kWt | kWe | kWt | kWe | kWt | kWe | 45 | 50 | 55 |
| −7 | −8 | 484 | 185 | 495 | 209 | 515 | 230 | 2.62 | 2.37 | 2.24 |
| −5 | −6 | 509 | 186 | 510 | 210 | 530 | 232 | 2.74 | 2.43 | 2.28 |
| 0 | −1 | 575 | 189 | 573 | 212 | 571 | 238 | 3.04 | 2.70 | 2.40 |
| 2 | 1 | 604 | 190 | 600 | 213 | 597 | 238 | 3.18 | 2.82 | 2.51 |
| 7 | 6 | 684 | 194 | 676 | 216 | 669 | 241 | 3.53 | 3.13 | 2.78 |
| 12 | 11 | 757 | 198 | 746 | 219 | 736 | 243 | 3.82 | 3.41 | 3.03 |
| Symbol (Meaning) | Value |
| fp,nren,NG (Non-renewable primary energy conversion factor for natural gas) | 1.05 |
| fp,nren,el (Non-renewable primary energy conversion factor for electricity from the grid) | 1.95 |
| fp,ren,el (Renewable primary energy conversion factor for electricity from the grid) | 0.47 |
| fp,ren,PV (Renewable primary energy conversion factor for electricity from the PV field) | 1 |
| fp,ren,heat_source_HP (Renewable primary energy conversion factor for external air thermal energy) | 1 |
| QR (Minimum renewable ratio for new buildings) | 60% |
| PV (kWp) (Peak power of the PV field) | 0–250–500 |
| PV (ηnom) (Peak efficiency of the PV field) | 16.0% |
| PV (m2 kWp−1) (Specific area of the PV field) | 6.3 |
| Specific CO2 emission factor (kgCO2 kWh−1) | |
| Electric energy from grid | 0.26 |
| NG | 0.2 |
| NG cost (€ Sm−3) | 1.00 |
| Electricity from the grid cost (€ kWh−1) | 0.30 |
| Electricity exported value (€ kWh−1) | 0.10 |
| CRT investment cost (k€) | 200 |
| HP-Air investment cost (k€) | 550 |
| PV investment cost (€ Wp−1) | 1.0 |
| Interest rate i | 2.0% |
| Period of the economic analysis n (y) | 15 |
| CAPEX (k€) | OPEX (k€) | |||||||||
|---|---|---|---|---|---|---|---|---|---|---|
| Plant | PV | Total | Electr. from the Grid | Electr. Exported | NG | Total | NPW (k€) | DPP (y) | ||
| PV = 0 kWp | ||||||||||
| Zone E | CRT | −200 | −200 | −85.317 | −85.317 | −1296 | - | |||
| HP-Air | −550 | 0 | −550 | −141.237 | 0 | −141.237 | −2365 | |||
| Zone E More Insulated | CRT | −200 | −200 | −48.093 | −48.093 | −818 | - | |||
| HP-Air | −550 | 0 | −550 | −81.610 | 0 | −81.610 | −1599 | |||
| Zone F | CRT | −200 | −200 | −-98.505 | −98.505 | −1466 | - | |||
| HP-Air | −550 | 0 | −550 | −167.427 | 0 | −167.427 | −2701 | |||
| Zone F More Insulated | CRT | −200 | −200 | −55.803 | −55.803 | −917 | - | |||
| HP-Air | −550 | 0 | −550 | −97.289 | 0 | −97.289 | −1800 | |||
| PV = 250 kWp | ||||||||||
| Zone E | CRT | −200 | −200 | −85.317 | −85.317 | −1296 | >25 | |||
| HP-Air | −550 | −250 | −800 | −90.152 | 17.301 | −72.852 | −1486 | |||
| Zone E More Insulated | CRT | −200 | −200 | −48.093 | −48.093 | −818 | >25 | |||
| HP-Air | −550 | −250 | −800 | −38.149 | 19.842 | −18.307 | −785 | |||
| Zone F | CRT | −200 | −200 | −98.505 | −98.505 | −1466 | - | |||
| HP-Air | −550 | −250 | −800 | −123.958 | 13.010 | −110.948 | −1976 | |||
| Zone F More Insulated | CRT | −200 | −200 | −55.803 | −55.803 | −917 | >25 | |||
| HP-Air | −550 | −250 | −800 | −57.480 | 14.230 | −43.251 | −1106 | |||
| PV = 500 kWp | ||||||||||
| Zone E | CRT | −200 | −200 | −85.317 | −85.317 | −1296 | 14.7 | |||
| HP-Air | −550 | −500 | −1050 | −59.396 | 41.377 | −18.019 | −782 | |||
| Zone E More Insulated | CRT | −200 | −200 | −48.093 | −48.093 | −818 | 12.1 | |||
| HP-Air | −550 | −500 | −1050 | −14.309 | 46.224 | 31.915 | −140 | |||
| Zone F | CRT | −200 | −200 | −98.505 | −98.505 | −1466 | >25 | |||
| HP-Air | −550 | −500 | −1050 | −89.856 | 29.142 | −60.714 | −1330 | |||
| Zone F More Insulated | CRT | −200 | −200 | −55.803 | −55.803 | −917 | 19.0 | |||
| HP-Air | −550 | −500 | −1050 | −36.380 | 34.696 | −1.684 | −572 | |||
Disclaimer/Publisher’s Note: The statements, opinions and data contained in all publications are solely those of the individual author(s) and contributor(s) and not of MDPI and/or the editor(s). MDPI and/or the editor(s) disclaim responsibility for any injury to people or property resulting from any ideas, methods, instructions or products referred to in the content. |
© 2024 by the author. Licensee MDPI, Basel, Switzerland. This article is an open access article distributed under the terms and conditions of the Creative Commons Attribution (CC BY) license (https://creativecommons.org/licenses/by/4.0/).
Share and Cite
Noro, M. Heating Industrial Buildings with Heat Pump Air Systems: Is It Always the Most Advantageous Option? Energies 2024, 17, 5209. https://doi.org/10.3390/en17205209
Noro M. Heating Industrial Buildings with Heat Pump Air Systems: Is It Always the Most Advantageous Option? Energies. 2024; 17(20):5209. https://doi.org/10.3390/en17205209
Chicago/Turabian StyleNoro, Marco. 2024. "Heating Industrial Buildings with Heat Pump Air Systems: Is It Always the Most Advantageous Option?" Energies 17, no. 20: 5209. https://doi.org/10.3390/en17205209
APA StyleNoro, M. (2024). Heating Industrial Buildings with Heat Pump Air Systems: Is It Always the Most Advantageous Option? Energies, 17(20), 5209. https://doi.org/10.3390/en17205209


