Article

Investigation into the Effect of Permeable Boundary Sealing on the Behavior of Hydrate Exploitation via Depressurization Combined with Heat Injection

1
Ganzhou Water Limited Company, Ganzhou 341000, China
2
Key Laboratory of Environmental Pollution Prevention and Control in Mining and Metallurgy, Jiangxi University of Science and Technology, Ganzhou 341000, China
3
Key Laboratory of Drilling and Exploitation Technology in Complex Conditions, College of Construction Engineering, Jilin University, Changchun 130026, China
*
Author to whom correspondence should be addressed.
Energies 2024, 17(20), 5172; https://doi.org/10.3390/en17205172
Submission received: 10 September 2024 / Revised: 6 October 2024 / Accepted: 15 October 2024 / Published: 17 October 2024
(This article belongs to the Section H: Geo-Energy)

Abstract

:
Depressurization combined with heat (mainly hot water) injection is an important technique for exploiting natural gas hydrate (NGH). To overcome the problems of pore water intrusion and hot water energy loss in the technique, this paper employs a method of setting sealing boundaries in permeable overburden and underburden to exploit NGH. The influence of the presence of sealing boundaries on NGH exploitation performances was numerically investigated. The results indicate that the sealing boundaries in permeable overburden and underburden can inhibit water intrusion and reduce heat loss, significantly improving the efficiency of hydrate dissociation and gas production. Specifically, the hydrate dissociation and gas production efficiency increased by 22.0–30.1% and 63.9–85.1%, respectively. Moreover, there is an optimal sealing vertical distance within the range of 0–15 m, maximizing the mining efficiency of NGH at the end of production. On the other hand, the presence of sealing boundaries effectively limits the escape range of CH4 in the permeable overburden and underburden, resulting in an increasing gas-to-water ratio and an increasing energy efficiency. These findings provide theoretical and technical support for the mining of NGH by depressurization combined with heat injection.

1. Introduction

Natural gas hydrate (NGH) is an ice-like crystalline compound, also known as combustible ice, which is mainly formed by CH4 and water molecules at high pressures and low temperatures [1]. The carbon content of global NGH is estimated to be more than twice that of proven fossil fuels. The development and utilization of NGH is receiving increasing attention because of its potential to enhance global energy security, diversify energy sources and reduce greenhouse gas emissions [2,3]. Economically, NGH provides a rich source of natural gas that can reduce energy costs. Environmentally, CH4 burns cleaner than coal and oil, producing fewer pollutants and CO2 emissions. Therefore, the development of NGH is a promising way to meet energy needs and mitigate climate change.
The principle of mining NGH is to disturb hydrate phase equilibrium by altering the temperature and pressure of its storage environment. At present, the techniques for exploiting NGH include depressurization, thermal stimulation, CO2 replacement, inhibitor injection, and multiple combined mining techniques, etc., [4,5,6,7,8,9]. Thermal stimulation can effectively decompose NGH, and it can be applied in both marine and permafrost environments. However, a single application of the method results in a huge waste of energy. Using CO2 replacement to exploit NGH can reduce the greenhouse effect due to the fact that CO2 molecules are able to successfully substitute CH4 in cages made up of water molecules. However, the process of injecting CO2 into the formation and ensuring effective CH4 substitution is technically complex. Injecting inhibitors into the formation can be effective in destabilizing hydrates, making it easier for them to break down and release CH4. However, the use of inhibitors can cause environmental problems, especially if they are toxic.
Depressurization is universally recognized as the most cost-effective and simplest hydrate excavation method [10,11]. However, its single application cannot realize the long-term efficient exploitation of NGH. When NGH is only produced by depressurization, the range of the formation temperature reduction area is continuously expanded by the endothermic effect of hydrate decomposition [12]. Furthermore, the temperature reduction phenomenon is more significant due to the gas throttling expansion effect around production wells. Then, the secondary formation of hydrate and icing phenomena will occur around the production well, resulting in the blockage of fluid seepage channels, and ultimately leading to a significant reduction in hydrate mining efficiency [12,13,14]. Fortunately, depressurization combined heat injection (D + Hi, which is a combined mining technique) is proposed. It can supplement the NGH reservoir with a lot of heat and inhibit hydrate secondary formation and ice formation near the production well [15]. Previous studies have shown that the CH4 production rate of D + Hi is about two times higher than that of a single thermal stimulation or depressurization method [11,15,16,17]. Therefore, D + Hi can be regarded as a prospective technique for hydrate extraction. The research results on the gas production capacity of marine NGH under depressurization or D + Hi mining conditions are summarized in Table 1.
Most of the discovered NGH reservoirs are shallowly buried in the seabed, and the overburden and underburden of the reservoirs are mostly permeable [24,25,26]. During the extraction of NGH using D + Hi, the pore water from the permeable overburden and underburden intrudes into the depressurization well (namely the production well), inhibiting the transfer of the pressure drop into the hydrate reservoir. Meanwhile, the hot water from the injection well enters the overburden and underburden, resulting in significant heat loss. Currently, water intrusion and heat loss have been the challenges hindering the efficient exploitation of NGH by D + Hi [27]. Zhong et al. [28], Chen et al. [29], and Li et al. [30] have proposed reservoir hydraulic fracturing to improve the efficiency of NGH exploitation. The fracture network formed after hydraulic fracturing in the NGH reservoir significantly improves the pressure drop transfer rate and creates favorable conditions for hot water diffusion, which in turn increases the hydrate decomposition rate and gas transport rate. However, the fracture network only mitigates the diffusion of hot water into the overburden and underburden to a certain extent. Moreover, it cannot avoid the massive intrusion of pore water from the permeable burdens into the hydrate reservoir and production well. These problems limit the further enhancement of energy efficiency and gas production efficiency during NGH exploitation.
Given this, this paper proposes setting sealing boundaries (which extend from the direction of the injection well to the production well, see Figure 1) in the overburden and underburden to improve the efficiency of hydrate exploitation using D + Hi. The presence of sealing boundaries can directly block the continuous flow of pore water from the overburden and underburden into the hydrate reservoir and production well. Moreover, it can also restrict the continuous flow of hot water into the burdens. Thus, it can be expected that setting sealing boundaries is a hydrate exploitation enhancement method with potential for engineering applications. In this work, we strive to reveal the effect of permeable boundary sealing on the behavior of hydrate exploitation via D + Hi by means of numerical simulation. Specifically, the effects of the presence of sealing boundaries on physical parameter distribution, hydrate dissociation behavior, CH4 production behavior, water production behavior, and energy efficiency were thoroughly studied. Moreover, the influence of vertical distance from the sealing boundaries to the edge of the NGH reservoir (referred to as sealing distance) on NGH exploitation performances was also investigated.

2. Numerical Model and Schemes

2.1. Geological Background

Since 2007, the China Geological Survey (CGS) has implemented many marine exploration programs in the Shenhu area (on the northern slope of the South China Sea), and they have successfully obtained NGH specimens at three stations: SH2, SH3, and SH7. The exploration results show that station SH2 has great potential for hydrate exploitation [31,32], thus well-logging data from SH2 are used in this study. The seabed temperature and pressure of SH2 are 4.84 °C and 12.46 MPa [30], respectively. The gas hydrate layer (GHL) is approximately 229 m below the seafloor [33,34]. Moreover, the GHL has a layer thickness of 0 to 40 m, porosity of 0.33 to 0.48, and hydrate saturation of 26% to 48% [33,34].

2.2. Model Establishment

The geological model for this study is shown in Figure 2. The model extends for a distance of 200 m in the X-direction and 180 m in the Z-direction, and the thickness of the GHL is 40 m. The thickness of overburden and underburden is 70 m. The injection well (Wellinj) is located in the middle of the GHL, while the production wells (Wellpro) are located on both sides of the GHL. To improve computational efficiency, the extension distance of the model in the Y direction is set to 1 m. The whole geological model is divided into 15,939 units (207 in the X-direction, 1 in the Y-direction, and 77 in the Z-direction), including 15,522 active and 417 inactive units. The physical properties of the units at the upper boundary of the overburden and the lower boundary of the underburden are fixed. The physical properties of the well units are also fixed. These units are all inactive. In addition, the dimensions of all wells in the geologic model are 0.2 × 0.2 m.

2.3. Numerical Code and Initial Conditions

The Tough + Hydrate numerical code (T + H) developed by Lawrence Berkeley National Laboratory is adopted in this study. The code is capable of modeling hydrate phase changes, gas–liquid transport, and heat transfer in sediments [35,36]. Furthermore, T + H can accurately characterize the depressurization decomposition mechanism of NGH, the thermally stimulated decomposition mechanism, and the decomposition mechanism in the presence of inhibitors [11,13,16]. In particular, laboratory-scale simulation studies and reservoir-scale simulation studies all demonstrate the feasibility of the code in hydrate exploitation [37,38,39].
The initial conditions of the geological model are identified based on the logging data from station SH2. The geothermal gradient of the hydrate deposit is about 0.05 °C/m [34]. The initial pressure distribution across the NGH reservoir is governed by a hydrostatic pressure gradient [26]. Then, the initial temperature and pressure at the center of GHL are identified, and they are 14.55 MPa and 15.29 °C, respectively. The initial conditions and the parameters of the geological model are shown in Table 2. The intrinsic permeability of sealing boundaries is set to 0 mD. To better reveal the effect of the presence of sealing boundaries on NGH exploitation performances, the hydrate in the reservoir during numerical simulations is assumed to be uniformly distributed and the reservoir is not mechanically deformed in the process of hydrate decomposition.

2.4. Simulation Scenarios

It can be expected that the different vertical distances between sealing boundaries to the edge of GHL will affect the diffusion extent of injected hot water in the NGH reservoir as well as permeable overburden and underburden, leading to an evolution in the behavior of NGH dissociation, CH4 production, and water production. This study set three runs with different sealing distances, and the simulation run without sealing boundaries is also set for comparison (see Table 3). The parameters of GHL as well as the parameters of overburden and underburden in the four runs are the same. The sealing distances of Runs 1–3 are 0 m, 6 m, and 15 m, respectively. The sealing boundaries have not been set in Run 4. In all numerical simulation runs, the water injection temperature and pressure are 40 °C and 20 MPa, respectively. Additionally, to avoid reservoir icing and to improve hydrate exploitation performances, the pressure of Wellpro is set to 4.5 MPa in the NGH extraction process [42].

3. Results and Discussion

3.1. Physical Parameters Distribution

3.1.1. NGH Saturation Distribution

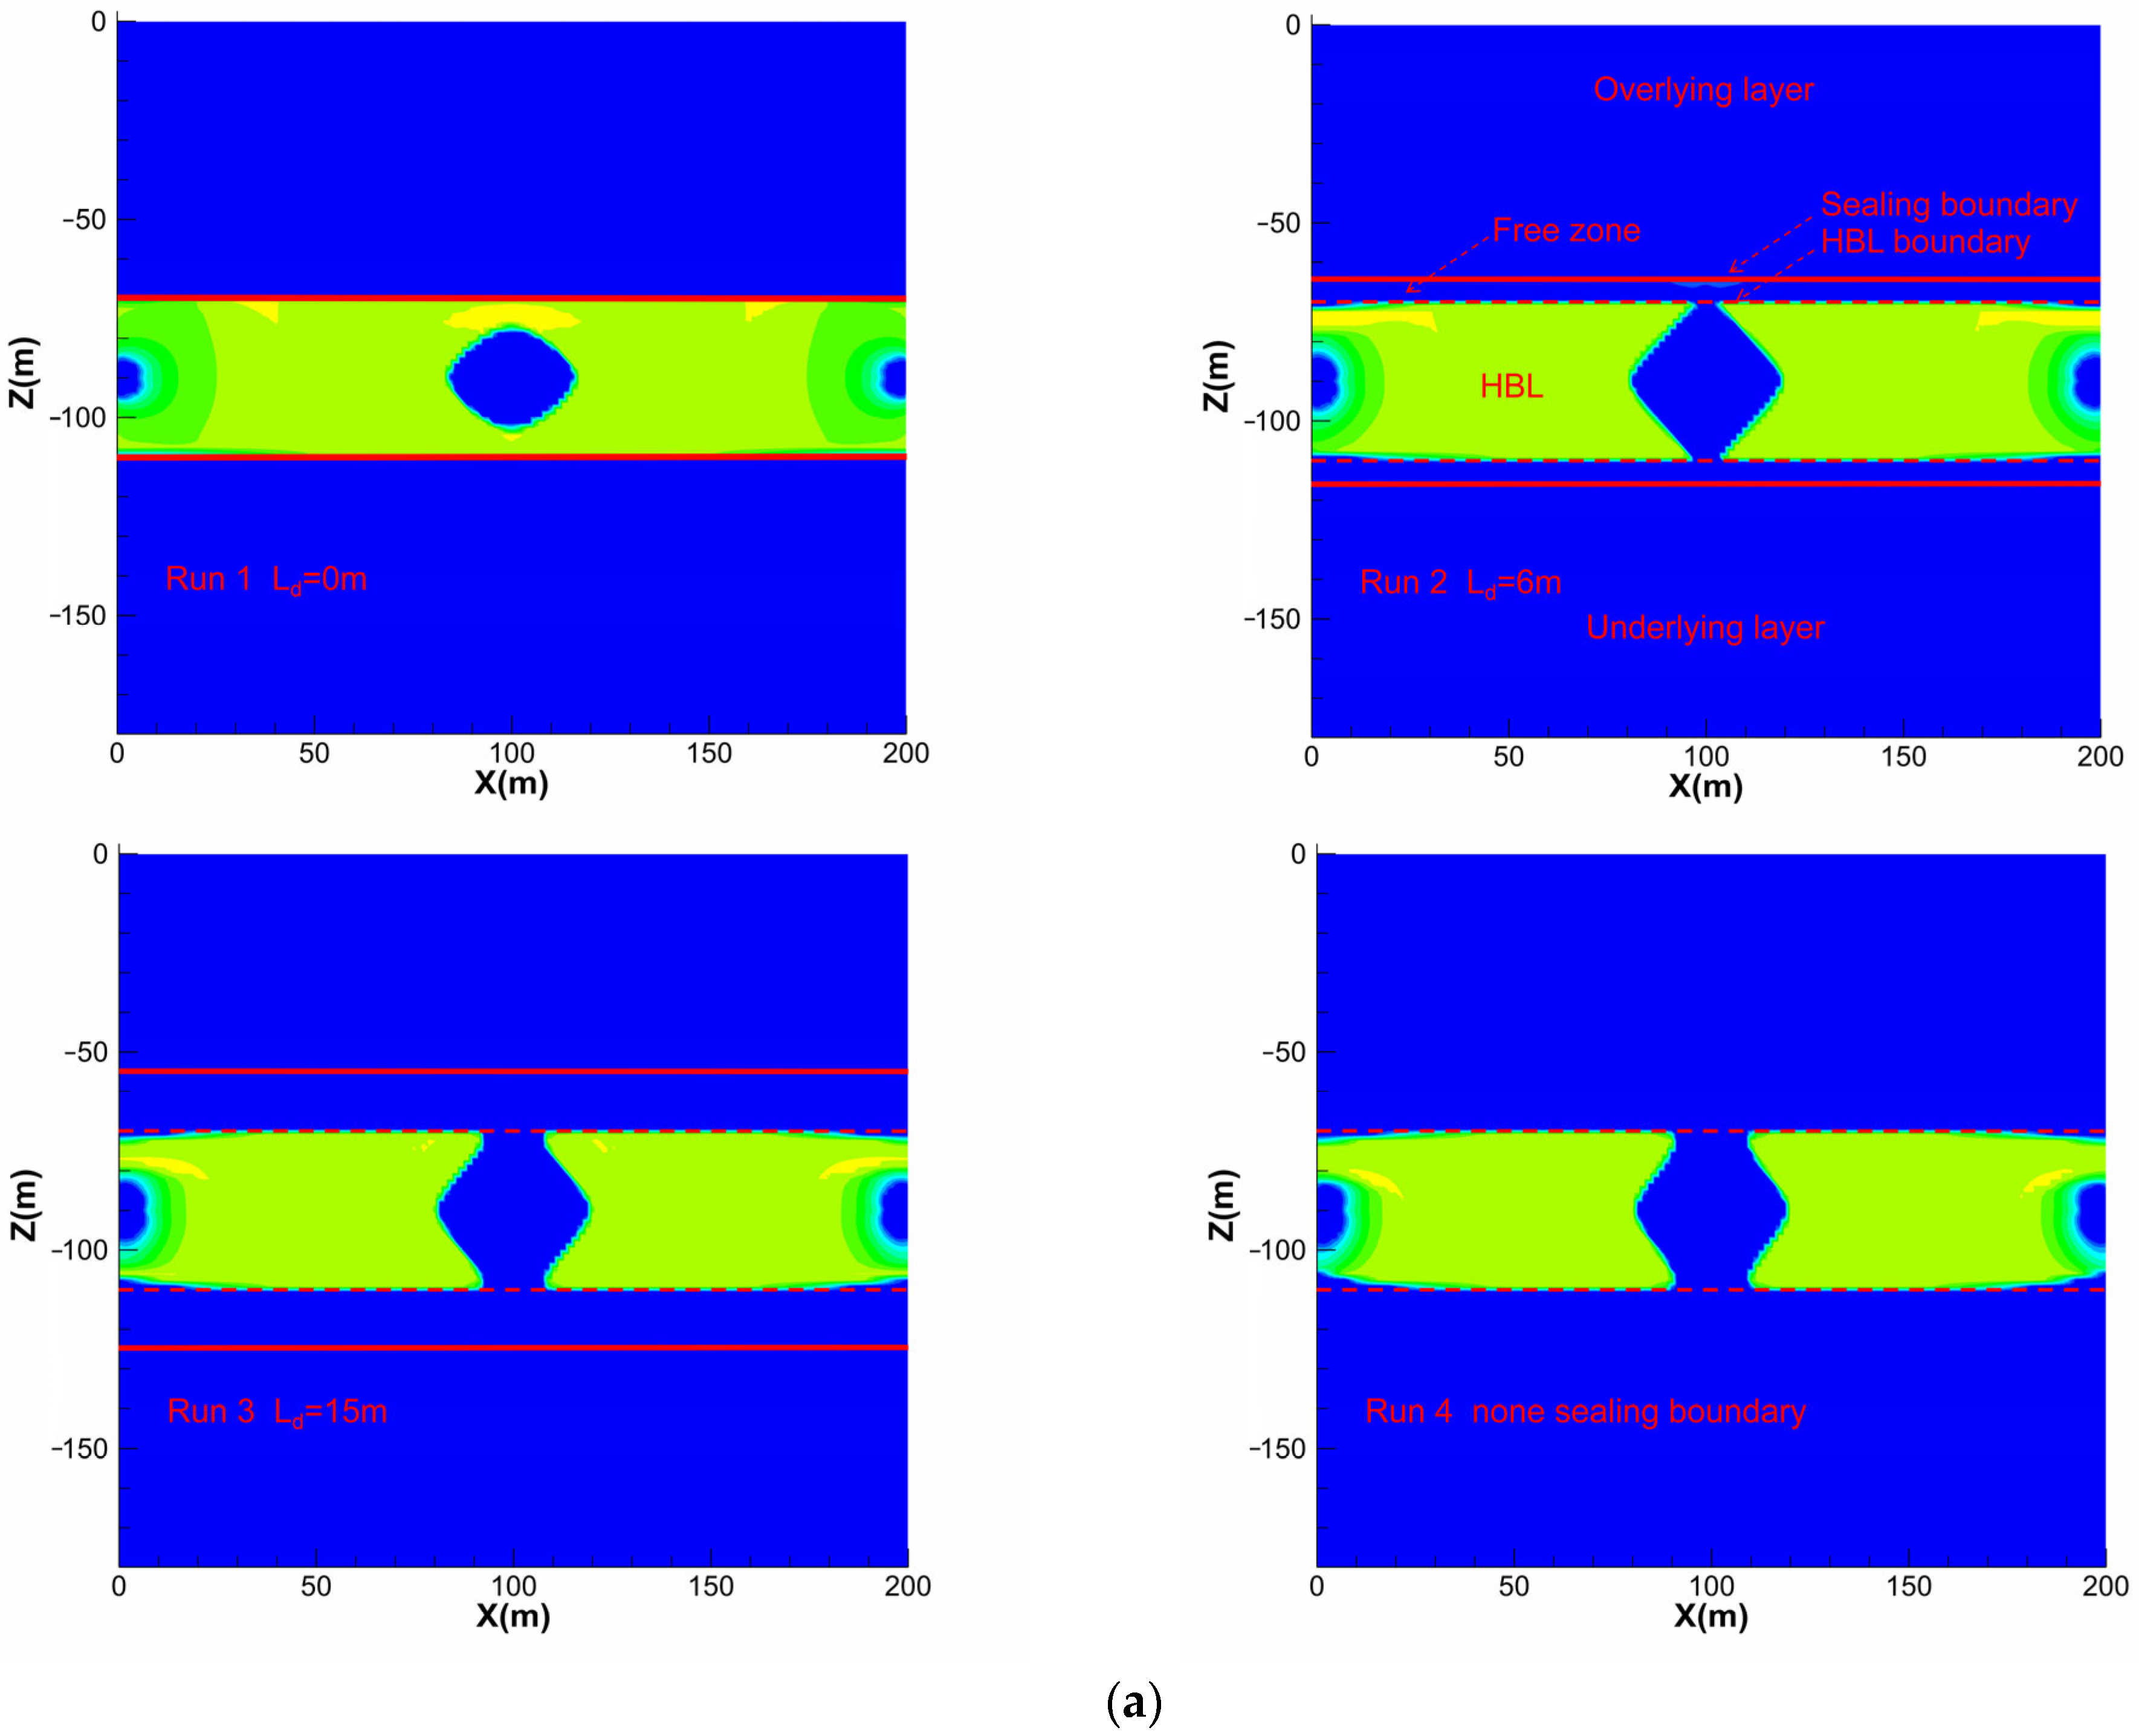
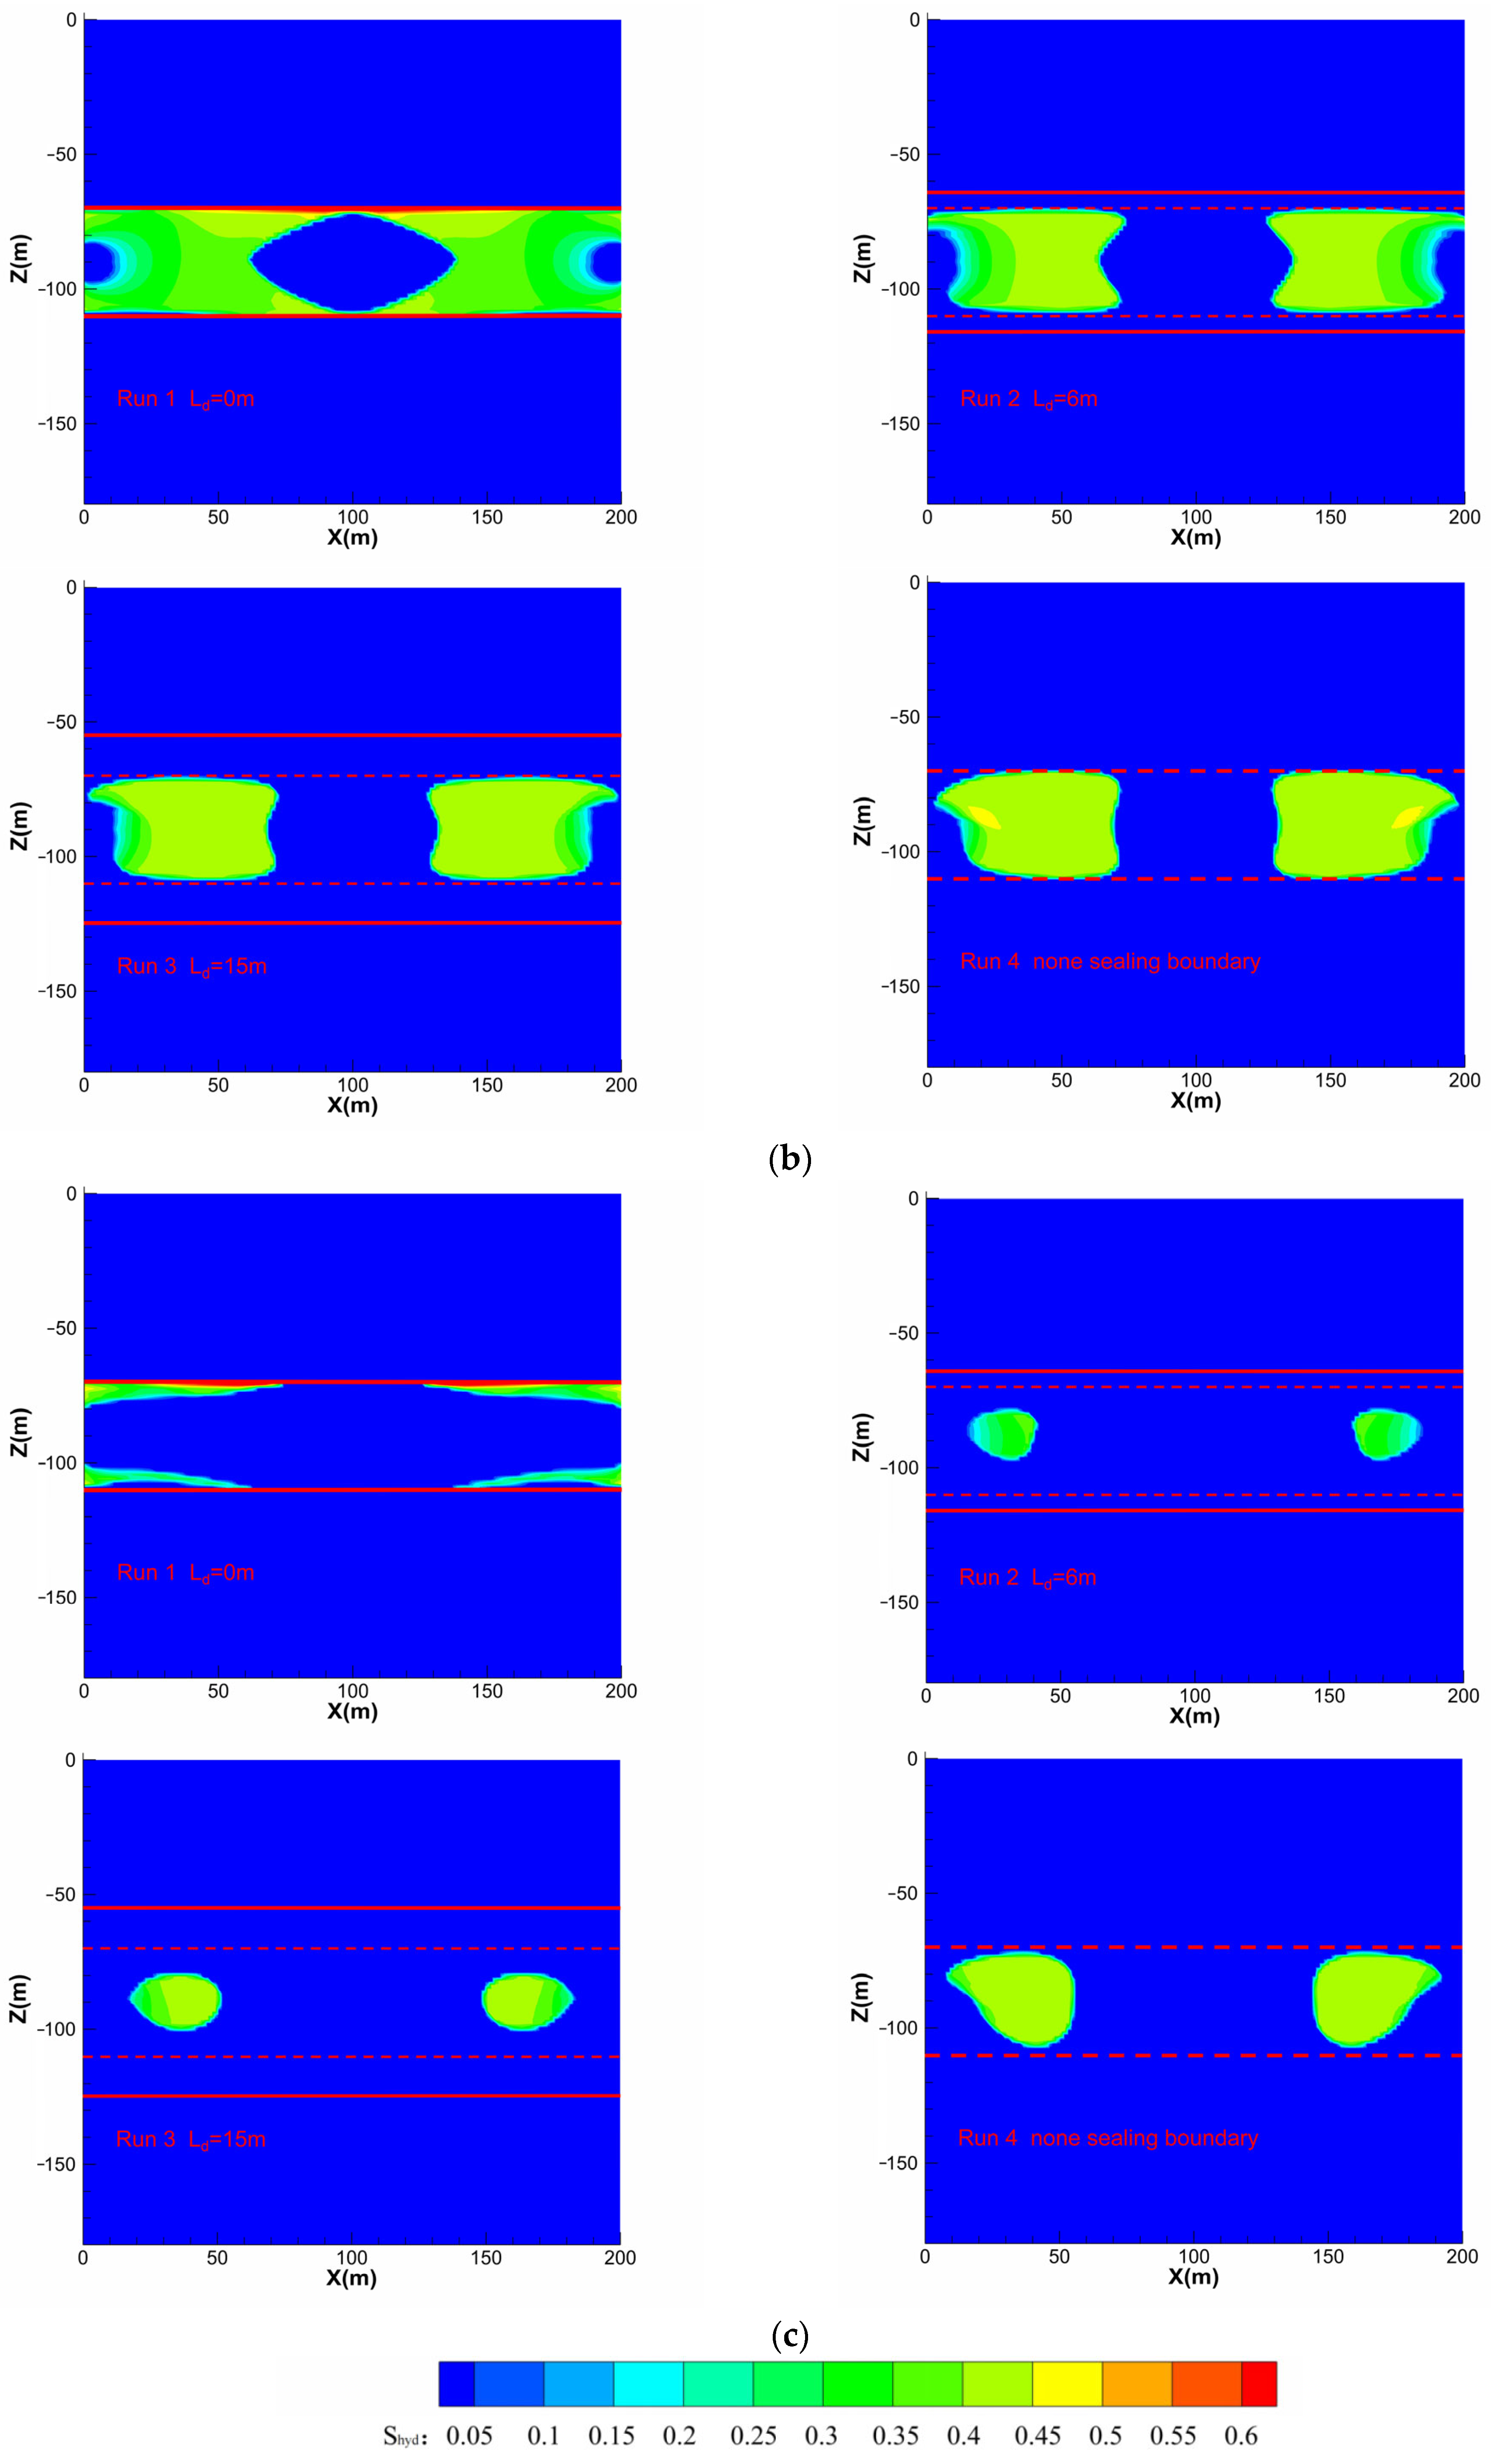
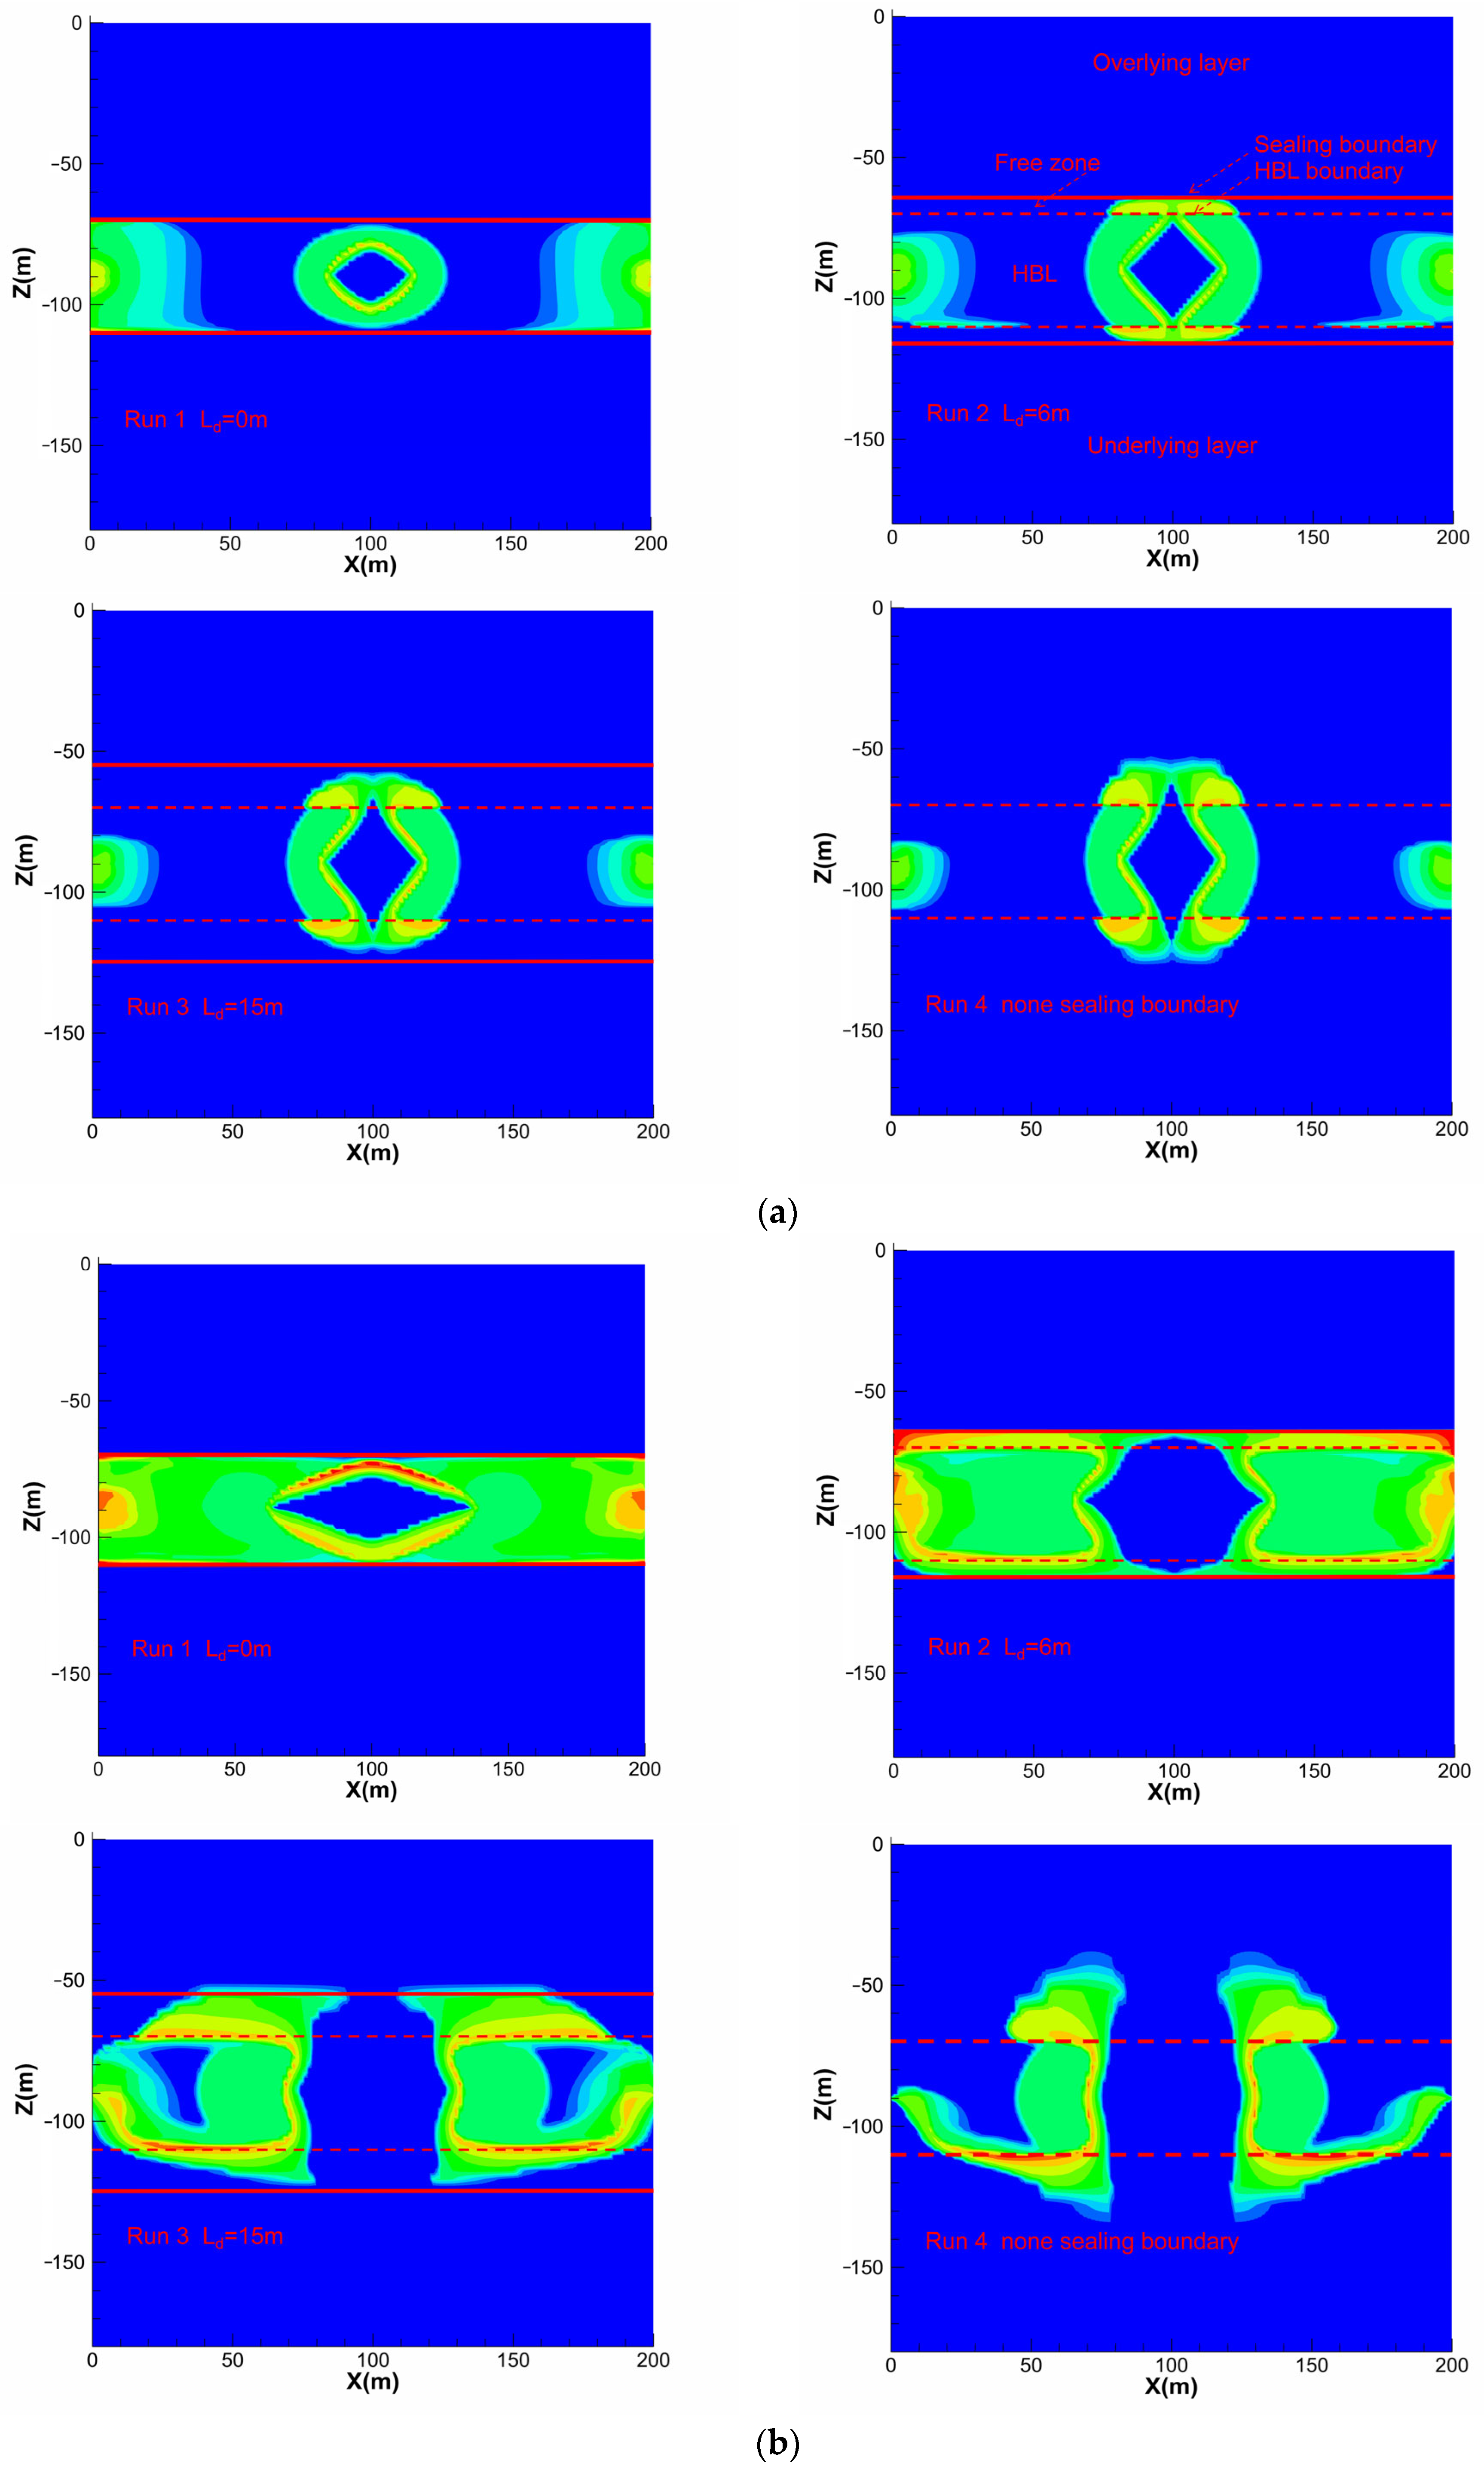
Hydrate decomposition can cause the NGH saturation (Shyd) in a reservoir to decrease. Therefore, the variation of Shyd distribution can well demonstrate the hydrate decomposition process. Figure 3 shows the Shyd distribution of Runs 1–4 at different times. After 360 d, Run 1 has the minimal hydrate complete dissociation area (Shyd = 0) around Wellinj, and the decomposition front in the vertical direction of Runs 2–3 has already reached the boundary of GHL. This is because the sealing distance of Run 1 is 0 m. The presence of sealing boundaries completely prevents the transport of hot water to the overburden and underburden. However, highly permeable free zones (the area between the edge of GHL and sealing boundaries) exist in Runs 2–3. The pore water pressure in the free zones (about 14.5 MPa) is much lower than the pressure of hot water around Wellinj (20 MPa), which effectively directs the seepage of hot water in the vertical direction, causing hydrate dissociation along the way. Obviously, both the overburden and underburden are highly permeable free zones due to the absence of sealing boundaries in Run 4. This provides the greatest induction for hot water migration, resulting in the largest zone of complete hydrate dissociation near the edge of GHL. Around Wellpro, the GHL is decomposed by depressurization. With the increase of sealing distance, the complete decomposition area of GHL gradually increases. This is because the pore water in highly permeable free zones intrudes into GHL and brings heat to hydrate decomposition. It should be noted that compared to Run 1, pore water intrusion in Runs 2–3 can inhibit the pressure drop transfer around Wellpro, which is detrimental to hydrate decomposition. Therefore, the size ordering of the regions with Shyd less than 0.4 is Run 1 > Run 2 > Run 3. Concerning Run 4, the area with Shyd less than 0.4 is the smallest due to the large amount of pore water present in the permeable overburden and underburden that can continuously intrude into GHL and Wellpro. In addition, it is found that the Shyd distribution of Run 4 is similar to that of Run 3 at this time. This phenomenon suggests that the 15 m sealing distance has little effect on hydrate decomposition in the early stage of hydrate exploitation.
At 1080 d, the horizontal extension distance of the NGH decomposition fronts of Runs 1–3 is greater than that of Run 4 around Wellinj. This indicates that the presence of sealing boundaries can promote the horizontal migration of hot water and hydrate decomposition. At Wellpro, the complete hydrate dissociation zone of Run 1 is greater than before, while the GHL lower side of Runs 2–3 has been completely decomposed, and the upper side is partially decomposed. With the analysis of the temperature distribution of Runs 2–3 (see Figure 4), this observation is because hot water accumulates more downward under the action of gravity, which leads to a greater pressure difference in the lower free zones and accelerates the hot water into Wellpro. These phenomena demonstrate that an increase in sealing distance promotes the hydrate decomposition around Wellpro. As for Run 4, hot water can also accumulate around Wellpro despite the absence of sealing boundaries at this time, which in turn assists in hydrate dissociation.
After 2160 d, Run 1 has a different Shyd distribution pattern than Runs 2–4. This phenomenon is attributed to the transport of hot water (see Figure 4). The hot water of Run 1 is blocked in GHL. It can only migrate to Wellpro through GHL, resulting in the incomplete hydrate decomposition area around sealing boundaries. Moreover, the hydrate saturation of the upper side of GHL in Run 1 is as high as 60% since the upward accumulation of CH4 leads to the secondary formation of hydrate. The hot water of Runs 2–4 migrates to Wellpro through the highly permeable free zones or the overburden and underburden and decomposes the upper and lower hydrate parts of the GHL along the way, thus the incomplete hydrate decomposition zone is located in the middle of GHL. Furthermore, since the free zones in Run 2 are the smallest, the vertical diffusion distance of hot water is limited, and the energy loss is less. Hence, the incomplete decomposition area of Run 2 is the smallest. Furthermore, it is noticeable that Run 4 has a greater incomplete hydrate dissociation zone than Runs 1–3 due to the hot water of Run 4 diffusing to the overburden and underburden in large quantities. These phenomena suggest that the presence of sealing boundaries can be effective in promoting hydrate decomposition in the late production period. Overall, in terms of the whole NGH exploitation process, it can be concluded that the NGH deposit with sealing boundaries is more beneficial to hydrate dissociation than without sealing boundaries.

3.1.2. NGH Reservoir Temperature Distribution

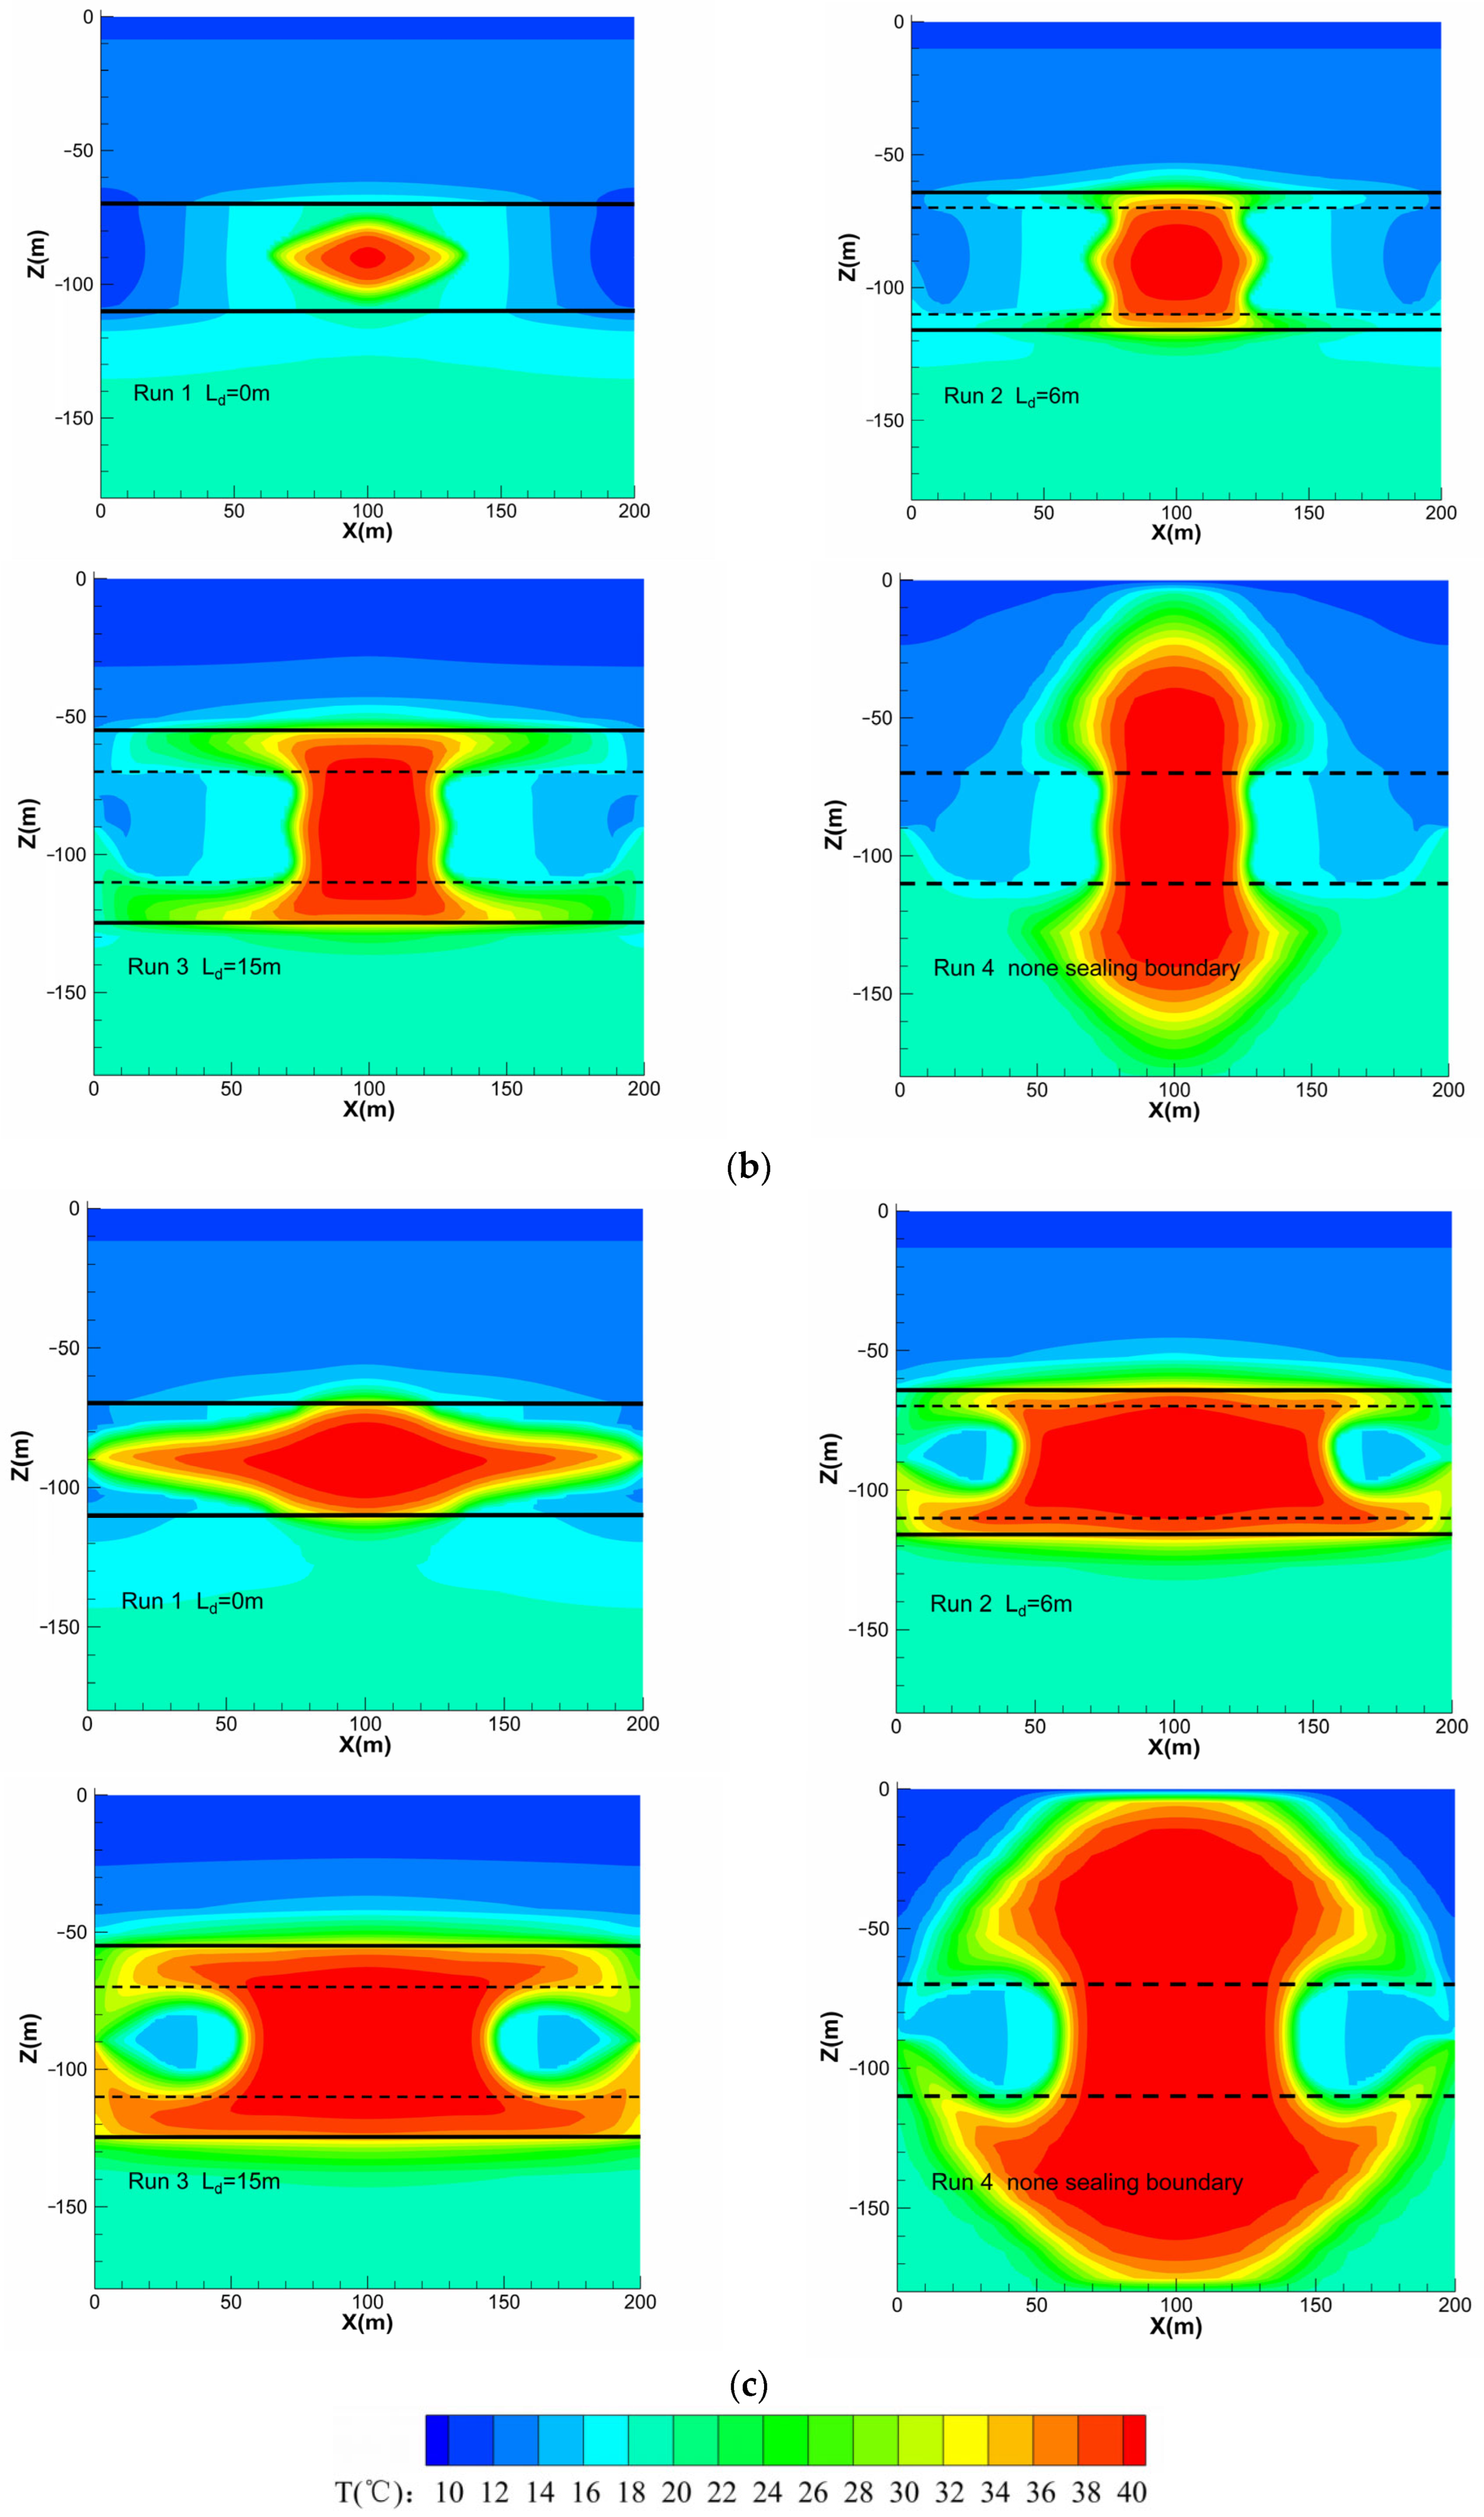
Figure 4 illustrates the variation of the hydrate reservoir temperature (T) distribution for Runs 1–4 during hydrate production. At 360 d, the diffusion distance of the high-temperature area (T = 40 °C) of Run 1 in the horizontal direction is longer than that in the vertical direction. However, the hot water diffusion situation of Runs 2–3 is reversed since the hot water is induced by the low pressure of highly permeable free zones. Particularly, the hot water of Run 4 is induced by the low pressure of overburden and underburden, leading to the diffusion distance of the high-temperature area in the horizontal direction being significantly shorter than that in the vertical direction. Overall, the hot water of Run 4 has the largest diffusion range in GHL. Combined with the Shyd distribution of each run at this time, it can be considered that the presence of sealing boundaries is detrimental to the thermal dissociation of hydrate in the early production stage.
At 1080 d, the high-temperature area of Runs 1–3 is further extended horizontally due to the continuous hot water injection and the low-pressure induction of Wellpro. It should be noted that quite a bit of hot water enters the free zones of Runs 2–3 and is transported toward Wellpro. Hot water contributes well to the hydrate decomposition on the upper and lower sides of GHL. For Run 4, a large amount of hot water enters the overburden and underburden. Unfortunately, the fluid is difficult to contribute to the thermal decomposition of hydrate. These phenomena indicate that the presence of sealing boundaries can accelerate the migration of hot water to Wellpro, increase the interaction area between hot water and hydrate, and effectively reduce energy loss. In addition, the hot water tends to migrate downward under the effect of gravity. Therefore, the dissociation degree of hydrate in the lower part of GHL in all runs is greater than that in the upper part. This observation can be also demonstrated by the Shyd distribution in Figure 3.
After 2160 d, the high-temperature zone of each run continues to spread horizontally. The hot water in Run 1 passes through GHL to reach Wellpro. The hot water in Runs 2–3 enters Wellpro through highly permeable free zones. However, the hot water in Run 4 enters Wellpro through overburden and underburden. The diffusion range of hot water in Run 4 is very extensive, resulting in the most serious heat loss among all runs. Therefore, it is very helpful to reduce the energy loss of hot water by setting sealing boundaries in the overburden and underburden. Moreover, the smaller the sealing distance, the better it is for reducing heat loss.

3.1.3. NGH Reservoir Pressure Distribution

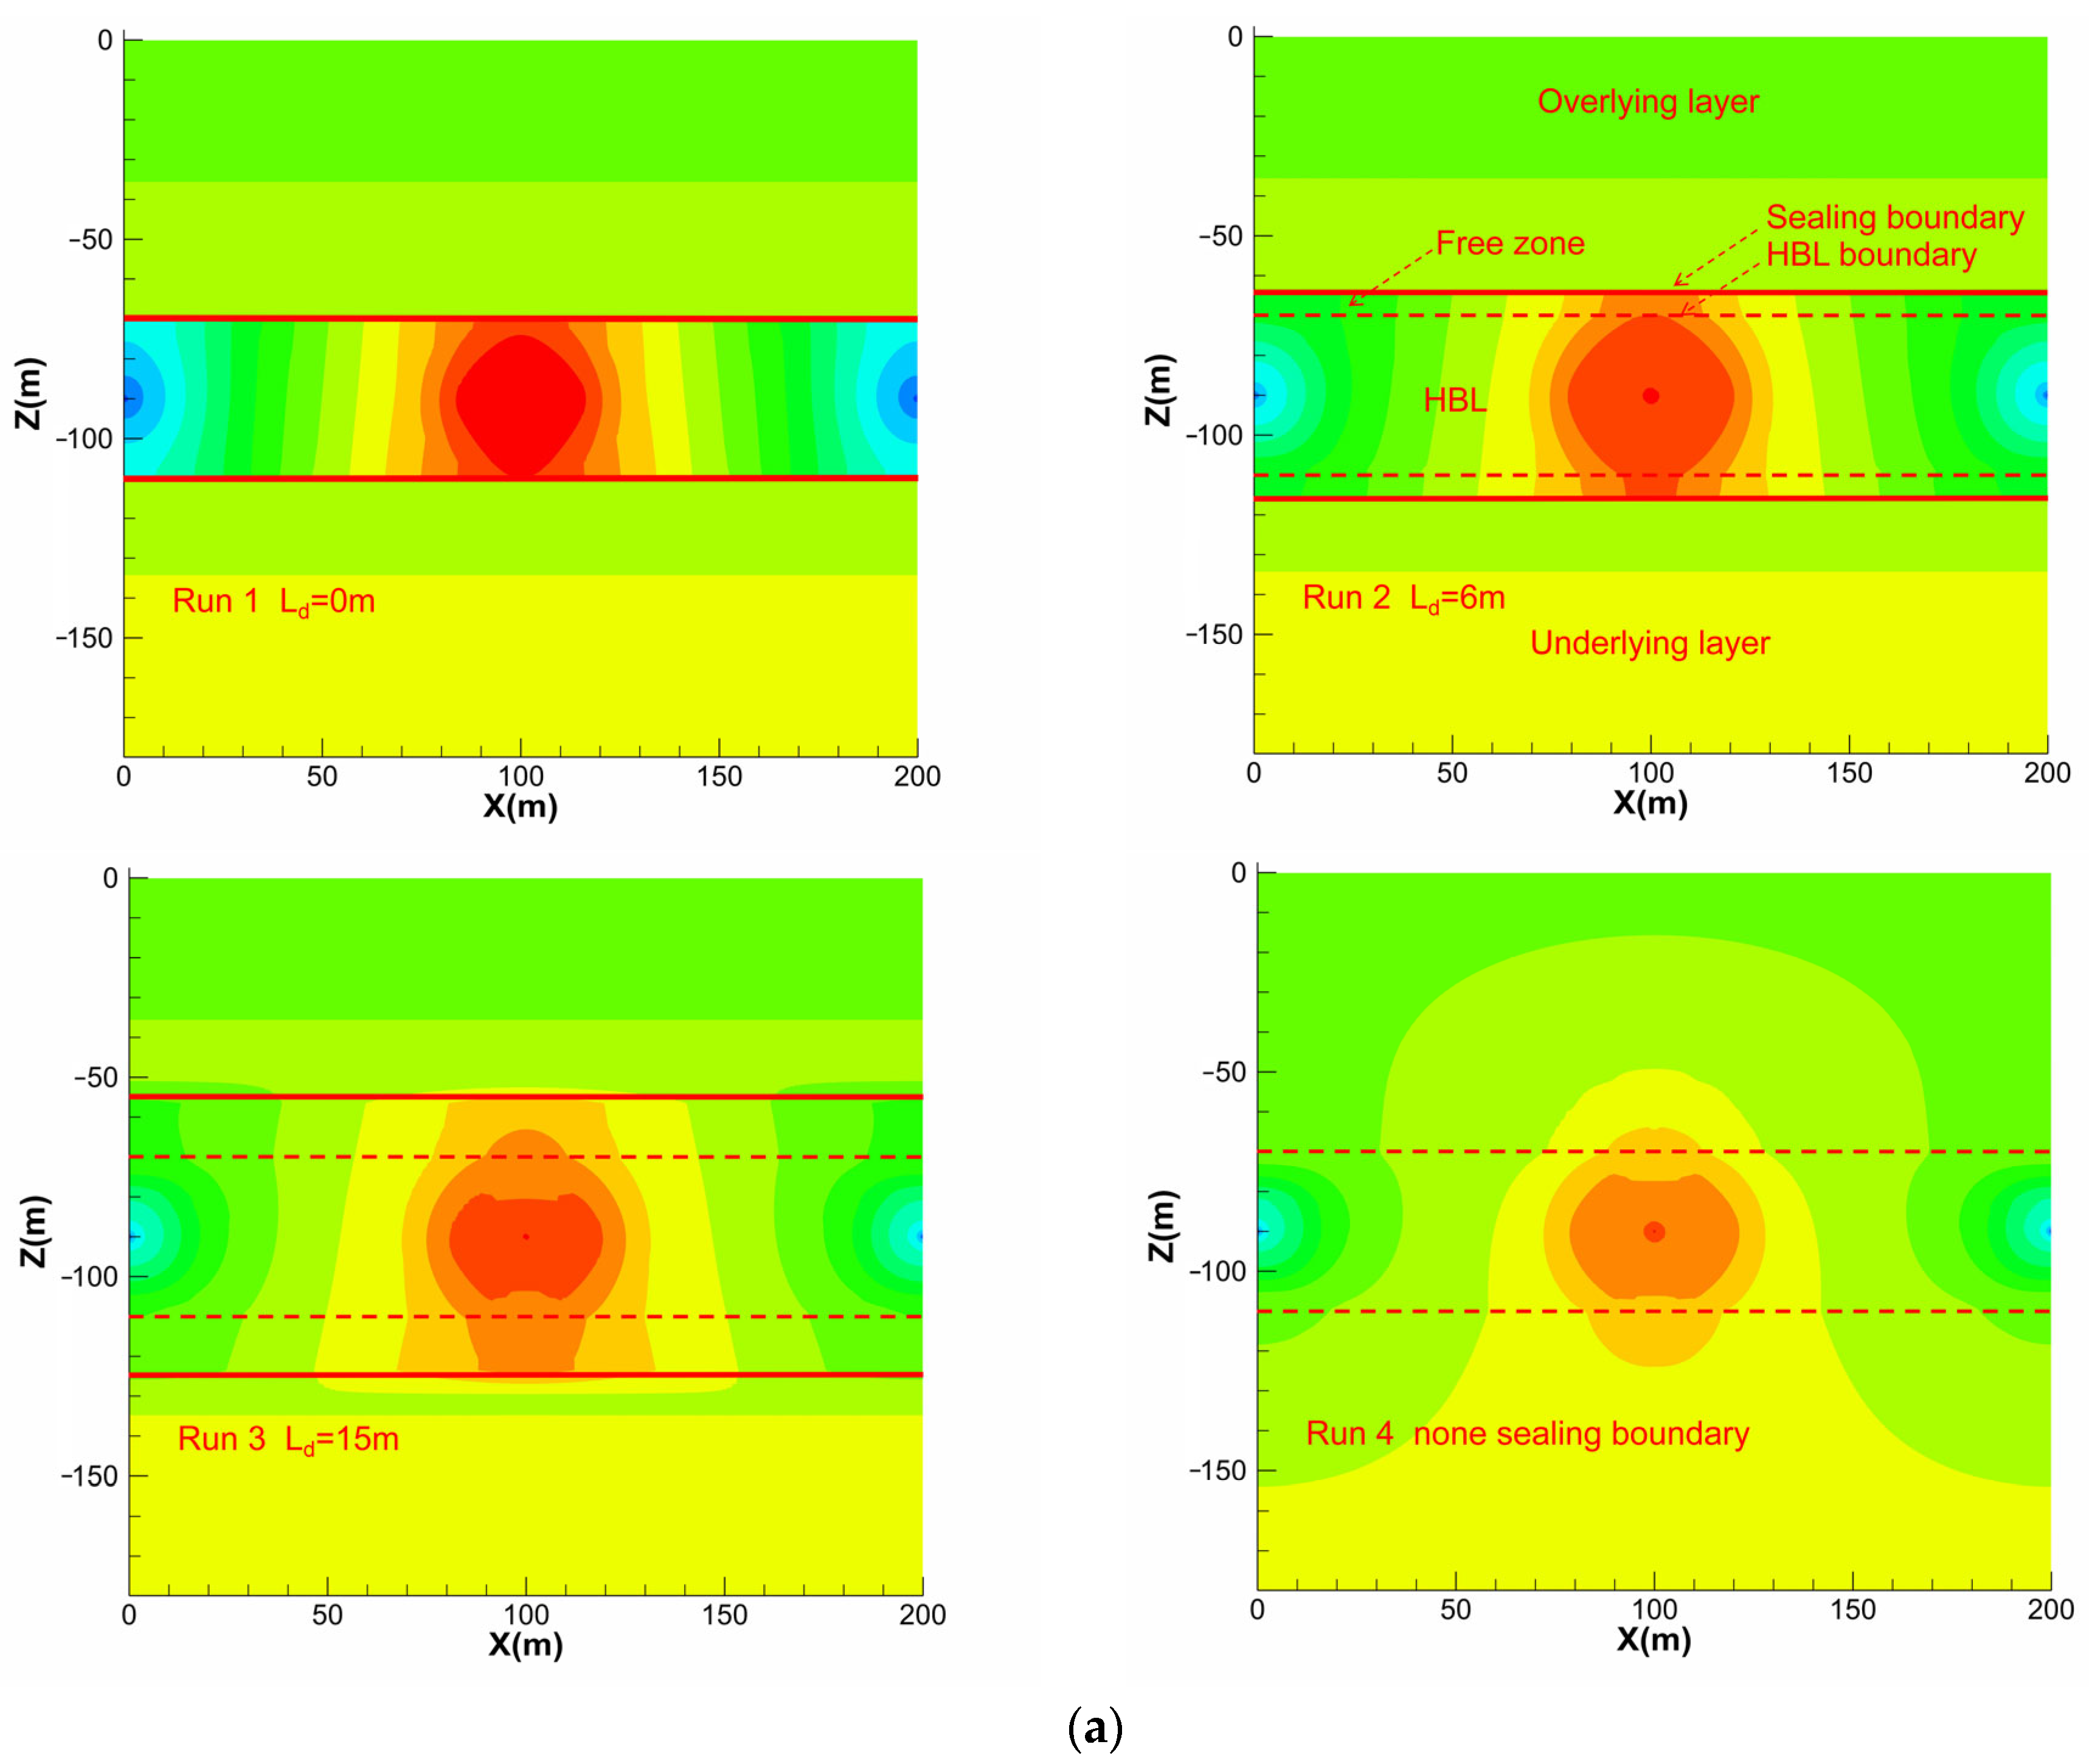
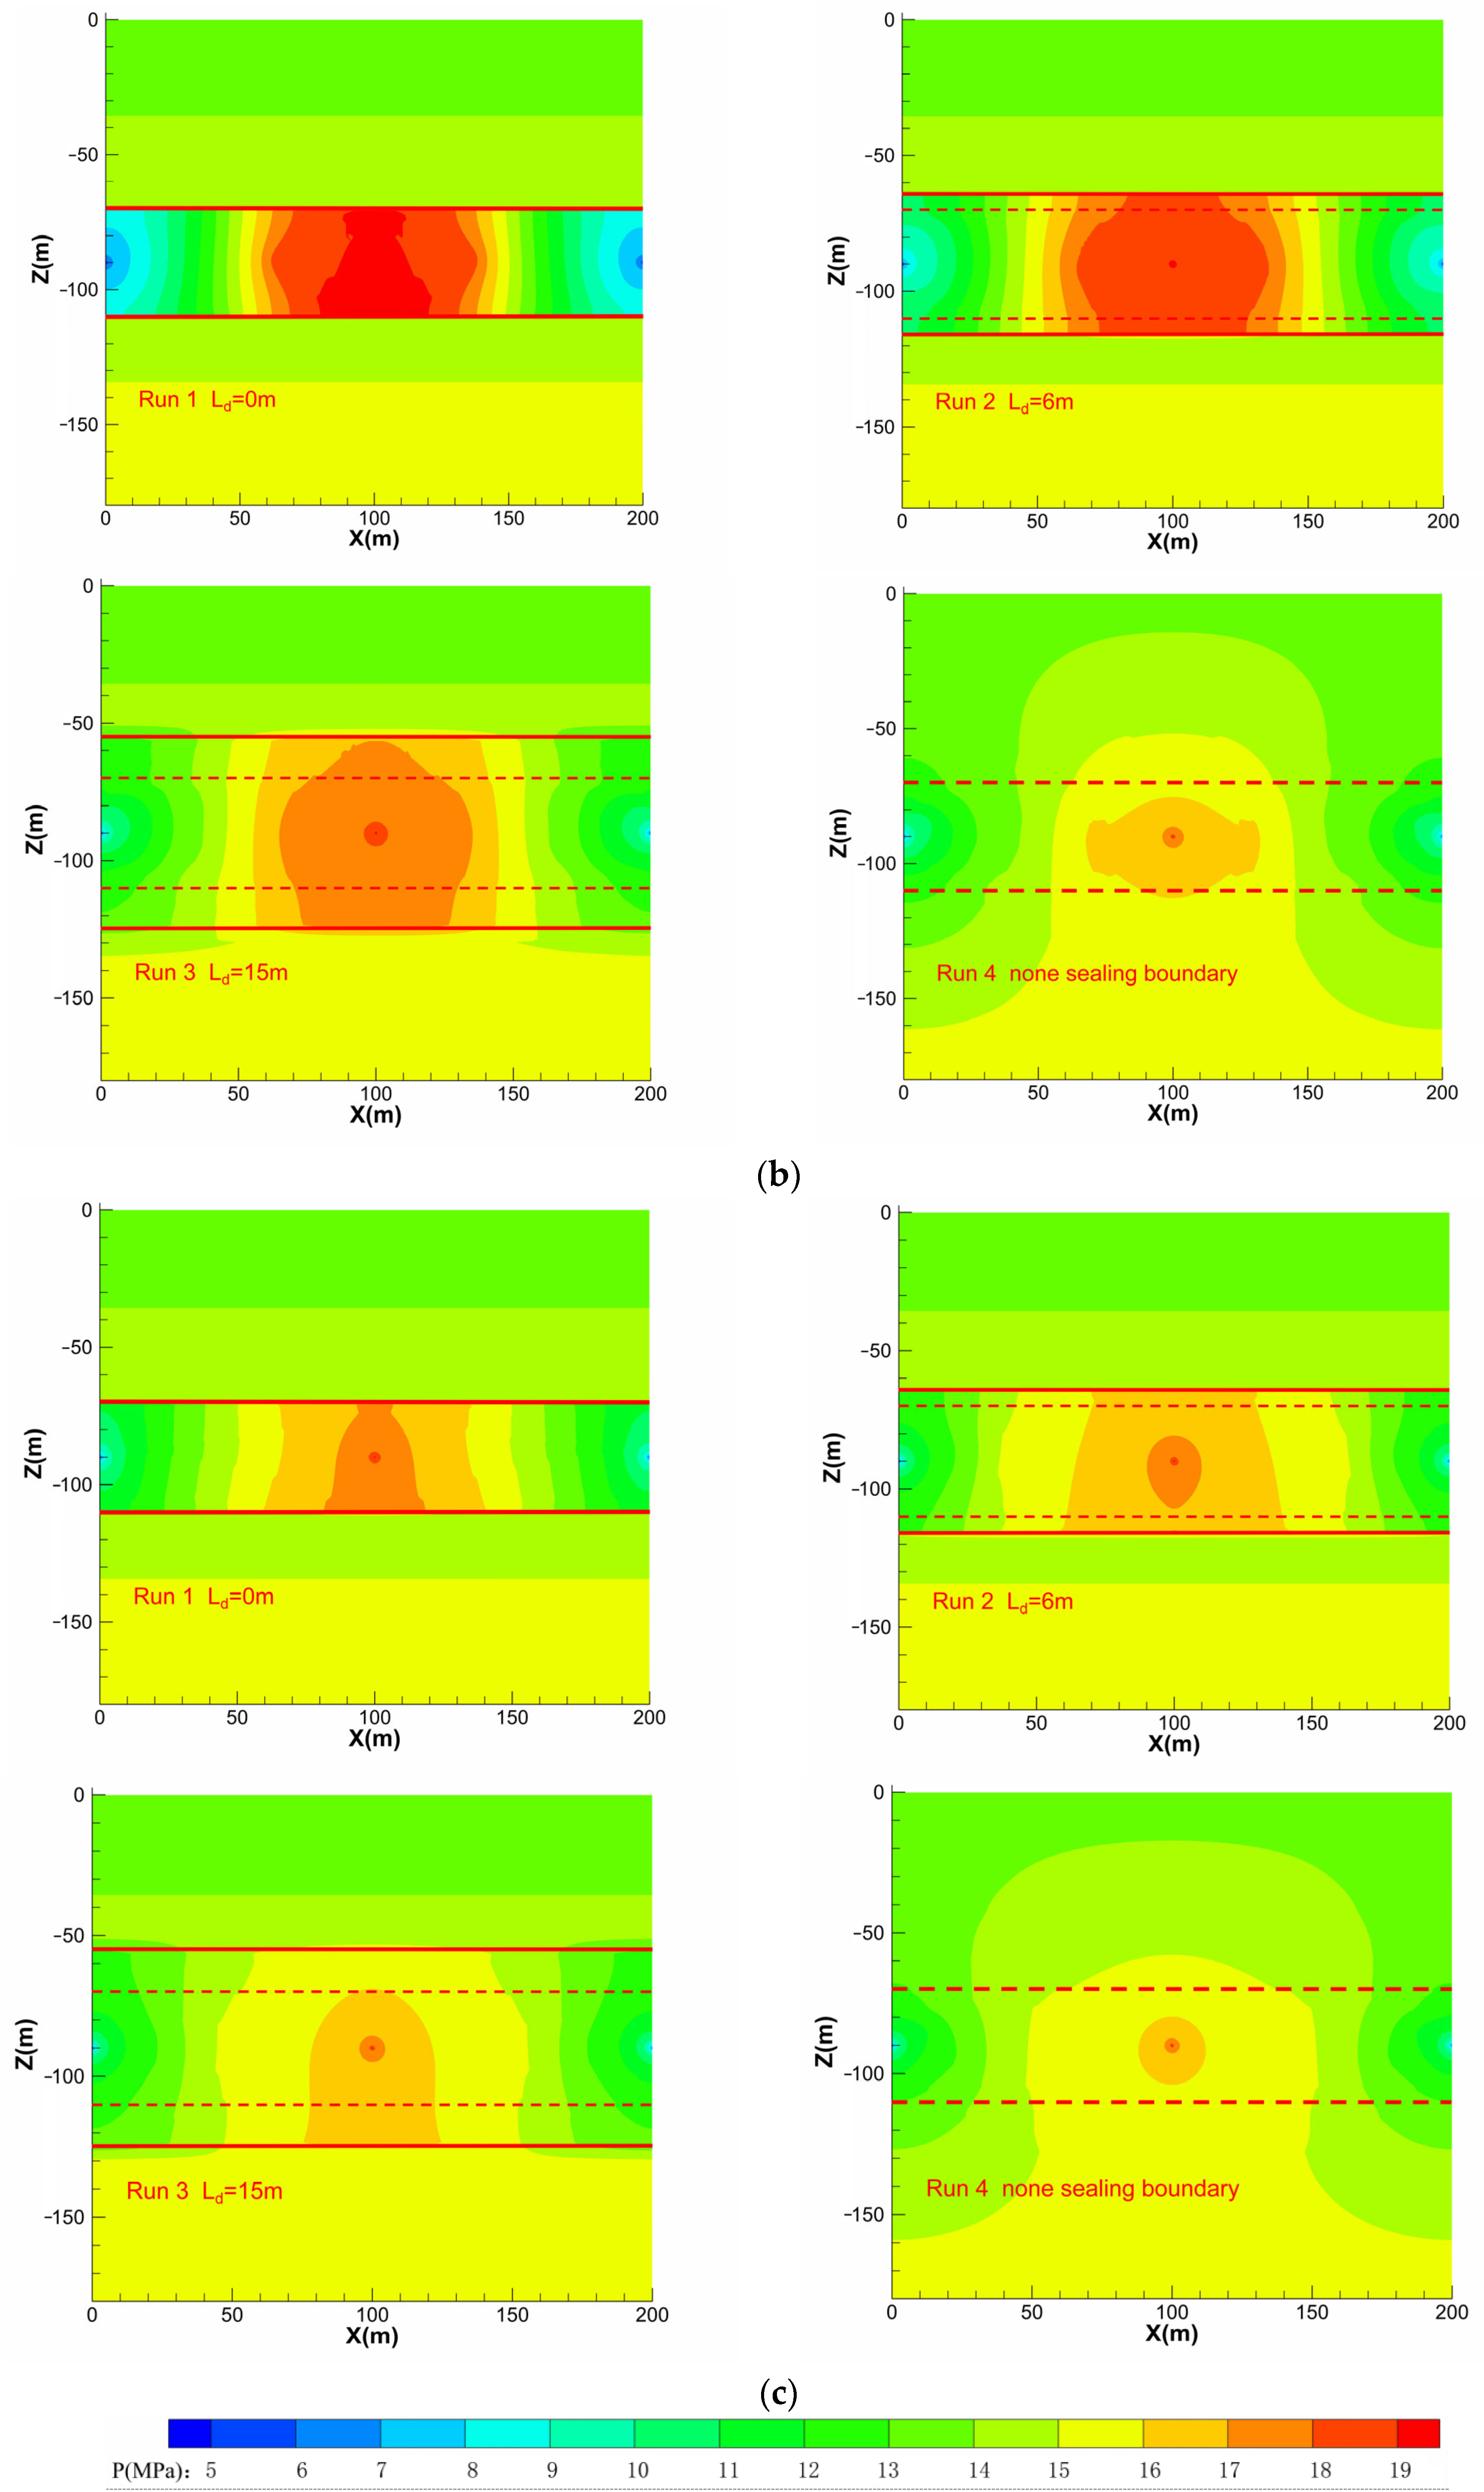
The NGH reservoir pressure (P) distribution for Runs 1–4 at different times is illustrated in Figure 5. At 360 d, the high-pressure region (P = 19 MPa) around Wellinj of Runs 1–3 is larger than that of Run 4 since the diffusion of hot water in the former runs is controlled to a limited range by sealing boundaries. However, the high-pressure region of Run 2 is larger than that of Run 3. These results indicate that the presence of sealing boundaries is beneficial to reduce the pressure loss of hot water, and the increase in sealing distance is detrimental to the maintenance of the high pressure of hot water. At Wellpro, the area of low pressure (8 MPa) shows the following trend: Run 1 > Run 2 > Run 3. This is because the pore water in highly permeable free zones of Runs 2–3 enters Wellpro and inhibits the transfer of pressure drop. The free zones of Run 3 are larger, so the inhibition on pressure drop transfer is more significant. Furthermore, the low-pressure area around Wellpro in Run 4 is smaller than that in Runs 1–3, which indicates that the presence of sealing boundaries is beneficial to reduce the inhibitory effect of pore water on the transfer of pressure drop.
At 1080 d, the low-pressure zone around Wellpro in Run 1 remains almost unchanged, while the low-pressure area decreases in Runs 2–3. This is because the pressure drop in Run 1 is enclosed in GHL, and there is no invasion of water to affect the transfer of the pressure drop. However, the hot water in Runs 2–3 enters highly permeable free zones and creates a greater pressure difference between the free zones and the Wellpro, thus accelerating the intrusion of pore water into the Wellpro. On the other hand, due to the presence of sealing boundaries in Runs 1–3, the area of sub-high pressure (P = 18 MPa) around Wellinj and the area of low pressure around Wellpro of Runs 1–3 are higher than that of Run 4. It is again suggested that the presence of sealing boundaries is beneficial to decrease the pressure loss of hot water and reduce the inhibition effect of pore water on the transfer of pressure drop.
At 2160 d, the low-pressure zone around Wellpro and the high-pressure zone around Wellinj of all runs decrease. This finding is due to the decomposition of a substantial amount of hydrate in GHL, which increases the effective permeability of GHL. Hence, the hot water can migrate more smoothly from Wellinj to Wellpro. In addition, the high-pressure area of Runs 1–3 is still larger than that of Run 4 since the diffusion of hot water is still limited by sealing boundaries in the late production period.

3.1.4. CH4 Saturation Distribution

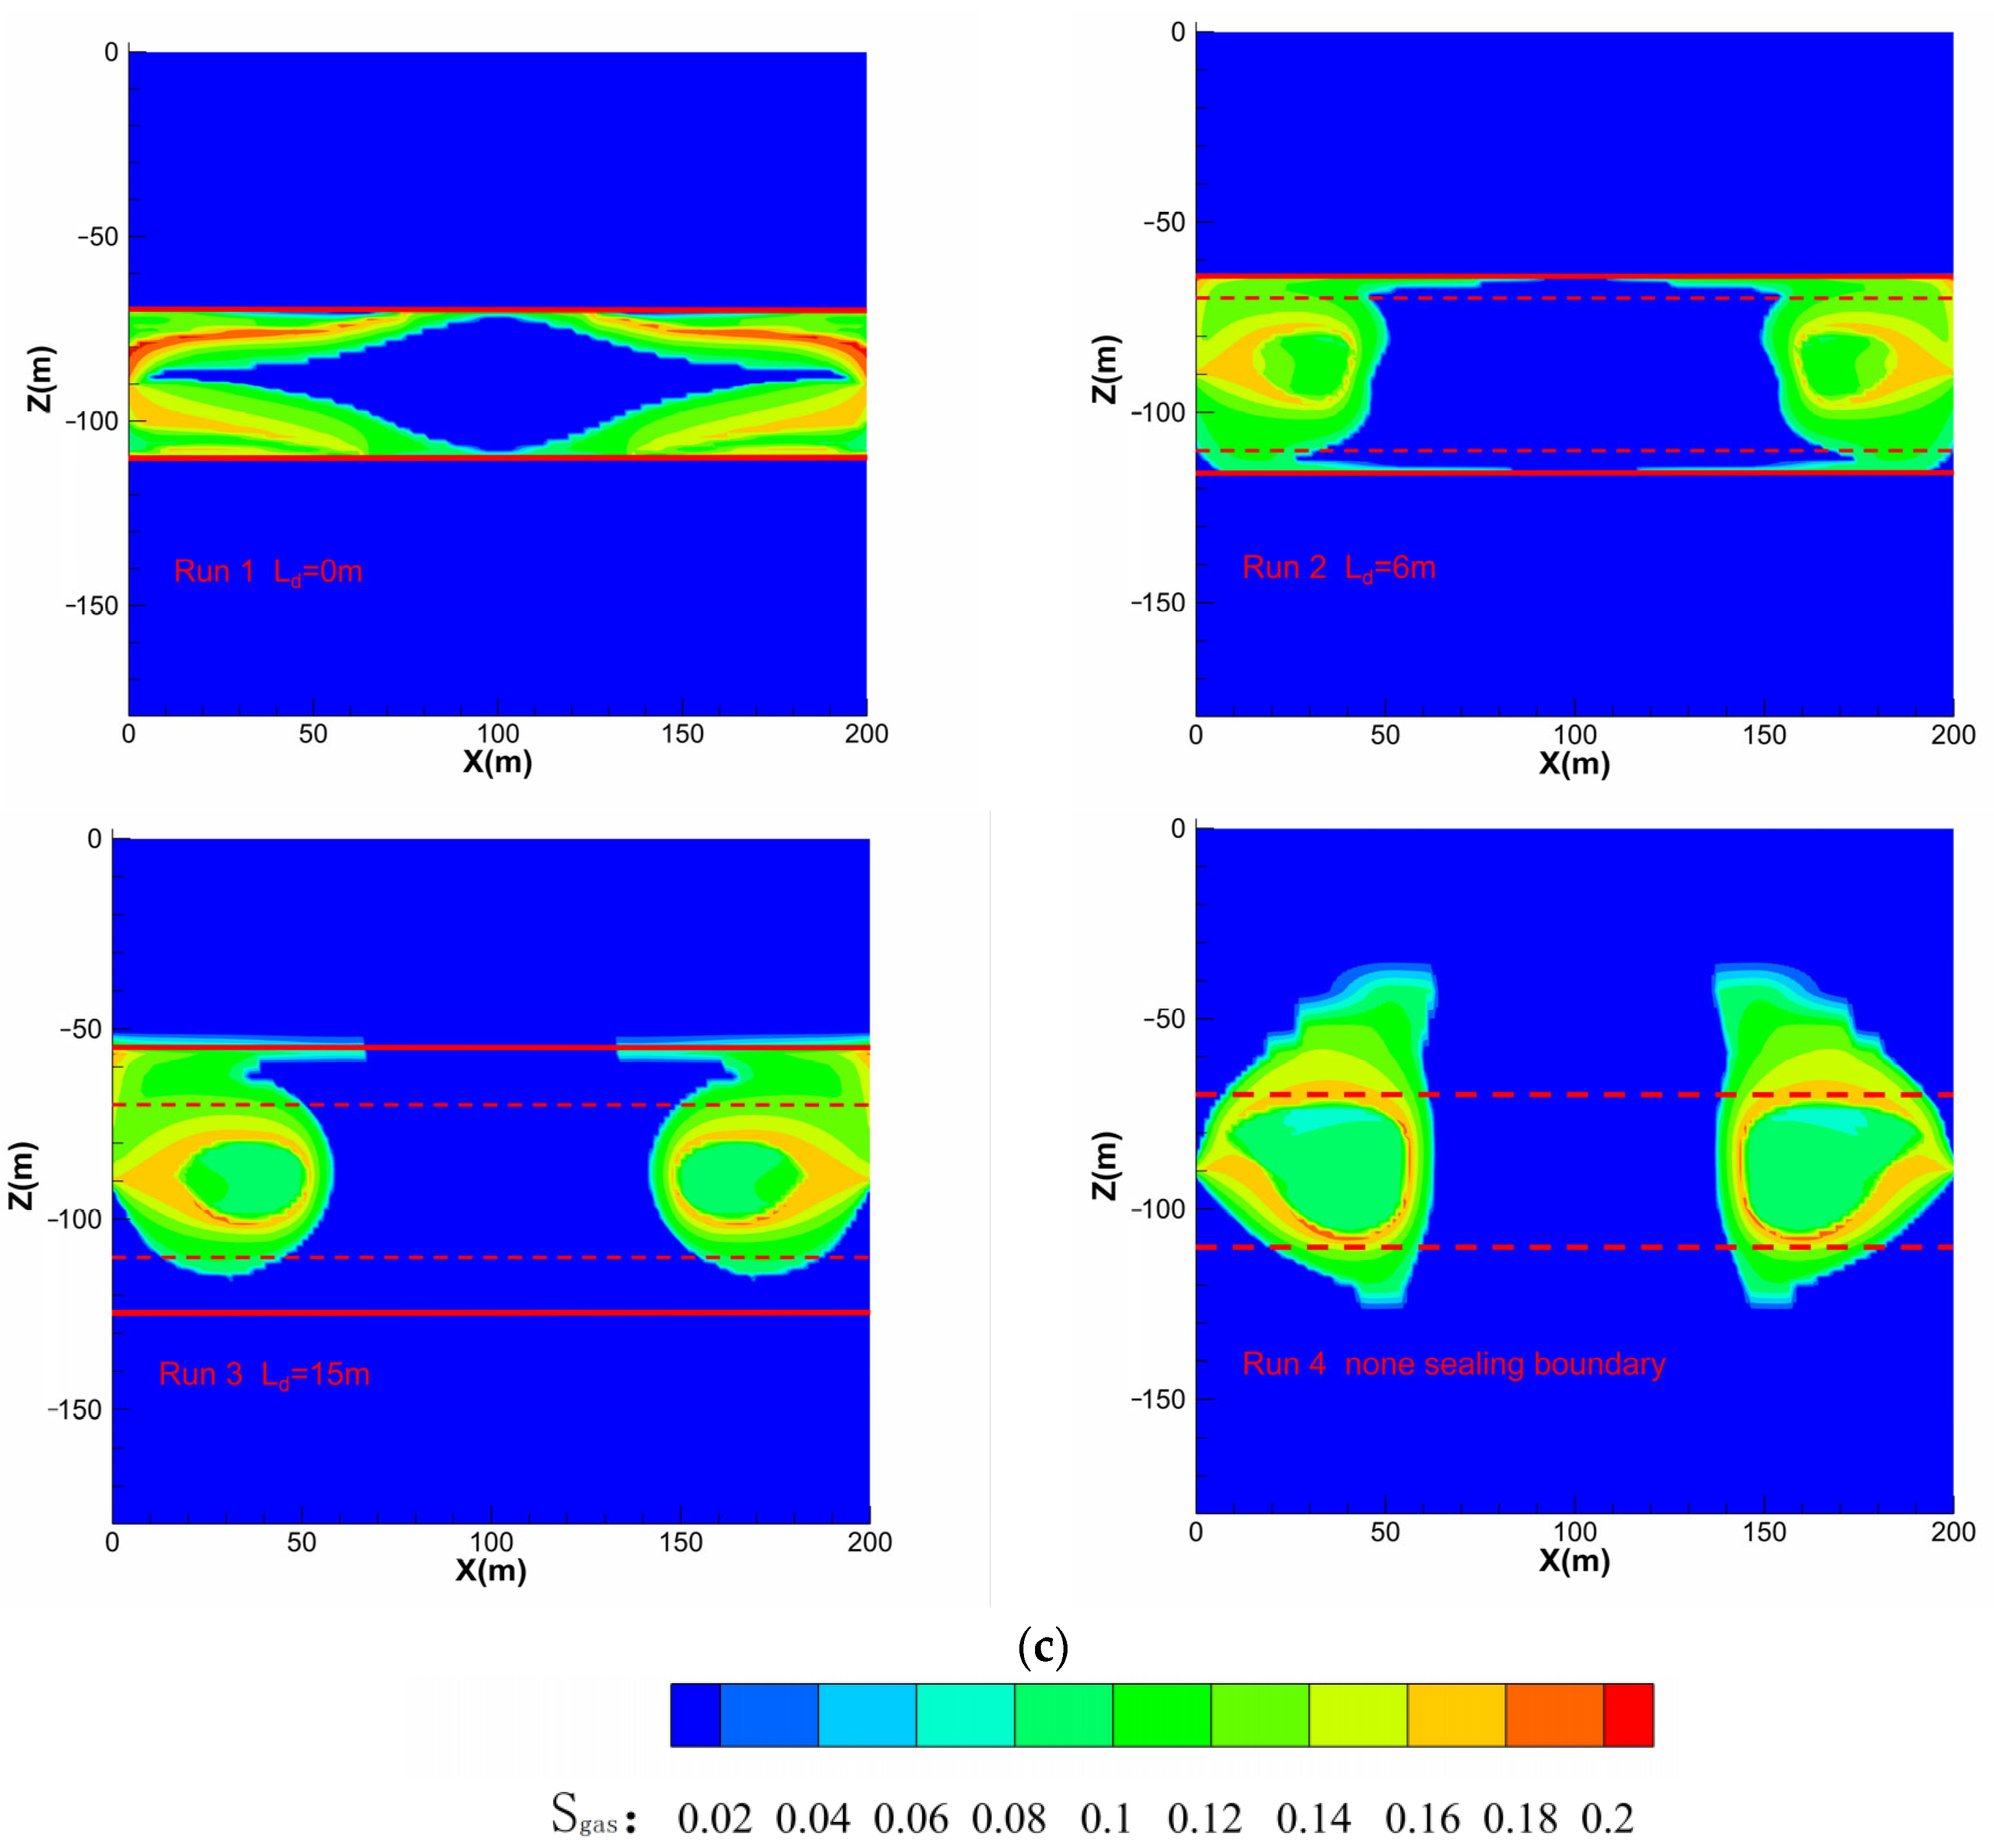
The variation of the hydrate reservoir CH4 saturation (Sgas) distribution for all runs in the hydrate exploitation process is shown in Figure 6. At 360 d, the CH4 in Run 1 essentially spreads throughout GHL due to the influence of sealing boundaries, and its gas distribution range is much larger than that of the other runs. Meanwhile, it is found that the area with high gas saturation (Sgas = 0.16) in Runs 2–3 is close to the hydrate decomposition front around Wellinj. This is understandable considering that the CH4 at the hydrate decomposition front is slowly diffusing in all directions, especially in the highly permeable free zones formed by sealing boundaries. Moreover, due to the absence of sealing boundaries, the diffusion range of highly saturated gas (Sgas = 0.16) of Run 4 in the overburden and underburden is significantly larger than that of Runs 2–3. This suggests that the presence of sealing boundaries effectively inhibits the diffusion of thermal-induced gas in the period of early production. On the other hand, by comparing Run 2 and Run 3, it is found that the gas distribution area around Wellpro decreases with increasing sealing distance. This observation is related to the intensity of water intrusion. In the process of hydrate extraction, the free water from highly permeable free zones intrudes Wellpro under the induction of low pressure. Then, under the impetus of the intrusion of water, the gas formed by the dissociation of NGH due to depressurization continues to enter Wellpro. Compared to Run 2, Run 3 has wider free zones and a higher total amount of pore water, resulting in more intense water intrusion in Wellpro. Hence, CH4 enters Wellpro more quickly in Run 3, thus reducing its distribution area. In addition, the Wellpro of Run 4 is subjected to the strongest degree of water intrusion at this time, so its gas distribution area is smaller than that of Runs 2–3.
At 1080 d, the CH4 migration tendency is coincident with the diffusion tendency of hot water (see Figure 5) in all runs since the gas continues to migrate to Wellpro under the drive of hot water. In Runs 1–2, CH4 is distributed throughout GHL due to the influence of sealing boundaries. Moreover, the Sgas near the upper sealing boundary is higher than near the lower boundary since CH4 is easy to accumulate upward with light density. The gas distribution of Run 3 is similar to that of Run 4. However, a large amount of gas from Run 4 is trapped in the overburden and underburden due to the absence of sealing boundaries restricting gas transportation, which is detrimental to gas recovery.
After 2160 d, the gas of Run 1 is sealed in GHL, while a lot of gas in Runs 2–3 is trapped in highly permeable free zones. As for Run 4, a large amount of gas remains in the overburden and underburden. These phenomena show that sealing boundaries are beneficial to reducing the residual gas in the overburden and underburden and promoting gas flow into Wellpro. Furthermore, under the influence of hot water drive and gas gravity, the gas distribution range on the upper side of GHL in Runs 2–4 is larger than that on the lower side. In general, the presence of sealing boundaries can not only limit the vertical migration of CH4 and accelerate the gas into Wellpro, but also reduce the residual gas in the overburden and underburden. This may effectively improve gas production efficiency.

3.2. NGH Decomposition Behavior

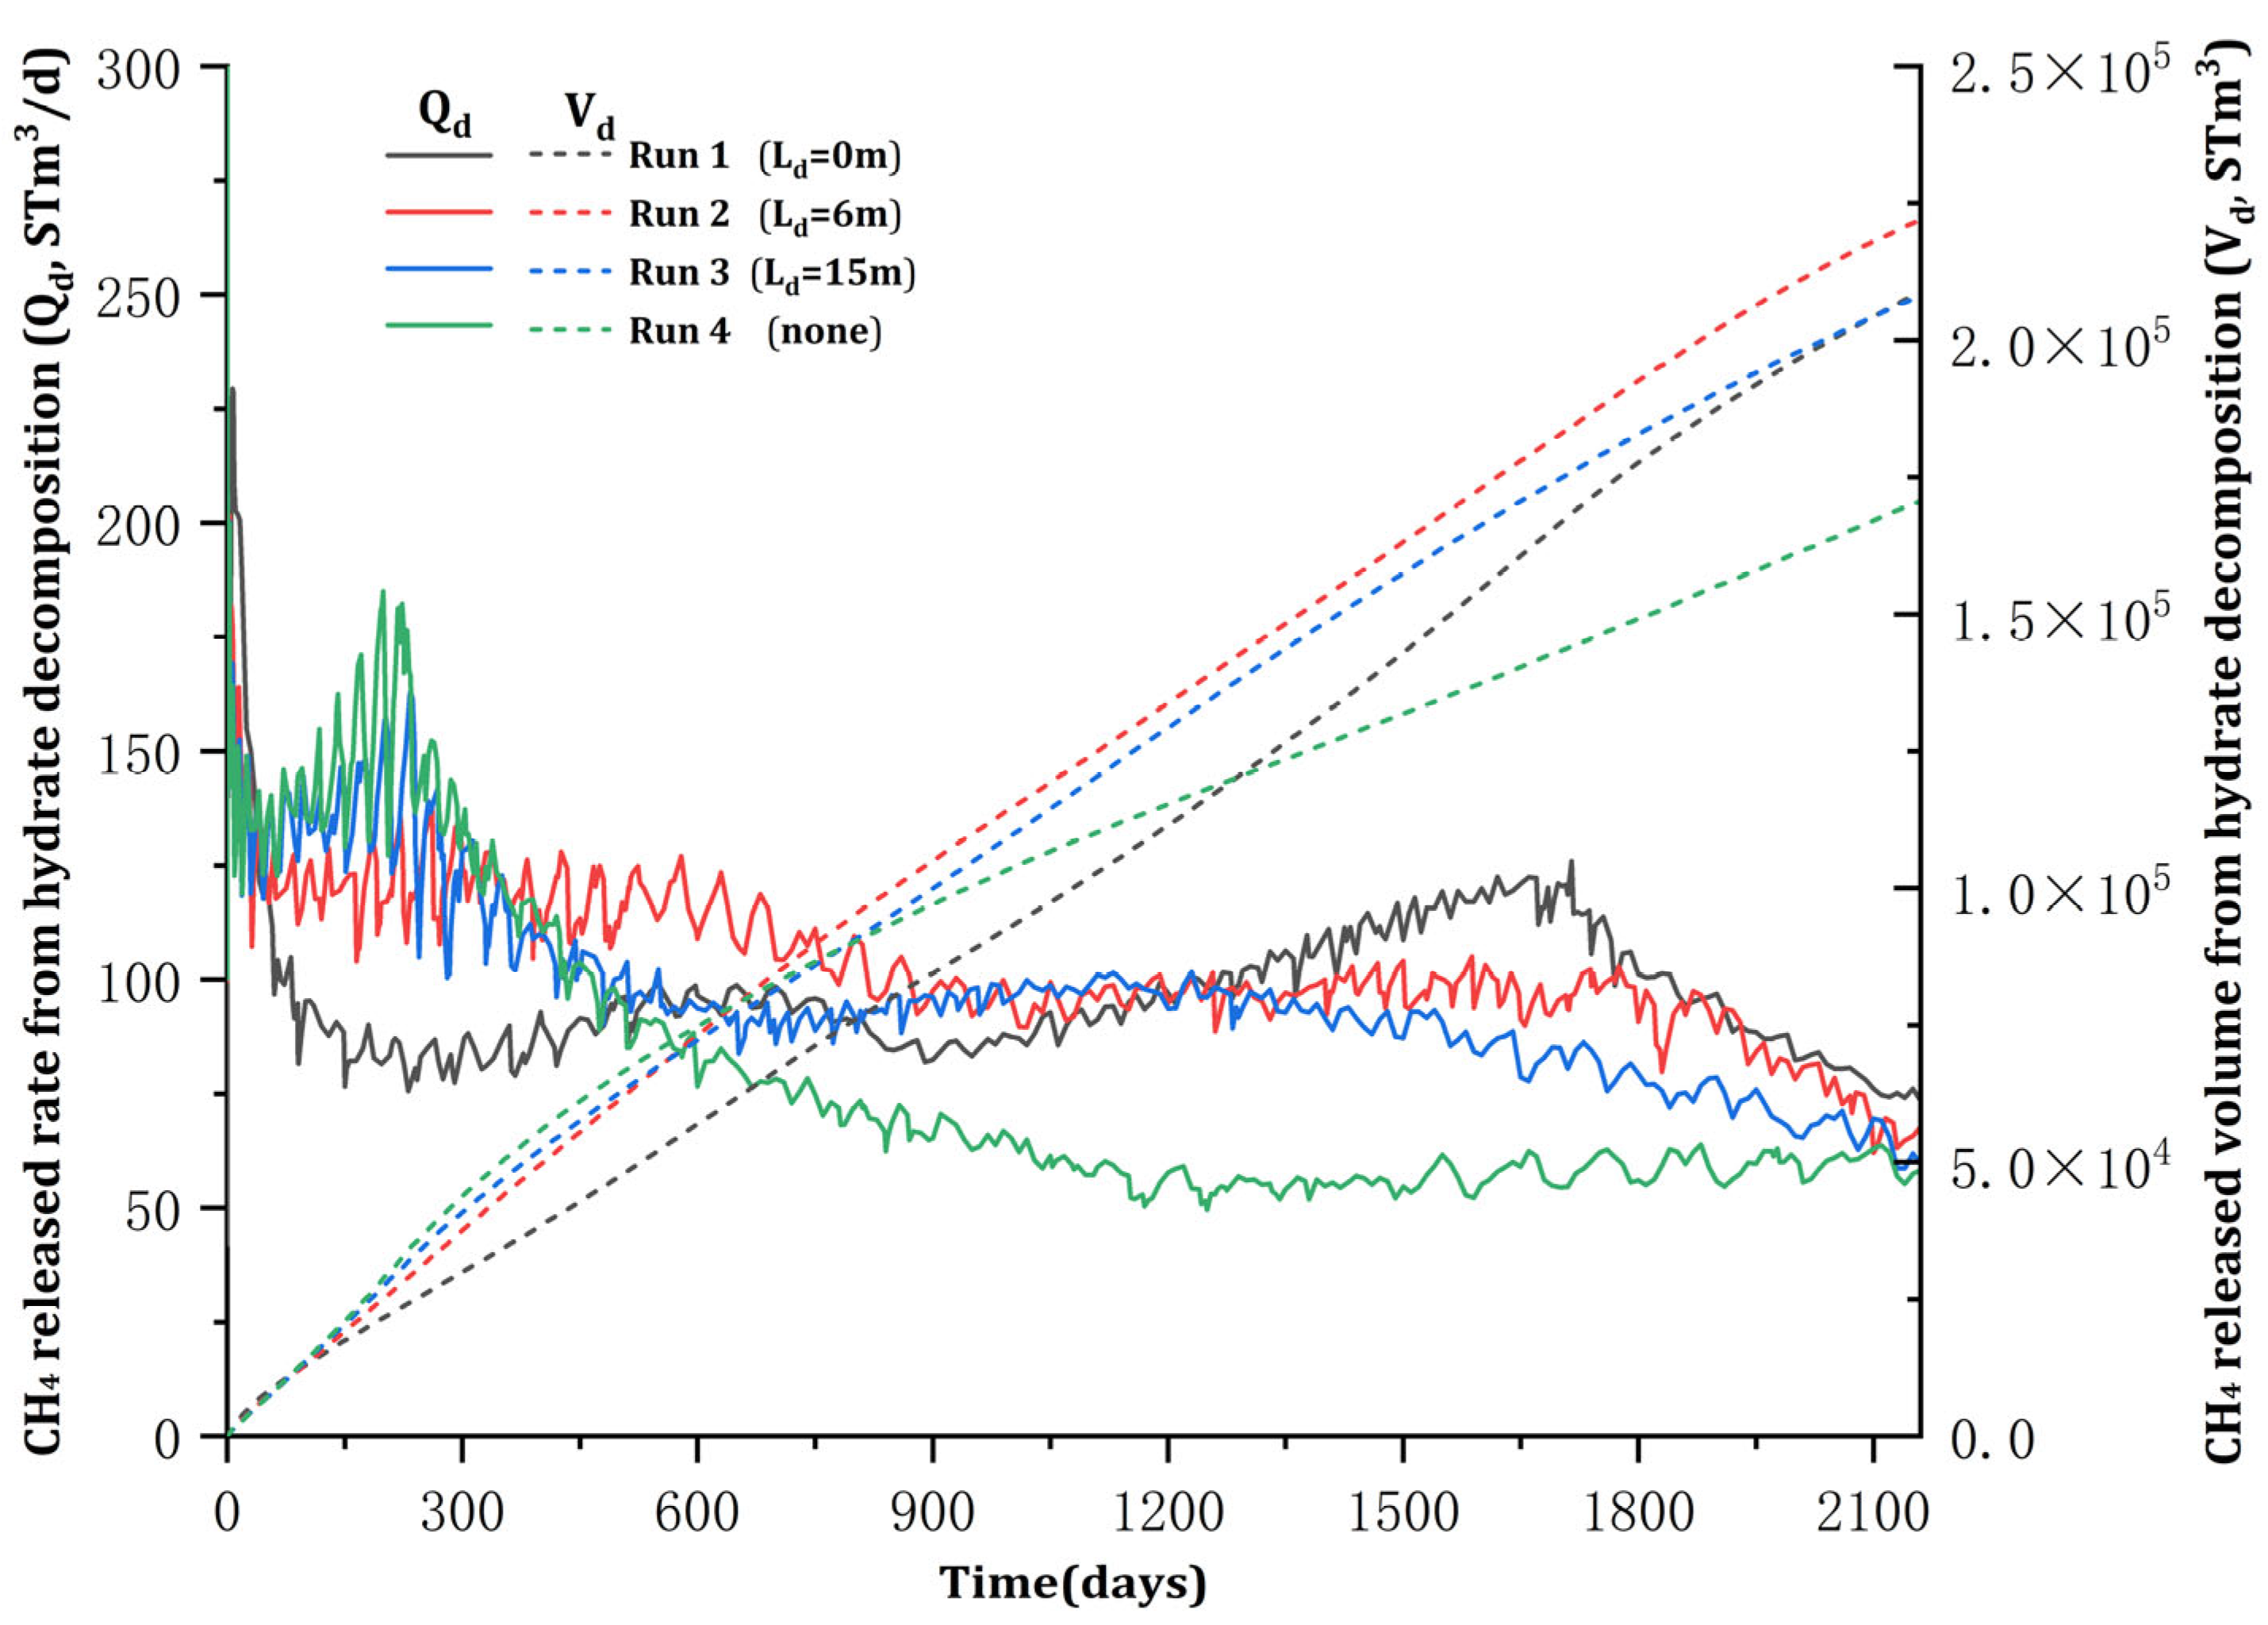
Figure 7 illustrates the variation of gas release rate (Qd) and gas release volume (Vd) from NGH dissociation in the production process. The Qd of Run 1 decreases in the early stage (within 200 d), then fluctuates and increases, reaching a peak of 125.9 m3/d at 1700 d. Afterwards, it decreases rapidly. There are two reasons for the decrease of Qd in the early stage. Firstly, the diffusion of hot water is hindered by sealing boundaries, which inhibits the thermal decomposition of hydrate. Secondly, the hydrate dissociation around Wellpro is inhibited since the heat supplement is not enough. In the middle stage of hydrate exploitation (200–1700 d), the sealing boundaries of Run 1 ensure that the heat and pressure of the hot water from Wellinj are not wasted in the overburden and underburden. Moreover, the continuous injection of hot water provides enough heat for the hydrate dissociation around Wellpro. Hence, the Qd increases. In the later stage, the amount of remaining hydrate in GHL is small, causing a continuous decline in Qd. The variation of Qd in Runs 2–3 is similar. They increase rapidly in the early stage, reaching the peak value of 136.48 m3/d and 130.48 m3/d, respectively, at about 200 d. Then, they fluctuate and decrease. The early increase in Qd is attributed to the thermal decomposition of hydrates around Wellinj. As mentioned earlier, the intrusive pore water from highly permeable free zones can also provide heat for the hydrate dissociation around Wellpro. That could also explain the increase in Qd. The decrease of Qd in the middle stage is due to the loss of heat and pressure of hot water in highly permeable free zones to some extent, which is detrimental to hydrate thermal dissociation. With the progress of production, the total hydrate amount continues to decrease in the later stage, and a substantial amount of hot water migrates to Wellpro, resulting in the decrease of Qd.
As for Run 4, it has a greater Qd value than Runs 1–3 within 400 d, indicating that the intrusion water from overburden and underburden is beneficial to the hydrate decomposition around Wellpro. Moreover, although the variation of Qd in Run 4 is similar to that in Runs 2–3 in the early and middle stages, Qd in the former is much lower than that in the latter for most of the hydrate production period. This result demonstrates that it is necessary to set sealing boundaries in the overburden and underburden since it can inhibit the loss of heat and improve the thermal decomposition efficiency of hydrate.
After NGH exploitation, the Vd values of Runs 1–4 are 2.09 × 10⁵ m3, 2.22 × 10⁵ m3, 2.08 × 10⁵ m3, and 1.71 × 10⁵ m3, respectively. Compared to Run 4, the Vd values for Runs 1–3 increase by 22.4%, 30.1%, and 22.0%, respectively. The results indicate that the presence of sealing boundaries in the overburden and underburden can improve the dissociation efficiency of NGH. However, the degree of improvement does not always intensify with increasing sealing distance. There exists an optimal sealing distance that allows hot water to decompose hydrate most rapidly. Under the simulation conditions in this work, the NGH dissociation efficiency is most improved when the sealing distance is 6 m. In conclusion, selecting the appropriate sealing distance is extremely important in practical hydrate mining engineering using D + Hi.

3.3. CH4 Production Behavior

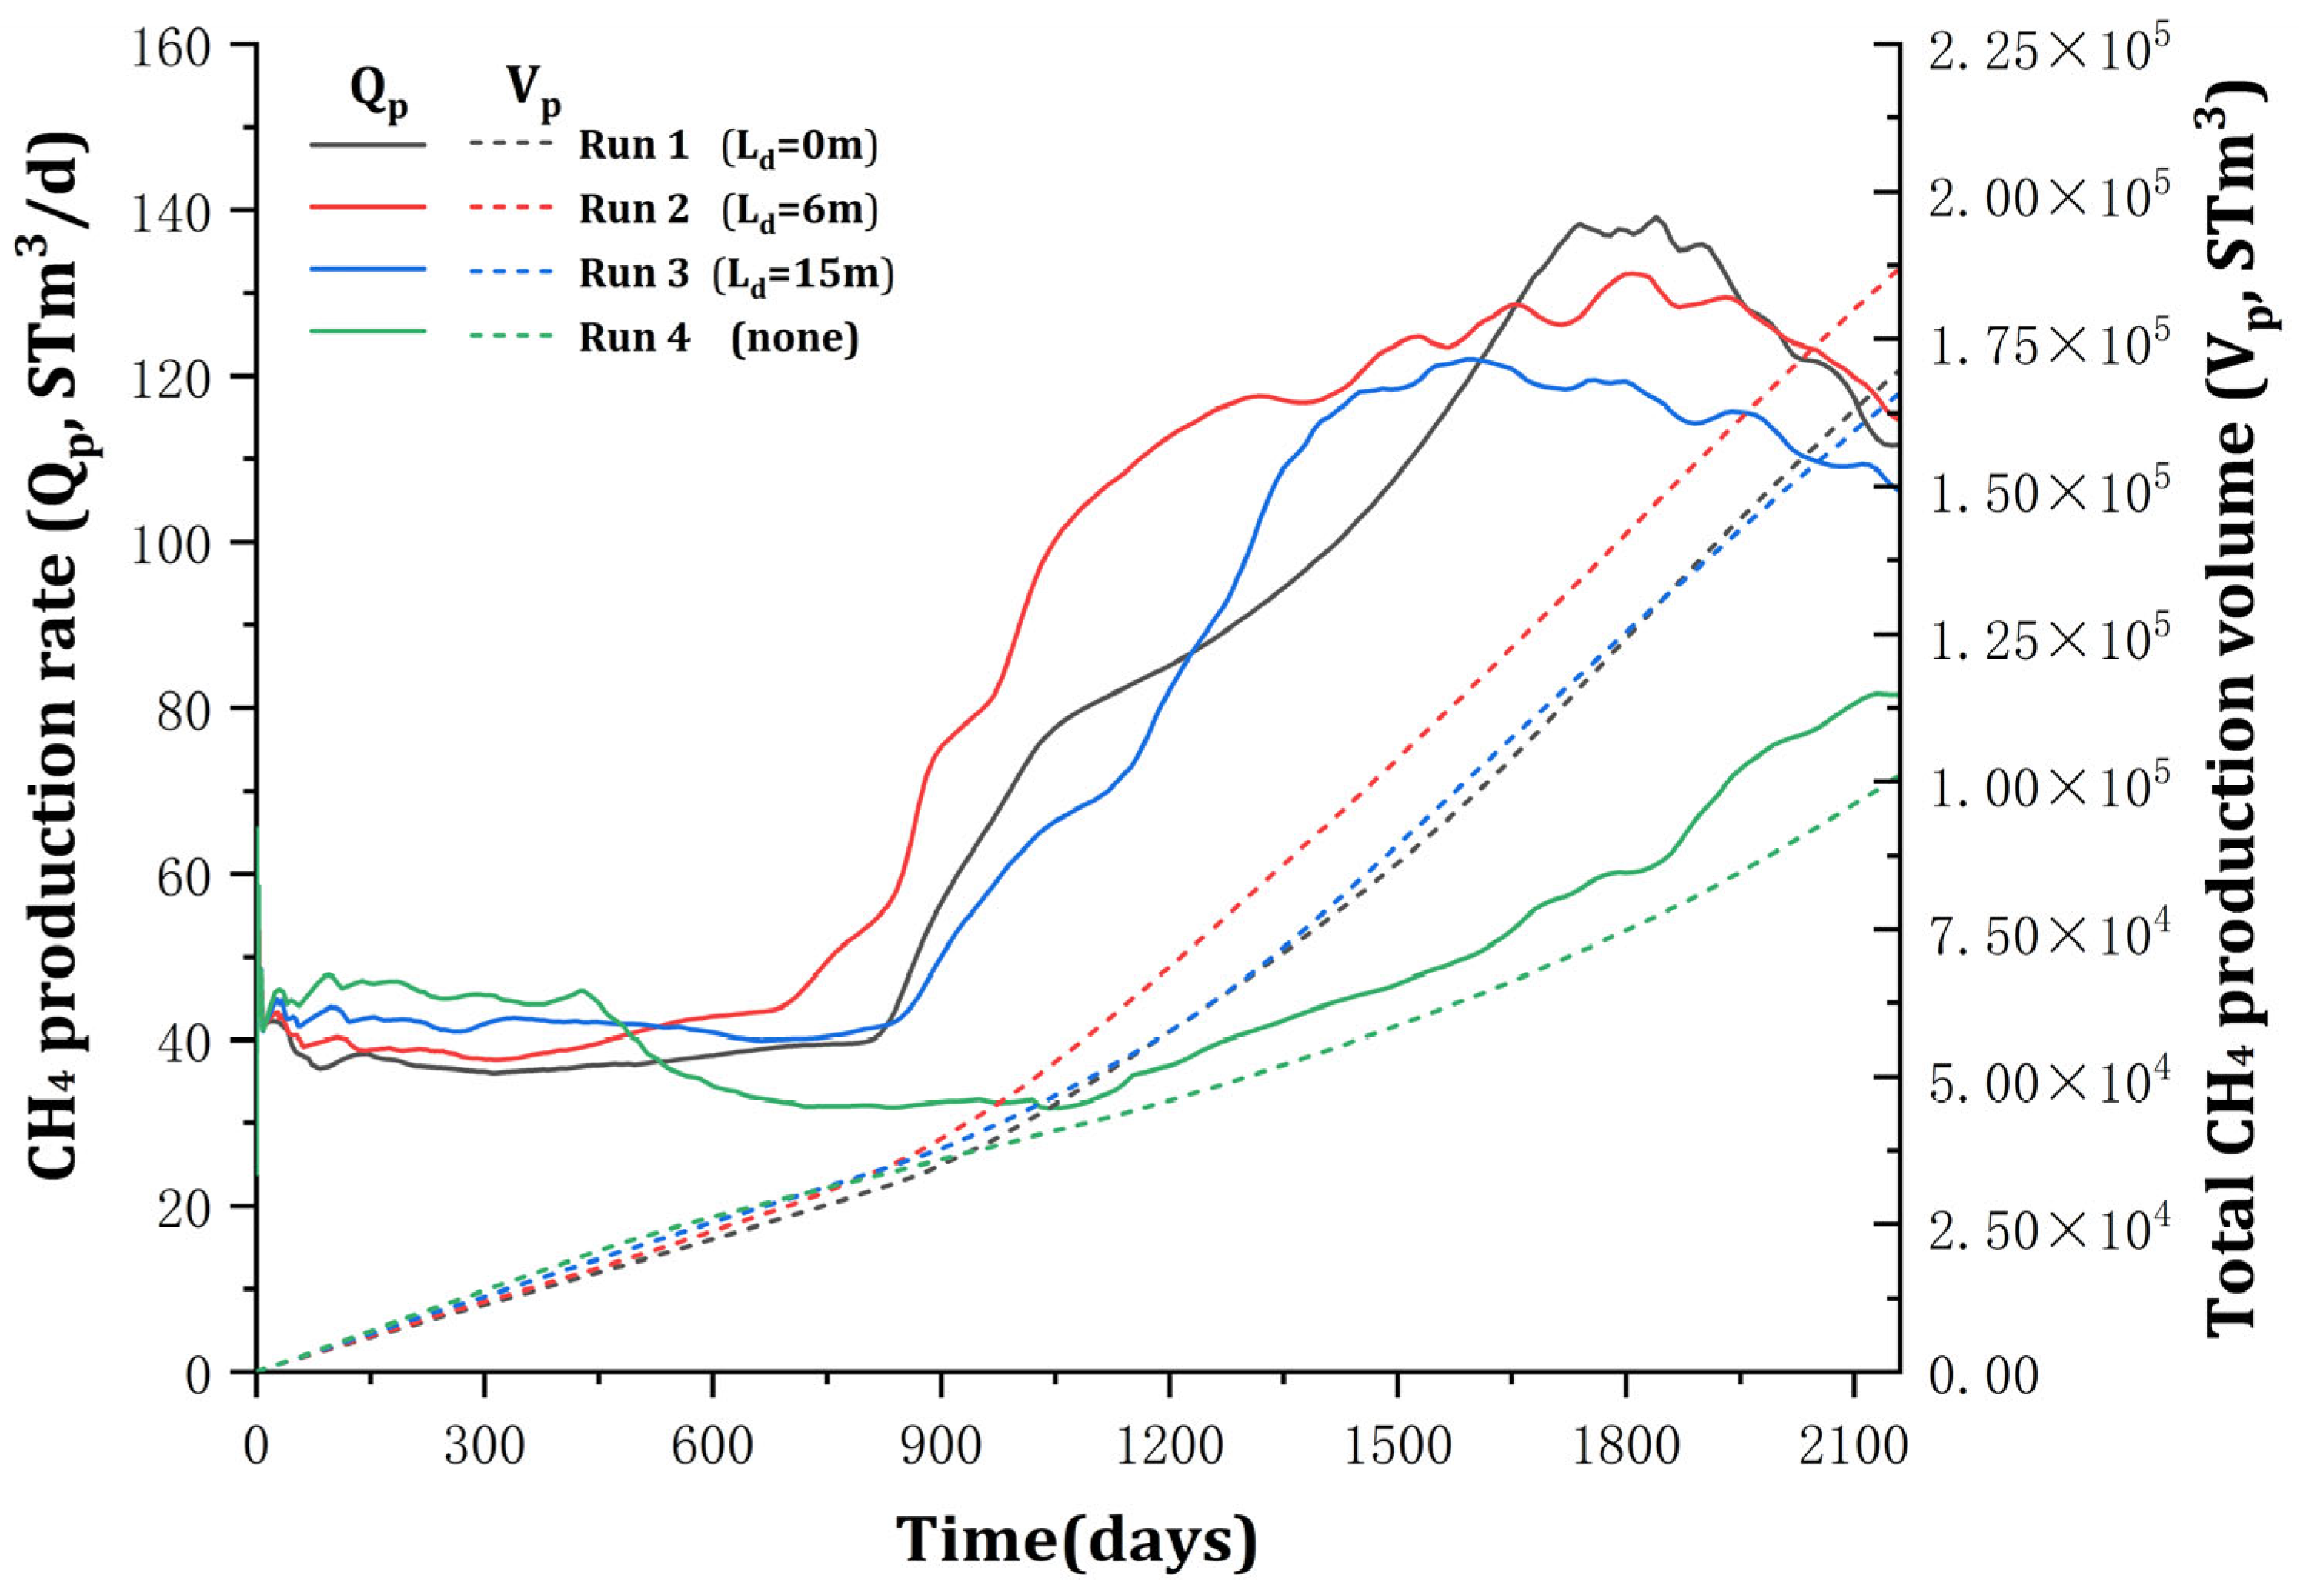
The variation of CH4 production rate (Qp) and CH4 production volume (Vp) for all runs is shown in Figure 8. It is found that Runs 1–3 have a similar Qp evolutionary process. They are almost stable in the early stage (within 750 d), increasing sharply after 750 d. Then, they reach peak values of 132.29 m3/d, 139.0 m3/d, and 122.03 m3/d, respectively, at about 1700 d. It should be noted that Runs 2–3 have a greater Qp value than Run 1 in the early stage. This is because the intrusive pore water in Runs 2–3 drives CH4 into Wellpro faster and provides more heat for the hydrate dissociation induced by depressurization. Under the low-pressure induction of Wellpro, hot water drives CH4 into Wellpro and provides heat for depressurization-induced hydrate decomposition, thus causing a sudden increase in Qp of Runs 1–3. Additionally, it is interestingly found that the surge of Qp in Run 2 appears the earliest, followed by Run 1 and Run 3. This is attributed to the fact that the highly permeable free zones of Run 2 are smaller than that of Run 3, and the hot water drives CH4 into Wellpro faster through the free zones. Meanwhile, there is no free zone in Run 1, and CH4 must penetrate GHL with a struggle to reach Wellpro. After 1800 d, the Qp of the three runs decreases due to the reduction of the residual amount of incompletely decomposed hydrate.
On the aspect of the Qp of Run 4 in Figure 8, it is found that the Qp of Run 4 is higher than that of Runs 1–3 since a substantial amount of intrusive water drives gas into the Wellpro within 450 d. As production proceeds, Qp in Run 4 suddenly increases at a time significantly later than in Runs 1–3. This result is due to the fact that the heat and pressure of the hot water in Run 4 are greatly lost in the overburden and underburden (it is demonstrated by T distribution in Figure 5), which causes the hot water to enter Wellpro slowly. It indicates that the lack of sealing boundaries in the overburden and underburden is detrimental to CH4 recovery during hydrate production. After 500 d, the Qp of Runs 1–3 is higher than that of Run 4, indicating that the contribution of the presence of sealing boundaries to gas recovery is beginning to appear.
After production, the Vp values of Runs 1–4 are 1.70 × 10⁵ m3, 1.87 × 10⁵ m3, 1.66 × 10⁵ m3, and 1.01 × 10⁵ m3, respectively. Compared to Run 4, the Vp values for Runs 1–3 increase by 68.0%, 85.1%, and 63.9%, respectively. The findings indicate that the presence of sealing boundaries in the overburden and underburden can improve the CH4 production efficiency of hydrate extraction. However, the degree of improvement does not always strengthen with increasing sealing distance. There exists an optimal sealing distance that allows hot water to drive CH4 to Wellpro most rapidly. Under the simulation conditions in this work, the gas production efficiency is most improved when the sealing distance is 6 m. In addition, the maximum Qp per unit length of production well is calculated to be 43.3 m3/d, which is significantly larger than the value obtained by Jin et al. [15]. This result emphasizes the necessity of boundary sealing.
To further investigate gas production behavior, the variations of the CH4 recovery ratio (Rpd = Vp/Vd) for all runs are compared and analyzed. Figure 9 illustrates the evolution of Rpd in all runs during hydrate production. It is found that the Rpd of all runs shows an increasing trend. In particular, the Rpd of Runs 1–3 increases sharply at 750–900 d, corresponding to the time of Qp increase. This result is caused by the hot water from Wellinj driving CH4 into Wellpro. However, compared to the former three runs, the Rpd of Run 4 does not increase steeply after 750 d. This is understandable given that the growth rate of Qp in Run 4 is noticeably lower than that in Runs 1–3. After NGH exploitation, the order of Rpd value is Run 2 > Run 1 > Run 3 > Run 4. This result indicates that the presence of sealing boundaries is beneficial to improve Rpd during hydrate exploitation. The maximum improvement is achieved at a sealing distance of 6 m.

3.4. Water Production Behavior

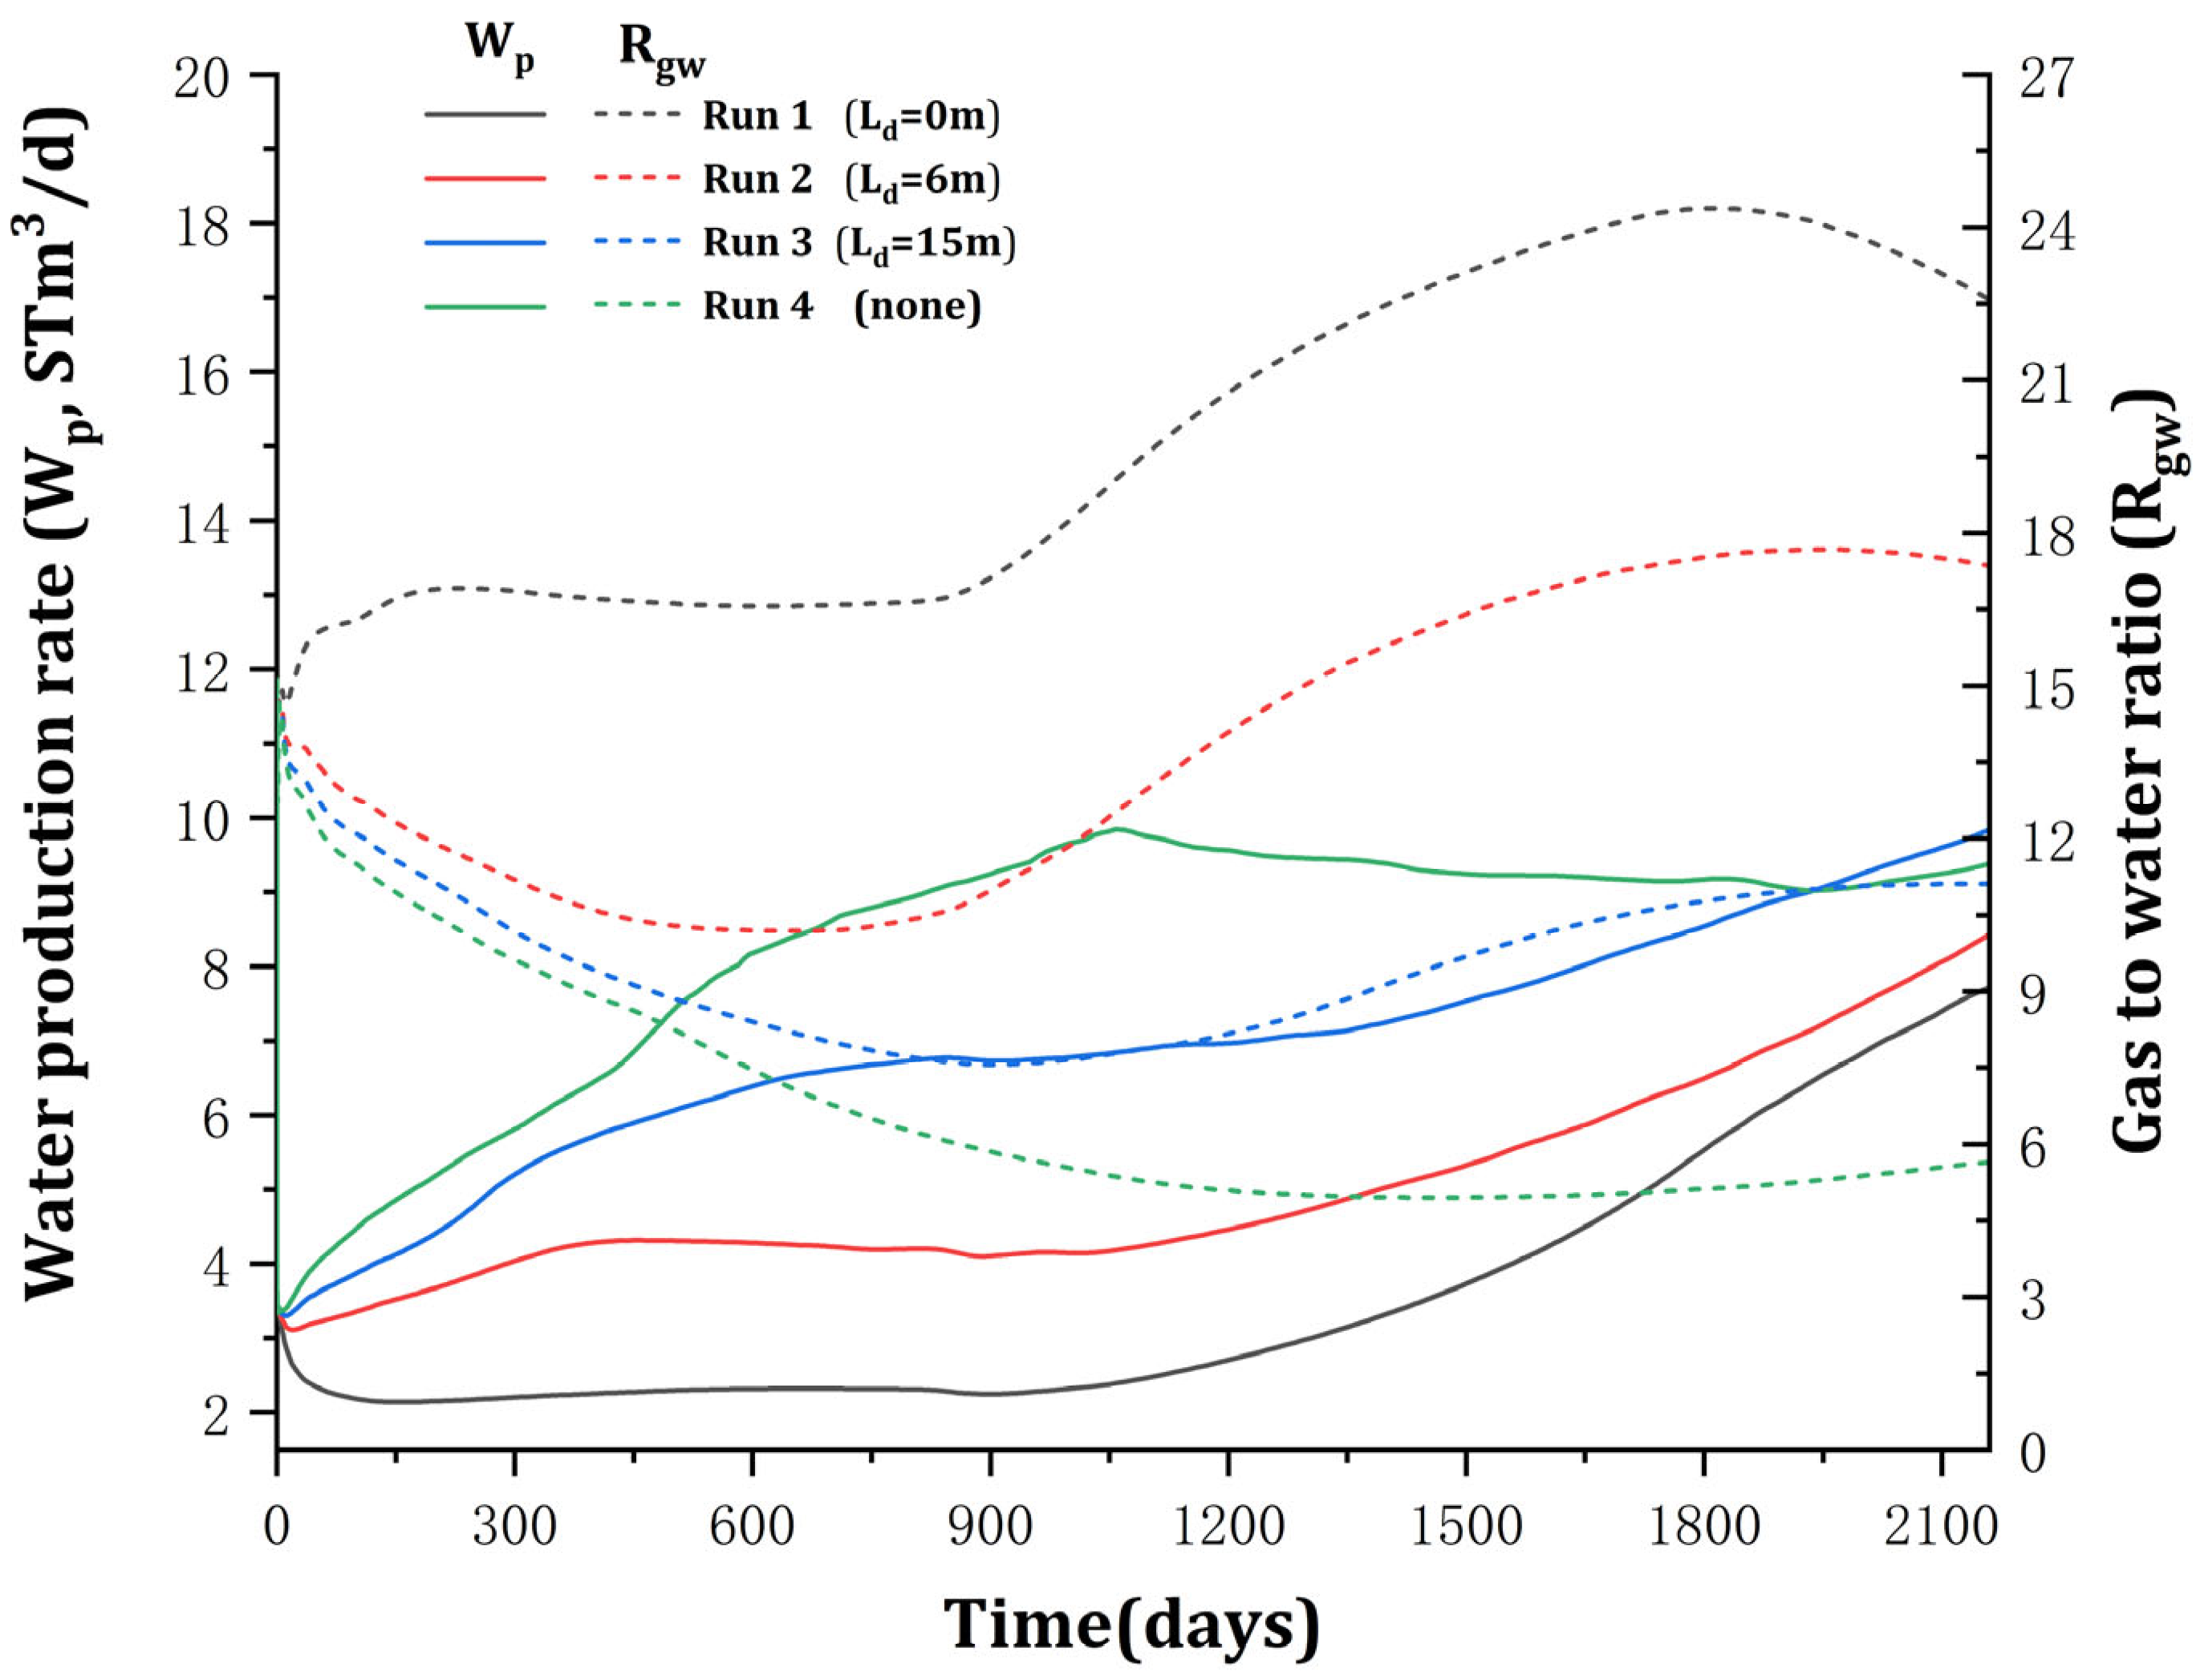
The variation of water production rate (Wp) in all runs during hydrate exploitation is shown in Figure 10. It is found that the Wp of Run 1 decreases within 100 d, stabilizes, and then increases at about 900 d. These observations are related to the water migration in hydrate reservoirs. There are three types of water in the reservoir during hydrate extraction: (1) water produced by hydrate dissociation; (2) pore water in GHL, highly permeable free zones, or overburden and underburden; (3) thermal water from Wellinj. Within 100 d, the Wp of Run 1 is mainly contributed by the hydrate dissociation water and pore water in GHL. The Wp decreases due to a decrease in the hydrate dissociation rate caused by depressurization, leading to a decrease in the hydrate decomposition water supply. When the hot water from Wellinj enters Wellpro at 900 d, the Wp increases. For Run 2 and Run 3, the variation trend of their Wp is consistent with Run 1. However, in the initial 400 d of production, the water entering Wellpro contains a large amount of pore water from free zones in addition to hydrate decomposition water and pore water in GHL. As a result, the Wp of Runs 2–3 continues to grow during this period. Moreover, the Wp of Runs 2–3 is noticeably greater than that of Run 1 throughout the NGH exploitation cycle. On the other hand, the Wp of Run 4 increases within 1050 d under the intrusion of large amounts of pore water in the overburden and underburden. However, it decreases slightly afterward. This is due to the fact that the hot water drives CH4 into Wellpro, and the gas accounts for a larger percentage of the volume of fluid entering Wellpro. Additionally, it is easily found that Run 4 has a Wp value considerably greater than Runs 1–3 throughout the hydrate production process.
As for Rgw (Rgw = Vp/Vw, Vw is water production volume) in Figure 10, it is found that Runs 1–3 have a similar Rgw evolutionary process. From 900 d to 1800 d, the Rgw in Runs 1–3 all have a rapid growth stage even though their Wp is increasing during this period. This is understandable considering that the growth rate of Qp in Runs 1–3 is much greater than that of Wp. As for Run 4, the Rgw remains at a low level after 900 d due to the pore water in the overburden and underburden being able to continuously enter Wellpro. After NGH exploitation, the Rgw of Runs 1–4 is 22.59, 17.35, 11.0, and 5.65, respectively. Compared to Run 4, the Rgw values for Runs 1–3 increase by 299.9%, 207.1%, and 96.6%, respectively. The above results demonstrate that the presence of sealing boundaries can significantly reduce water production and increase Rgw during hydrate production. The smaller the sealing distance, the less significant the water production phenomenon. In fact, a large amount of water production in the process of hydrate exploitation is a phenomenon that engineers are trying to avoid. However, it should be noted that the sealing distance set in a reservoir is not better when smaller, considering the hydrate decomposition efficiency and gas production efficiency.

3.5. Energy Efficiency

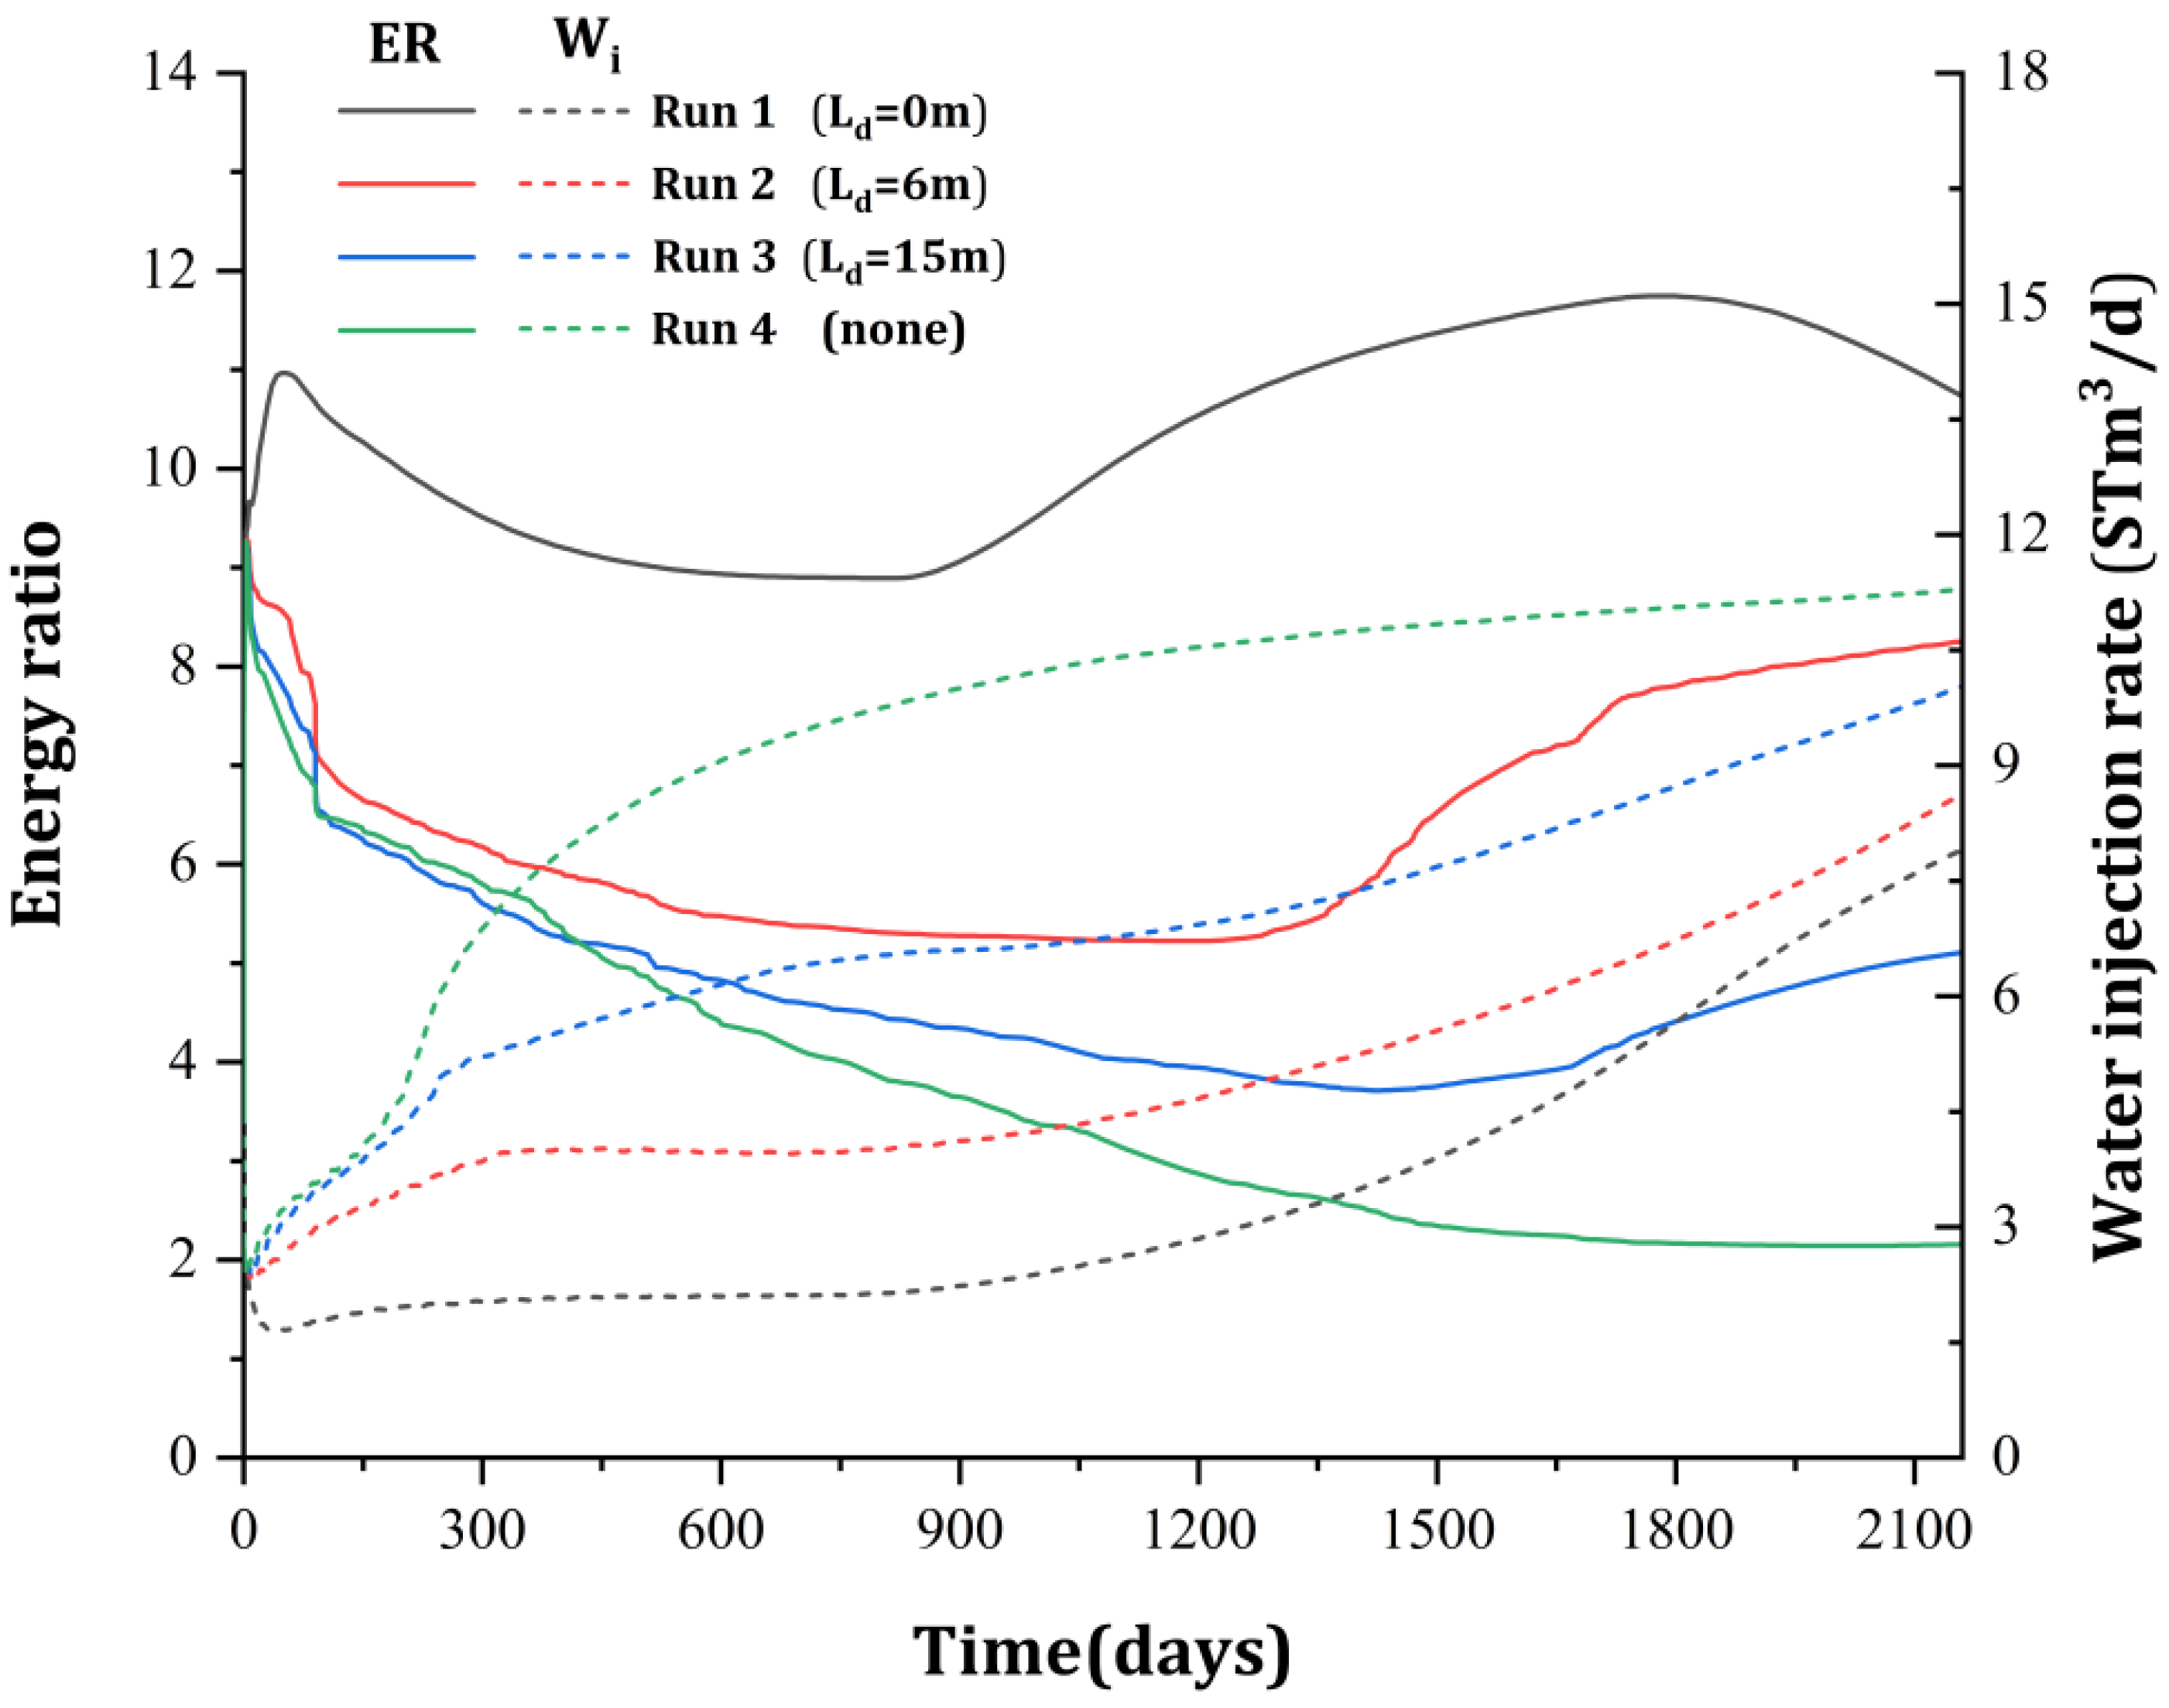
During NGH extraction using D + Hi, energy efficiency (ER, defined as the ratio of combustion heat of total produced CH4 to the heat consumed during hot water injection) is an important metric for evaluating the potential for exploiting hydrate reservoirs. The evolution of ER in Runs 1–4 during hydrate production is illustrated in Figure 11. It is found that the ER of Run 1 increases sharply within 100 d. This is understandable since the hot water from Wellinj is thoroughly blocked in GHL under the effect of sealing boundaries, resulting in Wi (hot water injection rate, shown in Figure 11) decreasing rapidly during the period. Then, the ER of Run 1 decreases at 100–900 d due to the fact that the gas produced by hydrate thermal dissociation around Wellinj has not yet entered Wellpro. Subsequently, the variation trend of ER is dominated by the variation in Qp because of a large amount of thermal-induced CH4 continuously flowing into Wellpro despite the gradual increase in Wi after 900 d.
On the other hand, the Wi of Runs 2–4 increases rapidly within 100 d due to the rapid transport of the hot water from Wellinj to highly permeable free zones or to permeable overburden and underburden. This is responsible for the decrease in the ER of Runs 2–4. As the Wi of Runs 2–4 continues to rise, the ER also continues to decline. After 1300 d, the ER of Runs 2–3 increases steeply as hot water drives CH4 from highly permeable free zones into Wellpro. However, the ER of Run 4 does not show an increasing trend due to the extensive diffusion of CH4 formed by hydrate thermal decomposition into the overburden and underburden (see Figure 6). After NGH exploitation, the ER values in Runs 1–4 are 10.73, 8.20, 5.28, and 2.36, respectively. Compared to Run 4, the ER values for Runs 1–3 increase by 354.2%, 247.2%, and 123.6%, respectively. The above results suggest that the presence of sealing boundaries can dramatically improve ER in the exploitation process of NGH. Moreover, the smaller the sealing distance, the more improvement can be achieved.

4. Conclusions

The effects of permeable boundary sealing on the behavior of hydrate exploitation via depressurization combined with heat injection were numerically investigated. The conclusions can be obtained as follows.
(1) The presence of sealing boundaries can significantly improve Qd and Vd because the diffusion of hot water is restricted, which reduces substantial energy loss. The Vd of the NGH reservoir with sealing boundaries is 22.0–30.1% higher than that of the reservoir without sealing boundaries after production. On the other hand, excessive sealing distance increases the energy loss of hot water and reduces the promoting effect on Qd and Vd. There is an optimal sealing distance between 0–15 m to maximize the hydrate decomposition efficiency.
(2) The presence of sealing boundaries can significantly improve Qp, Vp, and Rpd because the diffusion of CH4 is confined to the region between sealing boundaries and the edge of the NGH reservoir, and the CH4 is simultaneously driven by hot water. On the other hand, the increase in sealing distance accelerates the CH4 migration rate and increases Qp. However, the excessive sealing distance increases the residual gas quantity in the overburden and underburden at the later stage of production, resulting in the improved effect of the sealing boundary on Qp and Vp being reduced. There is an optimal sealing distance between 0–15 m to maximize the value of Vp.
(3) The presence of sealing boundaries can reduce water production and energy loss. Therefore, compared with the NGH reservoir without sealing boundaries, the Rgw and ER of the reservoir with sealing boundaries get a significant promotion. The ER increases by 123.6–354.2%, and the Rgw increases by 96.6–299.9%.
This study demonstrates the effectiveness of boundary sealing in increasing hydrate production. The results obtained can provide theoretical and technical support for the exploitation of marine NGH using D + Hi. In future works, the sensitivity of hydrate decomposition behavior and gas production behavior of hydrate reservoirs containing sealing boundaries to thermal injection technology parameters (injection pressure, injection temperature) and production technology parameters (production pressure, continuous/intermittent depressurization) should be considered. Moreover, the economic benefit evaluation of hydrate mining should also be conducted.

Author Contributions

Y.W.: Formal analysis, Writing—original draft. Y.Z.: Formal analysis, Data curation. X.Z.: Methodology. D.P.: Conceptualization, Methodology, Writing—review and editing. C.C.: Formal analysis. All authors have read and agreed to the published version of the manuscript.

Funding

This work was financially supported by Jiangxi Provincial Natural Science Foundation (No.20224BAB213044), and Jiangxi Provincial Key Laboratory of Environmental Pollution Prevention and Control in Mining and Metallurgy (2023SSY01071).

Data Availability Statement

The original contributions presented in the study are included in the article, further inquiries can be directed to the corresponding author.

Conflicts of Interest

Author Yihan Wang was employed by the company Ganzhou Water Limited Company. The remaining authors declare that the research was conducted in the absence of any commercial or financial relationships that could be construed as a potential conflict of interest.

References

  1. Sloan, E.D.; Koh, C.A. Clathrate Hydrates of Natural Gases, 3rd ed.; CRC Press: Boca Raton, FL, USA, 2007. [Google Scholar]
  2. Boswell, R.; Shipp, C.; Reichel, T.; Shelander, D.; Saeki, T.; Frye, M.; Shedd, W.; Collett, T.S.; McConnell, D.R. Prospecting for marine gas hydrate resources. Interpretation 2016, 4, SA13–SA24. [Google Scholar] [CrossRef]
  3. Konno, Y.; Fujii, T.; Sato, A.; Akamine, K.; Naiki, M.; Masuda, Y.; Yamamoto, K.; Nagao, J. Key findings of the world’s first offshore methane hydrate production test off the coast of Japan: Toward future commercial production. Energy Fuels 2017, 31, 2607–2616. [Google Scholar] [CrossRef]
  4. Klymenko, V.; Ovetskyi, S.; Martynenko, V.; Vytiaz, O.; Uhrynovskyi, A. An alternative method of methane production from deposits of subaquatic gas hydrates. Min. Miner. Depos. 2022, 16, 11–17. [Google Scholar] [CrossRef]
  5. Bazaluk, O.; Sai, K.; Lozynskyi, V.; Petlovanyi, M.; Saik, P. Research into Dissociation Zones of Gas Hydrate Deposits with a Heterogeneous Structure in the Black Sea. Energies 2021, 14, 1345. [Google Scholar] [CrossRef]
  6. Chong, Z.R.; Yang, S.H.B.; Babu, P.; Linga, P.; Li, X.S. Review of natural gas hydrates as an energy resource: Prospects and challenges. Appl. Energy 2016, 162, 1633–1652. [Google Scholar] [CrossRef]
  7. Zhou, S.; Zhao, J.; Li, Q.; Chen, W.; Zhou, J.; Wei, N.; Guo, P.; Sun, W. Optimal design of the engineering parameters for the first global trial production of marine natural gas hydrates through solid fluidization. Nat. Gas. Ind. B 2018, 5, 118–131. [Google Scholar] [CrossRef]
  8. Wang, L.; Wang, G. Experimental and Theoretical Study on the Critical Breaking Velocity of Marine Natural Gas Hydrate Sediments Breaking by Water Jet. Energies 2020, 13, 1725. [Google Scholar] [CrossRef]
  9. Sun, T.; Chen, F.; Zhong, L.; Liu, W.; Wang, Y. GIS-based mineral prospectivity mapping using machine learning methods: A case study from Tongling ore district, eastern China. Ore Geol. Rev 2019, 109, 26–49. [Google Scholar] [CrossRef]
  10. Jin, G.; Peng, Y.; Liu, L.; Su, Z.; Liu, J.; Li, T.; Wu, D. Enhancement of gas production from low-permeability hydrate by radially branched horizontal well: Shenhu Area, South China Sea. Energy 2022, 253, 124129. [Google Scholar] [CrossRef]
  11. Moridis, G.J.; Reagan, M.T.; Boyle, K.L.; Zhang, K. Evaluation of the gas production potential of some particularly challenging types of oceanic hydrate deposits. Transp. Porous Media 2011, 90, 269–299. [Google Scholar] [CrossRef]
  12. Chibura, P.E.; Zhang, W.; Luo, A.; Wang, J. A review on gas hydrate production feasibility for permafrost and marine hydrates. J. Nat. Gas Sci. Eng. 2022, 100, 104441. [Google Scholar] [CrossRef]
  13. Ning, F.; Chen, Q.; Sun, J.; Wu, X.; Cui, G.; Mao, P.; Li, Y.; Liu, T.; Jiang, G.; Wu, N. Enhanced gas production of silty clay hydrate reservoirs using multilateral wells and reservoir reformation techniques: Numerical simulations. Energy 2022, 254, 124220. [Google Scholar] [CrossRef]
  14. Makogon, Y.; Omelchenko, R. Commercial gas production from Messoyakha deposit in hydrate conditions. J. Nat. Gas Sci. Eng. 2013, 11, 1–6. [Google Scholar] [CrossRef]
  15. Jin, G.; Xu, T.; Wei, M.; Liu, C. Numerical evaluation of the methane production from unconfined gas hydrate-bearing sediment by thermal stimulation and depressurization in Shenhu area, South China Sea. J. Nat. Gas. Sci. Eng. 2016, 33, 497–508. [Google Scholar] [CrossRef]
  16. Feng, J.C.; Wang, Y.; Li, X.S.; Li, G.; Chen, Z.Y. Production behaviors and heat transfer characteristics of methane hydrate dissociation by depressurization in conjunction with warm water stimulation with dual horizontal wells. Energy 2015, 79, 315–324. [Google Scholar] [CrossRef]
  17. Feng, J.C.; Li, G.; Li, X.S.; Li, B.; Chen, Z.Y. Evolution of hydrate dissociation by warm brine stimulation combined depressurization in the South China Sea. Energies 2013, 6, 5402–5425. [Google Scholar] [CrossRef]
  18. Ye, J.; Qin, X.; Xie, W.; Lu, H.; Ma, B.; Qiu, H.; Liang, J.; Lu, J.; Kuang, Z.; Lu, C.; et al. Main progress of the second gas hydrate trial production in the South China Sea. China Geol. 2020, 47, 57–68. [Google Scholar]
  19. Ma, X.; Sun, Y.; Guo, W.; Jia, R.; Li, B. Numerical simulation of horizontal well hydraulic fracturing technology for gas production from hydrate reservoir. Appl. Ocean Res. 2021, 112, 102674. [Google Scholar] [CrossRef]
  20. Yu, T.; Guan, G.; Wang, D.; Song, Y.; Abudula, A. Gas production enhancement from a Multilayered hydrate reservoir in the South China sea by hydraulic fracturing. Energy Fuels 2021, 35, 1210418. [Google Scholar] [CrossRef]
  21. Yang, L.; Ye, J.; Qin, X.; Liang, Q.; Wu, X. Effects of the seepage capability of overlying and underlying strata of marine hydrate system on depressurization-induced hydrate production behaviors by horizontal well. Mar. Pet. Geol. 2021, 128, 105019. [Google Scholar] [CrossRef]
  22. Su, Z.; He, Y.; Wu, N.; Zhang, K.; Moridis, G.J. Evaluation on gas production potential from laminar hydrate deposits in Shenhu Area of South China Sea through depressurization using vertical wells. J. Pet. Sci. Eng. 2012, 86, 87–98. [Google Scholar] [CrossRef]
  23. Zhong, X.; Pan, D.; Zhai, L.; Zhu, Y.; Zhang, H.; Zhang, Y.; Wang, Y.; Li, X.; Chen, C. Evaluation of the gas production enhancement effect of hydraulic fracturing on combining depressurization with thermal stimulation from challenging ocean hydrate reservoirs. J. Nat. Gas Sci. Eng. 2020, 83, 103621. [Google Scholar] [CrossRef]
  24. Boswell, R.; Myshakin, E.; Moridis, G.; Konno, Y.; Collett, T.S.; Reagan, M.; Ajayi, T.; Seol, Y. India National Gas Hydrate Program Expedition 02 summary of scientific results: Numerical simulation of reservoir response to depressurization. Mar. Pet. Geol. 2019, 108, 154–166. [Google Scholar] [CrossRef]
  25. Fujii, T.; Suzuki, K.; Takayama, T.; Tamaki, M.; Komatsu, Y.; Konno, Y.; Yoneda, J.; Yamamoto, K.; Nagao, J. Geological setting and characterization of a methane hydrate reservoir distributed at the first offshore production test site on the Daini-Atsumi Knoll in the eastern Nankai Trough, Japan. Mar. Pet. Geol. 2015, 66, 310–322. [Google Scholar] [CrossRef]
  26. Wei, J.; Yang, L.; Liang, Q.; Liang, J.; Lu, J.; Zhang, W.; Zhang, X.; Lu, X. Geomechanical properties of gas hydrate-bearing sediments in Shenhu Area of the South China Sea. Energy Rep. 2021, 7, 8013–8020. [Google Scholar] [CrossRef]
  27. Ma, X.; Sun, Y.; Liu, B.; Guo, W.; Jia, R.; Li, B.; Li, S. Numerical study of depressurization and hot water injection for gas hydrate production in China’s first offshore test site. J. Nat. Gas Sci. Eng. 2020, 83, 103530. [Google Scholar] [CrossRef]
  28. Zhong, X.; Pan, D.; Zhu, Y.; Wang, Y.; Tu, G.; Nie, S.; Ma, Y.; Liu, K.; Chen, C. Commercial production potential evaluation of injection-production mode for CH-Bk hydrate reservoir and investigation of its stimulated potential by fracture network. Energy 2022, 239, 122113. [Google Scholar] [CrossRef]
  29. Chen, C.; Meng, Y.; Zhong, X.; Nie, S.; Ma, Y.; Pan, D.; Liu, K.; Li, X.; Gao, S. Research on the Influence of Injection–Production Parameters on Challenging Natural Gas Hydrate Exploitation Using Depressurization Combined with Thermal Injection Stimulated by Hydraulic Fracturing. Energy Fuels 2021, 35, 15589–15606. [Google Scholar] [CrossRef]
  30. Li, S.; Wu, D.; Wang, X.; Hao, Y. Enhanced gas production from marine hydrate reservoirs by hydraulic fracturing assisted with sealing burdens. Energy 2021, 232, 120889. [Google Scholar] [CrossRef]
  31. Zhang, W.; Liang, J.; Wei, J.; Su, P.; Lin, L.; Huang, W.; Guo, Y.; Deng, W.; Yang, X.; Wan, Z. Geological and geophysical features of and controls on occurrence and accumulation of gas hydrates in the first offshore gas-hydrate production test region in the Shenhu area, Northern South China Sea. Mar. Pet. Geol. 2020, 114, 104191. [Google Scholar] [CrossRef]
  32. Su, M.; Wang, H.; Sha, Z.; Liang, J.; Wu, N.; Qiao, S.; Cong, X.; Yang, R. Gas hydrates distribution in the Shenhu Area, northern South China Sea: Comparisons between the eight drilling sites with gas-hydrate petroleum system. Geol. Acta Int. Earth Sci. J. 2016, 14, 79–100. [Google Scholar]
  33. Li, G. Evaluation of the gas production potential of marine hydrate deposits in the Shenhu Area of the South China Sea. In Proceedings of the Offshore Technology Conference, Houston, TX, USA, 3 May 2010. [Google Scholar]
  34. Wu, N.; Yang, S.; Zhang, H.; Liang, J.; Wang, H.; Lu, J.A. Gas hydrate system of Shenhu area, northern South China Sea: Geochemical results. J. Geol. Res. 2011, 2011, 370298. [Google Scholar] [CrossRef]
  35. Moridis, G. Numerical studies of gas production from Class 2 and Class 3 hydrate accumulations at the Mallik Site, Mackenzie Delta, Canada. SPE Reserv. Eval. Eng. 2004, 7, 175–183. [Google Scholar] [CrossRef]
  36. Moridis, G.; Kowalsky, M.; Pruess, K. TOUGH+ Hydrate v1.0 User’s Manual: A Code for the Simulation of System Behaviour in Hydrate-Bearing Porous Media; Report LBNL-149E; Lawrence Berkeley National Laboratory: Berkeley, CA, USA, 2008. [Google Scholar]
  37. Moridis, G.J.; Reagan, M.T.; Queiruga, A.F.; Boswell, R. Evaluation of the performance of the oceanic hydrate accumulation at site NGHP-02-09 in the Krishna-Godavari Basin during a production test and during single and multi-well production scenarios. Mar. Pet. Geol. 2019, 108, 660–696. [Google Scholar] [CrossRef]
  38. Qin, X.; Liang, Q.; Ye, J.; Yang, L.; Qiu, H.; Liang, J.; Lu, C.; Lu, H.; Ma, B.; Kuang, Z. The response of temperature and pressure of hydrate reservoirs in the first gas hydrate production test in South China Sea. Appl. Energy 2020, 278, 115649. [Google Scholar] [CrossRef]
  39. Yin, Z.; Moridis, G.; Chong, Z.R.; Tan, H.K.; Linga, P. Numerical analysis of experimental studies of methane hydrate dissociation induced by depressurization in a sandy porous medium. Appl. Energy 2018, 230, 444–459. [Google Scholar] [CrossRef]
  40. Zhang, K.; Moridis, G.J.; Wu, N.; Li, X.; Reagan, M.T. Evaluation of alternative horizontal well designs for gas production from hydrate deposits in the Shenhu Area, South China Sea. In Proceedings of the International Oil and Gas Conference and Exhibition in China, Beijing, China, 8 June 2010. [Google Scholar]
  41. Van Genuchten, M.T. A closed-form equation for predicting the hydraulic conductivity of unsaturated soils. Soil. Sci. Soc. Am. J. 1980, 44, 892–898. [Google Scholar] [CrossRef]
  42. Boswell, R. Japan completes first offshore methane hydrate production test—Methane successfully produced from deepwater hydrate layers. Cent. Nat. Gas Oil 2013, 412, 386–7614. [Google Scholar]
Figure 1. Schematic diagram of reservoir sealing boundaries arrangement during hydrate extraction using D + T. (a) Vertical wells for hydrate exploitation; (b) Horizontal wells for hydrate exploitation.
Energies 17 05172 g001
Figure 2. The schematic of the geologic model.
Energies 17 05172 g002
Figure 3. The evolution of NGH saturation distribution of Runs 1–4 at different times. (a) 360 d; (b) 1080 d; (c) 2160 d.
Energies 17 05172 g003aEnergies 17 05172 g003b
Figure 4. The evolution of NGH reservoir temperature distribution of Runs 1–4 at different times. (a) 360 d; (b) 1080 d; (c) 2160 d.
Energies 17 05172 g004aEnergies 17 05172 g004b
Figure 5. The evolution of NGH reservoir pressure distribution of Runs 1–4 at different times. (a) 360 d; (b) 1080 d; (c) 2160 d.
Energies 17 05172 g005aEnergies 17 05172 g005b
Figure 6. The evolution of NGH reservoir gas saturation distribution of Runs 1–4 at different times. (a) 360 d; (b) 1080 d; (c) 2160 d.
Energies 17 05172 g006aEnergies 17 05172 g006b
Figure 7. CH4 release rate and CH4 release volume from NGH dissociation in Runs 1–4.
Energies 17 05172 g007
Figure 8. CH4 production rate and CH4 production volume in Runs 1–4.
Energies 17 05172 g008
Figure 9. Variation of gas recovery ratio of Runs 1–4 during hydrate exploitation.
Energies 17 05172 g009
Figure 10. Water production rate and gas-to-water ratio of Runs 1–4.
Energies 17 05172 g010
Figure 11. Energy efficiency and hot water injection rate of Runs 1–4.
Energies 17 05172 g011
Table 1. Summary of research results on the gas production capacity of marine NGH under depressurization or D + Hi mining conditions.
ReferencesExploitation MethodExploitation DurationAverage CH4 Production Rate
(m3/day/unit Production Well Length)
Type of Results
Second trial area of China [18]Depressurization30 day106Trial results
Ma et al. [19]Depressurization10 year10.3Simulation results
Yu et al. [20]Depressurization15 year5.23Simulation results
Yang et al. [21]Depressurization5 year21.9Simulation results
Su et al. [22]Depressurization3.5 year35.2Simulation results
Ning et al. [13]Depressurization5 year22.7Simulation results
Jin et al. [15]Depressurization combined heat injection 15 year37.5Simulation results
Feng et al. [17]Depressurization combined heat injection30 year61.5Simulation results
Zhong et al. [23]Depressurization combined heat injection3.5 year42.3Simulation results
Table 2. Initial conditions and model parameters.
ParametersUnit Value
Intrinsic porosity (Overburden and underburden, GHL) [33,34]Dimensionless0.38
Intrinsic permeability (Overburden and underburden, GHL) [26,33]mD20
Intrinsic permeability (sealing boundaries)mD0
The thickness of overburden m70
The thickness of GHL [33,34]m40
The thickness of underburdenm70
Gas hydrate saturation of GHL [26,33,34]Dimensionless0.44
Water salinity (mass fraction) [26,40] 0.03
Water saturation (overburden and underburden) [26,33,34]Dimensionless1.00
Geothermal gradient [34]°C/100 m5
Pressure gradientMPa/m0.01
GHL center temperature [26,34]°C15.29
CHL center pressure [26,34]MPa14.55
Rock density [34,40]kg/m32600
Capillary pressure model [41] P c a p = P 0 S A S i r A 1 S i r A 1 / λ 1 1 λ
Entry capillary pressure ( P 0 ) [23,40] Pa 1.0 × 10⁵
Pore structure index (λ) [23,40] 0.45
Relative permeability model [36] k r A = S A S i r A 1 S i r A n 0
k r G = S G S i r G 1 S i r A n G
Irreducible aqueous saturation ( S i r A ) [23,40] 0.30
Irreducible gas saturation ( S i r G ) [23,40] 0.03
Aqueous phase index ( n 0 ) [23] 3.5
Gas phase index ( n G ) [23,40] 3.5
Table 3. Simulation schemes for the research of the impact of the sealing boundary on hydrate exploitation.
RunsVertical Distance of Sealing Boundaries/mTi/°CPi/MPaPp/MPa
1040204.5
26
315
4none
Disclaimer/Publisher’s Note: The statements, opinions and data contained in all publications are solely those of the individual author(s) and contributor(s) and not of MDPI and/or the editor(s). MDPI and/or the editor(s) disclaim responsibility for any injury to people or property resulting from any ideas, methods, instructions or products referred to in the content.