1. Introduction
The evaporation of a liquid droplet in an ambient environment is a frequently observed phenomenon in nature, industrial processes, and practical systems. Several applications, for example, cooling water sprays, spray combustion, coating, printing, etc., involve multiple droplets that evaporate while interacting with each other in close proximity. The sizes of these droplets, their inter-droplet distance, and the arrangement of differently sized droplets are critical factors that influence the evaporation of multiple droplet systems. The understanding of complex heat and mass transfer mechanisms of such interacting droplets is a key to designing and developing efficient spray and printing devices, particularly beneficial for engineers and researchers working in the fields of fluid dynamics, combustion, material processing, and environmental sciences.
The evaporation dynamics of a single evaporating droplet have extensively been studied by researchers using both experimental and numerical techniques, leading to a thorough understanding of the phenomena. Moving towards more practical systems, focus shifted towards investigating the evaporation dynamics of 2–10 interacting droplets of different fluids, evaporating in various ambient conditions under different geometrical settings. Labowsky [
1] performed one of the initial studies on the evaporation dynamics of interacting droplets. He proposed a mathematical formulation to model the evaporation rates of a number of irregularly arranged interacting droplets of different sizes and fluids. It is reported that the droplet evaporation rates are significantly affected due to droplet interaction; however, the droplet temperature stays unaffected by the interactions. Raju and Sirignano [
2] studied two moving and evaporating droplets in the perspective of dense spray applications. They varied the droplet initial size, initial spacing, and Reynolds number and investigated its effects on the drag coefficient, Nusselt number, and the droplet spacing. The evaporation dynamics of a central droplet in droplet clusters under the microgravity conditions were investigated by Segawa et al. [
3]. They varied the droplet spacing and observed that the evaporation rate stayed almost constant or increased with decreasing the droplet spacing. Volkov et al. [
4] experimentally investigated the evaporation dynamics of two sequentially moving water droplets in a high-temperature combustion environment. They reported that the effects of the leading droplet on the evaporation of the trailing droplet will become insignificant if the spacing between the droplets is greater than 8–11 times the mean droplet radius. Volkov et al. [
5] further extended their study to a series of 2, 3, and 4 falling water droplets in a high-temperature gaseous environment. The effects of droplet size, droplet spacing, droplet initial speed, and the flow gas velocities were investigated towards evaporation dynamics. Zhao et al. [
6] conducted an interesting study to explore the region of influence of a single evaporating droplet. They concluded that the influence region is 30 times the geometric dimension of the droplet. Markadeh et al. [
7] explored the dynamics of a single droplet evaporating in spray-like conditions as experienced in a combustion chamber. The key parameters investigated were the droplet spacing, fuel types, and ambient temperature. They reported a droplet spacing parameter for which the effects of surrounding droplets are significant—a concept similar to the influence region. An experimental study was conducted by Wang et al. [
8] in which they suspended three droplets at equal spacing using quartz fiber and reported that the classical d
2-law is applicable for all the droplets during the quasi-steady evaporation stage, which makes up about 60% of the droplet lifetime. Yang et al. [
9] explored the effects of droplet radii and the initial droplet spacing on the burning rates for a double droplet system and observed that the front droplet burns at a faster rate than that of the back droplets in a convective environment irrespective of the droplet radii and spacing. Min et al. [
10] conducted numerical simulations for a group of liquid hydrogen droplets to investigate the group interaction effects. They investigated three arrays containing two, three, and five equally sized droplets. Masoud et al. [
11] proposed an analytical model to estimate the diffusive evaporation rates of multiple sessile droplets of different sizes, arranged at different angles with respect to each other. The results indicated that the proposed model predicted the evaporation rates fairly accurately when compared with the results of numerical simulation for a wide range of geometric configurations. Fairhurst [
12] further built upon the study by Masoud et al. for several cases and concluded that the theoretical results match well with the simulations; however, the results deviate up to 25% for the more confined droplets, which have a small evaporating rate and higher contact angles. Liu et al. [
13] stated that the droplet evaporation slows down due to the neighboring interacting droplets. He argued that the evaporation models for multiple droplets that are mostly based on isolated droplet evaporation models may not yield correct results. They, therefore, proposed a model based on the point source method incorporating an additional correction factor to deal with the inter-droplet interaction.
Several authors have focused on the evaporation of droplets in sprays and clouds to develop efficient combustion, cooling, and printing technologies. Lacasta et al. [
14] studied the evaporation of droplets arranged in periodic arrays of equal-sized droplets in a 2D system and concluded that the cooperative effects of the multiple droplets may result in an enhanced evaporation rate. Deprédurand et al. [
15] conducted an experimental study to investigate the evaporation rates of different fuel droplets in a monodisperse droplet stream. They monitored the Nusselt and Sherwood numbers and concluded that the interactions between the droplets are as critical as the fuel itself for the evaporation process. Zoby et al. [
16] performed a Direct Numerical Simulation of the kerosene droplets in a convective environment. They reported that the evaporation rates are reduced as the combustion of droplets occurs in a group. Chen and Lin [
17] experimentally studied the effects of spatial distribution and interaction of droplets on evaporation and combustion dynamics in spray combustion. For this purpose, they generated a series of inline droplets in a high-temperature oxidizing environment. The effects of the initial drop spacing (S
i) on the flame transition and droplet evaporation rate were investigated. They observed that, for S
i < 30, the droplet evaporation rate of interacting inline droplets was less than that of a single droplet. However, for the S
i in the range of 30–75, the evaporation rate exceeds that of the single drop. Finally, for S
i > 75, the interaction effects are negligible. The evaporation rate of the multiple interacting fuel droplets was studied by Kitano et al. [
18] to investigate the effects of pressure and gas temperature. They observed that the droplets’ lifetime increases as the pressure is increased. However, if the temperature is increased beyond 1500 K, the droplets’ lifetime decreases. The evaporation dynamics of multiple droplets were experimentally studied by Castanet et al. [
19] to develop a predictive model for the evaporation rate of fuel droplets in a dense region of sprays. They arranged the droplets in a single row and varied the droplet size, velocity, and droplet spacing. They reported that the droplet spacing has a strong influence on the droplet evaporation rate due to the development of a boundary layer around the droplets. Cossali and Tonini [
20] used statistical techniques to develop a model expressing the effects of droplet cloud density and shape on the global and local evaporation characteristics. Li et al. [
21] proposed an extended unit cell model to analyze the evaporation of stationary droplet clouds, considering the development of a boundary layer around the evaporating droplet. The parameters investigated are the droplet spacing and ambient pressure on the evaporation rate. Guo et al. [
22] numerically simulated the wastewater droplets generated from a multi-nozzle system under different working conditions with the aim of desulfurizing water. They concluded that the quality of evaporation can be improved by increasing the distance between the nozzles emitting water droplets as well as by increasing the flow rate.
The literature analysis reveals a huge interest in the field of evaporation dynamics of interacting drops, investigating different aspects, including the droplet fluid, the arrangement patterns, droplet spacing, and the droplet size. However, to the best of the authors’ knowledge, the effects of arrangement patterns of two differently sized inline droplets on the evaporation dynamics in the framework of 2D planar configuration have not been studied so far. The present research attempts to fill this gap and numerically investigates the evaporation patterns of differently sized droplets in two distinct arrangements, which is the key novel aspect of this research. This study is logically arranged into three sections. First, the effect of spacing between two identical, equal-sized droplets on the evaporation rates is studied. Next, the size of the trailing droplet is systematically varied against the leading droplet of constant radius, keeping the initial spacing between the droplets constant. Finally, the position of the bigger and smaller droplets is swapped to investigate the effects of the arrangement pattern of differently sized droplets on the evaporation rates. The non-dimensional d2 values, which represent the time evolution of the droplet evaporation, are plotted against non-dimensional times to monitor the evaporation rates. Furthermore, the velocities of each droplet and the inter-droplet distances are also plotted to analyze and investigate the effects of these variations on the evaporation dynamics of multiple droplets.
4. Results and Discussion
This section presents detailed results and discussion on the evaporation dynamics of multiple evaporating droplets moving under the action of gravity. The effects of variation in the initial distance between the droplets, the size of the droplets, and the arrangement pattern of differently sized droplets are investigated on the evaporation rates of the droplets, all in the inline configuration.
4.1. Effect of Initial Distance Ratio, S
The effects of the initial distance ratio (S), defined in Equation (22), on the evaporation dynamics of two inline moving droplets are explored by varying the initial distance between the droplets (L
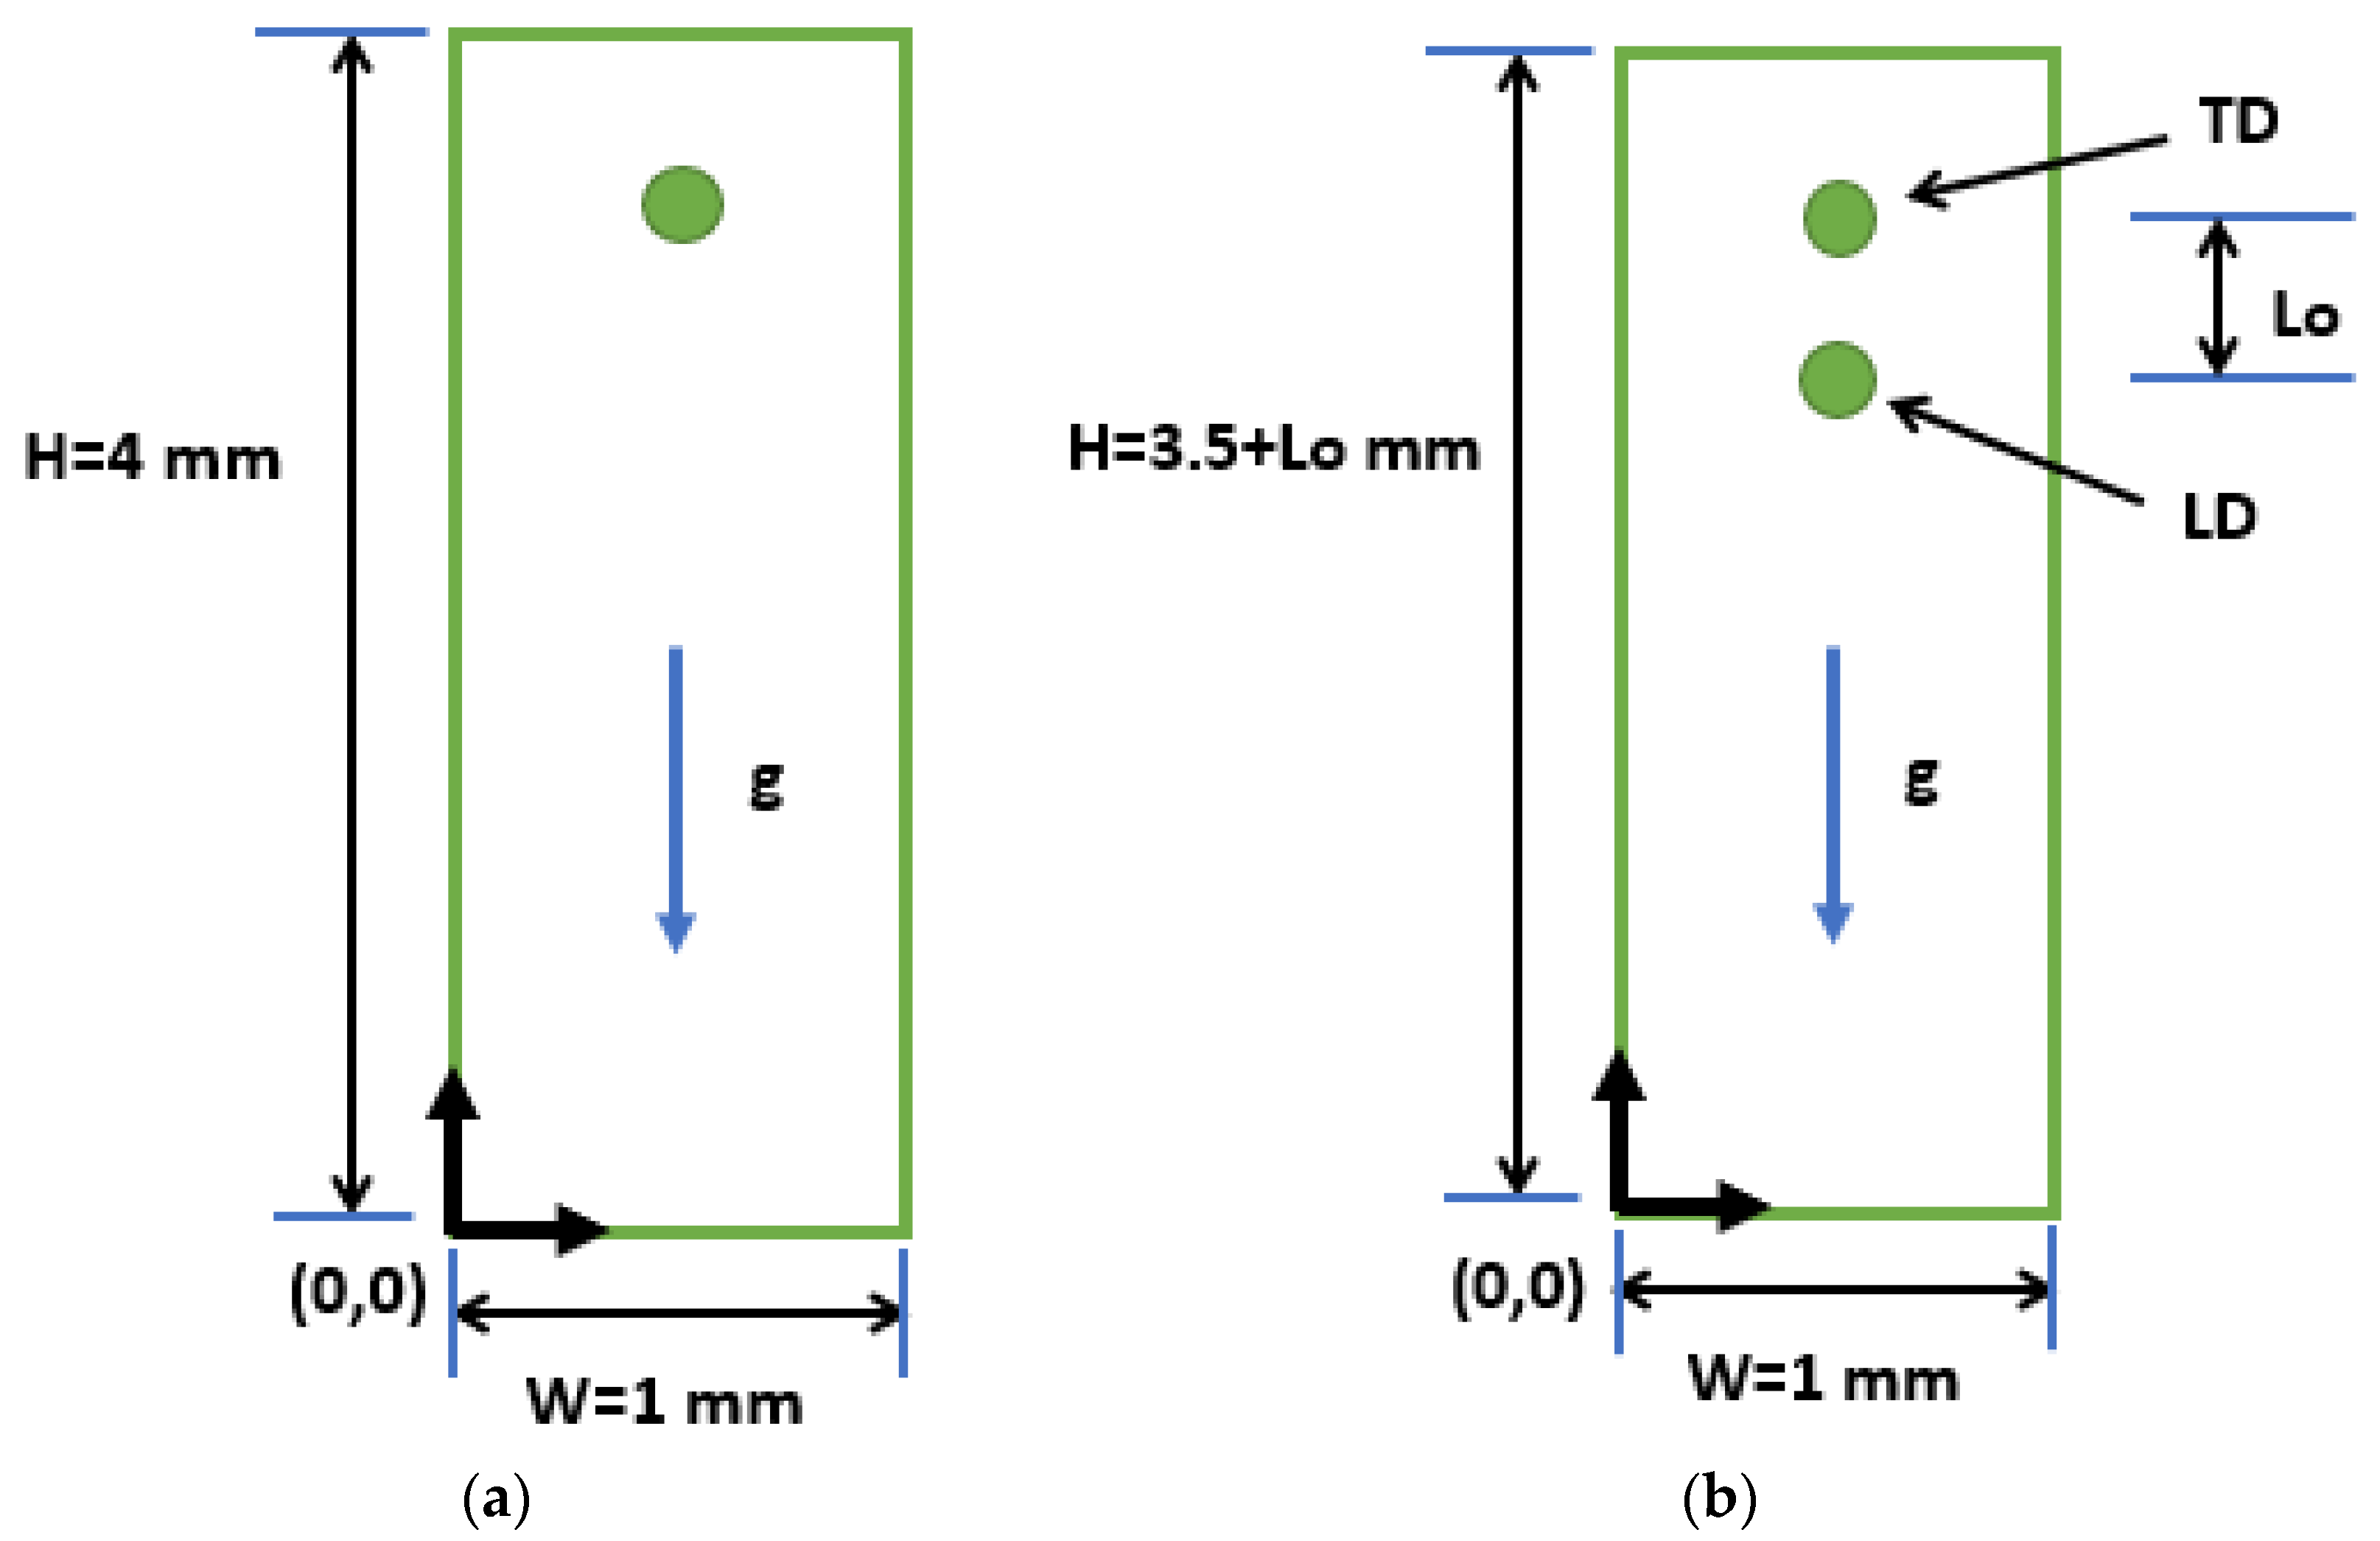
o). The initial distance ratio is varied in the range of 4–12 in the present study. Furthermore, both the droplets are of equal size, that is, the size ratio (R) is set to 1. At time t = 0, droplet 1, defined as the leading droplet (LD), is centered at (0.5, 3) mm, while droplet 2, named as the trailing droplet (TD), is placed with its center at (0.5, 3 + L
o) mm. The overall domain height is then adjusted according to the initial distance ratio (S) and, consequently, L
o, as mentioned in
Figure 1b. Both the droplets start moving under the action of gravity, g, and evaporate due to the high-temperature vapor environment. Normalized d
2, an indicator of evaporation rate, and droplet velocities are considered important parameters and are continuously monitored during this study.
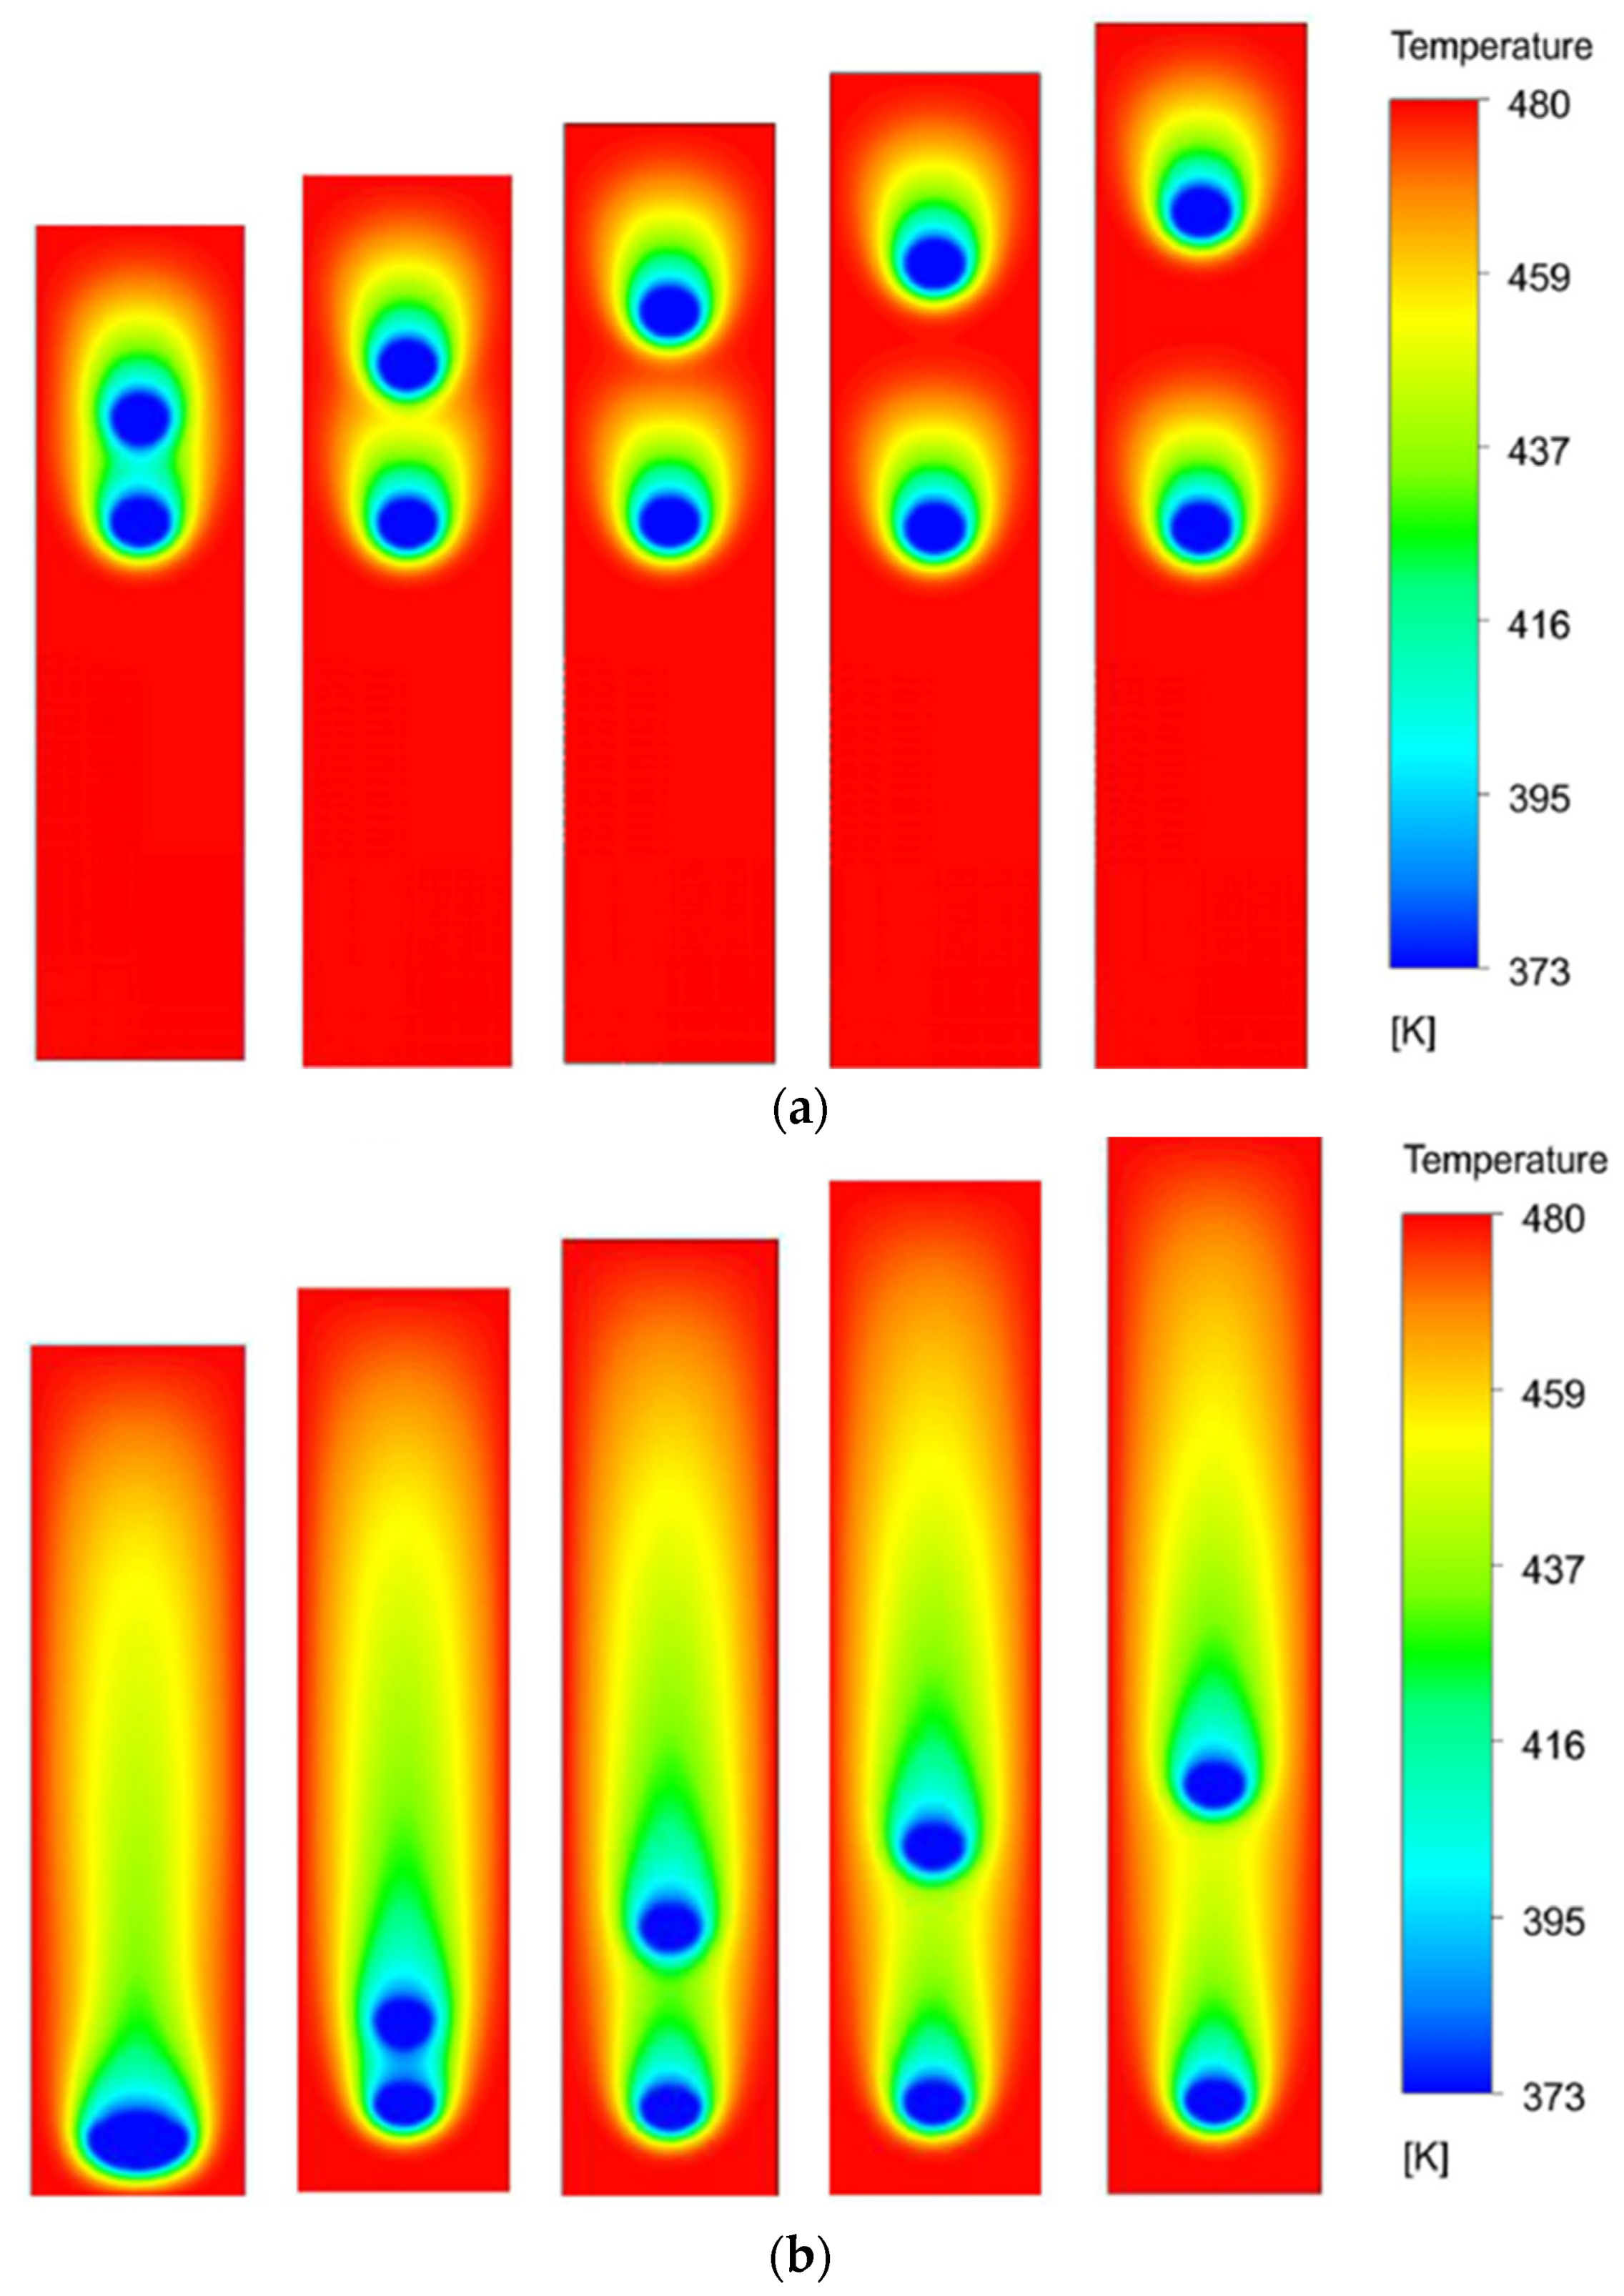
Figure 5 shows the contour plots of temperature in the domain for different values of S at two different time instances. The columns represent cases with S values of 4, 6, 8, 10, and 12 (left to right). The first row presents the contours at a non-dimensional time of τ = 3, while the second row shows it at τ = 12. The temperature contours show that a low-temperature thermal buffer layer is developed around the droplets as they move under the action of gravity. The buffer layer of the leading droplet sweeps along the droplet and then interacts with the trailing droplet, depending upon the value of S and the time. At time τ = 3, the buffer layer of the leading droplet is affecting the evaporation of the trailing droplet for S = 4 and 6. However, at τ = 12, all the cases show such interactions. It is a qualitative observation that, during the interaction, the leading droplet evaporates faster as compared to the trailing droplet since it is exposed to a high-temperature environment. The effect of the low-temperature thermal buffer layer on the training droplet is to slow down its evaporation rate due to the lesser temperature gradient between the droplet and the surrounding buffer zone. These observations are quantitatively supported by the trends of normalized d
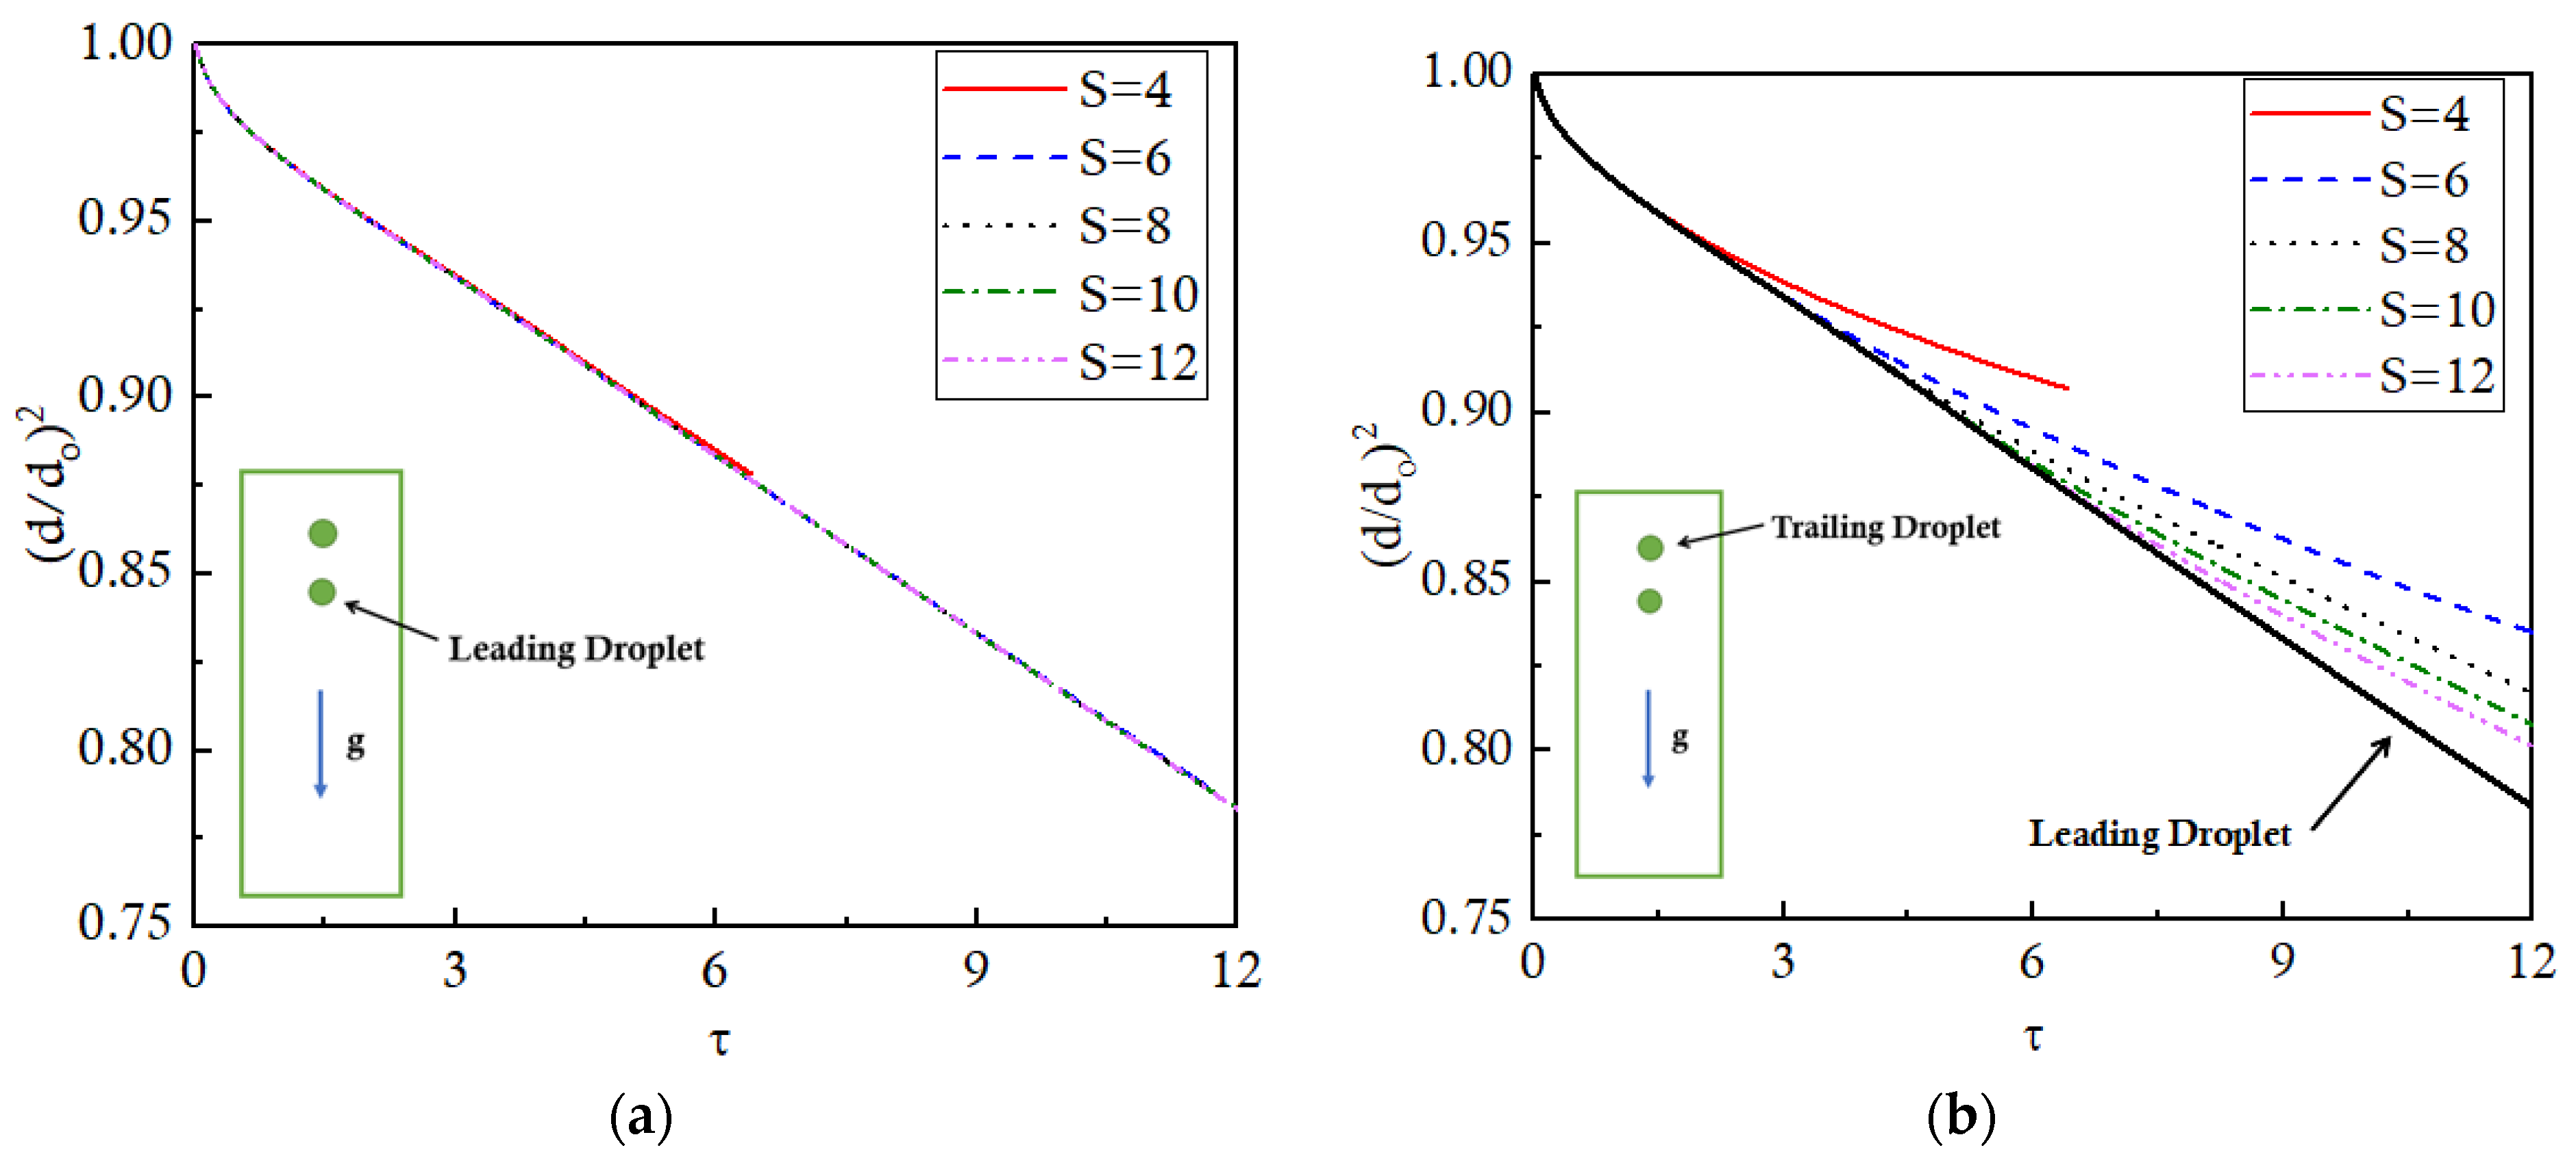
2 plotted against non-dimensional time for both the droplets in
Figure 6.
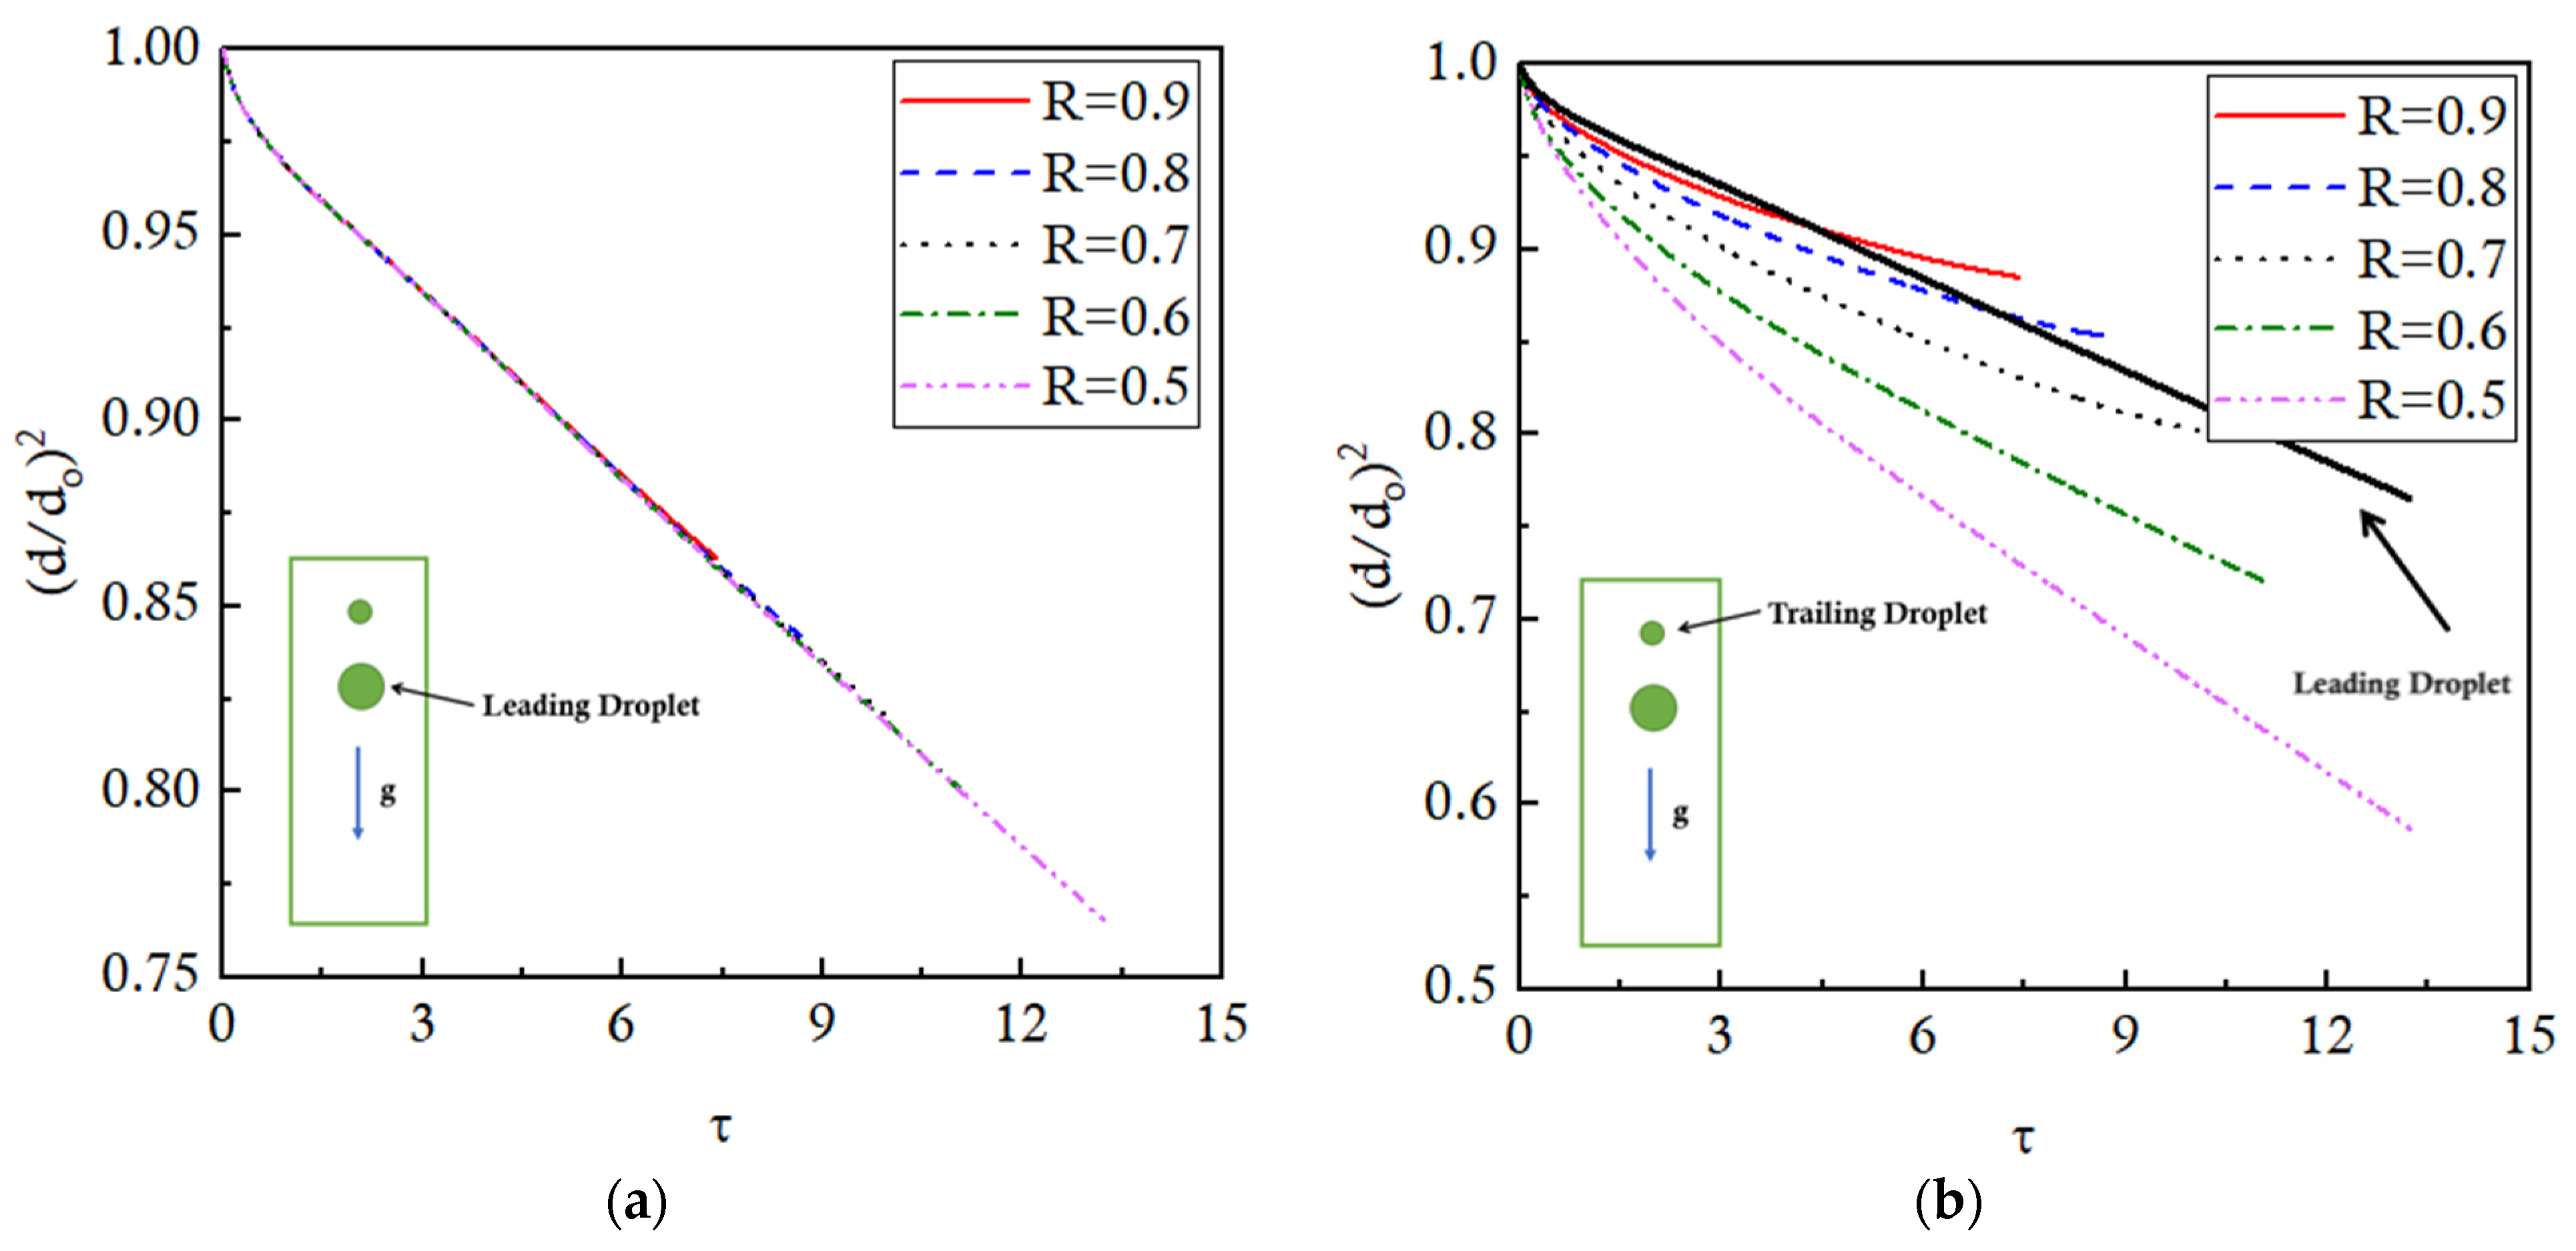
The evaporation of the leading droplet is negligibly affected by the presence of the trailing droplet, irrespective of the value of S, as indicated by the overlapping lines of normalized d
2 shown in
Figure 6a. However, the evaporation of the trailing droplet is significantly affected by the presence of the leading droplet depending on the value of S, as shown in
Figure 6b. The evaporation trend of the leading droplet is also presented in the same figure as a reference line for comparative purposes. It is observed that, till τ = 2, both the droplets evaporate at the same rate for any value of S since the thermal buffer layer has not yet approached the trailing droplet. After that, the trailing droplet of the smallest S case, that is, S = 4, starts getting affected by the thermal buffer layer, and the evaporation rate slows down.
For the rest of the S cases, the effects of the buffer layer are noticed by the trailing droplet successively later in time depending on the corresponding S values. Progressing further in time, at τ = 12, approximately 22% of the leading droplet has evaporated for all the S cases, except for the S = 4 case, where coalescence has occurred. In an ideal case, if the trailing droplet is not influenced by the leading one, then the trailing droplet is also expected to evaporate by the same amount, that is, 22%. However, in the actual scenario, the trailing droplets for S = 6, 8, 10, and 12 show 16.5%, 18%, 19%, and 20% evaporation, respectively, which is correspondingly 25%, 18.2%, 13.6%, and 9.1% less than the evaporation of the leading droplet. This clearly indicates that the effect of the neighboring droplets is to slow down the evaporation as compared to the isolated droplets. Furthermore, the effect of the leading droplet on the trailing droplet evaporation decreases as the S increases.
To further elaborate on the effects of droplet interaction on the evaporation process, the overall evaporation of the droplets is monitored.
Figure 7 compares the times required to reach 10% ((d/do)
2 = 0.9) and 18% ((d/do)
2 = 0.82) overall evaporation for different values of S. It can be observed that an increase in the value of S reduces the time required to achieve a defined evaporation target. For instance, the S = 4 case attains evaporation corresponding to (d/do)
2 = 0.9 at τ = 5.8, while the S = 12 case attains the same evaporation at τ = 5.2, which indicates 10.3% faster evaporation. Similarly, to achieve (d/do)
2 = 0.82, the S = 4 case takes τ = 13, whereas the S = 12 case attains that benchmark at τ = 11, showing a 15.3% superior evaporation rate.
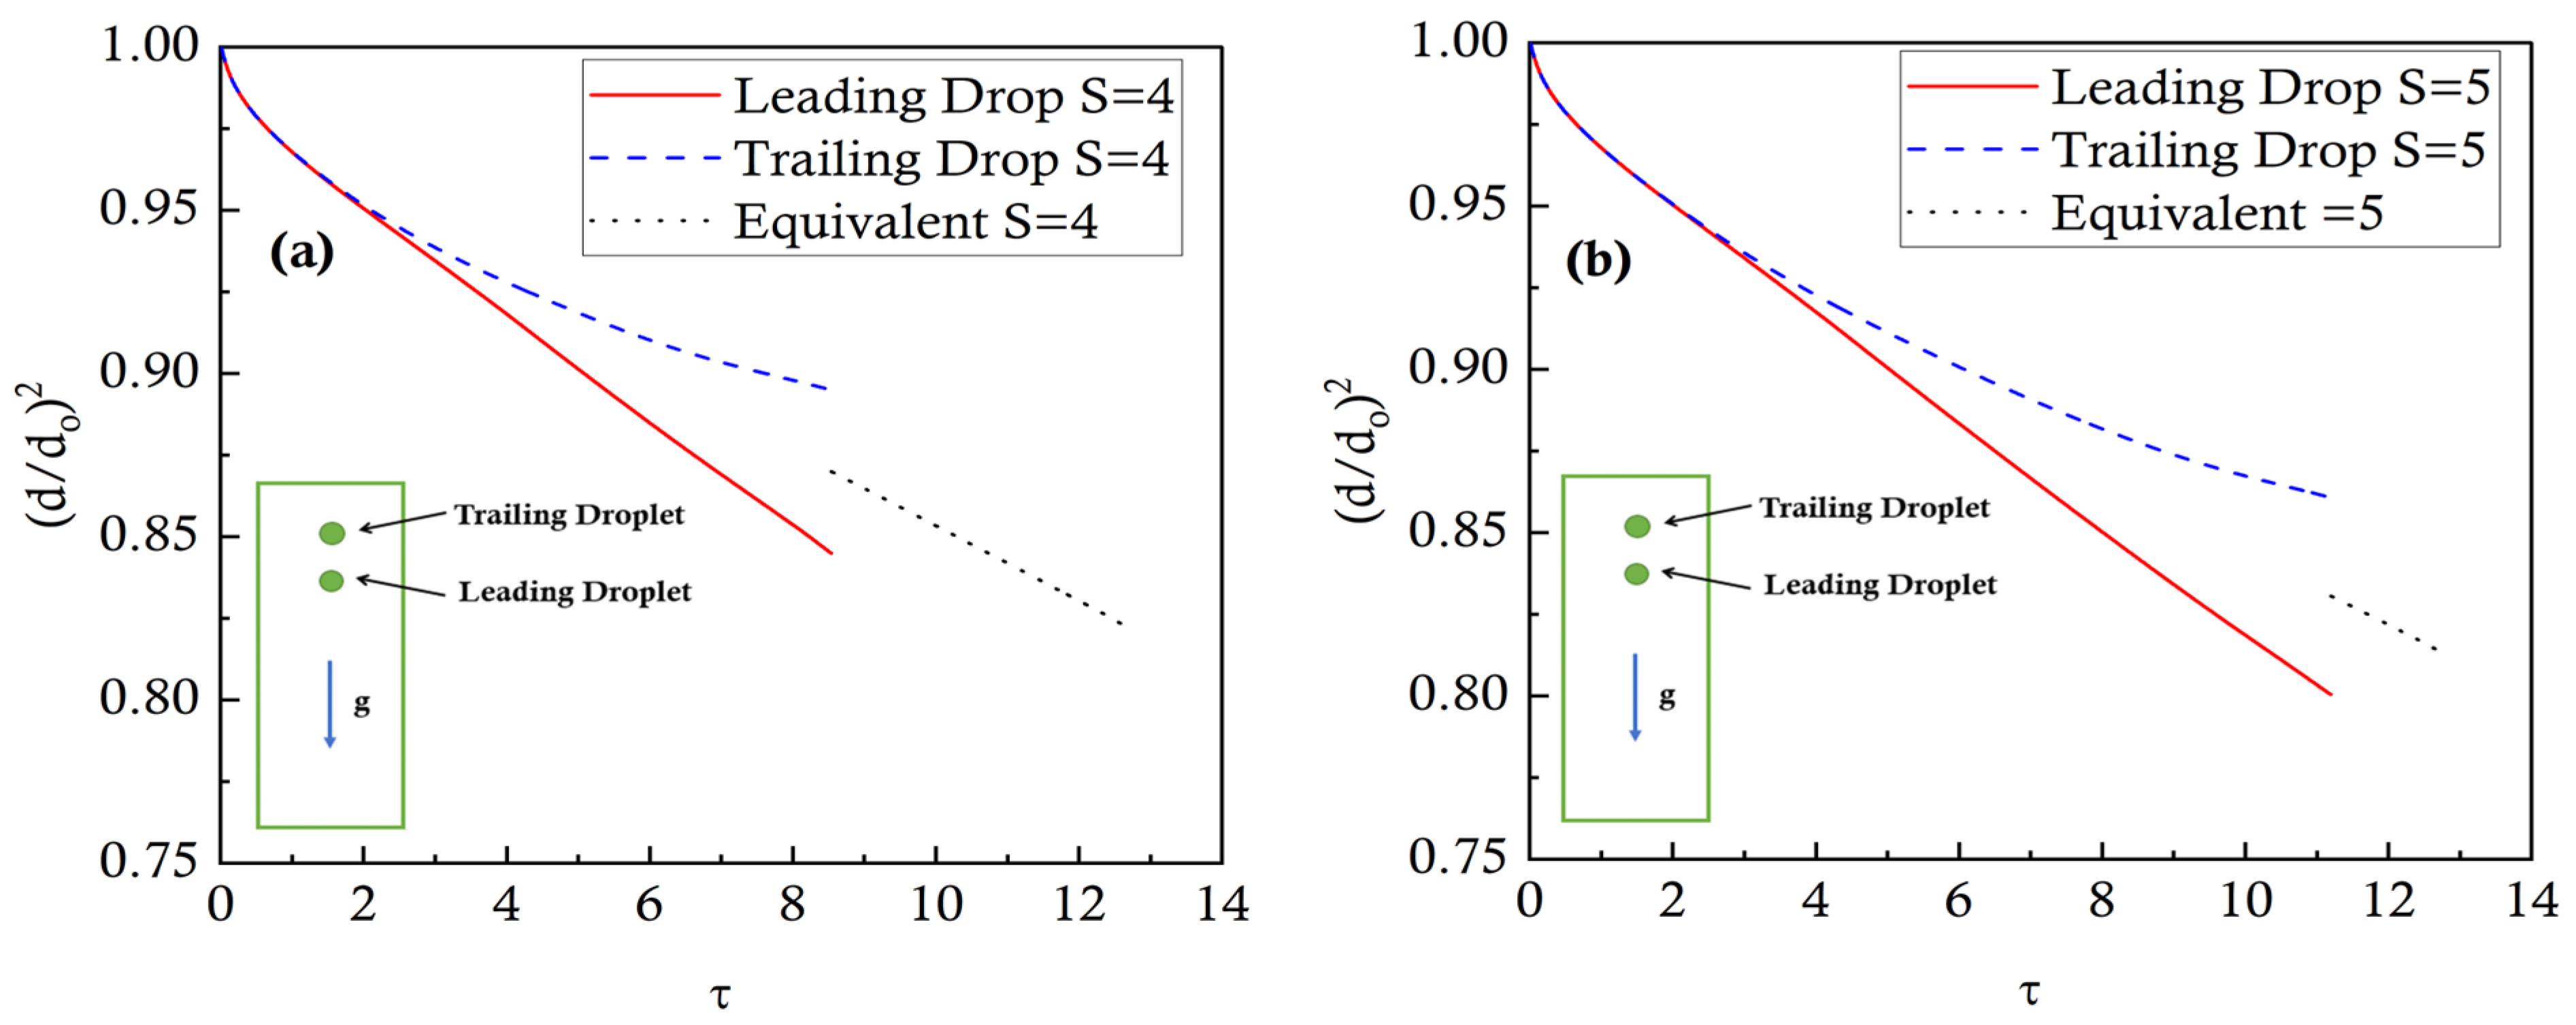
Figure 8 shows the effects of coalescence on the evaporation rates compared to the individual droplets’ evaporation before the coalescence. The normalized d
2 values are plotted against non-dimensional time for the leading, trailing, and merged droplets for S = 4 and S = 5. The first observation is that the coalescence delays as the initial distance ratio is increased. For example, the coalescence takes place at τ = 8.5 for S = 4, while it happens at τ = 11.2 for S = 5. Regarding the evaporation, it is noted that the effects of the coalescence are to average out the normalized evaporation rate of the previously separate droplets. Specifically, after coalescence, the merged droplet normalized evaporation rate is slower than the leading droplet while it is faster than the trailing droplet. This is because, after the coalescence, the instantaneous
d2 of the merged larger droplet is normalized by the sum of the diameters of the individual droplets (
), as given in Equation (25), to calculate the overall normalized
d2. Therefore, although the surface area of the single larger merged droplet is greater than either of the leading or the trailing droplets since it is normalized by a bigger number (the sum of the diameters of the individual droplets), hence the normalized evaporation rate of the merged droplet is slower than that of the leading droplet. Regarding the trailing droplet, the effects of the thermal buffer layer are eliminated after the coalescence, so the overall normalized evaporation rate of the larger droplet after coalescence is faster than the trailing droplet.
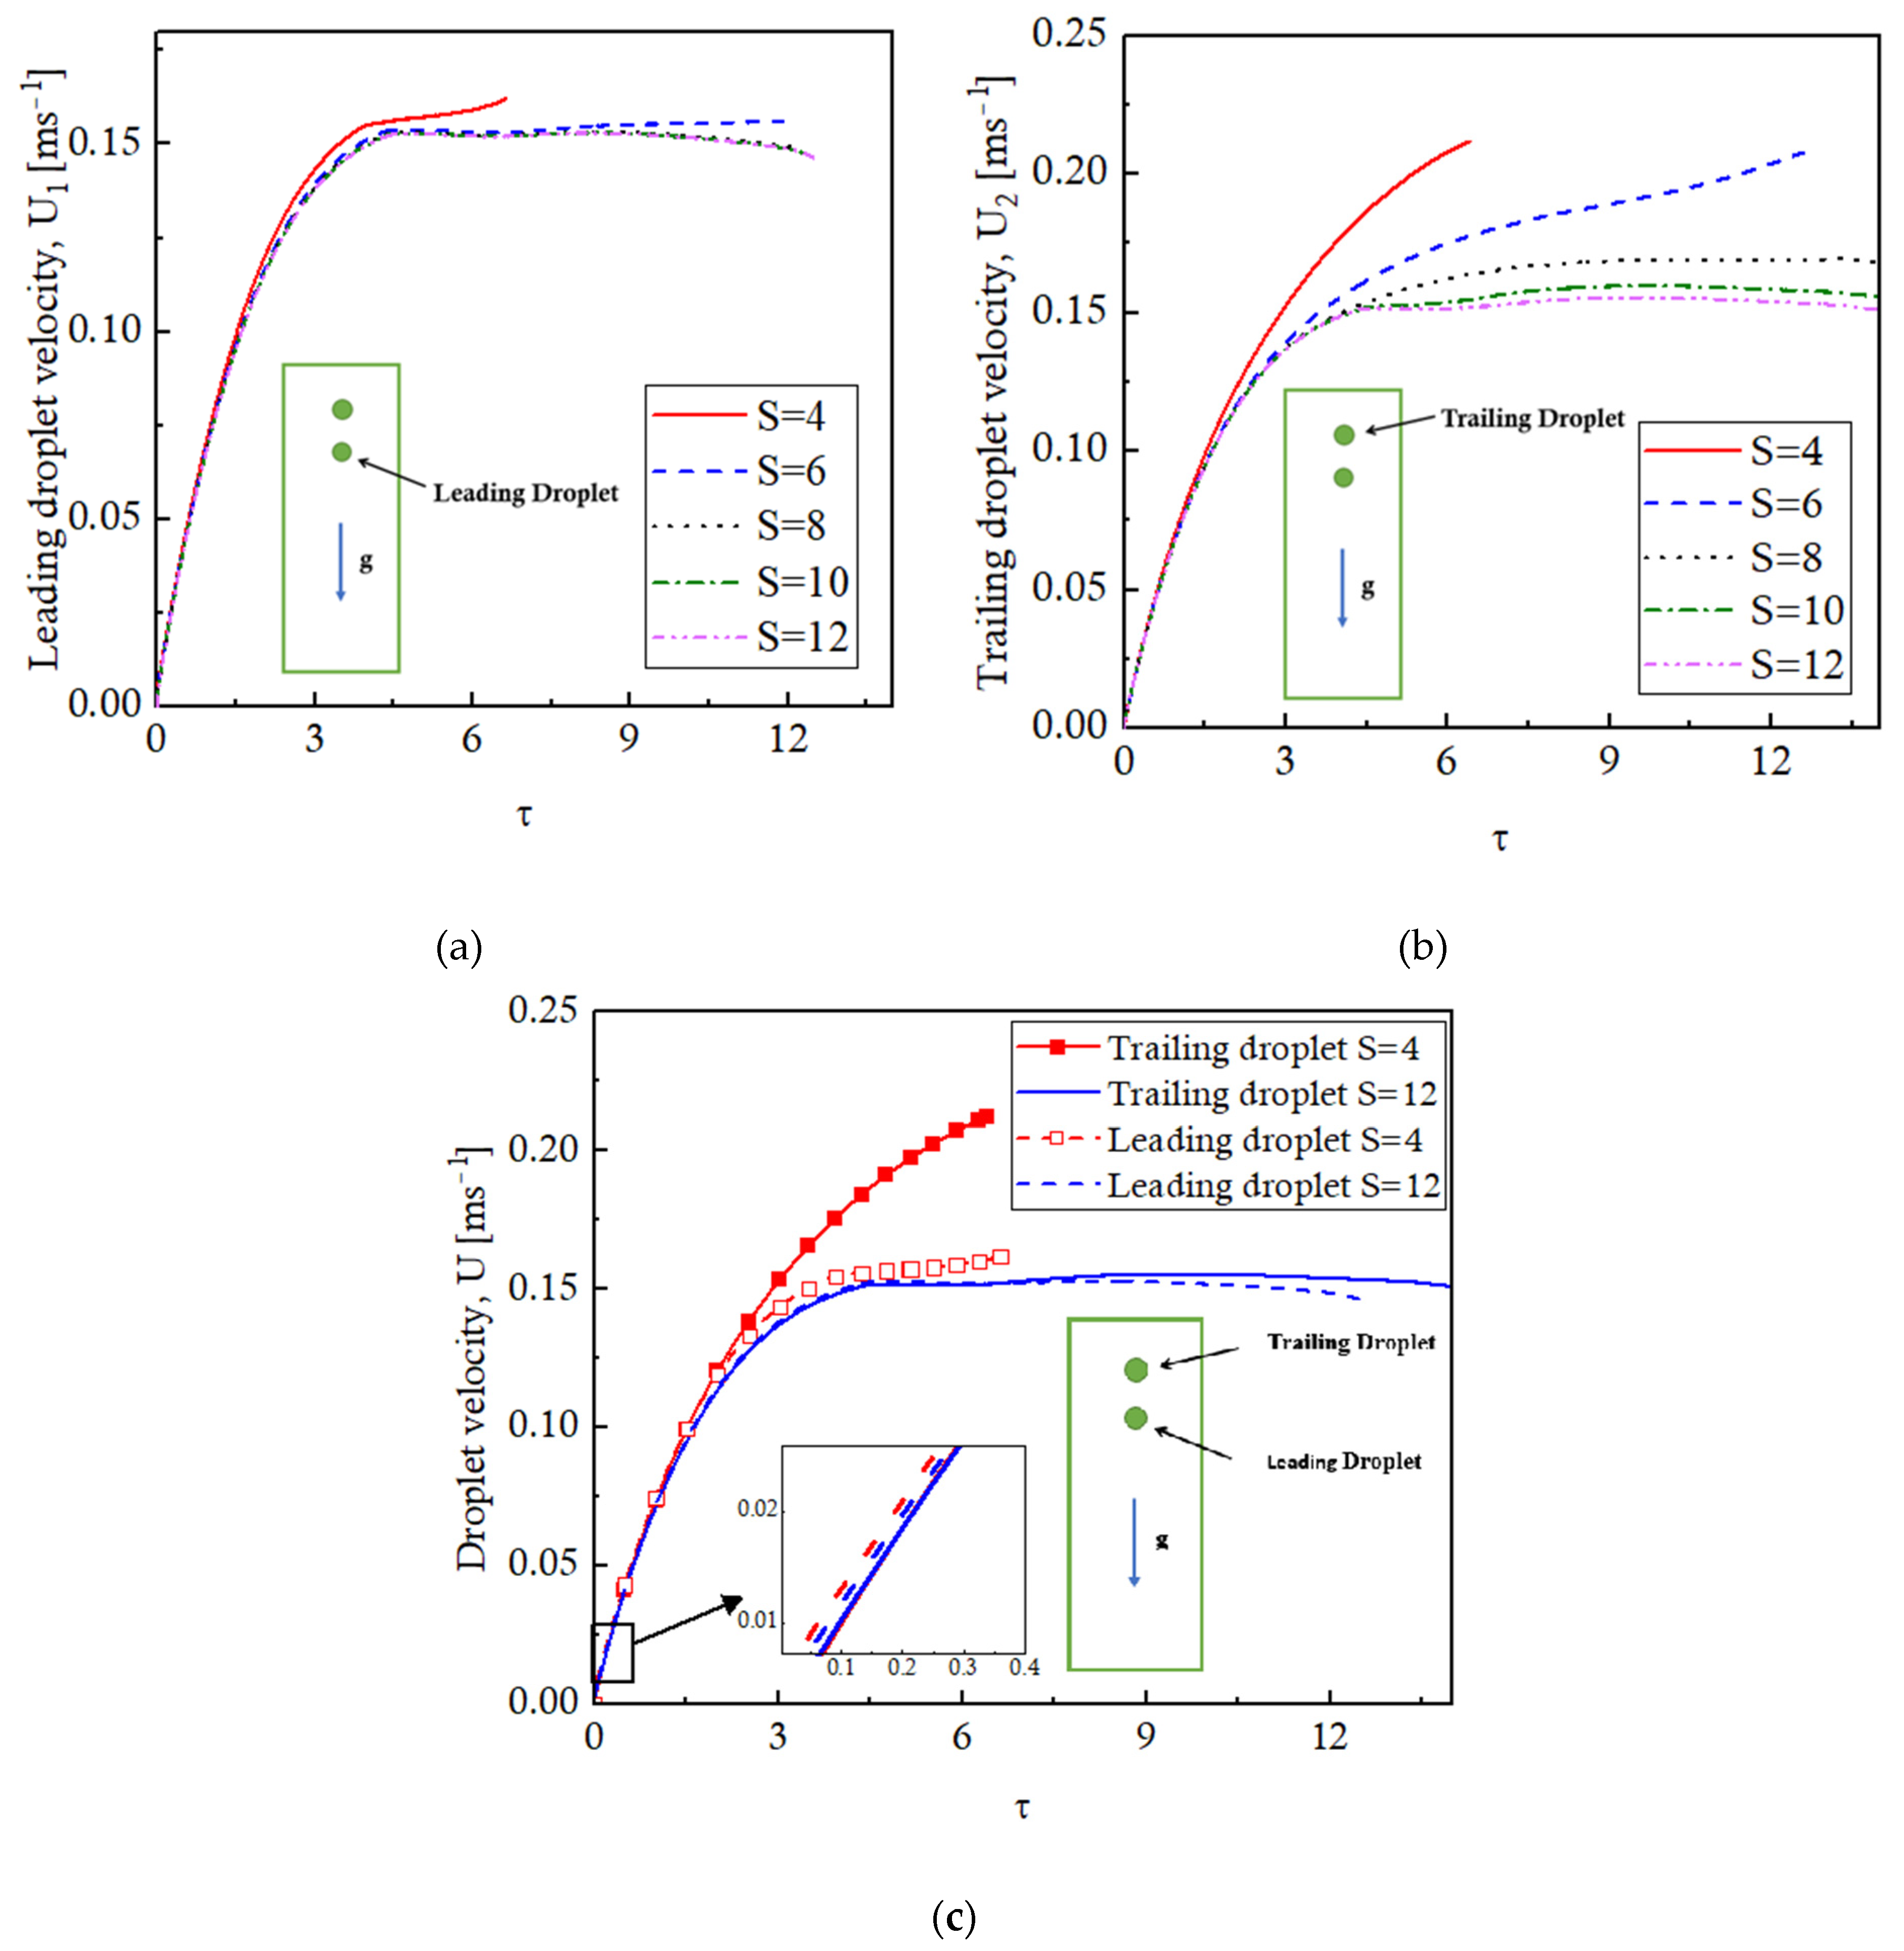
The droplets’ interaction during the evaporation process also affects the droplet velocities.
Figure 9 plots the velocities of the leading and the trailing droplets for different values of S. The droplet interaction has minimal effects on the velocity of the leading droplet for all values of S. The velocity increases as the droplet starts moving and attains a steady-state value, which is approximately independent of the S; a slightly different behavior is observed for the S = 4 case where coalescence takes place. The trailing droplet, however, exhibits a visible difference in the velocity profiles for different values of S. This is because the coalescence of the droplets occurs at different times for different values of S. Generally, it is observed that the leading and trailing droplets accelerate at the same rate until the trailing droplets enter into the low-pressure wake region of the leading droplet and experience a pull towards the leading droplet. This pull results in an increased velocity of the trailing droplet, leading to the coalescence of the droplets. The velocity plots of the leading and trailing droplets for S = 4 and S = 12 are presented in
Figure 9c to depict the phenomena. For a smaller value of S, that is, S = 4, the droplets are initially located close to each other. Therefore, the trailing droplet enters into the wake region of the leading droplet quite early and undergoes coalescence. For higher values of S, the droplets are initially placed sufficiently far apart, and as they evaporate, they lose mass and eventually weight; therefore, the terminal velocities tend to decrease. Finally, it is observed that the two evaporating droplets at rest tend to repel each other due to the evaporation-driven radial velocities pointing outwards. This is depicted by the differences in the velocities of the leading and the trailing droplets in the zoomed-in figure in
Figure 9c. The magnitudes of these velocities are quite small, and as the droplets move under the action of gravity, the repulsive effects are negligible.
4.2. Effect of Size Ratio, R
In this section, the effects of varying the size of the droplets on the evaporation dynamics of moving interacting droplets are investigated for a two inline droplet system. These droplets are initially positioned with their centers at (0.5, 3) mm and (0.5, 3.5) mm in a 1 × 4 mm
2 domain with an initial distance ratio of 4. The initial radius of the leading droplet is kept constant at a value of 0.25 mm for each geometric case, whereas the radius of the trailing droplet is systematically reduced to obtain size ratio (R) values of 0.9, 0.8, 0.7, 0.6, and 0.5. The size ratio (R) is mathematically defined in Equation (23). The present configuration, in which the smaller droplet is the trailing droplet, is named as Small-Big-Arrangement (SBA). The operational settings for the numerical simulations are mentioned in
Table 1. The droplets move under the action of gravity in an ambient gaseous environment maintained at a fixed temperature of 480 K, resulting in a Stefan number of 0.1.
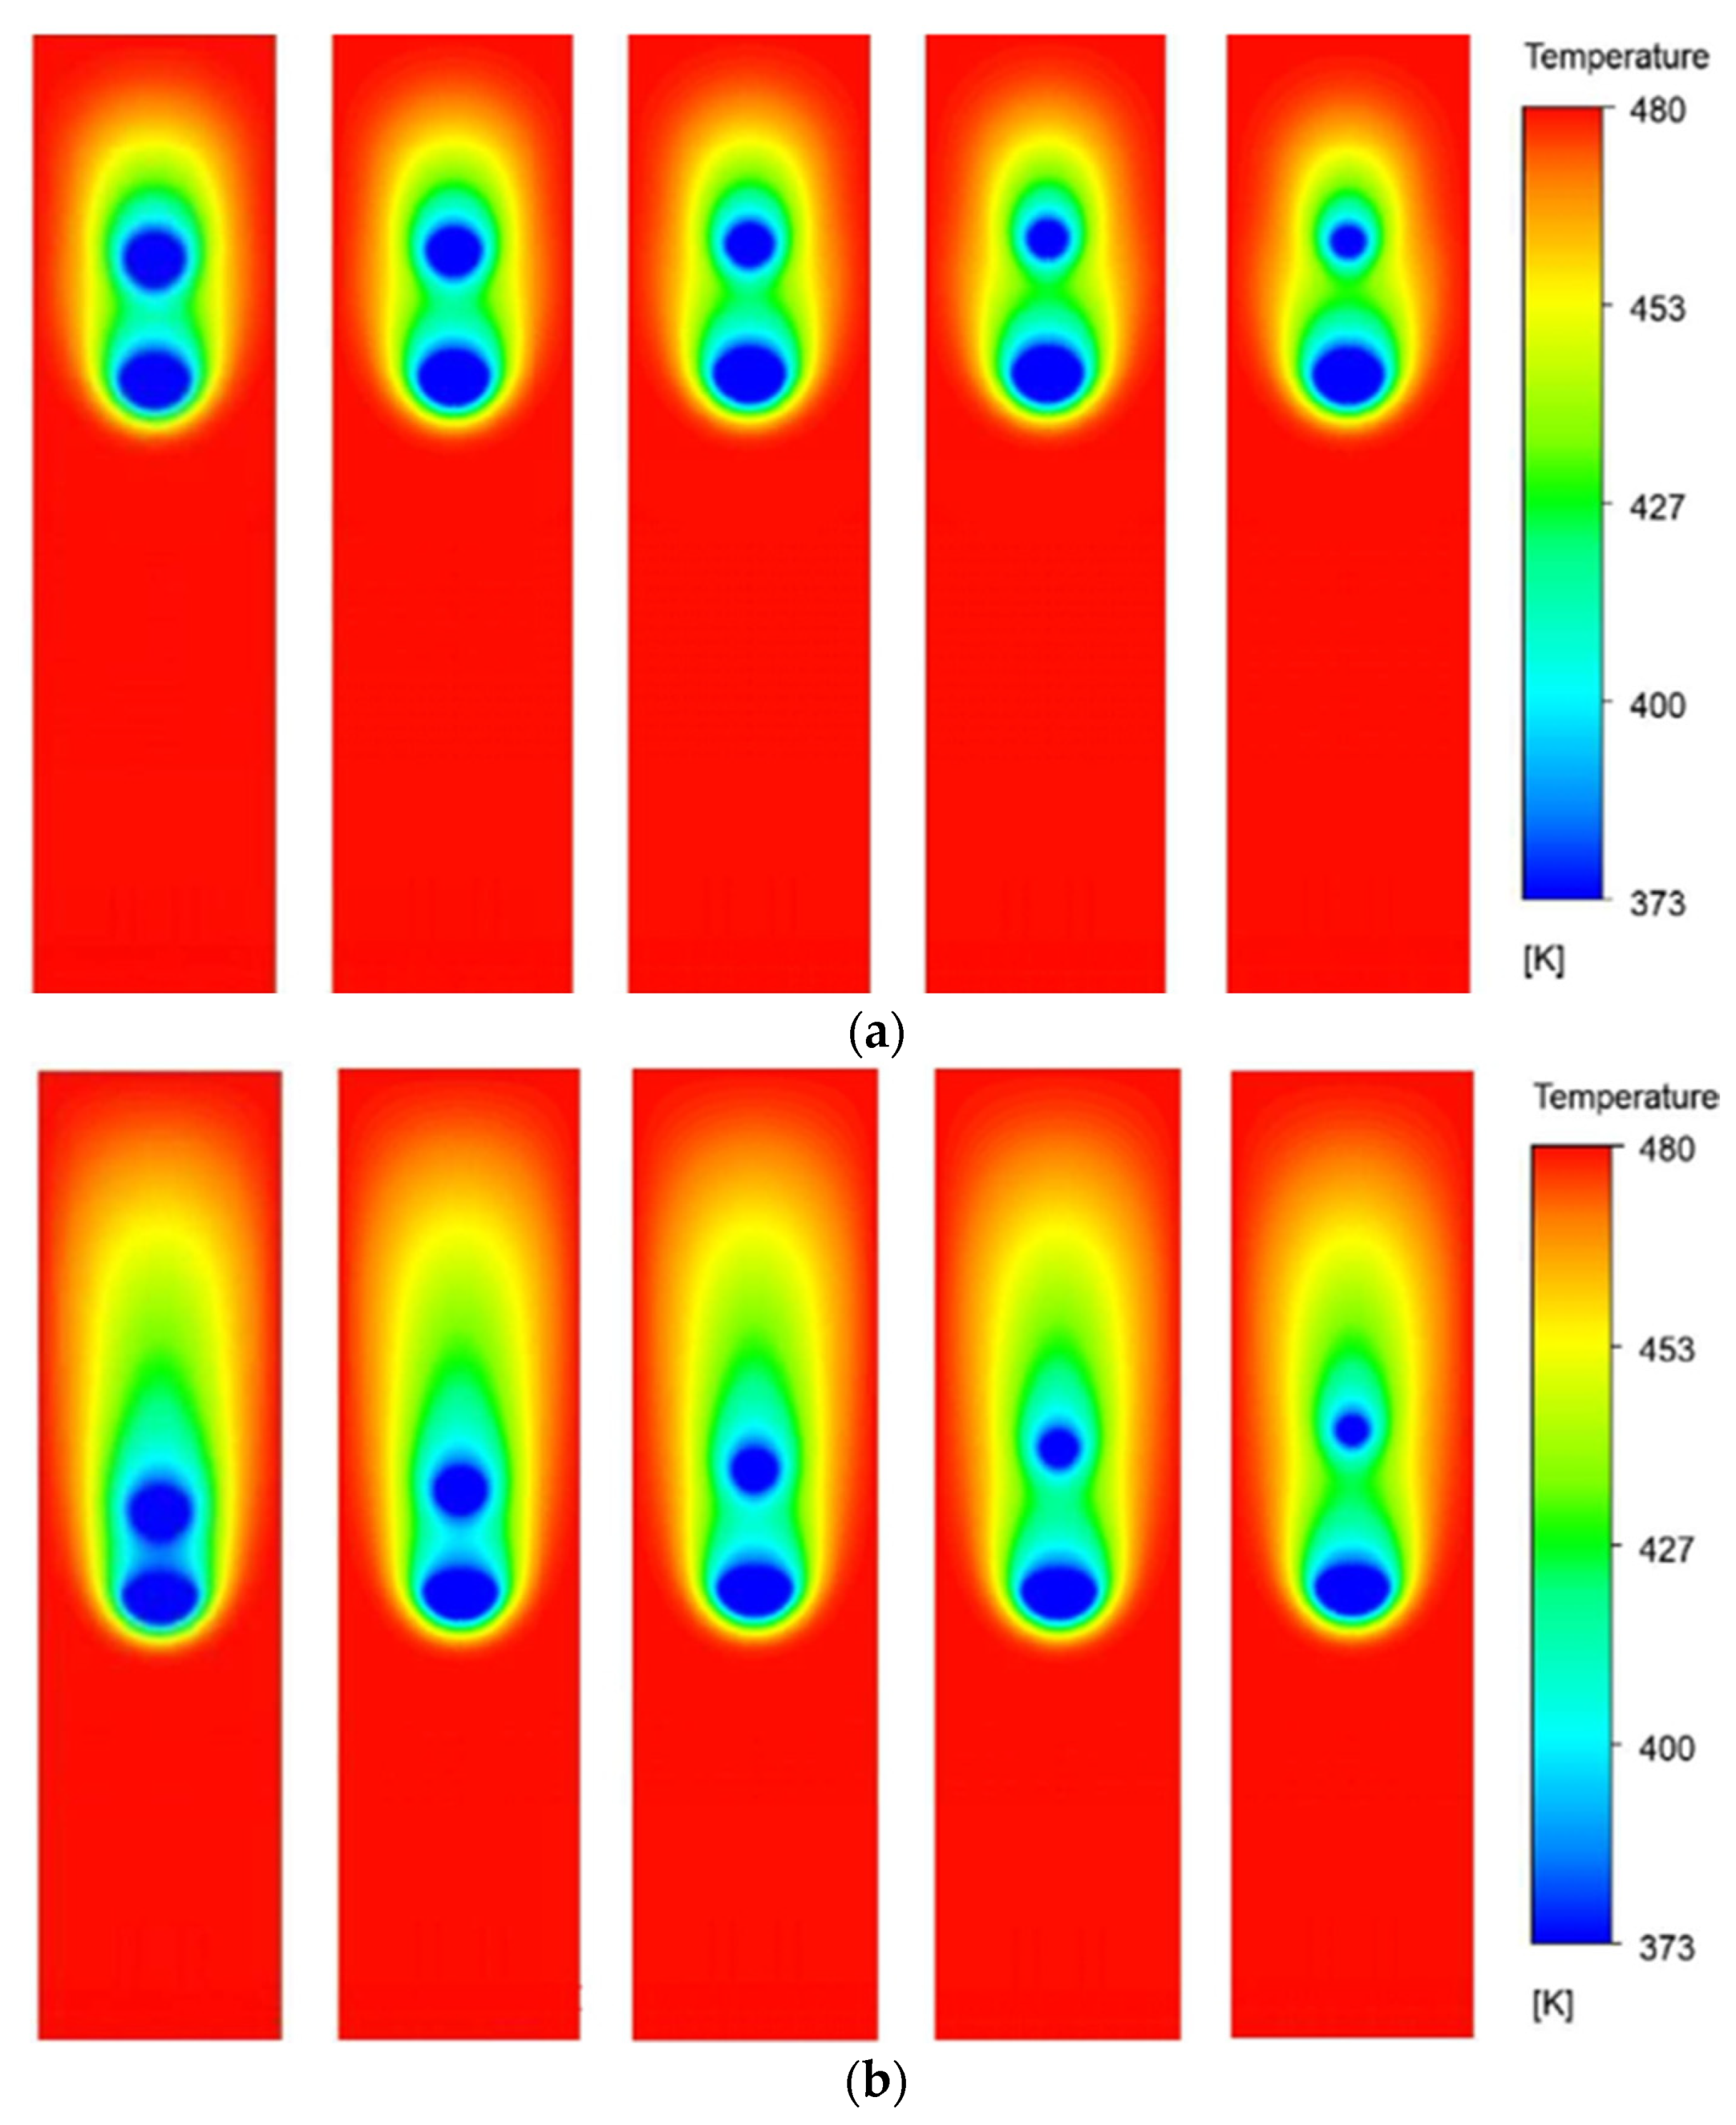
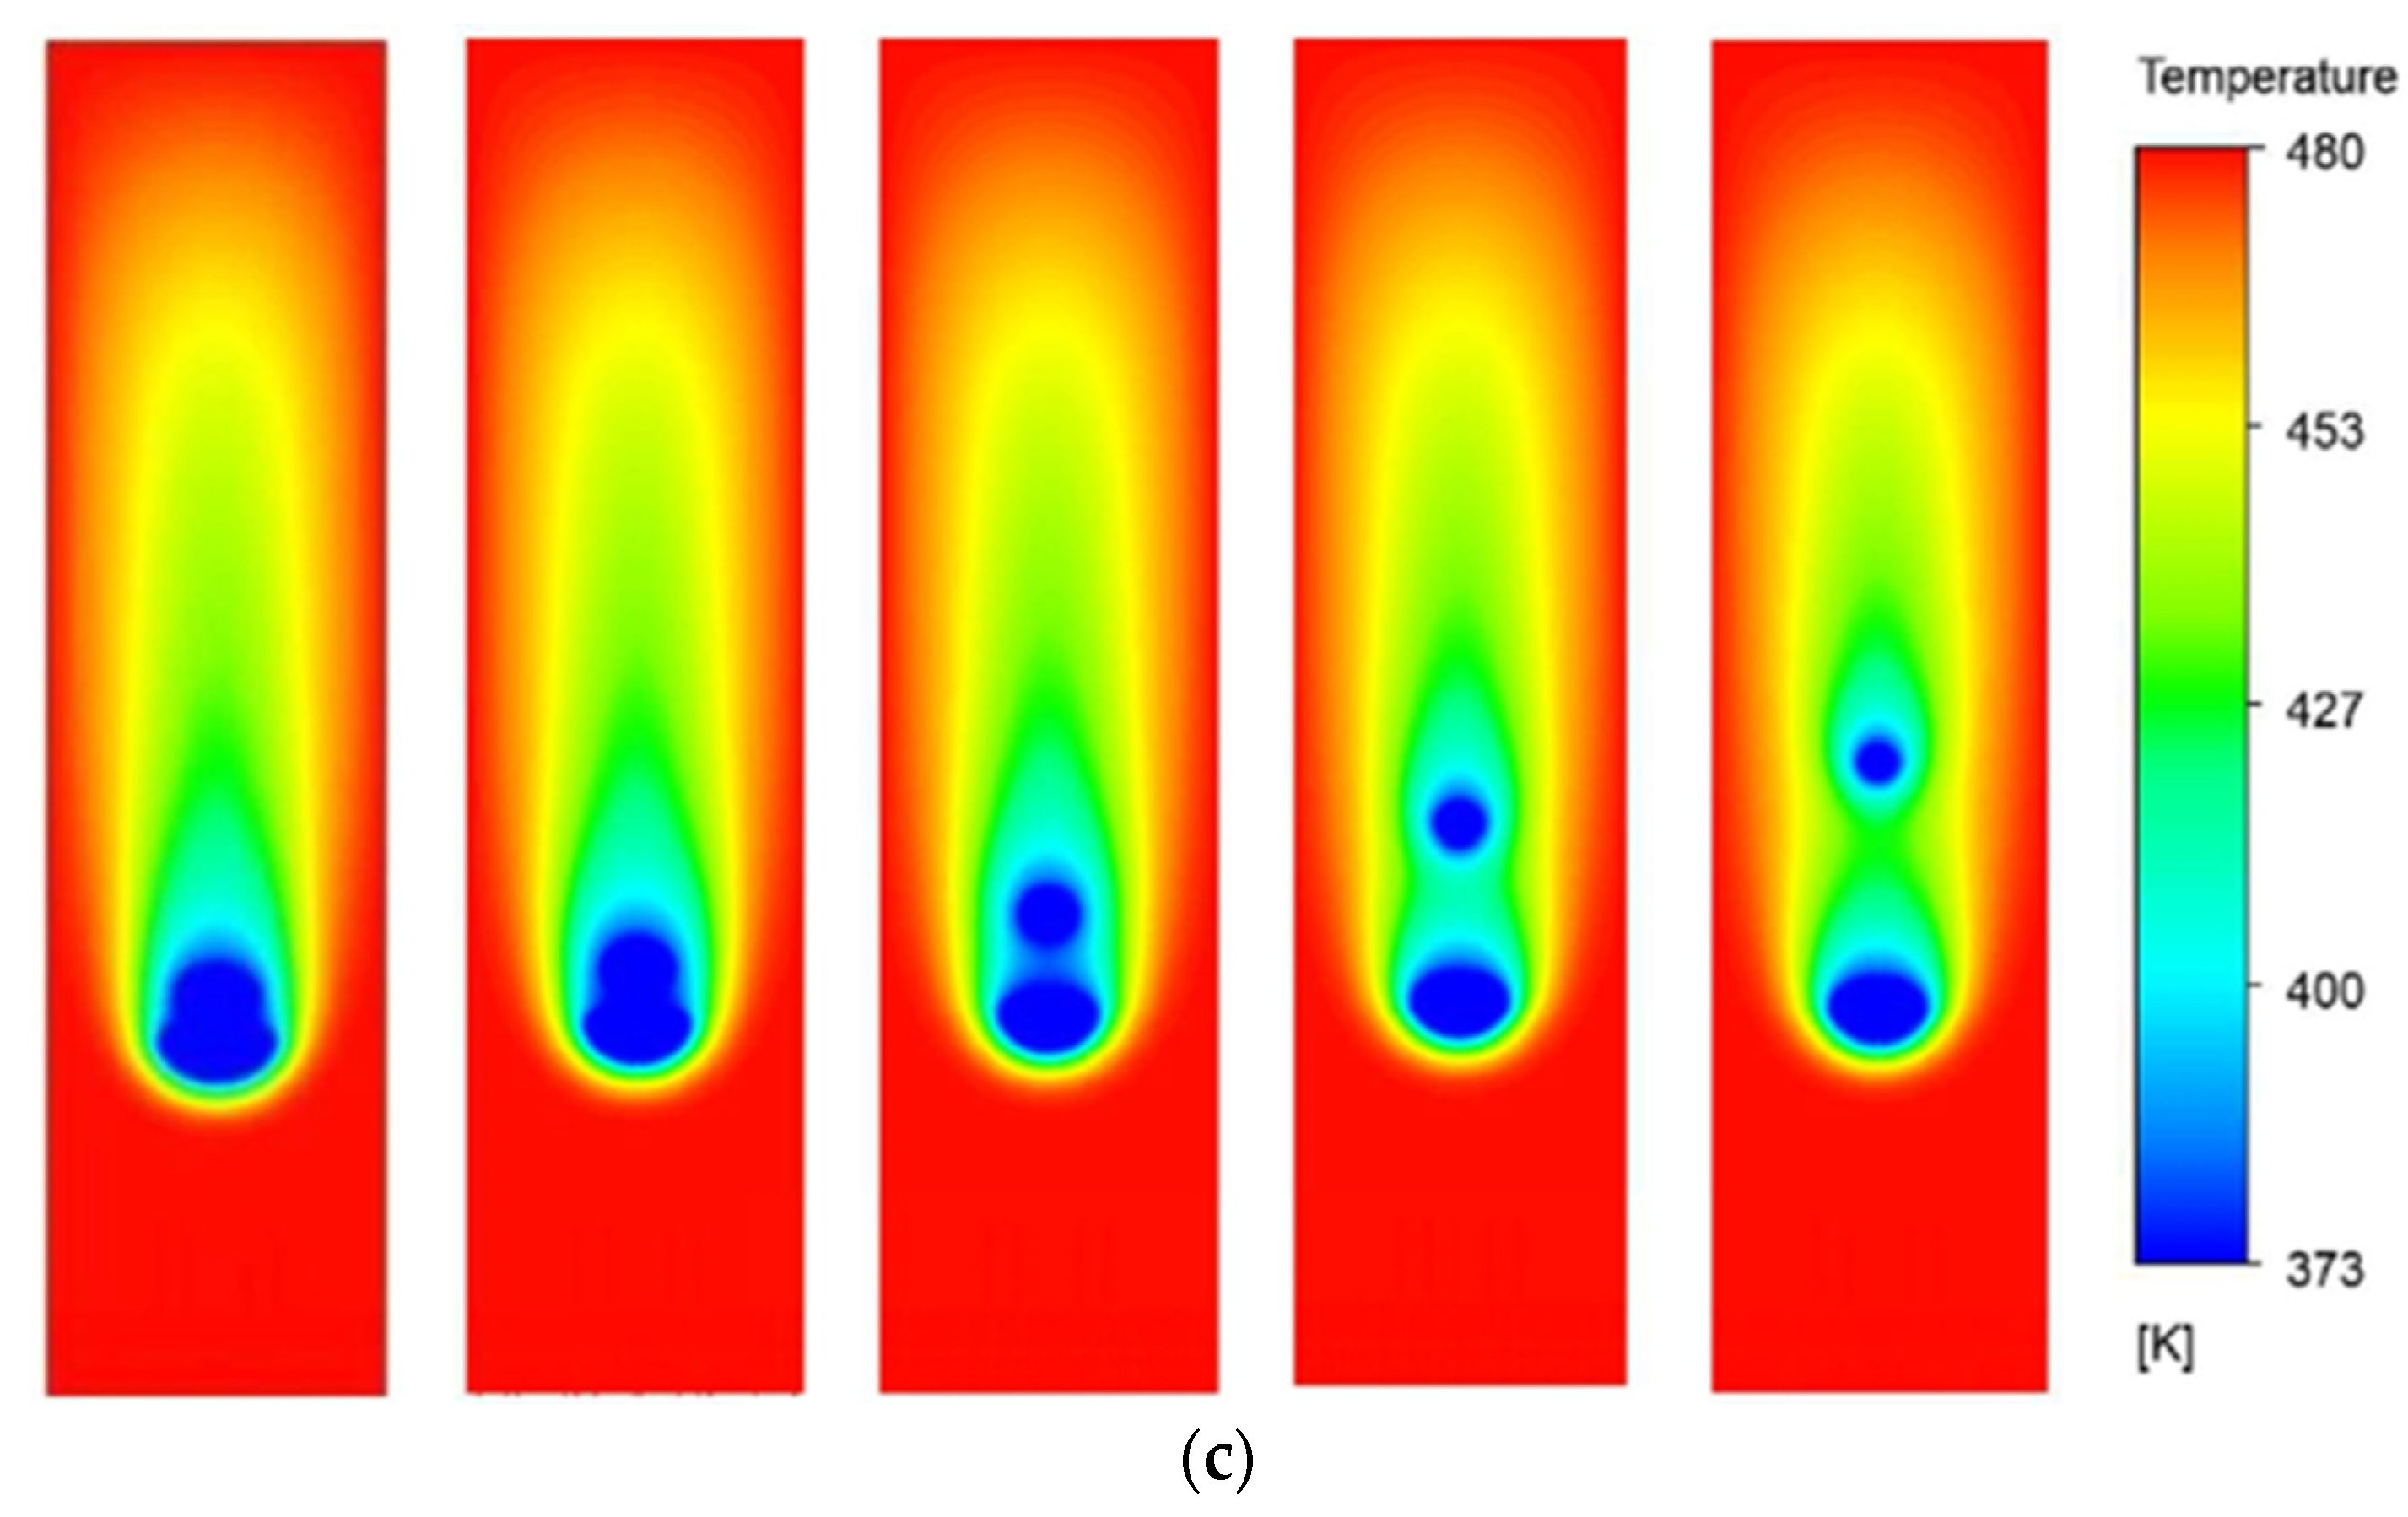
Figure 10 presents the temperature contours of all the cases at three different time instances. The size ratio (R) varies from 0.9 to 0.5 with a step size of 0.1 as we move from left to right across the columns. The rows present the contours of respective cases at three different time instances, that is, τ = 3, τ = 6, and τ = 9.
It is observed that, at non-dimensional time τ = 3, the temperature contours of the two droplets interact with each other for all the cases. It eventually affects the evaporation dynamics of the droplets. As the droplets move further down the channel, at τ = 6, the thermal buffer layer of the leading droplet envelopes the trailing droplet, significantly affecting the evaporation rates. It is further noted that the instantaneous distance between the leading and trailing droplets is dependent on the value of R; the higher the R, the smaller the distance between the droplets. This is because, for a larger R, that is, R = 0.9, the trailing droplet is bigger and, therefore, lies close to the leading droplet at the initial time (τ = 0). Eventually, later in time, the pull of the low-pressure wakes of the leading droplet is felt more quickly by the trailing droplet for larger R as compared to the smaller R. This results in higher velocities of trailing droplets and decreased distance between the leading and the trailing droplets for large R cases. At τ = 9, it can be seen that the coalescence of the two droplets has happened for R = 0.9 and 0.8 cases, while the R = 0.7 case is on the verge of coalescence. However, for the rest of the case, the two droplets are sufficiently far apart. This is because, for smaller R values (R = 0.6 and 0.5), the initial distance between the leading and trailing droplets is large and the pulling effects of the wakes of the leading droplet are felt quite late as compared to higher R value cases. Additionally, for the smaller trailing droplets, the terminal velocity is also lesser as compared to the leading droplet, resulting in an increase in the distance between the two droplets.
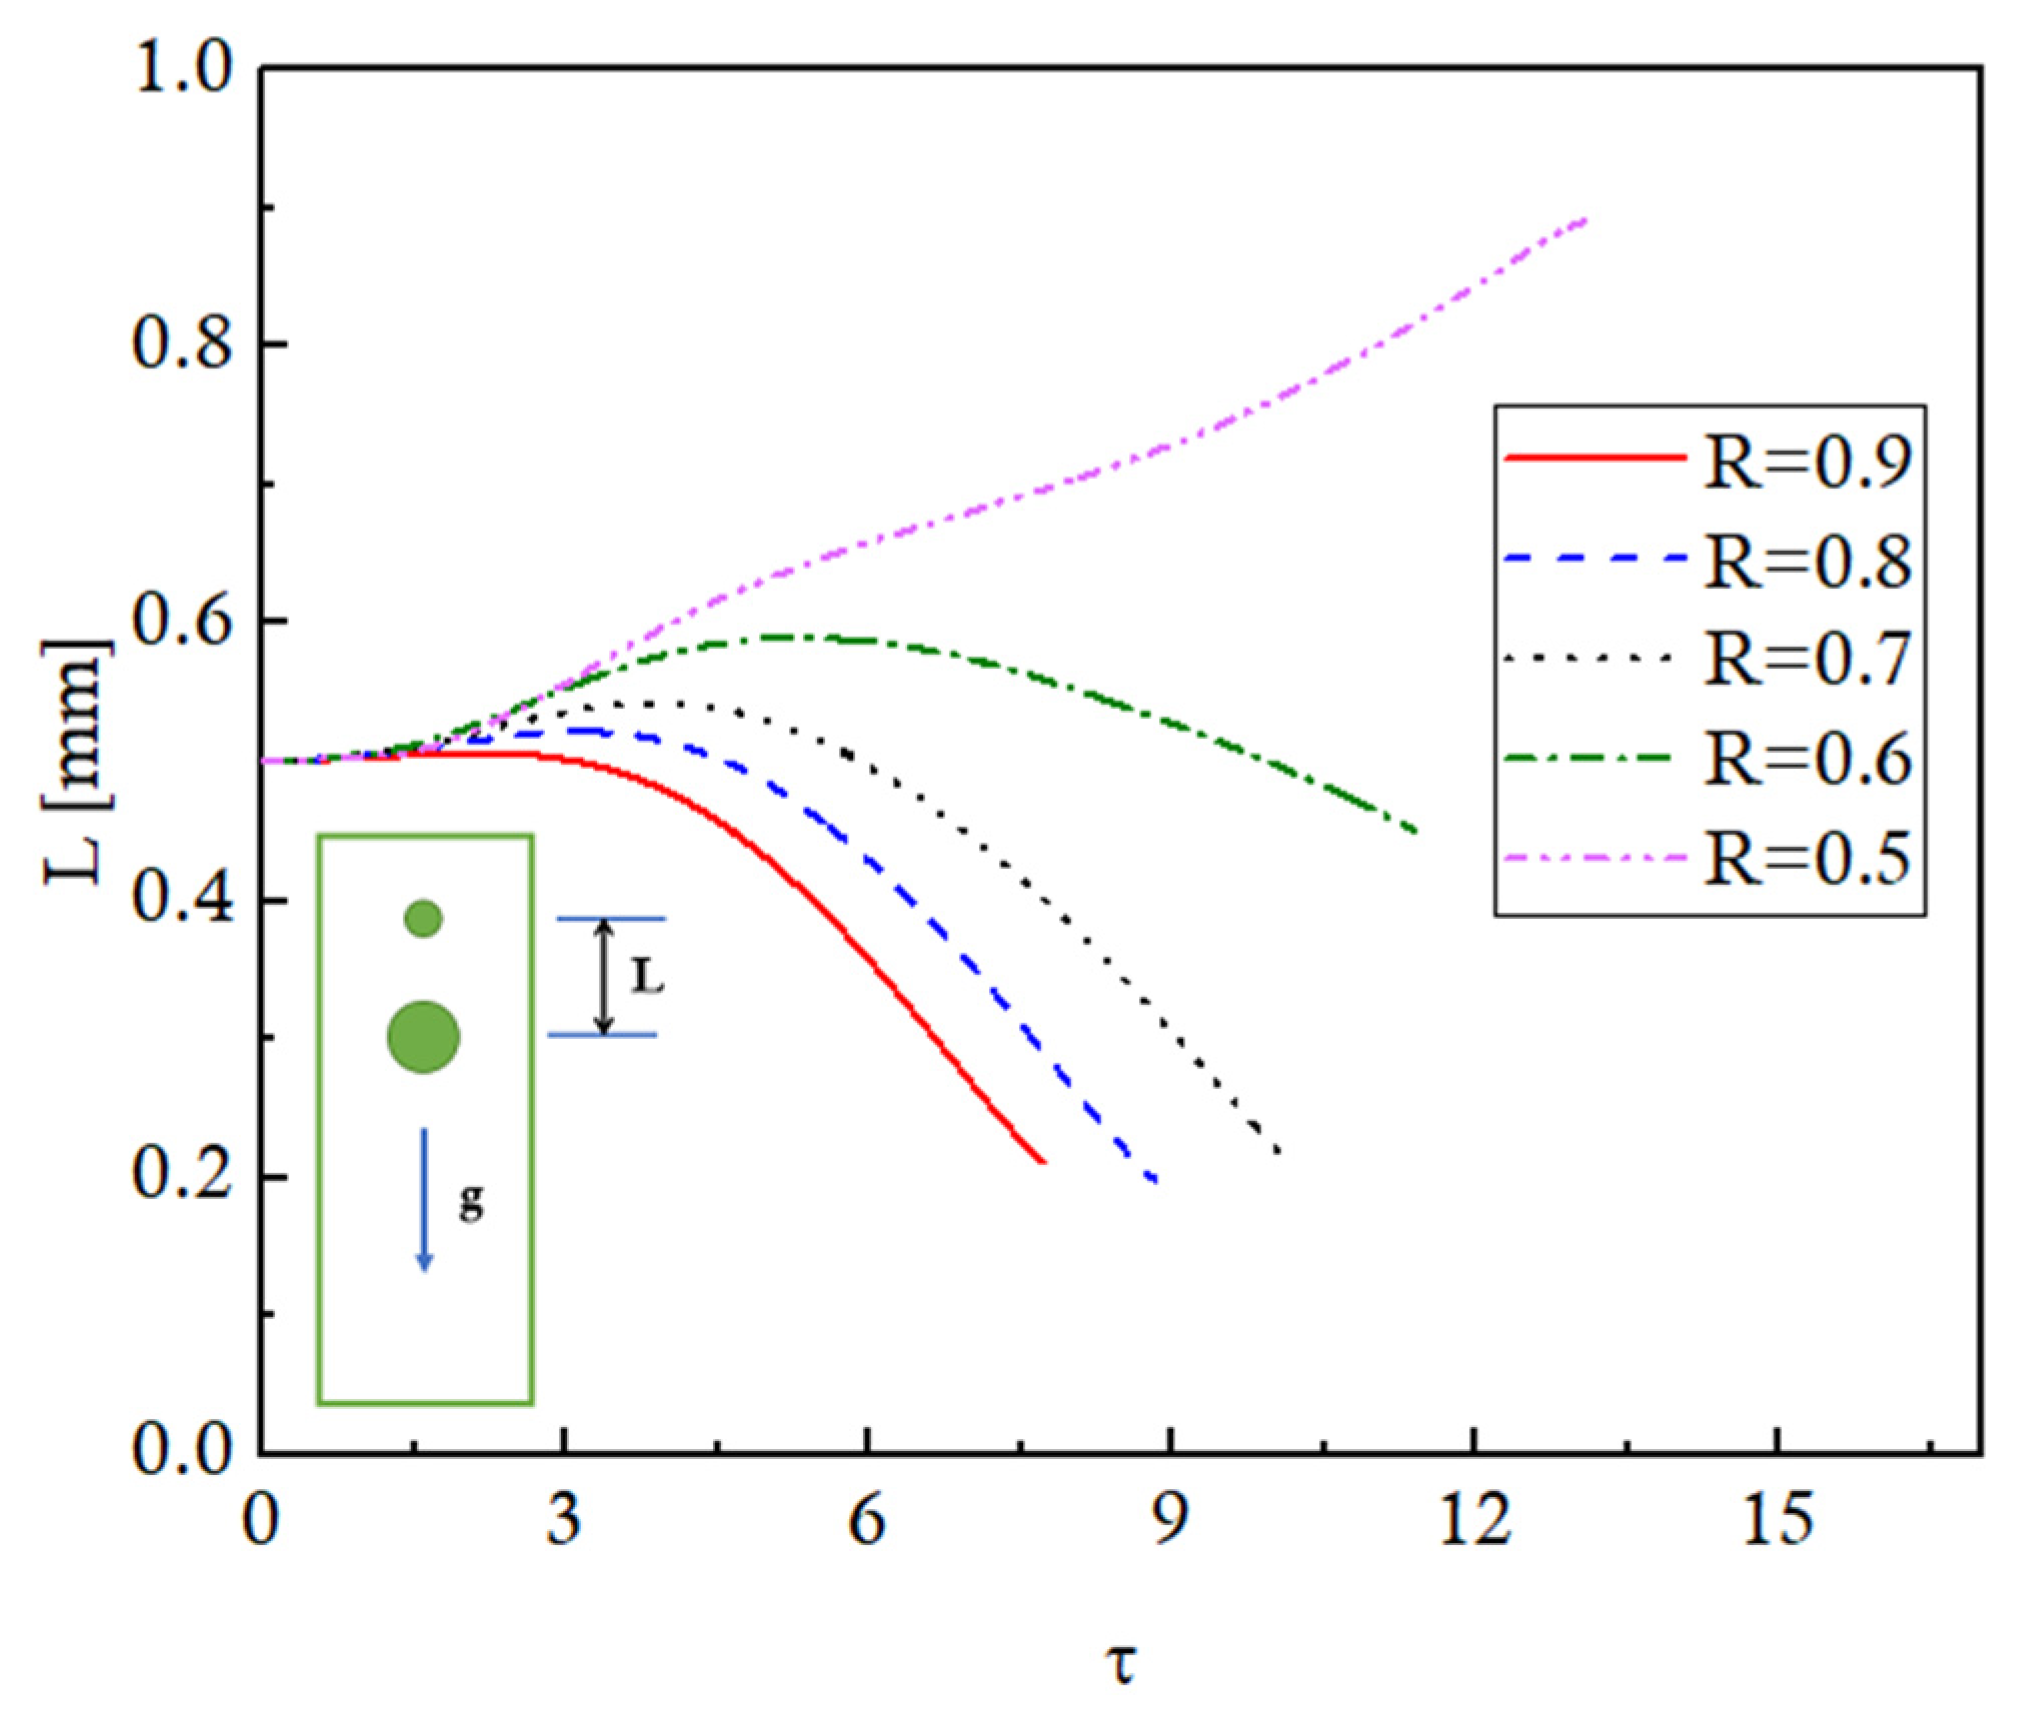
To further elaborate the evolving distances between the leading and trailing droplets for different R cases, the temporal variation of the distance between the two moving evaporating droplets is presented in
Figure 11. These trends can be explained using the concepts of terminal velocity and the suction effects of the wakes produced by the leading droplet. A bigger droplet will have a higher terminal velocity, and vice versa. Furthermore, the droplets will accelerate equally to attain their respective terminal velocities if subjected to similar ambient conditions. As the droplets start to move under the action of gravity for different R cases, they accelerate equally, and the distance between the droplets stays constant till τ = 1, for all the cases. Afterward, for R = 0.9, the trailing droplet being quite large (0.9 times the size of the leading droplet) and still accelerating to achieve its terminal velocity enters into the low-pressure suction region of the leading droplet. A pull is exerted on the trailing droplet, resulting in a decrease in the distance between the droplets until coalescence takes place. Similar trends are observed for R = 0.8, 0.7, and 0.6 cases, but the pull force resulting in a decrease in the distance between the droplets is observed progressively later in time because (1) the initial distance between the droplets increases as R is decreased, (2) the trailing smaller droplets experience more resistance, thereby decreasing their velocity and increasing the inter-droplet distance, and (3) smaller droplets have lower terminal velocities. The plot for the R = 0.5 case is in the continuation of the trends for the other R cases. In this case, the size of the trailing droplet is quite small, that is, half of the leading droplet size, and therefore experiences more resistance, resulting in a decrease in the velocity and an increase in the inter-droplet distance. Furthermore, the terminal velocity is also smaller, and after reaching the terminal velocity, the droplet attains steady-state velocity. Additionally, as the trailing droplet is away from the thermal buffer zone of the leading droplet, it experiences a high-temperature gradient resulting in rapid evaporation. This decreases the droplet size and further decreases the terminal velocity, resulting in a further increase in the inter-droplet distance.
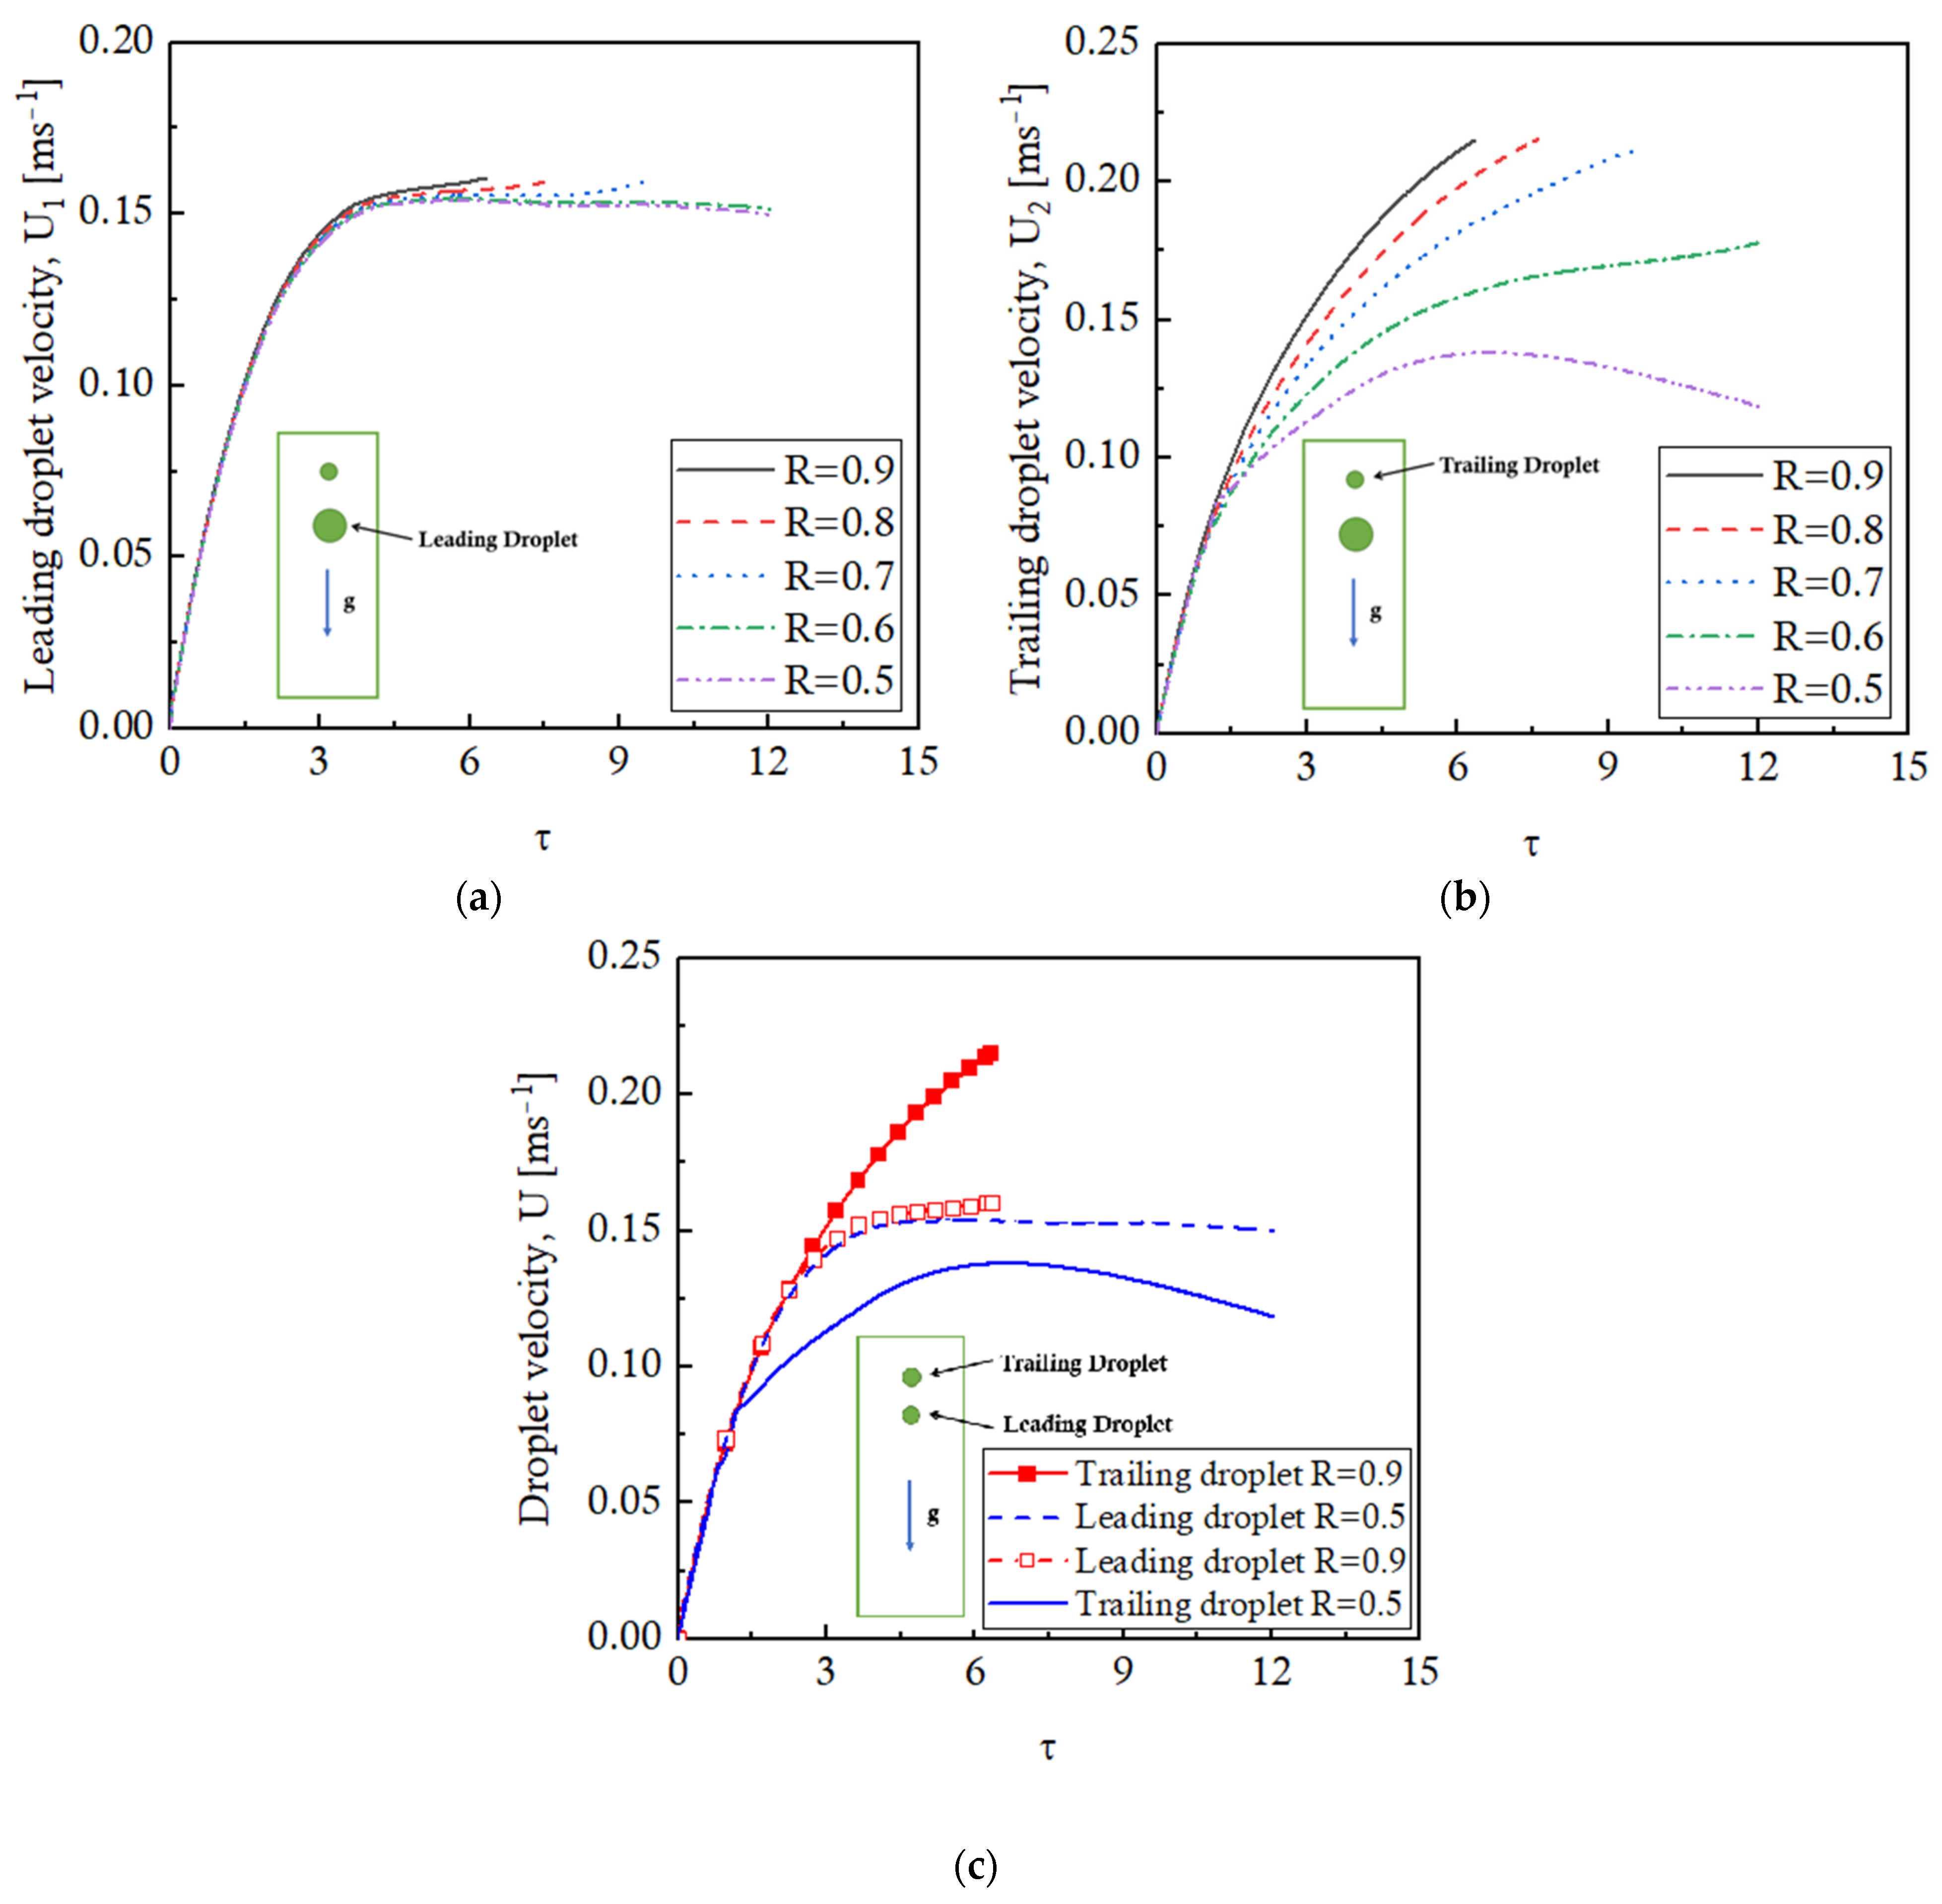
It is important to present the velocity profiles of the leading and trailing droplets for different R value cases to further explore the interaction and the coalescence of the droplets. The temporal variation of the velocity of the leading droplet is presented in
Figure 12a for all the studied cases, whereas the trailing droplet velocities are presented in
Figure 12b. The trends of the leading droplet velocity profiles are almost identical for all the size ratio (R) cases reporting a steady-state value of ~0.15 m/s. Small peaks are, however, observed as the droplets coalesce for R = 0.9, 0.8, and 0.7 cases. The velocity profiles of the trailing droplets are quite unique for different R cases. The velocities for R = 0.9, 0.8, and 0.7 cases continue to rise until the coalescence takes place at a velocity of 0.22 m/s. For the R = 0.6 case, the trailing droplet velocity reaches a steady-state value of 0.175 m/s, and eventually coalescence will occur. The trailing droplet velocity for R = 0.5 increases first and then decreases but stays lesser than the leading droplet velocity throughout the process.
These droplet interactions affect the evaporation rates of the droplets presented as normalized d
2 trends plotted against non-dimensional time τ in
Figure 13. It is observed that the evaporation of the leading droplet is insensitive to the size ratio (R), presenting overlapping trends for different values of R, as shown in
Figure 13a. The evaporation of the trailing droplet, however, is significantly affected by the size ratio (R). For the same center-to-center distance, a larger R value means a trailing droplet of a bigger radius that physically lies close to the leading droplet as compared to the smaller droplet corresponding to a smaller R value case. Therefore, a bigger trailing droplet close to the leading droplet evaporates slowly due to a low-temperature buffer layer of the leading droplet. This evaporation further slows down as the droplet comes closer to the leading droplet due to inertial effects. As the R values decrease, the trailing droplet subsequently lies farther away from the leading droplet, resulting in an increase in the evaporation rates. This justifies the trends presented in
Figure 13b. The lines are truncated as the coalescence takes place. Quantitatively, the coalescence takes place for R = 0.9, 0.8, and 0.7 at τ = 7.5, 8.7, and 10.4, respectively. Regarding the evaporation, at τ = 6, the leading droplet is evaporated by 12%. Considering the time size ratio values, it is expected that the trailing droplets, if placed in an isolated environment, should be evaporated by 13.3%, 15%, 17.1%, 20%, and 24% for R = 0.9, 0.8, 0.7, 0.6, and 0.5, respectively. However, due to the presence of the leading droplet and the interaction effects of the thermal buffer layer, these droplets actually evaporate by 11%, 12.5%, 15%, 19%, and 23.5%, reporting a corresponding reduction in the evaporation rates by 17.3%, 16.7%, 11.8%, 5%, and 2% for R = 0.9, 0.8, 0.7, 0.6, and 0.5 cases. It clearly indicates that the effects of the leading droplet on the evaporation rate of the trailing droplet decrease as the R value is decreased. If a quantitative comparison is made at the terminal times plotted for each R case, the evaporation of the trailing droplet is reduced by 26%, 25%, 22.2%, 15.9%, and 12.5% for R = 0.9, 0.8, 0.7, 0.6, and 0.5, respectively.
4.3. Effect of Arrangement Pattern
For two different-sized droplets, the arrangement pattern of the droplets also affects the evaporation process. To investigate this aspect, two configurations are studied, namely, a Small-Big-Arrangement (SBA) where the leading droplet is a big droplet and a Big-Small-Arrangement (BSA) where the leading droplet is the small droplet. This study is carried out for S = 4 and R = 0.5, in a domain size of 1 × 4 mm2 initialized at a temperature of 480 K.
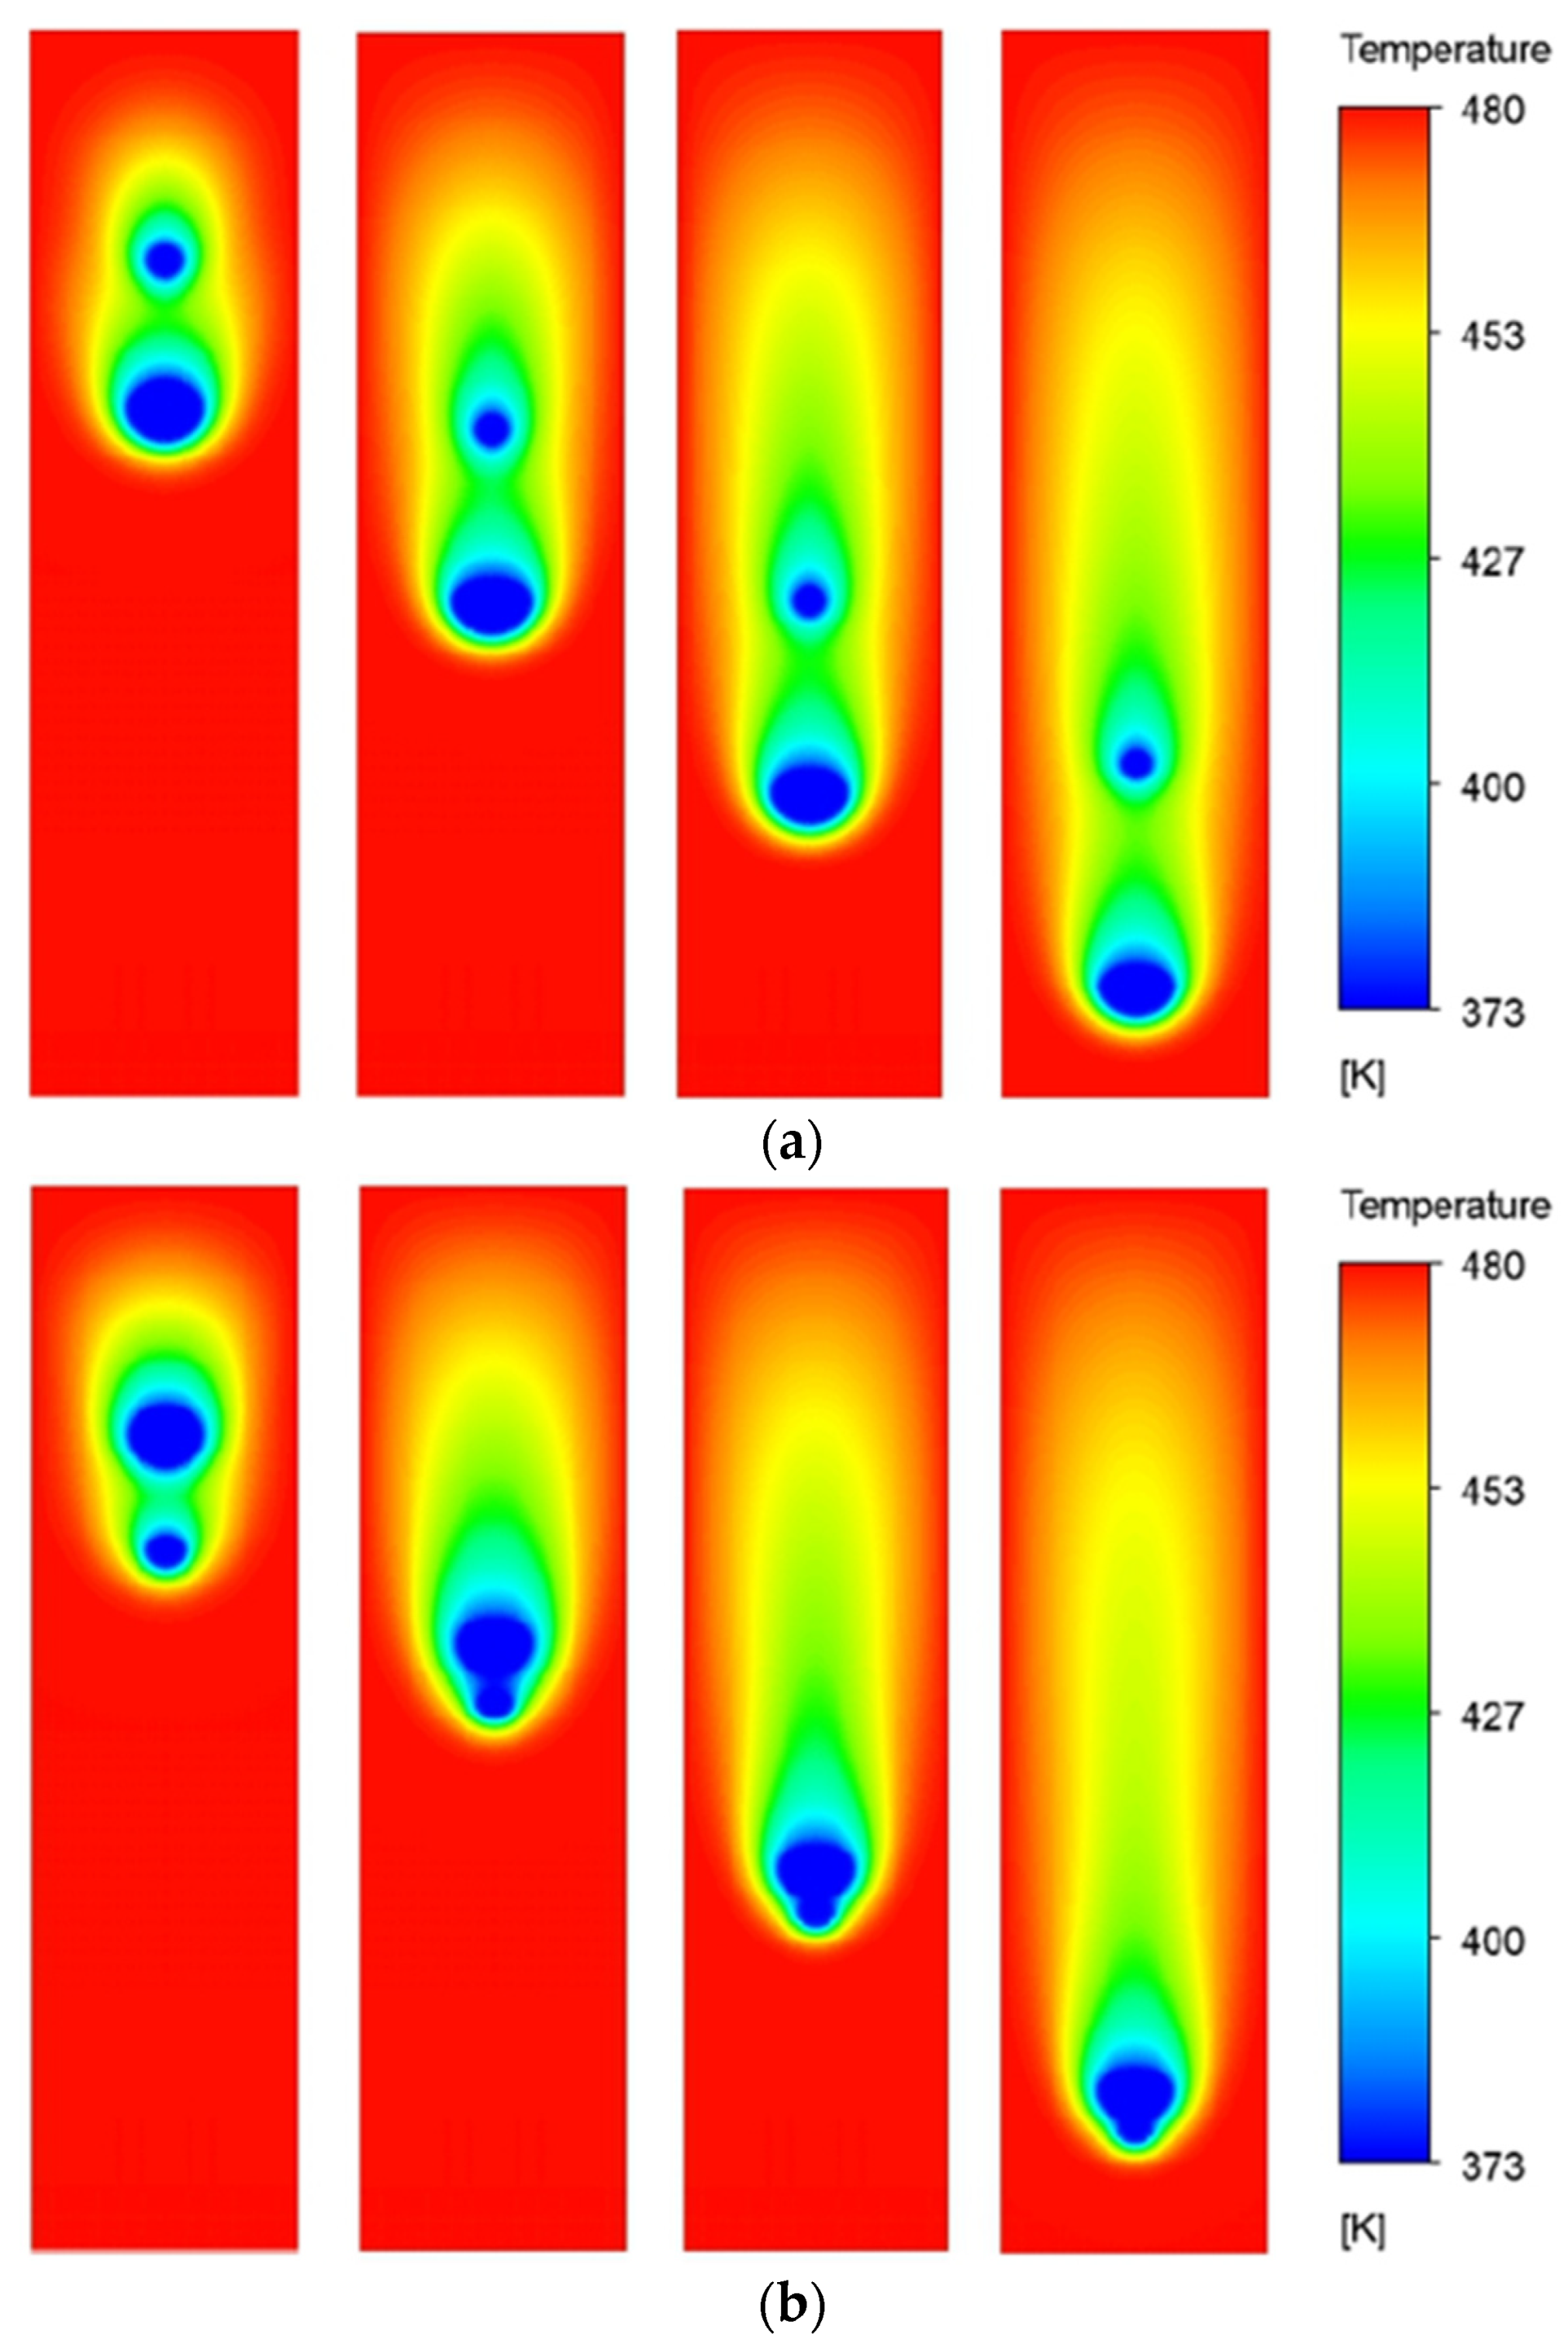
The temperature contours for both configurations are presented in
Figure 14 at τ = 3, 6, 9, and 12, moving from left to right across the columns. The top row presents the plots of the SBA configuration, while the bottom row is for the BSA configuration. These contours are crucial to understanding the evaporation dynamics of the moving droplets for the two configurations. For both cases, the thermal buffer layers are created due to the evaporation of the leading droplets that interact with the trailing droplets and will affect the evaporation phenomena. The interaction of the thermal buffer regions for the two configurations is, however, quite different due to the evolution of the inter-droplet distance as the droplets fall under the action of gravity. For the SBA configuration, the smaller trailing droplet slowly escapes out of the thermal buffer region due to the increasing distance between the droplets as the time proceeds. However, for the BSA configuration, the bigger trailing droplet continues to accelerate, comes closer to the leading smaller droplet, and at τ = 6, the coalescence starts.
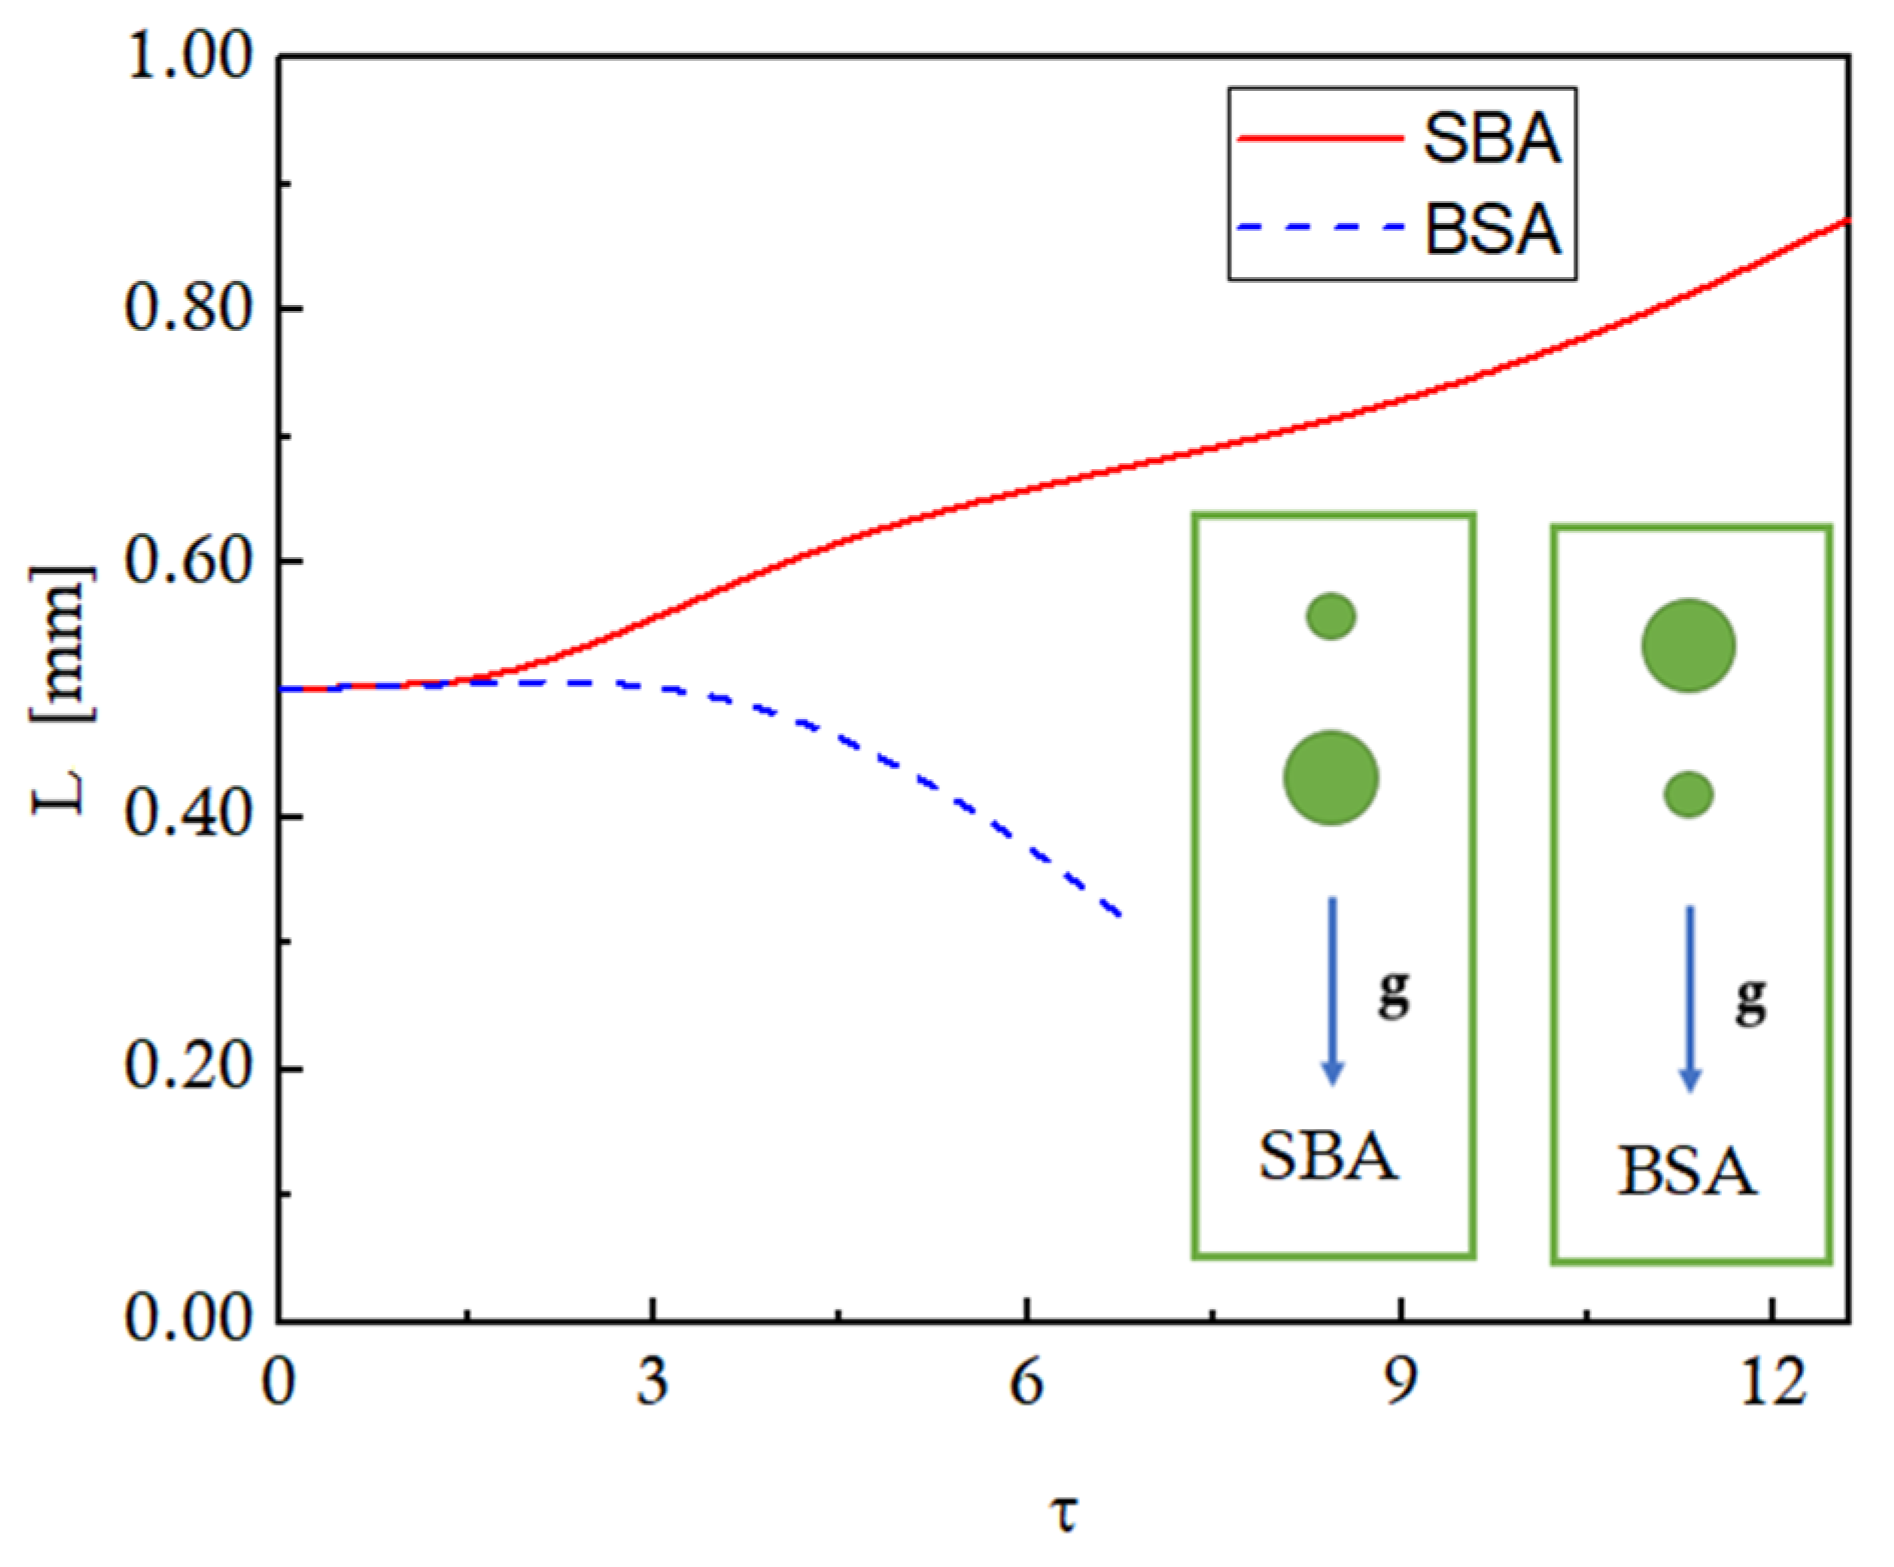
To explain the distinct trends of the droplet interaction for SBA and BSA configurations, the temporal evolution of the inter-droplet distance for both configurations is presented in
Figure 15. For an initial period of time, the inter-droplet spacing stays constant at the initial value for both configurations. Afterward, the distance between the two droplets starts decreasing for the BSA configuration, while it increases continuously for the SBA configuration. These trends can be explained using the velocities of the leading and trailing droplets presented in
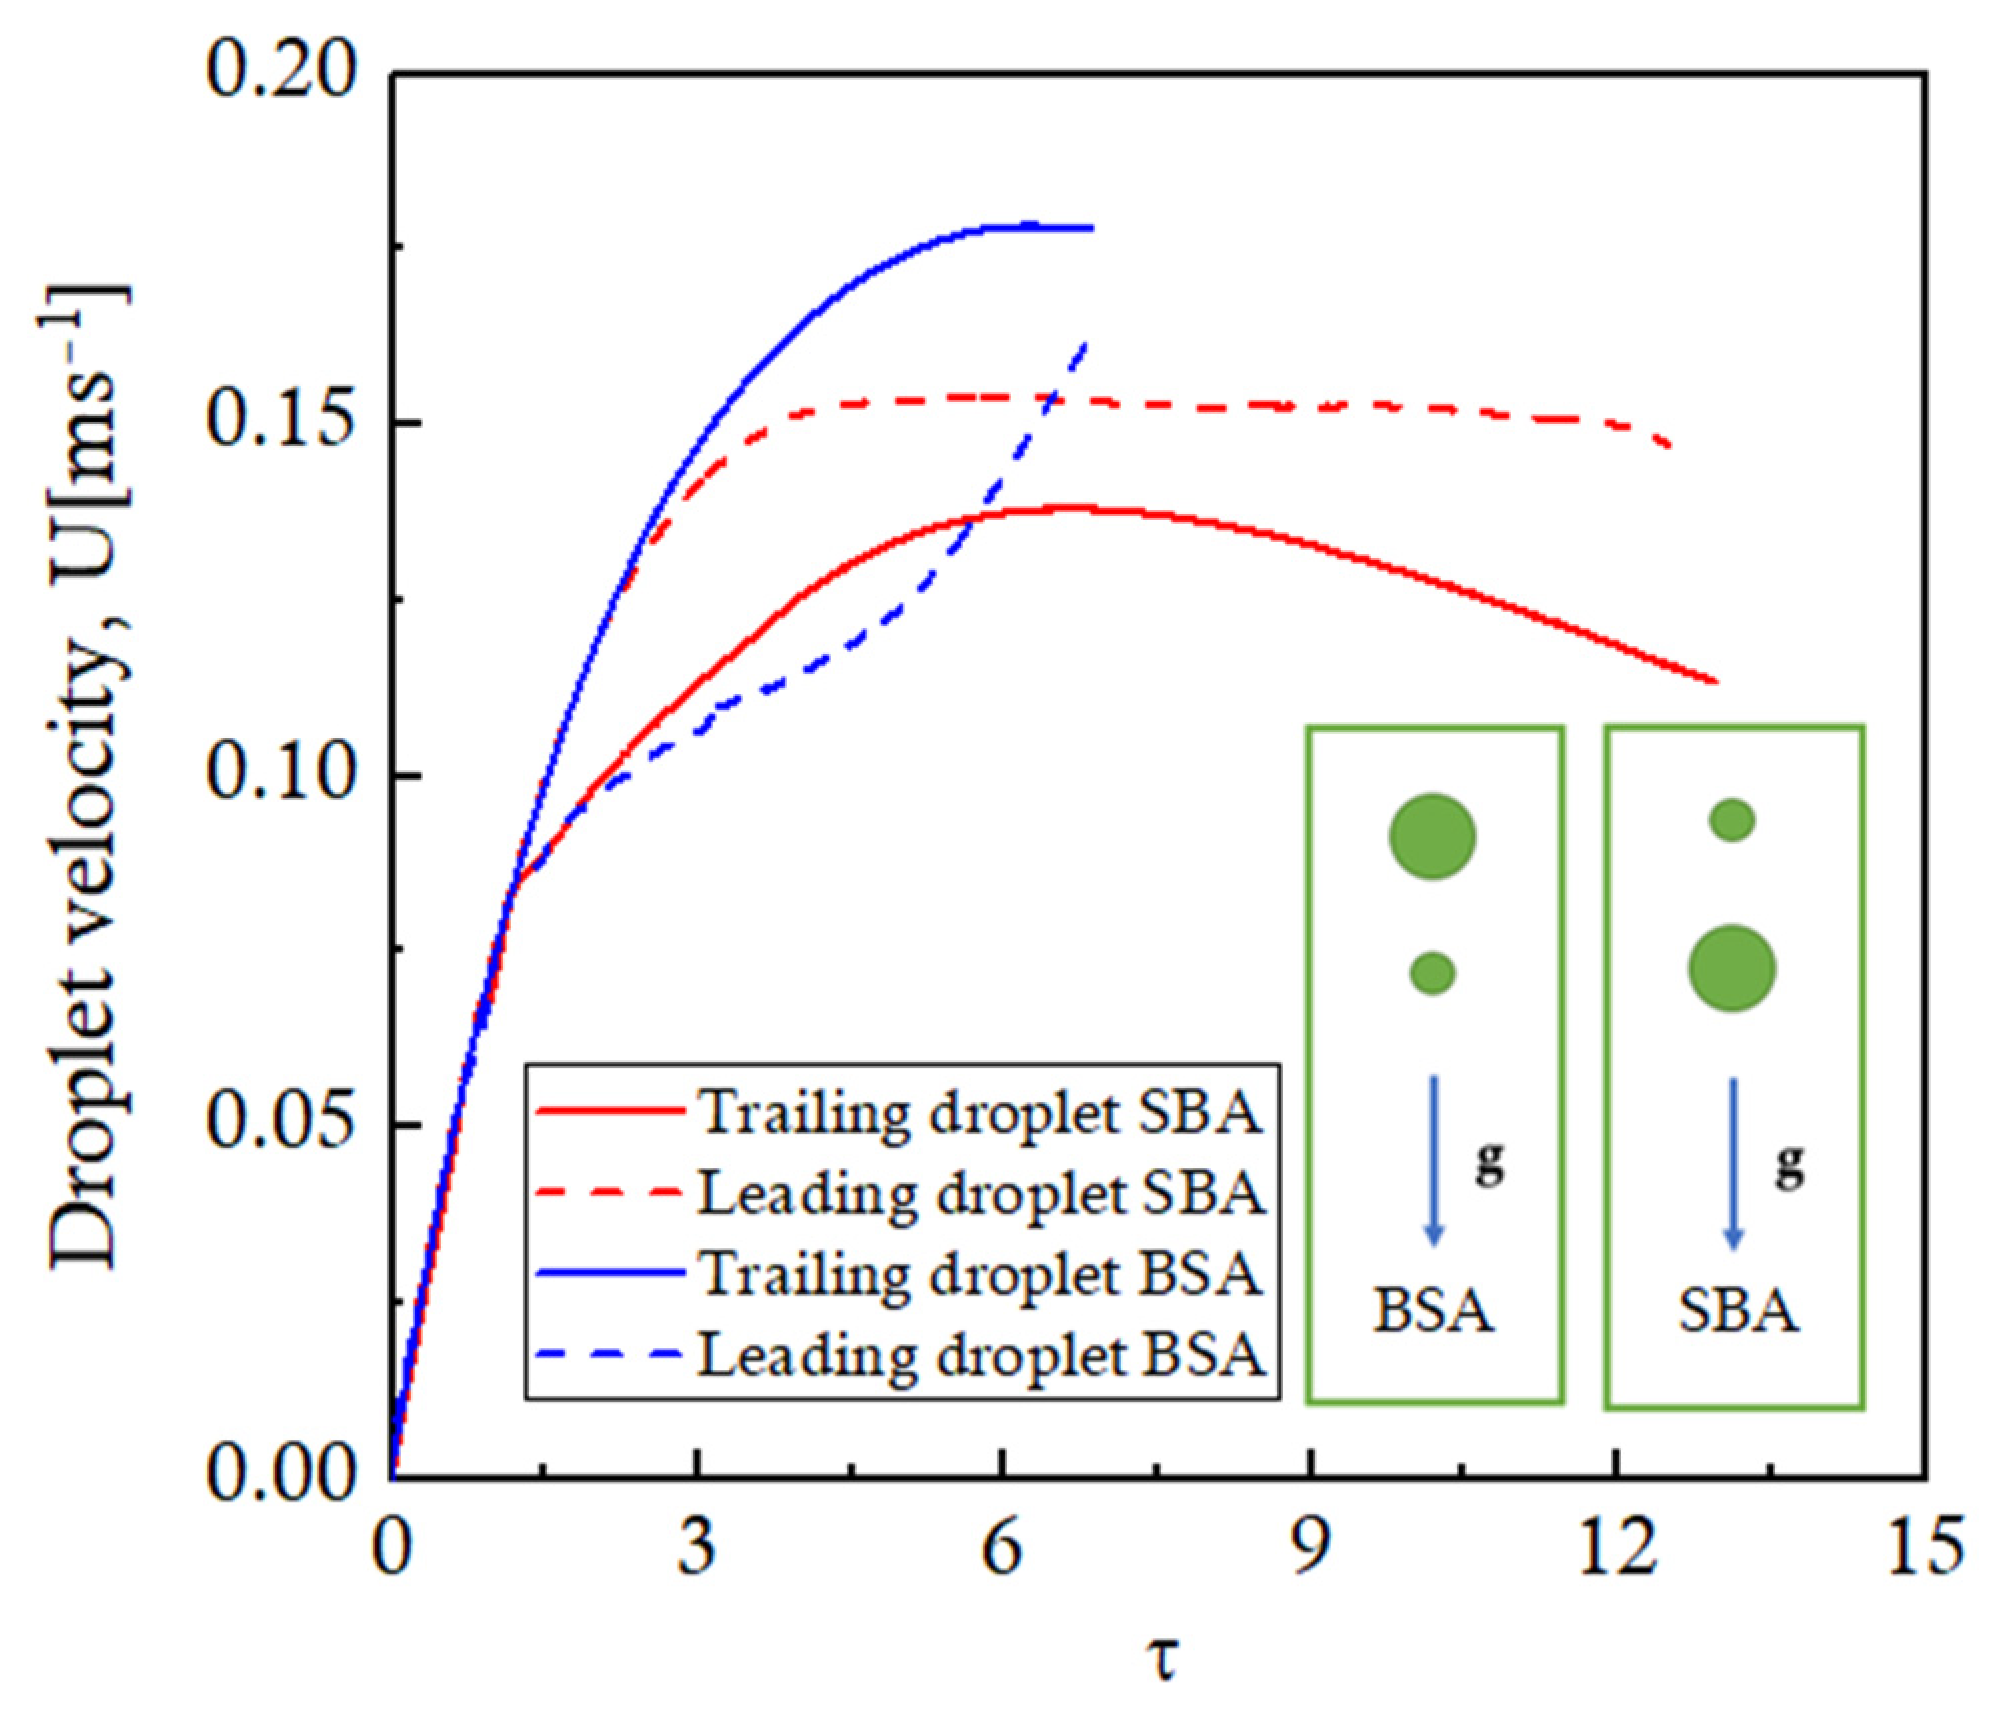
Figure 16 against the non-dimensional time. A smaller droplet will have a lower terminal velocity, and a larger droplet will attain a higher steady-state terminal velocity. It can be seen that, for the SBA configuration, as both droplets start to fall under gravity, both the droplets will accelerate equally for an initial period of time, thereby maintaining the equal inter-droplet distance as observed in
Figure 15. Afterward, as the trailing droplet reaches the steady-state terminal velocity of ~0.135 m/s, it will not accelerate anymore; rather, it starts decelerating as it comes out of the influence of the suction zone of the leading droplet. The leading larger droplet, on the other hand, will continue to accelerate to attain its larger terminal velocity of ~0.15 m/s as shown in
Figure 16. This results in an increase in the inter-droplet distance for the SBA configuration, as shown in
Figure 15. The situation reverses for the BSA case. In the BSA case, the smaller leading droplet tends to approach its steady-state terminal velocity at τ = 3, while the trailing droplet is still accelerating to attain its higher terminal velocity. Therefore, the distance between the droplets decreases until the coalescence takes place at ~τ = 6. These variations in the inter-droplet spacing affect the evaporation dynamics of the multi-sized droplets.
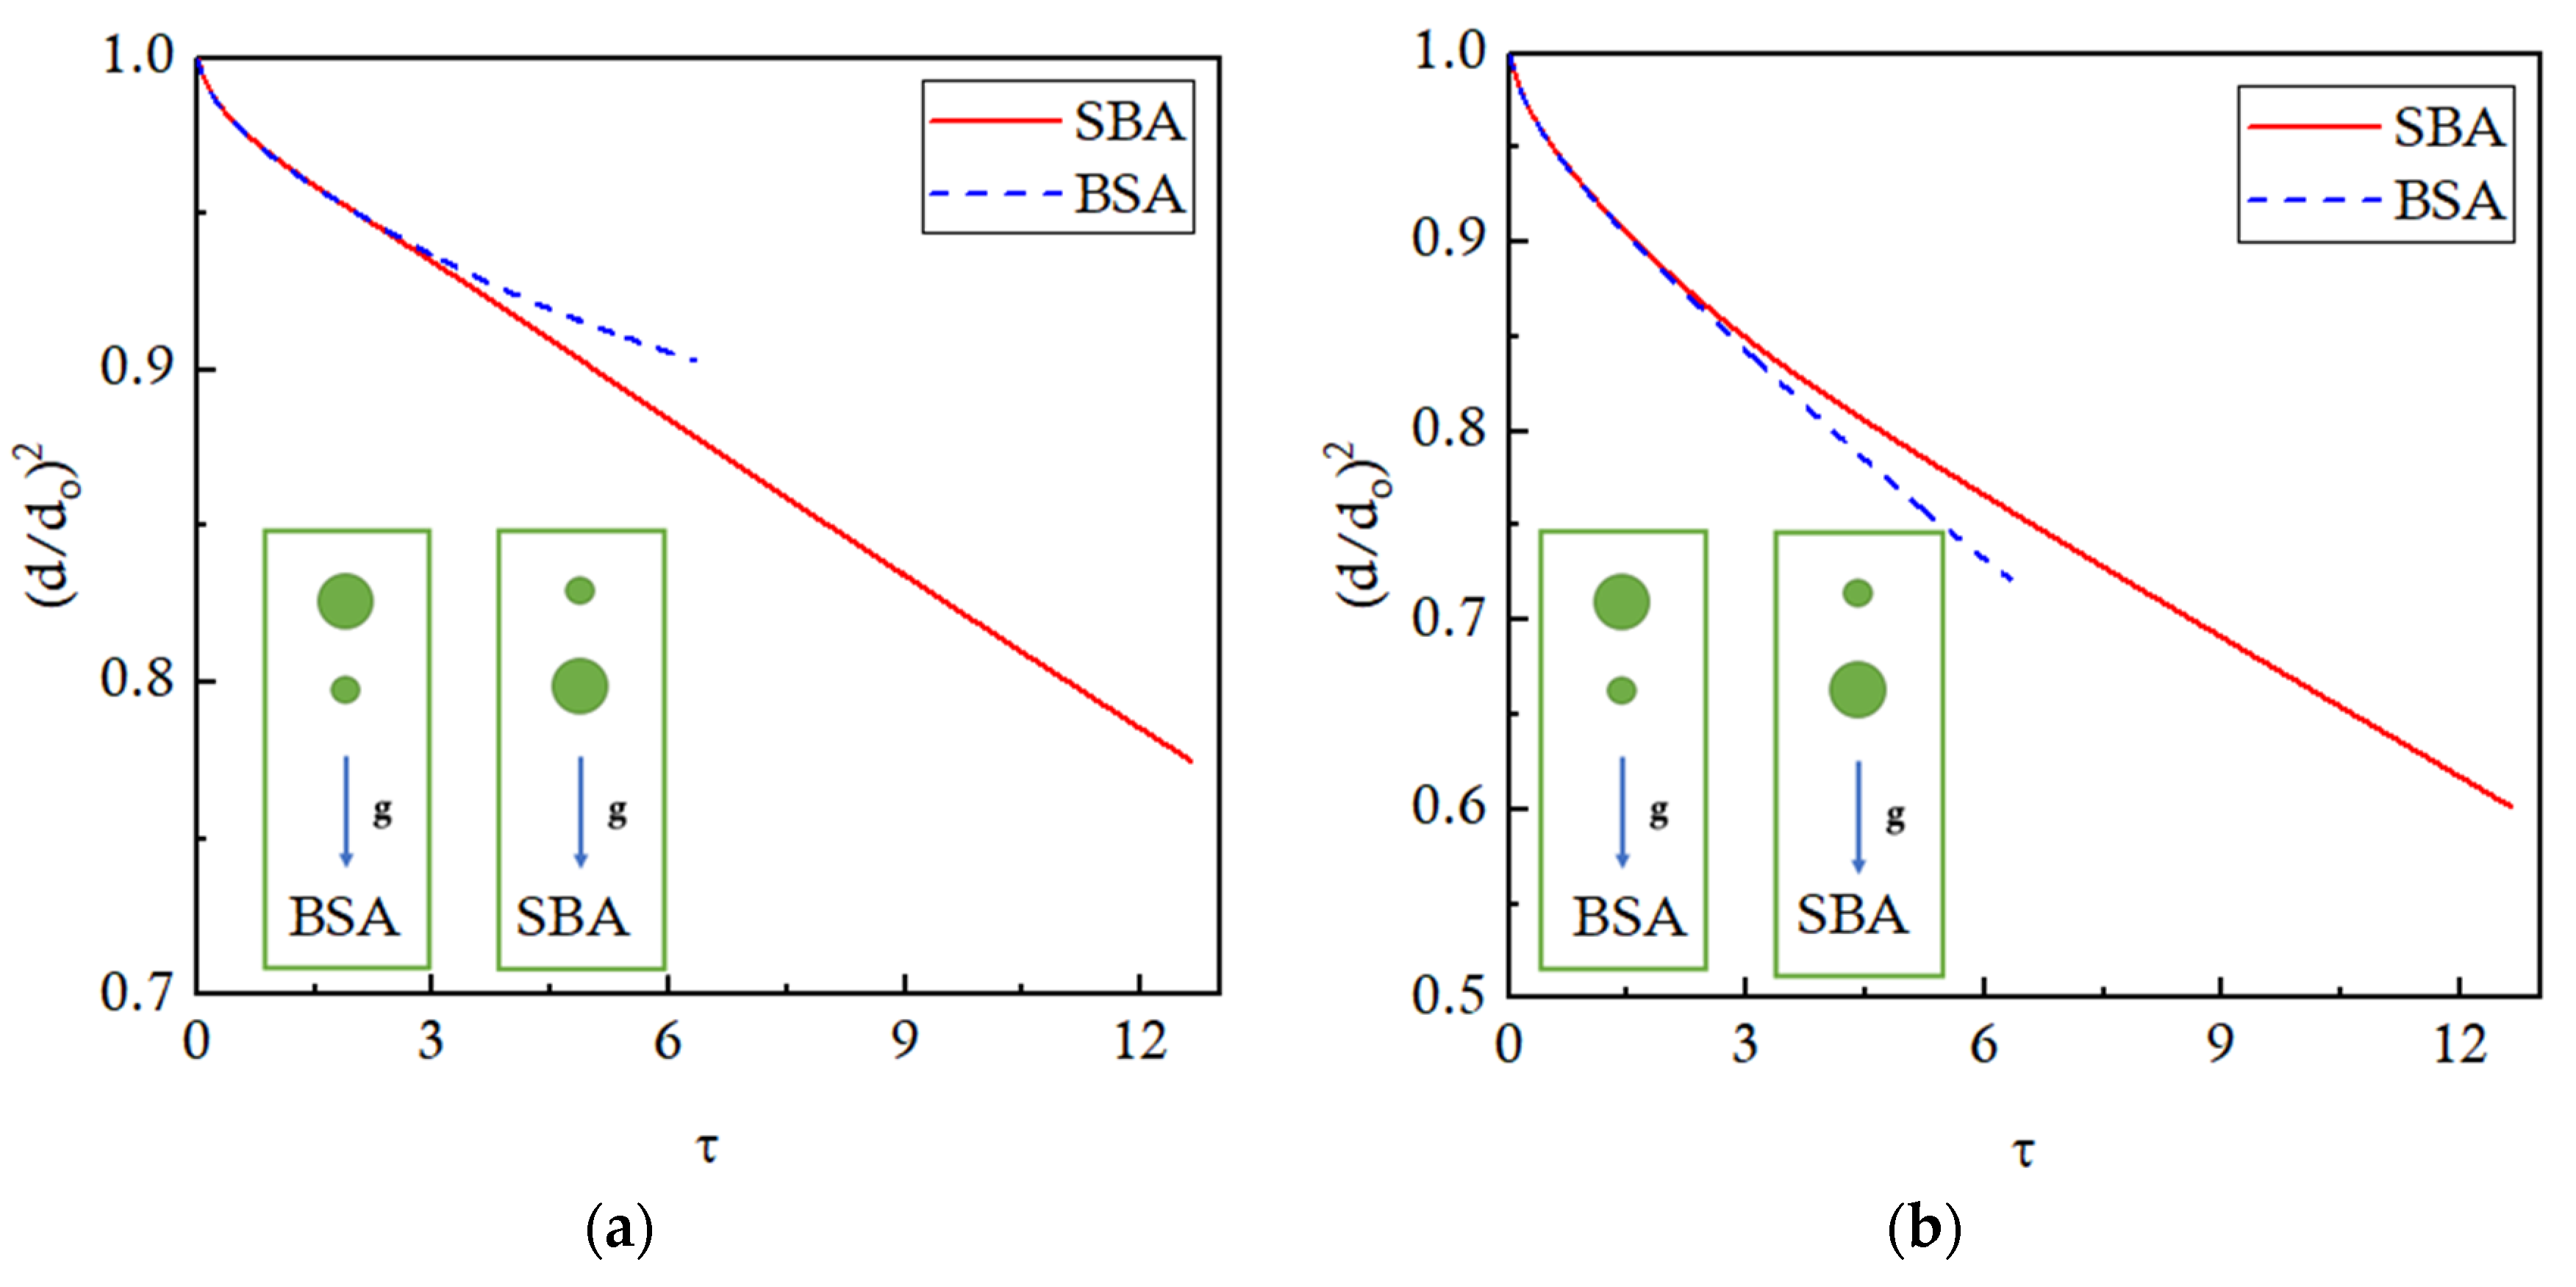
Figure 17 presents the evaporation trends of the big and small droplets in the form of normalized
d2 plotted against time. It is observed that the bigger droplet evaporates faster when it is in the leading position (SBA configuration) as compared to the trailing position (BSA configuration), as shown in
Figure 17a. Similarly, the smaller leading droplet evaporates faster (BSA configuration) than the smaller trailing droplet (SBA configuration) as shown in
Figure 17b. The slowed-down evaporation of the trailing droplets is due to the effects of the low-temperature thermal buffer layer of the leading droplets in both cases. For the BSA configuration, the trends of the normalized d
2 are presented before the coalescence takes place. Quantitatively, 28% of the leading smaller droplet is evaporated before coalescence, and the trailing droplet, which is double the size of the leading droplet, is expected to evaporate by 14% if placed in a similar isolated environment. But in actually, the trailing bigger droplet evaporates by only 10%, showing a 28.6% decrease in the evaporation. This decrease in the evaporation of the trailing droplet is due to the interaction effects of the buffer layer of the leading droplet. For the SBA configuration, the leading bigger droplet is evaporated by 23%. It is expected that the trailing droplet, which is half the size of the leading droplet, will evaporate by 46% if allowed to evaporate alone. However, it is observed that the trailing droplet evaporates by 40% due to the interaction effects of the leading droplet, reporting a 23% decrease in evaporation.
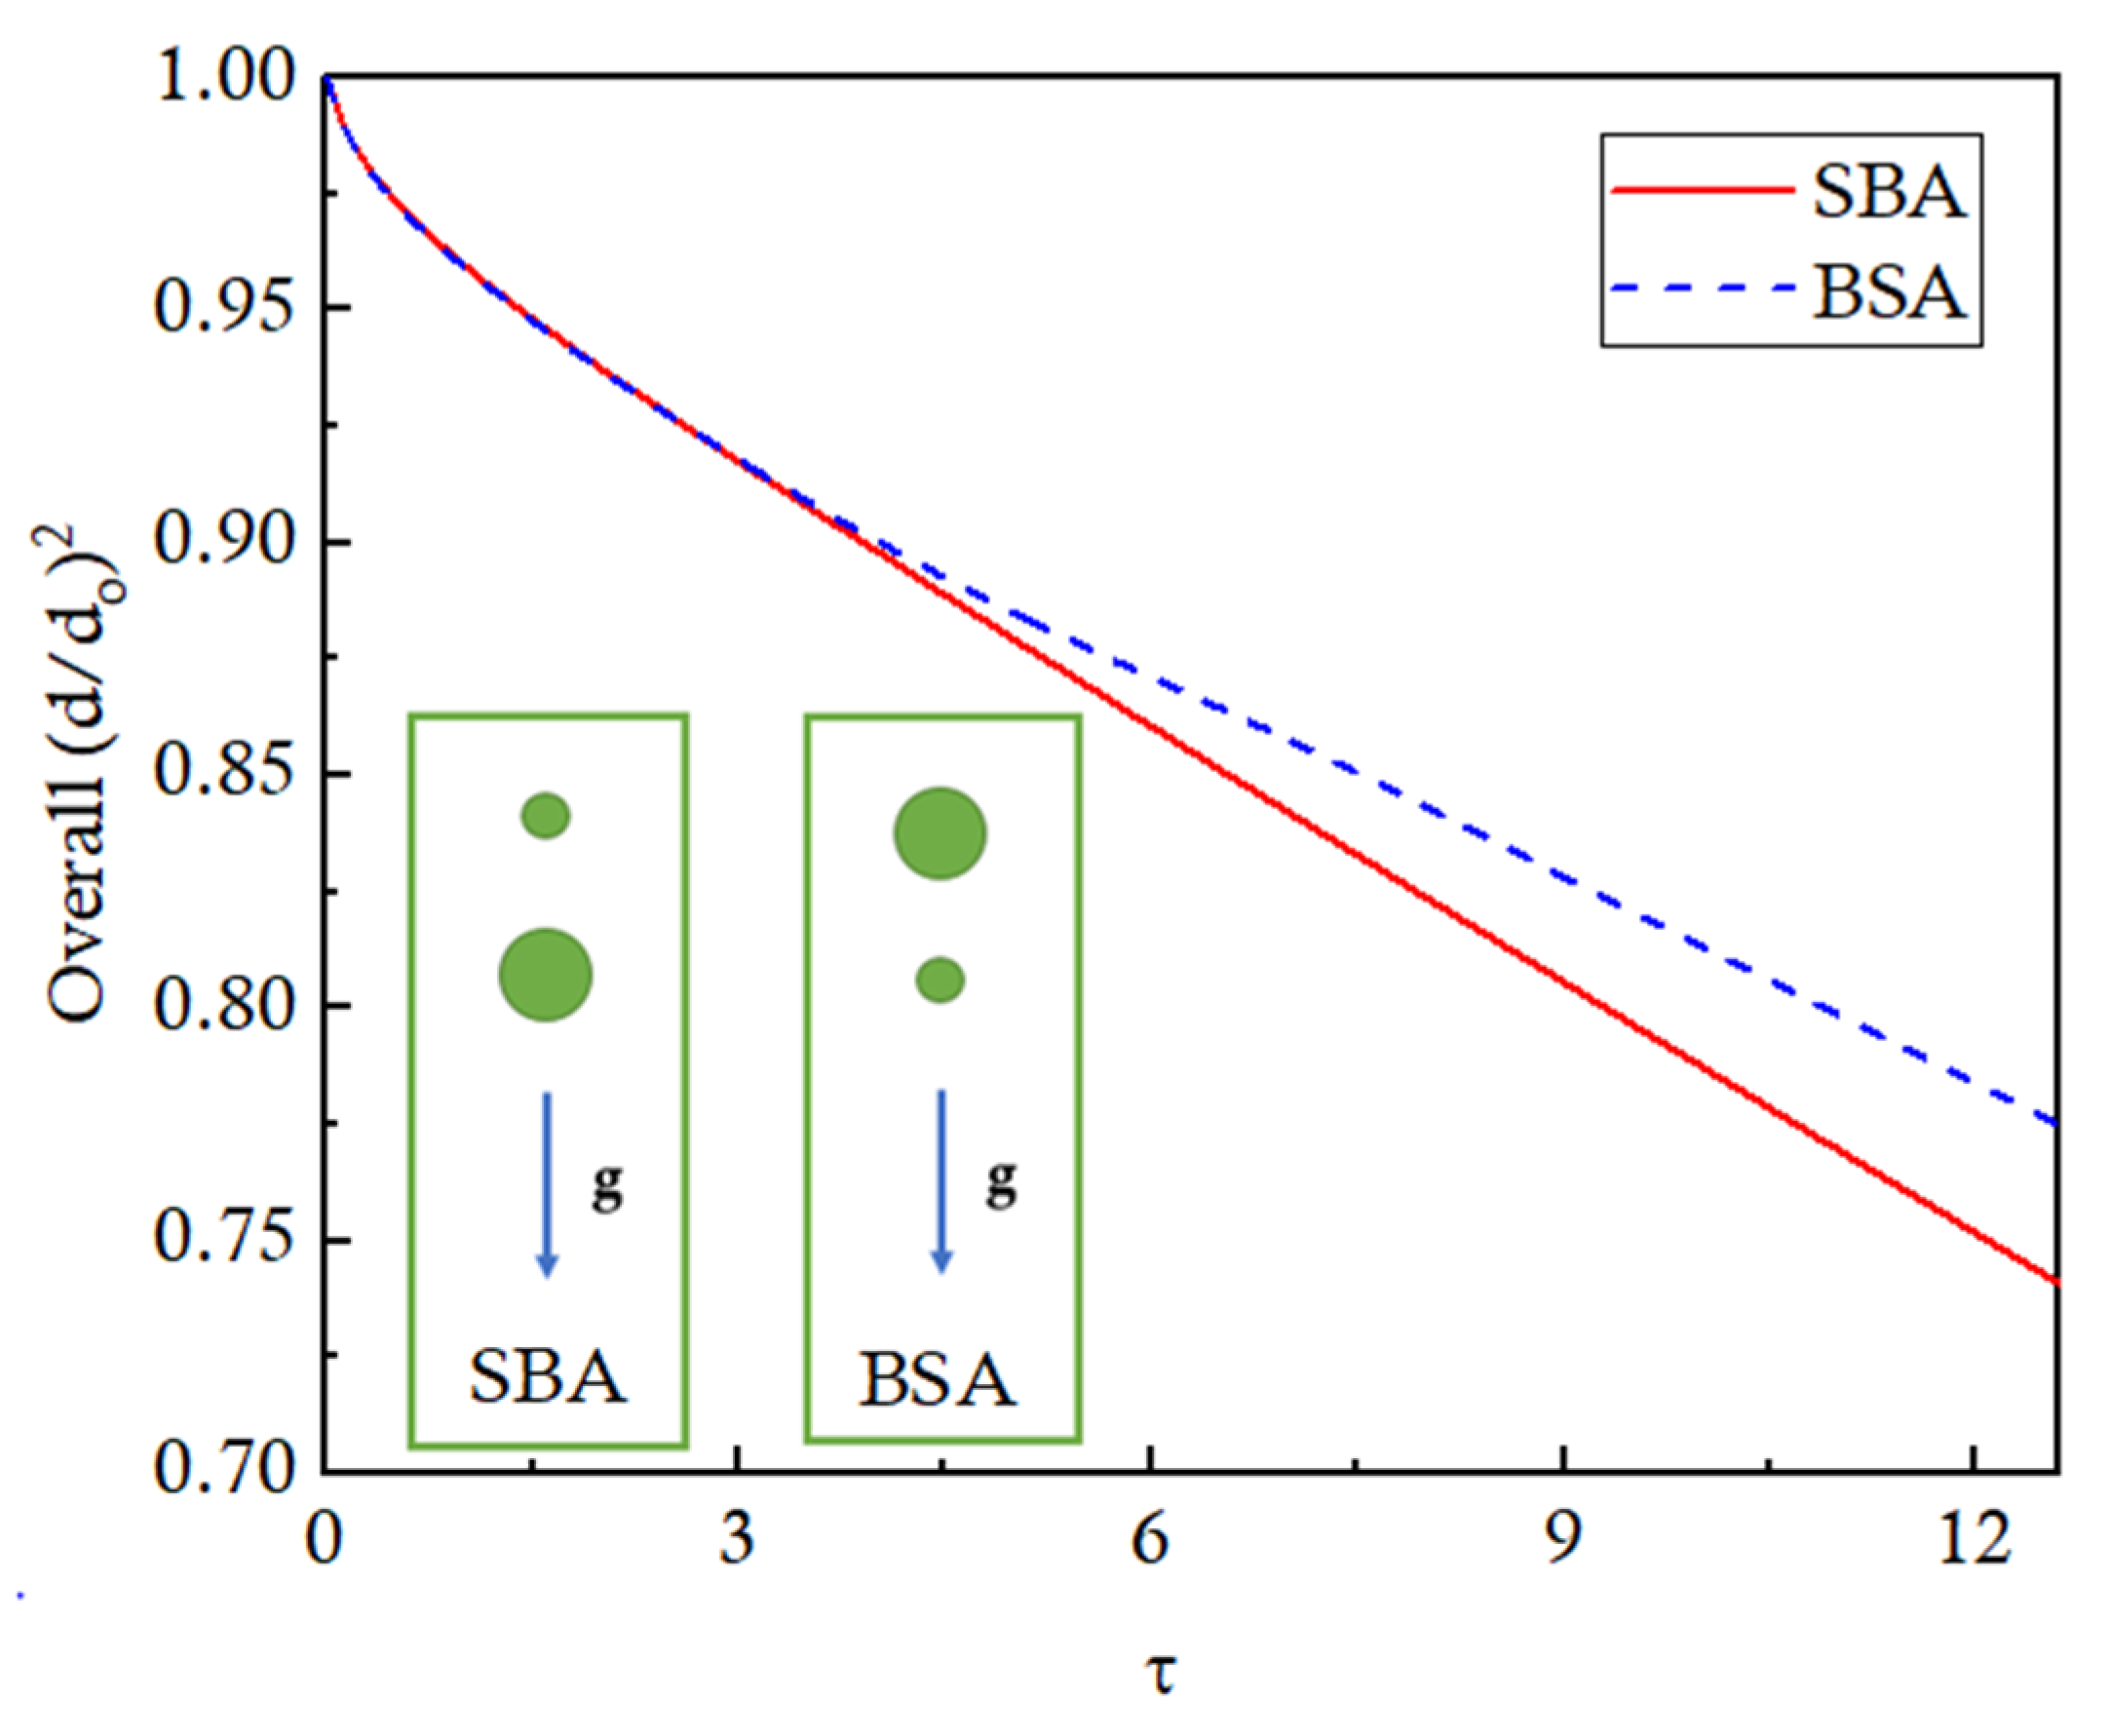
The overall evaporation of both droplets in BSA and SBA configurations is presented in
Figure 18 to analyze the effects of the arrangement pattern on the evaporation rate. The trends are identical for both configurations until 10% overall evaporation. Afterward, the evaporation of the BSA configuration slows down due to the close interaction and the coalescence effects. At
τ = 12, the droplets evaporate by 25% for the SBA configuration as compared to the 22% evaporation for the BSA configuration.
