Article

Storing Excess Solar Power in Hot Water on Household Level as Power-to-Heat System

1
Copernicus Institute of Sustainable Development, Utrecht University, Princetonlaan 8A, 3584 CB Utrecht, The Netherlands
2
Solyx Energy B.V. Smitspol 15M, 3861 RS Nijkerk, The Netherlands
*
Author to whom correspondence should be addressed.
Energies 2024, 17(20), 5154; https://doi.org/10.3390/en17205154
Submission received: 24 July 2024 / Revised: 7 October 2024 / Accepted: 12 October 2024 / Published: 16 October 2024
(This article belongs to the Special Issue Advanced Solar Technologies and Thermal Energy Storage)

Abstract

:
PV technology has become widespread in the Netherlands, reaching a cumulative installed capacity of 22.4 GWp in 2023 and ranking second in the world for solar PV per capita at 1268 W/capita. Despite this growth, there is an inherent discrepancy between energy supply and demand during the day. While the netting system in the Netherlands can currently negate the economic drawbacks of this discrepancy, grid congestion and imbalanced electricity prices show that improvements are highly desirable for the sustainability of electricity grids. This research analyzes the effectiveness of a Power-to-Domestic-Hot-Water (P2DHW) system at improving the utilization of excess PV electricity in Dutch households and compares it to similar technologies. The results show that the example P2DHW system, the WaterAccu, compares favorably as a low cost and flexible solution. In particular, for twelve different households differing in size (1–6 occupants), PV capacity (2.4–8 kWp), and size of hot water storage boiler (50–300 L), it is shown that the total economic benefits for the period 2024–2032 vary from −€13 to €3055, assuming the current net metering scheme is abolished in 2027. Only for large households with low PV capacity are the benefits a little negative. Based on a multi-criteria analysis, it is found that the WaterAccu is the cheapest option compared to other storage options, such as a home battery, a heat pump boiler, and a solar boiler. A sensitivity study demonstrated that these results are overall robust. Furthermore, the WaterAccu has a positive societal impact owing to its peak shaving potential. Further research should focus on the potential of the technology to decrease grid congestion when implemented on a neighborhood scale.

1. Introduction

The implementation of photovoltaics (PV) has become widespread in recent years, leading to effective use in both industries and residencies. In the Netherlands, the annual installed capacity of PV power in 2023 was 4.2 GWp, leading to a cumulative installed capacity of 22.4 GWp [1]. Not only that, but the Netherlands ranks second place in the world when it comes to solar PV per capita, scoring 1268 W per capita. This shows that the possibility of producing electricity individually per household and lowering energy costs as a result is a great benefit for consumers. Furthermore, PV development is an important part of the energy transition focused on lowering the use of fossil fuels [2]. Since the effectiveness of PV is still highly dependent on external factors, which can hardly be influenced, making full use of the generated solar electricity becomes the subsequent challenge. An average household only utilizes 30% of the produced PV power directly on an annual basis, which means that the majority of the produced energy must be sent to the grid to be potentially utilized by other households [3]. For PV users in the Netherlands, this has no monetary impact due to the current netting scheme, which allows households to subtract excess electricity fed into the grid from the electricity that they annually receive from the grid. This means that consumers with a large amount of installed PV power can effectively bring their electricity bills down to zero. In addition, most households also receive smaller monetary compensation for electricity sent to the grid [4]. This netting system has proven effective for encouraging consumers to adopt domestic PV by lowering the average payback period from 9 years to 5 years [4]. However, this can lead to the grid being overloaded when multiple PV users provide electricity, which requires mitigation by grid operators. This leads to increased grid and energy costs, even for residences without PV [5]. Therefore, it is preferable for PV users to utilize their own solar energy as much as possible, in addition to more sustainable energy being used instead of fossil fuels.
The primary way of accomplishing this goal is to store excess energy so it can be used when required at a later time. This is possible through battery technologies, but not only do most batteries still require materials that can lead to further pollution, the required materials are also quite expensive to the point where it becomes highly difficult to earn back the investment [3]. Instead, this research will focus on short-term storage of excess PV energy in hot water as an alternative to electric batteries and contemporary technologies. This short-term storage primarily acts as a power-to-heat system alternative to heat pumps [6,7]. The method will be referred to as a Power-to-Domestic-Hot-Water system, or a P2DHW system in short. As the name implies, this system is meant to be used at household level, unlike most power-to-heat systems with storage implemented that only function at larger scales requiring larger investments [8,9]. P2DHW is meant to function on a comparatively smaller scale, such as individual households or buildings at the largest scale. In countries such as England, where netting is not an option, P2DHW systems are already effective methods of utilizing more PV energy within households, so the question remains whether this is the case for the Netherlands as well, and what the effects of the netting system might be. This research will therefore focus on comparatively small-scale utilization of P2DHW compared to earlier research, analyzing how it interacts with the netting system and how it compares to contemporary technologies that utilize excess electricity, the latter of which has not been explored much in previous research. The P2DHM system includes an electric boiler and a specific device that is used for controlling energy flows, as shown in Figure 1a. The device is connected to the electric boiler and detects when electricity is being sent to the grid. Then, the device will dynamically control the heating elements of the boiler to heat tap water with the exact amount of excess energy. An example of this function is shown in Figure 1b. During the hour shown in this figure, the PV production [10] fluctuates, and the P2DHW system reacts accordingly so the energy can first be utilized by other devices in the residence. The residence power usage is constant at 5 kW, but at one point, an electric kettle is turned on for a few minutes, and the P2DHW system lowers its power usage accordingly.
Not only would this system lead to better local use of excess PV energy, it would also lead to lowered emissions of CO2, since the majority (80%) of households in the Netherlands still require gas to heat tap water [11,12,13,14]. The combination of this device and a conventional electric boiler is called a WaterAccu [15,16], which shall be used to gauge the effectiveness of the P2DHW system.
The purpose of this work is to investigate the effectiveness of P2DHW in the Dutch context, i.e., in relation to changing policies such as the abolishment of netting in the future. This will prompt PV system owners to utilize their own PV-generated energy as much as possible, hence increasing self-consumption.
The rest of the paper is organized as follows. In Section 2, the materials and methods are described. This is followed by Section 3, which describes the results of the modeling and sensitivity studies. In Section 4, a discussion is present, and Section 5 concludes the paper.

2. Materials and Methods

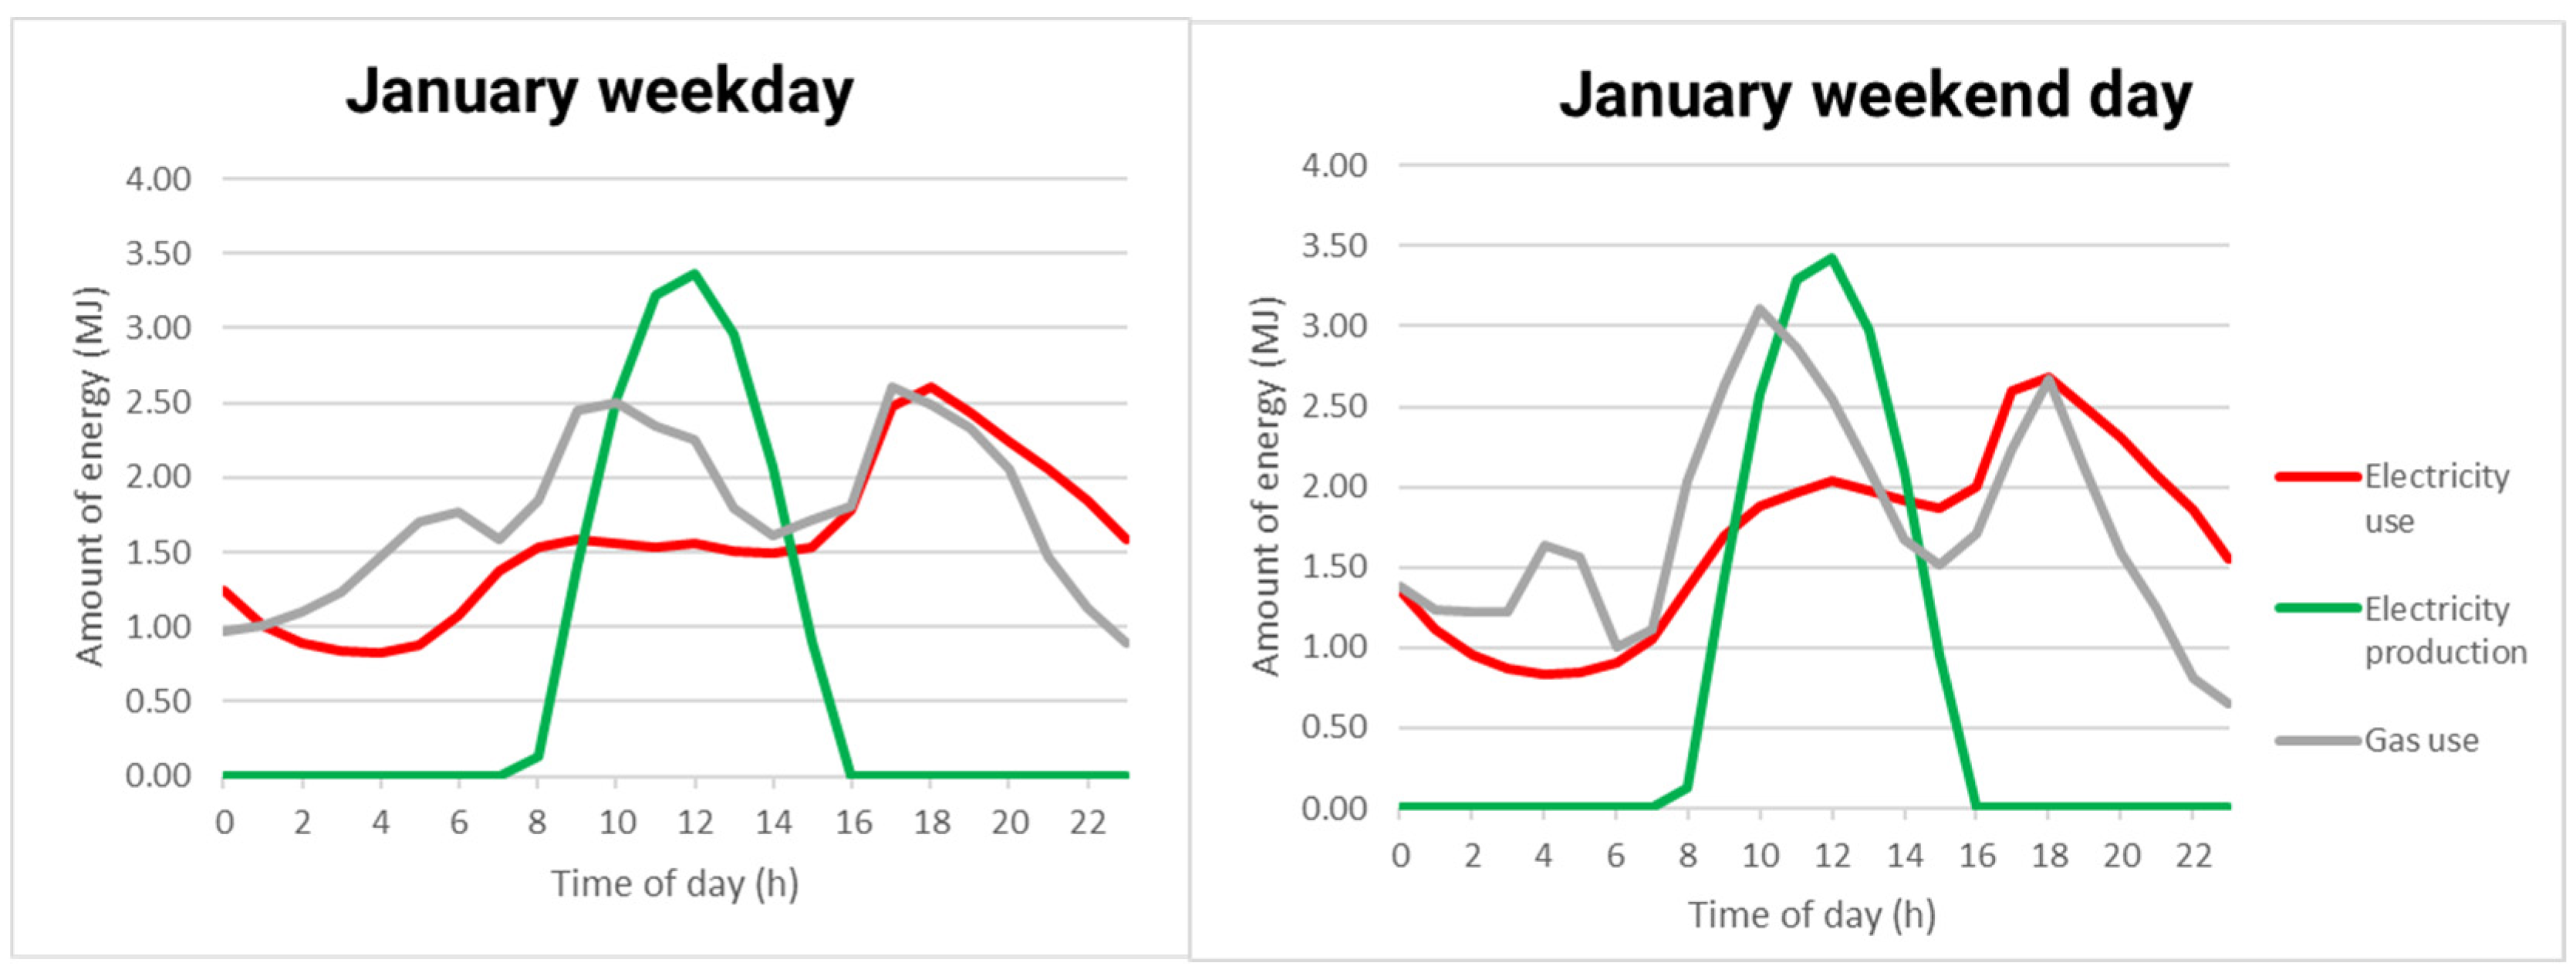
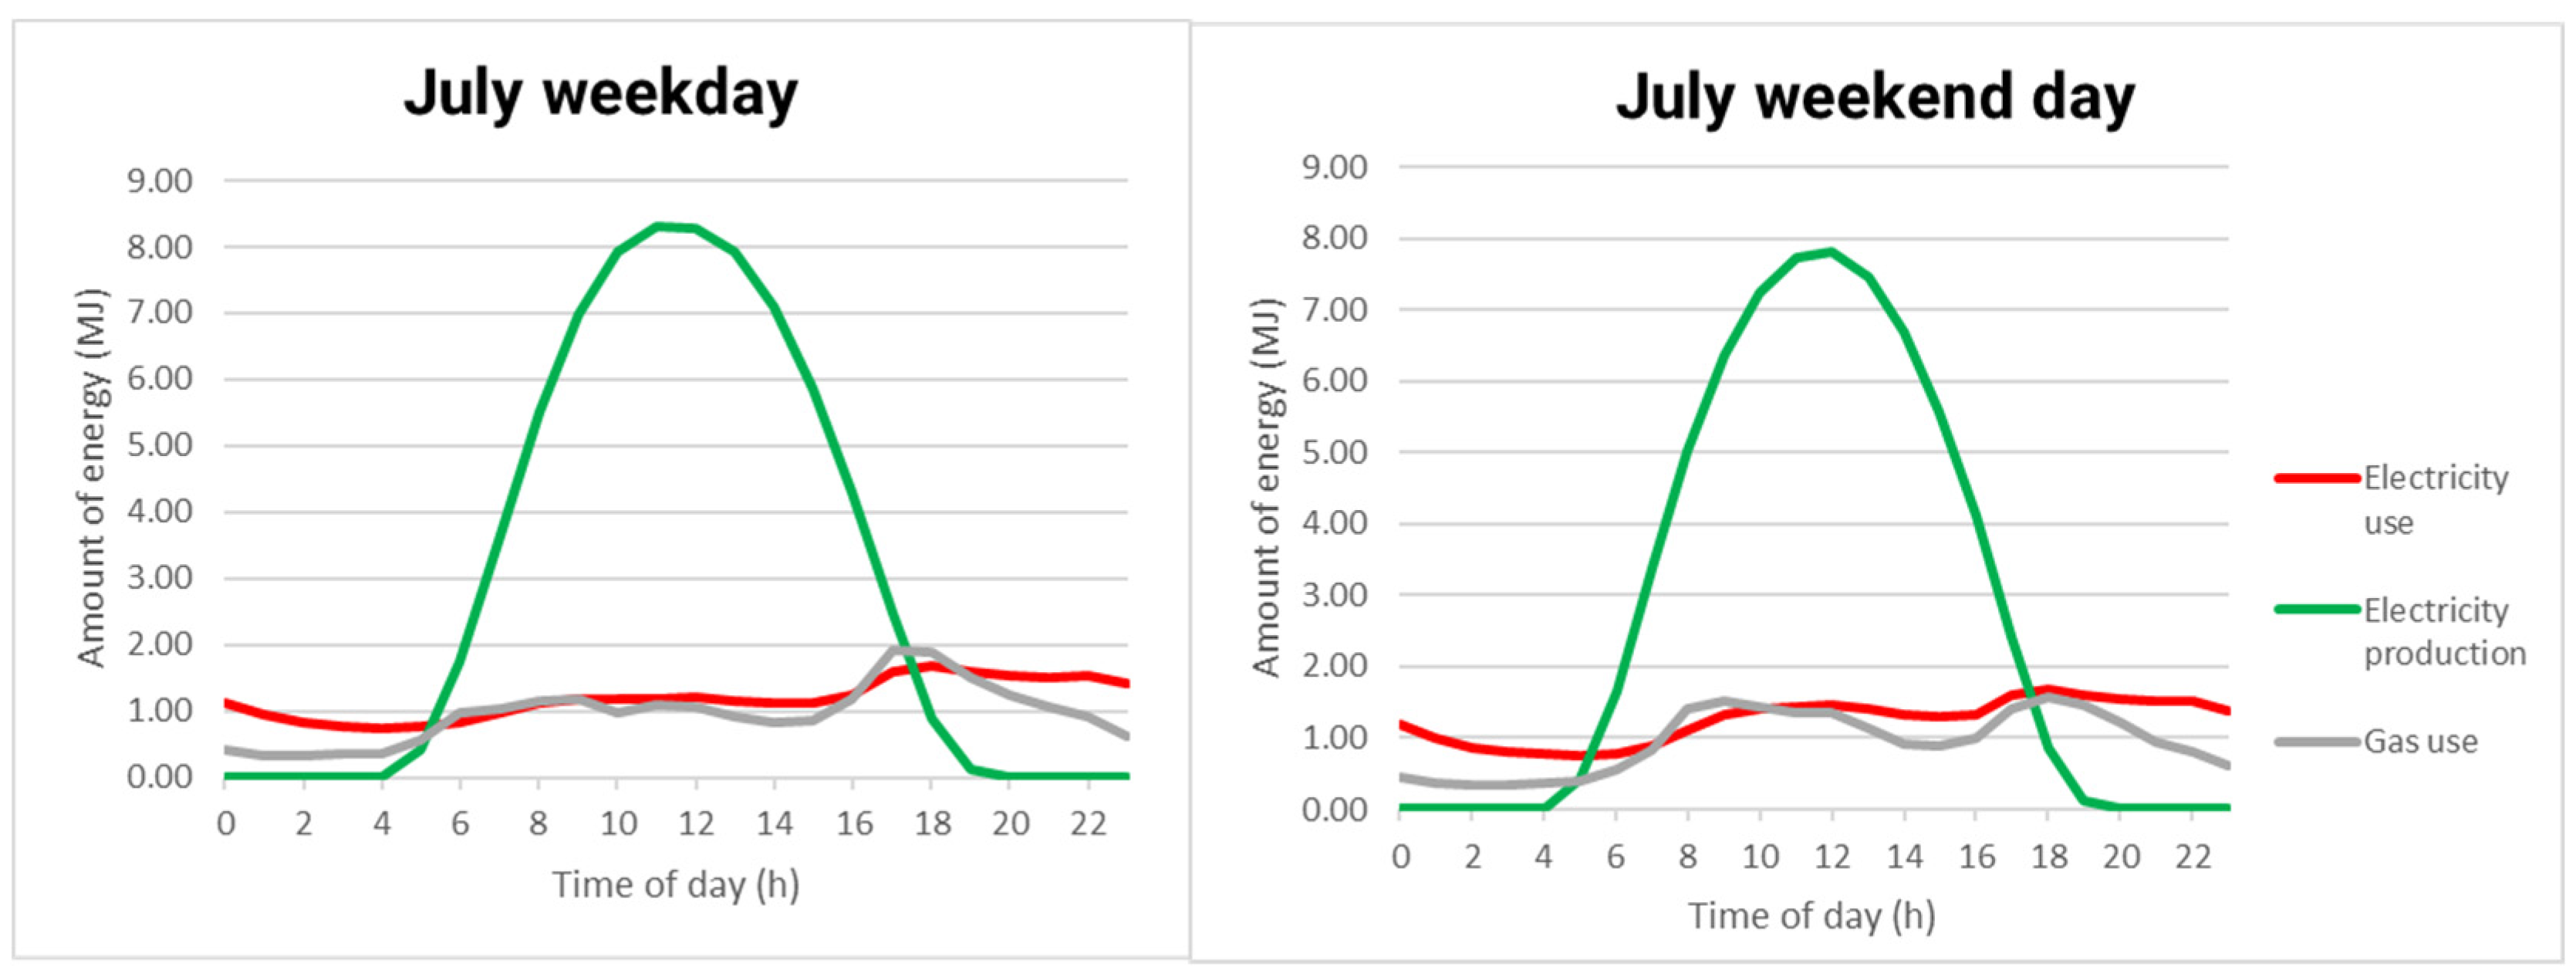
In order to determine the effectiveness of a P2DHW system compared to similar options, a model was created that calculates annual savings in gas and associated costs and improved local energy utilization for different households. The model utilizes datasets from the organization MFFBAS [17] showing the average electricity profile of a household in the Netherlands [18]. A few examples are shown in Figure 2 for January and Figure 3 for July, for a sunny weekday and a weekend day, including PV electricity profiles (in MJ). Note the different scales.
An electricity profile refers to the percentage of annual electricity used at a specific moment. Multiplying this percentage with the annual electricity usage then gives the electricity use for that moment. Coupled with data from the Dutch organization Nibud [19] regarding the average annual electricity use of differently sized households, the model can then determine the average hourly electricity usage for a household based on its size. For the exact calculations utilized, see Equations (1) and (2):
E E 1 m y = h = 0 23 Y f x     E p 1 h m y E u 1 h m   |   Y f x     E p 1 h m y E u 1 h m 0
E E 2 m y = h = 0 23 Y f x     E p 2 h m y E u 2 h m   |   Y f x     E p 2 h m y E u 2 h m 0
with
-
EE1my = Excess electricity produced on an average weekday for month m in year y (kWh).
-
Yf = Yield factor of solar panels (99.5%).
-
x = Number of years since 2023.
-
Ep1hmy = Electricity produced on an average weekday at hour h for month m in year y (kWh).
-
Eu1hm = Electricity used on an average weekday at hour h for month m (kWh).
-
EE2my = Excess electricity produced on an average weekend day for month m (kWh).
-
Ep2hmy = Electricity produced on an average weekend day at hour h for month m (kWh).
-
Eu2hm = Electricity used on an average weekend day at hour h for month m (kWh).
In order to determine the amount of PV energy available at a given time, data were utilized from an online tool of the Denmark Technical University (DTU), known as CorRES (correlations in renewable energy sources tool) [20]. The tool was specifically used to predict production of PV energy in the Netherlands, resulting in hourly capacity factors of the year 2023 that can be multiplied with the installed capacity of the PV panels to determine PV production, also taking into account a degradation of 0.5% annually (yield factor). The required inputs consisted of the geographical data of areas in the Netherlands (longitude, altitude, and latitude [21]), as well as a surface azimuth of 180° and tilt of 25° for the PV panels.
Combining these datasets allows the model to determine the average amount of excess electricity available for the WaterAccu on weekday and weekend days for each month. The excess energy is assumed to be used for P2DHW as much as possible, with variations being dependent on household size, since larger households would require a larger electric boiler and otherwise use more gas for heating water [22]. Since the average use of showering water is around 50 L per person [23] and the boiler sizes are taken in steps of 50 L, it is assumed that all water in the boiler is utilized per day. Equations (3)–(12) were used. Note, symbol is used as logical or operator.
E b o i l e r   = V b o i l e r     ρ w a t e r     1000     c w a t e r     Δ T 3600000
with
-
Eboiler = Amount of electricity required by the boiler per day (kWh).
-
Vboiler = Volume of the boiler (L).
-
ρwater = Specific density of water (1 kg/L).
-
cwater = Specific heat capacity of water (J/(kg*K)).
-
ΔT = Change in temperature of boiler (45 °C in summer, 50 °C in winter).
B E 1 m y = E E 1 m y E b o i l e r
B E 2 m y = E E 2 m y E b o i l e r
E G 1 m y = 0   E E 1 m y E b o i l e r
E G 2 m y = 0   E E 2 m y E b o i l e r
E R 1 m y = E u 1 m h = 0 23 ( Y x     E p 1 h m y ) + E E 1 m y
E R 2 m y = E u 2 m h = 0 23 ( Y x     E p 2 h m y ) + E E 2 m y
T B E y = m = 1 12 B E 1 m y     N D 1 m y + m = 1 12 B E 2 m y     N D 2 m y
T E G y = m = 1 12 E G 1 m y     N D 1 m y + m = 1 12 E G 2 m y     N D 2 m y
T E R y = m = 1 12 E R 1 m y     N D 1 m y + m = 1 12 E R 2 m y     N D 2 m y
with
-
BE1my = Amount of electricity utilized by the boiler on a weekday for month m in year y (kWh).
-
BE2my = Amount of electricity utilized by the boiler on a weekend day for month m in year y (kWh).
-
EG1my = Electricity sent back to the grid on a weekday for month m in year y (kWh).
-
EG2my = Electricity sent back to the grid on a weekend day for month m in year y (kWh).
-
ER1my = Electricity required from the grid on a weekday for month m in year y (kWh).
-
ER2my = Electricity required from the grid on a weekend day for month m in year y (kWh).
-
TBEy = Total amount of electricity utilized by the boiler in year y (kWh).
-
TEGy = Total amount of electricity sent back to the grid in year y (kWh).
-
TERy = Total amount of electricity required from the grid in year y (kWh).
-
ND1my = Number of weekdays in month m for year y.
-
ND2my = Number of weekend days in month m for year y.
This information was then used to calculate the savings on gas to heat the water using the lower heating value (LHV) of natural gas [24], as well as the savings in CO2 emissions [25,26]. The daily heating of water required a minimal temperature (i.e., 60 °C) to prevent the risk of legionella [27], and the heating required also varied slightly between winter and summer due to temperature differences [28]. The savings in gas were multiplied with a chosen gas tariff in order to determine the monetary savings of P2DHW.
However, by utilizing P2DHW, a household has less benefit from the netting system, since it can send less electricity back to the grid. This means that households with lower amounts of excess energy might save money from lower gas use but also have higher electricity costs. This can lead to situations where a household saves money through P2DHW, but because the savings of netting would be higher, P2DHW can lead to a monetary net loss. To check for this occurrence, the savings of P2DHW were compared with the savings of pure netting using Equations (13)–(15), as follows:
N P y = E C 1 y E C 2 y
E C 1 y = ( T E R y T E N 1 y )     E T R E G 1 y     E R T
E C 2 y = T E R y T E N 2 y T B E y     3.6 L H V G     G T R E G 2 y     E R T
with
-
NPy = Net profits obtained by P2DHW (€).
-
EC1y = Energy costs when only netting is utilized (€).
-
EC2y = Energy costs when netting and P2DHW are utilized (€).
-
TEN1y = Total electricity available for netting, consisting of the amount of electricity sent to the grid, but having a maximum of TEGy (kWh).
-
ET = Electricity tariff (€/kWh).
-
REG1y = Remaining energy returned to grid that cannot be used for netting (kWh).
-
ERT = Electricity return tariff (€/kWh).
-
TEN2y = Total electricity available for netting, in this case consisting of the amount of electricity sent to the grid after utilizing P2DHW, also having a maximum of TEGy (kWh).
-
LHVG = Lower heating value of natural gas (MJ).
-
GT = Natural gas tariff (€/m3).
-
REG2y = Remaining energy returned to grid that cannot be used for netting while having utilized P2DHW (kWh).
Several inputs were also tested using a sensitivity analysis to determine their impact on the calculations: the tariffs for electricity, gas, and returning electricity back to the grid, and lastly the efficiency degradation of the solar panels per year. Since gas prices can be sensitive to sudden changes [29] and the return-to-grid tariff can vary per energy provider [30], this gives a better view of how consistent the results would remain. Since the current Dutch government plans to abruptly end the netting system starting in 2027 [31], this was accounted for in the model.
Once the model was complete, its inputs were varied through twelve household scenarios to check the benefits of P2DHW for different households. Four broad categories of households were selected, differing between large and small households and high and low amounts of installed PV power, partly due to varying power of PV panels [32]. Within each category, three different types of households were identified, with the following specifics:
  • Small household, low installed power
    1.1.
    Single person living in a house with older solar panels.
    1.2.
    Two elderly people living together, needing more time for showering.
    1.3.
    Single parent living with a young child.
  • Large household, low installed power
    2.1.
    Family with two young children living in an older house.
    2.2.
    Family with three children. One of the children is a young adult living on their own but staying over regularly.
    2.3.
    Family with four children (all teenagers) living in an older house.
  • Small household, high installed power
    3.1.
    Rich businessperson who lives on their own, but often receives visitors.
    3.2.
    Married couple living in a modern (well insulated) house, with no plans to have children.
    3.3.
    Young couple with a Jacuzzi in their home.
  • Large household, high installed power
    4.1.
    Family with two children living in a modern (well insulated) house.
    4.2.
    Family with three children. One of the children is a young adult living on their own but staying over regularly.
    4.3.
    Family with four children living in a modern (well insulated) house.
Table 1 shows the specific information for each household, consisting of the number of occupants, the number of PV panels, the rated power per panel, and the size of the electric boiler.
The annual benefits for each household were calculated from 2024 to 2032. During these measurements, the following values were used for the tariffs: €1.36/m3 for the gas tariff, €0.32/kWh for the electricity tariff, and €0.07/kWh for the tariff of returning electricity to the grid.
Finally, the basic calculations of the model, consisting of Equations (1) and (2) and variations on Equations (4)–(12), were used to determine the benefits and drawbacks of technologies that could function as an alternative to P2DHW systems, based on use for a household of three inhabitants and twelve PV panels of 400 Wp, which acts as an average of the households in Table 1 (we refer to this as a base household). The other technologies consisted of a regular electric battery system, a heat pump boiler, and a solar boiler. The results of these calculations were then used for a multi-criteria analysis (MCA) to analyze the effectiveness of P2DHW compared to its potentially competing technologies. The following steps were utilized for the MCA, as described by Dodgson et al. [33]:
  • The goal of the MCA is to find a technology that enables savings in energy costs and lowered emissions for Dutch households in the period 2024 to 2032, preferably by allowing excess solar energy to become usable for the household.
  • The technologies that were compared consisted of a WaterAccu, an electric home battery [3,34], a heat pump boiler [35,36,37], and a solar boiler [38,39]. The inputs of the model consisted of three persons for the household size, utilizing 12 PV panels of 400 Wp each.
  • Five criteria were utilized:
    • Total costs, consisting simply of the required total financial investments to be able to utilize the technology, including installation costs. The values used were €1500 for the P2DHW system, €5000 for the home battery [3], €2915 for the heat pump boiler, and €3800 for the solar boiler.
    • Return-on-investment (ROI), determined by the following equation:
      R O I = y = 2023 2031 N e t   B e n e f i t s y T o t a l   i n s t a l l a t i o n   c o s t s     100 %      
    • Simple payback time, more commonly known as the payback period [40], which was determined by the following equation:
      P a y b a c k   p e r i o d = T o t a l   i n s t a l l a t i o n   c o s t s A n n u a l   s a v i n g s      
    • PV energy effectiveness, which describes how much more PV energy can be utilized effectively through the technology, was determined by the following equations:
      T E T y = m = 1 12 E T 1 m y     N D 1 m y + m = 1 12 E T 2 m y     N D 2 m y      
      T E E y = m = 1 12 E E 1 m y     N D 1 m y + m = 1 12 E E 2 m y     N D 2 m y      
      P V   e n e r g y   effectiveness = y = 2023 2031 T E T y y = 2023 2031 T E E y      
with
-
ET1my = Excess energy utilized by the technology on a weekday in month m for year y (kWh).
-
ET2my = Excess energy utilized by the technology on a weekend day in month m for year y (kWh).
-
TETy = Total excess energy utilized by the technology in year y (kWh).
-
TEEy = Total excess electricity produced in year y (kWh).
e.
Reduction in CO2 emissions in kg through lowering gas use. The following equation was used to determine these values:
R e d u c t i o n   i n   C O 2   e m i s s i o n s   =   y = 2023 2031 T E T y     3.6 L H V n a t u r a l   g a s     C O 2   c o n t e n t n a t u r a l   g a s      
4.
The scores were standardized using the maximum standardization method [41]: criteria b, d, and e prefer higher scores, so they are standardized by dividing the score of each technology by the highest score. Criteria a and c prefer lower scores, so these are standardized by dividing the score of each technology by the highest score, multiplying by −1 and adding a value of 1.
5.
Each score is assigned a weight using the expected values method [42], which reflects how important the criterion is compared to the other criteria. Using five criteria means that five different weight scores are distributed each time per scenario. The following equations show how these weights Wi are calculated:
W 1 = 1 5     5 + 1 5     5 1 + 1 5     5 2 + 1 5     5 3 + 1 5     5 4 0.46
W 2 = 1 5     5 + 1 5     5 1 + 1 5     5 2 + 1 5     5 3 0.26
W 3 = 1 5     5 + 1 5     5 1 + 1 5     5 2 0.16
W 4 = 1 5     5 + 1 5     5 1 0.09
W 5 = 1 5     5 0.04
Table 2 shows how the weights are distributed in specific scenarios.
6.
A sensitivity analysis was conducted on the weights of the criteria to check how sensitive each technology is to each criterion. This step consisted of varying the weights between 0 and 1 in steps of 0.1 and checking the changes in score for each technology.

3. Results

3.1. Results Derived from Basic Calculations

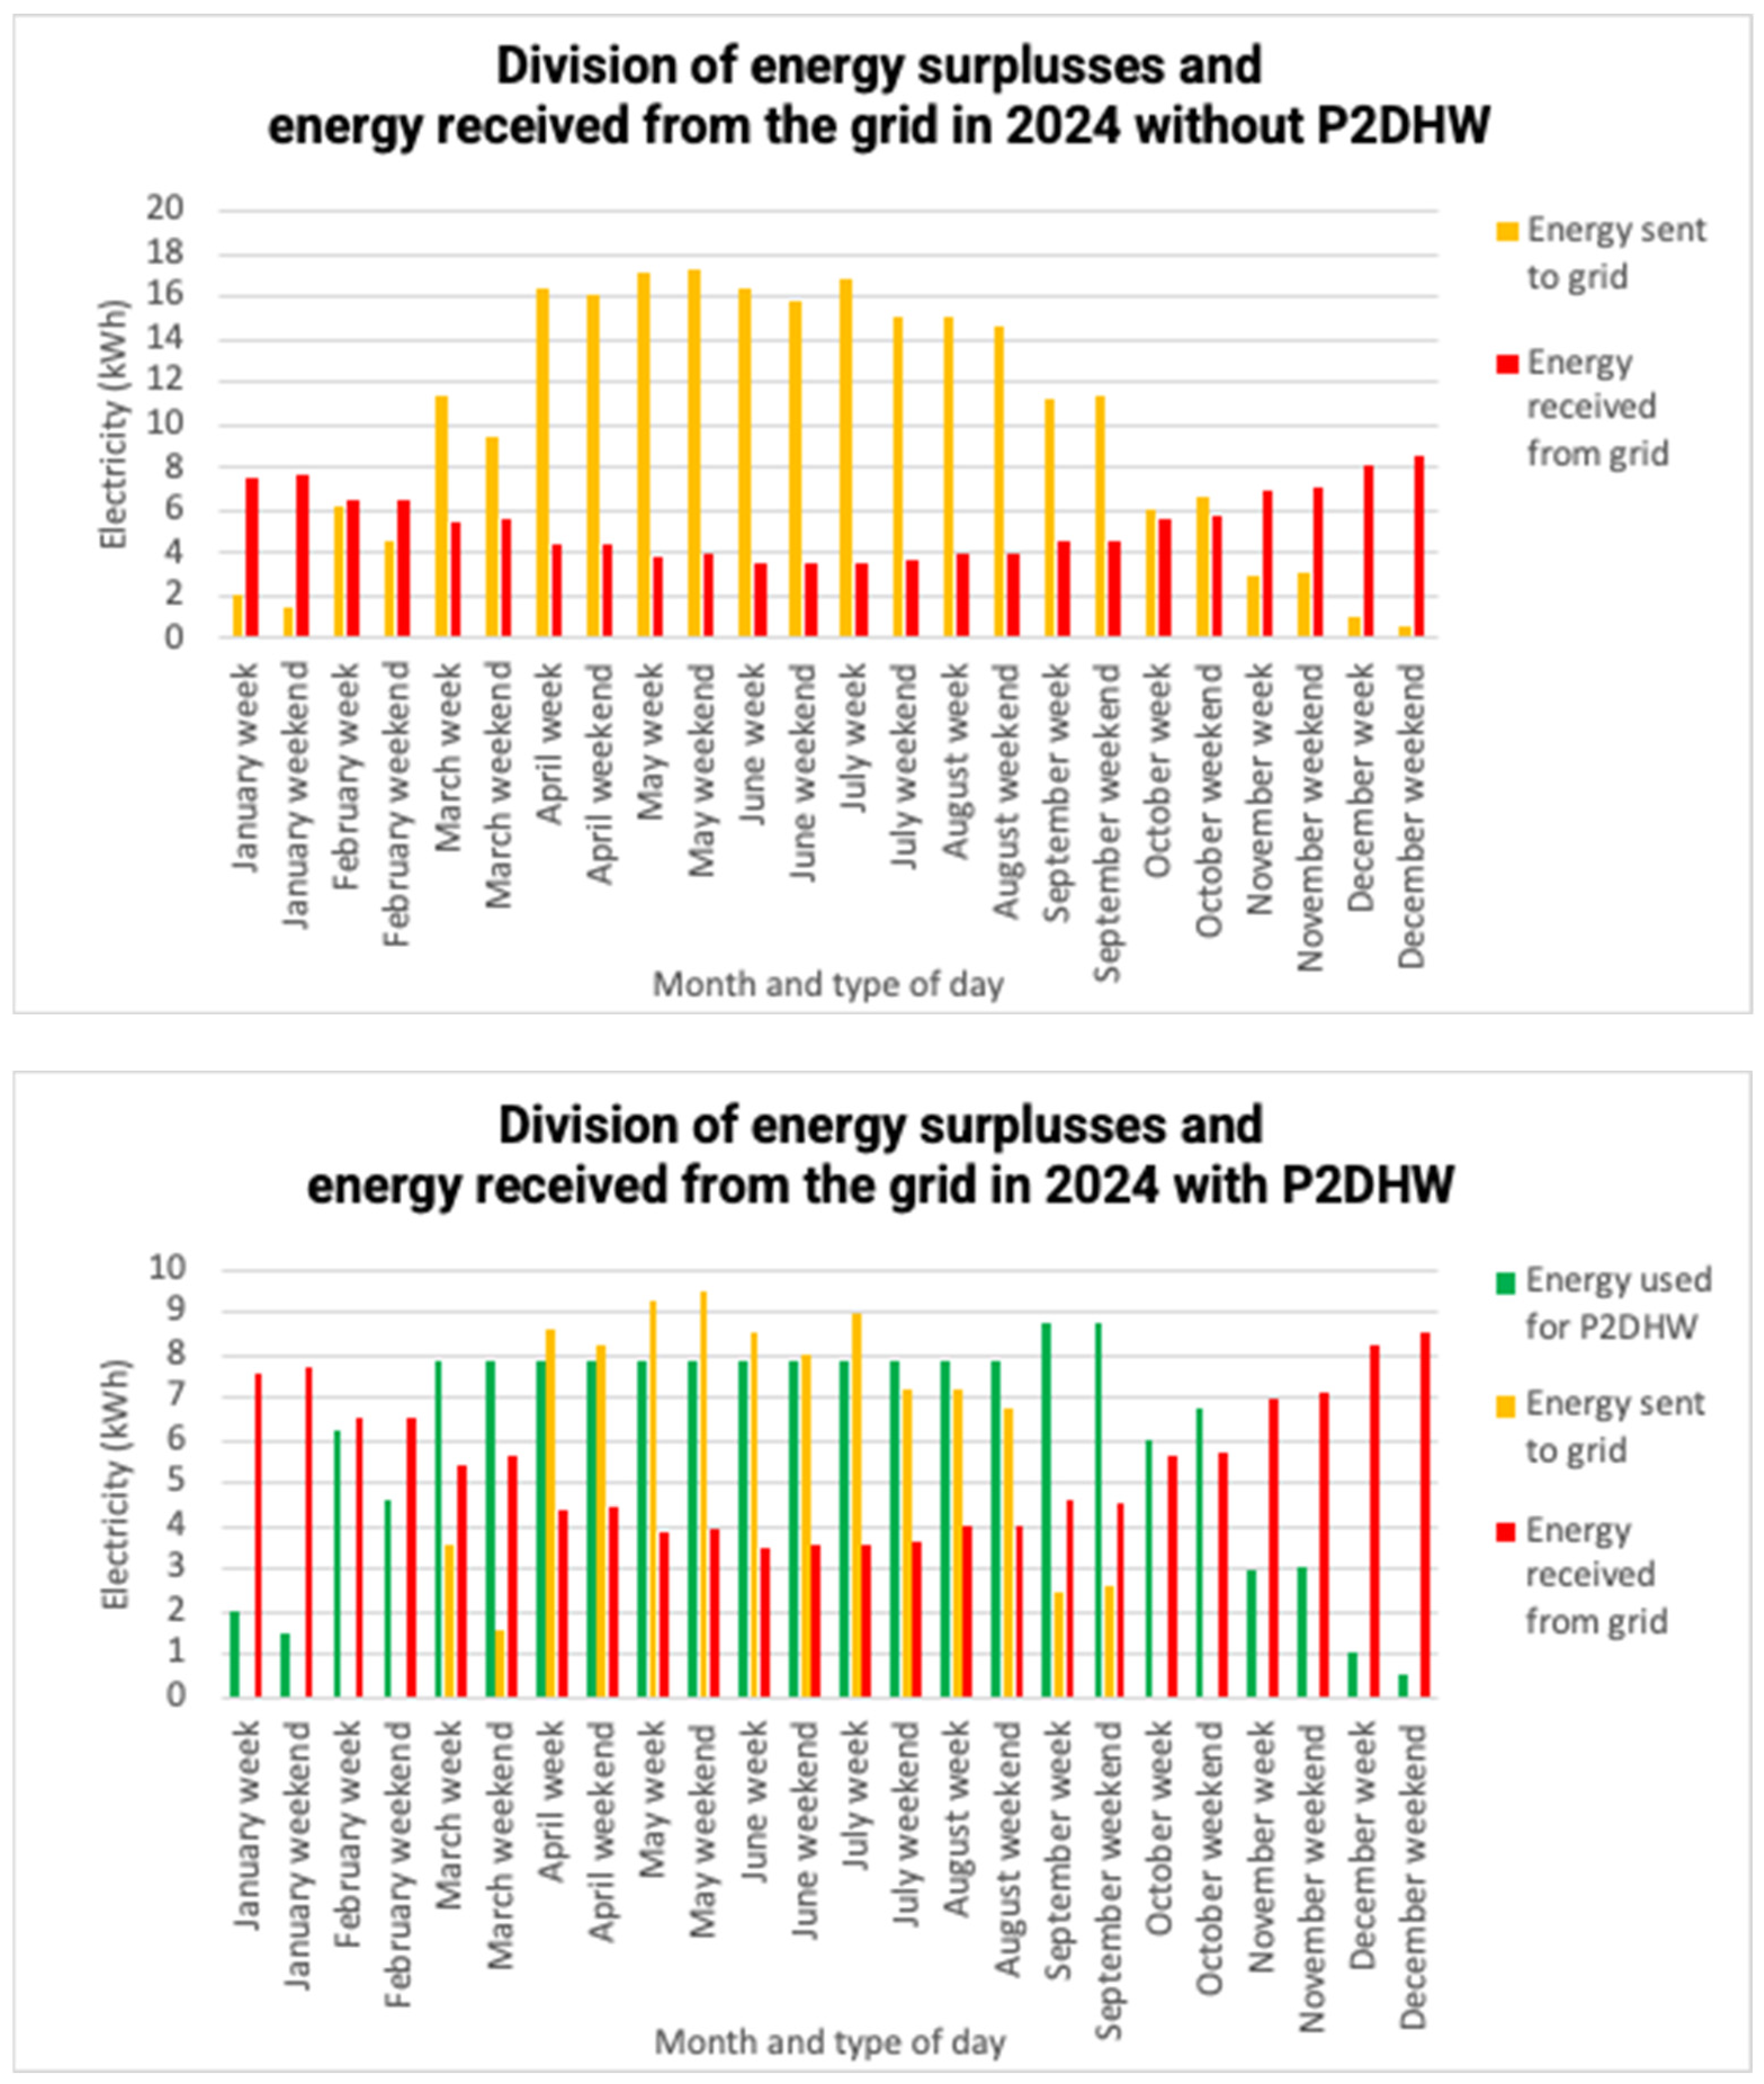
Figure 4 shows the influence of P2DHW on utilizing PV energy throughout the year for the base household composition (three inhabitants, twelve panels of 400 Wp). It can be seen that during the winter months (October, November, December, January, and February), all excess energy can be utilized, while during the summer, there is still energy being sent to the grid due to the boiler having reached maximum capacity. The excess energy in April, May, June, July, and August is quite similar, and about half of the excess PV energy is used for P2DWH. In March and September, about 80% of PV energy is used for P2DWH. Naturally, during the summer months, less energy is also required from the grid since there is more PV energy available.

3.2. Household Scenarios

The following tables show the annual savings obtained by P2DHW for the 12 different household scenarios. For the values in the Table 3, netting is present from the start (2024), but is removed starting in 2027, as currently planned by the Dutch government. Table 4 shows the results if netting is removed from the beginning (2024) as a hypothetical situation.
The results from the scenarios show that for most households with low amounts of installed PV power (i.e., households 2.1, 2.2 and 2.3), the savings of P2DHW are lower than returning the electricity to the grid for most years, leading to overall negative savings (Table 3). Once the netting system is removed, each household benefits from P2DHW, with the total mainly being dependent on how much each household benefits before 2027 (Table 4). Conversely, households with higher amounts of installed PV power all benefit from P2DHW immediately. Since these households produce more excess electricity, they can benefit from both P2DHW and the netting system. A notable difference is the total value for households 1.2 and 1.3 between the two tables. If netting is active until 2027, household 1.3 will end up with a higher total value, but if netting is removed from the start, household 1.2 will instead end up with a higher total. Since household 1.2 has a larger boiler and thus more use for P2DHW, netting becomes more disadvantageous for this household. Furthermore, while the scenarios of category 2 households all end up with negative total values when netting is active, without netting they score higher total values than most of the scenarios in household category 1. Once again, larger boilers allow for better use of P2DHW, but the benefits are lowered because of netting.

3.3. MCA

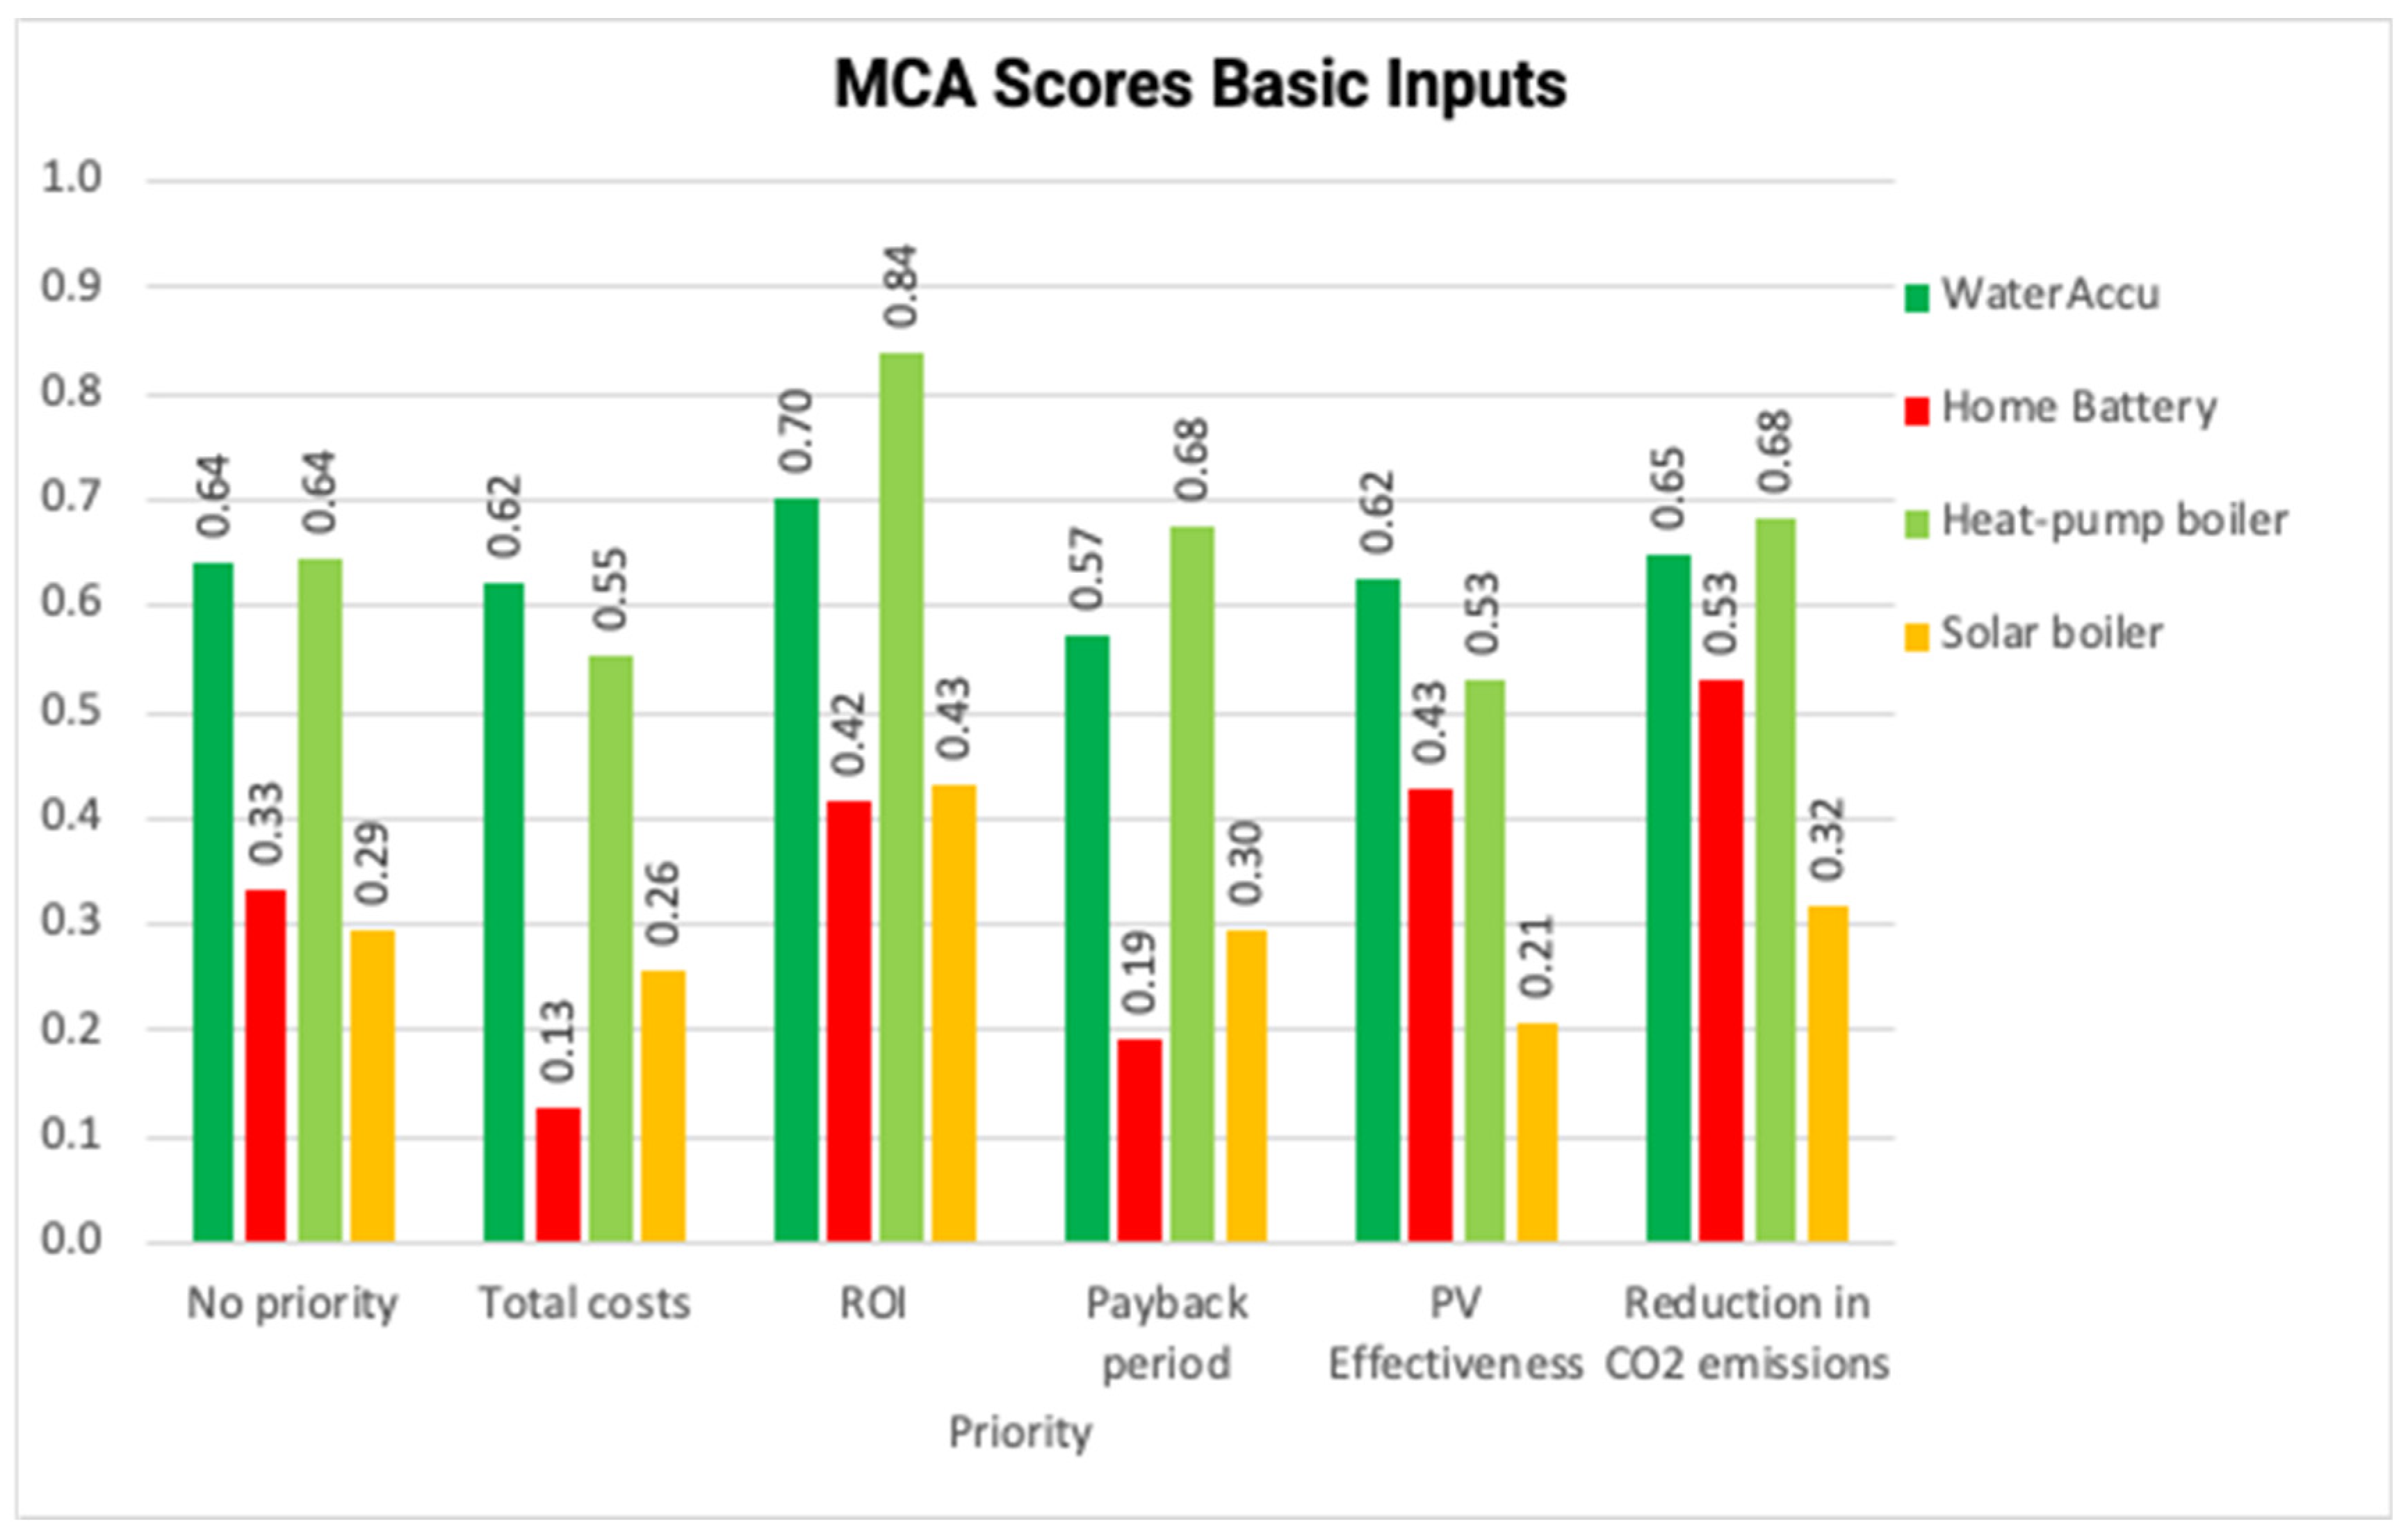
The results for the basic MCA are shown in Figure 5, with the initial values for the criteria being shown in Table 5.
When comparing the scores of the MCA, the two generally highest scoring technologies are the WaterAccu and the heat pump boiler. With no priority on either of the criteria, the WaterAccu and heat pump boiler score equally high (0.64), with both the home battery and solar boiler score considerably lower at 0.33 and 0.29, respectively. Comparing these highest scoring technologies, the heat pump boiler is more energy efficient, scoring particularly well on ROI and the payback period. However, its energy consumption does not match well with production of PV power, leading to lowered PV effectiveness. Therefore, it has no peak shaving capabilities and does not help as much in the effort to increase utilization of PV energy and mitigate grid congestion. The WaterAccu scores better in both total costs and PV effectiveness, meaning it is both an easier option for investors and helps more with mitigation of grid congestion. The other two technologies generally score lower due to their higher investment costs, with the complete lack of PV effectiveness for the solar boiler.

3.4. Sensitivity Analyses

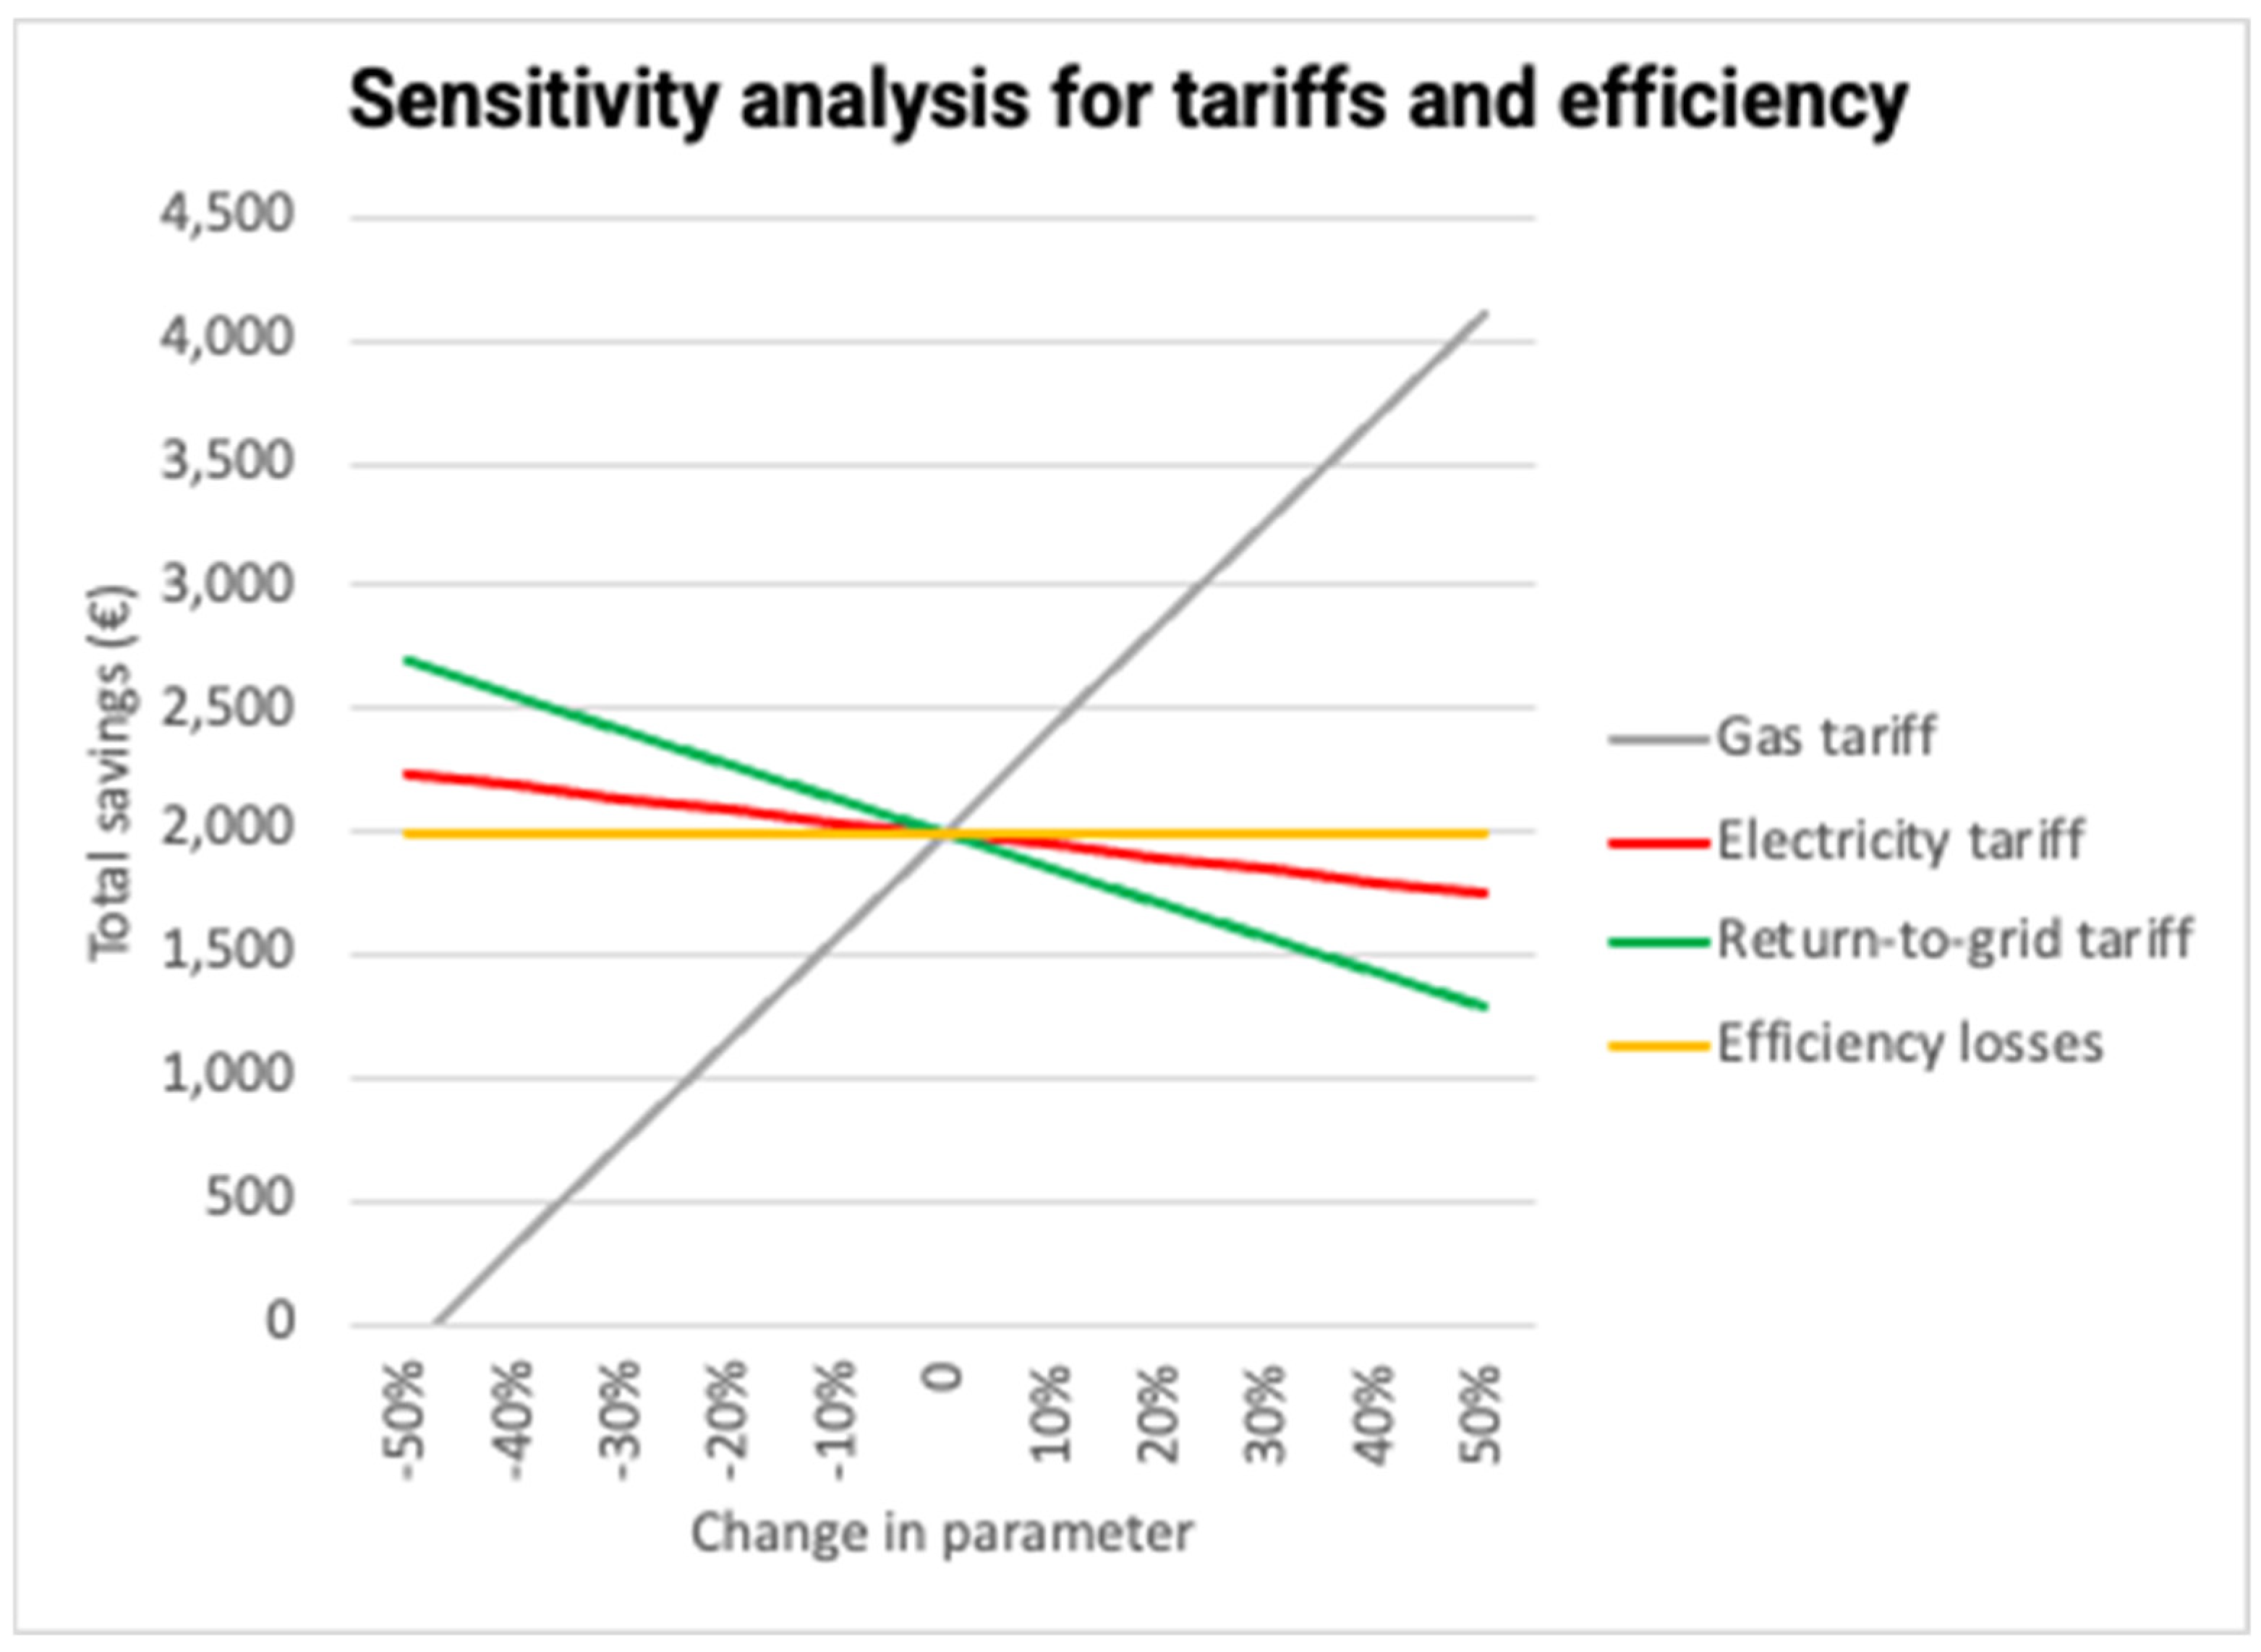
Figure 6 shows the results of the sensitivity analysis for the tariffs and the efficiency losses of the solar panels.
Based on the sensitivity analysis, changes to the gas tariff have the largest influence on the results of the model, where a 50% decrease in gas tariff can even lead to negative savings. Less severe effects are observed for the return-to-grid tariff and the electricity tariff, with 30% and 10% lower savings, respectively, for a 50% increase in each of these tariffs The effect of the efficiency losses is very minor. It should be noted that while no extra electricity is obtained from the net when utilizing P2DHW, changes in the electricity tariff still affect the savings. This is because the savings of P2DHW are compared to the savings obtained by utilizing netting, and these are dependent on the electricity tariff.
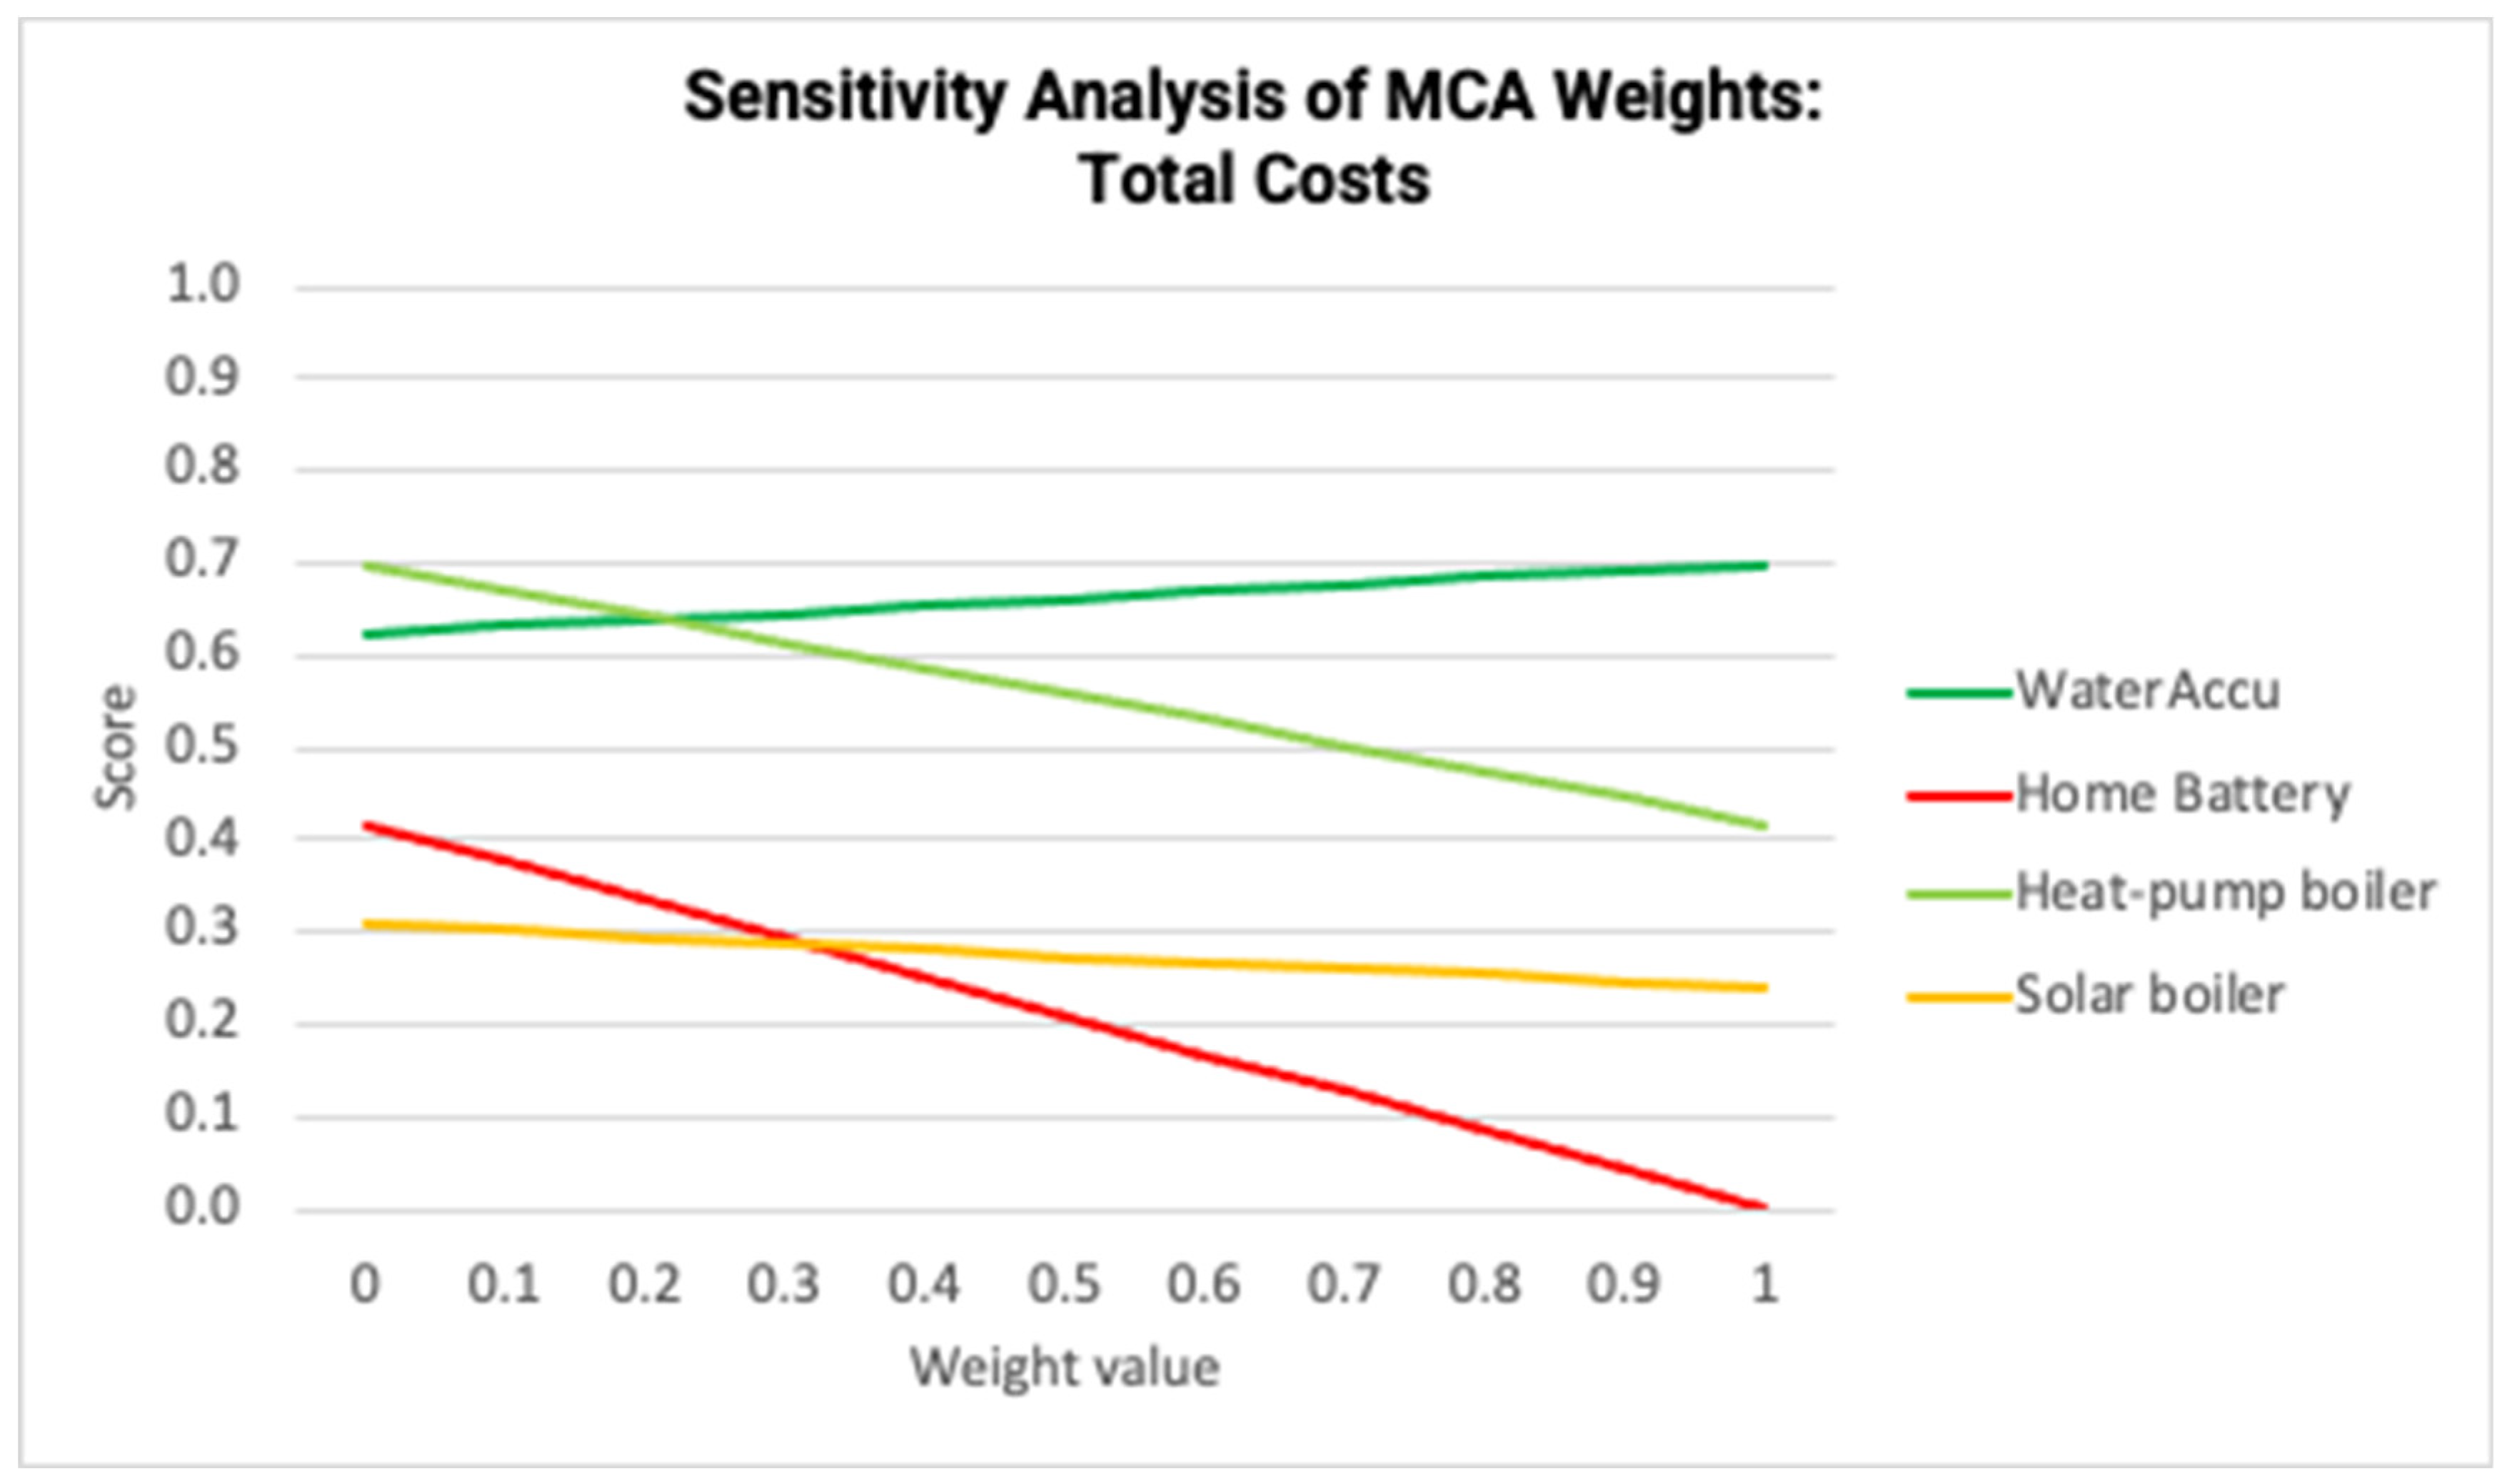
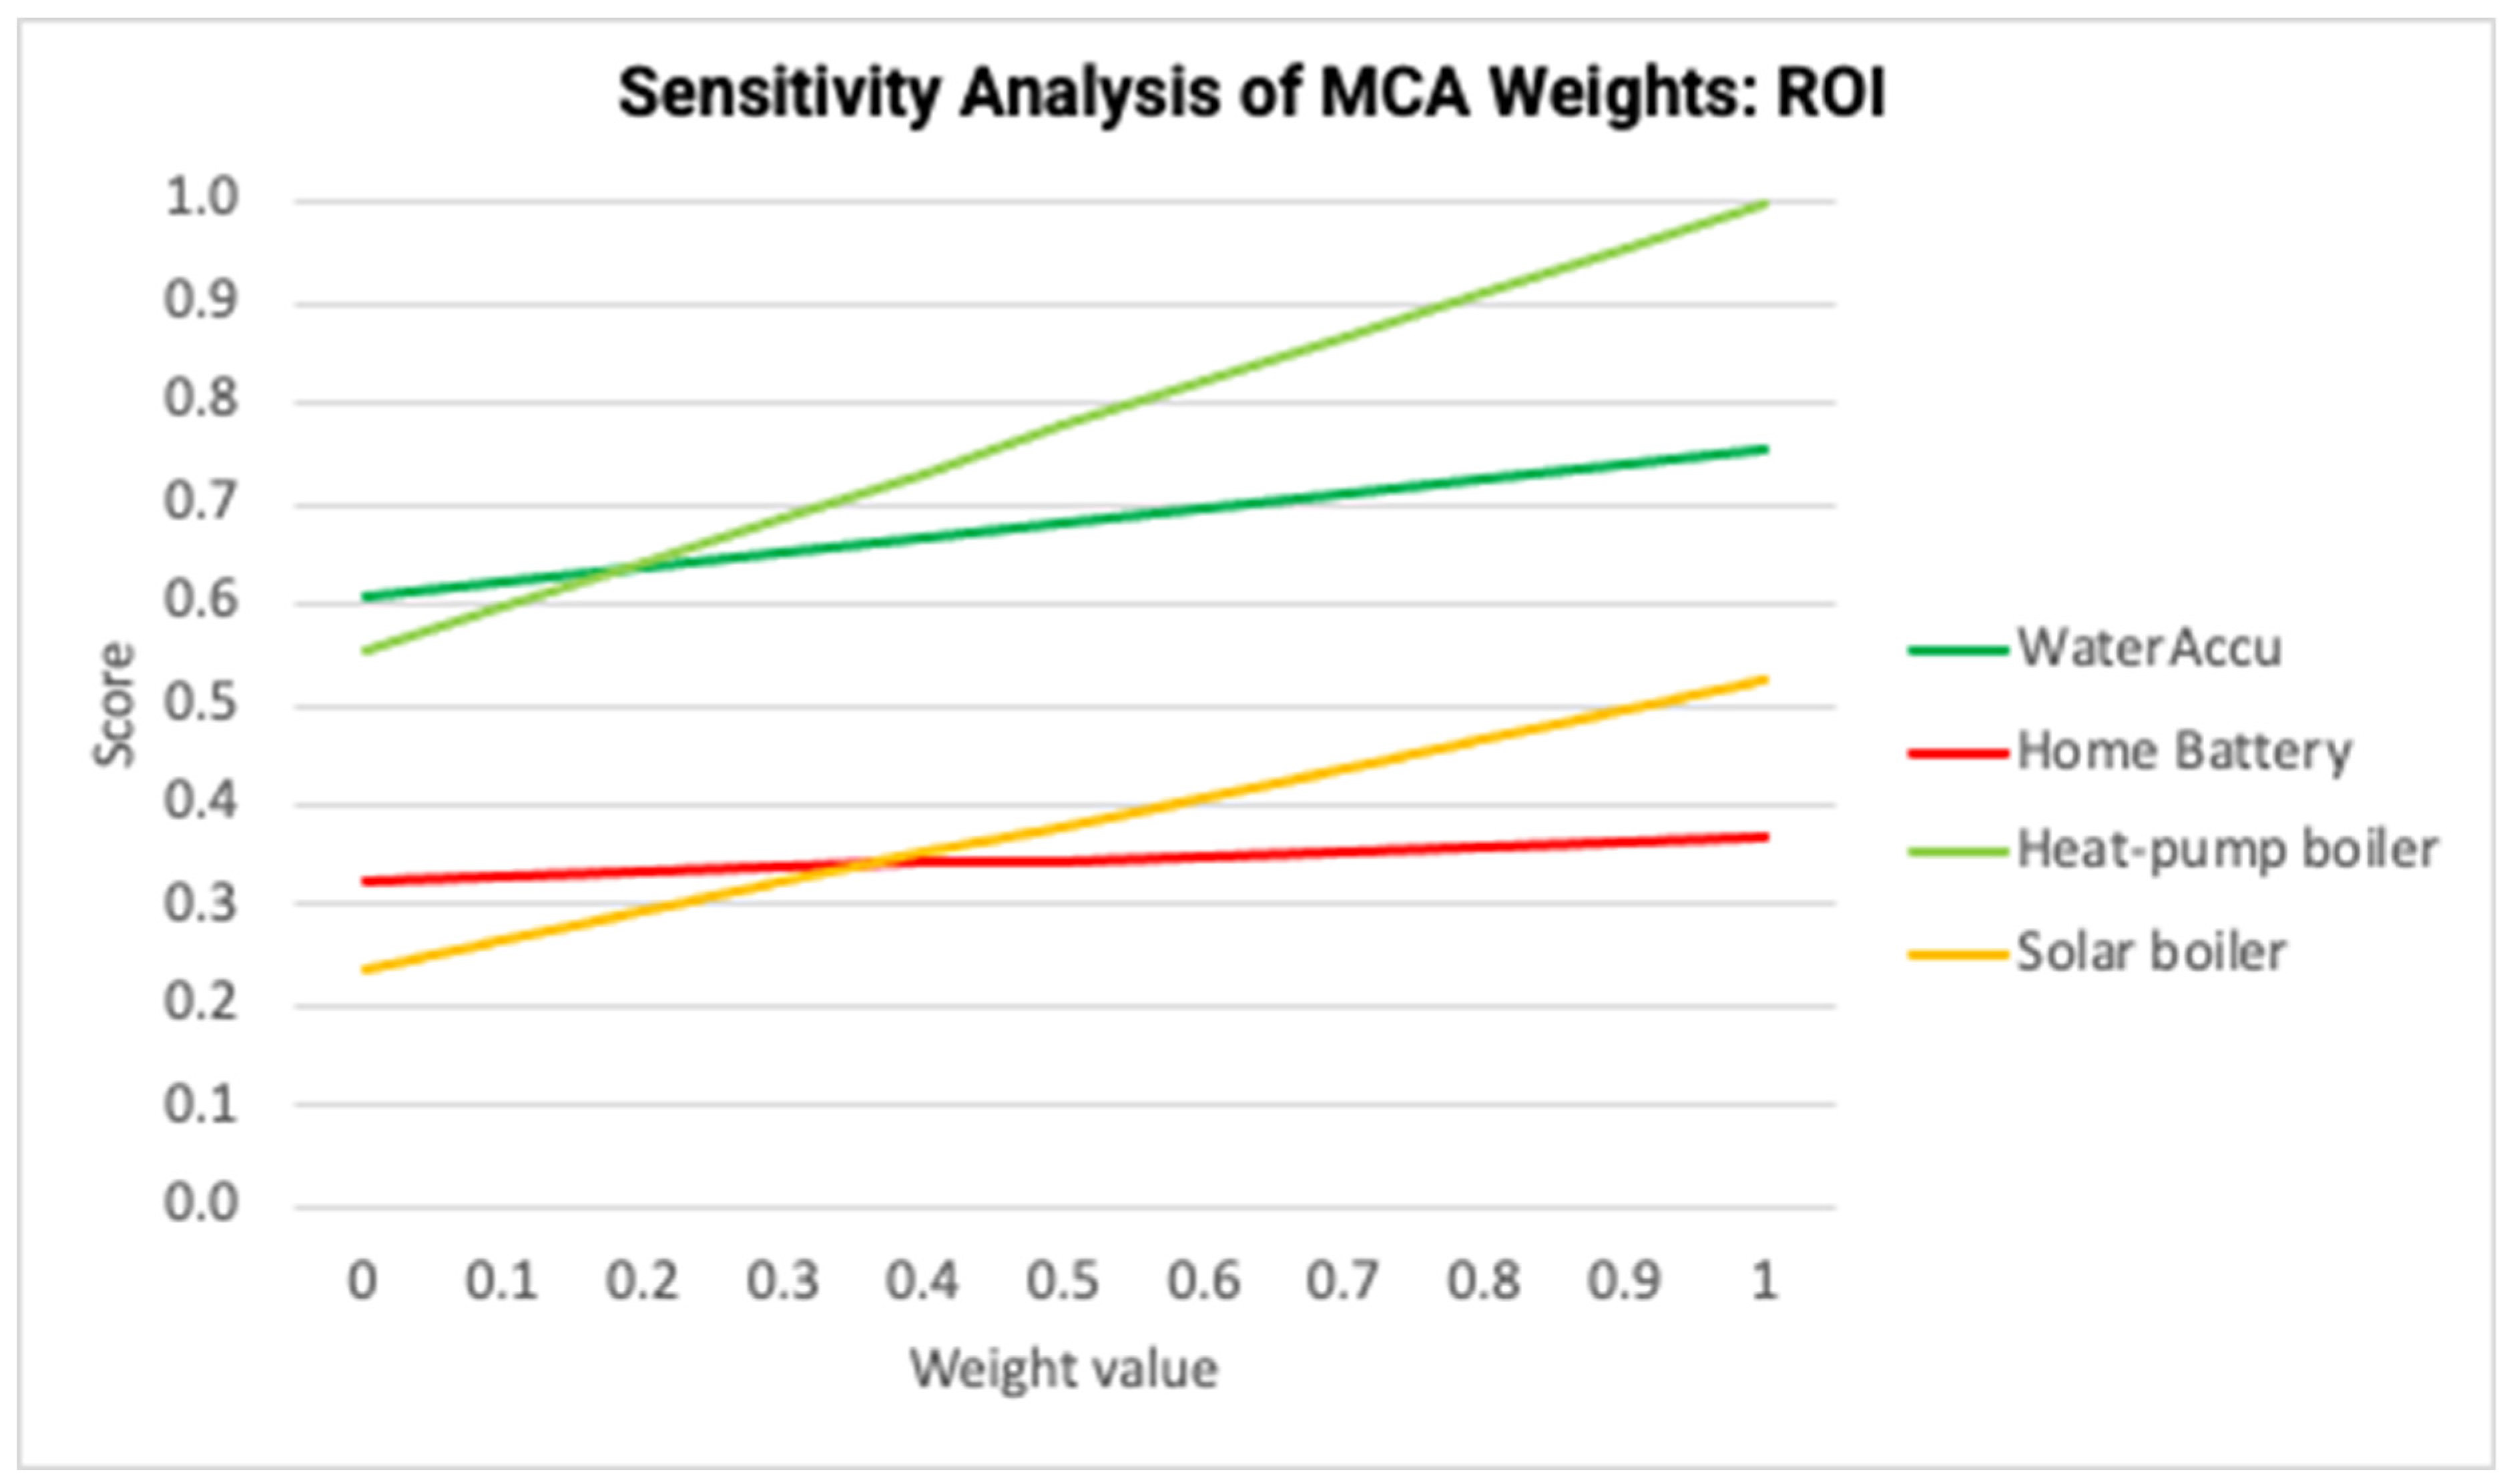
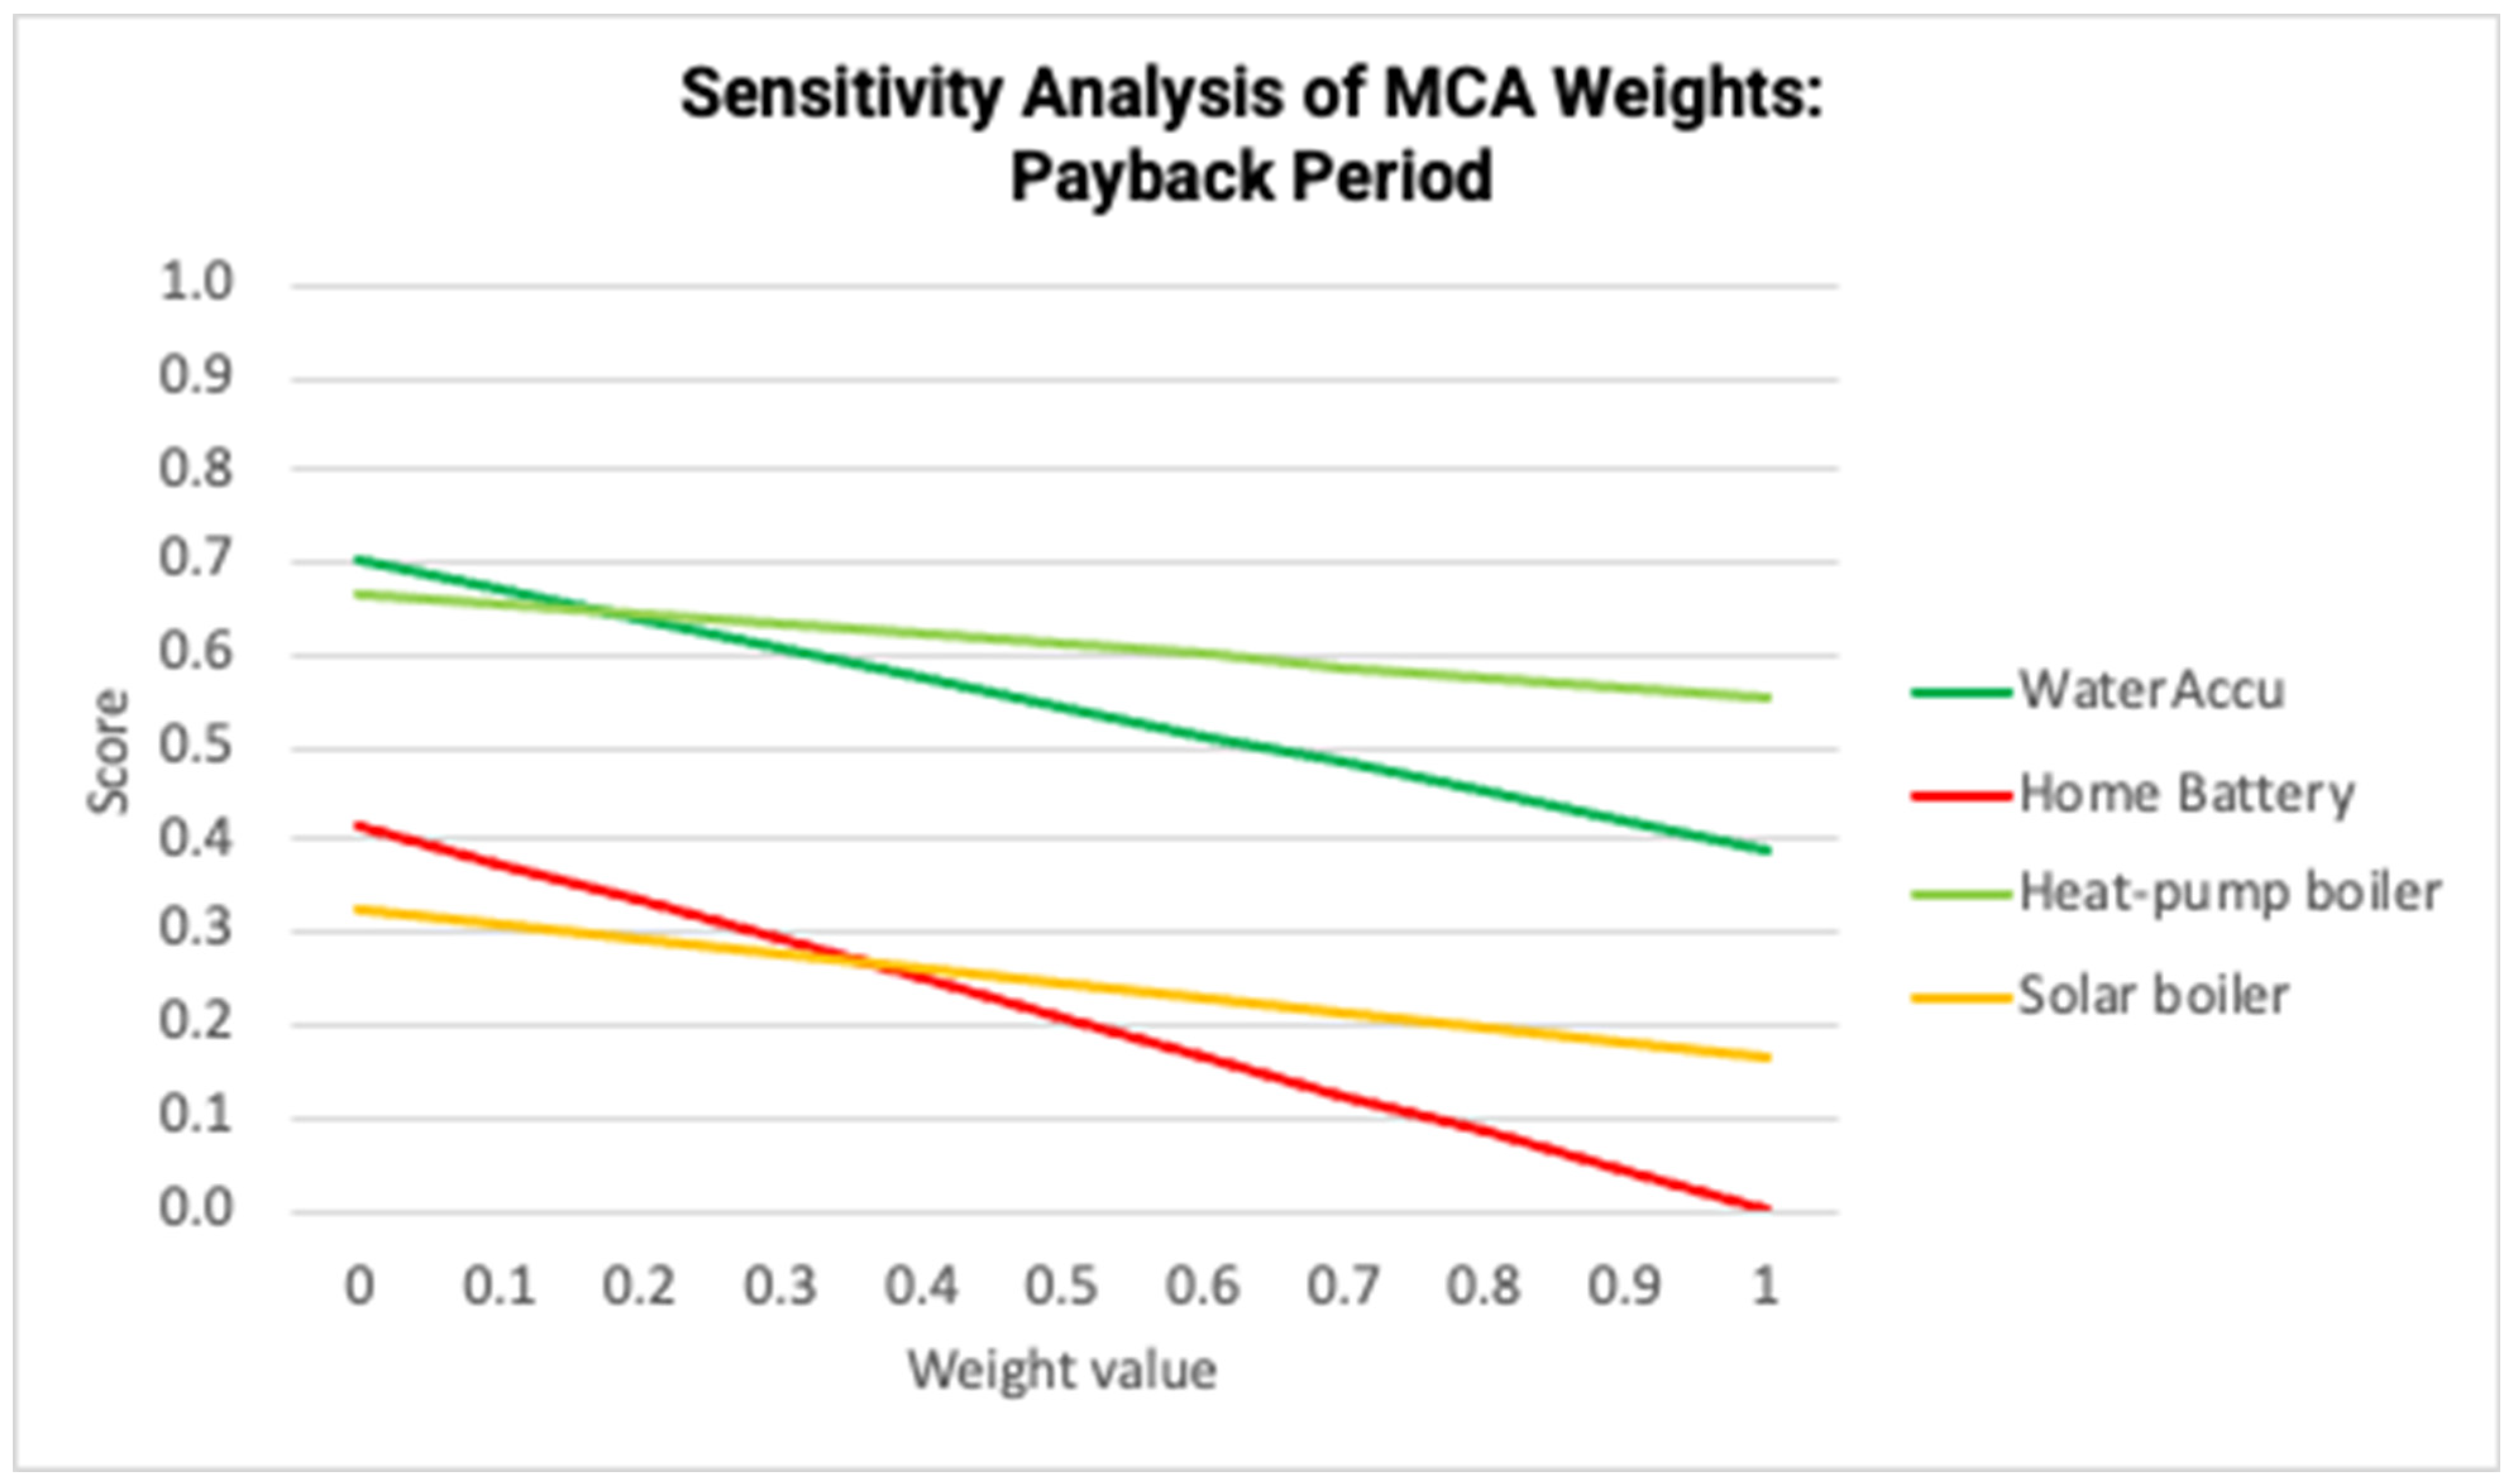
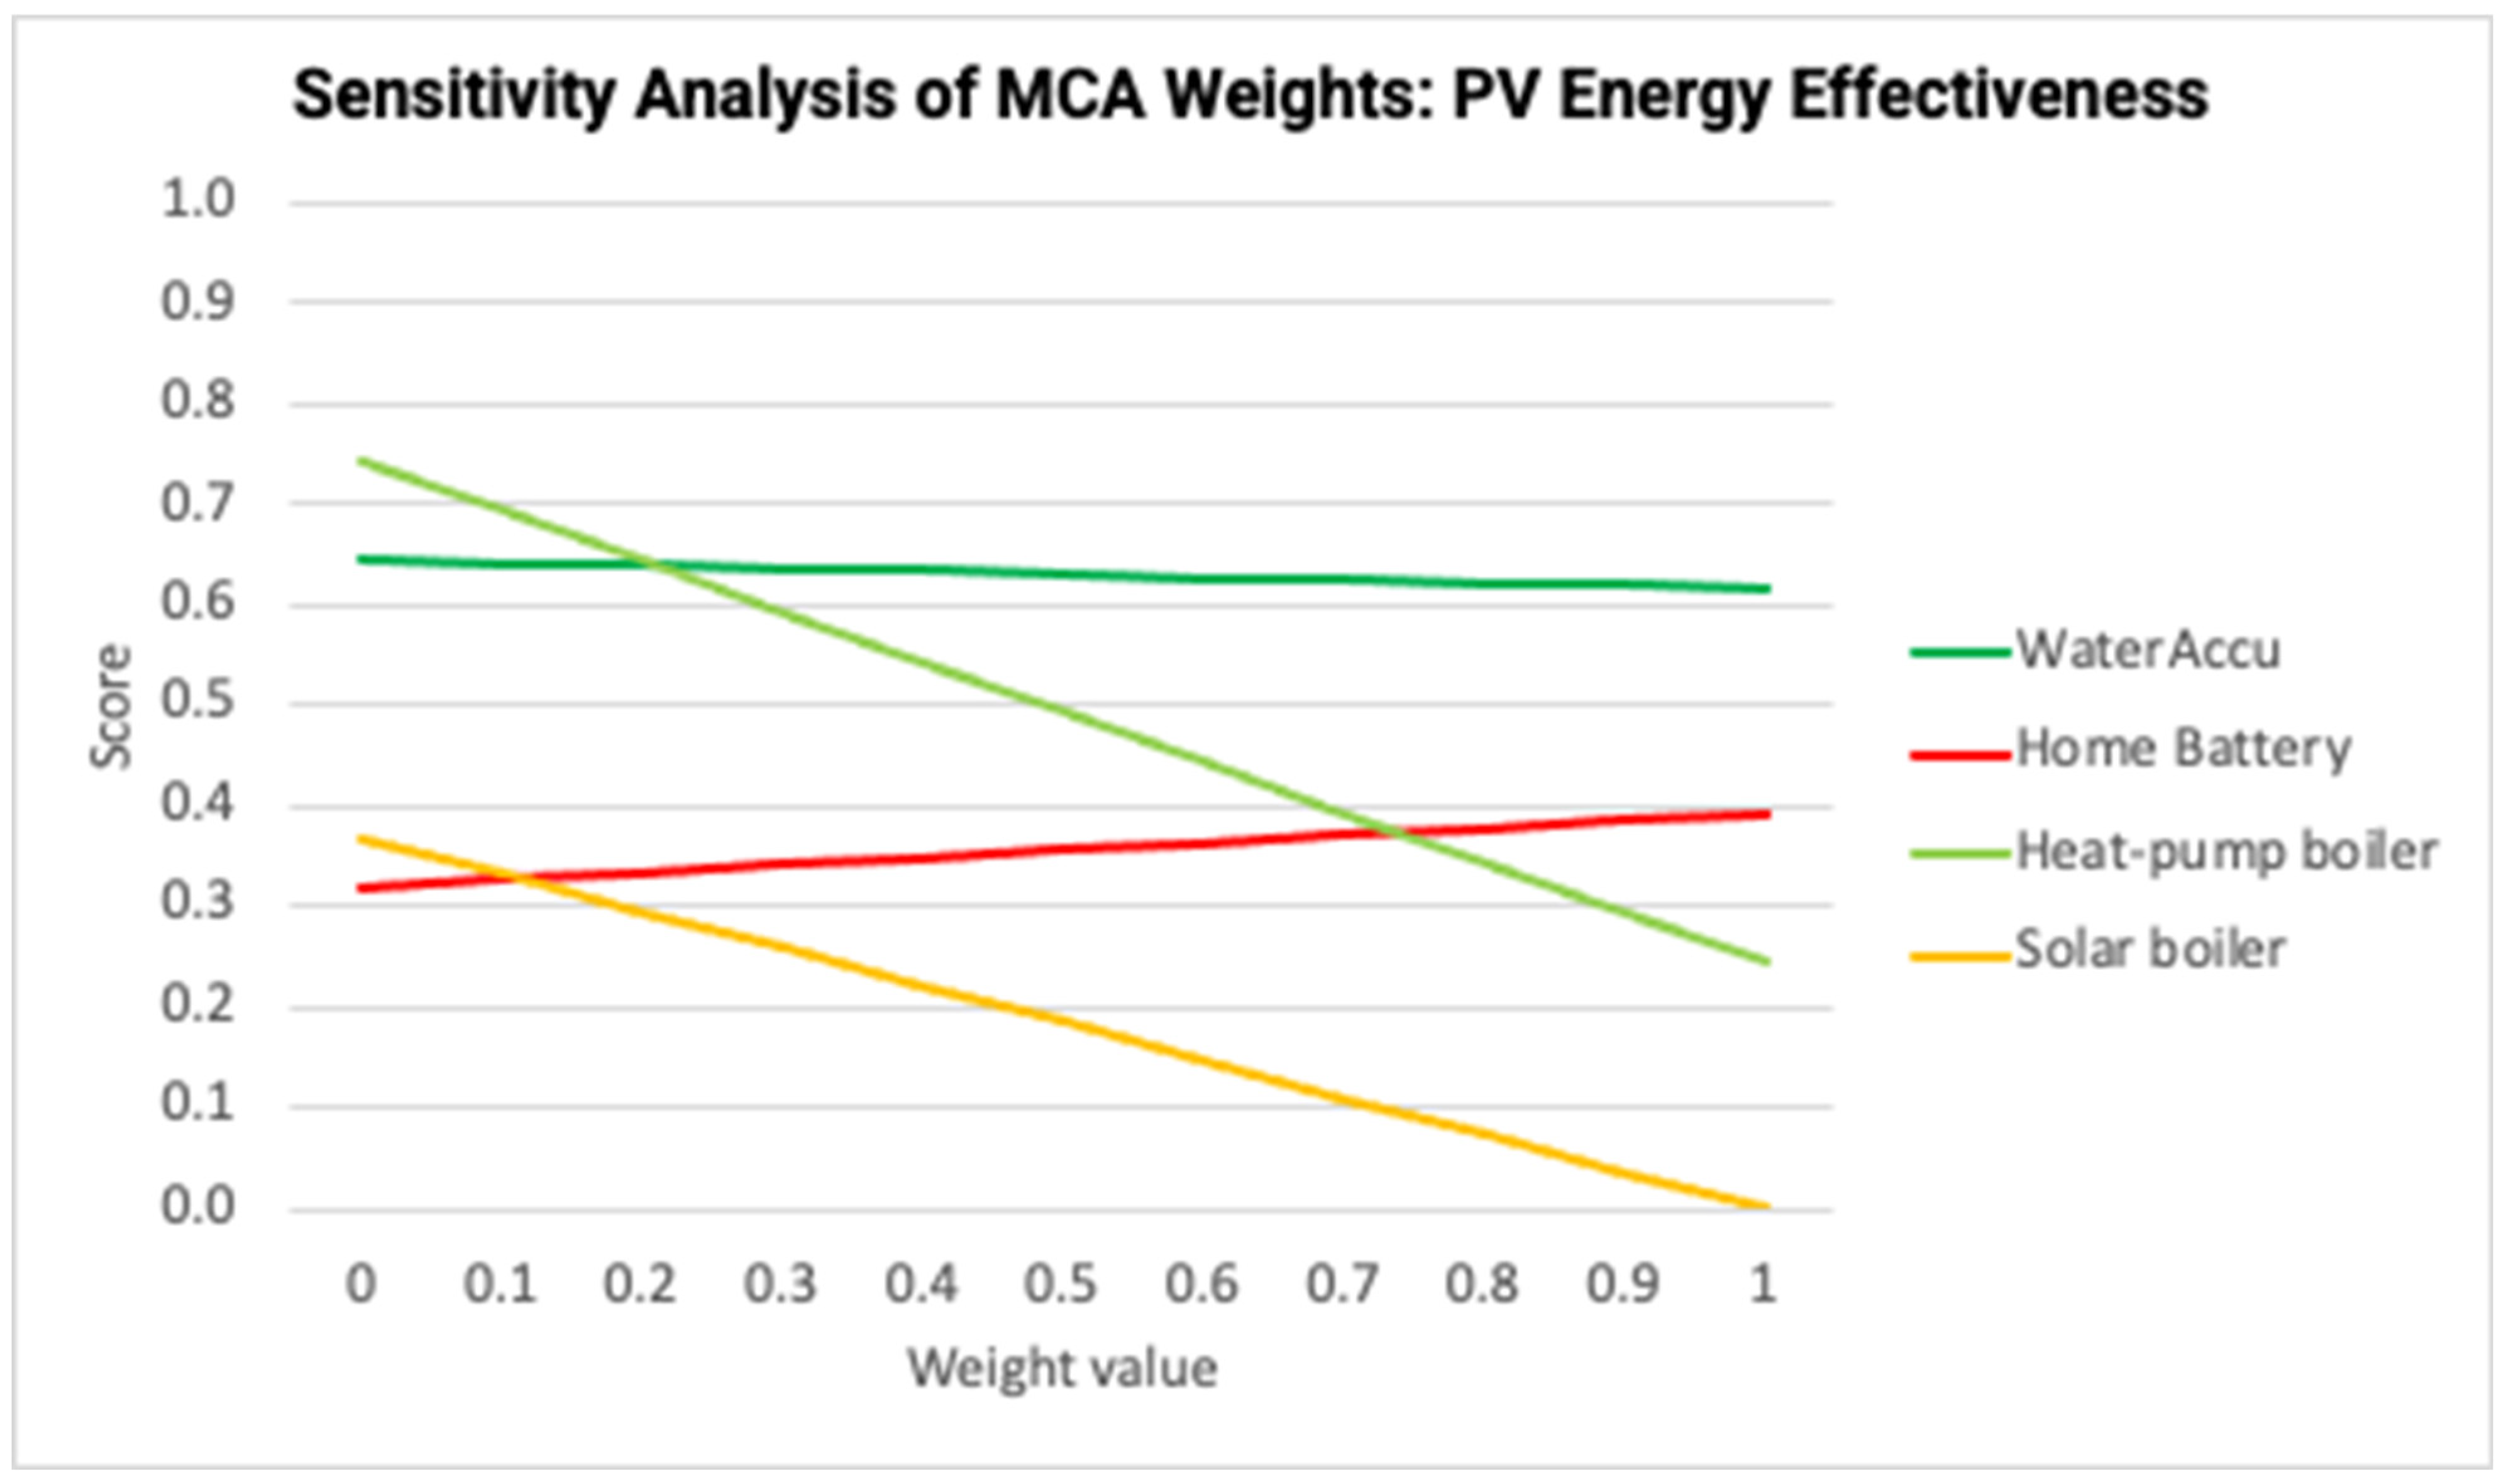
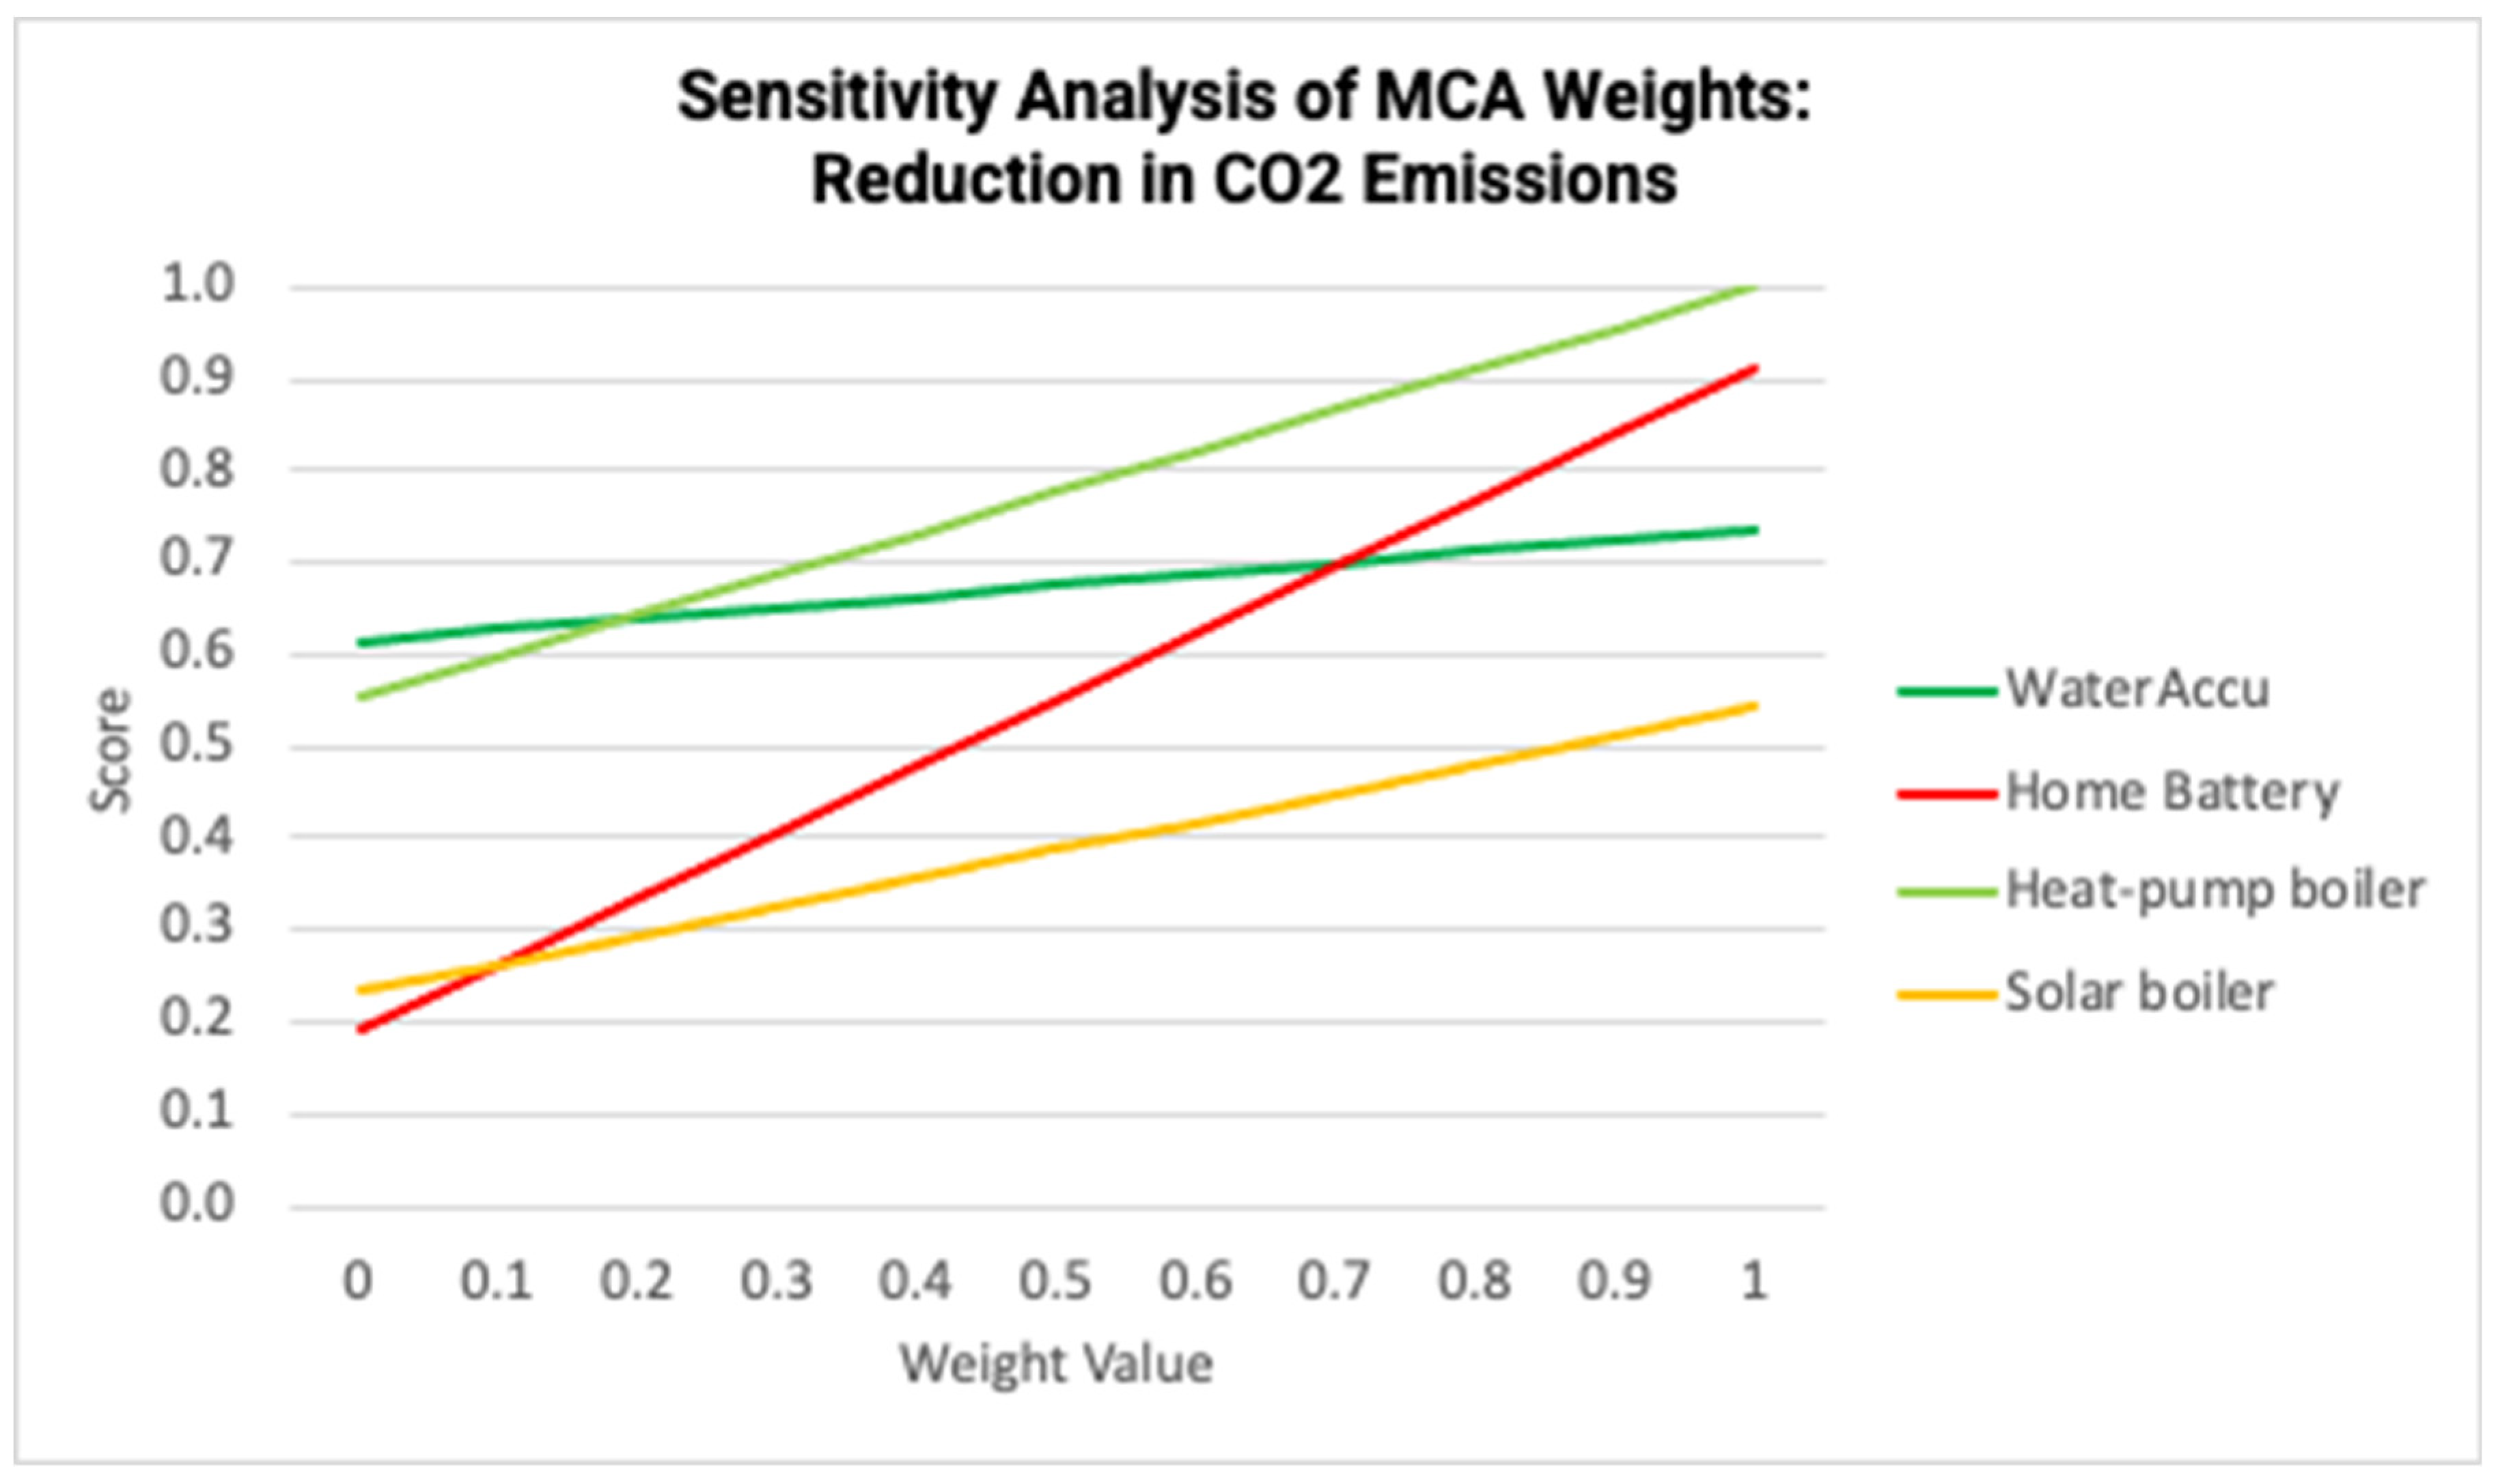
Figure 7, Figure 8, Figure 9, Figure 10 and Figure 11 show the results of the sensitivity analysis for the total costs, ROI, payback period, PV effectiveness, and CO2 emission reduction.
Figure 7 demonstrates that the home battery is the most sensitive to weight changes of the total costs, followed by the heat pump boiler. The solar boiler is hardly affected by this criterion. The WaterAccu is the only technology that receives a better score as the weight value increases, likely since it has the lowest starting value for this criterion.
Figure 8 shows that the heat pump boiler and the solar boiler are most affected by ROI weight changes. Both of these technologies benefit from a higher weight value for ROI. Both the home battery and the WaterAccu are affected much less, with the home battery being hardly affected at all
Figure 9 shows a nearly opposite situation compared to Figure 8: the WaterAccu and the home battery are most affected by the payback period, while the heat pump boiler and the solar boiler are affected less by this criterion. This can be expected as higher ROI is inversely related to the payback period.
Figure 10 shows that the heat pump boiler and solar boiler are most sensitive to changes in the weight of this criterion since these technologies cannot utilize excess PV energy as well as the other two. The WaterAccu score remains very stable, while the home battery score fluctuates slightly more but remains quite stable as well.
Figure 11 shows that all technologies aside from the WaterAccu are quite sensitive to changes in the weight of reduced CO2 emissions. The home battery is the most sensitive, while the heat pump boiler and solar boiler score similarly to each other.
In summary, the sensitivity analyses of the MCA criteria show that the scores of the WaterAccu are the most stable across the board apart from the payback period, with the other technologies being strongly affected by at least one criterion and generally more than one. The home battery is sensitive to the weight of total costs as well as reduction in CO2 emissions. It also has similar sensitivity to the payback period and effectiveness compared to the WaterAccu. Overall, the sensitivity analyses show the advantages of the WaterAccu in a robust way.

4. Discussion

With regard to limitations, the model used average values for many calculations in order to be broadly applicable. In the current model used, gas and electricity use of different households all follow the same energy profiles, with annual use being the only variation. In addition, the data used for calculating PV production remained static and were based on an average of multiple areas in the Netherlands, while the actual benefits of PV systems could be somewhat higher or lower depending on the specific location of a household. These limitations mean that the actual savings of specific households that utilize P2DHW might vary somewhat more than the calculations indicated. However, we believe that implementing more variety for both PV production and hourly energy use would not provide better insights. Another important limitation was the unchanging values of the gas and electricity tariffs over the years of study. These values remained the same during the calculations when it would be more realistic to have them vary between months. This would be a recommended addition for future research, even if the changes in tariffs can be rather uncertain.
The results show that the WaterAccu works effectively as a power-to-heat system at the residential level when compared to similar options. The heat pump boiler seems to be the most prominent alternative, scoring somewhat higher in several categories. However, one aspect of the WaterAccu that has not been discussed in the research is the versatility of its use in combination with other technologies. For example, it is possible to combine the WaterAccu with a regular heat pump or hybrid heat pumps. Furthermore, P2DHW scored the highest when it came to initial costs. This is important because many steps toward sustainability are still seen as expensive, and options like the home battery can indeed be a costly investment. Therefore, introducing newer options that are easier or less expensive to implement would be beneficial as the next step in the energy transition. P2DHW can fill a niche as an easier option for consumers.
Another important aspect is the state of the netting system in the Netherlands in the future. This research was conducted in a time when the future of the netting system was still uncertain. At first, the netting system was planned to remain in place instead of being gradually removed between 2027 and 2031, leading to several energy companies making plans to charge a fee for returning electricity to the grid. However, the new government has planned to remove the netting system by 2027. While it is still not entirely certain if this will happen, the earlier plans have shown that there will be more reason for consumers to utilize their own electricity, thus increasing self-consumption, either because netting will be abolished or because companies will take other actions, and especially because grid balancing will become even more of a problem. This would make P2DHW systems like the WaterAccu a simple solution to help remedy the issues of congestion and loss of effective utilization.
Recommendations for future research would be to test the effectiveness of P2DHW on a larger scale, such as at neighborhood level, since this is where the most (local) grid congestion tends to take place for consumers. Improving the model to account for better fluctuations in PV production and energy requirements will also be interesting to discover the flexibility of P2DHW. Finally, the mechanisms of the device to dynamically utilize electricity could be incorporated into other technologies, such as charging stations for electric cars or P2DHW on a larger scale, to also partly cover district heating using a heat storage system. This could be combined with research of P2DHW’s effectiveness on a neighborhood level.

5. Conclusions

The purpose of this research was to determine the value of P2DHW systems for better utilization of excess PV power and lower gas use in households of the Netherlands. This would not only be beneficial for lowering CO2 emissions but would also aid in lowering net congestion by preventing grids from being overloaded. In order to gauge the effectiveness of P2DHW, for twelve different households differing in size (1–6 occupants), PV capacity (2.4–8 kWp), and size of hot water storage boiler (50–300 L), it was shown that the total economic benefits for the period 2024–2032 varied from −€13 to €3055, assuming the current net metering scheme is abolished in 2027. Only for large households with low PV capacity were the benefits a little negative. Disbanding the netting systems three years earlier (2024) led to economic benefits of €618 to €3368.
Further, a comparison was performed between a P2DHW system and several alternative technologies that can utilize excess PV power, i.e., home battery, heat pump boiler, and solar boiler. The systems were tested on total costs, ROI, payback period, PV energy effectiveness, and CO2 emission reduction. As the results, including the sensitivity study have shown, P2DHW has the potential to effectively utilize excess PV power compared to the other options, mainly providing a simple and affordable method of improving sustainability at the household level. The system will be most effective when netting is disbanded, otherwise the latter is still preferable for households with little to no excess PV power.
Future research could focus on the effectiveness of preventing net congestion in neighborhood areas by employing P2DHW in multiple households at once, since the current research only focused on individual households. Furthermore, since P2DHW mostly allows for short-term storage, another option for future research would be to investigate methods of storing excess energy for a longer period of time, utilizing underground storage or similar methods. Finally, there are some technological limitations to the type of P2DHW utilized with regard to utilizing the amount of excess PV power at a particular point in time. Improving this aspect of the system would be an important step in making the technology more effective in the Netherlands.

Author Contributions

Conceptualization, I.K., E.S. and W.v.S.; methodology, I.K.; software, I.K.; validation, I.K.; formal analysis, I.K., E.S. and W.v.S.; investigation, I.K., E.S. and W.v.S.; resources, I.K. and E.S.; data curation, I.K.; writing—original draft preparation, I.K., E.S. and W.v.S.; writing—review and editing, I.K., E.S. and W.v.S.; visualization, I.K.; supervision, E.S. and W.v.S. All authors have read and agreed to the published version of the manuscript.

Funding

This research received no external funding.

Data Availability Statement

Data are available from the authors upon reasonable request.

Conflicts of Interest

The authors declare no conflicts of interest.

References

  1. Dutch New Energy Research (DNER) Nationaal Solar Trendrapport. 2024. Available online: https://www.solarsolutions.nl/trendrapport/ (accessed on 11 October 2024).
  2. Donker, J.; Halstead, M. Divestment from Fossil Fuels: Is It Accelerating the Energy Transition? TNO Perspectives Series on Energy Transition Financing. 2020. Available online: https://publications.tno.nl/publication/34637651/n4ZjNd/TNO-2020-divestment.pdf (accessed on 11 October 2024).
  3. Milieucentraal. Thuisbatterij: Zonne-Energie Opslaan. 2022. Available online: https://www.milieucentraal.nl/energie-besparen/zonnepanelen/thuisbatterij-zonne-energie-opslaan/ (accessed on 11 October 2024).
  4. Bakker, J.W.; Verheij, F.J.; Menkveld, M.; Usmani, O.A. Update Effect Afbouw Salderingsregeling op de Terugverdientijd van Investeringen in Zonnepanelen. 2022. Available online: https://www.rijksoverheid.nl/documenten/rapporten/2022/07/01/tno-rapport-update-effect-afbouw-salderingsregeling-op-de-terugverdientijd-van-investeringen-in-zonnepanelen (accessed on 11 October 2024).
  5. Londo, H.M.; Matton, R.; Usmani, O.; van Klaveren, M.; Tigchelaar, C. De Salderingsregeling: Effecten van een Aantal Hervormingsopties; ECN: Petten, The Netherlands, 2017. [Google Scholar]
  6. Bloess, A.; Schill, W.P.; Zerrahn, A. Power-to-heat for renewable energy integration: A review of technologies, modeling approaches, and flexibility potentials. Appl. Energy 2018, 212, 1611–1626. [Google Scholar] [CrossRef]
  7. Naranjo-Mendoza, C.; Oyinlola, M.A.; Wright, A.J.; Greenough, R.M. Experimental study of a domestic solar-assisted ground source heat pump with seasonal underground thermal energy storage through shallow boreholes. Appl. Therm. Eng. 2019, 162, 114218. [Google Scholar] [CrossRef]
  8. Nami, H.; Anvari-Moghaddam, A.; Arabkoohsar, A. Application of CCHPs in a centralized domestic heating, cooling and power network—Thermodynamic and economic implications. Sustain. Cities Soc. 2020, 60, 102151. [Google Scholar] [CrossRef]
  9. Zhang, K.; Liu, M.; Zhao, Y.; Yan, H.; Yan, J. Design and performance evaluation of a new thermal energy storage system integrated within a coal-fired power plant. J. Energy Storage 2022, 50, 104335. [Google Scholar] [CrossRef]
  10. Visser, L.; Elsinga, B.; AlSkaif, T.; van Sark, W. Open-Source Quality Control Routine and Multi-Year Power Generation Data of 175 PV Systems (0.0.1.); Data Set; Zenodo: Geneva, Switzerland, 2022. [Google Scholar] [CrossRef]
  11. CBS. Meer Elektriciteit Uit Hernieuwbare Bronnen, Minder Uit Fossiele Bronnen. 2022. Available online: https://www.cbs.nl/nl-nl/nieuws/2022/10/meer-elektriciteit-uit-hernieuwbare-bronnen-minder-uit-fossiele-bronnen (accessed on 11 October 2024).
  12. Hall, E.F.; Maas, R.J.M.; Limaheluw, J.; Betgen, C.D. Mondiaal Klimaatbeleid: Gezondheidswinst in Nederland Bij Minder Klimaatverandering; Report 2020-0200; RIVM: Bilthoven, The Netherlands, 2021. [Google Scholar]
  13. Milieucentraal. Gemiddeld Energieverbruik. 2022. Available online: https://www.milieucentraal.nl/energie-besparen/inzicht-in-je-energierekening/gemiddeld-energieverbruik/ (accessed on 11 October 2024).
  14. CBS. Woningen; Hoofdverwarmingsinstallaties, Region. 2023. Available online: https://opendata.cbs.nl/#/CBS/nl/dataset/84948NED/table (accessed on 11 October 2024).
  15. Boilergarant. Energiezuinig/Anti-Kalk Boilers. 2023. Available online: https://www.boilergarant.nl/c/energiezuinig-anti-kalk-boilers?product_category_id=44&price_from=&price_to=&attribute_63_from=&attribute_63_to=&attribute_64_from=&attribute_64_to=&attribute_65_from=&attribute_65_to=&sort=price:asc (accessed on 11 October 2024).
  16. Solyx Energy. Product Solar iBoost. 2023. Available online: https://www.solyxenergy.nl/product/solar-iboost/ (accessed on 11 October 2024).
  17. MFFBAS. Sectordocumenten. 2023. Available online: https://www.mffbas.nl/documenten/ (accessed on 11 October 2024).
  18. Enexis Netbeheer. Welke Aansluiting heb ik Nodig? 2023. Available online: https://www.enexis.nl/aansluitingen/welke-aansluiting-heb-ik-nodig (accessed on 11 October 2024).
  19. Nibud. Kosten van Energie en Water. 2023. Available online: https://www.nibud.nl/onderwerpen/uitgaven/kosten-energie-water/ (accessed on 11 October 2024).
  20. DTU Wind Energy. CorRES. 2022. Available online: https://corres.windenergy.dtu.dk/using-corres (accessed on 11 October 2024).
  21. De Felice, M. ENTSO-E Pan-European Climatic Database (PECD 2021.3) in Parquet Format; Data Set; Zenodo: Geneva, Switzerland, 2021. [Google Scholar] [CrossRef]
  22. Majcen, D.; Itard, L.; Visscher, H. Actual and theoretical gas consumption in Dutch dwellings: What causes the differences? Energy Policy 2013, 61, 460–471. [Google Scholar] [CrossRef]
  23. CBS. Watergebruik Thuis (WGT) 2021. 2022. Available online: https://www.cbs.nl/nl-nl/longread/aanvullende-statistische-diensten/2022/watergebruik-thuis--wgt---2021/6-de-douche#:~:text=De%20gemiddelde%20doucheduur%20is%207,79%2C6%20liter%20per%20douchebeurt (accessed on 11 October 2024).
  24. Green, D.W.; Southard, M.Z. Perry’s Chemical Engineers’ Handbook; McGraw-Hill Education: New York, NY, USA, 2019. [Google Scholar]
  25. Heslinga, D.C.; van Harmelen, A.K. Vaststellingsmethodieken Voor CO2-Emissiefactoren Van Aardgas in Nederland; TNO: Apeldoorn, The Netherlands, 2006. [Google Scholar]
  26. Croezen, H.; Doe, M.; Jorna, N. Broeikasgasemissies Aardgasketens; Report BI4005IBRP001F01; Royal HaskoningDHV: Rotterdam, The Netherlands, 2022; Available online: https://www.co2emissiefactoren.nl/wp-content/uploads/2022/01/35-RHDHV-Broeikasgasemissies-aardgasketens-2022.pdf (accessed on 11 October 2024).
  27. Doebbeling, B.N.; Wenzel, R.P. The epidemiology of Legionella pneumophila infections. Semin. Respir. Infect. 1987, 2, 206–221. [Google Scholar] [PubMed]
  28. Van der Molen, M.; Pieterse-Quirijns, I.; Donocik, A.; Smulders, E. Eigenschappen bodem en oppervlak beïnvloeden temperatuurstijging rond drinkwaterleidingen. H2O 2009, 42, 33. [Google Scholar]
  29. Berkhout, P.; Bergevoet, R.; Jellema, A. Knelpuntenanalyse Conflict Oekraïne: Analyse Knelpunten Korte Termijn voor de Agrarische Ketens; Report No. 2022-037; Wageningen Economic Research, Wageningen University Research: Wageningen, The Netherlands, 2022; Available online: https://research.wur.nl/en/publications/knelpuntenanalyse-conflict-oekraine-analyse-knelpunten-korte-term (accessed on 11 October 2024).
  30. Easyswitch. Energieprijzen. 2023. Available online: https://www.easyswitch.nl/energieprijzen/ (accessed on 11 October 2024).
  31. Energyshift. Salderen Stopt: Besluit Nieuw Cabinet. 2024. Available online: https://www.energyshift.nl/salderen-stopt-besluit-nieuw-kabinet/#:~:text=met%20budgettaire%20punten.-,Daarin%20werd%20ook%20de%20salderingsregeling%20genoemd%2C%20die%20eerder%20zou%20worden,voor%20veel%20installateurs%20en%20fabrikanten (accessed on 11 October 2024).
  32. Solvari BV. Zonnepanelen Wattpiek. 2023. Available online: https://www.zonnepanelen.net/wattpiek/ (accessed on 11 October 2024).
  33. Dodgson, J.S.; Spackman, M.; Pearman, A.; Phillips, L.D. Multi-Criteria Analysis: A Manual; Economic History Working Papers 12761; Communities and Local Government Publication: London, UK, 2009. [Google Scholar]
  34. Leestemaker, L.; Otten, M.; Scholten, P.; Hilster, D.; Meijer, C.; Király, J.; Van den Berg, R.; Bruinsma, M. STREAM Personenvervoer: Emissiekentallen Modaliteiten 2022. Publication Number 23.2210506.108, CE Delft. 2023. Available online: https://cedelft.eu/wp-content/uploads/sites/2/2023/03/CE_Delft_210506_STREAM_Personenvervoer_2022_DEF.pdf (accessed on 11 October 2024).
  35. Beccali, M.; Bonomolo, M.; Martorana, F.; Catrini, P.; Buscemi, A. Electrical hybrid heat pumps assisted by natural gas boilers: A review. Appl. Energy 2022, 322, 119466. [Google Scholar] [CrossRef]
  36. Boilergarant. Alle Warmtepompboilers. 2023. Available online: https://www.boilergarant.nl/c/alle-warmtepompboilers?product_category_id=65&sort=price:asc (accessed on 11 October 2024).
  37. Boilergarant. AquaThermica 200L (Zonder Warmtewisselaar). 2023. Available online: https://www.boilergarant.nl/p/aquathermica-200l-zonder-warmtewisselaar (accessed on 11 October 2024).
  38. Lupu, A.G.; Homutescu, V.M.; Balanescu, D.T.; Popescu, A. Efficiency of Solar Collectors—A Review. In IOP Conference Series: Materials Science and Engineering; IOP Publishing: Bristol, UK, 2018; Volume 444, p. 082015. [Google Scholar]
  39. Milieucentraal. Zonneboiler. 2022. Available online: https://www.milieucentraal.nl/energie-besparen/duurzaam-warm-water/zonneboiler/ (accessed on 11 October 2024).
  40. Zhao, Y.; Zhao, C.; Wen, T.; Markides, C.N. High Temperature Sensible Storage—Industrial Applications. Encycl. Energy Storage 2022, 1, 329–337. [Google Scholar]
  41. Mohamad, I.B.; Usman, D. Standardization and its effects on K-means clustering algorithm. Res. J. Appl. Sci. Eng. Technol. 2013, 6, 3299–3303. [Google Scholar] [CrossRef]
  42. Durbach, I.N.; Stewart, T.J. Using expected values to simplify decision making under uncertainty. Omega 2009, 37, 312–330. [Google Scholar] [CrossRef]
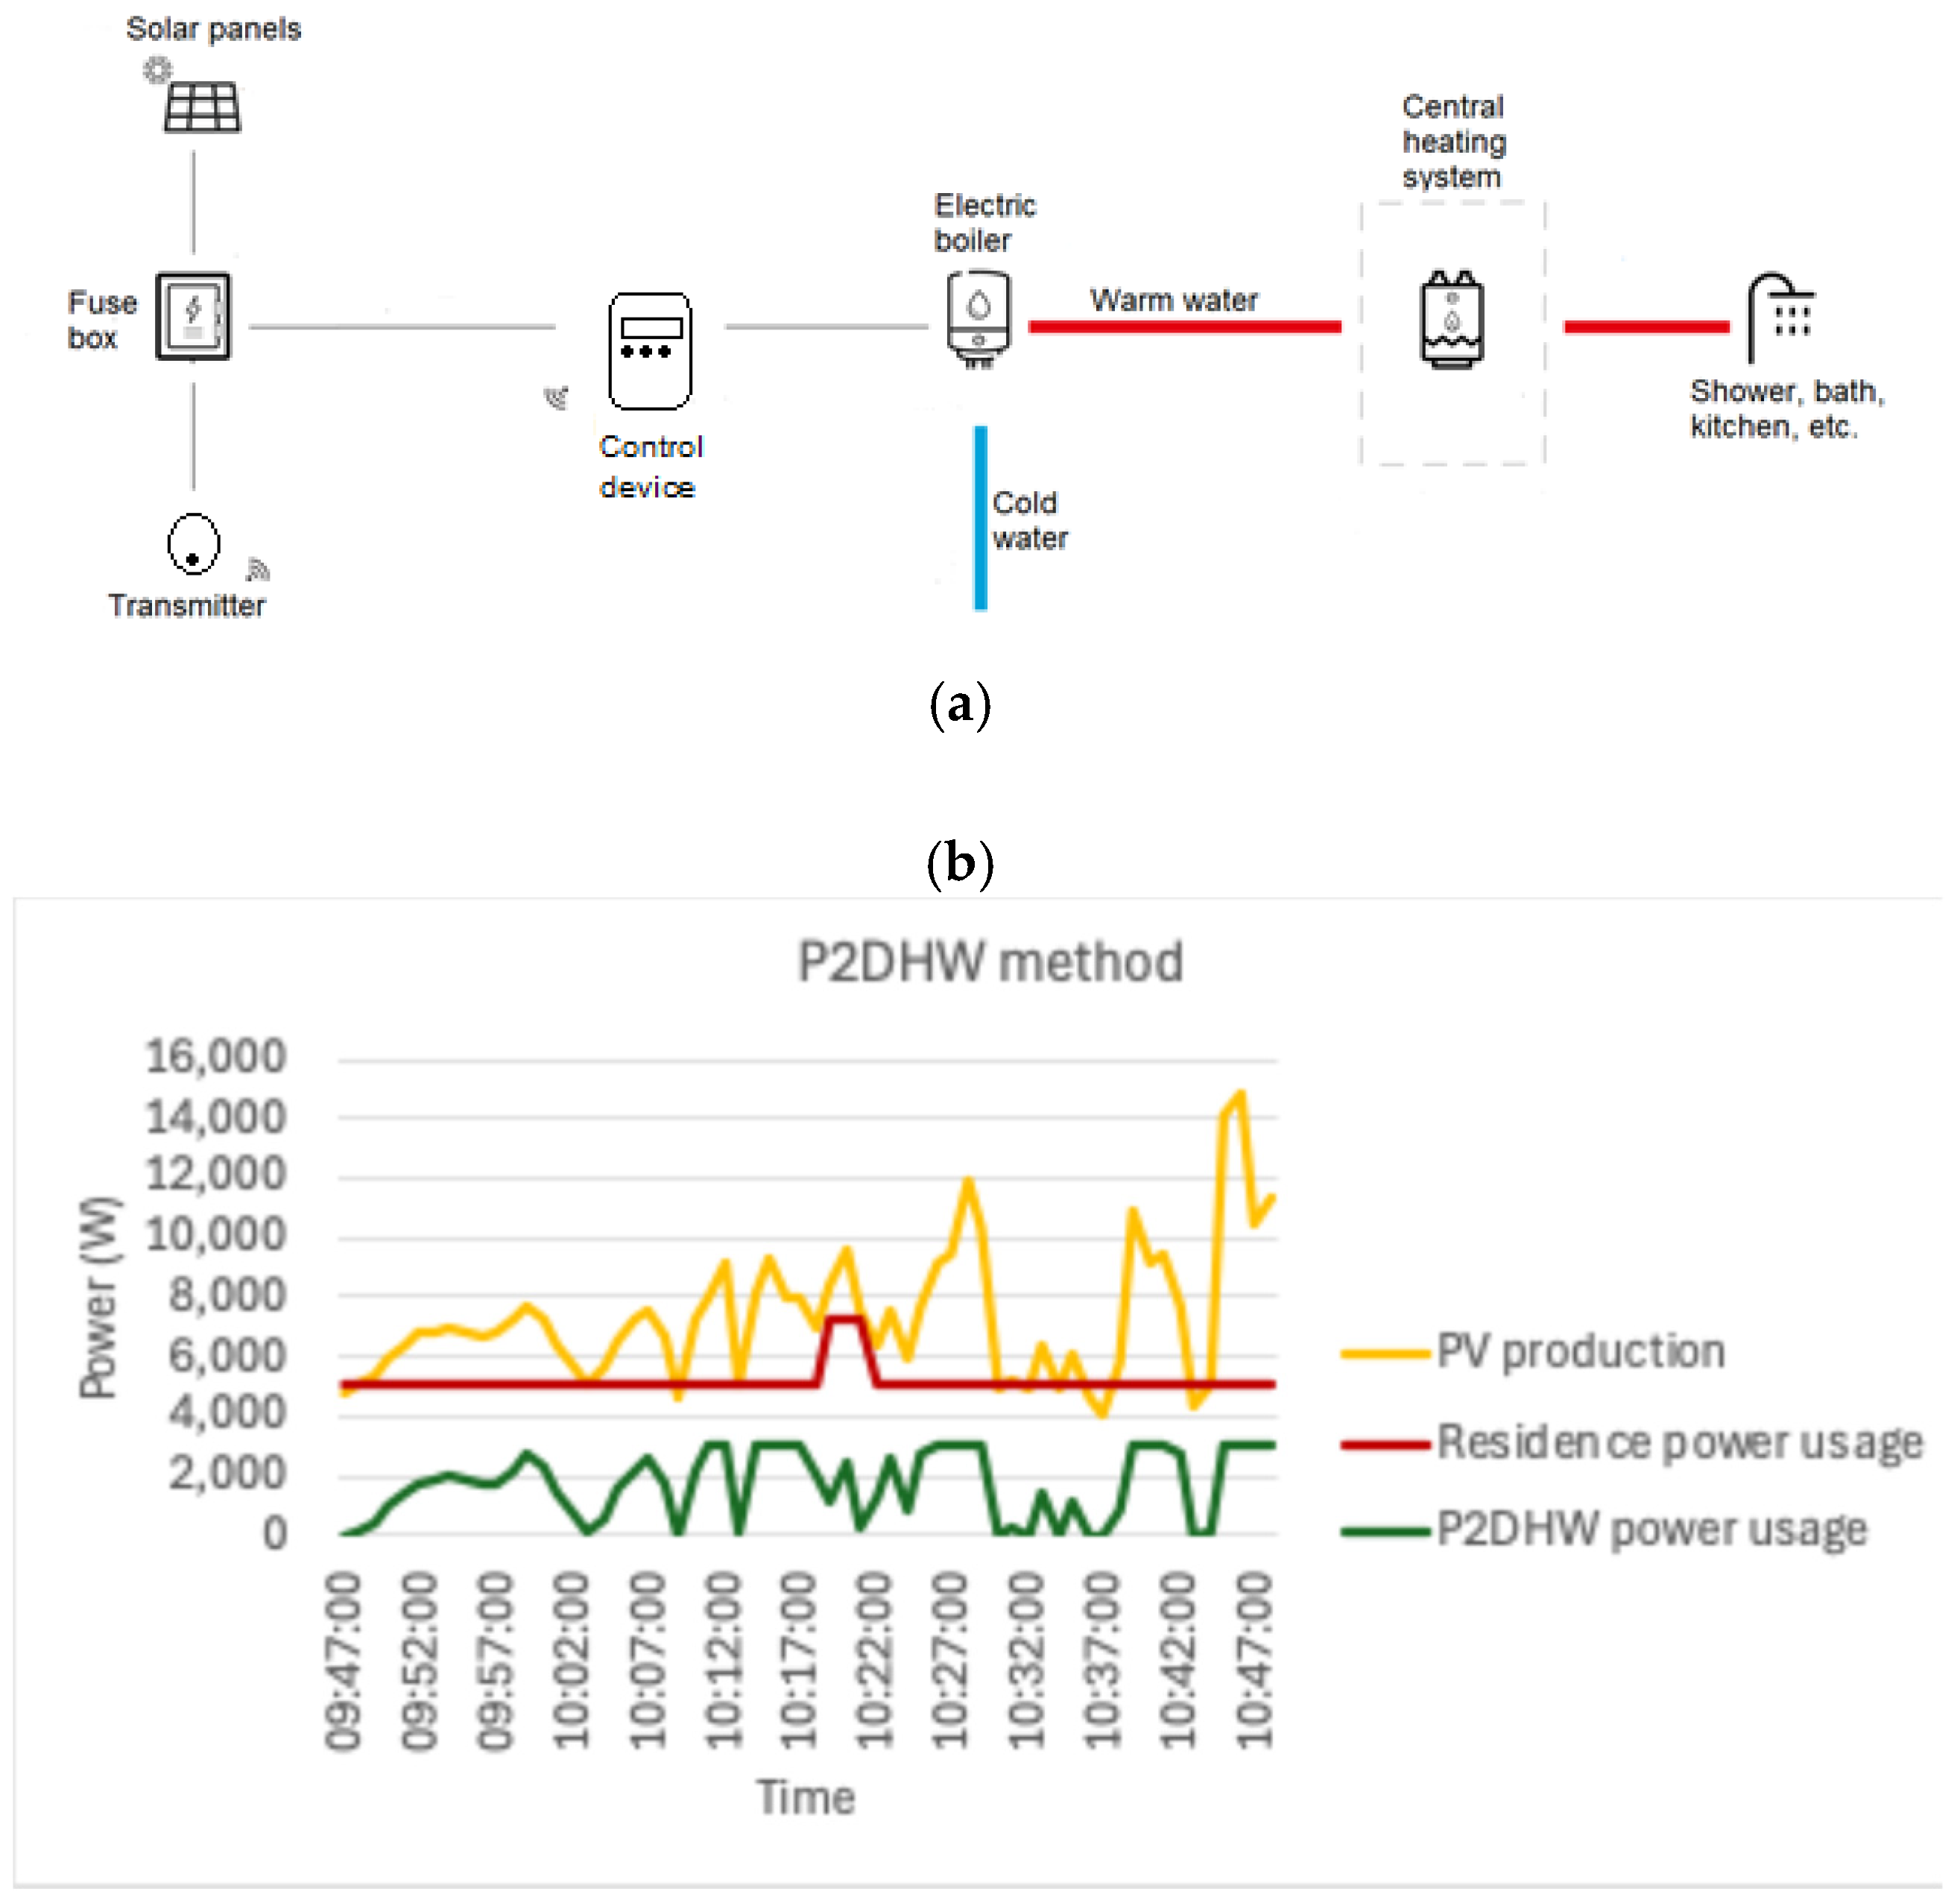
Figure 1. (a) Diagram showing the set-up of a P2DHW system, and (b) graph showing excess PV energy being utilized for P2DHW in the timeframe of one hour.
Energies 17 05154 g001
Figure 2. Energy usage in MJ for an average weekday and weekend day in January 2023.
Energies 17 05154 g002
Figure 3. Energy usage in MJ for an average weekday and weekend day in July 2023.
Energies 17 05154 g003
Figure 4. Daily energy demand of the base household without and with utilizing P2DHW for a weekday and weekend day for each month in the year 2024.
Energies 17 05154 g004
Figure 5. Final scores of each technology for the basic MCA with different properties.
Energies 17 05154 g005
Figure 6. Sensitivity analysis of the four primary parameters.
Energies 17 05154 g006
Figure 7. Results of the sensitivity analysis looking at total costs.
Energies 17 05154 g007
Figure 8. Results of the sensitivity analysis looking at ROI.
Energies 17 05154 g008
Figure 9. Results of the sensitivity analysis looking at the payback period.
Energies 17 05154 g009
Figure 10. Results of the sensitivity analysis looking at PV energy effectiveness.
Energies 17 05154 g010
Figure 11. Results of the sensitivity analysis looking at reduction in CO2 emissions.
Energies 17 05154 g011
Table 1. Overview of household specifics: number of occupants, number of PV panels and their rated capacity, and the size of the electric boiler.
Type of HouseholdNumber of OccupantsNumber of PV PanelsPower per PV Panel (Wp)Size of Boiler (L)
1.11830050
1.2210275120
1.321030080
2.1410275150
2.2510300200
2.3610375300
3.1112400150
3.2215375100
3.3215400150
4.1415400200
4.2518375200
4.3620400300
Table 2. Overview of weights used for 5 scenarios. The underlined score illustrates the priority.
ScenarioNo PriorityPriority
Total CostsROIPayback PeriodPV Energy EffectivenessReduction in CO2 Emissions
Total costs0.200.460.160.160.090.09
ROI0.200.160.460.260.040.04
Payback period0.200.260.090.460.160.16
PV energy effectiveness0.200.090.040.040.460.26
Reduction in CO2 emissions0.200.040.260.090.260.46
Table 3. Savings in different household scenarios with netting active until the start of 2027.
Household202420252026202720282029203020312032Total
1.1€53.64€49.90€47.65€68.74€68.59€68.65€68.29€68.13€67.98€561.57
1.2−€218.79−€222.43−€223.99€125.63€125.33€125.11€124.40€123.89€123.49€82.63
1.3−€96.59−€101.35−€103.66€97.80€97.57€97.54€97.08€96.87€96.66€281.92
2.1−€242.23−€240.19−€237.73€120.89€119.89€118.83€117.58€116.44€115.38−€11.13
2.2−€265.57−€263.35−€260.66€132.56€131.47€130.31€128.94€127.71€126.54−€12.06
2.3−€374.93−€372.26−€368.72€187.60€186.18€184.75€183.01€181.45€179.97−€12.96
3.1€207.29€207.53€206.52€206.13€205.74€205.80€204.71€204.37€204.02€1852.11
3.2€149.56€149.95€149.32€149.05€148.78€148.97€148.35€148.22€148.09€1340.30
3.3€214.20€214.80€213.83€213.40€212.97€213.23€212.19€211.90€211.62€1918.14
4.1€119.51€111.02€105.42€250.52€250.04€250.04€248.92€248.49€248.07€1832.04
4.2€218.71€209.26€202.86€259.47€258.93€258.93€257.65€257.16€256.68€2179.66
4.3€281.78€270.95€263.01€374.81€374.17€374.20€372.59€372.02€371.45€3054.98
Table 4. Savings in different household scenarios with netting no longer active.
Household202420252026202720282029203020312032Total
1.1€69.08€69.26€68.90€68.74€68.59€68.65€68.29€68.13€67.98€617.63
1.2€127.00€126.60€125.94€125.63€125.33€125.11€124.40€123.89€123.49€1.127.38
1.3€98.46€98.53€98.03€97.80€97.57€97.54€97.08€96.87€96.66€878.53
2.1€124.10€123.06€121.79€120.89€119.89€118.83€117.58€116.44€115.38€1077.96
2.2€136.06€134.92€133.55€132.56€131.47€130.31€128.94€127.71€126.54€1182.05
2.3€192.09€190.72€188.91€187.60€186.18€184.75€183.01€181.45€179.97€1674.67
3.1€207.29€207.53€206.52€206.13€205.74€205.80€204.71€204.37€204.02€1852.11
3.2€149.56€149.95€149.32€149.05€148.78€148.97€148.35€148.22€148.09€1340.30
3.3€214.20€214.80€213.83€213.40€212.97€213.23€212.19€211.90€211.62€1918.14
4.1€251.91€252.12€251.00€250.52€250.04€250.04€248.92€248.49€248.07€2251.12
4.2€261.04€261.29€260.01€259.47€258.93€258.93€257.65€257.16€256.68€2331.18
4.3€376.68€377.01€375.46€374.81€374.17€374.20€372.59€372.02€371.45€3368.40
Table 5. Initial values of the criteria used in the MCA.
WaterAccuHome BatteryHeat Pump BoilerSolar Boiler
Total costs (€)1500500029153800
ROI (%)874211560
Payback period (year)1118815
Effectiveness (%)6239240
Reduced CO2 emissions (kg)4055502955152988
Disclaimer/Publisher’s Note: The statements, opinions and data contained in all publications are solely those of the individual author(s) and contributor(s) and not of MDPI and/or the editor(s). MDPI and/or the editor(s) disclaim responsibility for any injury to people or property resulting from any ideas, methods, instructions or products referred to in the content.