Article

Optimal Dispatching Strategy for Textile-Based Virtual Power Plants Participating in GridLoad Interactions Driven by Energy Price

1
Changzhou Power Supply Branch, State Grid Jiangsu Electric Power Co., Ltd., Changzhou 213004, China
2
College of Electrical Engineering and Control Science, Nanjing Tech University, Nanjing 211816, China
*
Author to whom correspondence should be addressed.
Energies 2024, 17(20), 5142; https://doi.org/10.3390/en17205142
Submission received: 4 September 2024 / Revised: 28 September 2024 / Accepted: 11 October 2024 / Published: 16 October 2024
(This article belongs to the Special Issue Advanced Research on Heat Exchangers Networks and Heat Recovery)

Abstract

:
The electricity consumption of the textile industry accounts for 2.12% of the total electricity consumption in society, making it one of the high-energy-consuming industries in China. The textile industry requires the use of a large amount of industrial steam at various temperatures during production processes, making its dispatch and operation more complex compared to conventional electricity–heat integrated energy systems. As an important demand-side management platform connecting the grid with distributed resources, a virtual power plant can aggregate textile industry users through an operator, regulating their energy consumption behavior and enhancing demand-side management efficiency. To effectively address the challenges in load regulation for textile industry users, this paper proposes a coordinated optimization dispatching method for electricity–steam virtual-based power plants focused on textile industrial parks. On one hand, targeting the impact of different energy prices on the energy usage behavior of textile industry users, an optimization dispatching model is established where the upper level consists of virtual power plant operators setting energy prices, and the lower level involves multiple textile industry users adjusting their purchase and sale strategies and changing their own energy usage behaviors accordingly. On the other hand, taking into account the energy consumption characteristics of steam, it is possible to optimize the production and storage behaviors of textile industry users during off-peak electricity periods in the power market. Through this electricity–steam optimization dispatching model, the virtual power plant operator’s revenue is maximized while the operating costs for textile industry users are minimized. Case study analyses demonstrate that this strategy can effectively enhance the overall economic benefits of the virtual power plant.

1. Introduction

The textile industry, as a traditional pillar industry, has economic clusters whose scale approaches nearly 50% of the entire sector [1]. There is significant potential for energy conservation and consumption reduction within the textile industry [2]. Despite continuous enrichment of supply-side resources, the growing integration of distributed energy resources introduces output characteristics like randomness, intermittency, and fluctuations, which intensify challenges in regulating loads and allocating resources for textile industry users [3]. In this context, a virtual power plant (VPP) employs advanced information, communication, and control technologies to aggregate and optimize the management of distributed resources [4]. Acting as intermediaries between large-scale power systems and diverse distributed energy sources, a VPP is tailored to textile industrial parks to optimize energy dispatching by coordinating the energy consumption patterns of textile industry users. Furthermore, internally aggregated textile industry users and a virtual power plant operator (VPPO) engage in electricity markets through competitive bidding [5]. VPPO can additionally direct users to engage in demand response through strategic energy procurement and sales policies, fully capitalizing on the textile industry’s diverse energy complementarity. This approach is critical for guiding industrial users towards efficient energy consumption and maximizing the overall benefits of a VPP.
A VPP aggregates generating units, renewable energy sources, energy storage systems, and various flexible loads, optimizing specific objective functions through coordinated control mechanisms [6]. To achieve supply–demand balance, many scholars have conducted research on the optimal dispatching problem of VPP. Reference [7] introduces a multi-objective economic optimization dispatching model for VPPs, which balances the interests of power suppliers and cooling/heating providers, enhances environmental performance, and ensures economically sustainable operations. Reference [8] develops a comprehensive energy optimization dispatching model for VPP considering electric–thermal conversion, minimizing integrated operational costs across multiple electricity markets. Reference [9] proposes a multi-agent internal optimization dispatching decision model for VPP considering risk preferences. It establishes a profit allocation model based on Nash–Harsanyi bargaining solutions, quantifying the actual contributions of distributed energy resources to VPP profits and enhancing member participation in markets. Reference [10] presents a method for solving the control boundary of industrial park-type VPP by considering power network constraints, achieving precise boundary solutions for VPP control in industrial parks. Reference [11] aggregates flexible electric–thermal loads in industrial production processes into a multi-energy VPP. It adjusts equipment operation states using measurement and control methods to provide frequency conversion services, meeting ancillary service market demands. Reference [12] proposes a two-stage robust resilience enhancement strategy considering thermal inertia for combined heat and power VPP, effectively improving their capability to withstand extreme disasters. Reference [13] establishes an assessment method for the aggregated response capability of VPP distributed resources. It optimizes and quantifies multi-dimensional indicators of aggregated resources and analyzes indicator weights to obtain an overall response capability score for the VPP. Reference [14] introduces an optimized dispatching strategy for a multi-energy complementary VPP by considering renewable energy integration. It constructs an operational mechanism and optimization dispatching model covering generation, grid, load, and storage, significantly enhancing renewable energy utilization and enabling low-carbon economic operations of VPP.
Currently, there are existing studies on the interaction behaviors between VPPO and users. Reference [15] constructs a Stackelberg game model involving VPPO, energy suppliers, and users, aimed at optimizing VPPO pricing strategies, energy supply-side dispatch plans, and user demand response. Reference [16] proposes a Stackelberg game pricing model between VPPO and electric vehicle (EV) users, aiming for mutual benefits and optimizing operational revenue. Reference [17] develops a tripartite electricity pricing game involving distributed energy resources, VPPO, and users to achieve Nash equilibrium in revenue for all parties. Reference [18] introduces a Stackelberg game model where VPPO engage in coordinated charging management of electric vehicles, using reasonable electricity pricing to guide orderly charging and coordinate various distributed resources in the electricity market. Reference [19] investigates strategies for VPPO managing controllable loads of industrial users, exploring methods to reduce interaction costs and optimize overall VPP performance. Reference [20] integrates carbon trading with demand response strategies to develop a Stackelberg game model between operators and users, leveraging demand-side resources for emission reduction and response capabilities. Reference [21] constructs a multi-energy dynamic pricing model for operators by setting price ranges, maximizing their own revenue while ensuring maximal benefits for users. Reference [22] proposes a bi-level optimization model for a VPP including electric vehicles, balancing the interests of VPPO and EV users in a principal-agent game framework.
The abovementioned studies primarily focus on the optimal dispatching strategy of specific electric–thermal integrated systems from a macro level regardless of its industrial characteristics. Each industry has its own production process with different coupling forms of multiple energy flows [23,24]. Considering this research gap, this paper takes the textile industry, which is listed as one of top six high-density industries, as an example. As the textile industry is usually developing in clusters, we introduce a textile-based VPPO to dominate multiple textile users in the industrial park. The main contributions of this paper are summarized as:
  • This paper first establishes a bi-level dispatching strategy for VPP targeting textile industrial parks to specially address the coupling characteristics of electricity and steam.
  • Considering the impact on the user behavior brought by the energy prices, this strategy is modeled as where VPPO aims to maximize its own revenue in the upper level, while multiple textile industry users aim to minimize total operational costs in the lower level, finally resulting in an economic increase of the overall system.
  • Considering that the textile industry users utilize electrically-driven industrial steam boilers under decarbonization, the storage-like characteristics of the steam accumulator (SA) is specially addressed.

2. Bi-Level Dispatching Framework for VPP

As shown in Figure 1, the overall framework of the VPP includes the VPPO and the textile industry user system.
The VPPO structure consists of heat pumps, battery storage systems, combined heat and power units (CHP), electrode industrial steam boilers, and steam accumulators. VPPO has certain power and thermal capabilities, and can also provide a unified steam supply to textile industry users using electrode boilers and steam accumulators. When VPPO supply is insufficient, distributed supply is provided by textile industry users. These users have demand for electricity, heat, gas, and steam. When the industrial user’s own system can meet both electricity and heating demands, and the external gas station can fulfill their natural gas needs, there is no requirement for interaction with the VPPO. Only when the user’s own system fails to satisfy their energy demands do they engage with the VPPO to balance energy supply and demand.
In this framework, textile industry users initially prefer to use their own distributed photovoltaic (PV) systems to meet their electricity demands. When PV generation and discharge from their own energy storage systems cannot meet the users’ electricity needs, users can engage in electricity transactions with VPPO to balance energy supply and demand. When there is surplus PV generation, users can store the excess electricity in their own energy storage systems and choose to sell the surplus electricity to VPPO.
Based on the conventional electricity purchasing strategies between VPPO and users, this study further explores the purchasing strategies for thermal energy and steam. Industrial users can purchase natural gas either from external gas stations or through interactions with the VPPO. Additionally, users can sell excess natural gas when there is an oversupply in the market. Users purchase natural gas to produce thermal energy using gas boilers, and engage in thermal energy transactions with VPPO. Users can sell surplus thermal energy when there is excess supply, or purchase additional thermal energy when demand increases. Additionally, users sell high-temperature steam through electrode industrial steam boilers and SA, while simultaneously purchasing high-temperature steam that enters the outlet of the electrode industrial steam boiler. Steam transacted between VPPO and textile industry users is consistently high-temperature steam. The energy purchase and sale prices, as well as the energy trading strategies between the VPPO and industrial users, are based on real-time interactions, with dynamic adjustments made on an hourly basis.

3. The Bi-Level Optimal Dispatching Model for VPPO and Users

3.1. The VPPO-Level Optimal Dispatching Model

3.1.1. VPPO-Level Objective Function

The VPPO, as the upper-level leader, specifies various energy prices for electricity, heat, and steam purchases and sales in each time period, guiding the textile industry users in their strategies for purchasing and selling multiple energy sources of electricity, heat, and steam, with the maximization of total revenue as the objective function. The VPPO’s total revenue includes revenue from the purchase and sale of multiple energy sources between the VPPO and users, revenue from transactions between the VPPO and the external grid, and the VPPO’s gas purchase costs, as Equation (1) shows:
max   F VPPO = t = 1 T ( F e , t + F h , t + F s , t + F e , t grid C g , t VPPO )
In Equation (1), F VPPO represents the total revenue of the VPPO, F e , t , F h , t , F s , t , F e , t grid and C g , t VPPO , respectively, represent the revenue from VPPO’s purchase and sale of electricity, heat, and steam with users, revenue from transactions between VPPO and the external grid, and VPPO’s gas purchase costs, in yuan.
F e , t = ( λ e , t su P e , t su λ e , t bu P e , t bu ) Δ t
F h , t = ( λ h , t su P h , t su λ h , t bu P h , t bu ) Δ t
F s , t = ( λ s , t su Q s , t su λ s , t bu Q s , t bu ) Δ t
F e , t grid = ( λ e , t sg P e , t sg λ e , t bg P e , t bg ) Δ t
C g , t VPPO = λ gas V t VPPO
In Equations (2)–(6), λ e , t bu , λ e , t su , λ h , t bu and λ h , t su , respectively, represent the electricity and heat prices for VPPO’s purchase and sale with users at time t, yuan/kWh; λ e , t bg and λ e , t sg are the electricity grid prices for VPPO’s purchase and sale at time t, yuan/kWh. λ s , t bu and λ s , t su are the prices of steam purchased and sold by VPPO to users at time t, yuan/kJ; P e , t bu , P e , t su , P h , t bu and P h , t su , respectively, represent the electricity and thermal power purchased and sold by VPPO to users at time t, kW; Q s , t bu and Q s , t su are steam power purchased and sold by VPPO to users at time t, kJ/h; P e , t bg and P e , t sg are electricity grid power purchased and sold by VPPO at time, (kW); λ gas and V t VPPO are the price of natural gas at time t(yuan/m3) and amount of gas purchased (m3).
The electricity, thermal power, and steam energy purchased and sold to users by VPPO can be represented as:
P e , t su = i B P e , i , t ub P e , t bu = i S P e , i , t us
P h , t su = i B P h , i , t ub P h , t bu = i S P h , i , t us
Q s , t su = i B M s , i , t ub h s , i , t ub = i B Q s , i , t ub Q s , t bu = i S M s , i , t us h s , i , t us = i S Q s , i , t u s
In Equations (7)–(9), i B represents the set of users purchasing electricity, heat, and steam; i S represents the sold of users purchasing electricity, heat, and steam; P e , i , t ub , P e , i , t us , P h , i , t ub and P h , i , t us , respectively, represent the electricity and heat power purchased and sold by user i to VPPO at time t, kW; M s , i , t ub , h s , i , t ub , M s , i , t us and h s , i , t us , respectively, represent the steam flow rate and steam enthalpy purchased and sold by user i to VPPO at time t. Q s , i , t ub and Q s , i , t ub , respectively, represent the steam power purchased and sold by user i to VPPO at time t, kJ/h.

3.1.2. Energy Price Constraint

The energy price constraints for VPPO’s sale of electricity, heat, and steam to textile industry users are shown in Equations (10)–(12). To prevent sustained high prices for the multi-energy sold by VPPO, average price constraints are set for VPPO’s sale prices of electricity, heat, and steam, respectively [25].
λ e min λ e , t bu λ e , t sg λ e , t bu λ e , t su λ e , t bg t = 1 T λ e , t su 24 λ e , ave su
λ h min λ h , t bu λ h max λ h min λ h , t su λ h max t = 1 T λ h , t su 24 λ h , ave su
λ s min λ s , t bu λ s max λ s min λ s , t su λ s max t = 1 T λ s , t su 24 λ s , ave su
The minimum price at which VPPO purchases electricity from textile industry users is λ e min , while the grid selling price serves as the maximum price at which VPPO sells electricity to textile industry users; the upper and lower limits of VPPO’s buying and selling prices for thermal energy and steam to textile industry users are λ h max , λ h min , λ s max and λ s min ; and the average prices at which VPPO sells electricity, heat, and steam are λ e , ave su , λ h , ave su , and λ s , ave su .

3.1.3. VPPO’s Constraints on Multi-Energy Transaction Volumes with Users

In Equations (13)–(15), P e , max grid represents the maximum electricity volume at which VPPO can transact with the grid in each time period; P h , max VPPO represents the maximum heat volume VPPO can transact with users in each time period; Q s , max VPPO represents the maximum steam volume VPPO can transact with users in each time period.
0 P e , t su P e , max grid 0 P e , t bu P e , max grid
0 P h , t su P h , max VPPO 0 P h , t bu P h , max VPPO
0 Q s , t su Q s , max IPO 0 Q s , t bu Q s , max IPO

3.1.4. VPPO-Level Power Balance Constraint

The upper-level model centers around the VPPO, with electrical energy inputs including purchases from the public grid, electricity generation from CHP, discharges from electric energy storage, and purchases from textile industry users. Electrical energy outputs consist of electricity sales to the grid, electricity consumption by heat pumps, electricity consumption by electrode industrial steam boilers, charging of electric energy storage, and electricity sales to textile industry users. VPPO’s thermal energy inputs include heat production from heat pumps, heat production from cogeneration units, heat release from thermal energy storage, and purchases of heat from textile industry users. Thermal energy outputs include charging of thermal energy storage and thermal energy sales to textile industry users. VPPO’s steam energy inputs comprise steam production from electrode industrial steam boilers, steam release from SA, and steam purchases from textile industry users. Steam energy outputs include steam charging into SA and steam sales to textile industry users. The power balance is shown in Equations (16)–(18):
P e , t bg + P e , t CHP + P e , t VPPOdis + P e , t bu = P e , t HP + P e , t ESB _ VPPO + P e , t VPPOcha + P e , t su + P e , t sg
P h , t HP + P h , t CHP + P h , t VPPOdis + P h , t bu = P h , t VPPOcha + P h , t su
Q t ESB _ VPPO + Q s , t bu + M t VPPOSAdis h VPPOSAdis Δ t = Q s , t su + M t VPPOSAcha h VPPOSAcha Δ t

3.2. User-Level Optimal Dispatching Model

3.2.1. User-Level Objective Function

The user-level optimization and dispatching model minimizes the daily operational costs of textile industry users as its objective function.
min C u = i = 1 N C e , i + C h , i + C s , i + C g , i u
C e , i = t = 1 T ( λ e , t su P e , i , t ub λ e , t bu P e , i , t us )
C h , i = t = 1 T ( λ h , t su P h , i , t ub λ h , t bu P h , i , t us )
C s , i = t = 1 T ( λ s , t su Q s , i , t ub λ s , t bu Q s , i , t us )
C g , i u = t = 1 T λ gas V i , t GB
In Equations (19)–(23): C u represents the total cost of textile industry users; C e , i , C h , i , C s , i and C g , i u , respectively, represent the costs in yuan for textile industry user i to purchase or sell VPPO electricity, heat, steam, and natural gas.

3.2.2. Constraints on Purchasing and Selling Electricity, Heat, and Steam Power

Textile industry users cannot be in a buying and selling state simultaneously. There are maximum transaction volume constraints for buying and selling electricity, heat, and steam.
0 P e , i , t us ω e , i , t P e , max 0 P e , i , t ub ( 1 ω e , i , t ) P e , max
0 P h , i , t us ω h , i , t P h , max 0 P h , i , t ub ( 1 ω h , i , t ) P h , max
0 Q s , i , t us ω s , i , t Q s , max 0 Q s , i , t ub ( 1 ω s , i , t ) Q s , m a x
In Equations (24)–(26): ω e , i , t , ω h , i , t , ω s , i , t are binary variables ranging from 0 to 1, representing the buying and selling statuses of textile industry user i for electricity, heat, and steam during time period t. When ω e , i , t = 1 , the user sells electricity. Otherwise, the user buys electricity. When ω h , i , t = 1 , the user sells heat. Otherwise, the user buys heat. When ω s , i , t = 1 , the user sells steam. Otherwise, the user buys steam. The maximum values for buying and selling electricity, heat, and steam between VPPO and users are P e , max for electricity, P h , max for heat, and Q s , max for steam.
Considering the presence of nonlinear terms in Equations (23) and (24), a linearization of these equations is performed.
P e , i , t us 0 P e , i , t us x x P e , max ( 1 ω e , i , t ) M P e , i , t us P e , max P e , i , t us ω e , i , t M P e , i , t us ω e , i , t M P e , i , t ub 0 P e , i , t ub P e , max y y P e , max ( 1 ω e , i , t ) M P e , i , t us P e , max P e , i , t us ω e , i , t M P e , i , t us ω e , i , t M
P h , i , t us 0 P h , i , t us α α P h , max ( 1 ω h , i , t ) M P h , i , t us P h , max P h , i , t us ω h , i , t M P h , i , t us ω h , i , t M P h , i , t ub 0 P h , i , t ub P h , max β β P h , max ( 1 ω h , i , t ) M P h , i , t us P h , max P h , i , t us ω h , i , t M P h , i , t us ω h , i , t M
Q s , i , t us 0 Q s , i , t us δ δ Q s , max ( 1 ω s , i , t ) M Q s , i , t us Q s , max Q s , i , t us ω s , i , t M Q s , i , t us ω s , i , t M Q s , i , t ub 0 Q s , i , t ub Q s , max ε ε Q s , max ( 1 ω s , i , t ) M Q s , i , t ub Q s , max Q s , i , t ub ω s , i , t M Q s , i , t ub ω s , i , t M
In Equations (27)–(29): M is a sufficiently large number, and x , y , α , β , δ , ε are continuous variables.

3.2.3. User-Level Power Balance Constraint

The lower-level model primarily consists of textile industry users. Electrical energy input includes distributed photovoltaic generation P i , t PV , energy storage discharge, and purchasing from VPPO. Electrical energy output includes selling electricity to VPPO, base electrical load P e , i , t base , energy storage charging, electric boiler consumption for industrial steam, condenser consumption, and electricity demands of various production processes. Thermal energy input for textile industry users includes purchasing heat from VPPO, heating supplied by gas boilers, and heat release from thermal energy storage. Thermal energy output includes selling heat to VPPO, base thermal load P h , i , t base , thermal energy storage charging, and thermal requirements of various production processes. Steam energy input for textile industry users includes steam output provided by condensers to various processes, steam output directly supplied to ironing processes by electric industrial steam boilers, and steam energy release provided to various processes by SA. Steam energy output corresponds to steam requirements of various production processes.
P i , t PV + P e , i , t ub + P e , i , t Udis = P e , i , t base + P e , i , t us + P e , i , t Ucha + P i , t ESB + m = 1 N te 1 P i , m , t CON _ te 1 + n = 1 N pd 2 P i , n , t CON _ pd 2 + l = 1 N ir 3 P i , l , t CON _ ir 3 + D i e _ te 1 m = 1 N te 1 v i , m , t te 1 + D i e _ pd 2 n = 1 N pd 2 v i , n , t pd 2 + D i e _ ir 3 l = 1 N ir 3 v i , l , t ir 3
P h , i , t ub + P h , i , t Udis + Q i , t GB = P h , i , t base + P h , i , t us + P h , i , t Ucha + D i h _ te 1 m = 1 N te 1 v i , m , t te 1 + D i h _ pd 2 n = 1 N pd 2 v i , n , t pd 2 + D i h _ ir 3 l = 1 N ir 3 v i , l , t ir 3
m = 1 N te 1 ( Q i , m , t CONdis _ te 1 + M i , m , t SAdis _ te 1 h i , m , t SAdis _ te 1 Δ t ) + n = 1 N pd 2 ( Q i , n , t CONdis _ pd 2 + M i , n , t SAdis _ pd 2 h i , n , t SAdis _ pd 2 Δ t ) + l = 1 N ir 3 ( Q i , l , t CONdis _ ir 3 + M i , l , t SAdis _ ir 3 h i , l , t SAdis _ ir 3 Δ t + Q i , l , t ESB _ ir 3 ) = D i s _ te 1 m = 1 N te 1 v i , m , t te 1 + D i s _ pd 2 n = 1 N pd 2 v i , n , t pd 2 + D i s _ ir 3 l = 1 N ir 3 v i , l , t ir 3
In Equations (27)–(29): D i e _ te 1 , D i e _ p d 2 , D i e _ ir 3 represent the electricity demand of production processes for user i per unit time; D i e _ te 1 , D i e _ pd 2 , and D i e _ ir 3 , respectively, represent the heat demand of production processes for user i per unit time; D i s _ te 1 , D i s _ pd 2 , and D i s _ ir 3 , respectively, represent the steam demand of production processes for user i per unit time.

3.3. Solution Process

Based on the EMP algorithm package, utilizing the BARON solver within the GAMS environment, the Bi-level model described above is solved. The solving process of the textile-based virtual power plant constructed in this chapter to participate in the optimal dispatching strategy of grid-load interaction driven by energy price is shown in Figure 2.
Initially, input the electric, heat, and steam purchase and sale prices provided by VPPO to textile industry users. These initial energy prices enter the lower-level model with the objective of minimizing total operational costs for textile industry users. The model optimizes the actual purchase and sale strategies of electric, heat, and steam from VPPO, along with user gas purchase strategies and production plans. The optimized strategies for electric, heat, and steam purchases from VPPO are then transmitted to the upper-level model. The upper-level model aims to maximize VPPO revenue by optimizing the energy conversion equipment and dispatching plans. It updates the purchase and sale prices of electric, heat, and steam provided to textile industry users and feeds this information back to the lower-level model as model parameters. This iterative process continues to search for the optimal solution, ultimately determining the purchase and sale strategies of electric, heat, and steam that maximize VPPO revenue while minimizing user costs.

4. Constraints on the Operation of Various Types of Equipment

4.1. Modeling of Multi-Energy Coupling Devices by VPPO

4.1.1. Electrode Industrial Steam Boilers

The electrical–steam energy conversion constraints of electrode industrial steam boilers and the constraints on the high-temperature steam flow output from electrode industrial steam boilers are as follows [26].
Q t ESB = 3600 η ESB P t ESB Δ t
Q t ESB = M t ESB h ESB Δ t
In Equations (30) and (31), The electrical–steam energy conversion constraints of electrode industrial steam boilers include the output steam energy Q t ESB , input electrical power P t ESB and thermal efficiency η ESB ; M t ESB represents the steam flow output from the electrode industrial steam boiler at time t; h ESB represents the enthalpy value of the steam output from the electrode industrial steam boiler.

4.1.2. Steam Accumulator

VPPO and users can only buy and sell high-temperature steam, and the steam released by the SA is also high-temperature steam.
0 M t VPPOSAcha ω t VPPOcha M max VPPOSAcha 0 M t VPPOSAdis ω t VPPOdis M max VPPOSAdis ω t VPPOcha , ω t VPPOdis 0 , 1 S min VPPOSA S t VPPOSA S max VPPOSA S 1 VPPOSA = S τ VPPOSA S t VPPOSA = S t 1 VPPOSA + M t VPPOSAcha h VPPOSAcha Δ t M t VPPOSAdis h VPPOSAdis Δ t
In Equation (32), ω t VPPOcha and ω t VPPOdis are both binary variables ranging from 0 to 1. When ω t VPPOcha = 1 , SA injects steam; otherwise, it does not inject steam. When ω t VPPOdis = 1 , SA releases steam; otherwise, it does not release steam. M max VPPOSAcha , M max VPPOSAdis are maximum steam flow rates for SA’s steam charging and discharging; At time t, the remaining capacity S t VPPOSA is constrained by S min VPPOSA and S max VPPOSA . The remaining capacity of S 1 VPPOSA at the initial time is equal to the remaining capacity of S τ VPPOSA at the end of the optimization period; M t VPPOSAcha , M t VPPOSAdis , respectively, represent the steam inflow and outflow rates of electrode industrial steam boiler SA at time t; h VPPOSAcha , h VPPOSAdis , respectively, represent the enthalpy values of high-temperature steam intake and discharge for SA. Constraints on energy storage and thermal storage equipment are described here, while constraints on heat pump units and combined heat and power units are not discussed in detail.

4.2. Multi-Energy Coupling Equipment Model for Textile Industry Users

4.2.1. Electrode Industrial Steam Boiler for Users

Part of the steam sold by users is provided by electrode industrial steam boilers, and all steam purchased by users enters the outlet of electrode industrial steam boilers. Therefore, the modeling of electrode industrial steam boilers for textile industry users is as follows.
Q i , t ESB = 3600 η ESB P i , t ESB Δ t
Q i , t ESB = M i , t ESB h ESB Δ t
Q i , t ESB + Q s , i , t ub = Q i , t CONcha + Q i , t SAcha + l = 1 N ir 3 Q i . l , t ESB _ ir 3 + Q i , t ESB VPPO
Q i , t SAcha = M i , t SAcha h SAcha Δ t
Q i , t CONcha = M i , t CONcha h CONcha Δ t
Q i , l , t ESB _ ir 3 = M i , l , t ESB _ ir 3 h ESB _ ir 3 Δ t
Q i , t ESB VPPO = M i , t ESB VPPO h ESB VPPO Δ t
0 P i , t ESB P i , max ESB
0 M i , t ESB M i , max ESB
In Equations (33)–(41), At time t, the steam output energy of electrode industrial steam boilers Q i , t ESB depends on the electrical power input P i , t ESB ; M i , t ESB represents the steam flow rate outputted by user i’s electrode industrial steam boiler at time t; The steam energy purchased at the outlet of electrode industrial steam boilers by user i is Q s , i , t ub , which represents the steam energy purchased by user i; The steam energy sold by electrode industrial steam boilers Q i , t ESB VPPO depends on the steam flow rate M i , t ESB VPPO . Since the outlet high-temperature steam temperature of electrode industrial steam boilers is constant, h ESB VPPO remains constant; Q i , t CONcha , M i , t CONcha , respectively, represent the steam energy input to the condenser by user i’s electrode industrial steam boiler and the steam flow rate at time t; the steam energy input to the SA by user i’s electrode industrial steam boiler and the steam flow rate at time t are Q i , t SAcha and M i , t SAcha ; Q i , l , t ESB _ ir 3 , M i , l , t ESB _ ir 3 represent the steam energy and steam flow rate directly delivered by user i’s electrode industrial steam boiler to the l-th ironing process production line at time t; P i , max ESB is the upper limit of the input electrical power for user i’s electrode industrial steam boiler, and M i , max ESB is the upper limit of the steam flow rate output for user i’s electrode industrial steam boiler.

4.2.2. User’s Condenser

The energy balance constraints on condenser input, the relationship between the steam energy delivered by each process’s condenser and the electrical power consumed by the condenser, the output steam energy balance constraints, the enthalpy (temperature) constraints on steam delivered to each process, and the constraints on output steam flow rate can be expressed as:
Q t CON = Q t CONcha + 3600 ( m = 1 N te 1 P m , t CON _ te 1 + n = 1 N pd 2 P n , t CON _ pd 2 + l = 1 N ir 3 P l , t CON _ ir 3 ) Δ t
P m , t CON _ te 1 Δ t = Q m , t CONdis _ te 1 ( η e CON η s CON ) / 3600 P n , t CON _ pd 2 Δ t = Q n , t CONdis _ pd 2 ( η e CON η s CON ) / 3600 P l , t CON _ ir 3 Δ t = Q l , t CONdis _ ir 3 ( η e CON η s CON ) / 3600
Q t CON η s CON 1 + η e CON = m = 1 N te 1 Q m , t CONdis _ te 1 + n = 1 N pd 2 Q n , t CONdis _ pd 2 + l = 1 N ir 3 Q l , t CONdis _ ir 3
Q m , t CONdis _ te 1 = M m , t CON _ te 1 h m , t CON _ te 1 Δ t Q n , t CONdis _ pd 2 = M n , t CON _ pd 2 h n , t CON _ pd 2 Δ t Q l , t CONdis _ ir 3 = M l , t CON _ ir 3 h l , t CON _ ir 3 Δ t
m = 1 N te 1 M m , t CON _ te 1 + n = 1 N pd 2 M n , t CON _ pd 2 + l = 1 N ir 3 M l , t CON _ ir 3 M max CONdis
In Equations (42)–(46), The production lines of spinning, dyeing/printing, and ironing processes are denoted by m, n, and l; N te 1 , N pd 2 , and N ir 3 represent the quantities of production lines for spinning, dyeing/printing, and ironing processes, respectively; Q t CON represents the total energy input of the condenser at time t, kJ; Q t CONcha represents the steam energy input of the condenser at time t; P m , t CON _ te 1 , P n , t CON _ pd 2 , and P l , t CON _ ir 3 represent the electrical power required by the condenser at time t to supply steam to the production lines of spinning, dyeing/printing, and ironing processes; η e CON , η s CON represent the power consumption efficiency and heating efficiency of the condenser; Q m , t CONdis _ te 1 , Q n , t CONdis _ pd 2 , Q l , t CONdis _ ir 3 , M m , t CON _ te 1 , M n , t CON _ pd 2 , M l , t CON _ ir 3 , h m , t CON _ te 1 , h n , t CON _ pd 2 , and h l , t CON _ ir 3 , respectively, represent the steam energy, steam flow rate, and steam enthalpy delivered by the condenser to each production line of various processes at time t; the condenser’s maximum output steam flow rate is M max CONdis .

4.2.3. User’s Steam Accumulator

Part of the steam sold by textile industry users is provided by SA; therefore, the SA modeling for textile industry user i can be represented as:
0 M i , t SAcha ω i , t cha M i , max SAcha 0 m = 1 N te 1 M i , m , t SAdis _ te 1 + n = 1 N pd 2 M i , n , t SAdis _ pd 2 + l = 1 N ir 3 M i , l , t SAdis _ ir 3 ω i , t dis M i , max SAdis ω i , t cha , ω i , t dis 0 , 1 S i , min SA S i , t SA S i , max SA S i , 1 SA = S i , τ SA S i , t SA = S i , t 1 SA + M i , t SAcha h SAcha Δ t M i , t SA VPPO h SA VPPO Δ t ( m = 1 N te 1 M i , m , t SAdis _ te 1 h i , m , t SAdis _ te 1 + n = 1 N pd 2 M i , n , t SAdis _ pd 2 h i , n , t SAdis _ pd 2 + l = 1 N ir 3 M i , l , t SAdis _ ir 3 h i , l , t SAdis _ ir 3 ) Δ t
In Equation (47): Variables ω i , t cha and ω i , t dis are both binary (0–1) variables. When ω i , t cha = 1 , the SA charges steam for textile industry user i; otherwise, it does not charge steam. When ω i , t dis = 1 , the SA discharges steam for textile industry user i; otherwise, it does not discharge steam; The maximum charging and discharging steam flow rates of the SA for textile industry user i are M i , max SAcha and M i , max SAdis ; M i , m , t SAdis _ te 1 , M i , n , t SAdis _ pd 2 , M i , l , t SAdis _ ir 3 , h i , m , t SAdis _ te 1 , h i , n , t SAdis _ pd 2 and h i , l , t SAdis _ ir 3 represent the steam flow rate and steam enthalpy delivered by the SA to each process and production line of textile industry user i at time t; At time t, the remaining capacity S i , t SA for textile industry user i should be equal to its initial value; S i , min SA , S i , max SA , respectively, denote the minimum and maximum values of the remaining capacity of the SA for textile industry user i; S i , 1 SA , S i , τ SA represent the remaining capacity of SA for textile industry user i at the initial time and at the end of the optimization period; M i , t SA VPPO , h SA VPPO , respectively, represent the steam flow rate and steam enthalpy sold by the SA of textile industry user i at time t. Since the user sells isothermal steam, h SA VPPO remains constant [27].
Q i , t SA VPPO = M i , t SA VPPO h SA VPPO Δ t
Q s , i , t us = Q i , t ESB VPPO + Q i , t SA VPPO
The total steam energy sold by textile industry Q s , i , t us is the sum of the steam energy Q i , t SA VPPO sold by the SA and the steam flow rate Q i , t ESB VPPO .
Modeling the steam temperature boundary of the condensing unit for textile industry user i:
0.95 T s _ te 1 v m , t te 1 T m , t CON _ te 1 1.05 T s _ te 1 v m , t te 1 0.95 T s _ pd 2 v n , t pd 2 T n , t CON _ pd 2 1.05 T s _ pd 2 v n , t pd 2 0.95 T s _ ir 3 v l , t ir 3 T l , t CON _ ir 3 1.05 T s _ ir 3 v l , t ir 3
P m , t CON _ te 1 = e a b T m , t CON _ te 1 + c P n , t CON _ pd 2 = e a b T n , t CON _ pd 2 + c P l , t CON _ ir 3 = e a b T l , t CON _ ir 3 + c
h m , t CON _ te 1 = k 1 ( k 2 T m , t CON _ te 1 k 3 ) P m , t CON _ te 1 k 4 + ( k 5 T m , t CON _ te 1 + k 6 ) h n , t CON _ pd 2 = k 1 ( k 2 T n , t CON _ pd 2 k 3 ) P n , t CON _ pd 2 k 4 + ( k 5 T n , t CON _ pd 2 + k 6 ) h l , t CON _ ir 3 = k 1 ( k 2 T l , t CON _ ir 3 k 3 ) P l , t CON _ ir 3 k 4 + ( k 5 T l , t CON _ ir 3 + k 6 )
The modeling of the steam temperature boundary delivered by SA to each process is similar to the steam temperature boundary modeling of the condensing unit for textile industry user i mentioned above. Constraints on the operation of the gas boiler are not reiterated here.

5. Result Analysis

5.1. Basic Data

To validate the effectiveness of the optimal dispatching strategy for textile-based virtual power plants participating in grid-load interactions driven by energy price proposed in this paper, this section selects daily operational tasks and production equipment parameters from actual statistics of a textile enterprise in Jintan, Changzhou. Utilizing the EMP algorithm package and BARON solver within the GAMS environment, this study conducts simulation-based optimization analysis on the model. The bi-level model operates on a time scale of 1 h, with an overall scheduling horizon of 24 h. The bi-level model operates on a time scale of 1 h, with an overall scheduling horizon of 24 h. Time-of-use energy prices are shown in Table 1. VPPO sells electricity to the external grid at 50% of the purchase price and purchases natural gas at a rate of 3.7 yuan/m3, with a lower heating value of 9.97 kWh/m3.
To validate the effectiveness of the bi-level dispatching strategy, two scenarios are compared based on various energy price settings. The scenarios are as follows:
S1: VPPO sells electricity, heat, and steam energy to users at time-of-use energy prices;
S2: VPPO sells electricity, heat, and steam energy to users at real-time energy prices.
In scenario S1, multiple energy prices are based on time-of-use energy prices, with specific time intervals as detailed in Table 1. Given the widespread implementation of time-of-use electricity pricing, time-of-use energy prices extend this concept by dividing multiple energy prices into peak, off-peak, and valley periods to guide user energy consumption behavior. In scenario S2, multiple energy prices are based on real-time energy prices, where energy prices generally vary at each moment in time.

5.2. Strategy Results Analysis

The profits of VPPO within industrial park under different scenarios, total daily operating costs for textile industry users, and overall economic costs of the industrial park are shown in Table 2.
Comparing the VPPO earnings, total daily operating costs for textile industry users, and overall economic costs of the VPP between scenarios S1 and S2 as depicted in Table 3, the VPPO earnings in scenario S2 increased by 87.5% compared to scenario S1. The total operating costs for textile industry users rose by 1.51%, while the overall economic costs of the VPP decreased by 4.13% in scenario S2. This is attributed to the fact that in scenario S2, the VPPO multi-energy prices were generally higher than in S1, leading to increased VPPO earnings but also contributing to higher total operating costs for textile industry users. Additionally, in scenario S2, textile industry users reduced their energy purchases during peak pricing periods and increased purchases during off-peak periods, resulting in lower overall economic costs for the VPP. This demonstrates that the energy pricing strategy proposed in this paper effectively enhances the overall economic performance of VPP targeted at industrial parks, thereby improving energy utilization efficiency.
Comparing the operating costs of three textile industry users under scenarios S1 and S2 as shown in Table 3, the operating costs for the three textile industry users in scenario S2 increased by 0.646%, 1.658%, and 1.926%, respectively, compared to scenario S1. This is due to Textile Industry User 1 having the highest output from distributed photovoltaics and concurrently the highest SA capacity, resulting in the smallest increase in operating costs for User 1 among the three. Users 2 and 3 have similar levels of distributed photovoltaic output, with User 2 having slightly higher SA capacity than User 3, contributing to slightly better economic performance for User 2 than User 3. This illustrates that the installed capacity of new energy sources and SA capacity significantly impact the operating costs of textile industry users, with higher capacities leading to lower operating costs.

5.3. Analysis of Energy Trading Outcomes

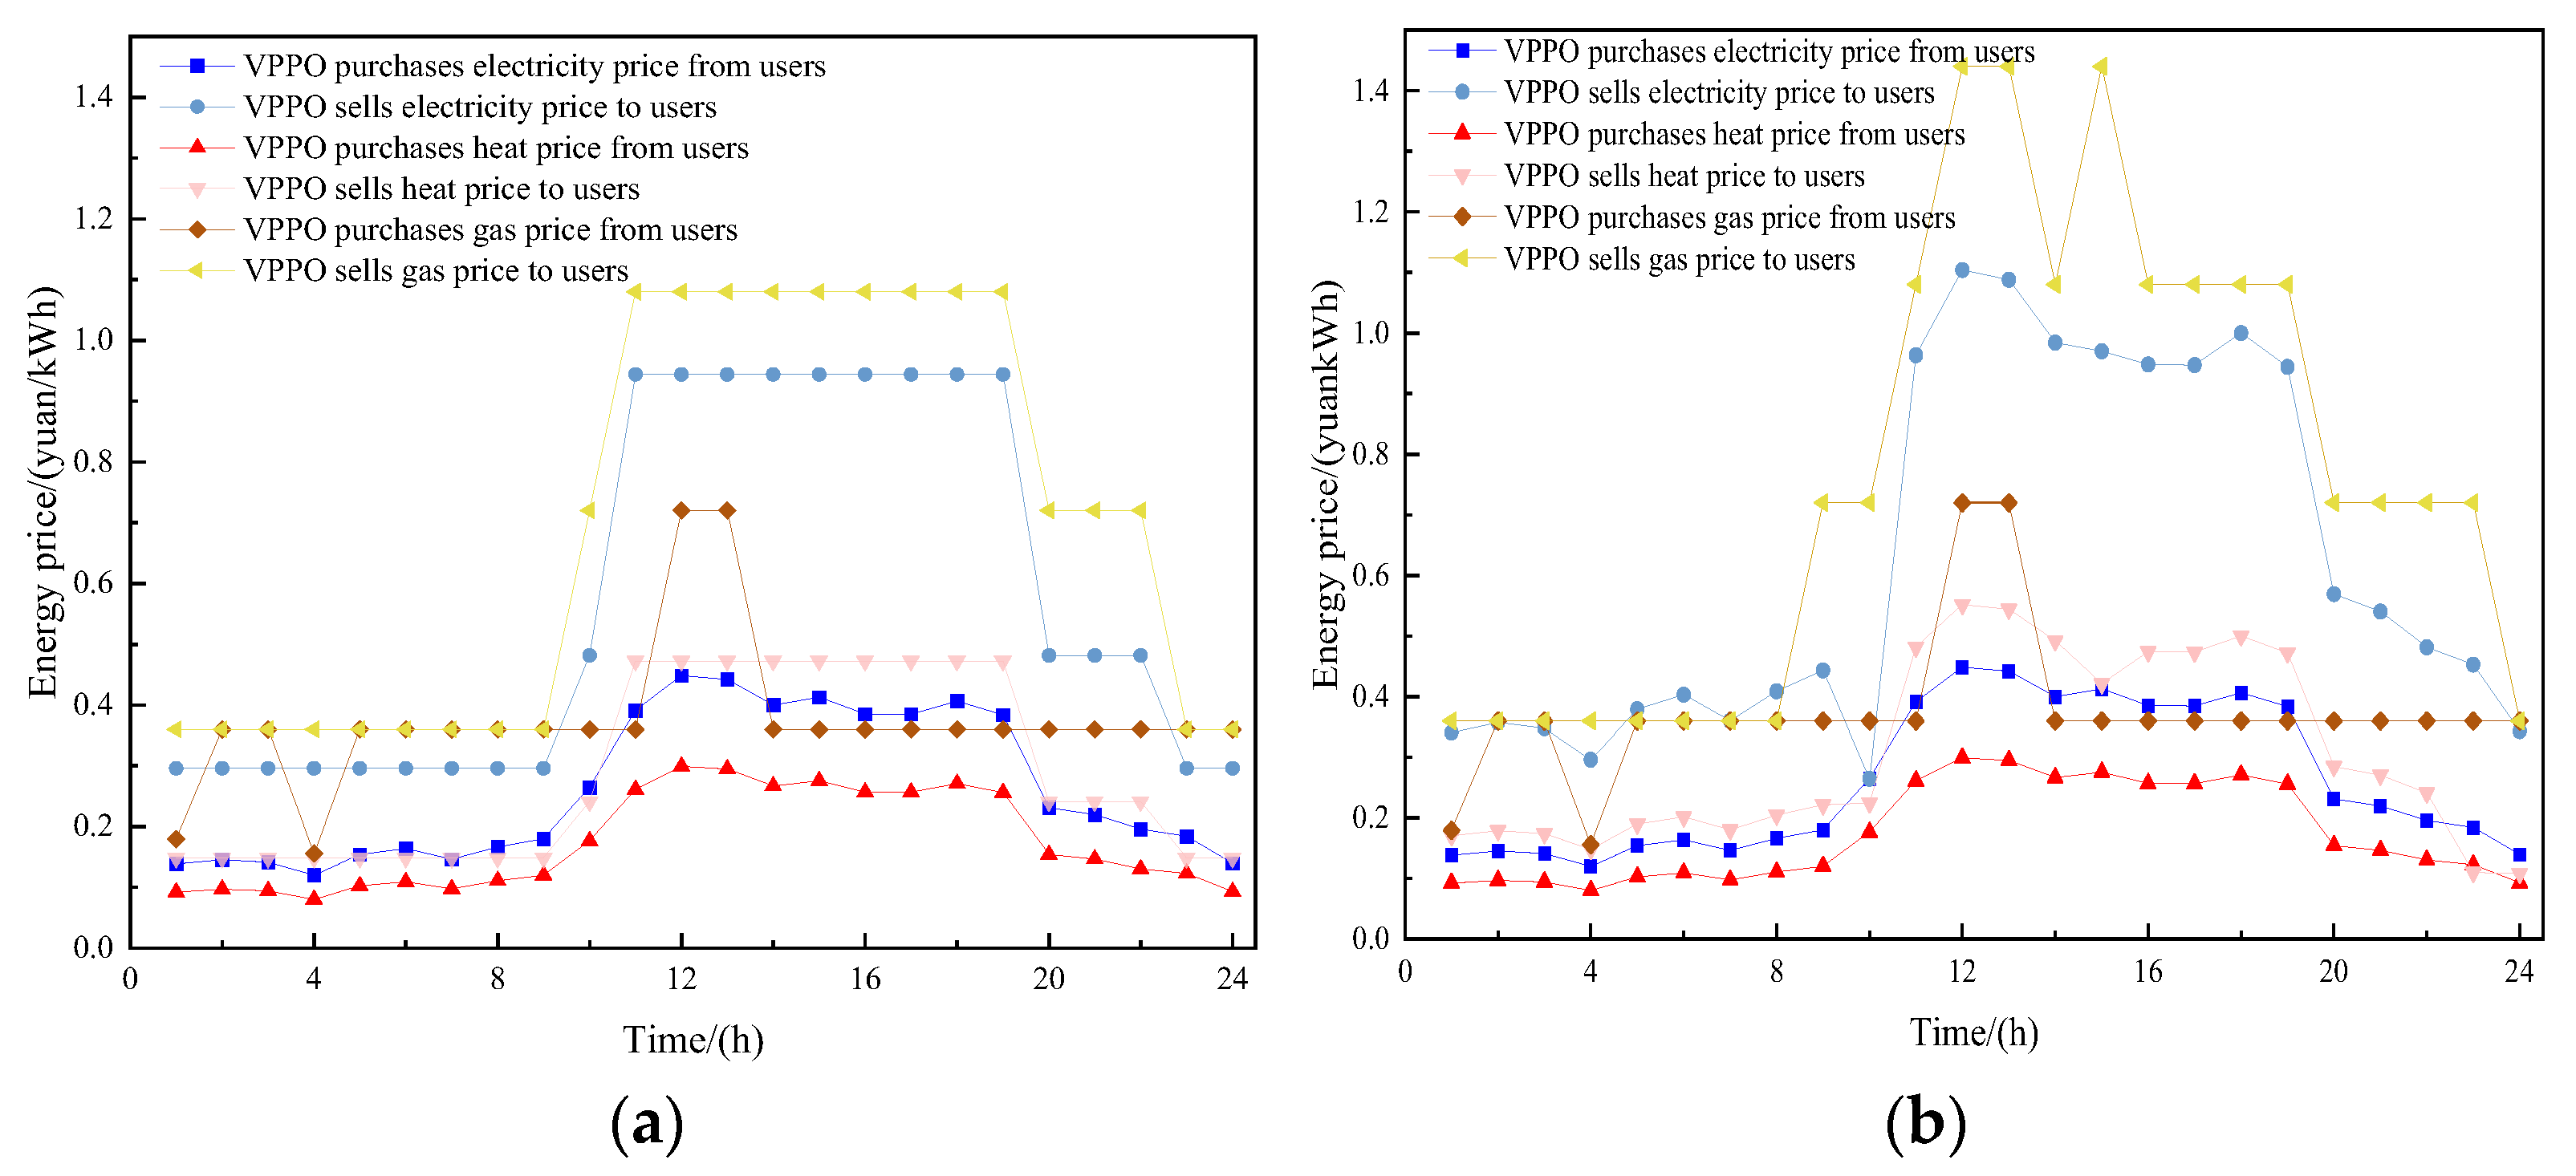
In scenarios S1 and S2, the pricing results of VPPO for textile industry users are depicted in Figure 3 and Figure 4.
Figure 4 and Figure 5, respectively, depict the electricity trading patterns between VPPO and textile industry users in scenarios S1 and S2. From the figures, it is evident that the textile industry users predominantly sell electricity during the high solar output period from 8:00 to 16:00. During the peak period from 11:00 to 19:00, compared to scenario S1, VPPO in scenario S2 sell electricity at higher prices, resulting in lower sales volume by VPPOs and lower electricity purchase by users. Textile industry User 3, with limited SA capacity, purchases significant amounts of electricity to produce steam during the 11:00 to 13:00 period to meet production demands. In contrast, during the off-peak period from 1:00 to 5:00, VPPO in scenario S2 sell electricity at lower prices compared to S1, leading to higher electricity purchases by users and lower sales volume by VPPO. Textile industry User 1 purchases substantial amounts of electricity during this period for production purposes. These observations demonstrate that the proposed bi-level optimization dispatching method under time-of-use energy pricing effectively encourages adjustments in electricity purchasing plans for textile industry users.
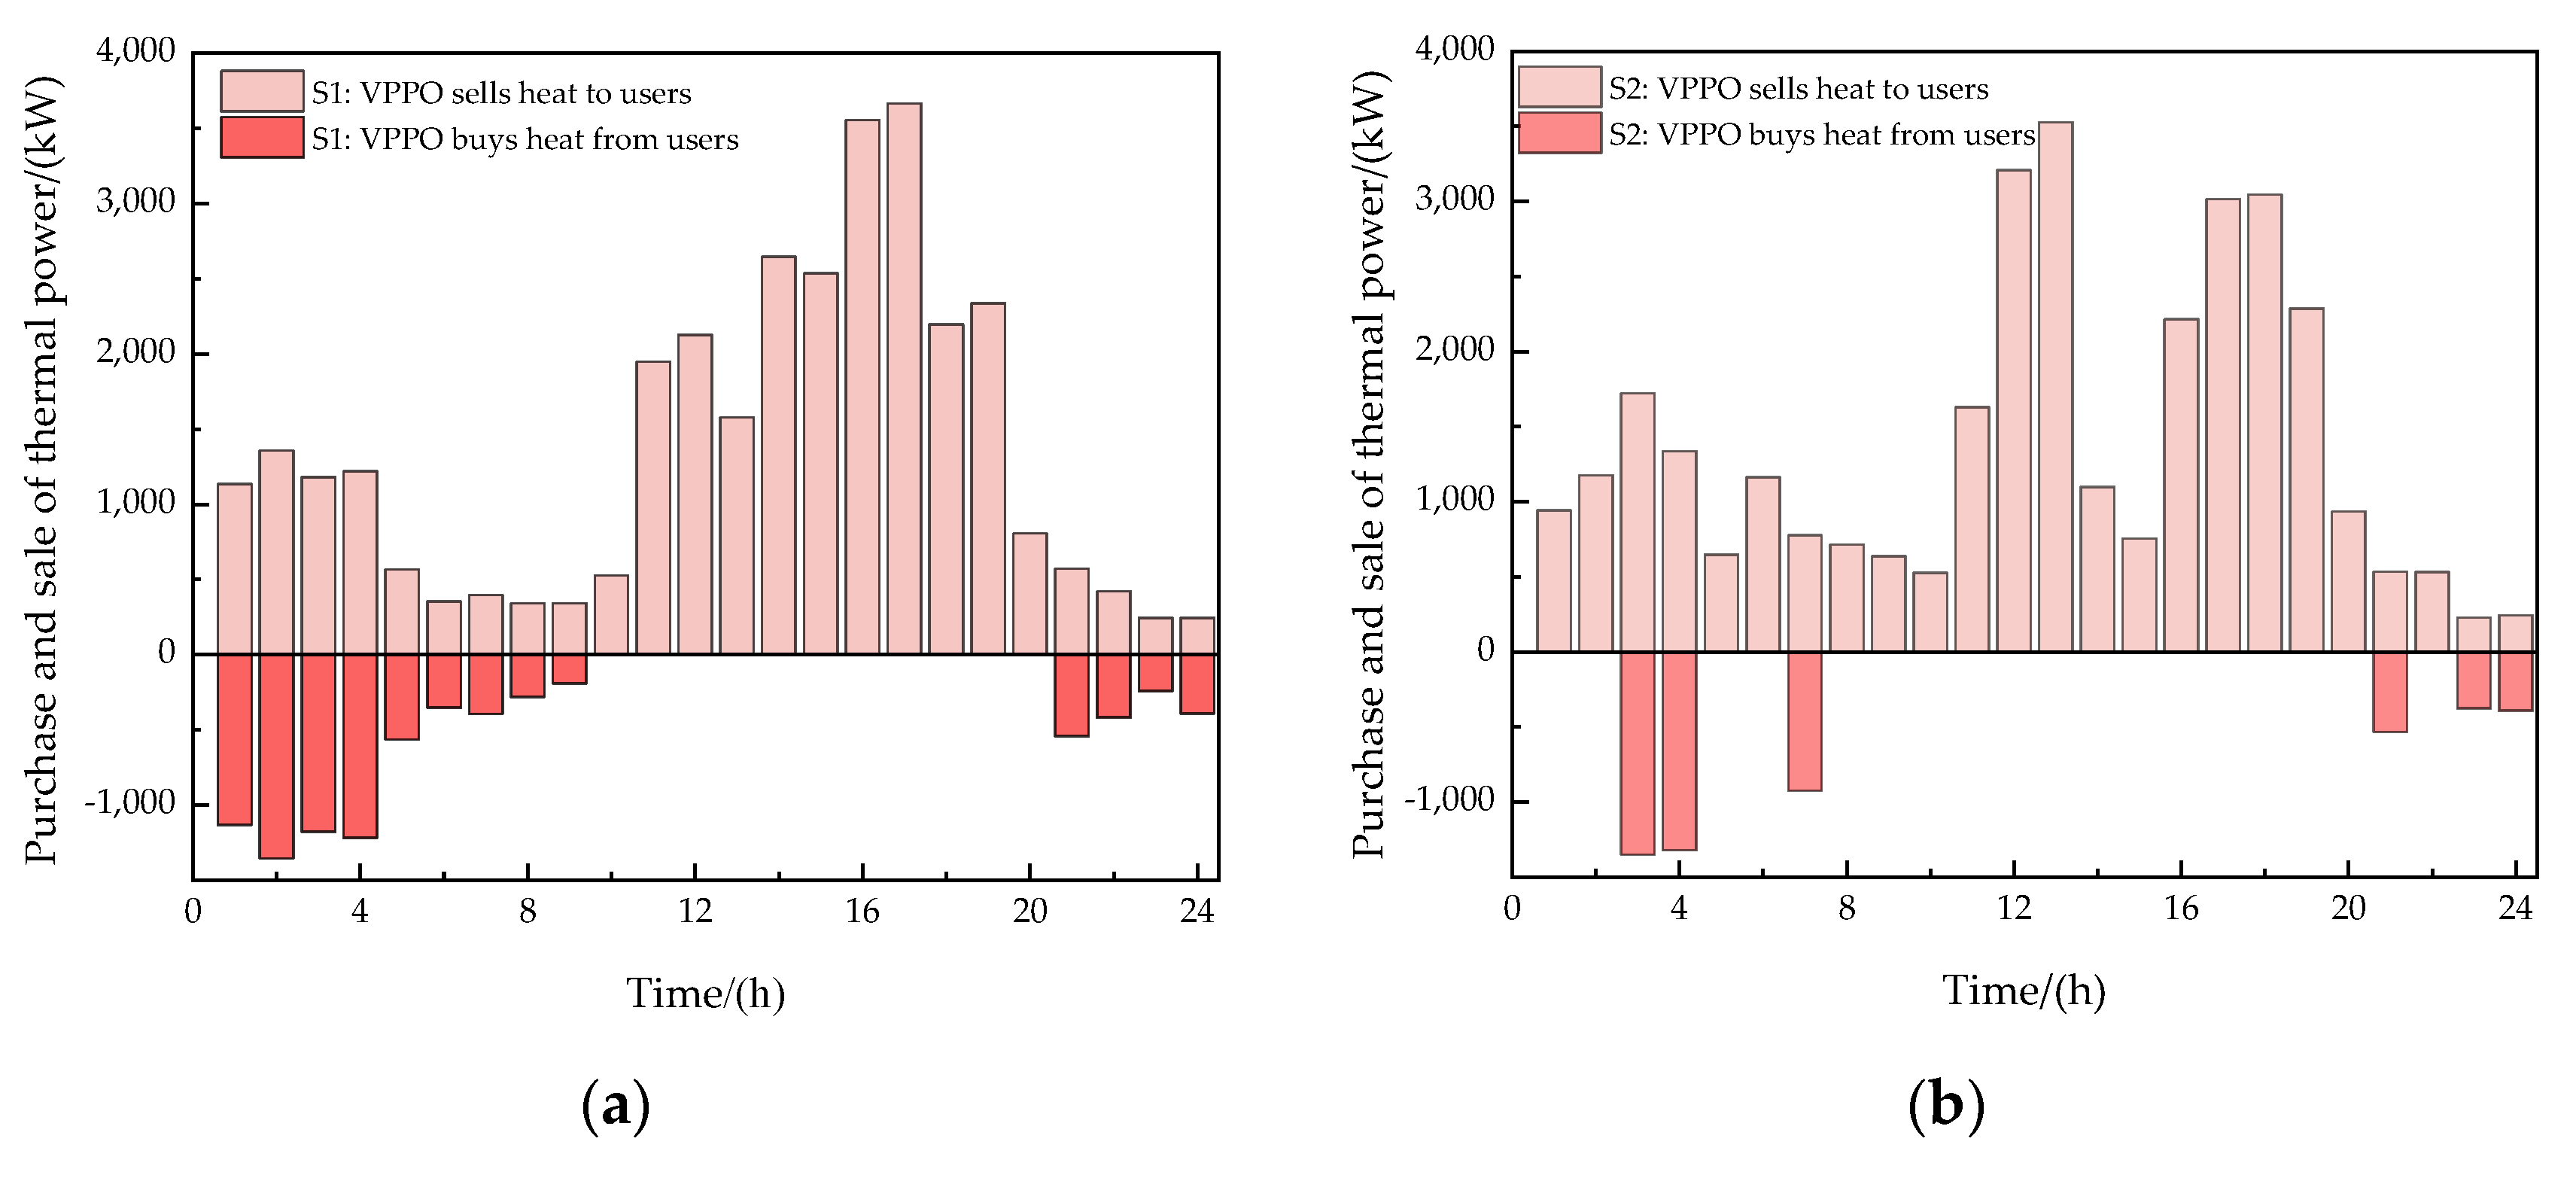
Figure 6 and Figure 7 depict the heat trading patterns between VPPO and textile industry users in scenarios S1 and S2, respectively. A comparison reveals that there is minimal variation in the total heat sold by VPPO between scenarios S1 and S2. However, VPPO in scenario S2 shows significantly reduced heat purchases. This is because during peak periods in scenario S2, electricity prices are higher, prompting VPPO to utilize CHP units to generate electricity while producing substantial amounts of heat. Consequently, VPPO in scenario S2 exhibit lower heat purchase volumes. Additionally, based on the electricity selling prices by VPPOs as depicted in Figure 5, which influences the timing of industrial production schedules, the heat purchase volumes for textile industry users 1 and 3 in scenario S2, as shown in Figure 7, also shift compared to scenario S1, concentrating during off-peak hours.
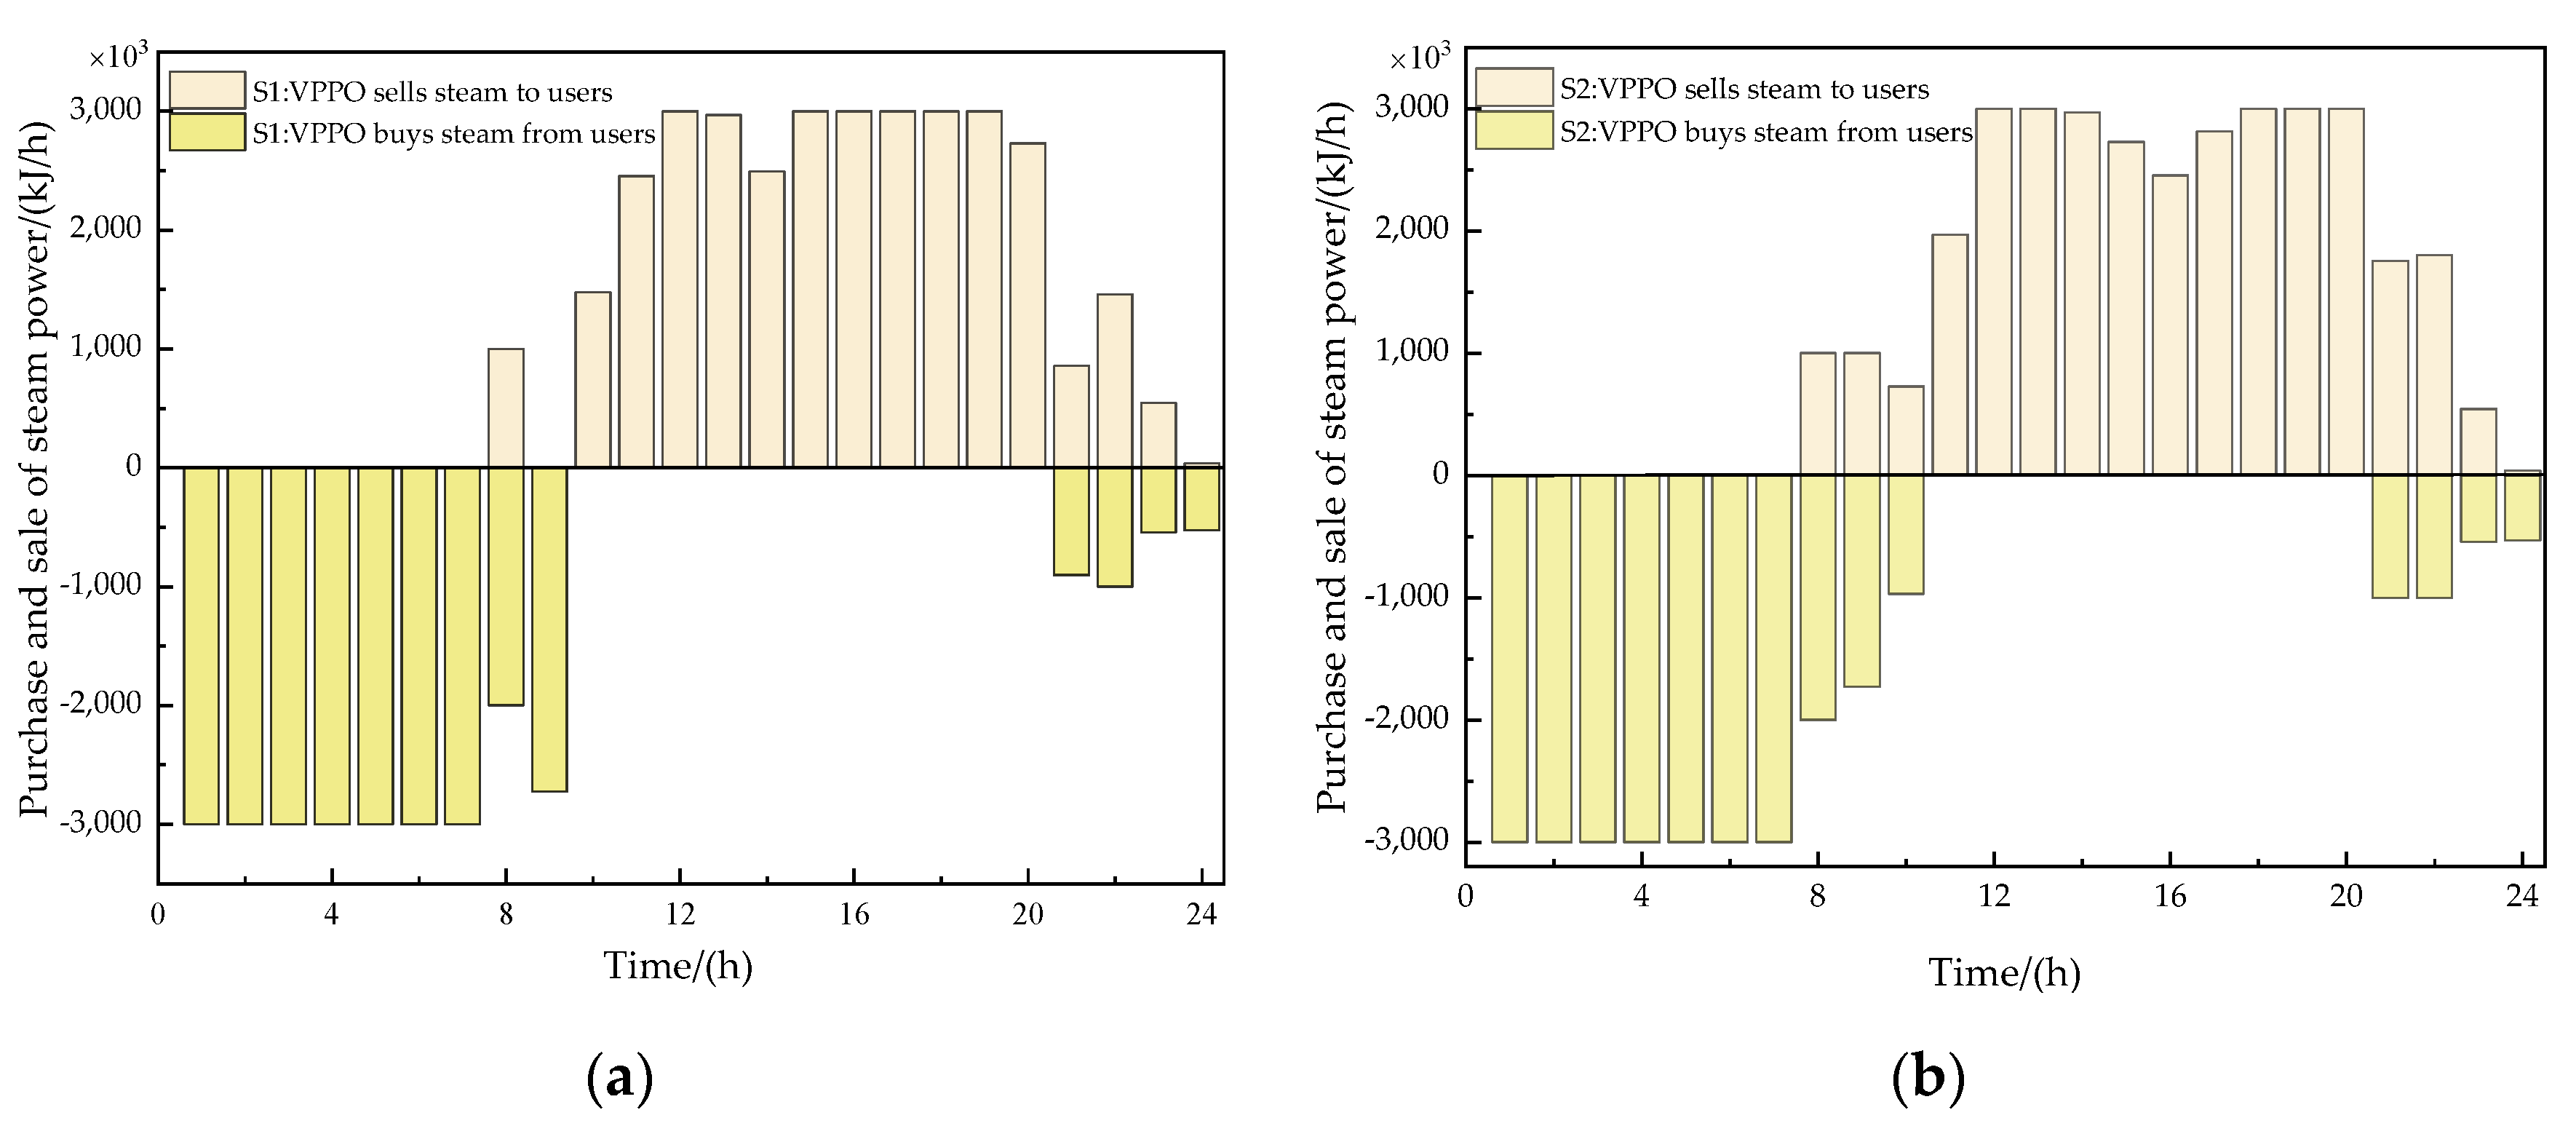
Figure 8 and Figure 9, respectively, illustrate the steam trading patterns between VPPO and textile industry users in scenarios S1 and S2. Comparing Figure 8 and Figure 9, during the 11:00 to 19:00 period in scenario S2, VPPO significantly reduce their steam sales compared to scenario S1. This reduction is attributed to the increase in steam prices during this period due to the surge in electricity prices, leading to decreased steam purchases by textile industry users. Additionally, the steam sales volume increases for textile industry User 1 and User 2 in scenario S2. This is because User 2 has a smaller SA capacity, while User 1 has a larger SA capacity, allowing them to increase their economic benefits through the proposed strategies.

5.4. Analysis of Optimal Dispatching Results

In scenario S2, the optimized dispatching results for VPPO regarding electricity, heat, and steam are depicted in Figure 10. From the figure, it is evident that VPPO achieve multi-energy power balance constraints for electricity, heat, and steam.
Photovoltaic generation is the primary source of internal electricity within the VPPO. As shown in Figure 10 for electric power, VPPO primarily sources electricity from the grid and CHP units. During off-peak electricity price periods, VPPO purchases electricity from the grid, while during peak periods, it utilizes gas and the CHP units to supplement power supply. VPPO’s electricity consumption mainly involves selling electricity to textile industry users, with its electrode industrial steam boilers and heat pumps predominantly operating during off-peak electricity price periods. Energy storage systems charge during off-peak periods and discharge during peak periods, thereby enhancing VPPO’s electricity revenue. As depicted in Figure 10 for heat power, VPPO’s heat sources primarily involve heat pumps for heating during off-peak electricity price periods and purchasing heat for textile industry users. During peak electricity price periods, energy conversion from gas to heat is facilitated through CHP units as an energy substitution measure. Regarding steam power, as shown in Figure 10, VPPO utilizes electrode industrial steam boilers to produce steam during off-peak electricity price periods. Simultaneously, it purchases steam from textile industry users, storing the obtained steam in SA. During peak electricity price periods, steam is released from SA and sold to textile industry users. The operational status of SA for each textile industry user is illustrated in Figure 11.

6. Conclusions

This paper proposes an optimal dispatching strategy for textile-based virtual power plants participating in grid-load interactions driven by energy price. The results are as follows:
(1) In the bi-level optimization strategy proposed in this paper, compared to VPPO selling electricity at peak, flat, and off-peak multi-energy prices, VPPO’ profits increased by 87.5% under real-time energy prices. Total operating costs for textile industry users increased by 1.51%. Meanwhile, the overall economic costs of the VPP decreased by 4.13%, effectively enhancing the overall economic viability of the VPP.
(2) Under the guidance of real-time energy prices set by the VPP, users adjusted their energy consumption behaviors by shifting energy purchase times to off-peak periods. This adjustment facilitated production planning and the transfer of multi-energy loads, resulting in smoother fluctuations in demand for textile industry users.
(3) The operating costs of textile industry users are related to the capacity of SA. Textile industry user 1 has the highest SA capacity, while user 3 has the lowest. Under real-time energy prices, the operating costs for these three textile industry users increased by 0.646%, 1.658%, and 1.926%, respectively. This indicates that the size of SA capacity affects the economic viability of textile industry users; higher SA capacity leads to lower operating costs for textile industry users.

Author Contributions

Supervision, T.C. and C.L.; methodology, M.L.; data curation, Y.X.; writing—original draft preparation, M.D. and M.L.; writing—review and editing, H.Y. and X.D. All authors have read and agreed to the published version of the manuscript.

Funding

This research was funded by State Grid Changzhou Power Supply Company, “Research on the Economic and Multi-Scenario Applications of Electric-Thermal Synergy Control Technology Considering Steam Equivalent Energy Storage Characteristics”, grant number SGJSCZ00KJJS2312263.

Data Availability Statement

The data presented in this study are available on request from the corresponding author due to legal and privacy reasons.

Conflicts of Interest

Authors Tingyi Chai, Chang Liu and Yichuan Xu were employed by the company Changzhou Power Supply Branch, State Grid Jiangsu Electric Power Co., Ltd. The remaining authors declare that the research was conducted in the absence of any commercial or financial relationships that could be construed as a potential conflict of interest.

References

  1. Xu, C.; Guan, Y. Cluster Convergence: Pioneering the Future -Symposium on Advancing the Modernization of Textile Industry Clusters. Text. Appar. Wkly. 2024, 10, 21. [Google Scholar]
  2. Liu, J.; Peng, J.; Deng, J.; Liu, S. Two-stage Robust Optimization-based Economic Dispatch of Virtual Power Plants Considering Cogeneration. J. Syst. Simul. 2023, 35, 1799–1813. [Google Scholar]
  3. Bhuiyan, E.A.; Hossain, M.Z.; Muyeen, S.M. Towards Next Generation Virtual Power Plant: Technology Review and Frameworks. Renew. Sustain. Energy Rev. 2021, 150, 111358. [Google Scholar] [CrossRef]
  4. Gao, C. Conceptual reflection on virtual power plants. Distrib. Util. 2023, 40, 2–6. [Google Scholar]
  5. Xie, B.; Zhang, L.; Hao, P. Real-time Pricing Demand Response Mechanism of Virtual Power Plant Based on Stackelberg Game. Chin. J. Manag. Sci. 2024, 1–18. [Google Scholar] [CrossRef]
  6. Tao, W.; Ai, Q.; Li, X. Research Status and Prospects of Collaborative Dispatching and Market Trading of Virtual Power Plants. South Power Syst. Technol. 2024, 1–15. Available online: http://kns.cnki.net/kcms/detail/44.1643.tk.20240318.1018.008.html (accessed on 27 September 2024).
  7. Hao, J.; Huang, T.; Xu, Q.; Sun, Y. Virtual power plant multi-objective optimal dispatching strategy with multiple energy suppliers. Distrib. Util. 2023, 40, 32–42. [Google Scholar]
  8. Li, B.; Gu, C.; Du, J.; Tian, K.; Chen, S. Virtual power plant resource dispatching optimization strategy considering electrothermal conversion. Distrib. Util. 2023, 40, 16–21. [Google Scholar]
  9. Yu, H.; Lu, W.; Tang, L.; Zhang, Y.; Zou, X. Economic dispatch and profit distribution strategy for multi-agent virtual power plants considering risk preference. Integr. Intell. Energy 2024, 46, 66–77. [Google Scholar]
  10. Liao, S.; He, C.; Li, L.; Xu, J.; Sun, Y. Solution Method of Regulatory Boundary for Industrial Park Type Virtual Power Plant Considering Power Network Constraints. Autom. Electr. Power Syst. 2024, 48, 66–75. [Google Scholar]
  11. Wang, J.; Shen, X.; Xu, Y. Ancillary service for frequency regulation based on multi-energy virtual power plant aggregating factory load. In Proceedings of the 11th IET International Conference on Advances in Power System Control, Operation and Management (APSCOM 2018), Hong Kong, China, 11–15 November 2018. [Google Scholar]
  12. Yu, S.; Zhang, J.; Yuan, Z.; Fang, F. Resilience Enhancement Strategy of Combined Heat and Power-Virtual Power Plant Considering Thermal Inertia. Power Gener. Technol. 2023, 44, 758–768. [Google Scholar]
  13. Jiang, Z.; Zhang, F.; Hu, F.; Sun, Y.; Jiang, W. Evaluation method of aggregated responsiveness of distributed resources in virtual power plant. Electr. Power Eng. Technol. 2022, 41, 39–49. [Google Scholar]
  14. Zhang, N.; Zhu, H.; Yang, L.; Hu, C. Optimal Dispatching Strategy of Multi-Energy Complementary Virtual Power Plant Considering Renewable Energy Consumption. Power Gener. Technol. 2023, 44, 625–633. [Google Scholar]
  15. Wang, J.; Niu, Y.; Chen, Y.; Du, M. Master-slave game optimal dispatching of virtual power plant. Electr. Power Autom. Equip. 2023, 43, 235–242. [Google Scholar]
  16. Li, Q.; Zhu, D.; Huang, D.; Wu, S.; Yang, Y. Stackelberg game pricing strategy between virtual power plant operators and electric vehicle users. Electr. Power Eng. Technol. 2022, 41, 183–191. [Google Scholar]
  17. Cang, H.; Liu, H. Economic research on virtual power plant source-load coordination based on electricity price linkage. Mod. Electron. Tech. 2022, 45, 149–155. [Google Scholar]
  18. Qiang, L.; Jiale, T.; Ke, Z. Pricing Strategy for a Virtual Power Plant Operator with Electric Vehicle Users Based on the Stackelberg Game. World Electr. Veh. J. 2023, 14, 72. [Google Scholar] [CrossRef]
  19. Li, Q.; Zhou, Y.C.; Wei, F.C. Multi-time scale dispatching for virtual power plants: Integrating the flexibility of power generation and multi-user loads while considering the capacity. Appl. Energy 2024, 362, 122980. [Google Scholar] [CrossRef]
  20. Zhang, Y. On Low-Carbon Optimization Operation of Integrated Energy Systems Considering Hydrogen Energy Coupling and Master-Slave. Master’s Thesis, Nanchang University, Nanchang, China, 2023. [Google Scholar]
  21. Ehsan, H.-F.; Saeed, H.; Seifeddine, B.-E. Virtual Power Plant Operational Strategies: Models, Markets, Optimization, Challenges, and Opportunities. Sustainability 2022, 14, 12486. [Google Scholar] [CrossRef]
  22. Hua, Y.; Wang, Y.; Bai, H.; Han, D.; Pu, F. Interval master-slave game optimal dispatching of virtual power plant with electric vehicle. Therm. Power Gener. 2022, 51, 163–170. [Google Scholar]
  23. Tang, F. Optimal Dispatching of Combined Heat and Power of Virtual Power Plant Based on Hybrid Energy Storage. Master’s Thesis, North China Electric Power University, Beijing, China, 2021. [Google Scholar]
  24. Liang, A.; Zeng, S.; Ren, J.; Zhang, X.; Cao, F. Intelligent Operation Dynamic Characteristics of Heat Pump System in Integrated Electric-thermal Cooperative Grid Based on Game Optimization Algorithm. J. Refrig. 2024, 45, 109–111. [Google Scholar]
  25. Sun, W.; Wu, J.; Zhang, Q. Coordinated optimization of a distribution network and multi-integrated energy microgrid based on a double-layer game. Power Syst. Prot. Control 2024, 52, 26–38. [Google Scholar]
  26. Maddah, H.; Sadeghzadeh, M.; Ahmadi, M.H.; Kumar, R.; Shamshirband, S. Modeling and Efficiency Optimization of Steam Boilers by Employing Neural Networks and Response-Surface Method (RSM). Mathematics 2019, 7, 629. [Google Scholar] [CrossRef]
  27. Bai, Z.; Miao, C.; Wang, W.; Sun, F.; Zhang, P. The Value of Thermal Storage Technology in Integrated Energy System. Distrib. Util. 2019, 36, 20–26. [Google Scholar]
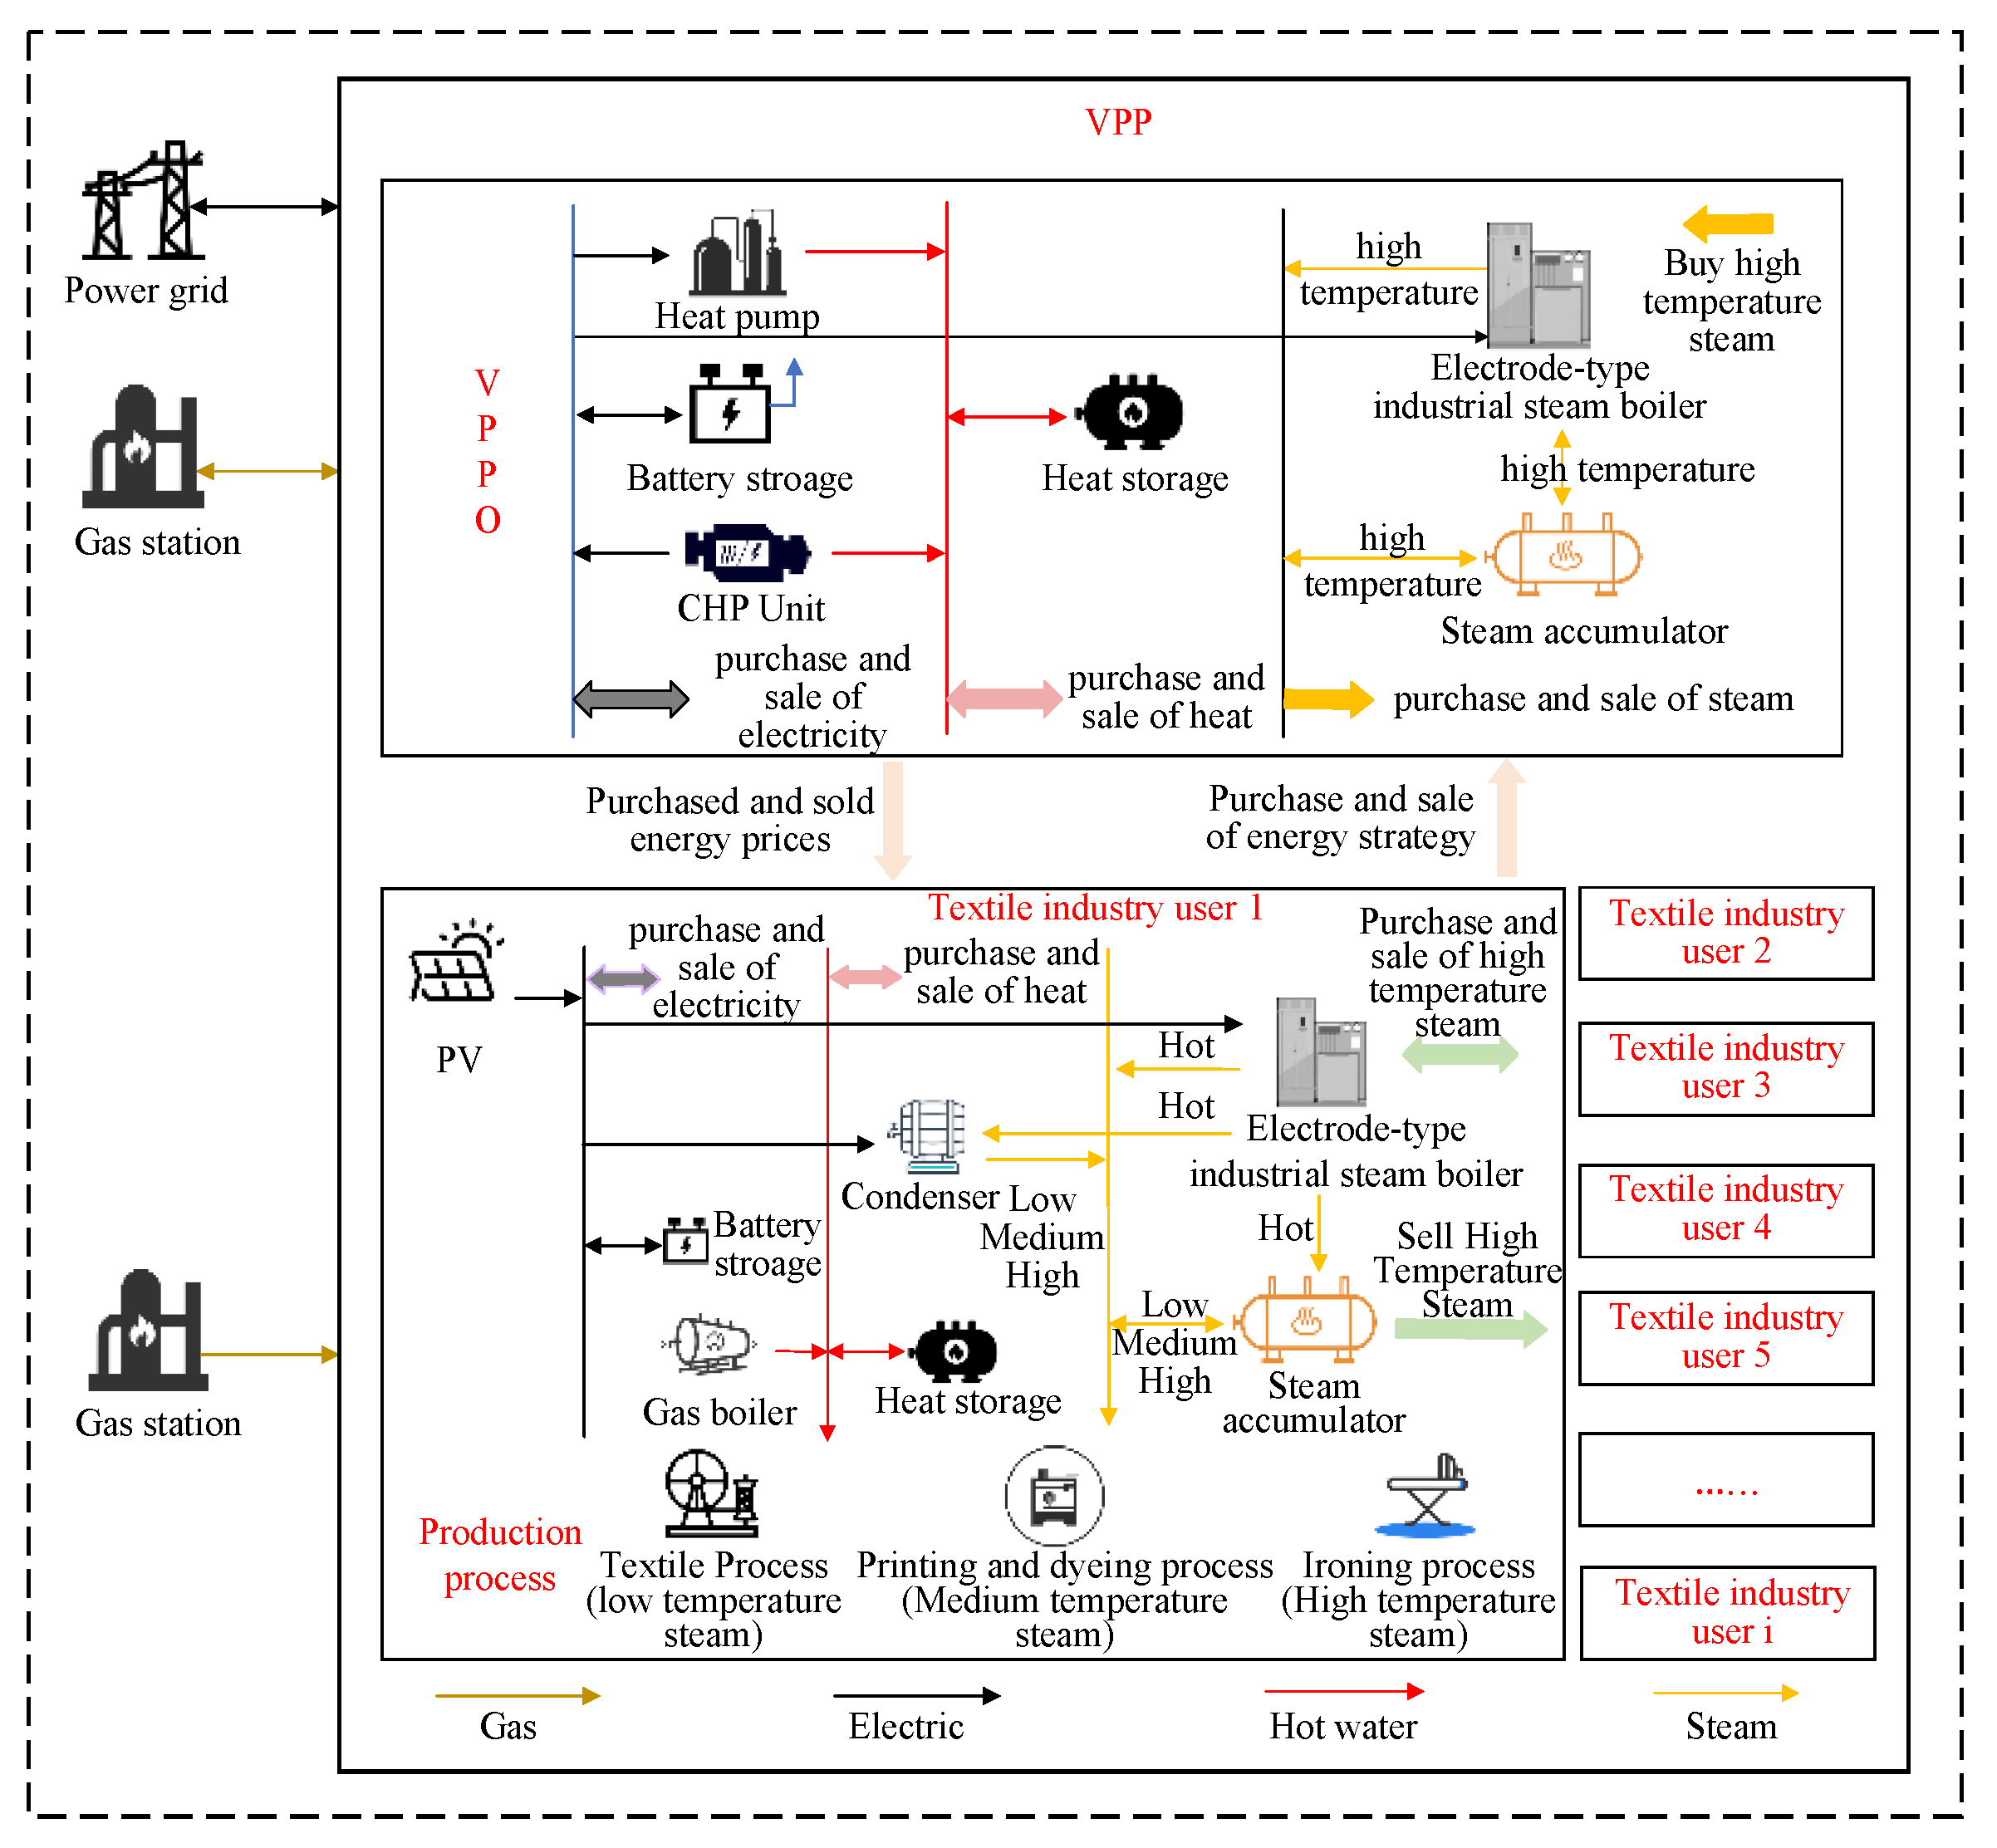
Figure 1. The overall structure of the VPP.
Energies 17 05142 g001
Figure 2. Solving process.
Energies 17 05142 g002
Figure 3. VPPO energy price under scenario S1 and S2. (a) S1 scenario VPPO trades energy prices. (b) S2 scenario VPPO trades energy prices.
Energies 17 05142 g003
Figure 4. Purchase and sale electricity strategy of VPPO under scenario S1 and S2. (a) S1 scenario VPPO trades electrical power. (b) S2 scenario VPPO trades electrical power.
Energies 17 05142 g004
Figure 5. Purchase and sale electricity strategy of users under scenario S1 and S2. (a) S1 scenario user trades electrical power. (b) S2 scenario user trades electrical power.
Energies 17 05142 g005
Figure 6. Purchase and sale heat strategy of VPPO under scenario S1 and S2. (a) S1 scenario VPPO trades thermal power. (b) S2 scenario VPPO trades thermal power.
Energies 17 05142 g006
Figure 7. Purchase and sale heat strategy of users under scenario S1 and S2. (a) S1 scenario users trade thermal power. (b) S2 scenario users trade thermal power.
Energies 17 05142 g007
Figure 8. Purchase and sale steam strategy of VPPO under scenario S1 and S2. (a) S1 scenario VPPO trades steam power. (b) S2 scenario VPPO trades steam power.
Energies 17 05142 g008
Figure 9. Purchase and sale steam strategy of VPPO under scenario S1 and S2. (a) S1 scenario users trade steam power. (b) S2 scenario users trade steam power.
Energies 17 05142 g009
Figure 10. Multi-energy balance diagram of VPPO.
Energies 17 05142 g010
Figure 11. SA operation of each user.
Energies 17 05142 g011
Table 1. The time interval division of time-of-use energy price.
Time IntervalTime Range
Peak period11:00~19:00
off-peak period10:00, 20:00~22:00
valley period1:00~9:00, 23:00~24:00
Table 2. Comparison of VPPO profits, total operating costs of industrial users and overall economic cost of VPP under two scenarios.
ScenarioVPPO Earnings/(yuan)Total Operating Costs for Textile Industry Users/(yuan)Overall Economic Costs of the VPP/(yuan)
S15 471.167 188 800.828 783 329.661 6
S210 258.255 590 145.685 179 887.429 6
Table 3. Comparison of daily operating costs of industrial users under different scenarios.
ScenarioCost for User 1Cost for User 2Cost for User 3
S122 075.684 130 818.277 935 906.866 7
S222 218.254 931 329.119 636 598.310 5
cost volatility−0.646%−1.658%−1.926%
Disclaimer/Publisher’s Note: The statements, opinions and data contained in all publications are solely those of the individual author(s) and contributor(s) and not of MDPI and/or the editor(s). MDPI and/or the editor(s) disclaim responsibility for any injury to people or property resulting from any ideas, methods, instructions or products referred to in the content.