Article

Enhancing Semiconductor Chiller Performance: Investigating the Performance Characteristics of Ultra-Low-Temperature Chillers Applying a Liquid Receiver

Department of Refrigeration and Air-Conditioning Engineering, College of Engineering, Pukyong National University, 45, Yongso-ro, Nam-gu, Busan 48513, Republic of Korea
*
Author to whom correspondence should be addressed.
Energies 2024, 17(20), 5144; https://doi.org/10.3390/en17205144
Submission received: 12 September 2024 / Revised: 8 October 2024 / Accepted: 14 October 2024 / Published: 16 October 2024
(This article belongs to the Section J: Thermal Management)

Abstract

:
This study investigates the implementation of a cryogenic chiller utilizing a mixed-refrigerant cascade refrigeration cycle (MRCRC). In this setup, R-404A is employed in the high-temperature circuit (HTC), while a mixture of refrigerants is utilized in the low-temperature circuit (LTC). Unlike a conventional MRCRC that operates without a receiver to maintain the composition ratio, this research explores the impact of receiver installation on system performance. Experiments were conducted with and without a receiver to assess performance improvements and device behavior. With a fixed refrigerant charge of 4 kg, the suction and discharge pressures of the LTC compressor remained low and stable after the receiver’s installation. The addition of a receiver significantly reduced the cooling time, with further reductions observed as the refrigerant charge increased. The system achieved evaporative heat capacities of 0.59, 1.76, and 2 kW for refrigerant charges of 4, 7, and 9 kg, respectively. Notably, at the maximum refrigerant charge of 11 kg, the evaporative heat capacity peaked at 3.3 kW. These findings indicate that incorporating a receiver is crucial for enhancing the cooling performance of cryogenic coolers using mixed refrigerants and stabilizing device operation. This contrasts with previous studies that omitted receivers due to concerns over potential alterations in the composition ratio of the mixed refrigerant.

1. Introduction

Low-temperature refrigeration—targeting temperatures from −50 to −80 °C—is used extensively across various fields, including food storage, medical devices, and semiconductor processes. The multistage compression refrigeration cycle (MSCRC) and cascade refrigeration cycle (CRC) are representative low-temperature refrigeration methods. In particular, CRC is widely used in low-temperature refrigeration owing to its stability in achieving low temperatures and its ability to secure a substantial cooling capacity. More specifically, to achieve temperatures ranging from −50 to −80 °C, R-404A is used primarily in high-temperature circuits (HTCs), and R-23 and R-508B are used in low-temperature circuits (LTCs). LTC refrigerants possess a normal boiling point (NBP) ranging from approximately −87 to −82 °C, making vacuum operation essential to decrease the target temperature to −80 °C or less. However, during vacuum operation, minute cracks in the pipe joints allow the intrusion of air that passes through the narrow space of the expansion valve and subsequently freezes, causing system complications. The need for vacuum operation can be circumvented by using refrigerants with low NBPs; however, this strategy involves a high condensation pressure. To address these problems, several studies have focused on mixed-refrigerant refrigeration cycles, in which refrigerants with different boiling points are blended, leading to a reduced condensation pressure even at low evaporation temperatures, thereby circumventing vacuum operations.
Several studies have examined this subject. Liu et al. [1] used a mixed refrigerant comprising R-290 and R-170 and compared the novel ejector-enhanced auto-cascade refrigeration cycle (NEARC) with the conventional auto-cascade refrigeration cycle (CARC) through simulations. They discovered that the NEARC yielded a cooling capacity of 108.612 W at an evaporation temperature of −65 °C. Moreover, Liu et al. [2] found that the basic ejector-enhanced auto-cascade refrigeration cycle and its modification—that is, the modified ejector-enhanced auto-cascade refrigeration cycle (by adding an expansion valve and an internal heat exchanger)—exhibited a cooling capacity of 149.94 W at an evaporation temperature of −55 °C. Sivakumar et al. [3] compared mixed refrigerants comprising R-290, R-23, and R-14 against R-1270, R-170, and R-14 in a three-stage cascade refrigeration cycle. They revealed that the former mixed refrigerant, comprising R-290, R-23, and R-14, exhibited a superior performance with a cooling capacity of 56.70 W at an evaporation temperature of −97 °C. Tan et al. [4] explored a mixed refrigerant comprising R-1150 and R-600a for a two-stage cascade refrigeration cycle using a fractionated auto-cascade refrigeration cycle coupled with a two-phase ejector and analyzed the refrigeration performance. They determined that a cooling capacity of 1.4 kW could be achieved at an evaporation temperature of −81 °C. Zhang et al. [5] found that a cooling capacity of 250 W could be obtained at an evaporation temperature of −70 °C when a mixed refrigerant of R-744 and R-290 was applied to a small two-stage cascade refrigeration cycle with a fractionation heat exchanger. He et al. [6] compared the theoretical performance of an auto-cascade refrigeration cycle based on the type of a two-component mixed refrigerant. They revealed that a mixed refrigerant comprising R-170 and R-600 exhibited a cooling capacity of 750 W at an evaporation temperature of −50 °C. Liopis et al. [7] conducted research on a cryogenic cascade refrigeration system and proposed a new method for calculating the thermodynamic performance, circular configuration, and energy efficiency of the CRC. Gong et al. [8] compared R-508B—which is mainly used in CRC-based systems—with various mixed refrigerants and analyzed their performance. They revealed that a mixed refrigerant of R-170 and R-116 exhibited a higher performance compared to R-508B; in particular, the mixed refrigerant could achieve a cooling capacity of 150 W at an evaporation temperature of −80 °C. Liu et al. [9] compared and evaluated the performance of a modified auto-cascade refrigeration cycle (MARC) equipped with a self-recuperator featuring a CARC. They revealed that the coefficient of performance (COP) and exergy efficiency of the MARC were higher than those of the CARC under the given operating conditions and that MARC exhibited a higher performance with the use of R-600a and R-1150 than with R-290 and R-170. Yan et al. [10] improved a CRC-based system equipped with an ejector using a mixed refrigerant of R-134a and R-23; their simulation results revealed that the highest exergy destruction occurred in the compressor. Several studies have also focused on the application of cryogenic mixed refrigerants in various fields [11,12,13,14,15,16,17,18,19].
However, applying the findings of previous studies on low-temperature mixed refrigerants in industrial chillers presents challenges because of the focus on extremely low temperatures and the use of flammable refrigerants, resulting in small cooling capacities measured in watts. Also, as shown in Table 1, the experimental studies on cycles employing cryogenic mixed refrigerants have often omitted the installation of a receiver and accumulator, fearing composition ratio disruptions that could prevent the stagnation of the liquid refrigerant at certain positions, generated by boiling-point differences. Consequently, these studies imposed limitations on the refrigerant charge amounts, and attempts to maximize the cooling capacity through additional refrigerants have led to elevated system pressures. In semiconductor chillers, flammable refrigerants are strictly regulated, and the pressure is capped at 2.0 MPa_g. Consequently, forcibly increasing the refrigerant circulation by increasing the power number—that is, the discharge—of the compressor is the only method for securing the desired cooling capacity. However, this reduces the economic efficiency from an engineering perspective. Consequently, in this study, a mixed refrigerant was applied to the LTC of a CRC, and its performance was analyzed in the presence and absence of a receiver. The role of the receiver was determined based on this experiment.

2. Materials and Methods

2.1. Experimental Apparatus and Method

Figure 1 shows a schematic diagram of the experimental apparatus comprising an HTC and LTC. The HTC consists of a compressor, a condenser, an electronic expansion valve, and a cascade heat exchanger (HTC evaporator). The LTC consists of a compressor, a cascade heat exchanger (LTC condenser), an internal heat exchanger, an electronic expansion valve, an evaporator, a brine tank, and a brine heater. An oil separator and filter dryer are installed in the HTC and LTC to stabilize the system.
In the first experiment, the receiver and accumulator were installed only in the HTC because of concerns regarding potential changes in the composition ratio. However, in the second experiment, a receiver was installed in the LTC to determine its importance in the cryogenic cycle. The chiller works as follows.
The refrigerant discharged from the compressor in the HTC passes through the oil separator to store the oil contained in it. Subsequently, the refrigerant is cooled in the condenser and condensed as a liquid refrigerant, some of which is stored in the receiver. The refrigerant discharged from the receiver passes through the sight glass and filter dryer, then expands in the expansion valve to reach a low-temperature, low-pressure state. The refrigerant is then supplied to the cascade heat exchanger (HTC evaporator), where it exchanges heat with the mixed refrigerant of the LTC and then evaporates. And the refrigerant is separated into liquid and vapor refrigerants in the accumulator. The separated vapor refrigerant is supplied into the inlet of the compressor along with the oil recovered in the oil separator to complete a cycle.
In the LTC, the refrigerant discharged from the compressor passes through an oil separator to store the oil contained therein. The refrigerant then cools in the cascade heat exchanger (LTC condenser), and some of it is condensed as a liquid refrigerant. During the second experiment, because of the installation of the receiver, some liquid refrigerant is stored in the receiver. Owing to the nature of the mixed refrigerant used in the LTC, the dryness is determined based on the temperature in the phase-change section. Thus, complete condensation occurs in the internal heat exchanger. The liquid refrigerant passing through the internal heat exchanger expands at the expansion valve through the filter dryer and sight glass and then flows into the evaporator. The refrigerant is partially evaporated in the evaporator through heat exchange with the brine, is completely vaporized in the internal heat exchanger, and is then introduced into the compressor to complete a cycle.
During operation, the hot-gas bypass valve in the LTC counters the instantaneous high pressure during the initial compressor operation. This bypasses some of the high-pressure refrigerant gas discharged from the LTC compressor, ensuring the stable operation of the unit. The HTC condenser condenses the refrigerant using cooling water supplied from a constant temperature bath. When a load is applied, the brine is heated using a heater.
For this experiment, a 10 HP scroll-type compressor was used for both the HTC and LTC, and all the heat exchangers used a plate-type heat exchanger to maximize thermal efficiency. The fluids used in the experiment are listed in Table 2, and the LTC mixed-refrigerant composition ratio is listed in Table 3.

2.2. Experimental Conditions

Two experiments were conducted to attain a supply temperature of −80 °C depending on the installation of the receiver. The conditions for each experiment were as follows:
  • In the first experiment, the refrigerant charge amount in the LTC was increased, and a receiver was not installed in the LTC. The refrigerant charge amount was increased from 2 to 4 kg, and the temperature and pressure at each point of the refrigeration cycle, as well as the brine supply temperature, were compared and analyzed.
  • In the second experiment, a receiver was installed in the LTC. When the amount of refrigerant charge in the LTC was increased from 4 to 11 kg, the cooling time, temperature, pressure at each point of the refrigeration cycle, and cooling capacity were compared and analyzed. Table 4 lists the detailed experimental conditions.
During operation, the hot-gas bypass valve in the LTC counters the instantaneous high pressure during the initial compressor operation. This reduces the discharge pressure by bypassing the high-pressure refrigerant gas discharged from the compressor. The HTC condenser cools the refrigerant by supplying cooling water at a constant temperature in a constant-temperature bath. When a load is applied, the brine is heated using a heater.

2.3. Experimental Method

In order to determine the cooling capacity and cycle performance of chillers with and without a receiver, we conducted experiments by increasing the LTC refrigerant charge. Experiments were conducted with and without a receiver at various refrigerant charge amounts, and based on this, we also determined the refrigerant capacity that can be accommodated by installing a receiver. The experimental process was as follows:
  • In this experiment, since the refrigerant used is a refrigerant mix, each refrigerant was charged in the order of higher boiling point to lower boiling point, considering the relatively higher pressure of the low-boiling refrigerant according to the mixing ratio.
  • The system for the experiments was not operated during refrigerant charging, and the charging was completed with the correct weight to match the mixing ratio of the blended refrigerants, ensuring that the mixing ratio was maintained during the experiments.
  • After the chiller was started, when the evaporation temperature of the HTC reached −15 to −20 °C, we slightly reduced the opening of the HTC EEV and then started the LTC.
  • When the cycle was operated with an LTC high pressure of 1.8 MPa_g and a compressor discharge temperature below 95 °C, we reduced the opening rate of the LTC expansion valve to lower the brine temperature to the target temperature.
  • When the chiller was operated stably at a brine temperature below −80 °C, we further reduced the opening of the LTC expansion valve.
  • When the chiller was operating under steady conditions, it started applying a load.

3. Data Curation

The cooling capacity of the refrigeration cycle can be calculated using Equation (1), based on the temperature and flow rate of the brine at the inlet and outlet of the evaporator obtained from the experiments. The density and specific heat of brine can be calculated using Equations (2) and (3) from the data sheet [20] as follows:
Q e v a = T 1 T 2 m b C p , b d T = V b T 1 T 2 ρ C p , b d T
ρ = 2.0845 T [ ° C ] + 1665.8
C p , b = 1.4982 T [ ° C ] + 1091

4. Results and Discussion

4.1. Experimental Results without the Receiver

4.1.1. LTC Pressure by Refrigerant Charge Amount

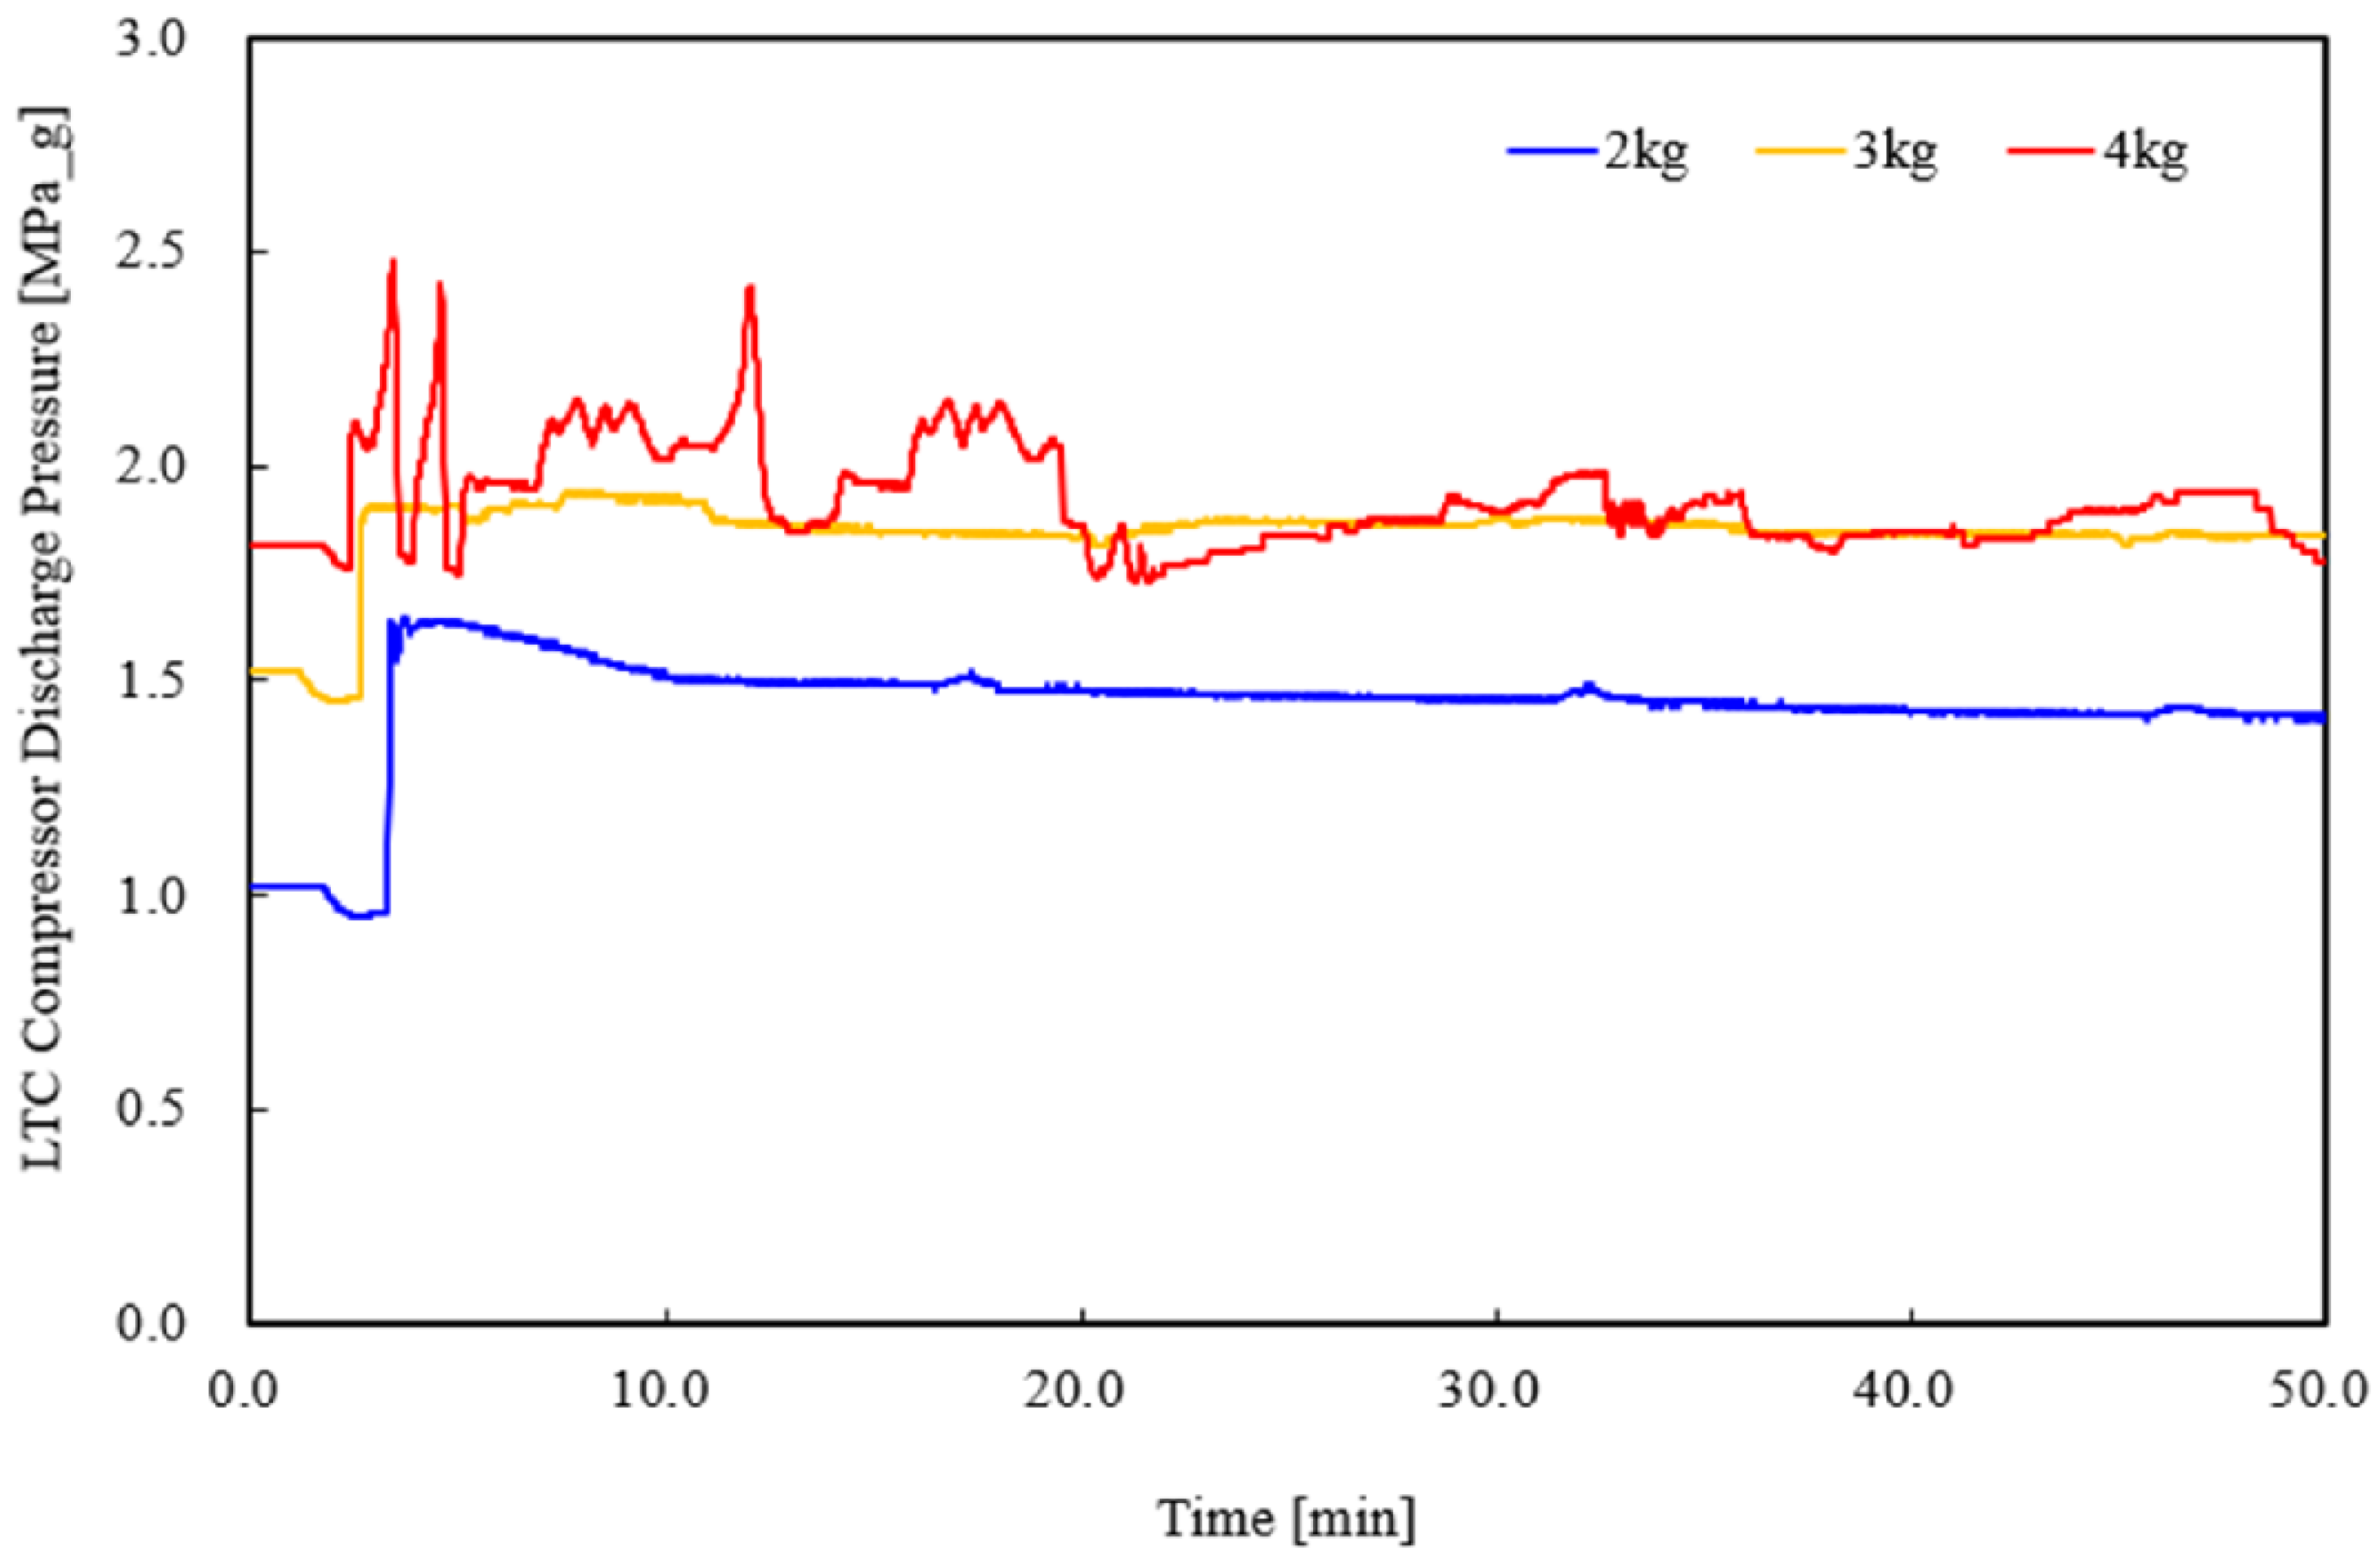
In the first experiment, the suction and discharge pressures of the LTC compressor were analyzed based on the refrigerant charge amount when the receiver was not installed. Figure 2 and Figure 3 show the suction and discharge pressures of the LTC compressor based on the refrigerant charge amount, respectively. Both the suction and discharge pressures at charge amounts of 2 and 3 kg are more stable compared to 4 kg. While the suction pressure is similar between 2 and 3 kg, the discharge pressure is higher at 3 kg, indicating that changes in the refrigerant charge amount have a greater impact on discharge pressure. The suction and discharge pressures are higher when the charge amount was 4 kg compared to when it was 2 or 3 kg, and severe pressure changes are evident. As shown in Figure 3, when the refrigerant charge amount is 4 kg, the discharge pressure is relatively high at the beginning of the operation at approximately 2.5 MPa_g. The discharge pressure tends to increase with the amount of refrigerant charge. When the refrigerant charge amount is 4 kg, the discharge pressure changes frequently.

4.1.2. Brine Supply Temperature by Refrigerant Charge Amount

Figure 4 illustrates the brine supply temperature of the LTC as a function of the refrigerant charge amounts in the LTC, specifically for charge levels of 2, 3, and 4 kg.
Notably, when the refrigerant charge amounts to 2 and 3 kg, the brine supply temperatures (−47.8 and −77 °C, respectively) fall short of the target temperature of −80 °C. The liquid refrigerant is insufficient when the refrigerant is not charged over a certain amount, resulting in the degradation of cooling capacity. When the refrigerant charge amount is 4 kg, the brine supply temperature reaches the target temperature of −80 °C. However, the excessive charge amount causes an increase in pressure at the beginning of operation and an unstable pressure distribution. To solve the problem of equipment instability at the beginning of operation and limit the charge amount, the installation of a receiver in the LTC can be considered to be necessary.

4.2. Experimental Results with the Receiver

4.2.1. LTC Compressor Pressure by Refrigerant Charge Amount

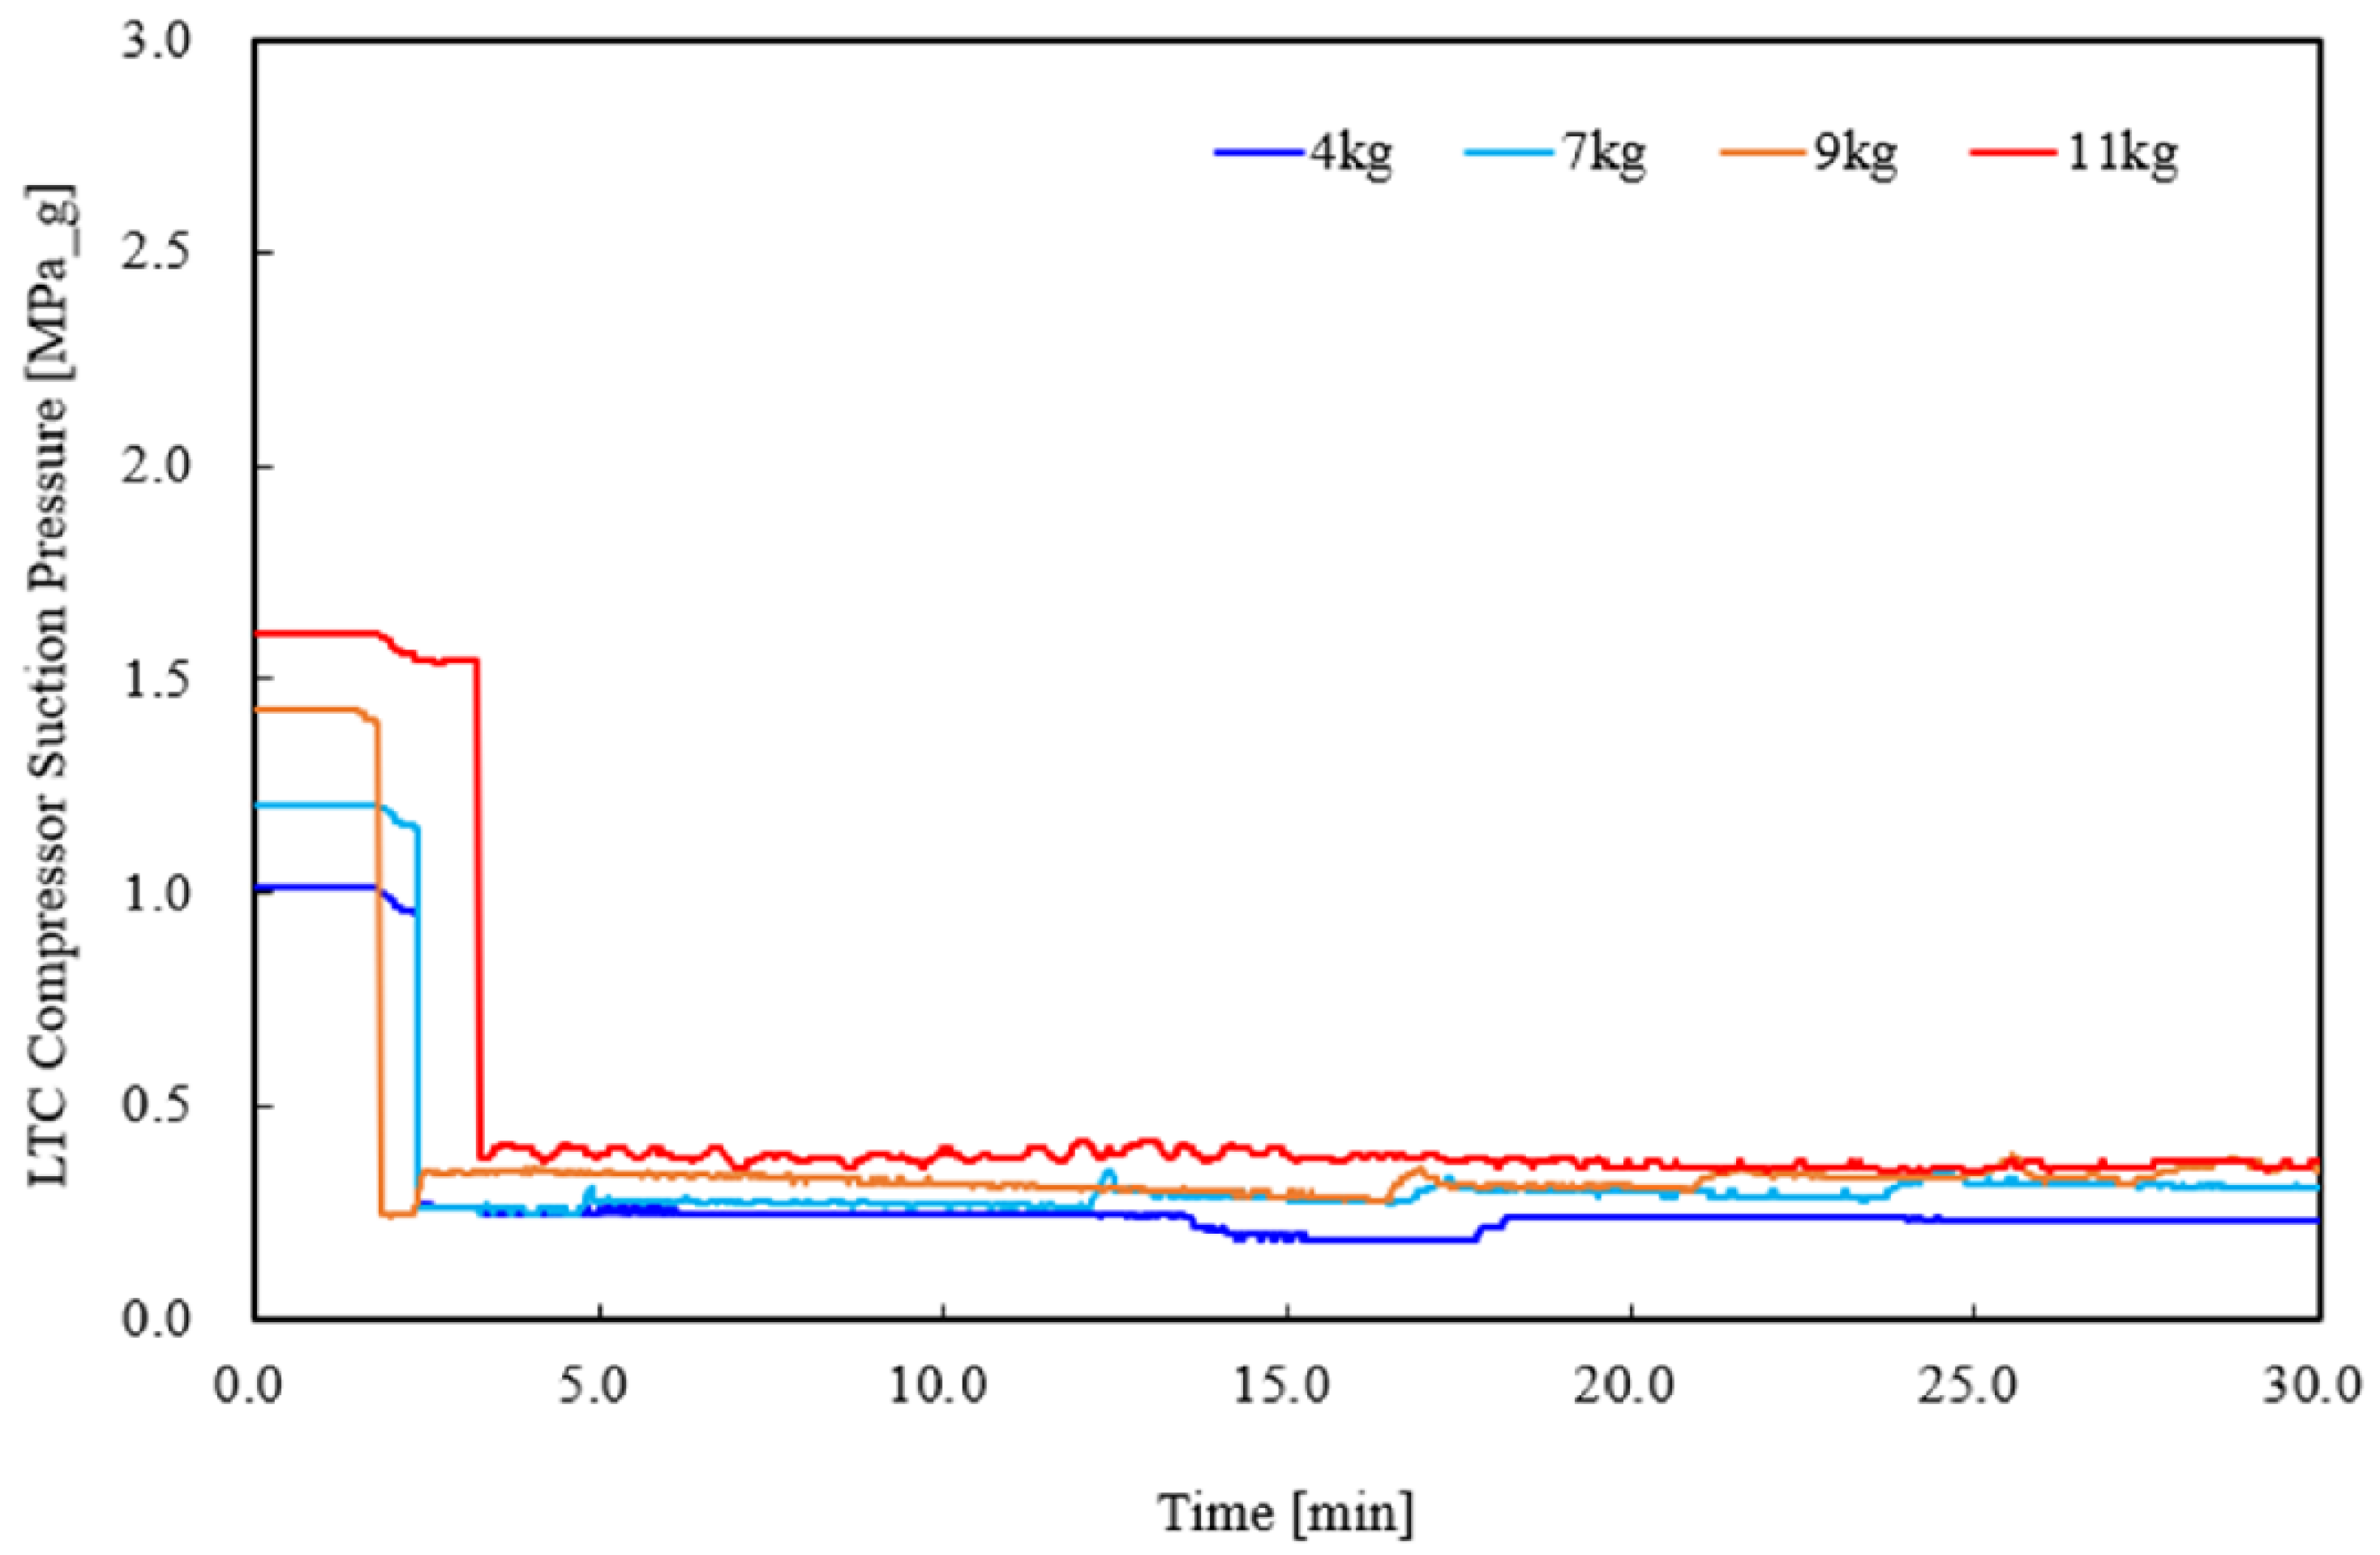
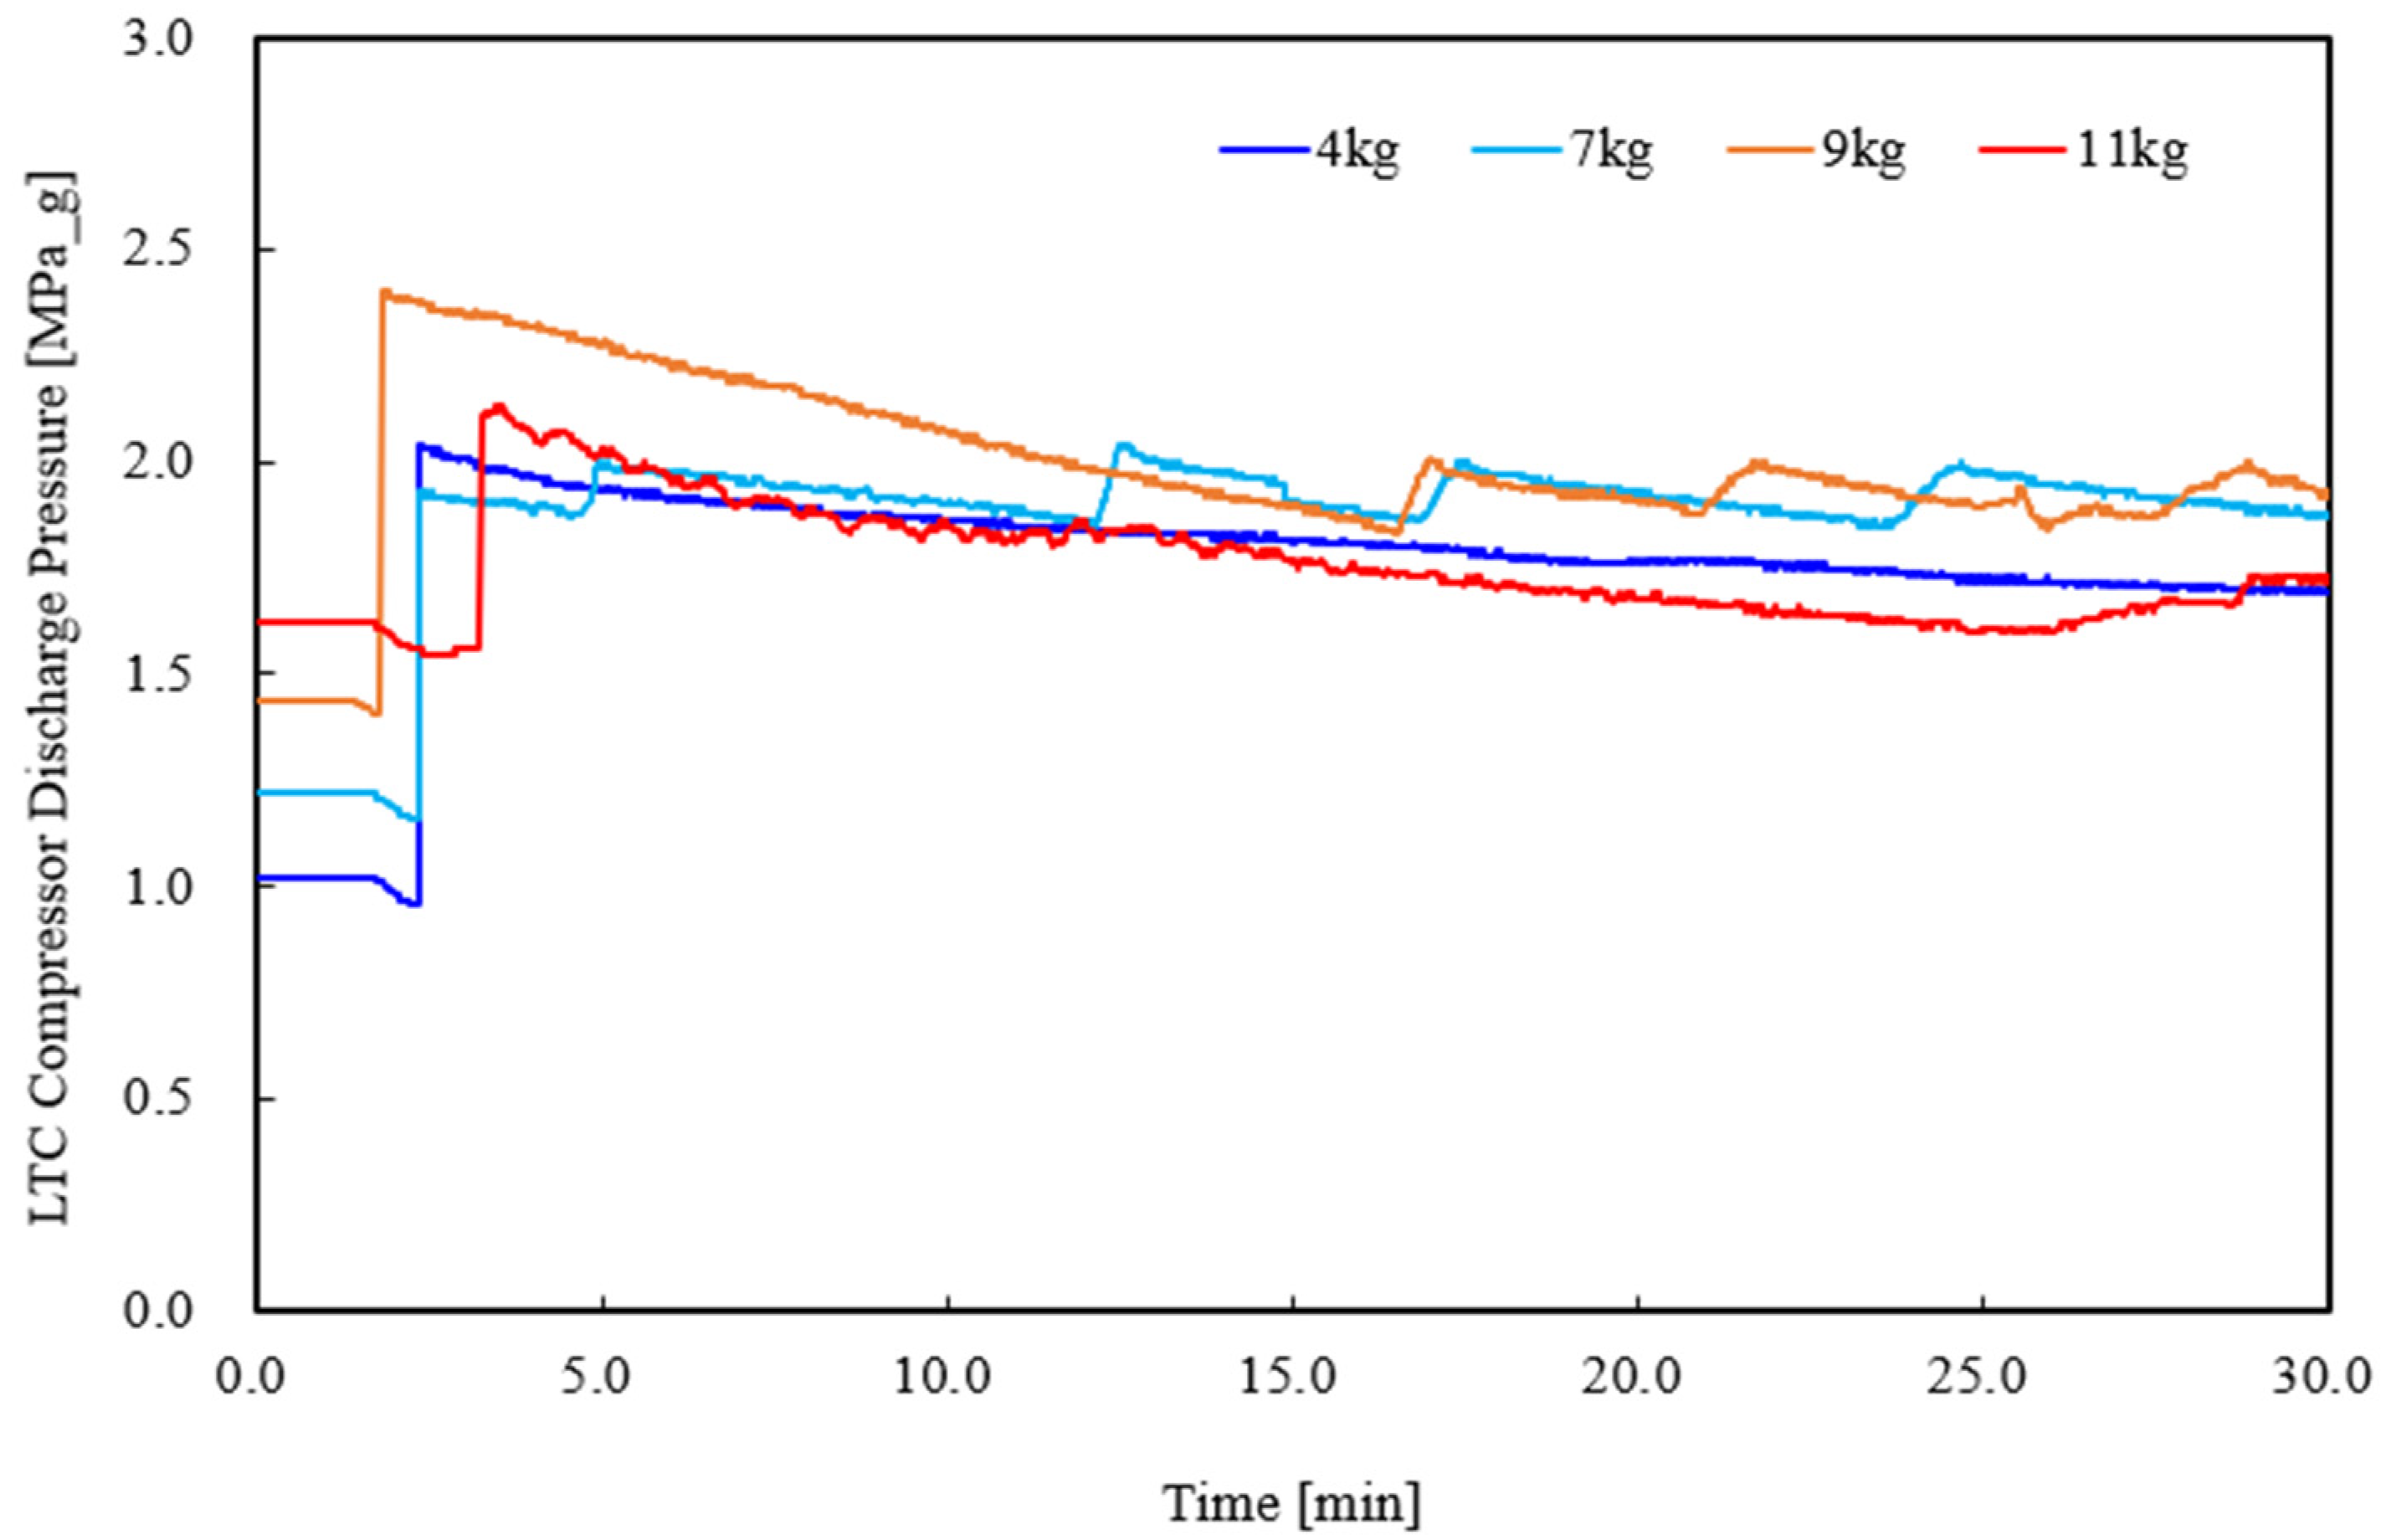
This experiment was conducted under the aforementioned experimental conditions after installing the receiver in the LTC. Figure 5 and Figure 6 show the suction and discharge pressures of the LTC compressor based on the refrigerant charge. By comparing the results shown in Figure 2 and Figure 3 with those shown in Figure 5 and Figure 6, it is evident that the suction and discharge pressures are generally low and stable in the presence of the receiver at a refrigerant charge of 4 kg. This indicates that the receiver contributes to maintaining the system pressure in a stable manner. As shown in Figure 6, the pressure at the beginning of operation exceeds 2 MPa_g. In particular, the discharge pressure increases because the amount of refrigerant circulating within the system increases. When a steady state is reached, the discharge pressure remains stable at less than 2 MPa_g. Moreover, the suction and discharge pressures are stable with no major change despite an increase in the refrigerant charge amount, unlike the results obtained without a receiver.

4.2.2. Brine Cooling Time and Supply Temperature by Refrigerant Charge Amount

Figure 7 presents the lowest brine supply temperatures achieved for refrigerant charge amounts of 4, 7, 9, and 11 kg, along with the cooling time required to reach these temperatures. For the refrigerant charge of 4 kg, the target temperature (−80 °C) cannot be reached, and only a temperature of −60 °C can be attained despite the installation of the receiver. This limitation occurs because the installation of the receiver increases the device’s volume, resulting in a relatively insufficient refrigerant circulation compared to the refrigerant charge amount, which hinders reaching lower temperatures. Conversely, increasing the refrigerant charge to 7, 9, and 11 kg allowed for the achievement of −80 °C, with the shortest time to reach this temperature observed at 11 kg.
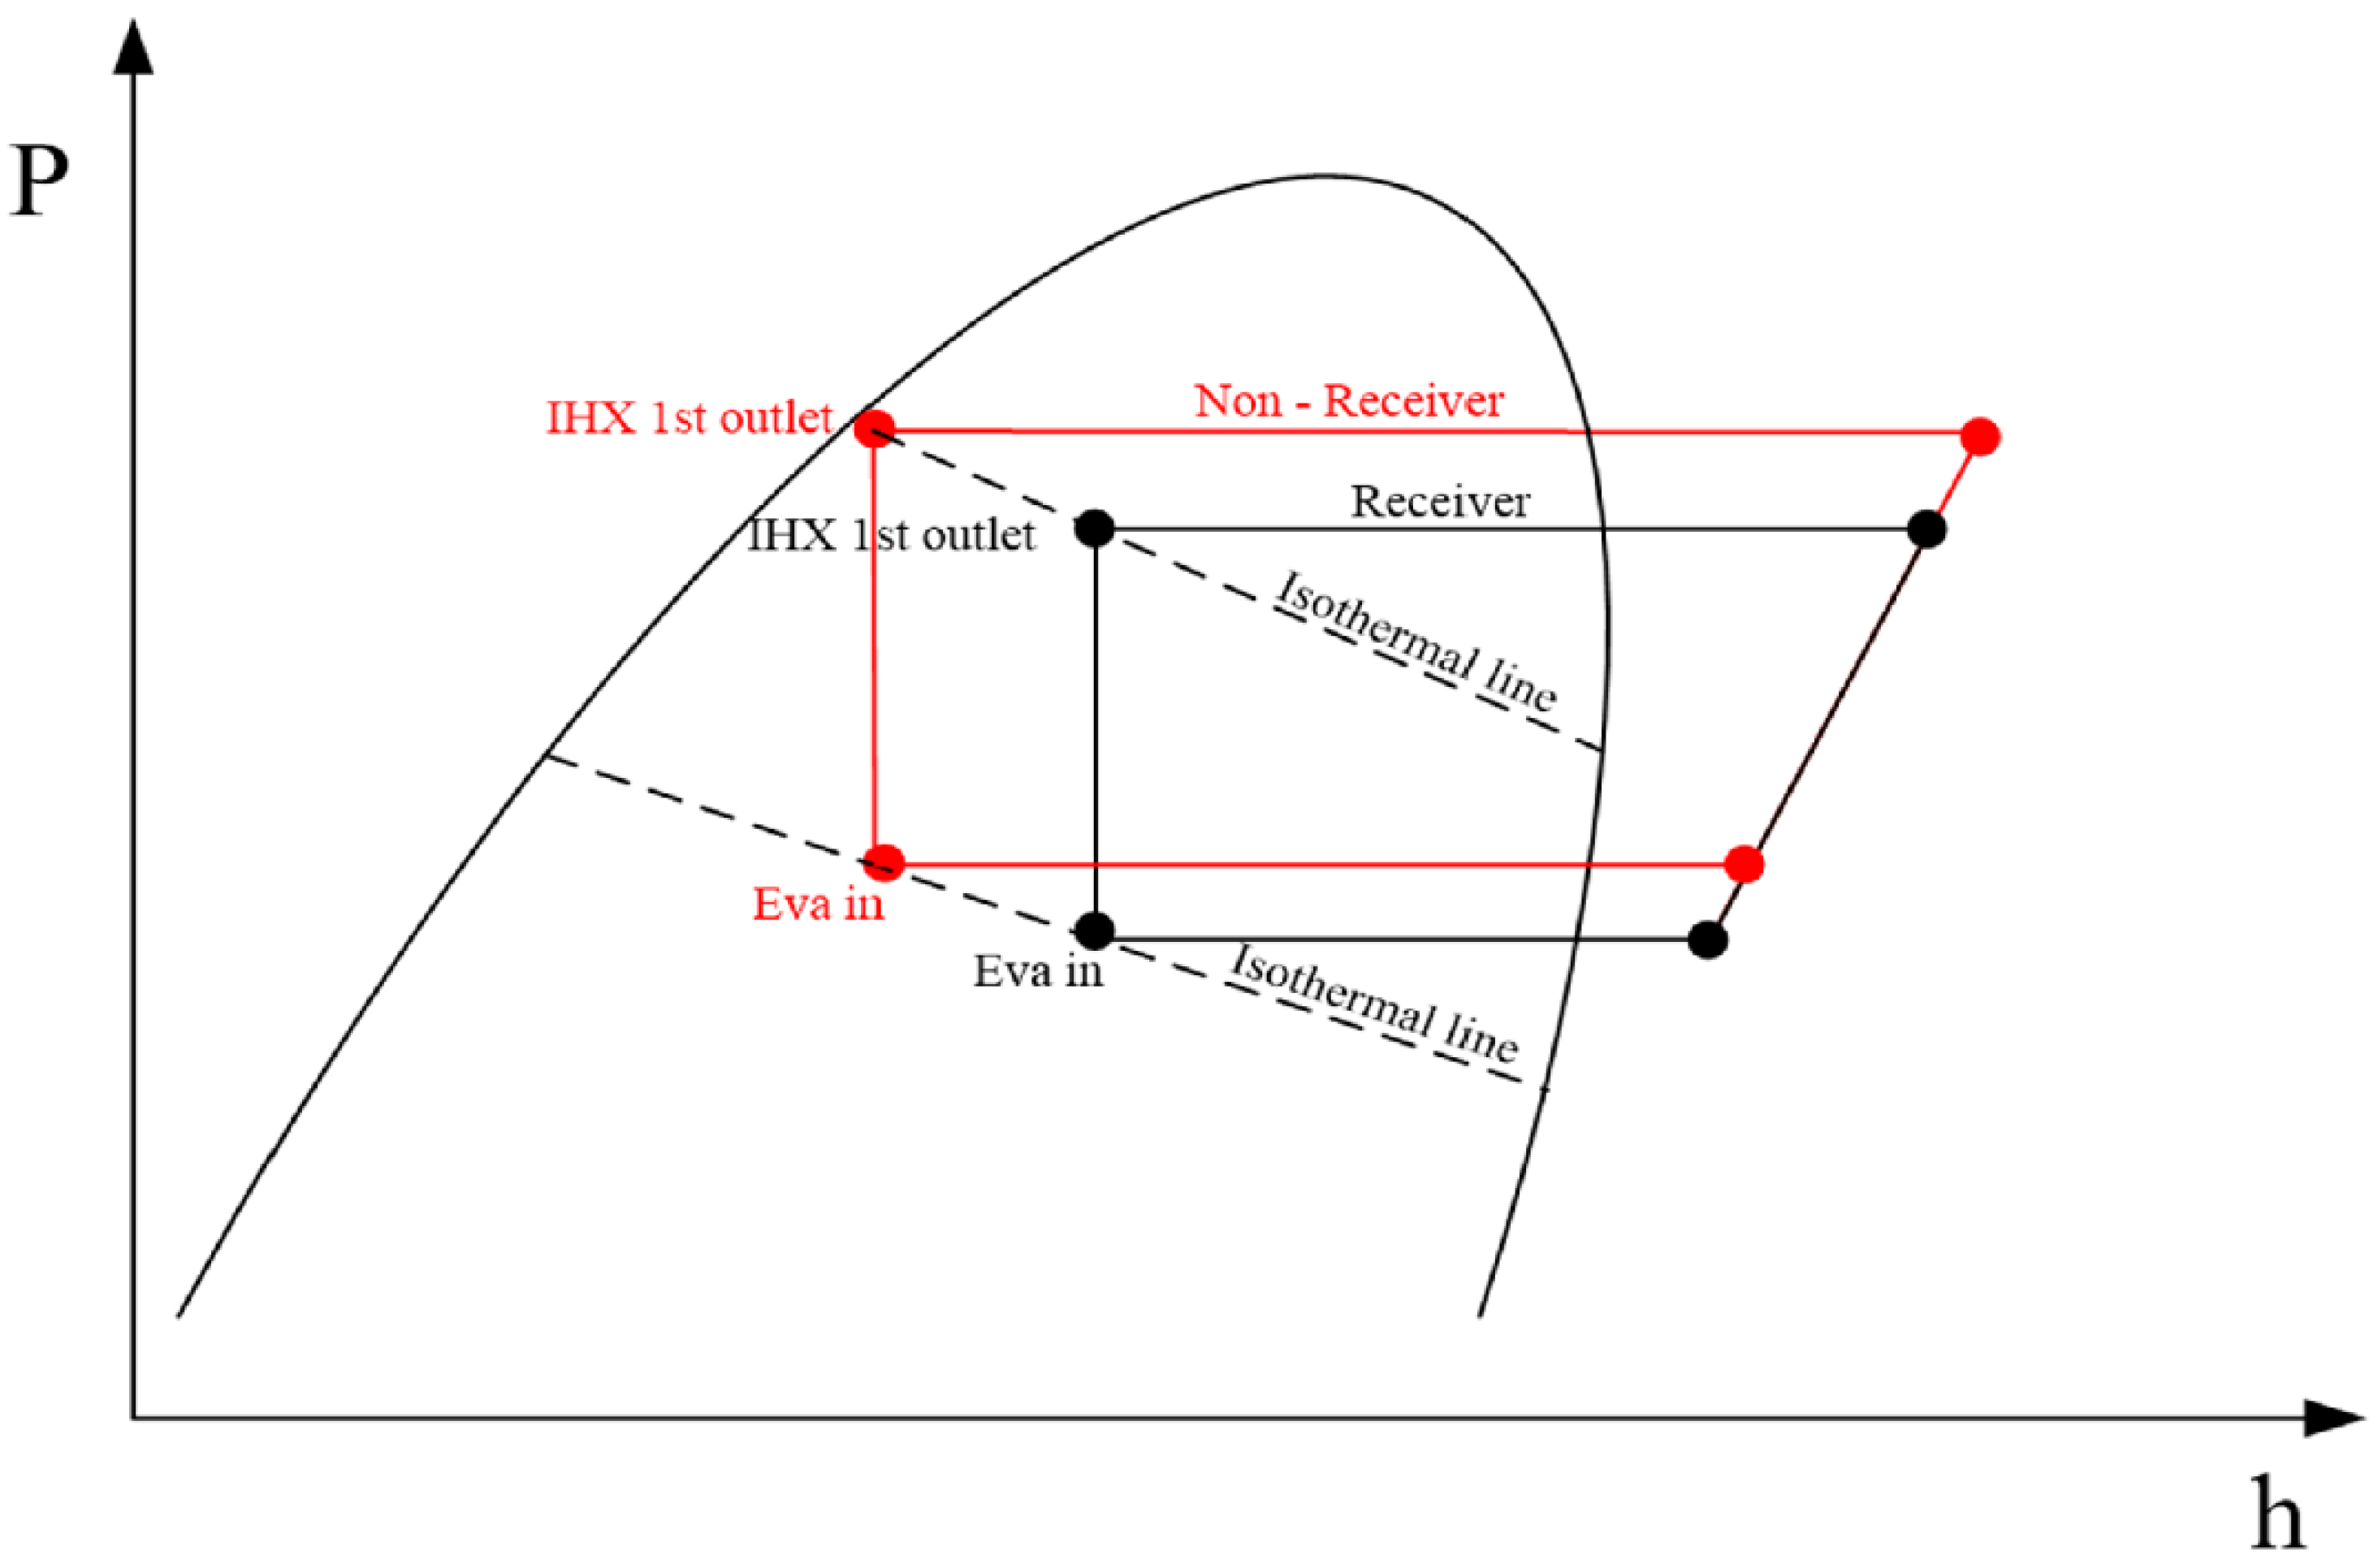
Figure 8 shows the P-h diagram of the mixed refrigerant. The isothermal lines are expressed as straight lines toward the bottom right. Here, if the pressure is different, despite having the same internal heat exchanger (IHX) outlet temperature, the evaporation pressure required to reach the same evaporation temperature is different. In particular, it is evident that the high pressure of the IHX is greatly reduced by the installation of the receiver, which reduces the pressure corresponding to the evaporation temperature, thereby failing to achieve the target temperature (−80 °C). However, the target temperature of −80 °C can be achieved when the refrigerant charge amount is increased to 7, 9, and 11 kg. As the amount of charge increases, the cooling time tends to decrease.

4.2.3. Cooling Capacity by Refrigerant Charge Amount

When the refrigerant charge amount is 4 kg, the target temperature (−80 °C) cannot be reached, and only a temperature of −60 °C can be attained despite the installation of the receiver. This result can be attributed to the characteristics of the mixed refrigerant. Figure 9 is a graph that shows the evaporation heat capacity at refrigerant charge amounts of 4, 7, 9, and 11 kg. When the charge amounts are 4 and 7 kg, evaporation heat capacities of 0.59 and 1.76 kW are evident under no-load conditions, respectively.
A steady state could not be maintained when the load was applied using a heater. Assuming the refrigerant charge to be insufficient, the refrigerant charge was increased during the experiment. When the charge amounts were 9 and 11 kg, a steady state was maintained under the application of the load through the heater, and evaporation heat capacities of 1 and 3.3 kW were evident—that is, the evaporation heat capacity was higher at a charge of 11 kg than at 9 kg.

4.3. Comparison between the Presence and Absence of a Receiver

4.3.1. Brine Cooling Time According to the Presence or Absence of a Receiver

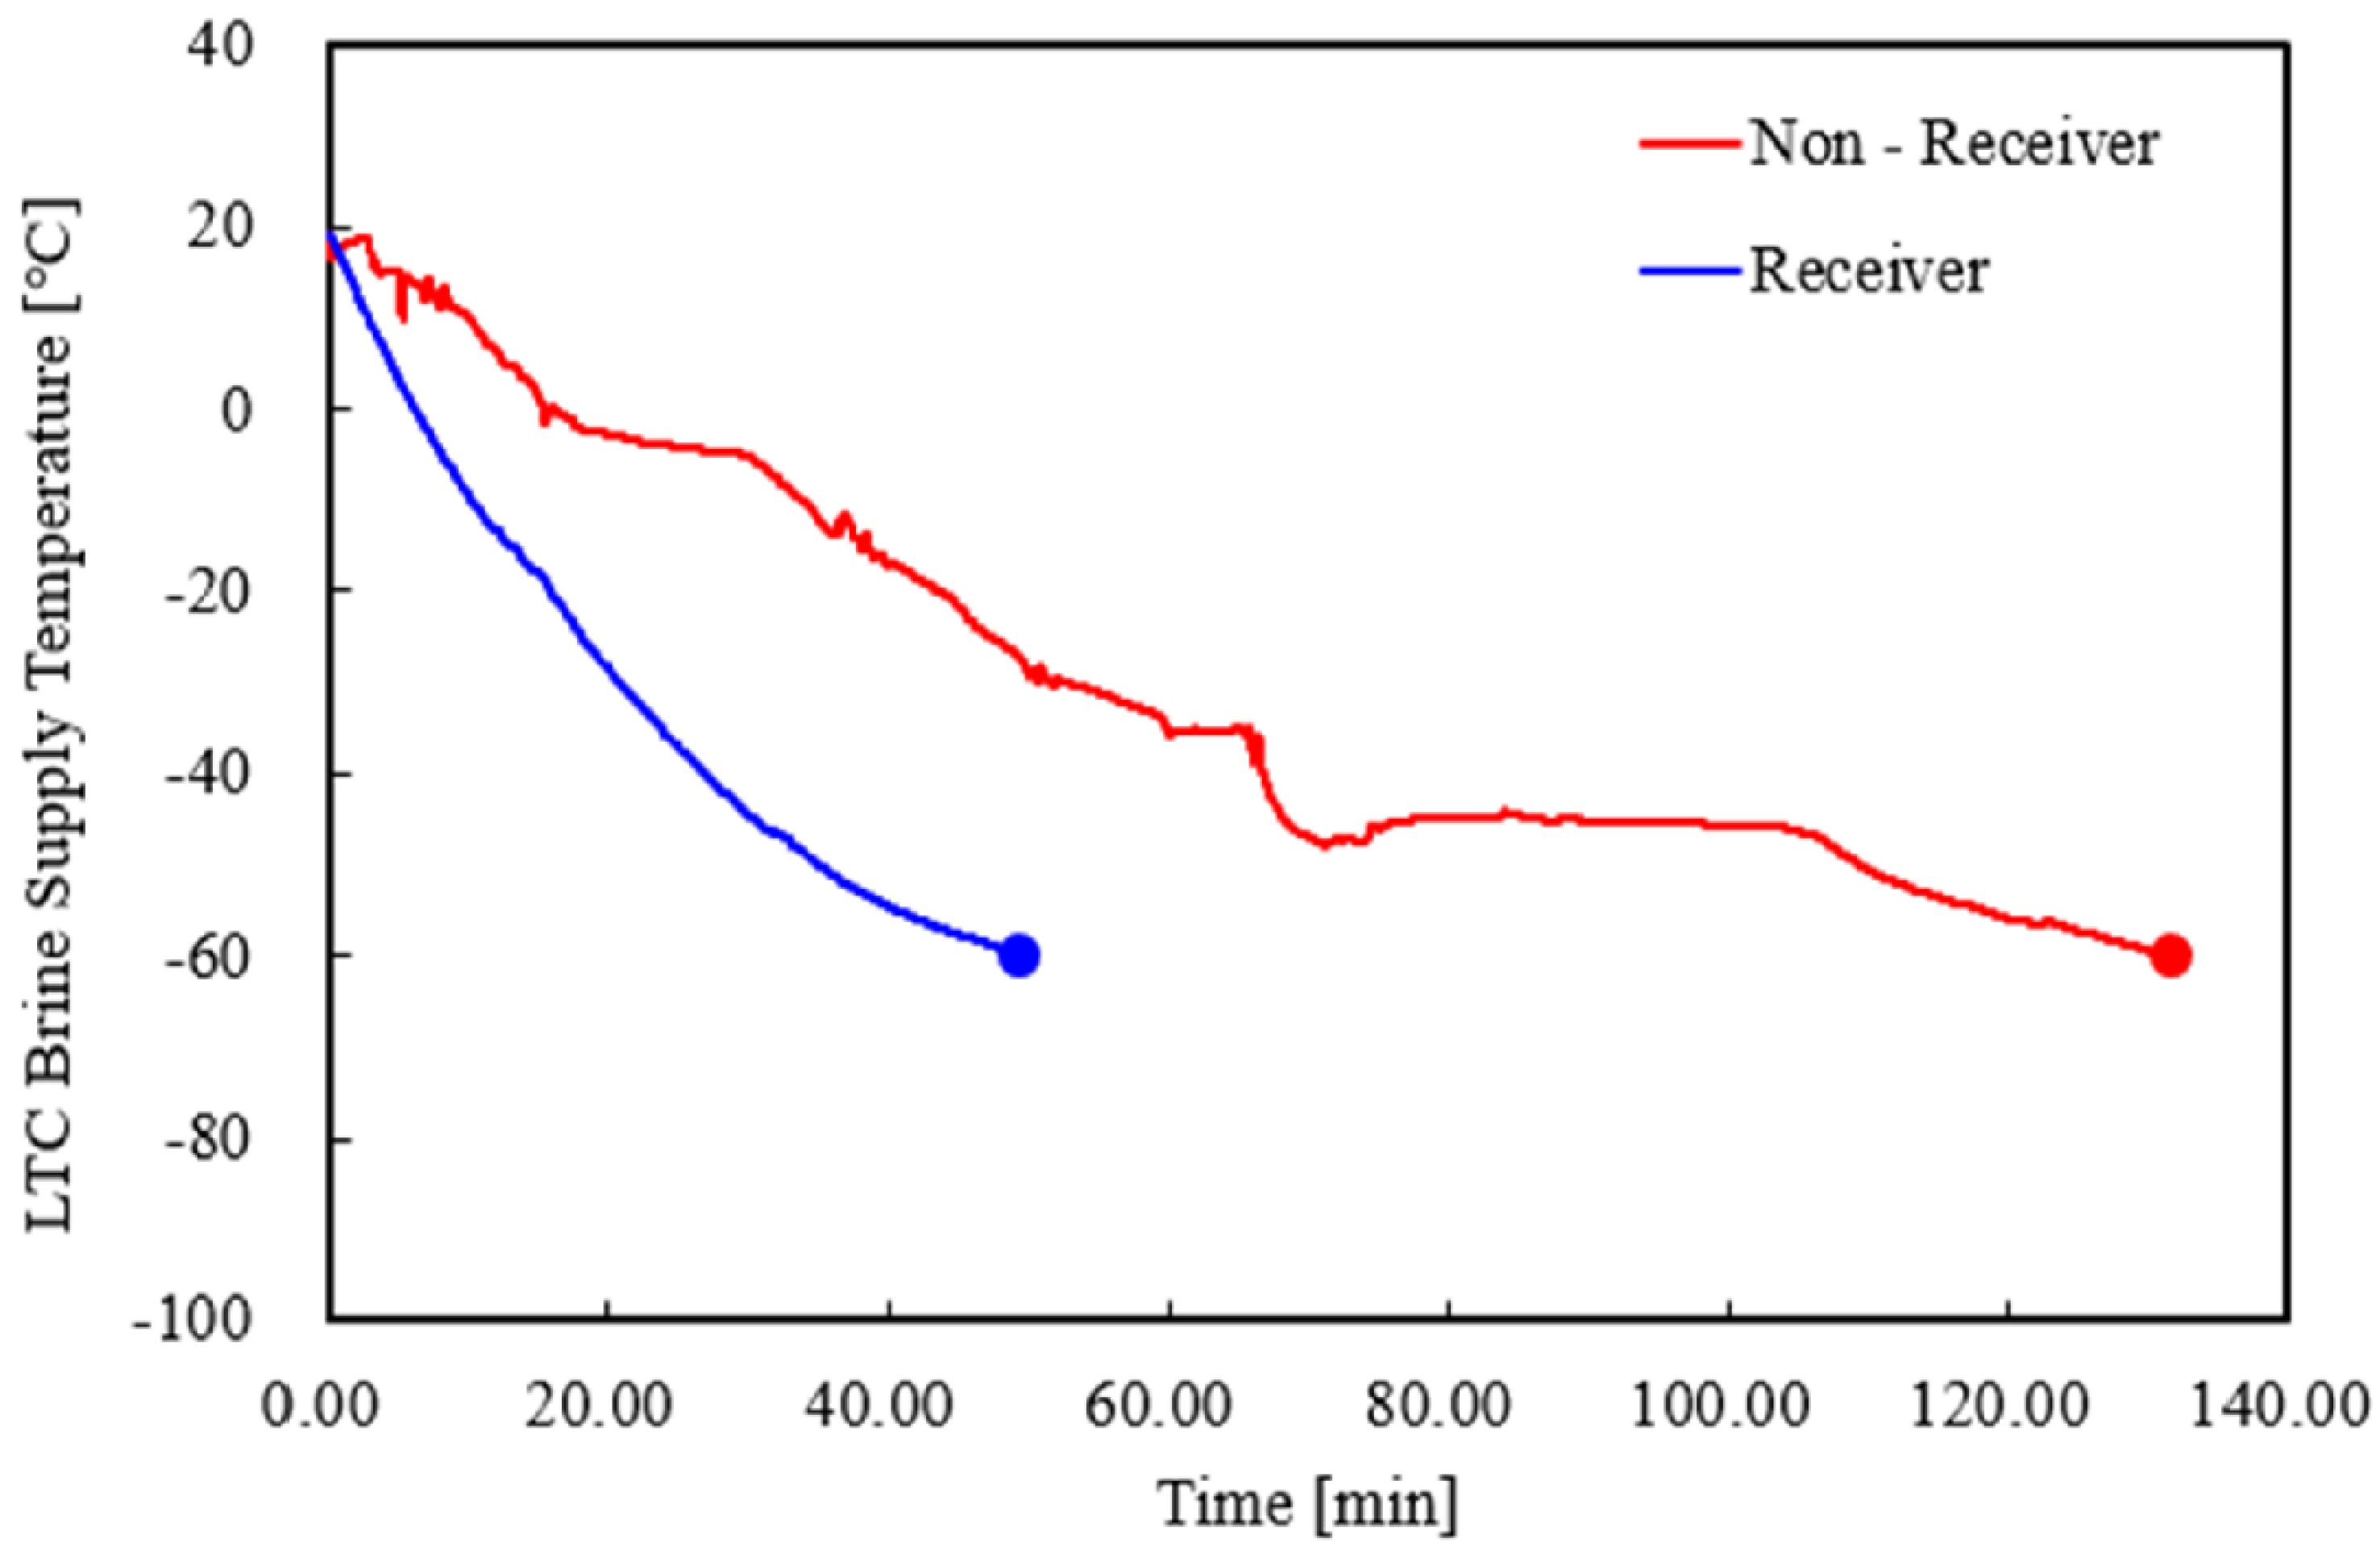
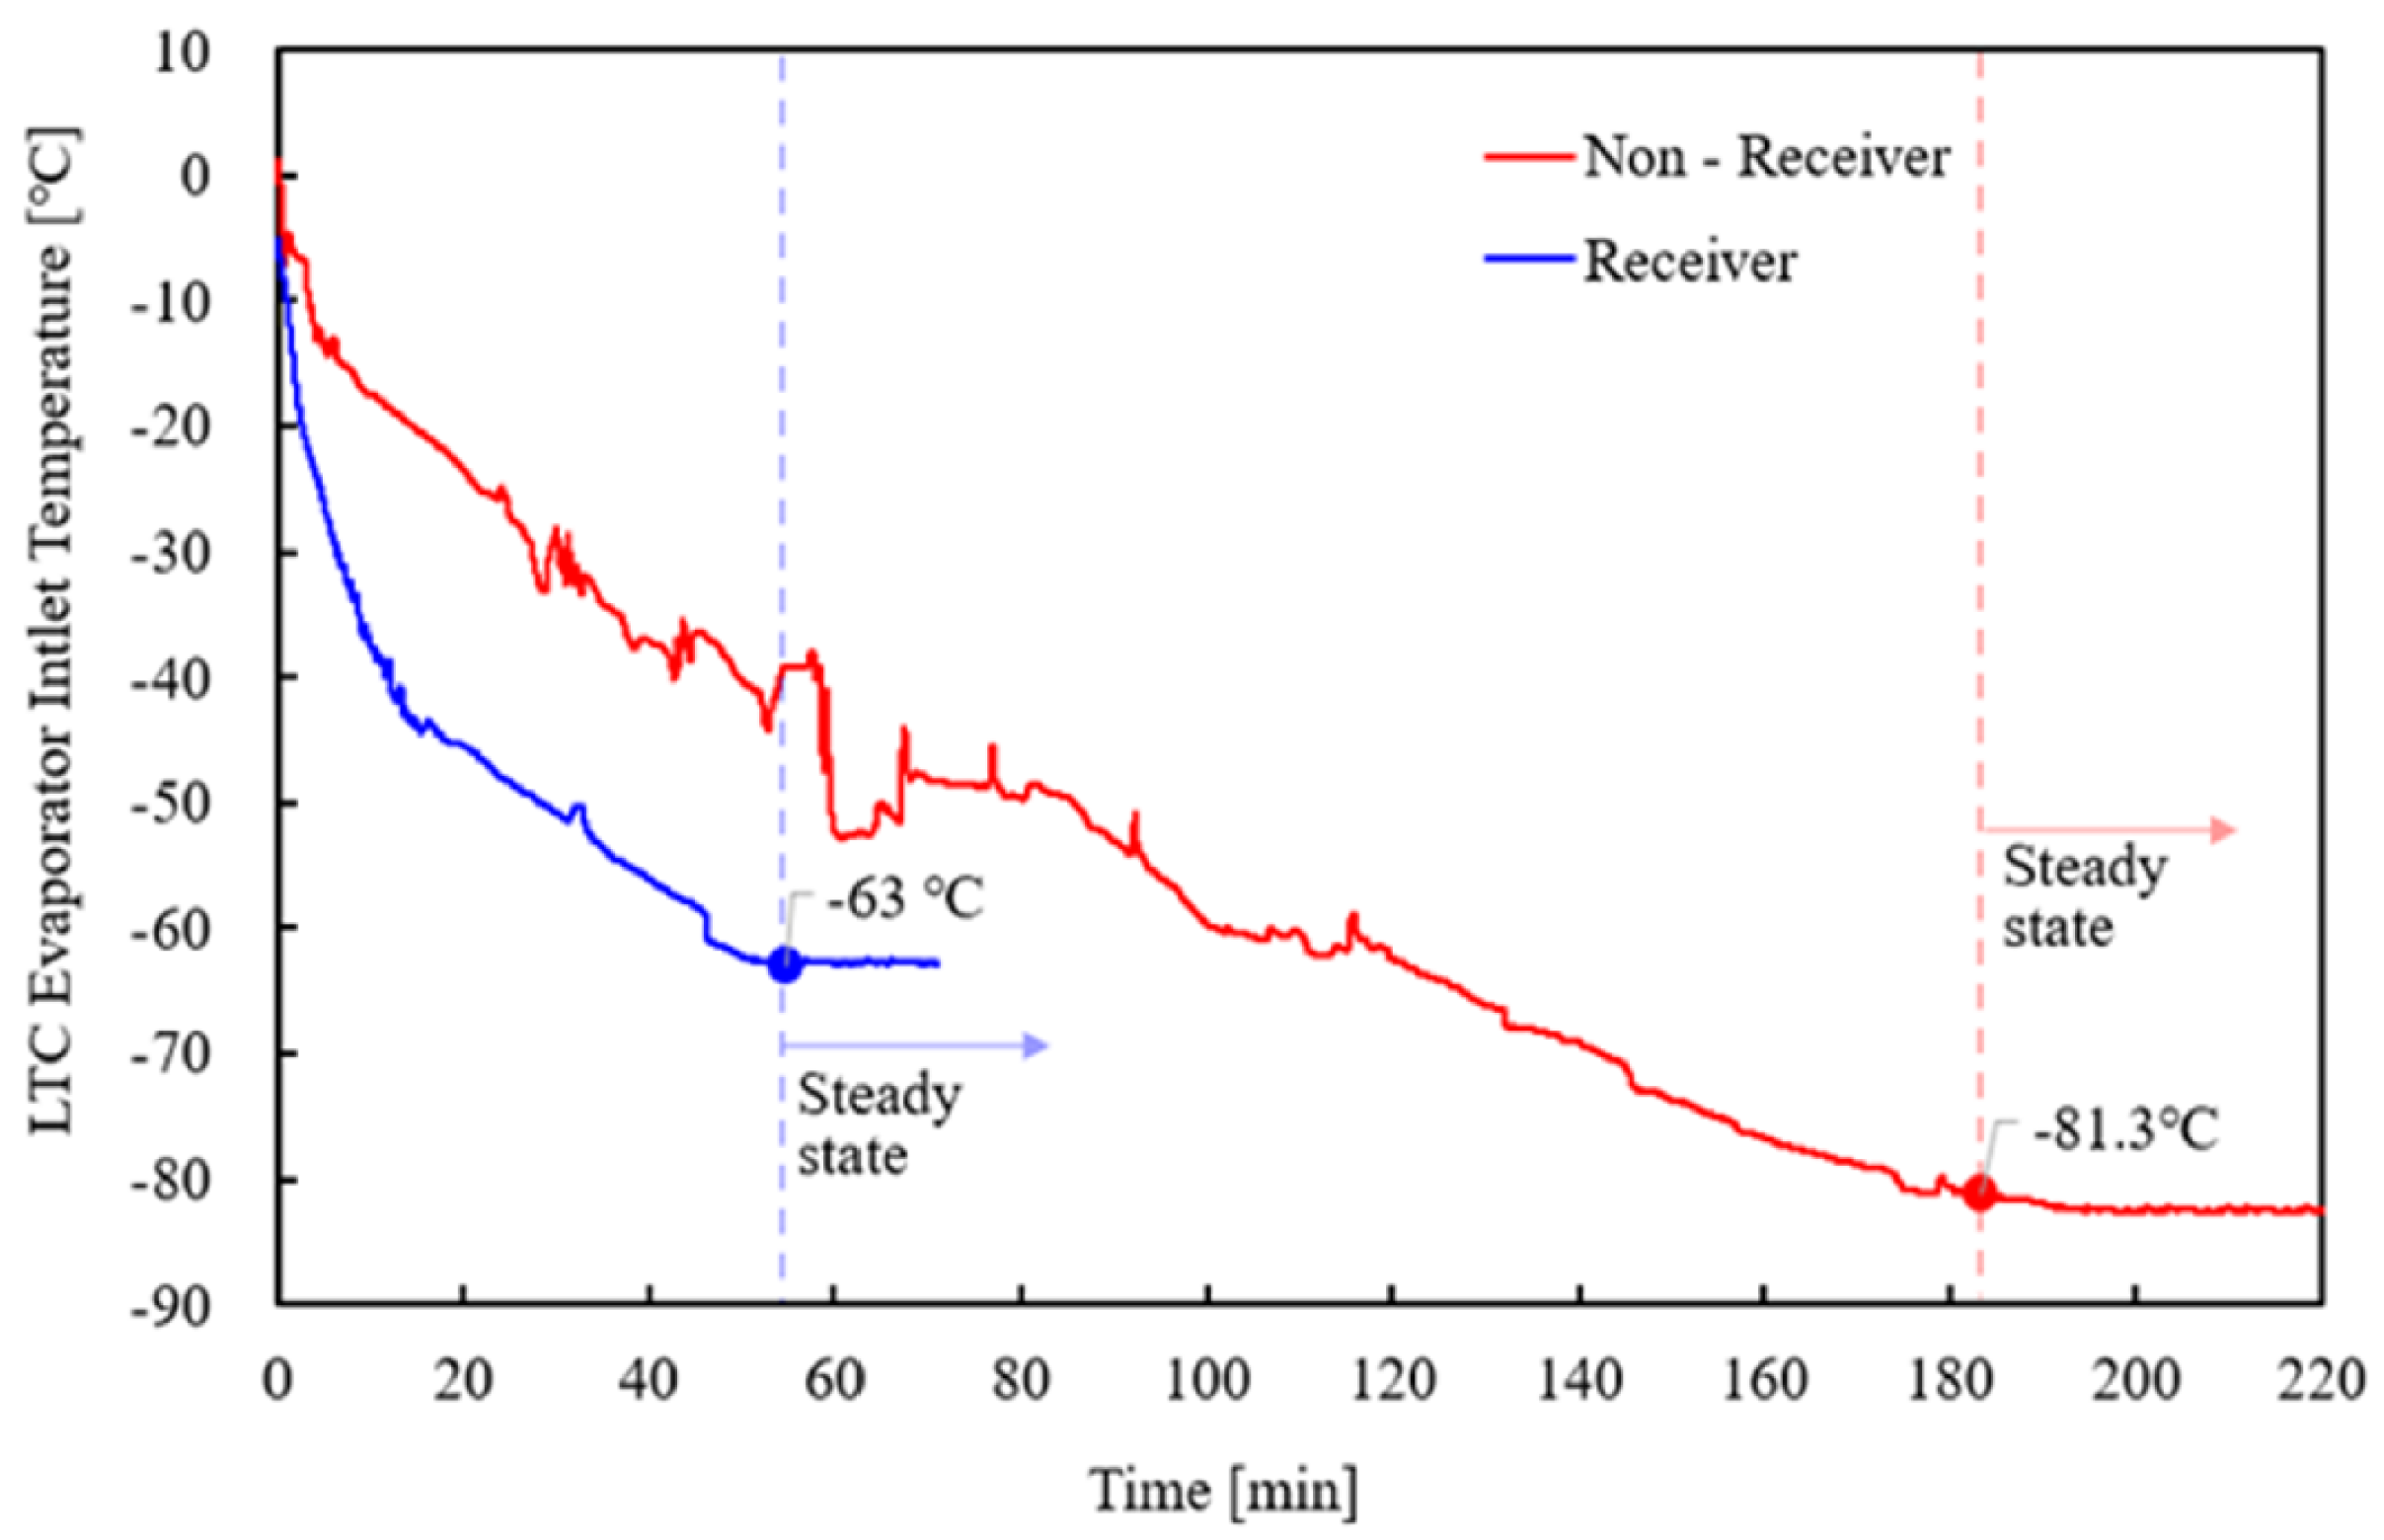
To study the influence of a receiver on the system, an analysis was conducted at the same charge amount of 4 kg based on the presence or absence of the receiver. Figure 10 shows the brine cooling time based on the presence or absence of a receiver. As previously mentioned, the target temperature (−80 °C) was reached when the refrigerant charge amount was 4 kg in the absence of the receiver; however, a temperature of only −60 °C was achieved in the presence of the receiver. Consequently, we analyzed the cooling time based on this temperature of −60 °C. The cooling time was 132 min in the absence of the receiver and 46 min in its presence, indicating a considerable reduction in cooling time. Moreover, the pattern of temperature change was stable.

4.3.2. LTC Behavior Based on the Presence or Absence of a Receiver

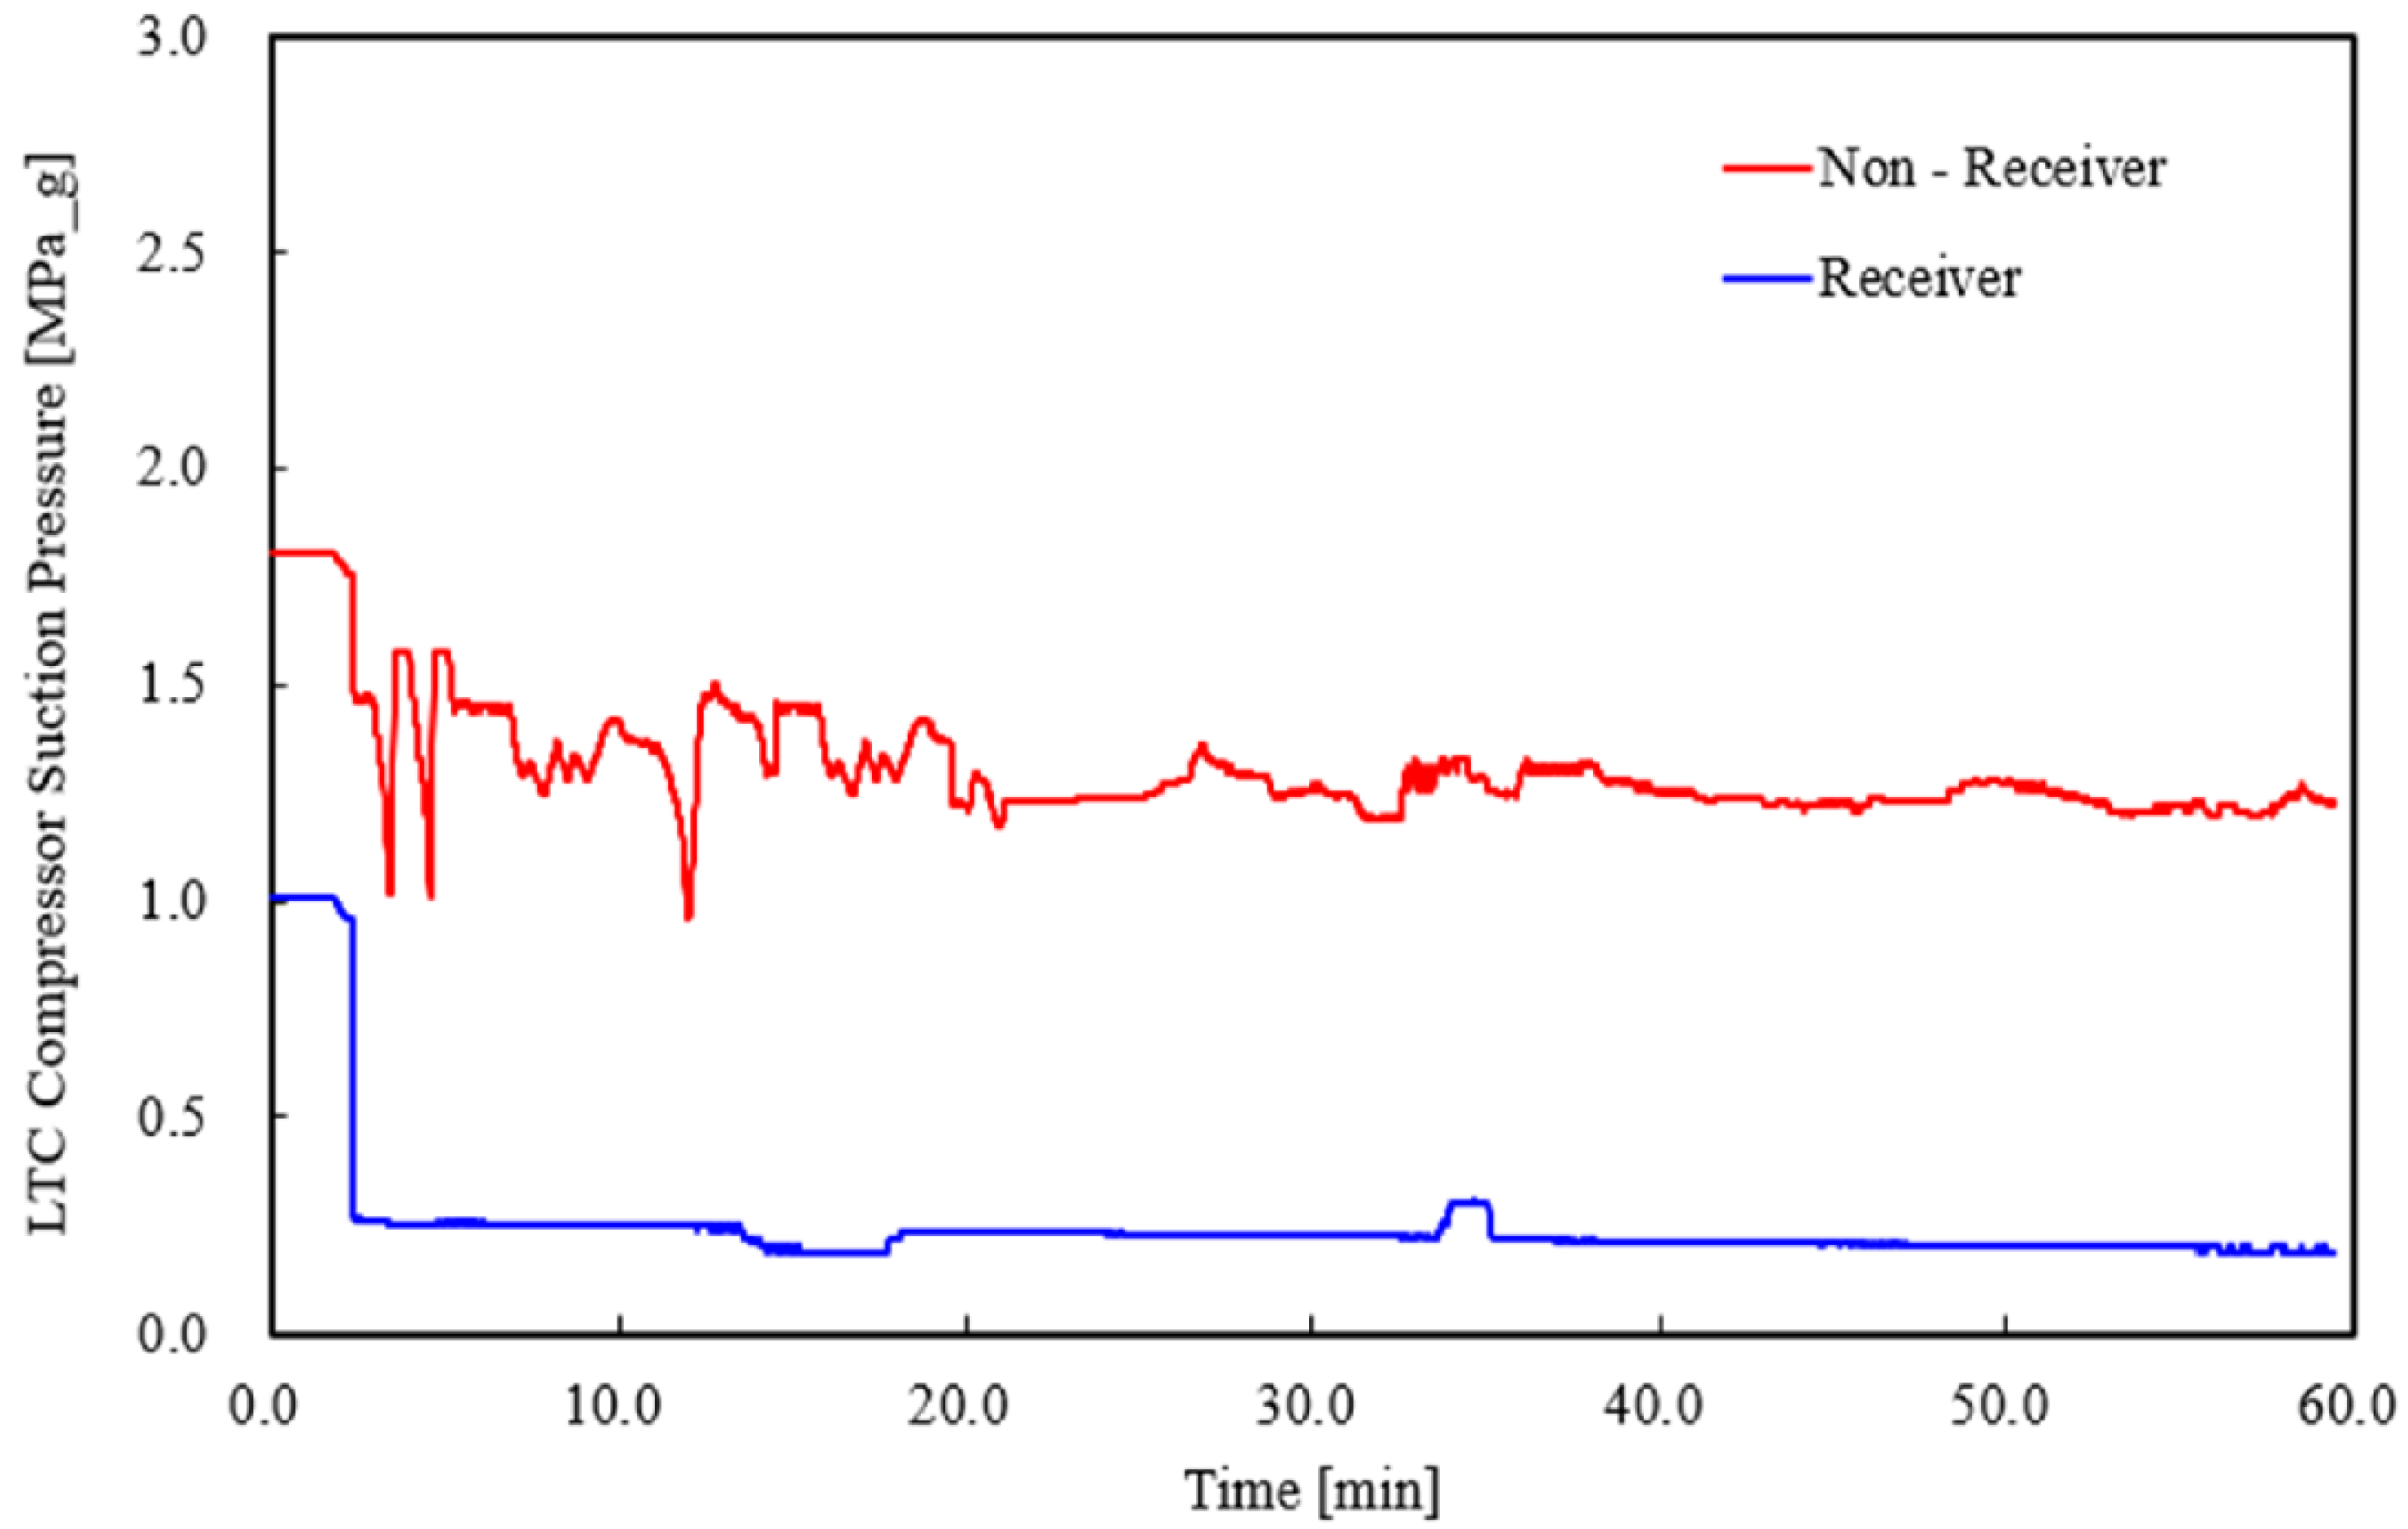
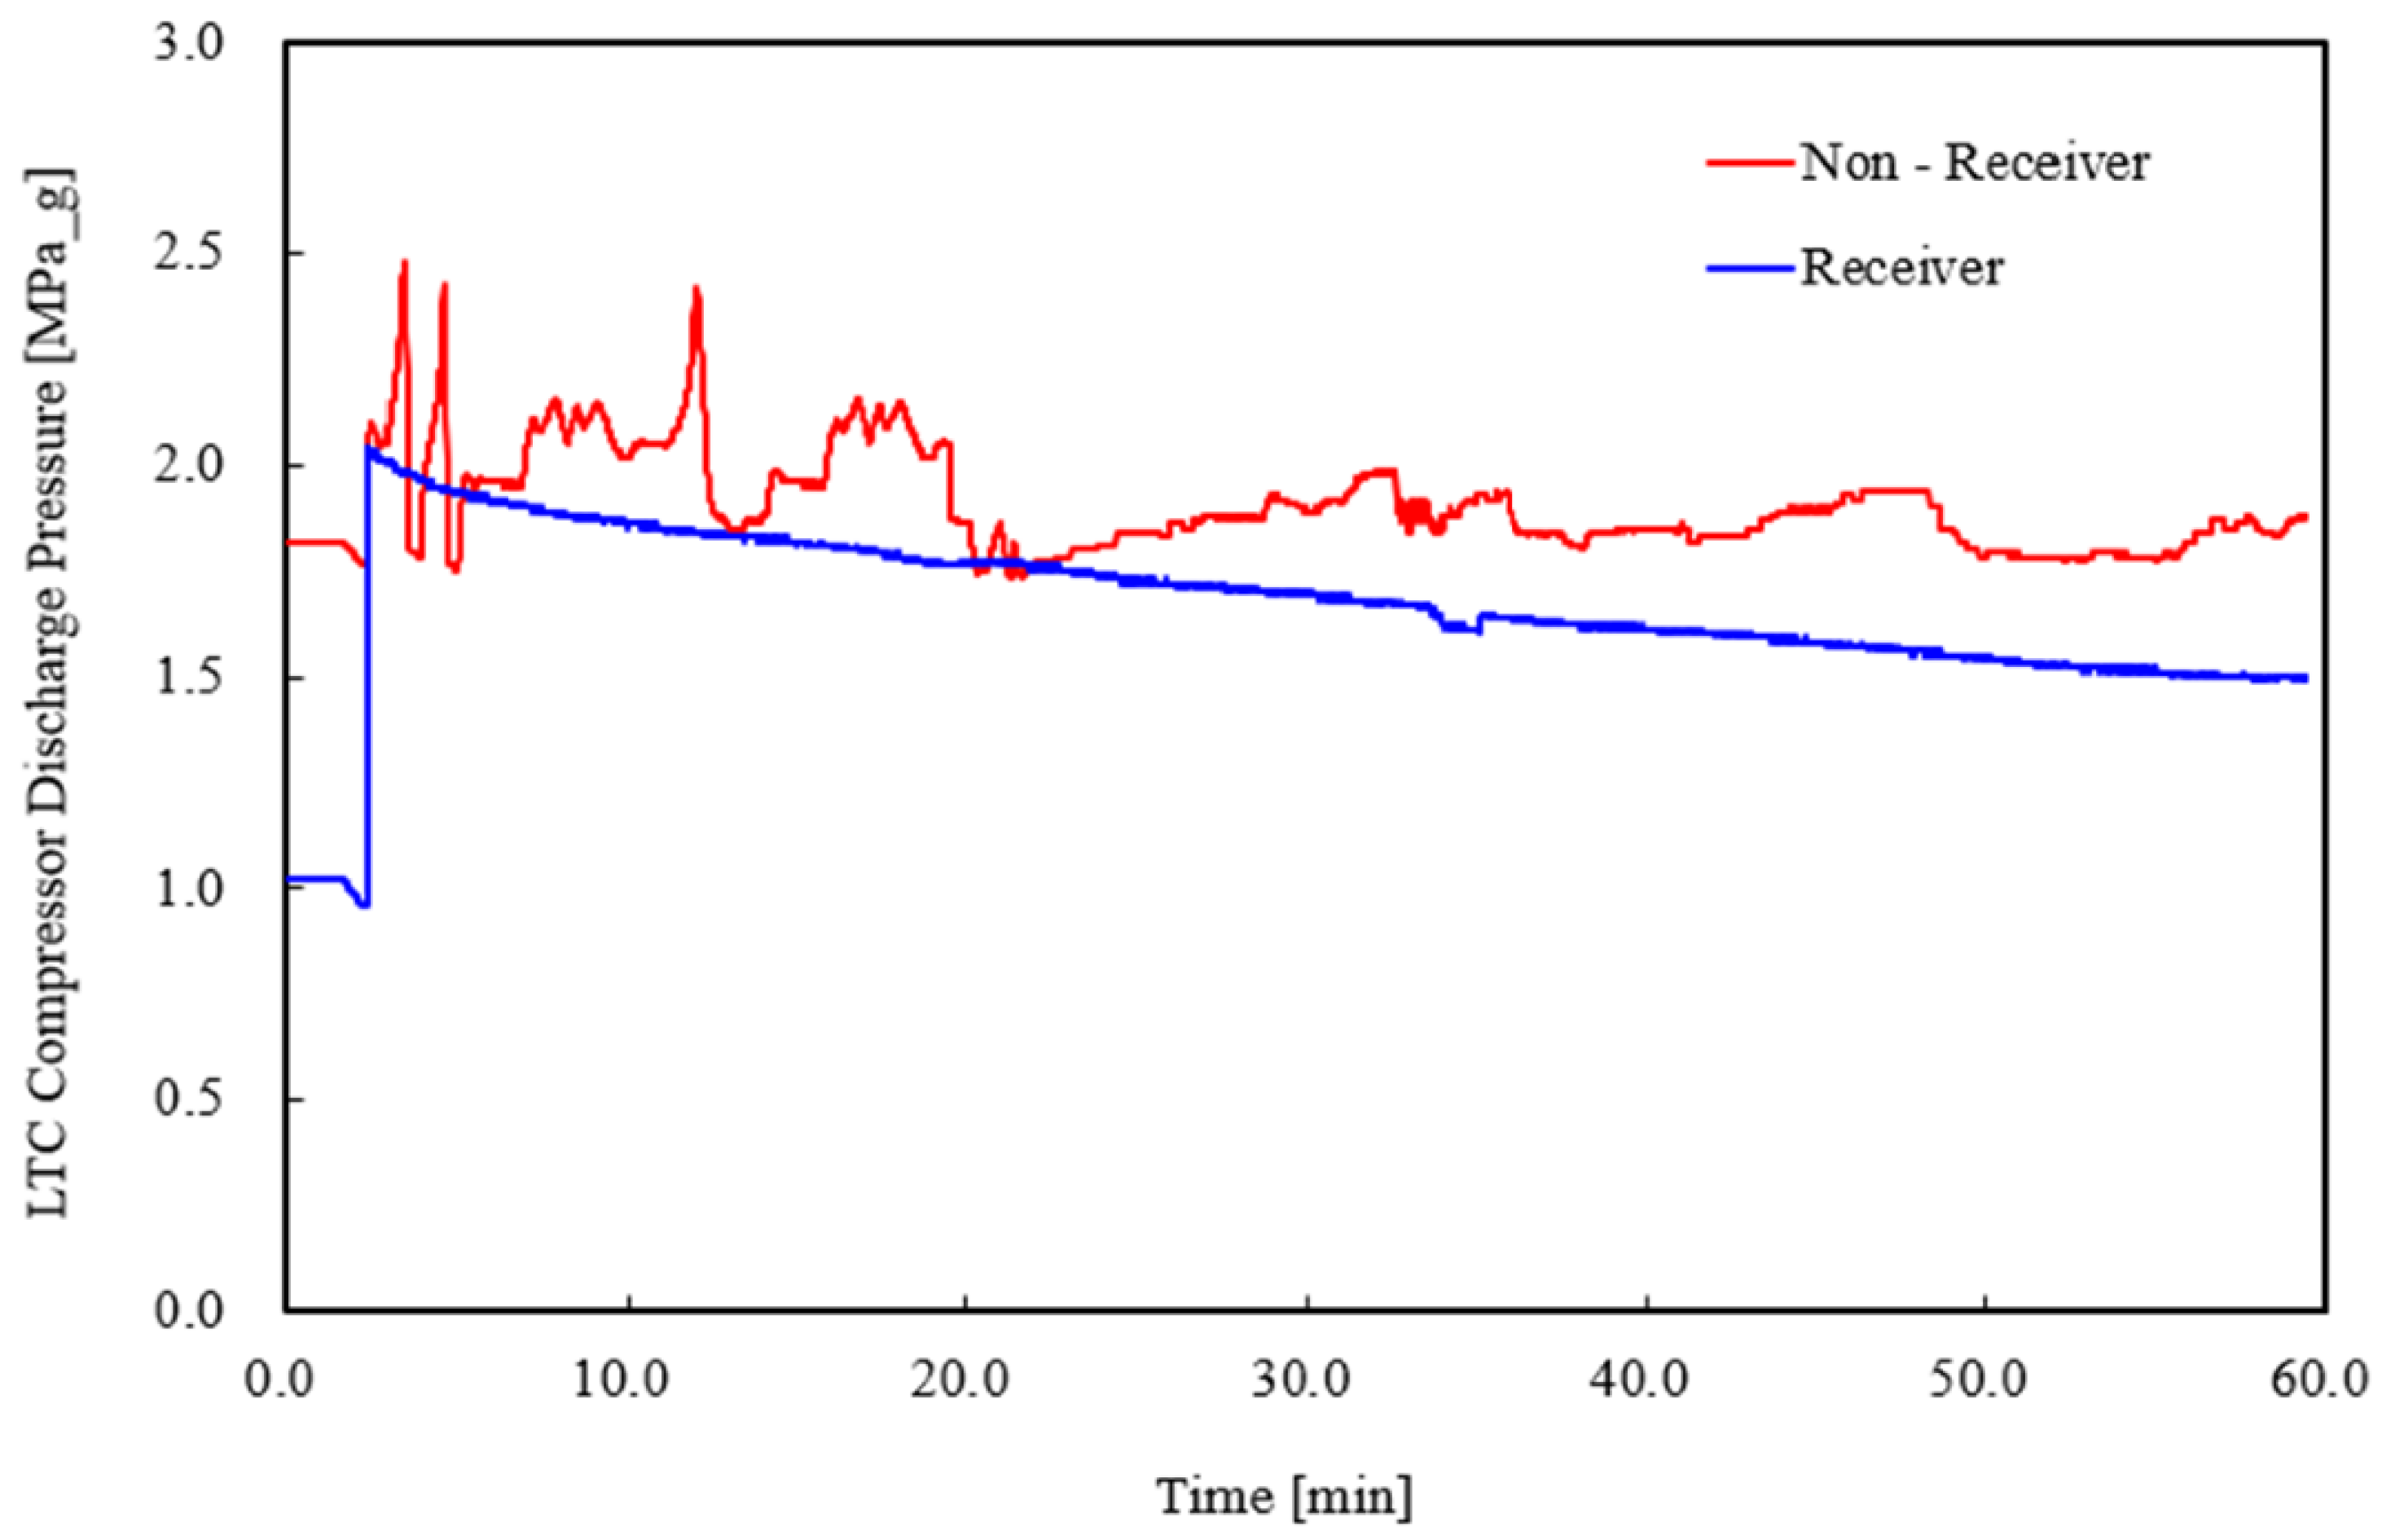
Figure 11 and Figure 12 show the suction and discharge pressures of the LTC compressor based on the presence or absence of a receiver under a refrigerant charge of 4 kg. Notably, the compressor suction pressure is greatly reduced and exhibits stable behavior with receiver usage.
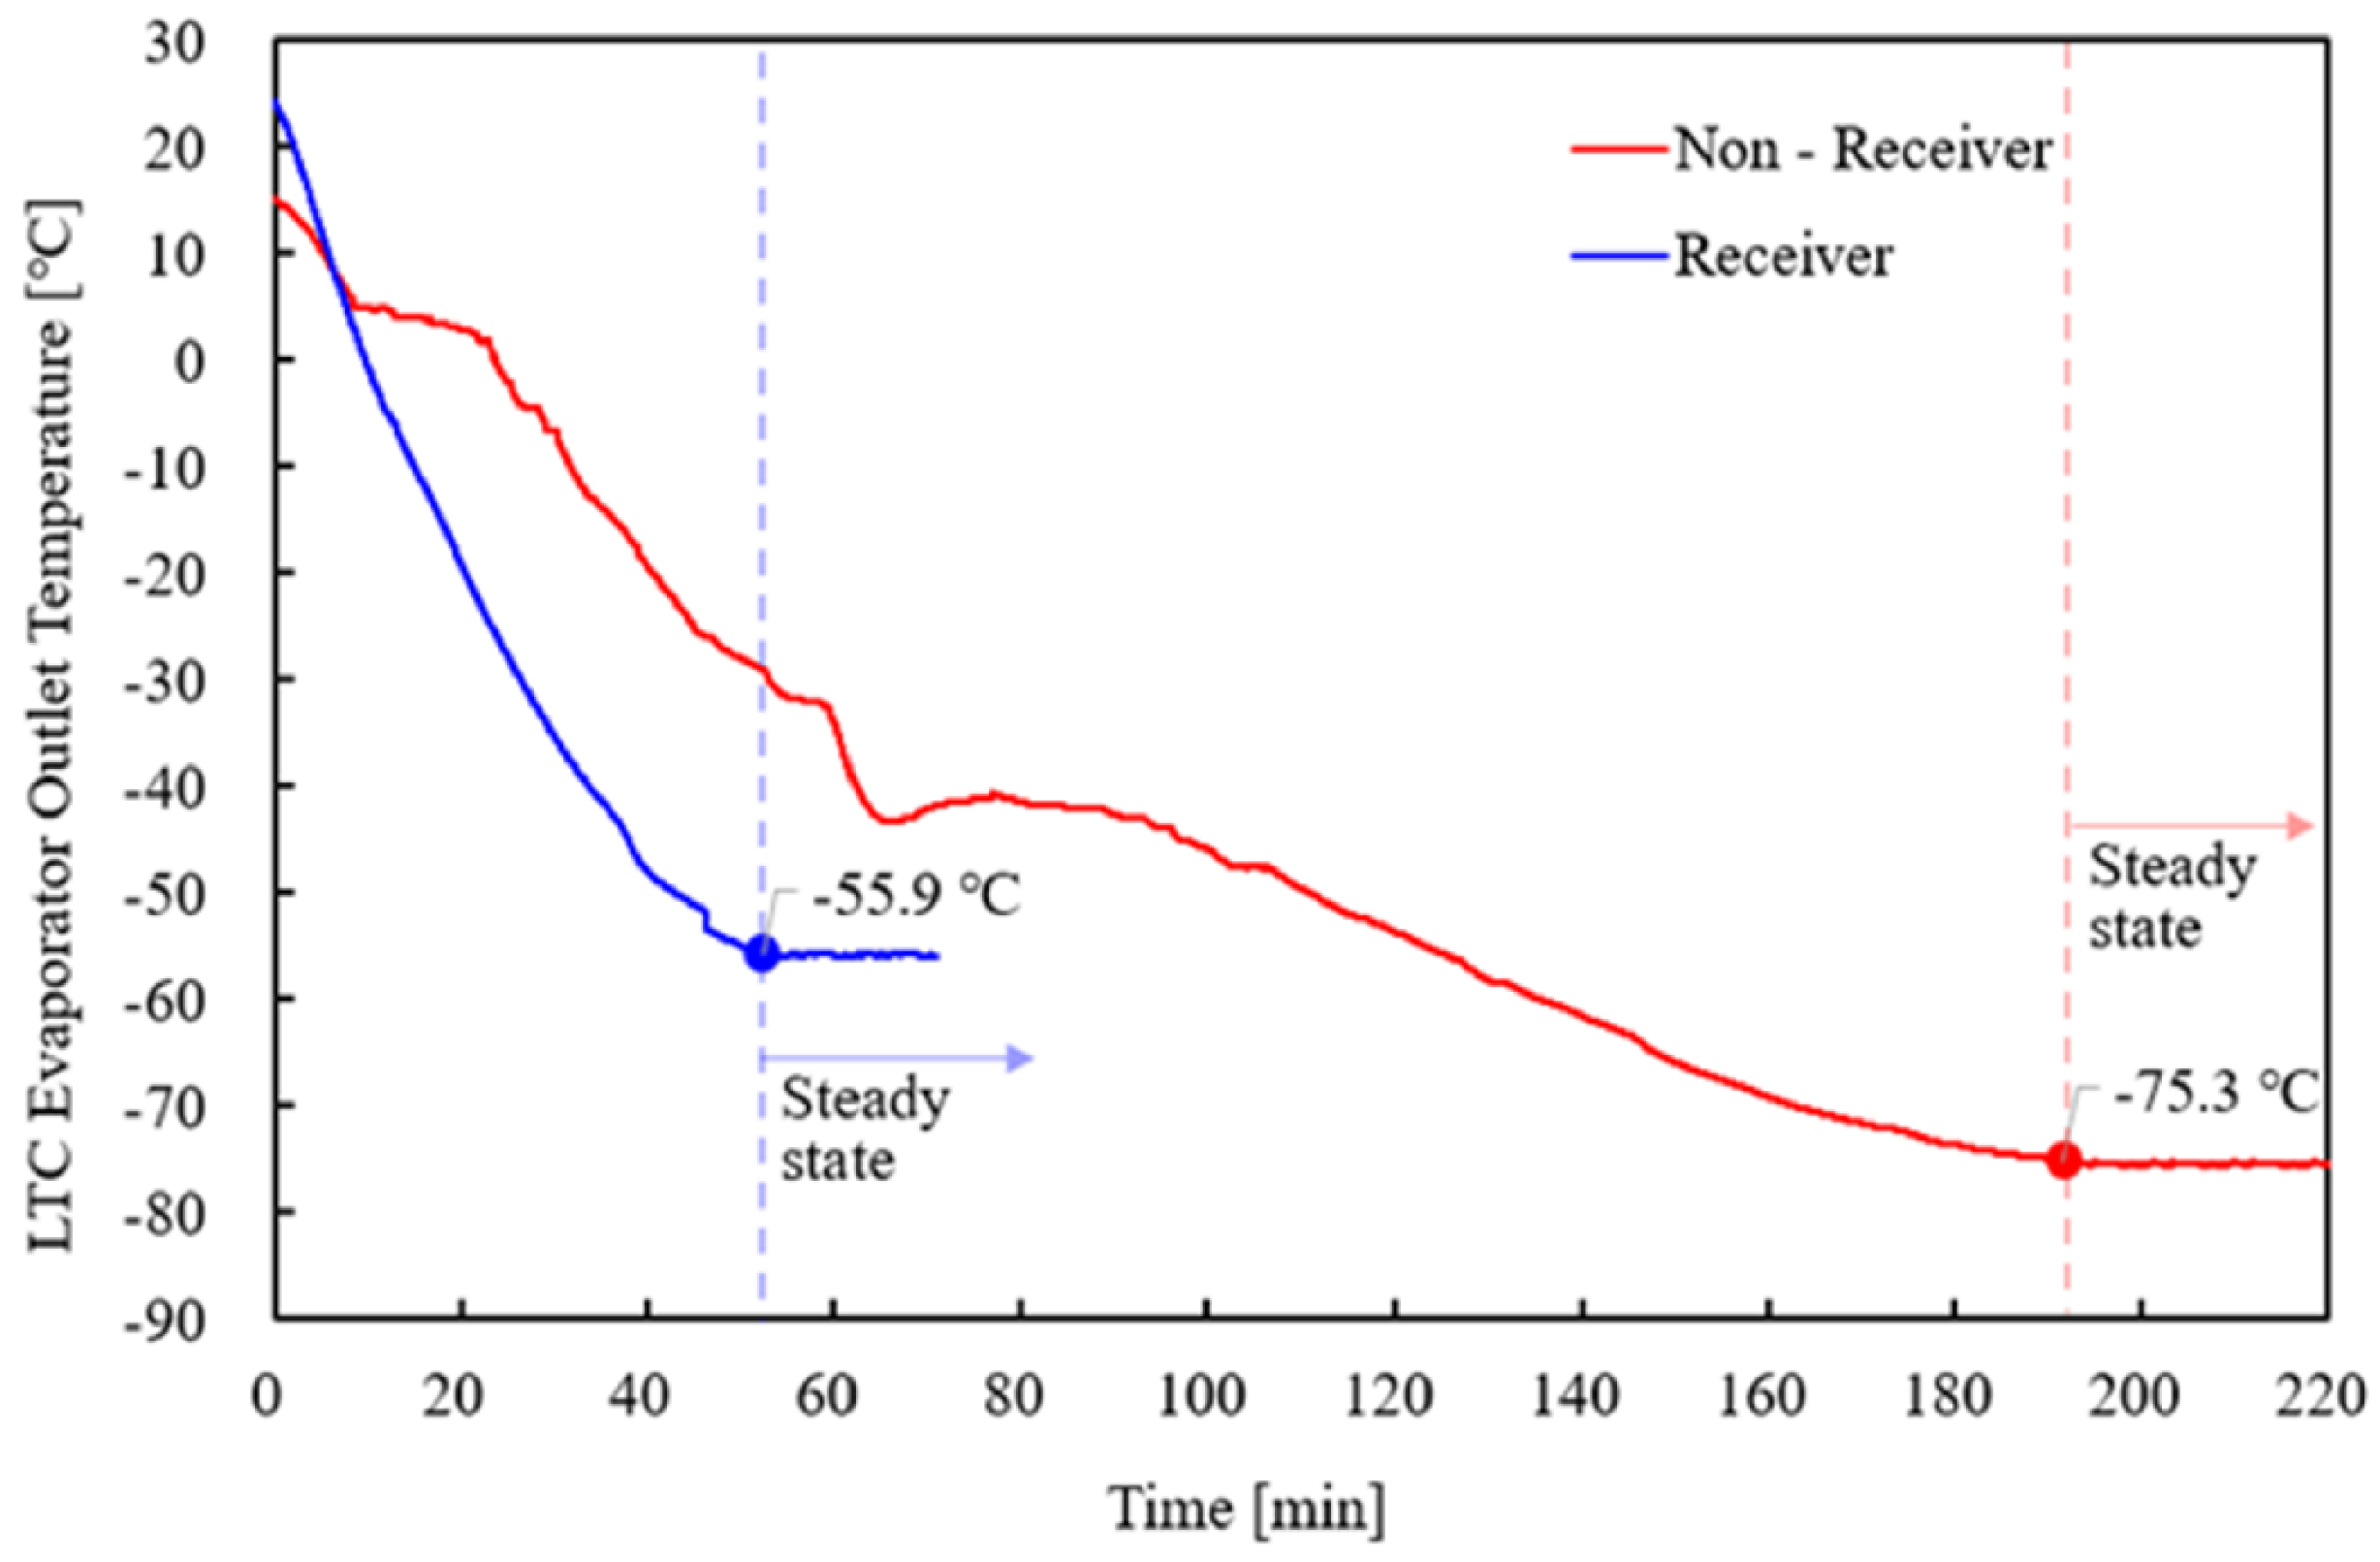
Additionally, under a refrigerant charge of 4 kg, the temperature at each point of the LTC and the time required to reach a steady state were compared based on the presence or absence of a receiver. Figure 13 and Figure 14 compare the suction and discharge temperatures of the LTC compressor, respectively. Figure 15 compares the outlet temperatures of the LTC cascade heat exchanger (LTC condenser). Notably, the change in the LTC cascade outlet temperature is smaller in the presence of a receiver. This can be attributed to the installation of the receiver, which greatly reduces the operational time of the experimental apparatus, enabling a more stable operation by decreasing the cooling time, as shown in Figure 10.
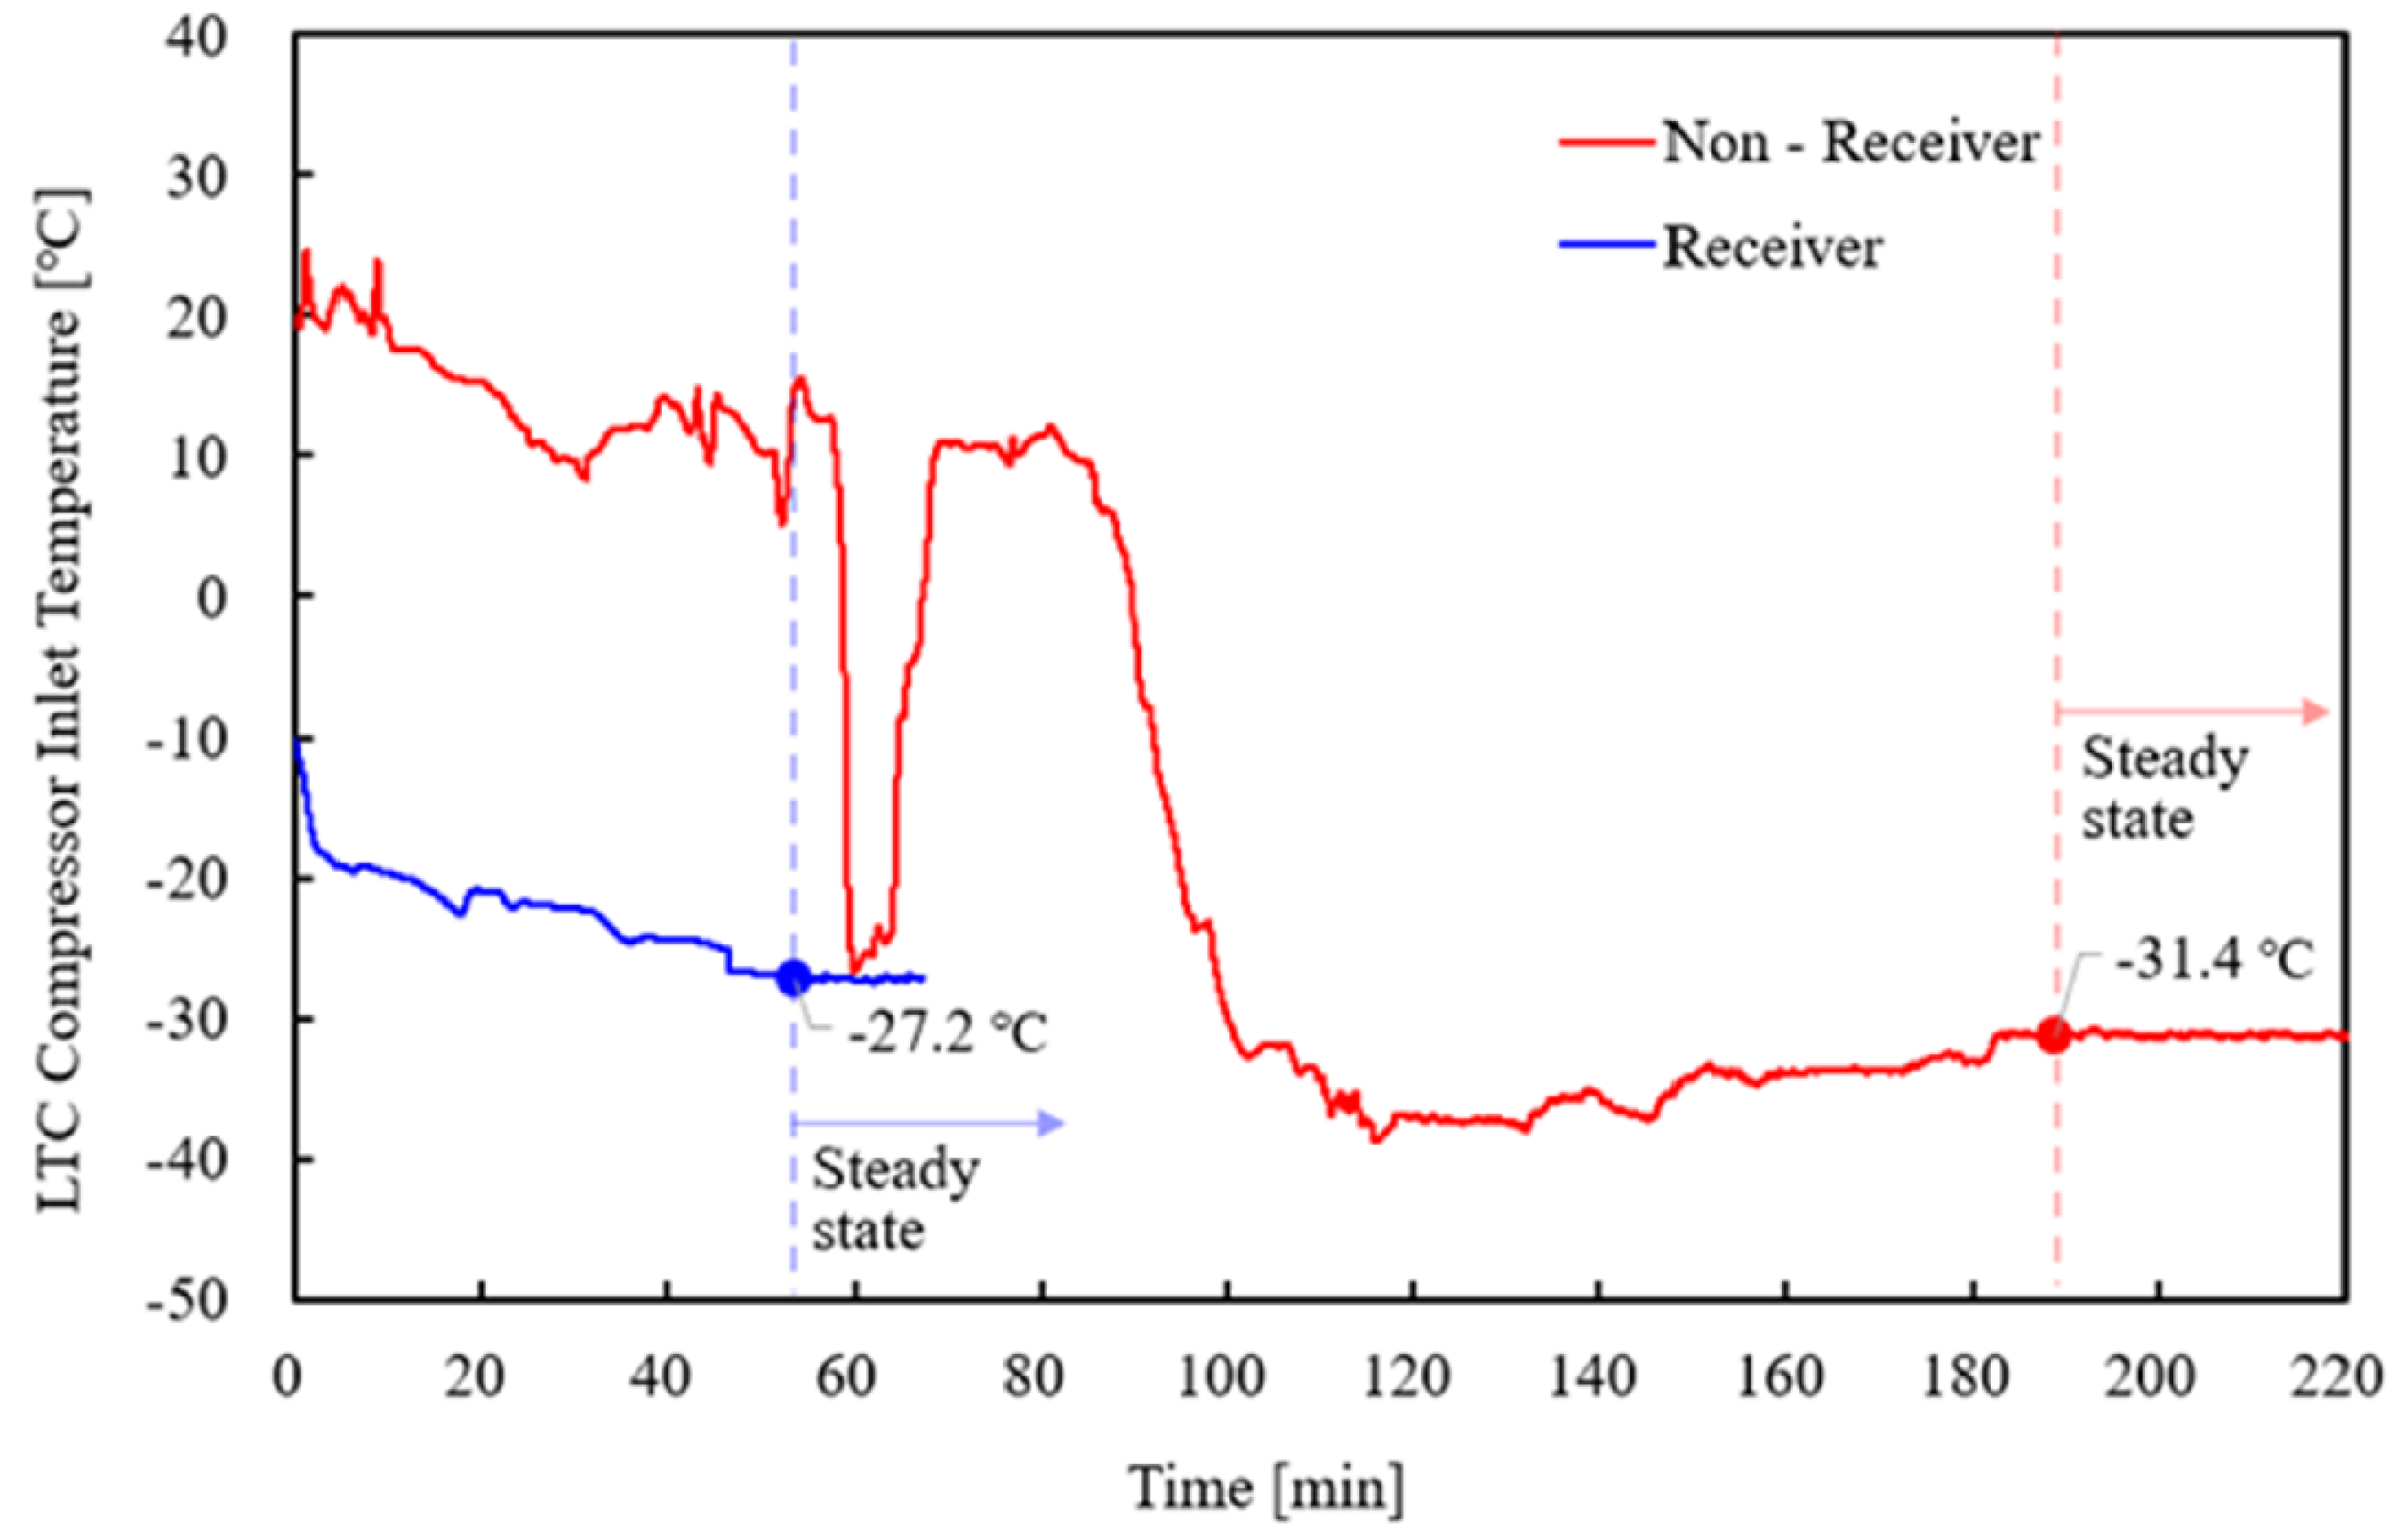
Figure 16 shows a comparison of the LTC IHX first-outlet temperature. Figure 17 and Figure 18 compare the inlet and outlet temperatures of the LTC evaporator, respectively. In the absence of a receiver, the discharge pressure at the beginning of operation peaks at approximately 2.5 MPa_g, as shown in Figure 14, and the LTC cascade outlet temperature fluctuates considerably, as shown in Figure 15. This trend indicates that a refrigerant charge of 4 kg is the limit in the absence of a receiver. In the presence of a receiver, stable operation is possible even when the refrigerant charge amounts are 7, 9, and 11 kg, as shown in Figure 5 and Figure 6, indicating that the limit of the refrigerant charge amount can be overcome to a certain extent in the presence of a receiver.
By analyzing the brine cooling time and LTC behavior based on the presence or absence of a receiver at the same refrigerant charge amount, it was evident that the cooling capacity was large, and the cycle was stable in the presence of the receiver. This trend demonstrates that the receiver in the mixed-refrigerant cascade refrigeration cycle (MRCRC) is directly correlated with the cooling capacity.

5. Conclusions

This study investigated system performance based on the presence or absence of a receiver in an MRCRC. The key conclusions drawn from this analysis are as follows:
  • With a refrigerant charge amount of 4 kg, the suction and discharge pressures of the low-temperature compressor remained low and stable after the receiver was installed.
  • The installation of the receiver significantly shortened the cooling time for the same refrigerant charge of 4 kg, and the cooling time to reach the target temperature decreased as the refrigerant charge amount increased.
  • Following the installation of the receiver, the evaporation heat capacity values were measured at 0.59, 1.76, and 2 kW for charge amounts of 4, 7, and 9 kg, respectively. At the maximum refrigerant charge amount of 11 kg, an evaporation heat capacity of 3.3 kW was observed. The installation of the receiver facilitated stable operation despite increases in the refrigerant charge amount, leading to an enhancement in cooling capacity.
These findings highlight the essential role of a receiver in the MRCRC setup for improving and optimizing cooling capacity. However, it is important to note that the working fluid used in this study was a mixed refrigerant, which may stagnate in larger components (e.g., heat exchangers, oil separators, and receivers), potentially disrupting the circulating composition ratio. Therefore, further research is needed to determine whether the disruption of the circulation composition occurs in each component.

Author Contributions

Writing—original draft, conceptualization, resources, J.-H.L.; validation, resources, data curation, visualization, H.-I.J.; validation, resources, data curation, visualization, S.-B.L.; data curation, validation, formal analysis, supervision, C.-H.S. All authors have read and agreed to the published version of the manuscript.

Funding

This work was partly supported by the Korea Institute of Energy Technology Evaluation and Planning (KETEP) grant funded by the Korea government (MOTIE) (RS-2024-00418835, Development of High-Efficiency Ultra-Low Temperature Refrigeration Equipment for −100 °C Using Natural Refrigerants).

Data Availability Statement

The data presented in this study are the property of the respective companies and are available from the corresponding authors upon request.

Conflicts of Interest

The author declares no conflicts of interest.

Nomenclature

SYMBOLS
CARCConventional auto-cascade refrigeration cycle
CRCCascade refrigeration cycle
HTCHigh-temperature circuit
LTCLow-temperature circuit
MRCRCMixed-refrigerant cascade refrigeration cycle
MSCRCMultistage compression refrigeration cycle
NBPNormal boiling point
NEARCNovel ejector-enhanced auto-cascade refrigeration cycle
QHeat capacitykW
MMass flow ratekg/h
TTemperature°C
CpStatic pressure specific heat kJ/kg K
VVolumetric flowm3/h
hEnthalpykJ/kg
POEPolyol ester oil-
GREEK SYMBOLS
ρDensitykg/m3
SUBSCRIPTS
evaEvaporation-
bBrine-
gGauge-

References

  1. Liu, J.; Liu, Y.; Yu, J.; Yan, G. Thermodynamic analysis of a novel ejector-enhanced auto-cascade refrigeration system. Appl. Therm. Eng. 2022, 200, 117636. [Google Scholar] [CrossRef]
  2. Liu, S.; Bai, T.; Wei, Y.; Yu, J. Performance analysis of modified ejector-enhanced auto-cascade refrigeration cycle. Energy 2023, 265, 126334. [Google Scholar] [CrossRef]
  3. Sivakumar, M.; Somasundaram, P. Exergy and energy analysis of three stage auto refrigerating cascade system using Zeotropic mixture for sustainable development. Energy Convers. Manag. 2014, 84, 589–596. [Google Scholar] [CrossRef]
  4. Tan, Y.; Li, X.; Wang, L. Thermodynamic performance of the fractionated auto-cascade refrigeration cycle coupled with two-phase ejector using R1150/R600a at −80 °C temperature level. Energy 2023, 281, 128328. [Google Scholar] [CrossRef]
  5. Zhang, L.; Xu, S.; Du, P.; Liu, H. Experimental and theoretical investigation on the performance of CO2/propane auto-cascade refrigerator with a fractionation heat exchanger. Appl. Therm. Eng. 2015, 87, 669–677. [Google Scholar] [CrossRef]
  6. He, Y.; Wu, H.; Liu, Y.; Wang, T.; Wu, X.; Cheng, C.; Jin, T. Theoretical performance comparison for two-stage auto-cascade refrigeration system using hydrocarbon refrigerants. Int. J. Refrig. 2022, 142, 2736. [Google Scholar] [CrossRef]
  7. Liopis, R.; Martinez-Angeles, M.; Garcia-Valero, M. A novel method to measure the energy efficiency and performance of an auto-cascade refrigeration cycle. Appl. Therm. Eng. 2023, 233, 121146. [Google Scholar] [CrossRef]
  8. Gong, M.; Sun, Z.; Wu, J.; Zhang, Y.; Meng, C.; Zhou, Y. Performance of R170 mixtures as refrigerants for refrigeration at –80 °C temperature range. Int. J. Refrig. 2009, 32, 892–900. [Google Scholar] [CrossRef]
  9. Liu, J.; Liu, Y.; Yan, G.; Yu, J. Thermodynamic analysis on a modified auto-cascade refrigeration cycle with a self-recuperator. Int. J. Refrig. 2022, 137, 117–128. [Google Scholar] [CrossRef]
  10. Yan, G.; Yan, J.; Yu, J. Energy and exergy analysis of a new ejector enchanced auto-cascade refrigeration cycle 105. Energy Convers. Manag. 2015, 105, 509–517. [Google Scholar] [CrossRef]
  11. Yu, J. Improving the performance of small Joule–Thomson cryocooler. Cryogenics 2008, 48, 426–431. [Google Scholar] [CrossRef]
  12. Bai, T.; Li, D.; Xie, H.; Yan, G.; Yu, J. Experiemental research on a Joule–Thomson refrigeration cycle with mixture R170/R290 for –60 °C low-temperature freezer. Appl. Therm. Eng. 2021, 186, 116476. [Google Scholar] [CrossRef]
  13. Walimbe, N.S.; Narayankhedkar, K.G. Atrey. M.D. Experimental investigation on mixed refrigerant Joule–Thomson cryocooler with flammable and non-flammable refrigerant mixtures. Cryogenics 2010, 50, 653–659. [Google Scholar] [CrossRef]
  14. Bai, T.; Yan, G.; Yu, J. Influence of internal heat exchanger position on the performance of ejector-enhanced auto-cascade refrigeration cycle for the low-temperature freezer. Energy 2022, 238, 121803. [Google Scholar] [CrossRef]
  15. Yan, G.; He, C.; Yu, J. Theoretical investigation on the performance of a modified refrigeration cycle using binary zeotropic hydrocarbon mixture R170/R290. Int. J. Refrig. 2018, 94, 111–117. [Google Scholar] [CrossRef]
  16. Qin, Y.; Li, N.; Zhang, H.; Jin, B.; Liu, B. Experimental characterization of an innovative refrigeration system coupled with Linde–Hampson cycle and auto-cascade cycle for multi-stage refrigeration temperature applications. Energy 2022, 240, 122498. [Google Scholar] [CrossRef]
  17. Gong, M.; Wu, J.; Cheng, Q.; Sun, Z.; Liu, J.; Hu, Q. Development of a –186 °C cryogenic preservation chamber based on a dual mixed-gases Joule–Thomson refrigeration cycle. Appl. Therm. Eng. 2012, 36, 188–192. [Google Scholar] [CrossRef]
  18. Tzabar, N. Binary mixed-refrigerants for steady cooling temperatures between 80 K and 150 K with Joule–Thomson cryocoolers. Cryogenics 2014, 64, 70–76. [Google Scholar] [CrossRef]
  19. Rozhentsev, A.; Naer, V. Investigation of the starting modes of the low-temperature refrigerating machines working on the mixtures of refrigerants. Int. J. Refrig. 2009, 32, 901–910. [Google Scholar] [CrossRef]
  20. 3M. 3M Novec 7500 Engineeried Fluid. Available online: https://multimedia.3m.com/mws/media/65496O/3m-novec-7500-engineered-fluid.pdf (accessed on 8 October 2024).
Figure 1. Schematic diagram of the experimental apparatus.
Energies 17 05144 g001
Figure 2. LTC compressor suction pressure based on different refrigerant charge amounts.
Energies 17 05144 g002
Figure 3. LTC compressor discharge pressure based on different refrigerant charge amounts.
Energies 17 05144 g003
Figure 4. LTC brine supply temperature based on different refrigerant charge amounts.
Energies 17 05144 g004
Figure 5. LTC compressor suction pressure based on different refrigerant charge amounts.
Energies 17 05144 g005
Figure 6. LTC compressor discharge pressure based on different refrigerant charge amounts.
Energies 17 05144 g006
Figure 7. LTC brine cooling time to minimum temperature based on different refrigerant charge amounts.
Energies 17 05144 g007
Figure 8. P-h diagram of the mixed refrigerant.
Energies 17 05144 g008
Figure 9. Evaporation heat capacity using different refrigerant charge amounts.
Energies 17 05144 g009
Figure 10. Brine cooling time to minimum temperature after receiver installation.
Energies 17 05144 g010
Figure 11. LTC compressor suction pressure based on using a receiver.
Energies 17 05144 g011
Figure 12. LTC compressor discharge pressure based on using a receiver.
Energies 17 05144 g012
Figure 13. LTC compressor suction temperature with respect to receiver usage.
Energies 17 05144 g013
Figure 14. LTC compressor discharge temperature with respect to receiver usage.
Energies 17 05144 g014
Figure 15. LTC cascade outlet temperature with respect to receiver usage
Energies 17 05144 g015
Figure 16. LTC IHX first-outlet temperature with respect to receiver usage.
Energies 17 05144 g016
Figure 17. LTC evaporator inlet temperature with respect to receiver usage.
Energies 17 05144 g017
Figure 18. LTC evaporator outlet temperature with respect to receiver usage.
Energies 17 05144 g018
Table 1. Previous research on the similar target temperature ranges of this study.
AuthorTarget TemperatureRefrigerantEvaporation CapacityReceiver Type
Liu et al. [1]−65 °CR-290, R-170108.612 WNo
Liu et al. [2]−55 °CR-170, R-290149.94 WNo
Sivakumar et al. [3]−97 °CR-290, R-23, R-1456.70 WNo
Tan et al. [4]−81 °CR-1150, R-600a1.4 kWNo
Zhang et al. [5]−48 °CR-744, R-290200 WNo
He et al. [6]−50 °CR-170, R-600750 WNo
Liopis et al. [7]−80 °CR-600a, R-1150150 WNo
Gong et al. [8]−80 °CR-170, R-116150 WNo
Liu et al. [9]−60 °CR-600a, R-1150135.28 WNo
Yan et al. [10]−55 °CR-134a, R-2370 WNo
Table 2. Fluids used in the experimental apparatus.
FluidMaterial
RefrigerantHTCR-404A
LTCR-134a, R-125, R-23, R-14
BrineNOVEC-7500 (provided by 3M)
Compressor oilSW—22P (POE)
Cooling waterH2O
Table 3. Composition ratio of the LTC mixed refrigerant.
RefrigerantR-134aR-125R-23R-14
Mass fraction0.20.130.090.58
Table 4. Experimental conditions of each experiment.
CaseParametersValueUnit
1
(Non-receiver type)
Target brine supply temperature−80°C
LTC
refrigerant charge amount
2–4kg
Brine volume flow20LPM
Cooling water temperature19–20°C
Cooling water volume flow45–46LPM
Compressor speed60Hz
2
(Receiver type)
Target brine supply temperature−80°C
LTC
refrigerant charge amount
4–11kg
Brine volume flow20LPM
Cooling water temperature19–20°C
Cooling water volume flow45–46LPM
Compressor speed60Hz
Disclaimer/Publisher’s Note: The statements, opinions and data contained in all publications are solely those of the individual author(s) and contributor(s) and not of MDPI and/or the editor(s). MDPI and/or the editor(s) disclaim responsibility for any injury to people or property resulting from any ideas, methods, instructions or products referred to in the content.