Article

Time-Domain Fault Detection and Location Scheme for Flexible DC Distribution Networks

1
State Grid Suzhou Power Supply Company, Suzhou 215004, China
2
School of Electrical Engineering and Automation, Nantong University, Nantong 226019, China
*
Author to whom correspondence should be addressed.
Energies 2024, 17(20), 5128; https://doi.org/10.3390/en17205128
Submission received: 3 September 2024 / Revised: 2 October 2024 / Accepted: 13 October 2024 / Published: 15 October 2024
(This article belongs to the Section F: Electrical Engineering)

Abstract

:
Accurately detecting and locating the fault point of the DC line is significant for eliminating the fault and restoring the power supply of the flexible DC distribution network as soon as possible. Firstly, a direction pilot protection scheme for a complex DC distribution network is proposed based on the integral of the current superposition to identify the fault direction. Then, an online time-domain fault location method based on the least square (LS) method to solve the overdetermined equations is proposed by analyzing the fault loop circuit after the DC line fault. The proposed location scheme utilizes fault data at both ends of the line to eliminate the theoretical impact of fault resistance, and the calculation of the current difference method is discussed to reduce the location error of whether the fault current-limiting reactor (CLR) exists. Finally, various simulations by PSCAD/EMTDC V4.5 demonstrate that the proposed scheme has high protection reliability and location results after different fault positions and resistances. The proposed scheme has low requirements for the sampling rate, fault data length, and implementation costs, which can meet practical application requirements.

1. Introduction

With the significant progress of power semiconductor devices and the rapid development of DC loads, distributed generation (DG), energy storage systems, etc., DC distribution networks or DC microgrids have advantages, such as high transmission capacity, large power supply radius, more suitable access to DGs, excellent power quality, and low line losses [1,2,3]. Protection technology, as a bottleneck in the application of DC distribution, is still in the theoretical research stage [4,5]. When a DC line malfunctions, to quickly eliminate the fault and restore the power supply, it is important to detect and locate the fault point accurately [6].
On the one hand, although single-ended fault detection schemes, such as overcurrent protection (O/C), low-voltage protection (Under-voltage), and current direction, can meet the requirements of fault protection for speed response, they are difficult to ensure selectivity, have low reliability, and cannot detect high-resistance ground faults [4,7]. Usually in DC networks, to limit the rapid rise of short-circuit currents, current-limiting reactors (CLRs) are connected in series on both ends of the DC line. The CLRs can play a role in smoothing fault signals and forming the boundary of protection. Therefore, the voltage change rate-based protection method can accelerate the speed and sensitivity of fault detection. Reference [8] employs the frequency domain impedance to detect the DC faults in DC distribution grids. The single-ended method can accelerate the speed of fault protection without relying on communication systems and has a simple principle. However, in complex flexible DC distribution networks, the reliability and selectivity of protection are insufficient. References [9,10,11,12,13] study the application of communication-based current differential protection in DC distribution systems. Reference [12] proposes a pilot protection scheme that utilizes the direction of current at both ends of the line. In the case of high-resistance faults, the amplitude of the fault current is small, and there are limitations to current differential protection and current direction pilot protection. To solve the problem of identifying high-resistance faults, Reference [13] adopts a pilot protection scheme with current superposition, but it is hard to ensure reliability by only comparing the directional information at a certain moment.
On the other hand, the DC cable lines are mostly buried underground, and time-consuming and labor-intensive manual line inspection makes it difficult to detect the fault point. Moreover, since DC circuit breakers (DCCBs) will quickly cutoff faulty lines, the length of data available for fault location is limited, which increases the difficulty of online fault location. The distance between DC distribution lines is relatively short. Using the traditional traveling-wave fault location method may require a higher sampling rate to ensure distance accuracy, which is costly, and it is difficult to eliminate interference from multiple reflections in complex networks.
At present, the fault location of DC distribution lines can be divided into two categories. The first type is the injection signal method. References [14,15,16] use a probe power unit (PPU) to inject signals for fault location. Its essence is to input a capacitor bank with initial voltage to form RCL second-order attenuation oscillation in the fault circuit and extract oscillation information through algorithms, such as FFT [14] and Prony [15,16], to calculate the fault distance. Reference [16] equates cable lines to π models, adopts the concept of apparent pseudo-impedance, and uses the Prony algorithm to extract attenuation oscillation parameters. The above injection signal method is used for fault location after the completion of DCCB operation, which requires additional distance-measuring devices and increases the cost of fault location.
The second type is online fault location methods. Reference [17] uses a discrete median filter and mathematical morphology to design a diagnosis scheme for DC distribution systems. Reference [18] establishes the circuit equations for the discharge stages of the capacitors at both ends of the line and eliminates the influence of fault resistance to calculate the fault distance. However, the above method does not regard the influence of adjacent lines and is only applicable to point-to-point DC lines. Reference [19] utilizes the Hausdorff distance and cubic spline interpolation to locate the fault, but a higher sampling rate is required to ensure location accuracy. Reference [20] obtains two independent equations from two different measurement values at different time points after a DC line short-circuit fault and solves the fault circuit parameters for fault location. However, it does not apply to single-pole grounding faults. References [21,22,23,24] use a series of measurement data after a fault to calculate the reactance between the protection measurement point and the fault point by solving the pseudo-inverse matrix, thereby calculating the fault distance. However, the influence of distributed capacitance is not considered, and only fault data from one end are utilized, which cannot eliminate the influence of multiple power sources and are only applicable to radial networks.
To accurately detect and locate the fault point, this paper first proposes a direction pilot protection scheme suitable for complex DC distribution networks in Section 2. Secondly, based on the analysis of the state equation of the fault circuit, an online fault location scheme is proposed, and the current difference calculation problem is discussed regarding whether the CLR exists or not in Section 3. Finally, the performance of the proposed fault detection and fault location scheme is verified through PSCAD/EMTDC in Section 4. Conclusions are drawn in Section 5. The proposed scheme is suitable for complex DC networks and has high reliability and accuracy under different fault resistances and locations.

2. Fault Detection for Flexible DC Networks

In response to the limitations of existing fault detection schemes for DC distribution networks, especially in complex mesh DC distribution grids, this paper proposes a fault detection scheme suitable for complex mesh DC distribution networks. The protection station’s intelligent electronic devices (IEDs) collect each outgoing line’s current in real time at a lower sampling rate (such as 5 kHz) and communicate data with adjacent stations. The protection schematic is shown in Figure 1, where DC buses A and B have n and m feeders, respectively, line AB is the DC line connecting DC buses A and B, i1 and i2 are the collection currents of IED A and B by current sensors, and f is the fault point. Once the IED detects a DC line fault, the IED will send an action command to DCCB to cutoff the faulty line.
This fault detection scheme is based on data communication, and due to the short distance of the DC distribution network, communication delay can be accepted to a certain extent [10,11]. If the system requires a high speed of protection, it would be used as a backup protection scheme.
To distinguish between normal and disturbance situations, the current change is used to detect disturbances, and the start-up criterion is as follows:
Δ i n m ( k ) = n = 0 M 1 i m n ( k M + n + 1 ) i m n ( k M + n ) > Λ
where imn is the DC flowing from the DC bus m along the DC line to the DC bus n, k is the corresponding sampling point, the current reference direction is the direction of the bus flowing toward the line by default, M is the data length for the start-up criterion, and Λ is the set threshold value. To detect most grounding fault disturbances (more than 100 Ω fault resistance) under a 10 kHz sampling rate of a 10 kV DC system, the optimal values for case studies in this paper were set as M = 3 and Λ = 20 A. When the starting criterion was met, subsequent protection actions were taken.
The integral of the current superposition can be expressed discretely as follows:
S n m = j = 0 N 1 ( i n m ( k + j ) i pre )
where ipre is the steady-state current, which can be expressed as ipre = i(kP). In this paper, P = 5 was adopted for the case study according to our large number simulation, and the data calculation length was N = 8 after taking into account both the reliability and computational speed. The fault direction can be determined by integrating the positive and negative values of the current superposition, and the criterion is as follows:
S n m > k 1 ,   forward fault S n m k 1 ,   reverse   fault   or   healthy
where k1 is the reliability coefficient, which was set as 0.1 in this paper.
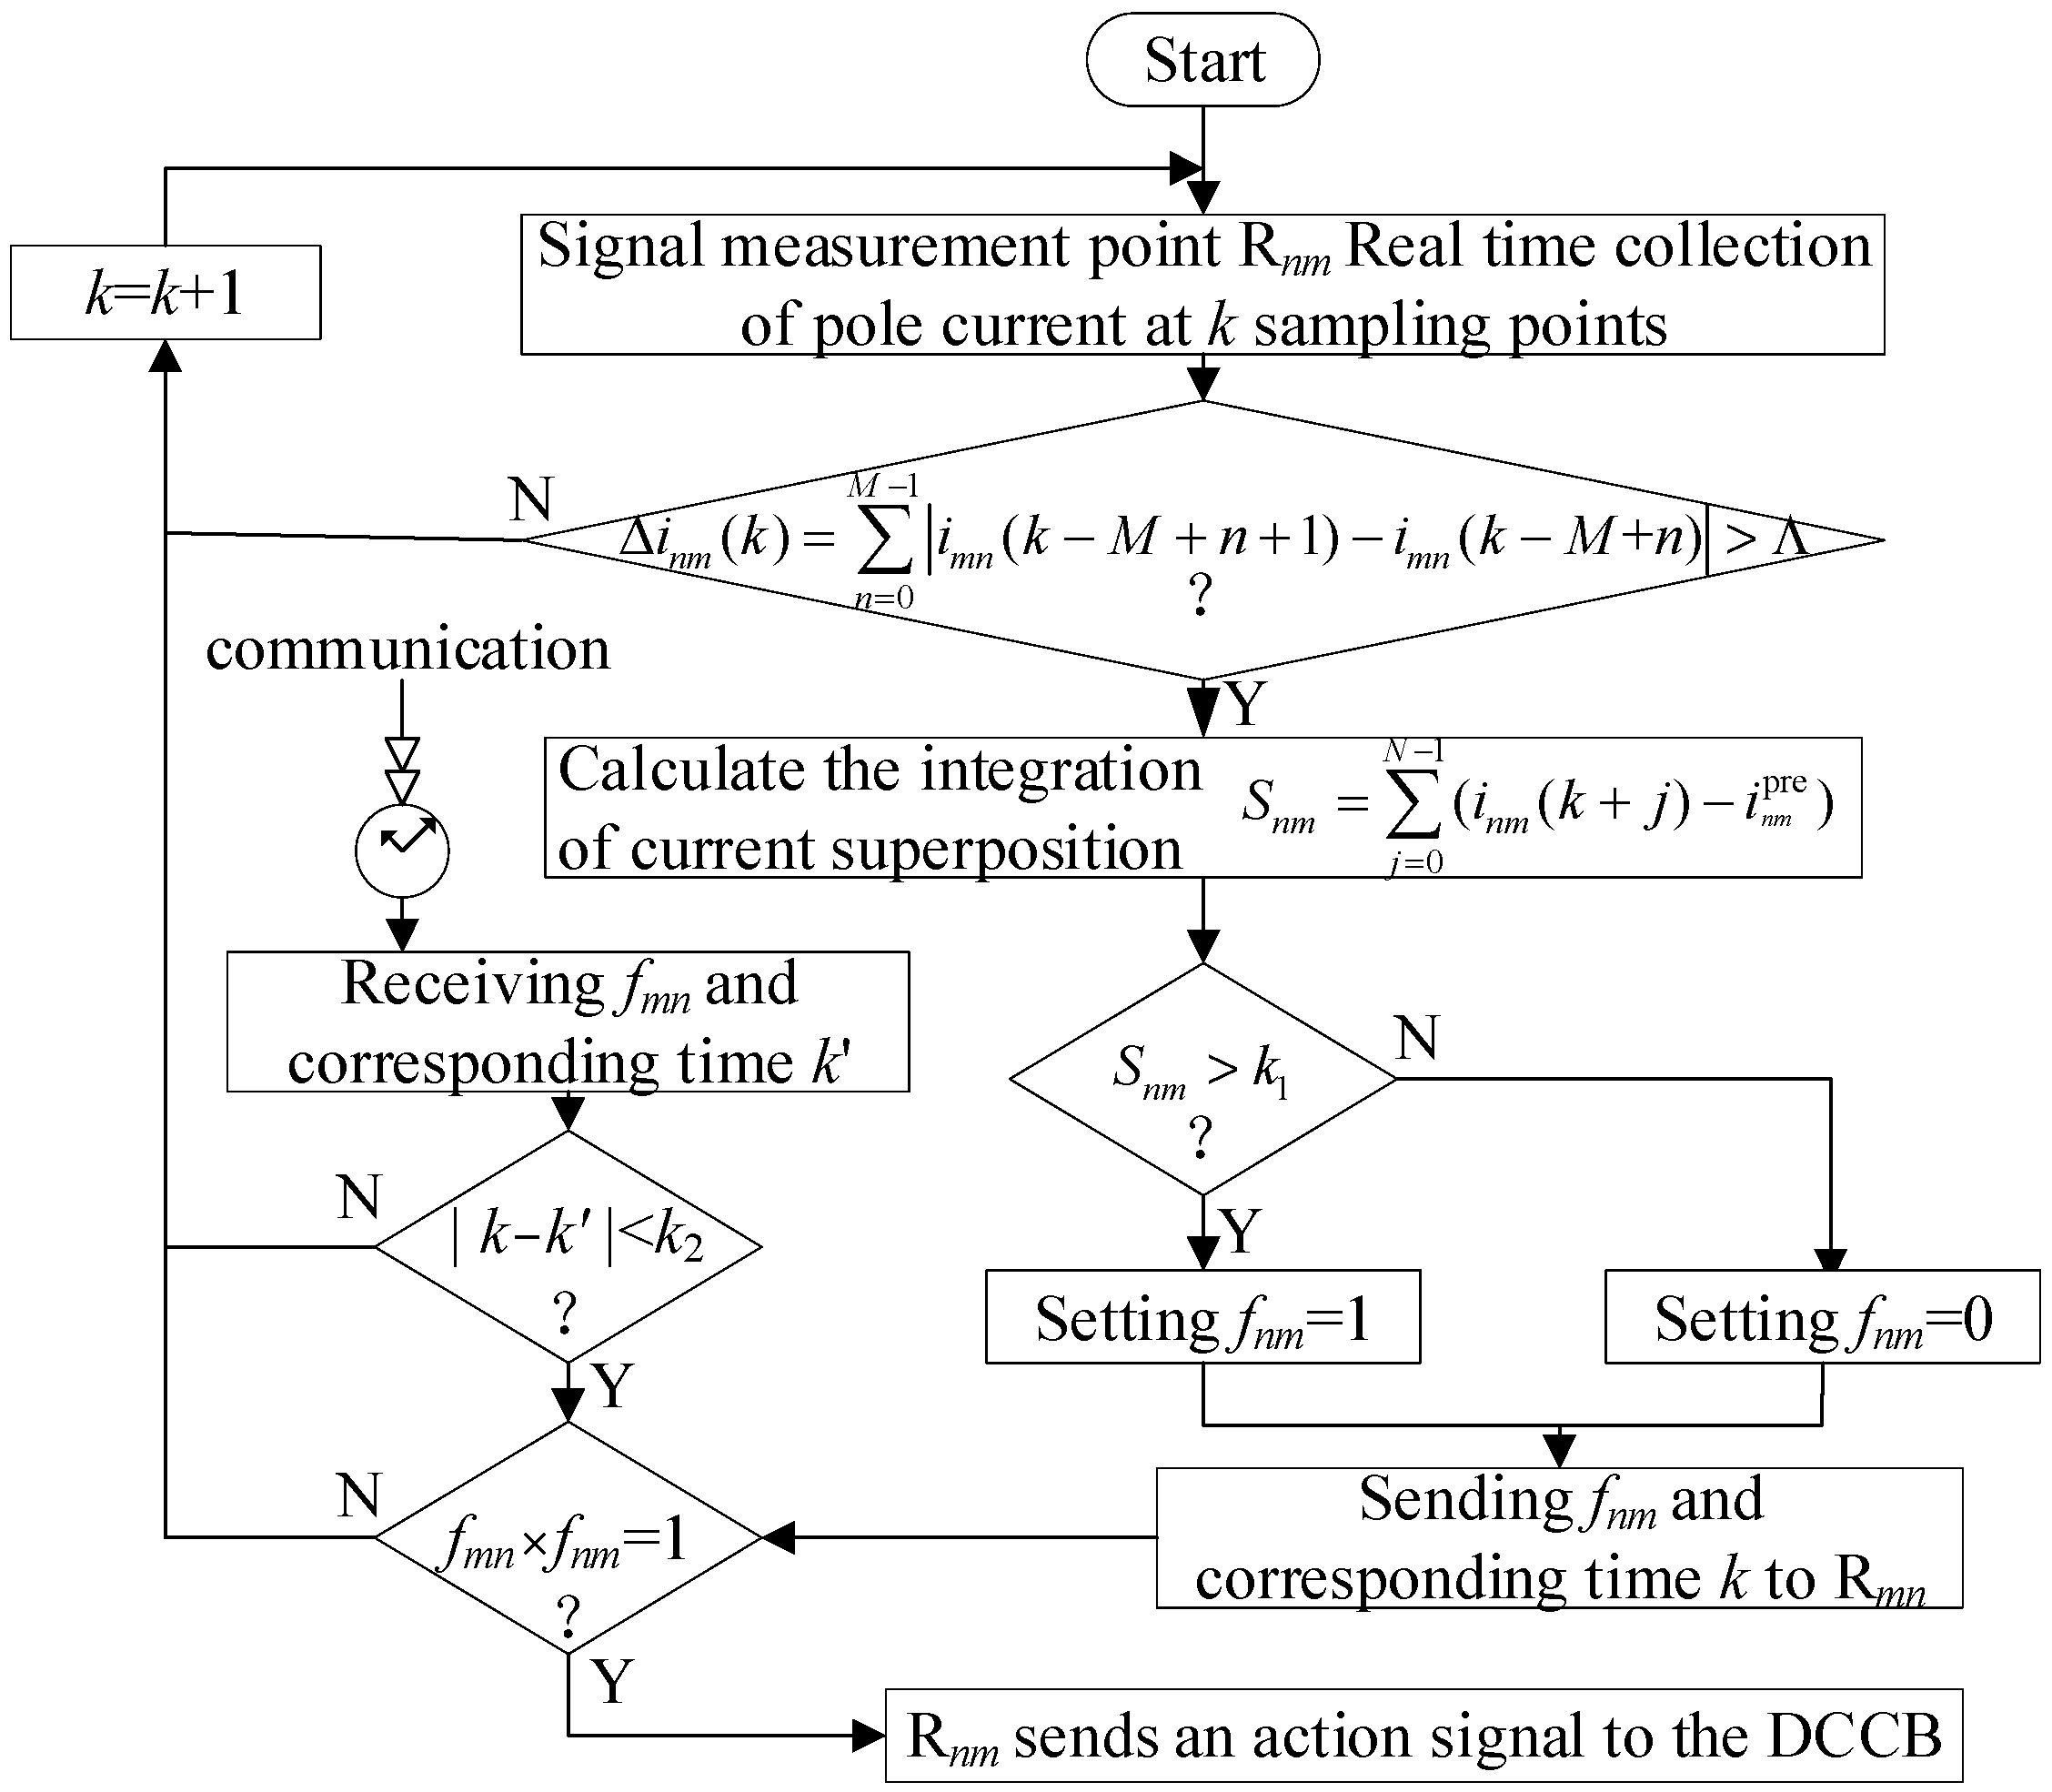
The flowchart of the proposed direction pilot protection scheme is depicted in Figure 2. The signal measurement point (SMP), Rnm, samples the pole current at time k in real time and determines whether the starting criterion is met. If it does not meet the requirements, the next data point is sampled.
After meeting the startup criteria, the integral value, Snm, of the current superposition at the k-sampling time is calculated. A label symbol, fnm, is used to determine whether it is a positive-direction fault. The label symbol, fnm, and fault sampling time, k, are transmitted to the SMP, Rmn. The protection setting method of the SMP, Rmn, on the other end is similar to the local Rnm.
After obtaining the positive direction fault, fnm = 1, Rnm receives the signal, fmn, and corresponding time, k′, sent by the other end Rmn and determines whether the difference between k and k′ is greater than a set value k2. This criterion is mainly to avoid mis-operation caused by long waiting times. The value of k2 is greater than the maximum communication delay and multiplied by a reliability coefficient.
It is worth noting that the data at both terminals do not need to be strictly synchronized (general Beidou or GPS satellite synchronization is required).

3. Principle of Fault Location Scheme

The following sections will introduce the principle of online fault location and study the fault circuits after the pole-to-ground (PTG) fault and pole-to-pole (PTP) fault to locate the fault point, mainly discussing the existence and absence of CLRs at both ends of DC lines.

3.1. DC Lines without CLRs

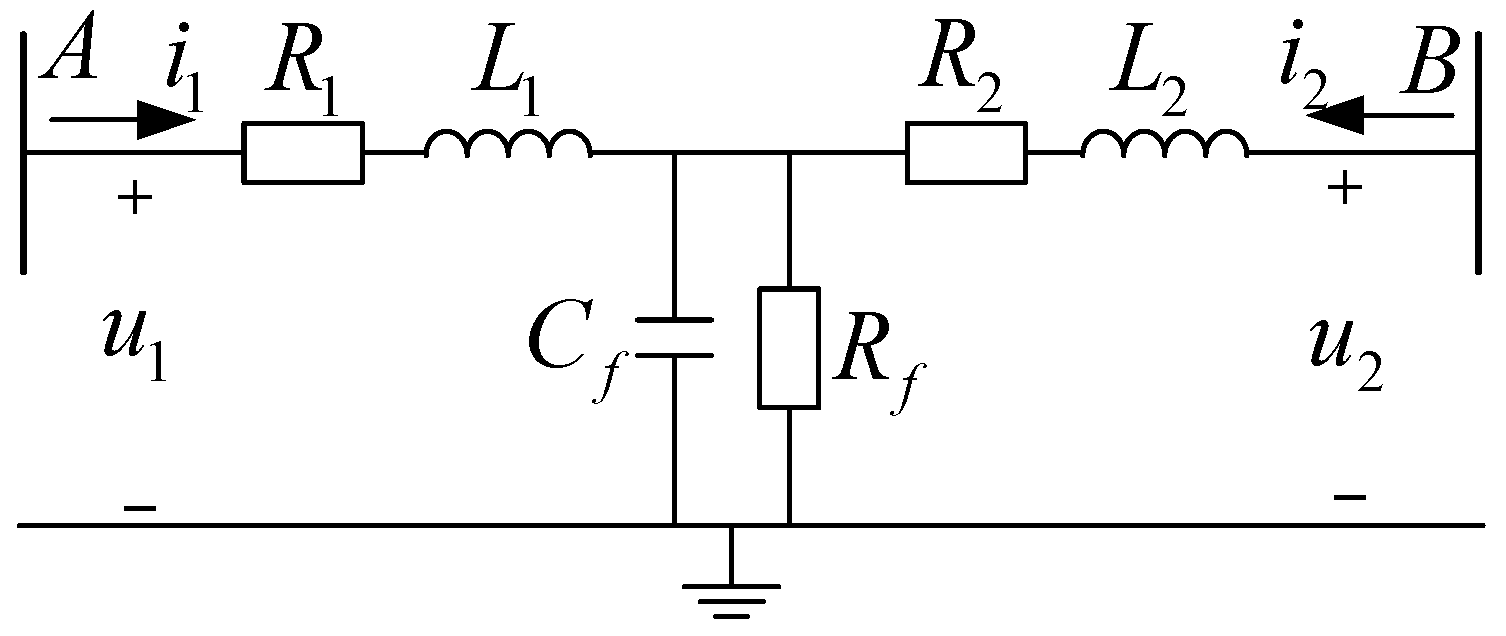
When there are no series CLRs at either end of the line, the line model is equivalent to a π-type model. Because the equivalent capacitance of the parallel connection of the DC side of the converter is much larger than the line’s distributed capacitance, the line terminal’s distributed capacitance can be ignored. Therefore, the equivalent fault circuit of a PTG fault can be obtained, as depicted in Figure 3.
In Figure 3, u1 and i1 indicate the voltage and current measured at A terminal, u2 and i2 denote the voltage and current measured at B terminal, R1 and L1 represent the equivalent line resistance and reactance from A to the fault point, f, R2 and L2 represent the equivalent line resistance and reactance from B to f, Cf is the equivalent line capacitance at f, and Rf is the fault resistance. In Figure 3, according to Kirchhoff’s voltage law (KVL), it can be obtained as follows:
u 1 = R 1 i 1 + L 1 d i 1 d t + u f
where uf is the voltage at f. If it is assumed that the equivalent impedance of Cf during the fault transient process is xc, then uf can be expressed as [19]:
u f = 1 C f i C d t = 1 C f R f R f + x c i 3 d t
where i3 = i1 + i2. Generally, after a period of fault, the frequency of transient current i3 will decrease, and uf is mainly related to Rf. Due to the need for differential calculation in the equation and the fact that the transient fault current is a high change rate nonlinear signal, Reference [24] approximates its differentiation using the difference between two points at time k and k + 1, which can result in significant computational errors. To eliminate this error as much as possible, this paper takes the difference between the previous sampling point and the subsequent sampling point at time k, and obtains:
d i 1 d t ( k ) = i 1 ( k + 1 ) + i 1 ( k 1 ) 2 Δ t
and
i 3 ( k ) d t = i 3 ( k ) + i 3 ( k + 1 ) Δ t / 2
where k denotes the k-th sampling point after the fault, and Δt is the sampling interval. After the fault, starting from the k-th sampling point, the equations are valid, and the equations can be organized and represented in matrix form, as follows:
V = U × R 1 L 1 x c R f / ( x c + R f )
where U = i 1 ( k ) d i 1 d t ( k ) i 3 ( k ) i 1 ( k + 1 ) d i 1 d t ( k + 1 ) i 3 ( k + 1 ) i 1 ( k + N ) d i 1 d t ( k + N ) i 3 ( k + N ) , V = u 1 ( k ) u 1 ( k + 1 ) u 1 ( k + N ) , and N is the total number of sampling points after the k-th sampling point. The equation is an overdetermined equation, which can be solved by solving a pseudo-inverse matrix. Essentially, it is the least square (LS) problem for solving overdetermined systems of equations [17,18,19]. By solving the equation, we can obtain:
R 1 L 1 x c R f / ( x c + R f ) = ( U T U ) 1 U T V
Based on the above analysis, the line parameters between terminal A and f can be obtained. When the line parameter information is known, the fault distance can be determined by the proportional relationship between the obtained parameters and the line parameter information. In some cases, the parameter information of the circuit may be unknown, and in this case, the fault distance is calculated by the ratio of the parameters measured at both ends. This paper calculates the fault distance by the proportion of the line reactance obtained from both ends, which is expressed as:
x 1 = L 1 L 1 + L 2 L A B
where x1 is the distance from terminal A to f, L1 is the measured line reactance at end A, L2 is the measured line reactance at end B, and LAB is the total length of line AB.

3.2. DC Lines with CLRs

When installing CLRs at both ends of a DC line, the line is equivalent to a π-type model. Due to the barrier of the CLR, the distributed capacitance of the equivalent line at the line terminal cannot be ignored. The high-frequency transient signals will be generated, resulting in a PTG fault-equivalent circuit, as shown in Figure 4.
According to the relationship between the current and voltage changes on the inductance, the differential calculation of the line current can be obtained by calculating the voltage on the CLR, further eliminating the error in differential calculation. The current differential at sampling point k can be expressed as:
d i 1 d t ( k ) = u L ( k ) L d c
where Ldc is the size of the CLR, and uL is the voltage of the CLR. By substituting the Equation (6) into the Equation (11), the parameter information of the faulty circuit can be obtained, thereby obtaining the fault distance. However, due to the presence of current-limiting reactors, the equivalent capacitors C1 and C2 at the line ports can lead to high-frequency transient processes in fault voltage and current, resulting in significant errors. Therefore, it is significant to filter the measured fault voltage and current signals to eliminate high-frequency transient signals. This paper utilized a low-pass Butterworth digital filter to filter the measured signal and then used the equation to solve the overdetermined equation system to obtain the fault circuit parameters, thereby obtaining the fault distance.

3.3. Design of Online Fault Location Scheme

The above analysis took the PTG fault as an example, which also applies to PTP faults. For PTP faults, it is necessary to convert the PTG voltages into the PTP voltages, while the rest of the process is similar. The entire fault location process is as follows:
(a)
After satisfying criterion Equation (1), record the fault current data at a higher sampling rate (such as 10 kHz).
(b)
After the faulty line is cutoff, the local IED sends fault-recording data to the opposite end of the faulty line IED’ and receives the recording data sent by IED’. The length of the recorded data starts from fault detection to DCCB, cutting off the faulty line.
(c)
Calculate the parameters of the fault circuit. If there is no CLR, calculate the fault circuit parameters through Equations (6) and (9). If CLR is installed, perform low-pass filtering first, then calculate the fault circuit parameters using Equations (9) and (11).
(d)
Calculate the fault distance. If the line parameters are known, the fault distance can be directly calculated. If the line parameters are unknown, the fault circuit parameters are calculated at both end IEDs, and the fault distance is calculated by Equation (10).

4. Simulation Results

4.1. Simulation System and Parameters

To demonstrate the effectiveness of the proposed fault detection and location scheme, a simulation model of symmetrical bipolar DC distribution was built in PSCAD/EMTDC, as shown in Figure 5, where the dashed box indicates the part mainly used for the case study. Manitoba Hydro developed PSCAD/EMTDC, and PSCAD provides a graphical user interface for EMTDC (electromagnetic transients including DC). PSCAD enables users to construct circuit models flexibly and provides a wide variety of components. The converter is a two-level voltage source converter (VSC), and the DC side is grounded with a clamping capacitor through a small resistor.
During simulation, each converter adopts inner and outer loop decoupling control, with one end (A) set to ±10 kV DC voltage control, and other end set to active power control, transmitting 10 MW rated power. The DC line adopts an AC polyethylene-insulated (XLPE) power cable with a cross-sectional area of 150 mm2, model YJV-8.7/10 kV. The specific simulation parameters are shown in Table 1.

4.2. Transient Characteristics of DC Faults

(1)
PTG Faults
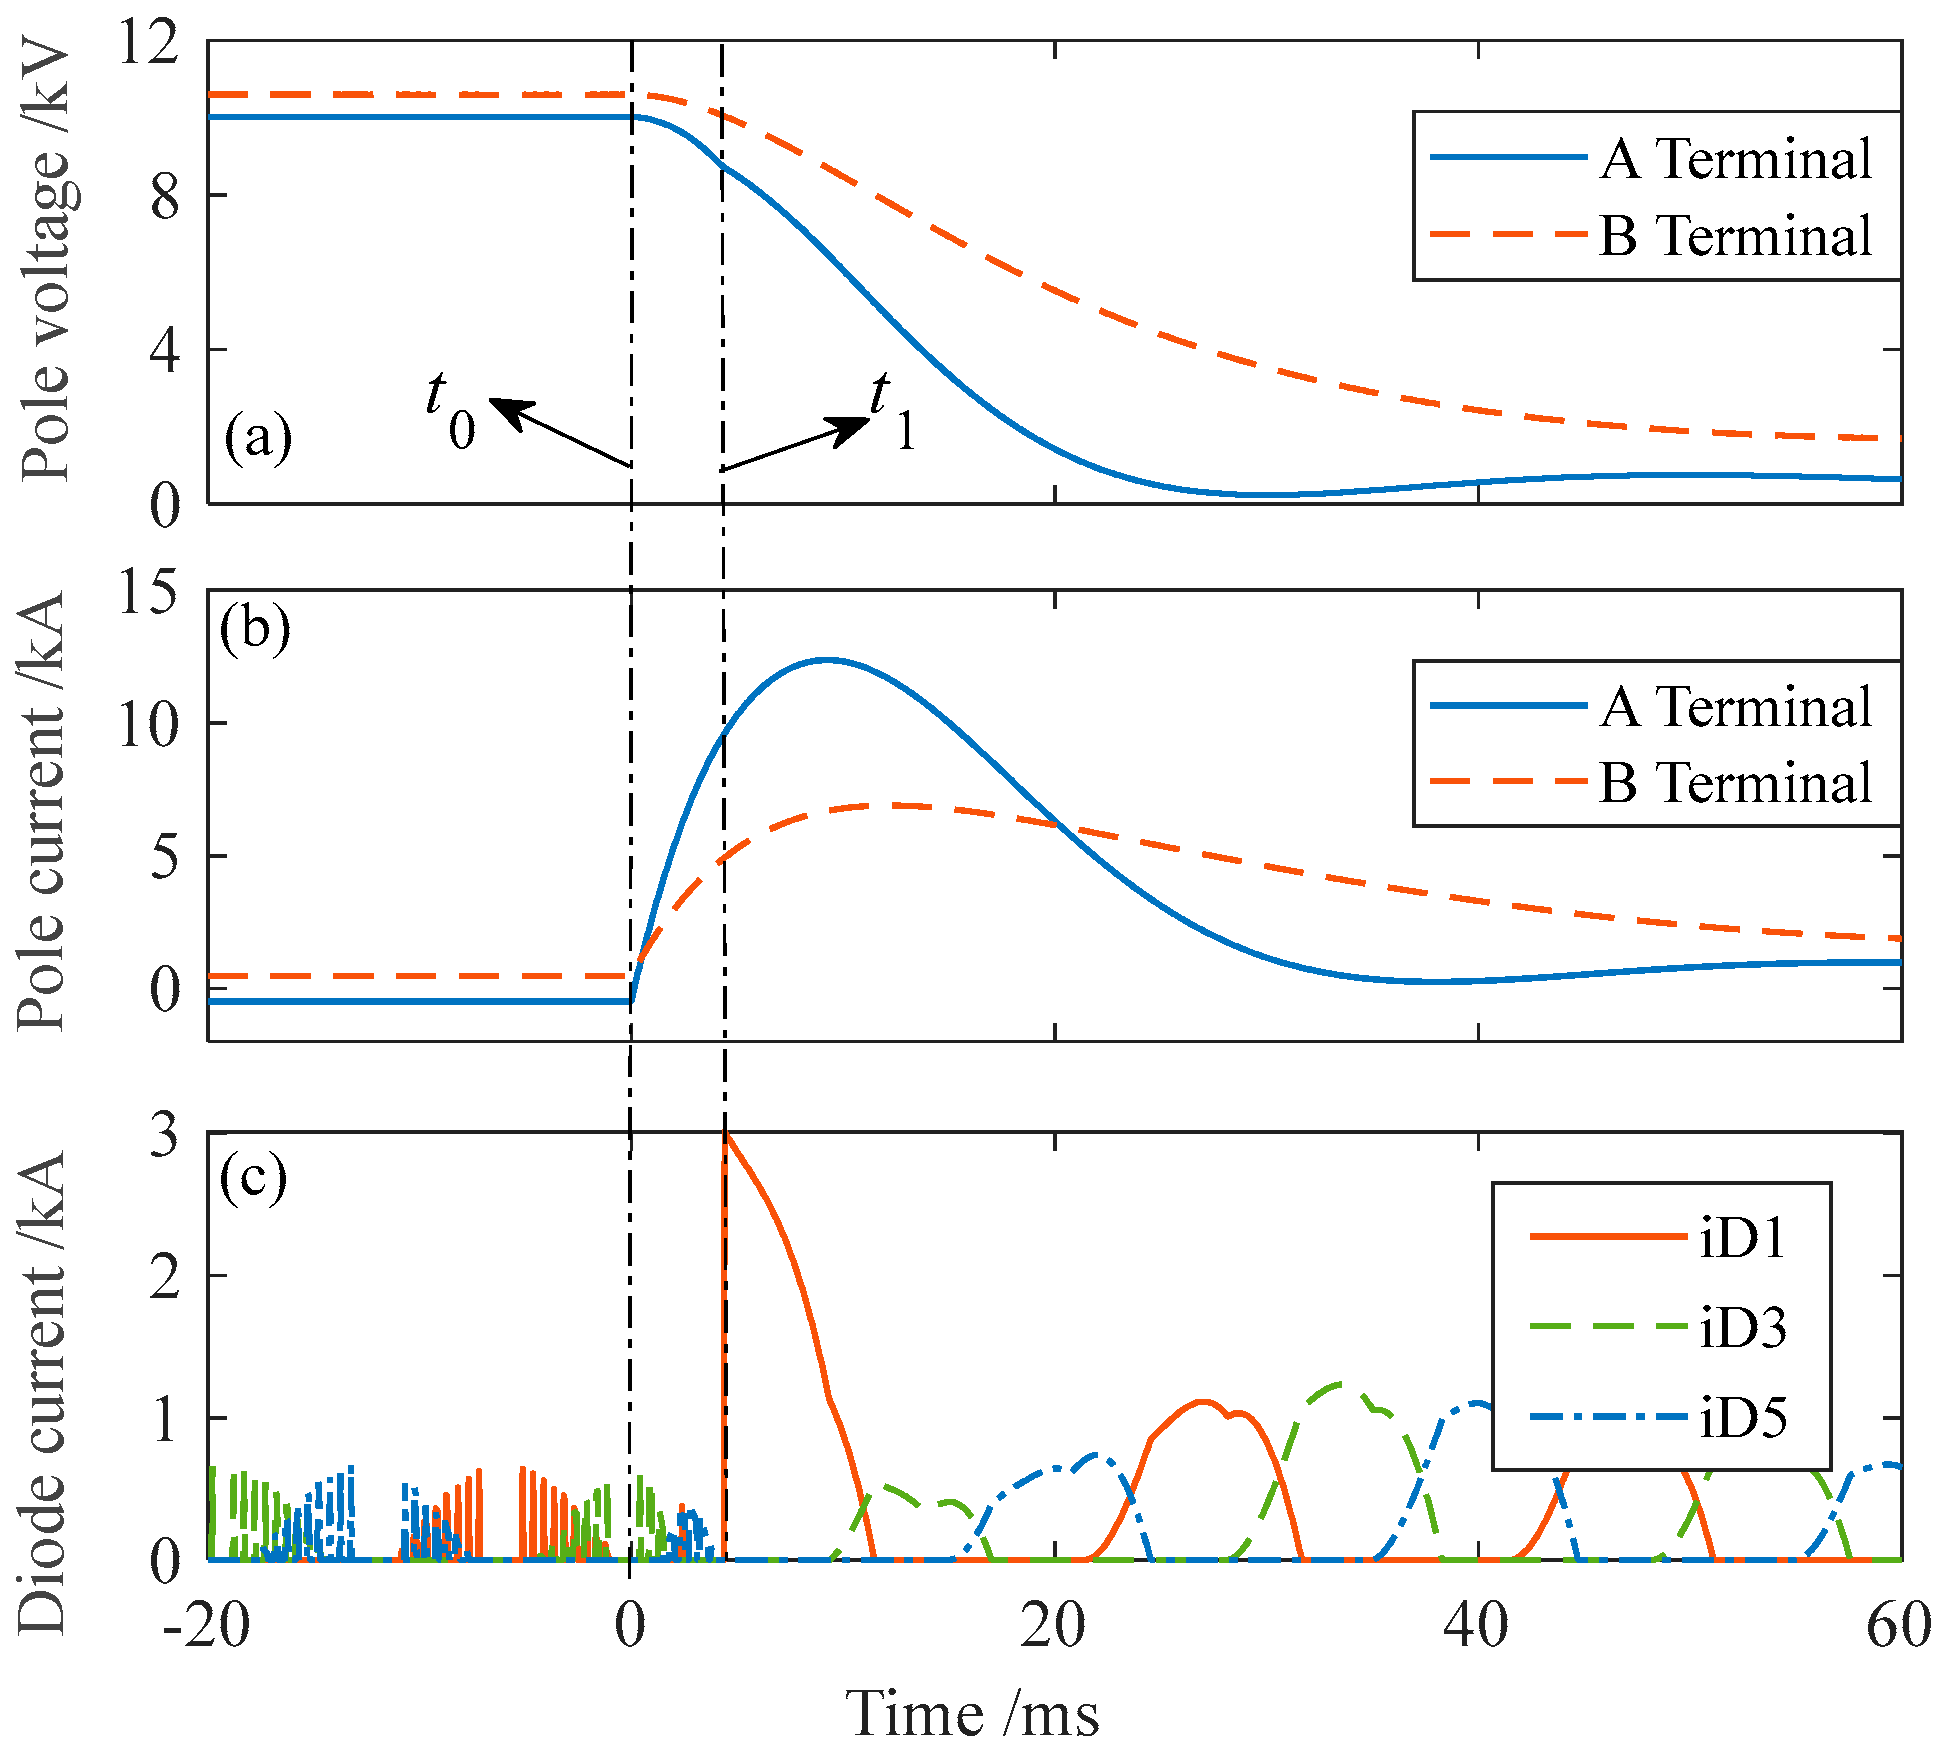
The change trends of the voltages and currents obtained at terminal A after a positive PTG fault with 1Ω fault resistance are shown in Figure 6. In Figure 6, a PTG fault occurred at t0 = 0 ms. After about 5 ms, the A-terminal VSC was locked due to overcurrent at t1 (when the current flowing through the IGBT exceeded 3 kA). After locking, the current flowing through the reverse parallel diode of the A-terminal VSC rapidly increased, as shown in Figure 6c. Therefore, it was necessary for the protection device to quickly cutoff the fault and leave a data length of less than 5 ms for the fault location.
(2)
PTP Faults
A PTG fault occurred at 1 km from the A terminal, and the voltages and currents are shown in Figure 6. After about 3 ms, the VSC was locked due to overcurrent at t1. From Figure 7a, when t2 was approximately equal to 10 ms, the DC voltage dropped to zero. At this point, the anti-parallel diode current of the A-end VSC was positive, and the freewheeling current was conducting, causing the fault current to rapidly increase, as shown in Figure 7c, which needs to be avoided.

4.3. Performance Analysis of Fault Detection Scheme

In this paper, a positive PTG fault with a fault resistance of 50 Ω at position F1 was simulated. After the fault, the current changes at all SMPs on DC bus 1 and bus 2 are shown in Figure 8. At this point, due to the large fault resistance, the amplitude of the fault current was weak. It may be difficult to accurately detect the fault using current amplitude or current change rate methods. From Figure 8, the SMPs R12 and R21 were at the faulty line, the integral values S12 and S21 of the current superposition were both positive, while for the healthy lines R13 and R24 on the same DC bus, the integral values S13 and S24 of the current superposition were both negative, and this feature was utilized to diagnose faults.
(1)
Influence of the Fault Positions
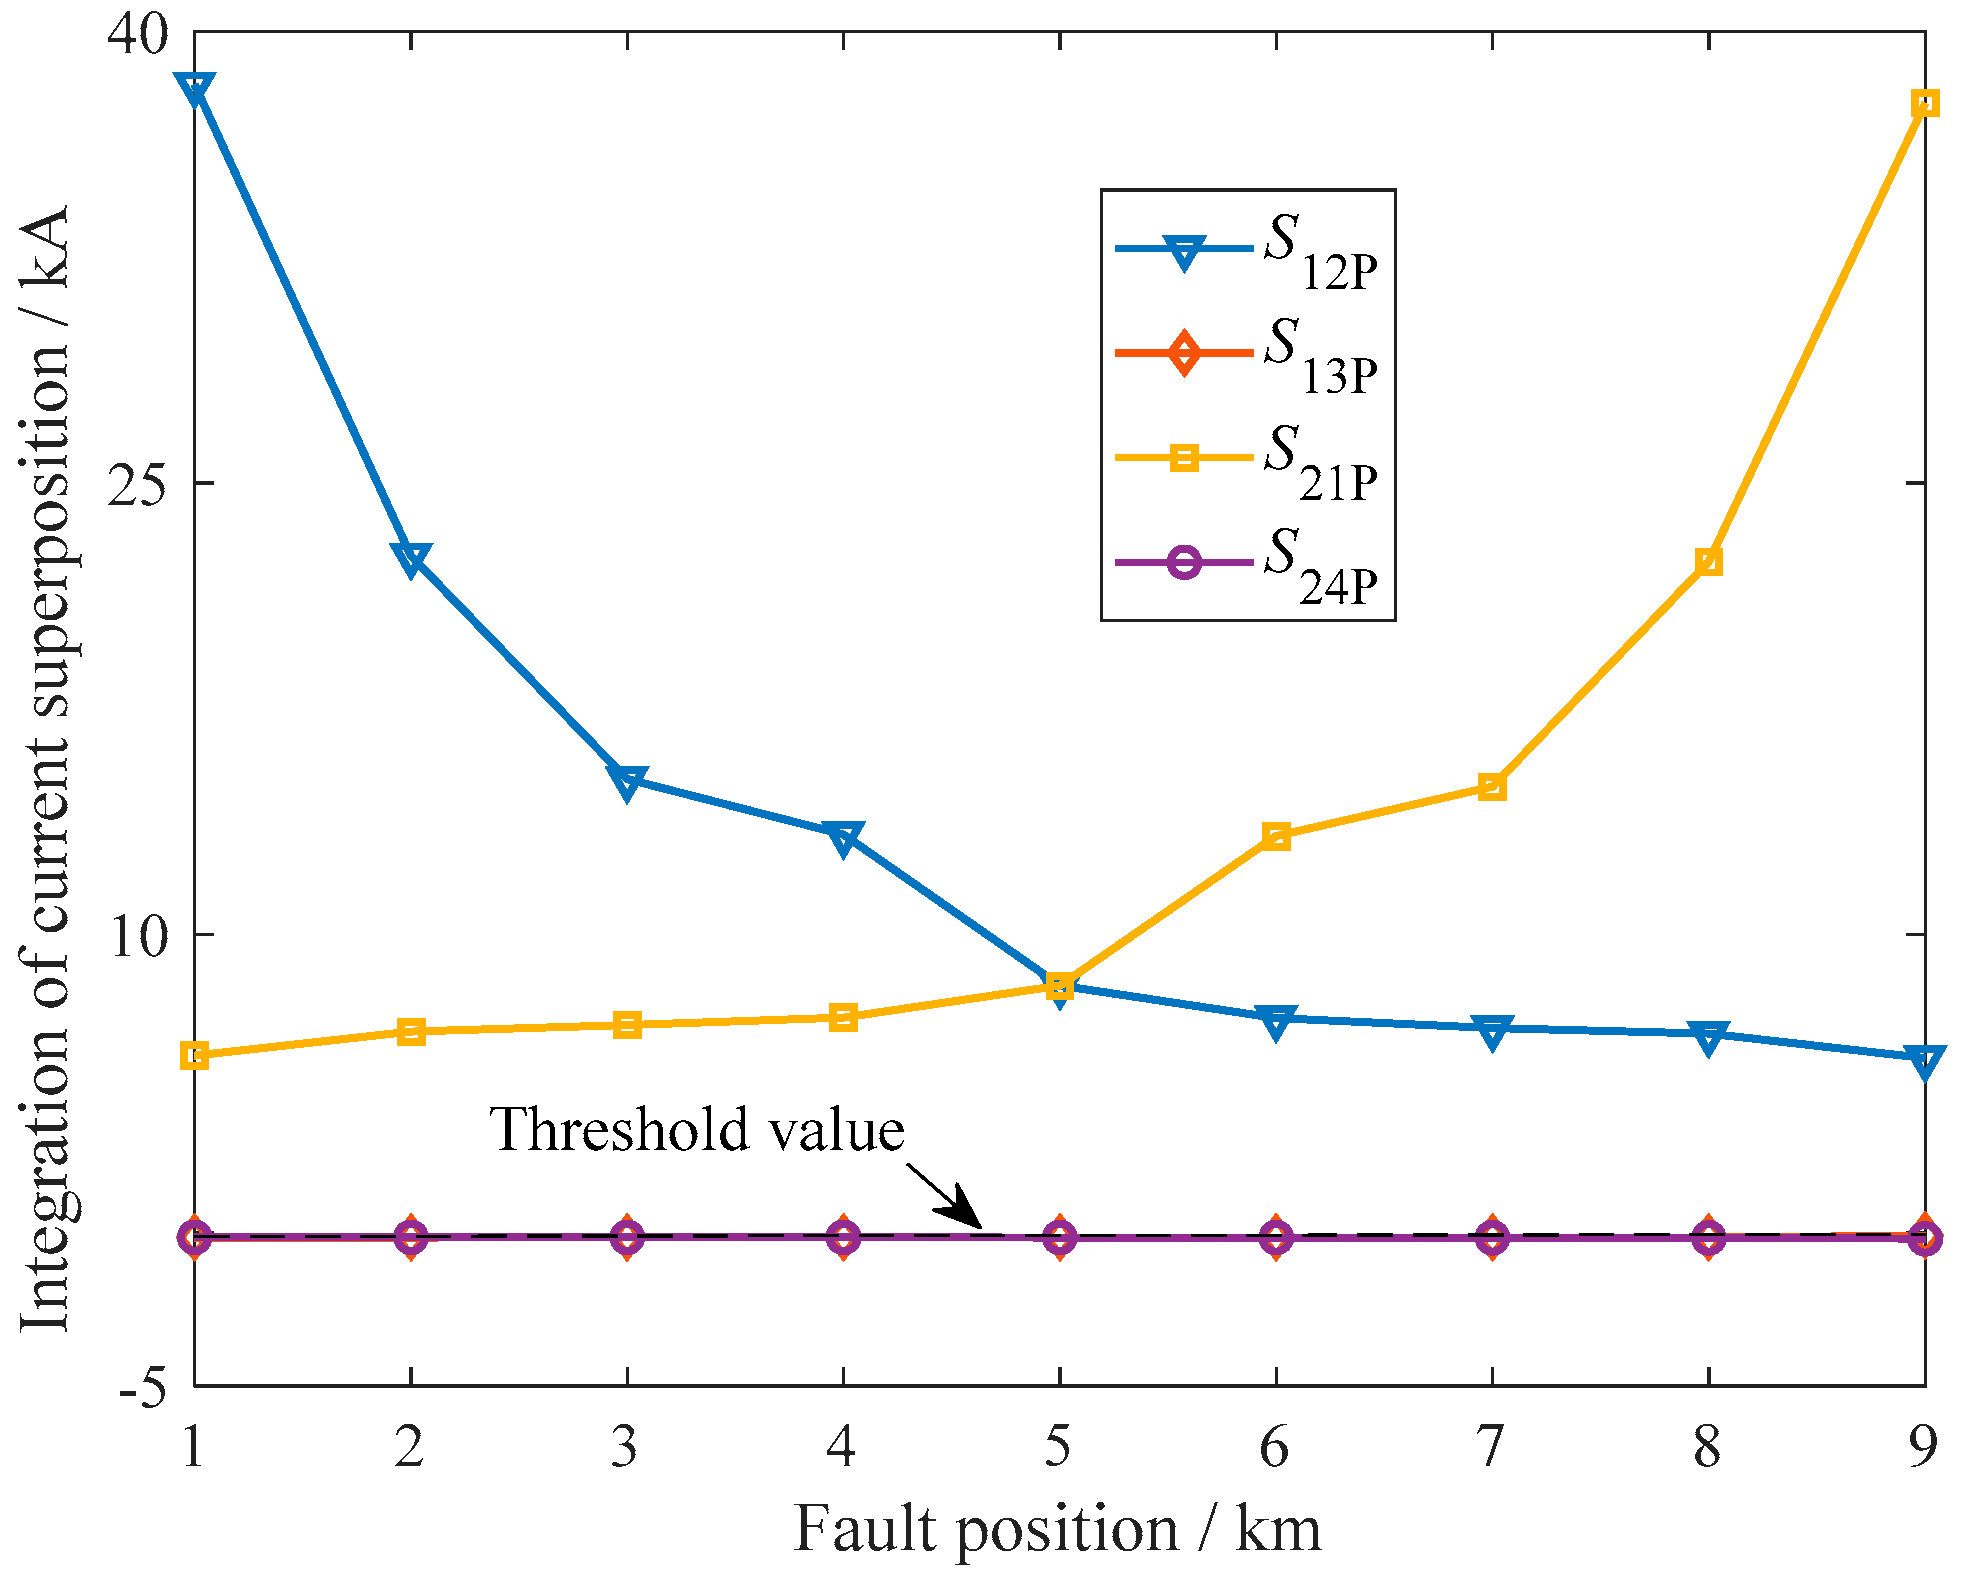
To test the performance of the proposed direction pilot protection scheme at different fault positions, a simulation was conducted, as shown in Figure 5, where F1 experienced a positive PTG fault with 1 Ω fault resistance, and the positions varied from 1 km to 9 km of cable 1. The change trends of the current superposition calculated at different SMPs on bus 1 and bus 2 are shown in Figure 9.
From Figure 9, it can be observed that the closer the distance to the VSC, the larger the calculated value of the current superposition, but even at the end of the line, its computed value was still far greater than the protection threshold. For the SMPs R13 and R24 of the same DC bus, the calculated current superposition was a value with a smaller amplitude of less than zero. The parallel capacitors of VSCs were closest to the fault point and discharged into the fault point; thus, the fault currents fed into the healthy line were limited. By simulating faults at different positions, it can be verified that the proposed fault protection scheme identified faults at different fault positions, and it did not relay the protection boundary.
(2)
Influence of the Fault Resistances
To test the performance of the proposed directional criterion under different fault resistances, a positive PTG fault occurred at 2 km from the R12, as shown in Figure 5. The fault resistances varied from 0.01 Ω to 100 Ω, and the faults were detected using the proposed scheme, as shown in Figure 10.
The protection results of the SMPs on each line of bus 1 and bus 2 are shown in Figure 10. When the fault resistance was less than 30 Ω, the integral of the current superposition calculated at the SMP in the fault area was positive and significantly decreased with the increase in the fault resistance, while the current superposition calculated at the SMP in the healthy line of the same DC bus was negative; thus, the proposed scheme accurately identified the fault direction. When the fault resistance reached 100 Ω, although the calculated value of the current superposition was small, it was still greater than the set value, indicating that the proposed directional criterion has a high ability to identify fault resistance.

4.4. Results of the Proposed Fault Location Scheme

Taking the example of not installing CLRs at both ends of the line, the fault location process and performance were deeply analyzed.
(1)
Fault Location Process
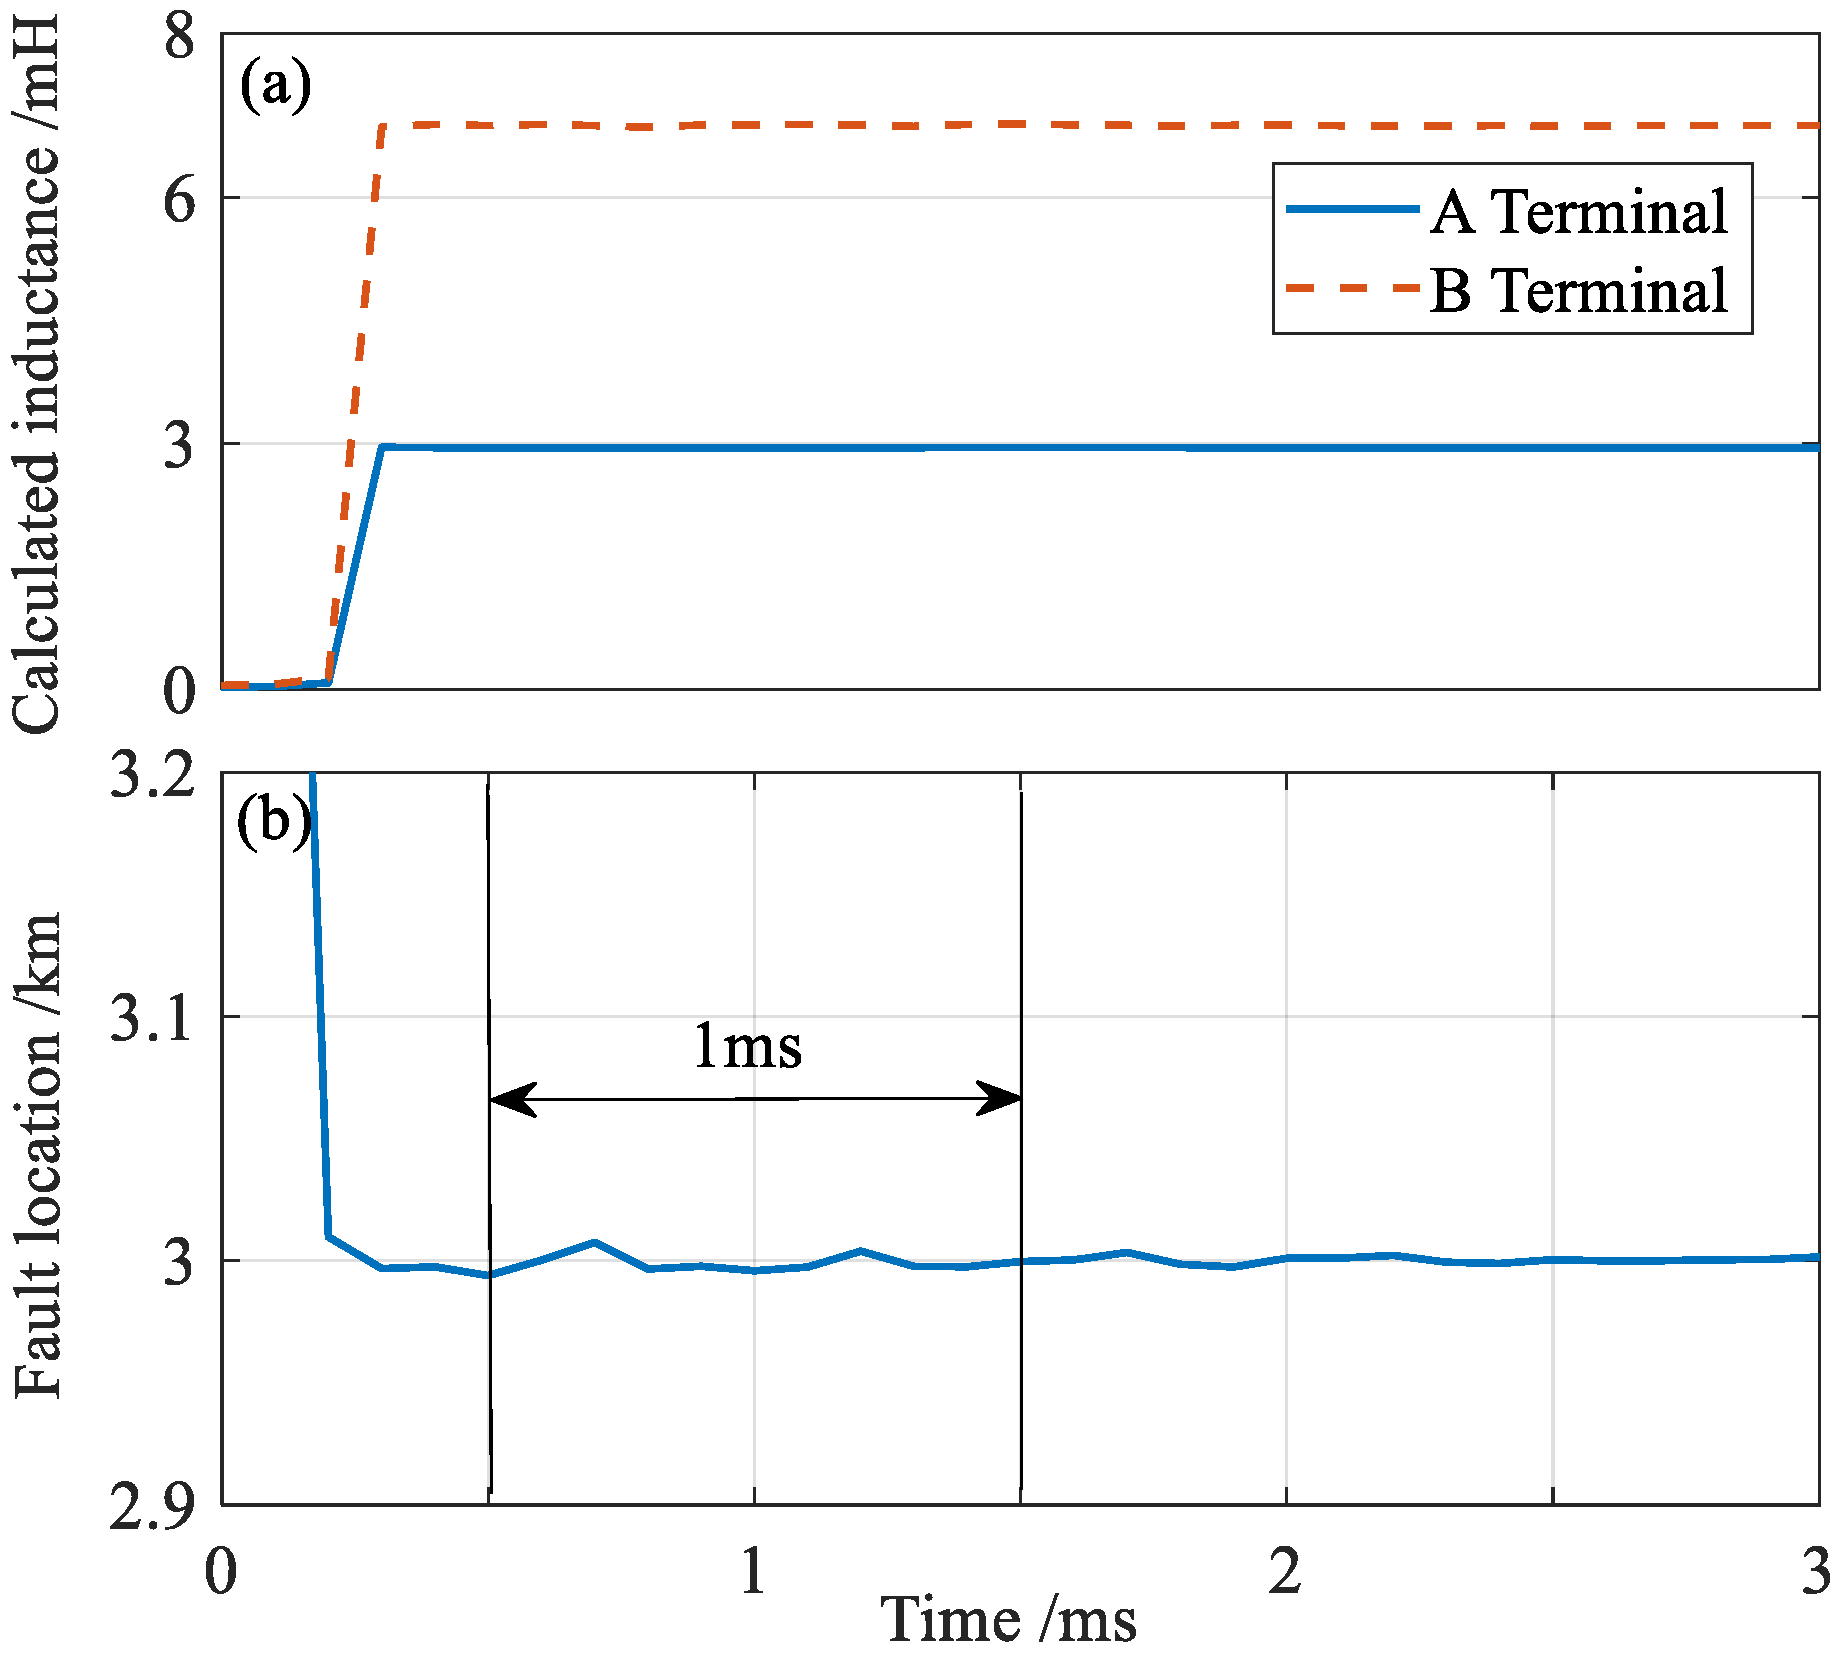
Due to the limited available data length, 20 recorded data points (i.e., 2 ms data length under a 10 kHz sampling rate) were used for fault location. The reactance at both ends of A and B was calculated, as shown in Figure 11a. Based on the computed reactance values of the fault circuit lines at both ends of A and B, the fault distance was calculated using the Equation (10), as shown in Figure 11b. To demonstrate the performance of the proposed method, the maximum error of the fault distance calculated within 0.5 ms to 1.5 ms after the fault occurred was taken. Meanwhile, to more conveniently describe the location accuracy, the location error rate was defined as:
e = x 1 x 1 L A B × 100 %
where e is the error rate, x1 is the calculated fault distance, x1′ is the actual location of the fault, and LAB is the total length of the line.
For PTP faults, the fault location process was similar to that of PTG faults, using 20 recorded data points for fault location. Figure 12 shows the location accuracy measured after a PTP fault and a PTP fault, with a 1 Ω fault resistance at different fault positions on the line. From Figure 12, regardless of where the fault occurred on the line, the location error rate was less than 0.5%. The fault location error rate during a fault in the middle of the line was higher than that at both ends, because the equivalent distributed capacitance on both sides of the fault line was relatively large, which caused certain interference with the fault location results. The simulation results verified that the proposed method could achieve online fault location without the need for additional devices and had high accuracy with a low sampling rate.
(2)
Impact of Fault Resistances and Distances
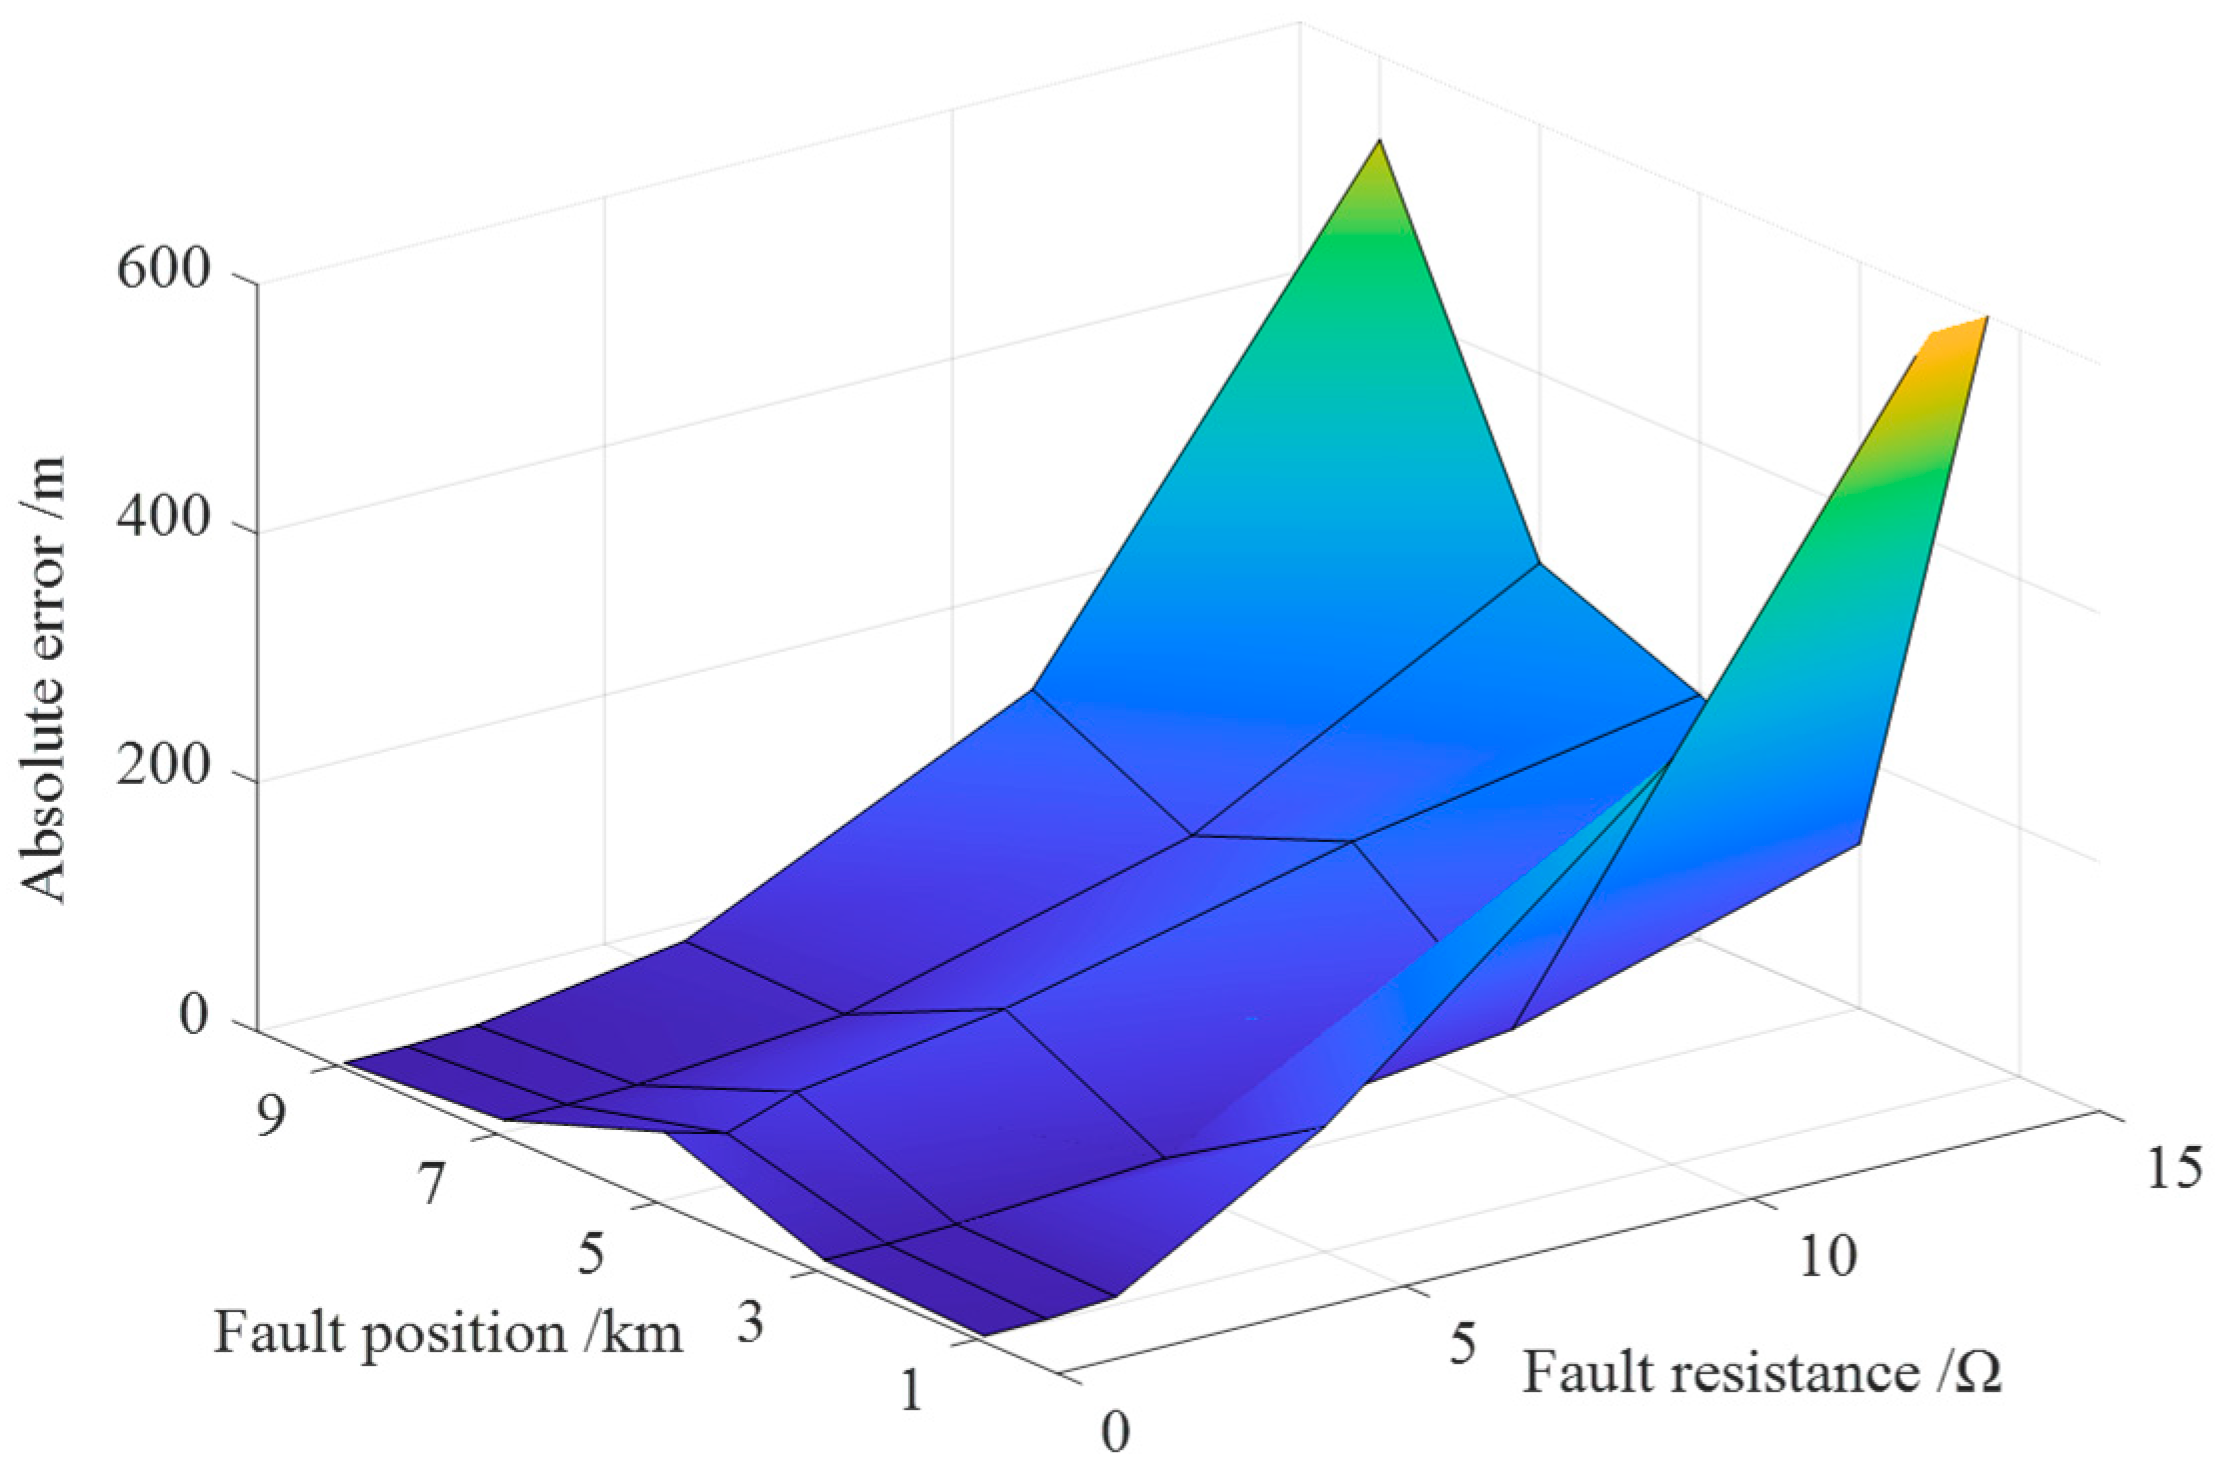
To study the influence of fault resistance and fault distances on the fault location results, a PTG fault was simulated, with different fault resistances occurring at varying positions on the line. The fault location results are shown in Figure 13.
From Figure 13, when the fault resistance was less than 5 Ω, the absolute location error obtained after different fault conditions was less than 70 m. The location accuracy near both ends of the line was more sensitive to resistance changes, resulting in significant errors when the fault resistance was 15 Ω. The location accuracy of the middle section of the line was less sensitive to the fault resistance, but the location error rate was higher than at both ends of the line when the fault resistance was small. The reason is that as the fault resistance increased, the fault current was already weak, and the interference of the distributed capacitance current in the circuit was more obvious. When there was a fault near both ends of the line, the equivalent distributed capacitance on one side was smaller than the equivalent distributed capacitance on the other side, and the impact of distributed capacitance was more pronounced when the fault current was smaller.
(3)
Influence of the Data Length and Sampling Rate
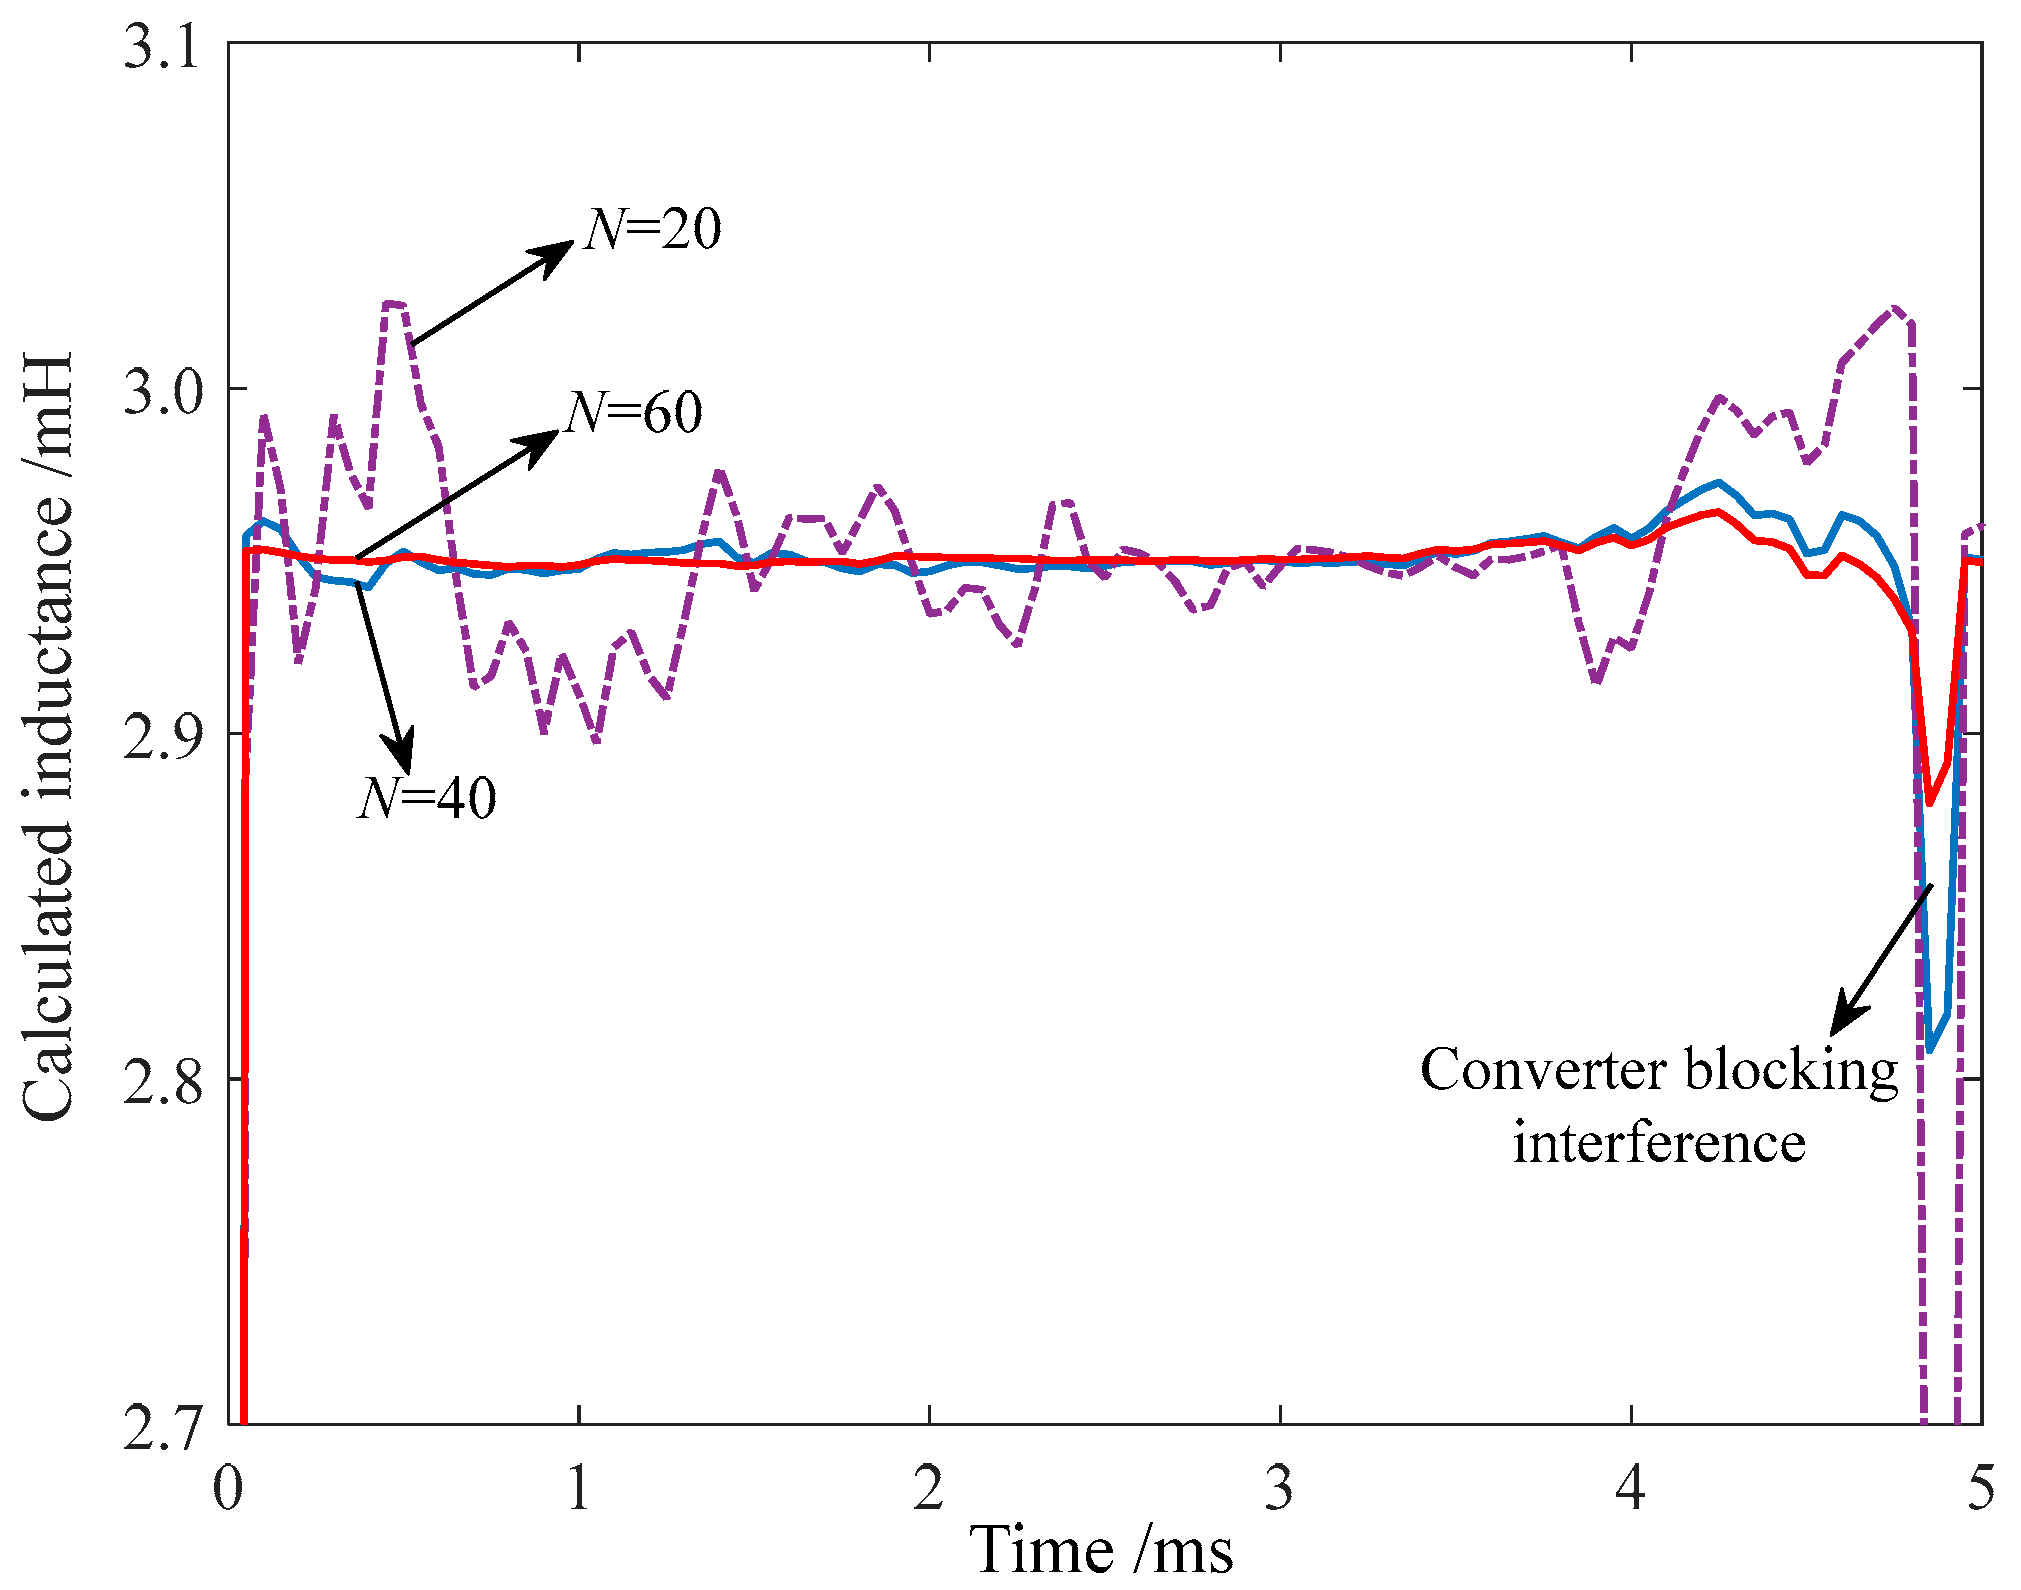
To study the influence of different data lengths on the fault location results, the calculated inductance results at the A terminal were compared at a sampling rate of 10 kHz, and the sampling points were N = 20, 40, and 60 points, respectively. The simulation results are shown in Figure 14: with the increase in sample points, the calculated values were more stable and accurate. In practical environments, since DCCB will quickly cutoff faults, the sampling points obtained are limited.
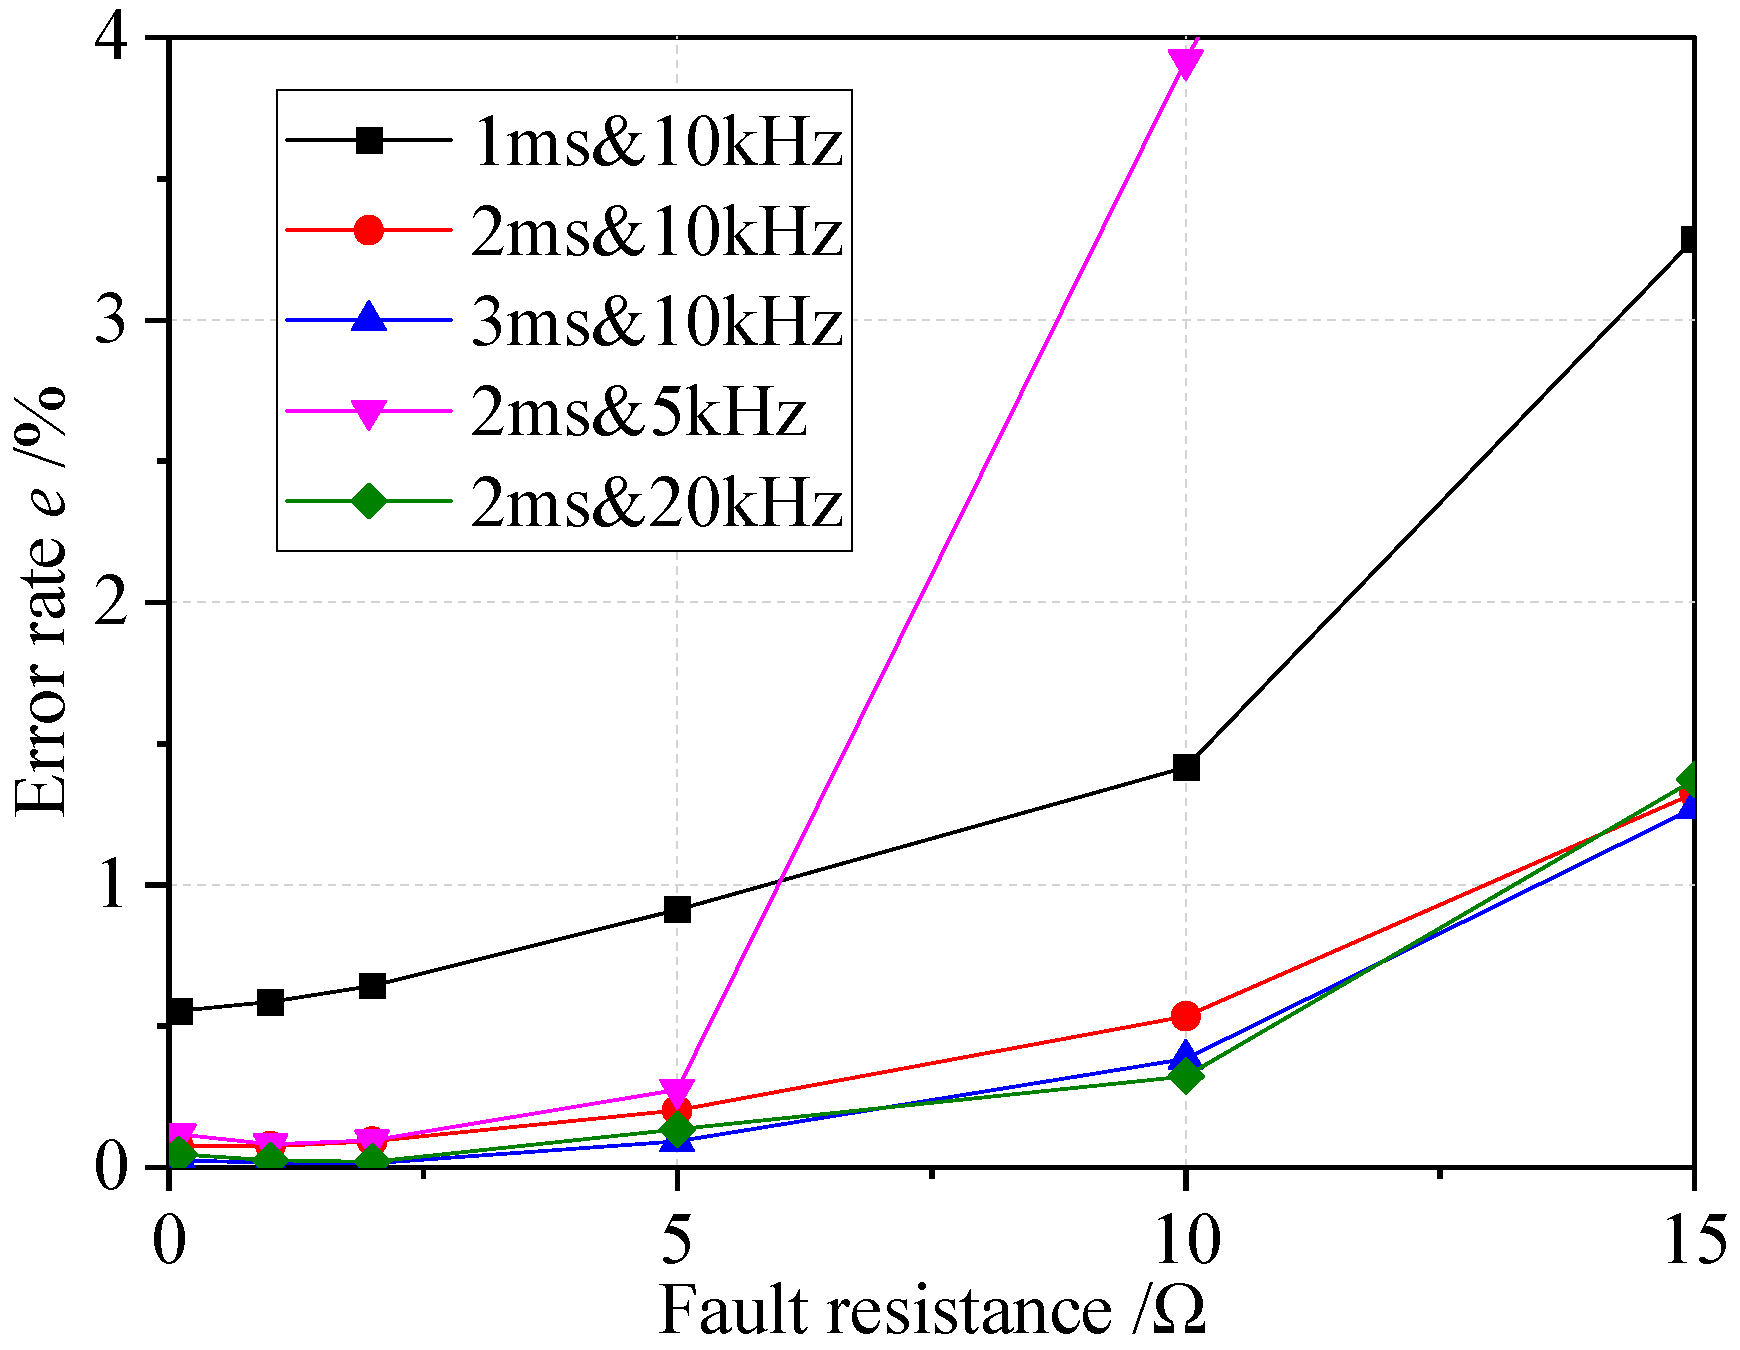
To study the impact of different sampling rates on the proposed fault location scheme, the fault location accuracy was compared at sampling rates of 5 kHz, 10 kHz, and 20 kHz, and the results are shown in Figure 15. From Figure 15, when the fault resistance was less than 5 Ω, the influence of the sampling rate was relatively small, and high fault location results were achieved. However, when the fault resistance increased, smaller sampling rates were more likely to produce larger location errors. At the same sampling rate of 10 kHz, as the data length increased from 1 ms to 3 ms, the fault location results became more accurate due to the acquisition of more information, but it did not increase nonlinearly. Increasing the data length from 1 ms to 2 ms significantly improved the location accuracy, while the improvement from 2 ms to 3 ms was limited.
(4)
Influence of the Asynchronous Sampling
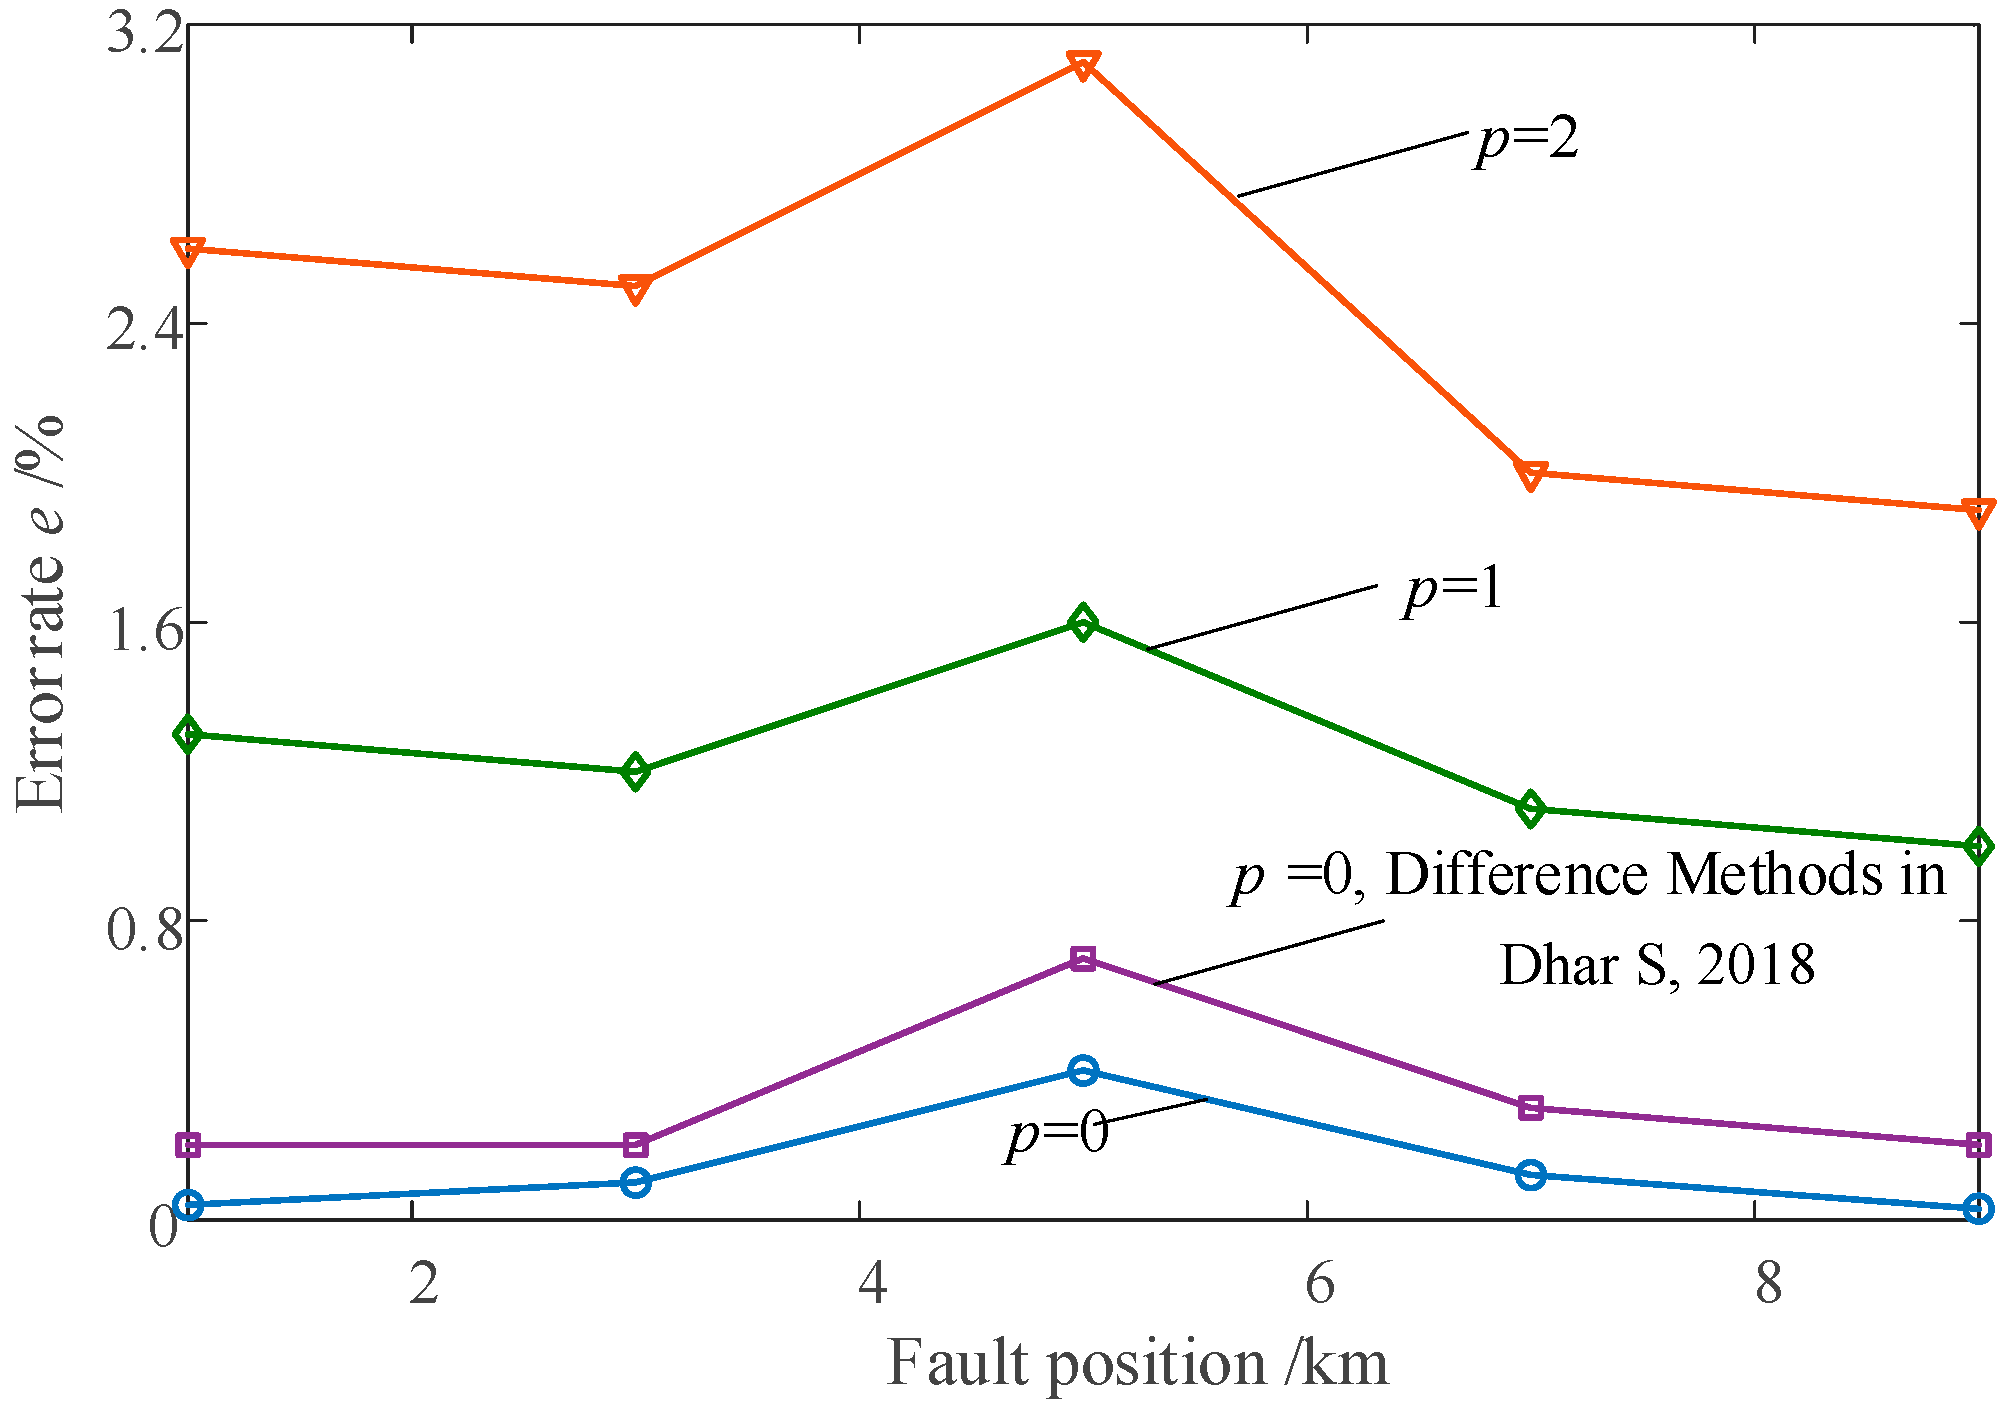
In practical environments, there may be asynchronous sampling between the sampling signals at both ends. At a sampling rate of 10 kHz, the number of sampling points at both ends of the line that differed due to asynchronous sampling was taken as p = 0, 1, and 2, respectively. The fault location results are shown in Figure 16. As p increased, the location error rate also increased. Due to the large change rate of the transient DC faults’ current, a large location error was caused when p was larger than 2.
Besides, in this paper, the current difference methods of fault location accuracy were compared, and the comparison results are shown in Figure 16. The simulation results verified that the proposed difference method, as in Equation (6), improved the accuracy of fault location results when compared with the traditional methods used in Reference [24].
(5)
Influence of DC Line with CLRs
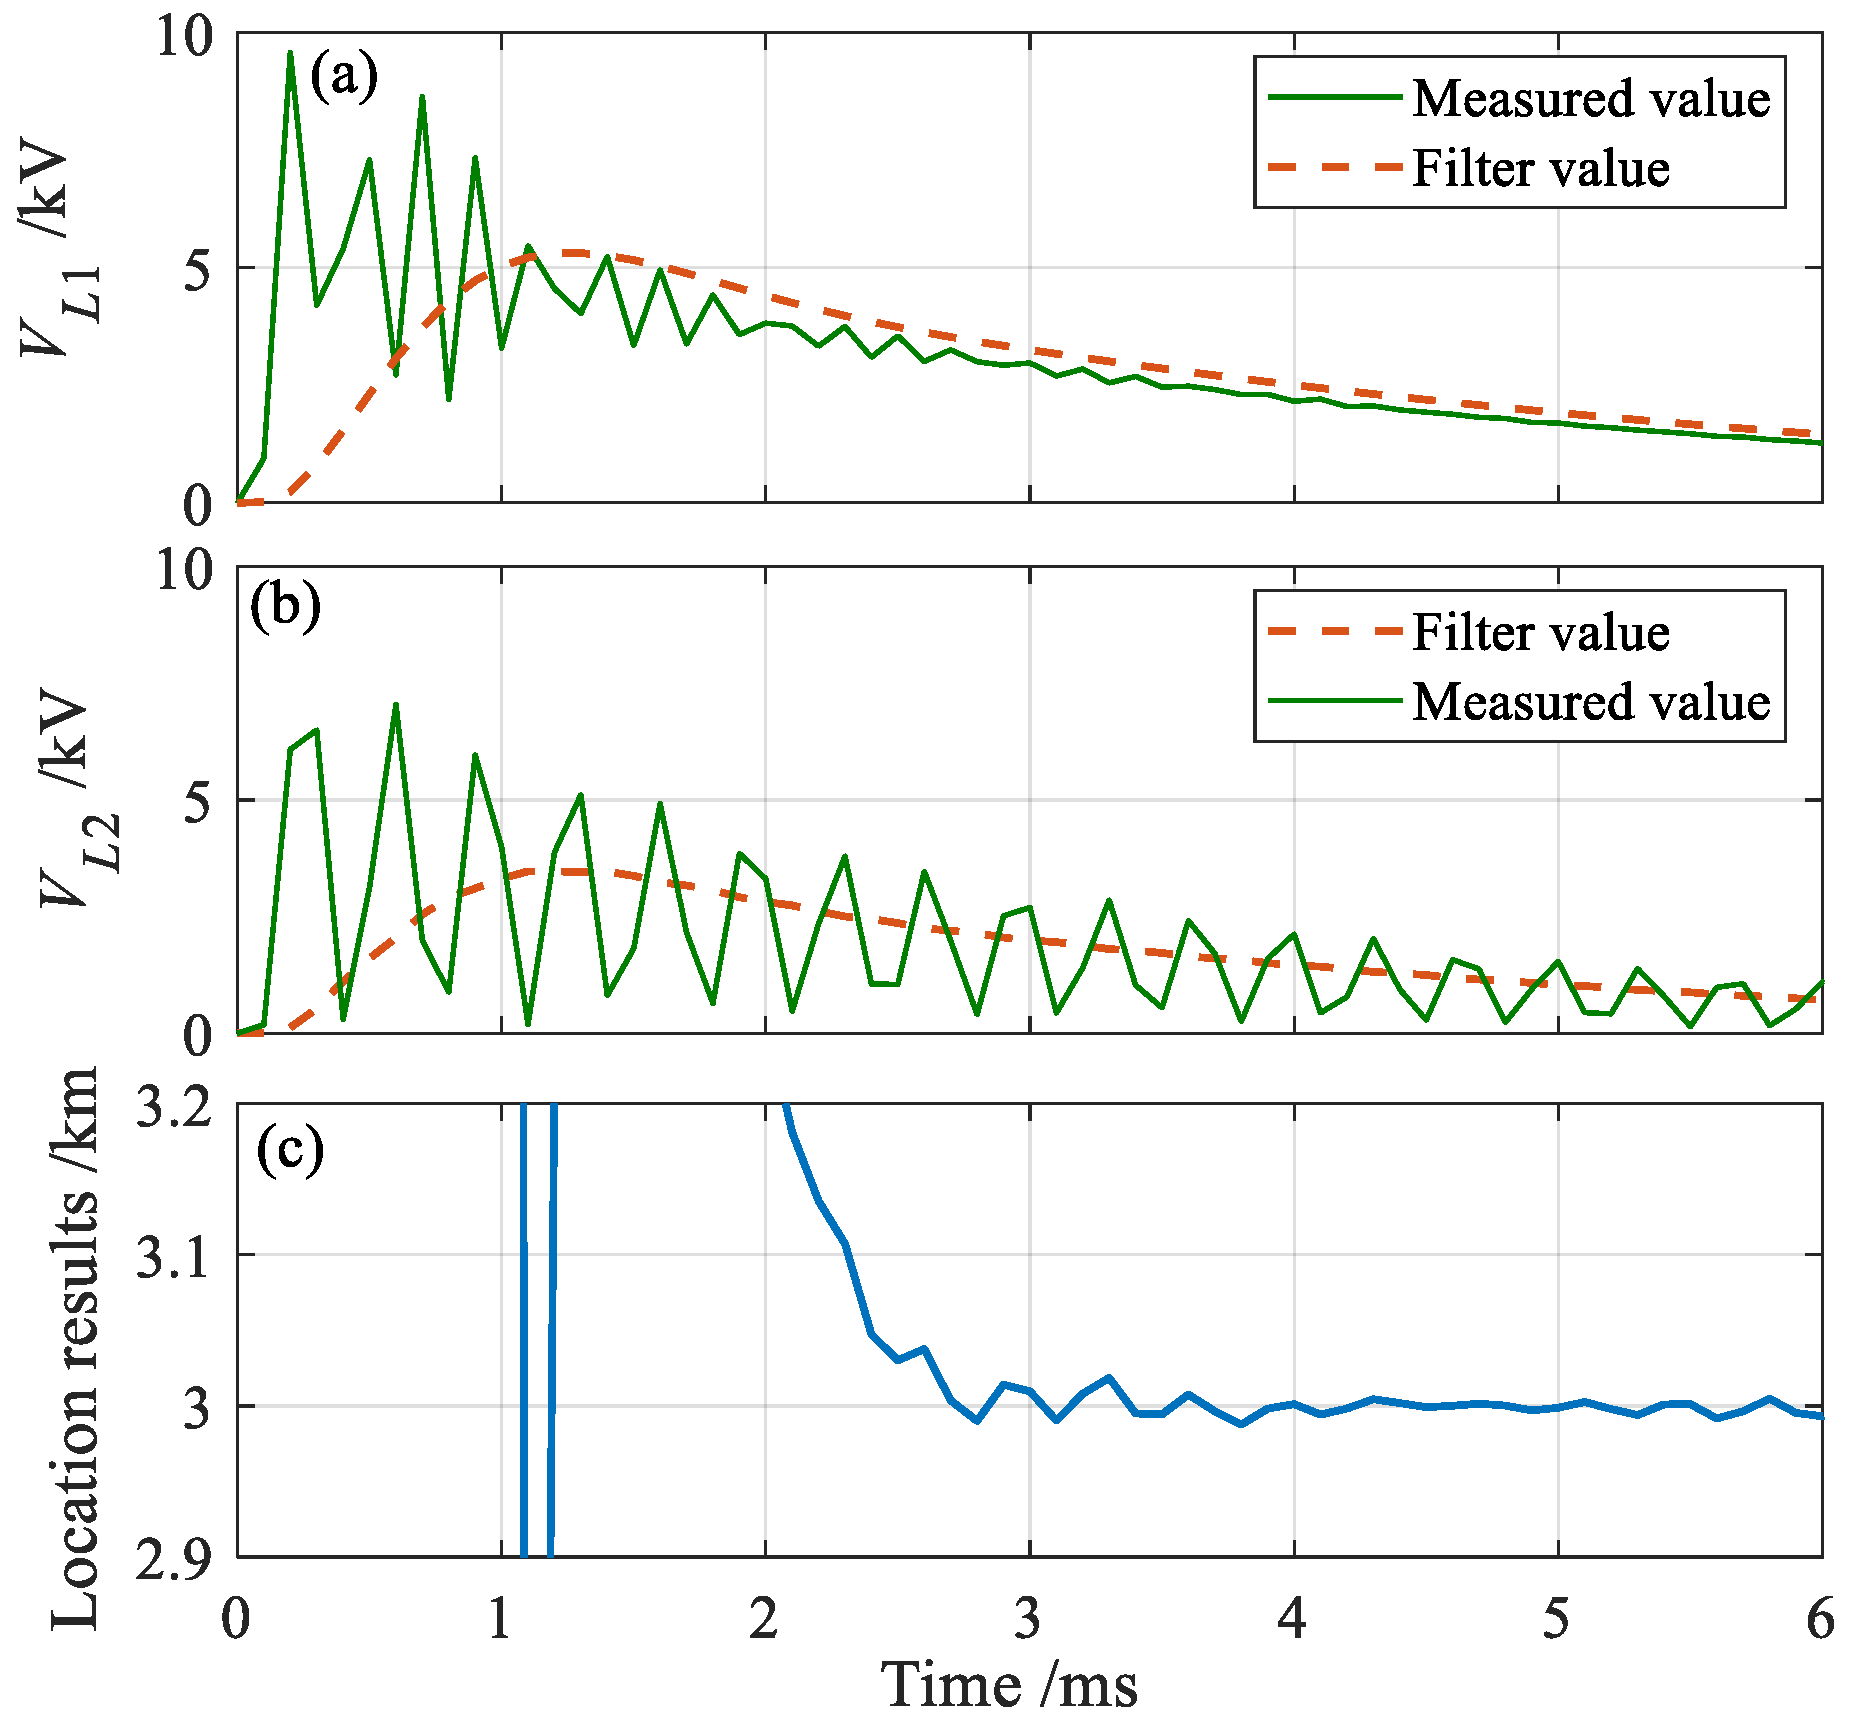
In the case of installing a CLR at both ends of the line, the time requirement for protection was slightly alleviated, and the data length that could be obtained was longer. To improve the fault location accuracy and reduce the high-frequency transient effects caused by CLRs and distributed capacitors, this paper took N = 30 under a 10 kHz sampling rate. A digital low-pass Butterworth filter was introduced to filter out the influence of high-frequency transient signals. The passband boundary frequency of the low-pass filter was set to 150 Hz, the cutoff frequency was 1550 Hz, and the maximum attenuation coefficient of the stopband was 22.
When a PTG fault with 1 Ω resistance occurred at 3 km from the A terminal, the location results were as shown in Figure 17. In Figure 17a, VL1 is the voltage on the A-terminal CLR, which generated a high-frequency transient signal due to the presence of distributed capacitance. Figure 17a compares the voltage changes before and after filtering. VL2 is the voltage value on the B-terminal CLR, and its trend is similar to that on the A terminal, as shown in Figure 17b. Figure 17c shows the fault location results obtained using the proposed scheme. From Figure 17c, there was a significant location error between 0 and 2 ms after the fault occurred. The reason is that the signal fluctuated greatly during this period, and the low-pass filter had a certain impact on the original signal. Therefore, in this paper, fault data after 3 ms were selected for fault location to obtain more accurate results.

4.5. Comparison Results

(1)
Comparison Results of the Fault Detection Scheme
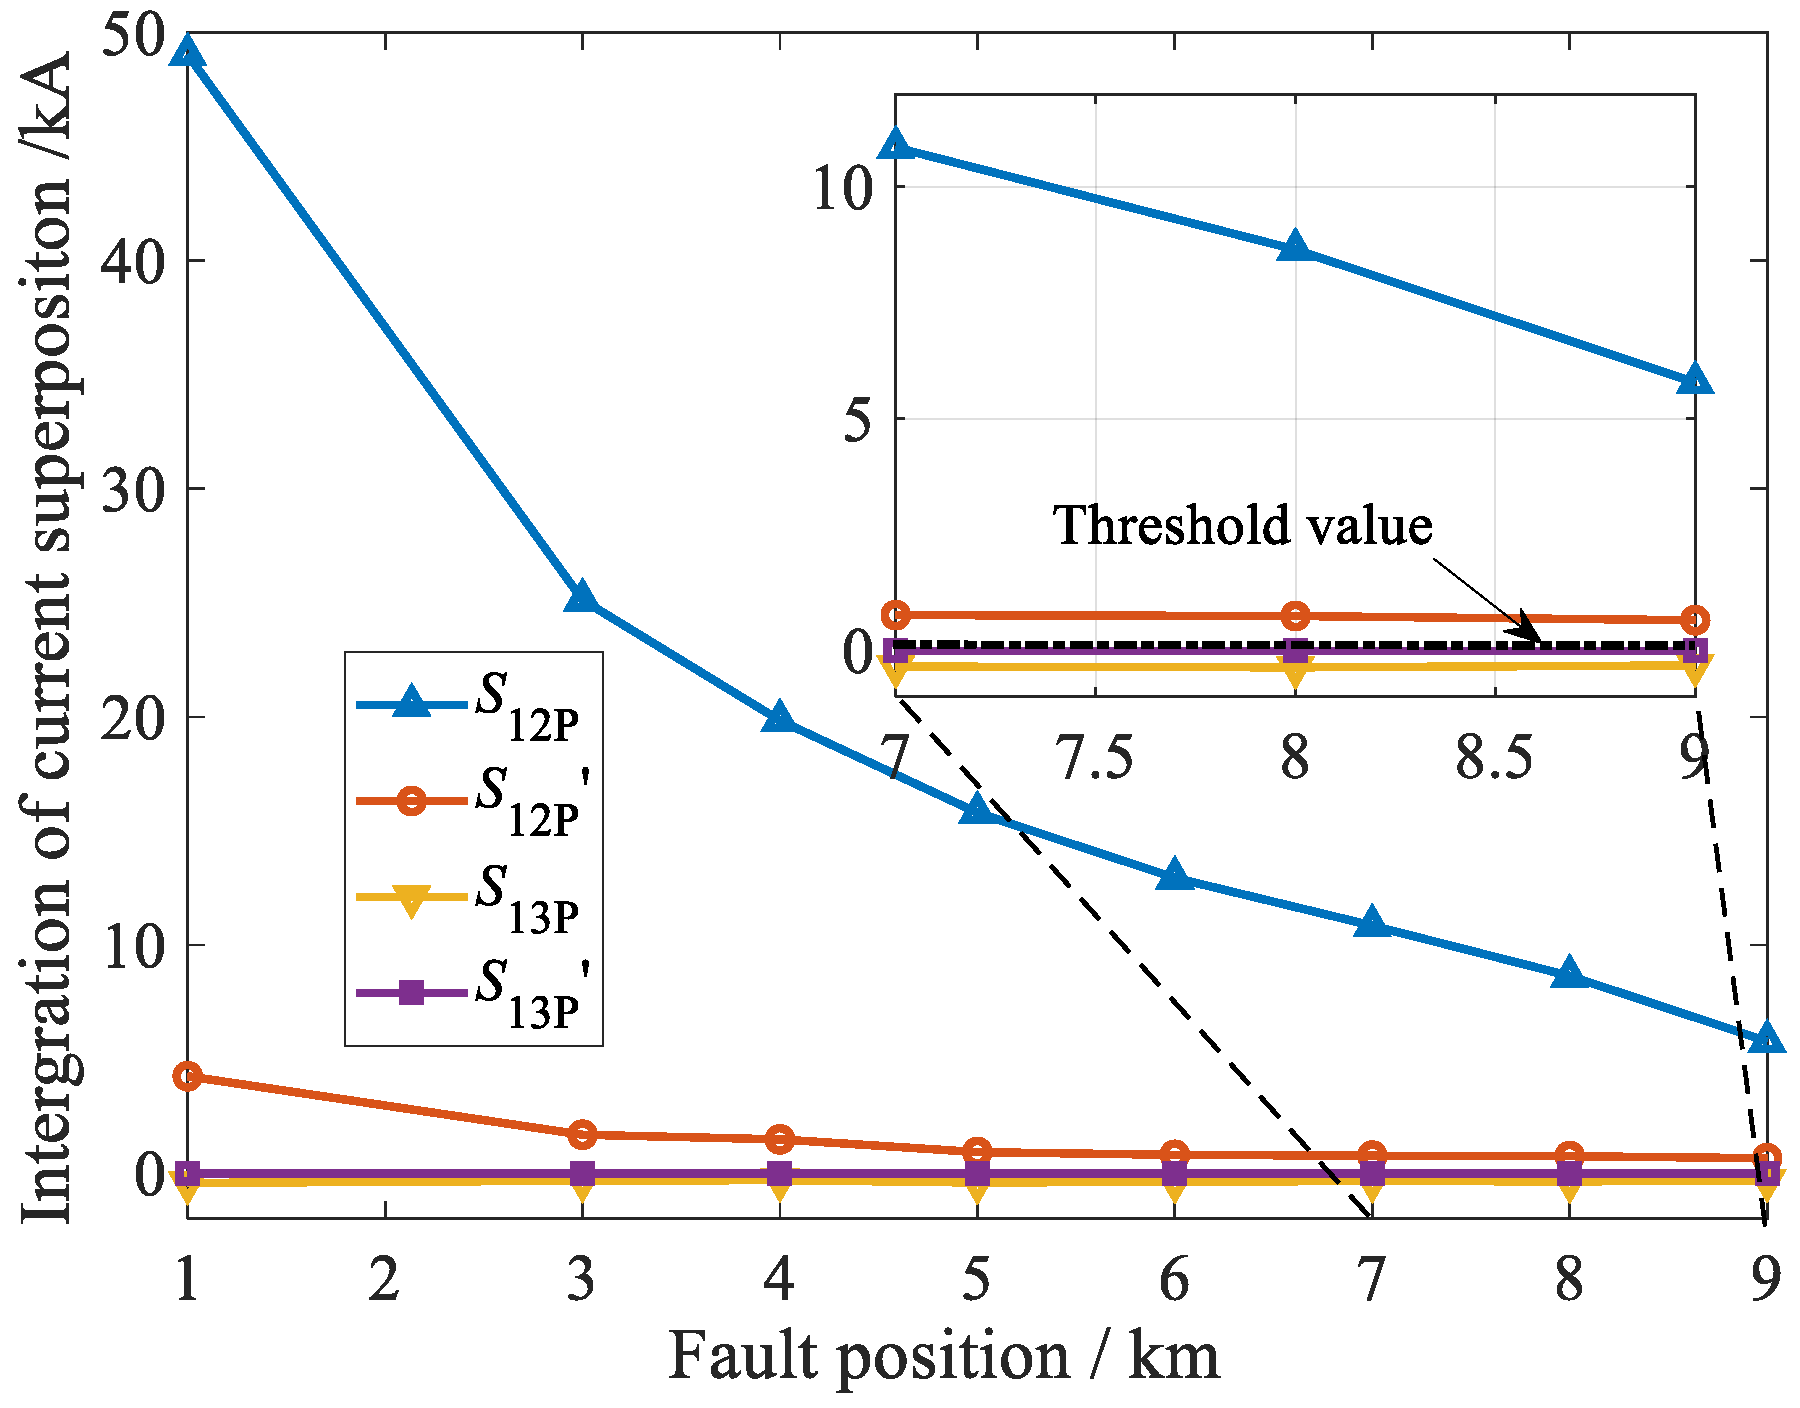
Reference [13] proposed a superimposed current-based unit protection scheme for the DC microgrid. The magnitude of the superimposed current could determine the direction of the fault, but this value was small, especially in the case of high-resistance faults, where the difference in characteristics between internal and external faults was not significant enough. On this basis, in this paper, we used the integration of current superposition to determine the fault direction, which expanded the differences and improved the reliability of protection. To further demonstrate the performance of the proposed fault detection method, PTG faults were simulated at different locations (1, 3, 5, 7, and 9 km) in the simulation system, and the detection results are shown in Figure 18, where S12P and S13P represent the protection values of the proposed method, while S12P′ and S13P′ are the protection values from Reference [13]. The proposed method had more significant protection differences and could detect faults more reliably.
(2)
Comparison Results of the Fault Location Scheme
In this paper, PTG faults were simulated with 2Ω fault resistances at different locations (1, 3, 5, 7, and 9 km) on a DC line. The comparison results of different fault location methods are shown in Table 2. For the D-type traveling-wave-based fault location method [19], when the sampling rate was 10 kHz, the fault location error caused by one sampling point error exceeded the total length of the line (10 km). Therefore, a lower sampling rate could not be used for fault location when the line length was short. When the sampling rate increased to 500 kHz, fault location was theoretically feasible. However, due to the presence of DC parallel capacitors, the DC voltage did not undergo sudden changes, resulting in significant errors in the initial fault waveform captured by discrete wavelet transform.
Reference [21] used two sampled signals at different times to solve the equivalent parameters of the fault circuit, thereby obtaining the fault position. The principle of this method is simple: it is prone to interference by relying on the sampling signal at a certain moment. This method has extremely high requirements for signal synchronization sampling, and it can only be applied to PTP faults. In this paper, the LS method was used to solve overdetermined equations, thus reducing the impact of noise and data singularities, and obtaining the highest fault location accuracy.

5. Conclusions

In this paper, a direction pilot protection scheme suitable for complex DC distribution networks was proposed based on the integration of current superposition. Besides, an online fault location scheme based on the least squares method to solve the overdetermined equation was also proposed. The proposed fault detection and location scheme has the following advantages:
(a)
The proposed fault detection scheme applies to complex DC distribution networks and can reliably detect grounding faults with high fault resistances.
(b)
The proposed fault location scheme considers the influence of distributed capacitance and improves the calculation method of the current differential to reduce the fault location error.
(c)
The proposed scheme is a time-domain scheme, does not require a high sampling rate and data length, is suitable for complex networks with multiple sources, and can achieve online fault location, reducing the cost and complexity of the location scheme.
The disadvantage of the proposed scheme is that it requires a communication system, but only needs to transmit the current data of the fault recorder to the opposite end at a certain moment after the fault.
The next step of the work can focus on whether the grounding method of the DC distribution system and the grounding medium of the grounding fault have an impact on the method proposed in this paper.

Author Contributions

Conceptualization, Y.L. and X.Y.; methodology, Y.L.; software, K.Q.; validation, K.Q. and X.Z.; resources, J.L. and K.Q.; writing—original draft preparation, X.Y.; writing—review and editing, J.L. and X.Z.; supervision, Y.L.; project administration, J.L.; funding acquisition, X.Z. All authors have read and agreed to the published version of the manuscript.

Funding

This work is supported by Science and Technology Project Funding of State Grid Jiangsu Electric Power Co., Ltd. (J2023103).

Data Availability Statement

The original contributions presented in the study are included in the article, further inquiries can be directed to the corresponding author.

Acknowledgments

The authors would like to thank the State Grid Corporation of China for its support.

Conflicts of Interest

Authors Yafei Li, Jie Li and Kejun Qian were employed by the State Grid Suzhou Power Supply Company. The remaining authors declare that the research was conducted in the absence of any commercial or financial relationships that could be construed as a potential conflict of interest. The authors declare that this study received funding from State Grid Jiangsu Electric Power Co., Ltd. The funder was not involved in the study design, collection, analysis, interpretation of data, the writing of this article or the decision to submit it for publication.

Nomenclature

LS least square
CLRcurrent-limiting reactor
DGdistributed generation
DCCBDC circuit breaker
PPUprobe power unit
IEDintelligent electronic device
SMPsignal measurement point
PTGpole-to-ground
PTPpole-to-pole
KVLKirchhoff’s voltage law
VSCvoltage source converter
ImnDC flowing from the DC bus m to the DC bus n
ΔImn(k)DC change, where k is the corresponding sampling point
Λset threshold value for the start-up criterion
Mdata length to calculate the DC change start-up criterion
ipresteady-state current
Pnumber of sampling points to obtain the steady-state current
Snmintegral of the current superposition
Ndata length of calculating Snm
k1reliability coefficient of the direction criterion
Rmnrelay of a signal measurement point at line nm close to bus n
fnmlabel symbol of fault direction
k2set value of the mis-operation criterion
ffault point
R1 and L1equivalent line resistance and reactance from A to f
Cf and Rfequivalent line capacitance and fault resistance at f
xcequivalent impedance of Cf during the fault transient process
u1, u2, and ufequivalent voltage at A, B, and f
i1, i2, and i3currents at terminals A, B, and f
d i 1 d t ( k ) difference between the previous and the subsequent sampling point at k-th sampling
Δtsampling interval
U and V matrixes of currents and voltages for calculating fault distance
LABtotal length of line AB
x1distance from end A to f
Ldcsize of the CLR
uLvoltage of the CLR

References

  1. Azizi, M.; Husev, O.; Veligorskyi, O.; Rahimpour, S.; Roncero-Clemente, C. Grounding and isolation requirements in dc microgrids: Overview and critical analysis. Energies 2023, 16, 7747. [Google Scholar] [CrossRef]
  2. Emhemed, A.A.S.; Fong, K.; Fletcher, S.; Burt, G.M. Validation of fast and selective protection scheme for an LVDC distribution network. IEEE Trans. Power Deliv. 2017, 32, 1432–1440. [Google Scholar] [CrossRef]
  3. Hategekimana, P.; Ferre, A.J.; Bernuz, J.M.R.; Ntagwirumugara, E. Fault detecting and isolating schemes in a low-voltage dc microgrid network from a remote village. Energies 2022, 15, 4460. [Google Scholar] [CrossRef]
  4. Xu, Y.; Hu, Z.; Ma, T. Monopolar grounding fault location method of dc distribution network based on improved relieff and weighted random forest. Energies 2022, 15, 7261. [Google Scholar] [CrossRef]
  5. Yang, R.; Fang, K.; Chen, J.; Chen, Y.; Liu, M.; Meng, Q. A novel protection strategy for single pole-to-ground fault in multi-terminal dc distribution network. Energies 2023, 16, 2921. [Google Scholar] [CrossRef]
  6. Ma, T.; Hu, Z.; Xu, Y.; Dong, H. Fault location based on comprehensive grey correlation degree analysis for flexible dc distribution network. Energies 2022, 15, 7820. [Google Scholar] [CrossRef]
  7. Larik, N.A.; Li, M.S.; Wu, Q.H. Enhanced fault detection and localization strategy for high-speed protection in medium-voltage DC distribution networks using extended kalman filtering algorithm. IEEE Access 2024, 12, 30329–30344. [Google Scholar] [CrossRef]
  8. Wei, X.; Zou, G.; Zhang, S.; Xu, C. Frequency domain impedance based protection for flexible DC distribution grid. IEEE Access 2022, 10, 114203–114213. [Google Scholar] [CrossRef]
  9. Monadi, M.; Zamani, M.A.; Koch-Ciobotaru, C.; Candela, J.I.; Rodriguez, P. A communication-assisted protection scheme for direct-current distribution networks. Energy 2016, 109, 578–591. [Google Scholar] [CrossRef]
  10. Fletcher, S.D.A.; Norman, P.J.; Fong, K.; Galloway, S.J.; Burt, G.M. High-speed differential protection for smart DC distribution systems. IEEE Trans. Smart Grid 2014, 5, 2610–2617. [Google Scholar] [CrossRef]
  11. Monadi, M.; Gavriluta, C.; Luna, A.; Candela, J.I.; Rodriguez, P. Centralized protection strategy for medium voltage DC microgrids. IEEE Trans. Power Deliv. 2017, 32, 430–440. [Google Scholar] [CrossRef]
  12. Emhemed, A.A.S.; Burt, G.M. An advanced protection scheme for enabling an LVDC last mile distribution network. IEEE Trans. Smart Grid 2014, 5, 2602–2609. [Google Scholar] [CrossRef]
  13. Mohanty, R.; Pradhan, A.K. A superimposed current based unit protection scheme for DC microgrid. IEEE Trans. Smart Grid 2018, 9, 3917–3919. [Google Scholar] [CrossRef]
  14. Park, J.-D.; Candelaria, J.; Ma, L.; Dunn, K. DC ring-bus microgrid fault protection and identification of fault location. IEEE Trans. Power Deliv. 2013, 28, 2574–2584. [Google Scholar] [CrossRef]
  15. Mohanty, R.; Balaji, U.S.M.; Pradhan, A.K. An accurate noniterative fault-location technique for low-voltage DC microgrid. IEEE Trans. Power Deliv. 2016, 31, 475–481. [Google Scholar] [CrossRef]
  16. Lin, F.; Wu, J.; Hao, L. One-terminal on-line fault location method for DC distribution cable based on apparent pseudo-impedance identification. Power Syst. Technol. 2016, 40, 2555–2561. [Google Scholar]
  17. Mumtaz, F.; Khan, T.S.; Alqahtani, M.; Sher, H.A.; Aljumah, A.S.; Almutairi, S.Z. Ultra high-speed fault diagnosis scheme for DC distribution systems based on discrete median filter and mathematical morphology. IEEE Access 2024, 12, 45796–45810. [Google Scholar] [CrossRef]
  18. He, J.; Zhang, M.; Luo, G.; Yu, B.; Hong, Z. A fault location method for flexible DC distribution network based on fault transient process. Power Syst. Technol. 2017, 41, 985–992. [Google Scholar]
  19. Wei, Y.; Sun, P.; Song, Z.; Wang, P.; Zeng, Z.; Wang, X. Fault location of VSC based DC distribution network based on traveling wave differential current with hausdorff distance and cubic spline interpolation. IEEE Access 2021, 9, 31246–31255. [Google Scholar] [CrossRef]
  20. Yang, J.; Fletcher, J.E.; O’Reilly, J. Short-circuit and ground fault analyses and location in VSC-based DC network cables. IEEE Trans. Ind. Electron. 2012, 59, 3827–3837. [Google Scholar] [CrossRef]
  21. Li, M.; Jia, K.; Bi, T.; Yang, G.; Liu, Y.; Yang, Q. Fault distance estimation-based protection for DC distribution networks. Power Syst. Technol. 2016, 40, 719–724. [Google Scholar]
  22. Mohanty, R.; Pradhan, A.K. Protection of smart DC microgrid with ring configuration using parameter estimation approach. IEEE Trans. Smart Grid 2018, 9, 6328–6337. [Google Scholar] [CrossRef]
  23. Feng, X.; Qi, L.; Pan, J. A novel fault location method and algorithm for DC distribution protection. IEEE Trans. Ind. Appl. 2017, 53, 1834–1840. [Google Scholar] [CrossRef]
  24. Dhar, S.; Patnaik, R.K.; Dash, P.K. Fault detection and location of photovoltaic based DC microgrid using differential protection strategy. IEEE Trans. Smart Grid 2018, 9, 4303–4312. [Google Scholar] [CrossRef]
Figure 1. Protection diagram of a DC distribution system.
Energies 17 05128 g001
Figure 2. The flowchart of the direction pilot protection scheme.
Energies 17 05128 g002
Figure 3. Fault-equivalent circuit without CLRs.
Energies 17 05128 g003
Figure 4. Fault-equivalent circuit with CLRs.
Energies 17 05128 g004
Figure 5. Topology of the simulation system.
Energies 17 05128 g005
Figure 6. Characteristics of a PTG fault. (a) is the pole to ground voltage; (b) is the positive pole current; (c) is the diode current in the VSC at A-terminal.
Energies 17 05128 g006
Figure 7. Characteristics of a PTP fault. (a) is the pole to pole (PTP) voltage; (b) is the positive pole current; (c) is the diode current in the VSC at A-terminal.
Energies 17 05128 g007
Figure 8. The protection results of the directional criterion.
Energies 17 05128 g008
Figure 9. Fault detection results after different positions.
Energies 17 05128 g009
Figure 10. Fault detection results after different resistances.
Energies 17 05128 g010
Figure 11. Location results after a PTG fault. (a) is the calculated inductance at both terminal; (b) is the calculated fault location at A-terminal.
Energies 17 05128 g011
Figure 12. Location results with different fault positions.
Energies 17 05128 g012
Figure 13. Influence of fault distance and fault resistance.
Energies 17 05128 g013
Figure 14. Influence of the sampling points.
Energies 17 05128 g014
Figure 15. Influence of sampling rate and data length.
Energies 17 05128 g015
Figure 16. Influence of asynchronous sampling and current difference methods comparing with reference [24].
Energies 17 05128 g016
Figure 17. Location results with CLRs: (a) voltages on the A-terminal CLR, (b) voltages on the B-terminal CLR, and (c) location results.
Energies 17 05128 g017
Figure 18. Comparison results of the fault detection scheme.
Energies 17 05128 g018
Table 1. The parameters of the simulation system.
Simulation ParametersValuesSimulation ParametersValues
DC voltage/kV±10DC line length of AB/km10
AC line voltage/kV10Unit resistance/(Ω/km)0.123
AC reactor/mH10Unit reactance/(mH/km)0.984
DC capacitor/μF20,000Unit capacitance/(μF/km)0.283
Table 2. Fault location errors with different methods.
MethodsConditionsFault Position/km
13579
ProposedN = 101.6 m11.1 m13.3 m5.1 m2.1 m
Reference [19]10 kHz41.0 km28.0 km30.0 km17.0 km41.0 km
500 kHz5.0 km10.0 km7.5 km2.5 km6.5 km
Reference [21]PTP faults102.3 m350.8 m143.6 m26.5 m295.1 m
Disclaimer/Publisher’s Note: The statements, opinions and data contained in all publications are solely those of the individual author(s) and contributor(s) and not of MDPI and/or the editor(s). MDPI and/or the editor(s) disclaim responsibility for any injury to people or property resulting from any ideas, methods, instructions or products referred to in the content.