Abstract
Wave energy has the potential to provide a sustainable solution for global energy demands, particularly in coastal regions. This study explores the use of reinforcement learning (RL), specifically the Q-learning algorithm, to optimise the energy extraction capabilities of a wave energy converter (WEC) using a single-body point absorber with resistive control. Experimental validation demonstrated that Q-learning effectively optimises the power take-off (PTO) damping coefficient, leading to an energy output that closely aligns with theoretical predictions. The stability observed after approximately 40 episodes highlights the capability of Q-learning for real-time optimisation, even under irregular wave conditions. The results also showed an improvement in efficiency of 12% for the theoretical case and 11.3% for the experimental case from the initial to the optimised state, underscoring the effectiveness of the RL strategy. The simplicity of the resistive control strategy makes it a viable solution for practical engineering applications, reducing the complexity and cost of deployment. This study provides a significant step towards bridging the gap between the theoretical modelling and experimental implementation of RL-based WEC systems, contributing to the advancement of sustainable ocean energy technologies.
1. Introduction
Ocean wave energy represents a sustainable and environmentally friendly source of power, with its potential recognised for decades [1]. It has been estimated that wave energy could produce around 32,000 TWh/yr globally, contributing significantly to the renewable energy mix [2]. Despite this promise, wave energy technologies are still in their infancy and require further research to fully exploit their potential. Numerous efforts have been dedicated to improving wave energy converters (WECs) in recent years [3], with control strategies being a crucial element in enhancing the efficiency and power output of WEC systems [4]. The most commonly studied control strategies for WECs include resistive, reactive, latching, and model predictive control (MPC) [5].
Resistive control, also known as passive control, involves making the power take-off (PTO) force proportional to the device’s speed, which simplifies control by manipulating the damping of the PTO without reactive power flow [6]. Reactive control, on the other hand, optimises both damping and stiffness to maximise energy capture but requires more sophisticated algorithms [7]. Latching control, introduced by Budal and Falnes [8], temporarily stops the device motion to synchronise with the incoming wave for optimal energy absorption. More recently, adaptive and predictive control methods, such as MPC, have been investigated to address the non-linear nature of wave conditions [9]. These controllers aim to maximise energy extraction by predicting future wave patterns and adjusting the control strategy accordingly.
Nevertheless, most of the time controllers are design for the particular site condition of the location and the characteristics of the WECs, which can be a problem if the meteorological conditions changes or if the device is affected, for example, by the marine species [10]. Adaptive controllers have been propose for this conditions and one promising idea is to use artificial intelligent techniques to learn the best behaviour of the WECs and adapt it to new conditions.
In the current literature, various reinforcement learning (RL) algorithms have been applied to the control of WECs. One of the earliest approaches is Q-learning, which was first introduced in [6] for a resistive control strategy. In this study, Q-learning was implemented to adapt the damping parameter based on the exploration of a simulated environment with both regular and irregular waves. This approach showed promise in improving the adaptability of WEC control systems. Later, in [7], the same algorithm was applied to a reactive control strategy for a point absorber, where it demonstrated its effectiveness in rapidly converging to optimal parameters without requiring a model, in both regular and irregular wave environments. As noted in [11], the non-linearities present in WEC systems, specifically those introduced by mechanical PTO components, did not prevent the algorithm from determining optimal damping and stiffness parameters, thus maximising electricity generation.
The emergence of Deep Reinforcement Learning (DRL) has further advanced the field by incorporating neural networks that provide greater generality and adaptability in dynamic environments. Algorithms such as Deep Q-Network (DQN) have gained considerable popularity due to their ability to overcome some of the limitations of traditional Q-learning. For instance, Zou et al. [12] demonstrated the effectiveness of DQN in simulated environments using real wave data, where it achieved a 24% to 156% increase in power generation compared to MPC and proportional-derivative (PD) controllers. Similarly, Hasankhani et al. [9] compared DQN with MPC in controlling the height of a marine turbine and found DQN to be superior in handling model imperfections. Another approach is the use model-free deep reinforcement learning (DRL) control algorithm called soft-actor-critic, Anderlini et al. [13] use this algorithm applied to a spherical point absorber, initially using MPC to avoid the unpredictable behaviour of the initial learning stage, finding promising results.
Until this year, most studies involving DRL were limited to simulations, and only recently have the first experimental implementations been documented. In [14], an experimental study using a reactive control strategy with DRL was carried out on a two-body point absorber. The study highlighted significant deviations between theory and experiment, with errors exceeding 90%, suggesting that various sources of error were present, including unmodelled dynamics and non-linearities. A second study by Chen et al. [15] also employed a reactive control strategy using DRL on the same two-body point absorber, once again finding large discrepancies between theoretical predictions and experimental results. These pioneering experimental efforts are valuable but indicate that achieving congruence between theory and practical results is still a major challenge in this domain.
To address these issues and minimise the sources of error observed in previous studies, this work adopts a more straightforward approach. Specifically, we use Q-learning, the most commonly applied and easy-to-implement RL algorithm, along with resistive control, which is simpler to implement in real systems compared to more complex reactive strategies. Furthermore, we apply this approach to a single-body point absorber, as its simpler dynamics make it easier to model and control effectively. This combination aims to reduce the gap between theoretical and experimental results, while providing a robust, experimentally validated method for improving wave energy conversion.
2. Experimental Set-Up
The experimental set-up used in this work is the same as presented in [16]. Figure 1 shows a schematic view of the wave channel located in the laboratory of the University of Bío-Bío, where the corresponding experiments were conducted. At one end, there is a wave generator paddle, whose movement is controlled by an electric motor and a frequency controller. At the opposite end, there is a wave absorption system to reduce the wave reflection effect. At a distance of from the paddle, there is a buoy. This spherical buoy has a diameter of 210 mm and a mass of 2.52 kg, representing the point-absorber wave energy converter (PA-WEC). It was 3D printed using PLA filament and is attached to a 20 mm diameter aluminium shaft, whose movement is restricted by two ball bearings, allowing only vertical motion. The PTO system, which is visualised in Figure 2, consists of a direct mechanical rack and pinion drive, where the rack is connected to the vertical shaft and the pinion to the DC motor shaft used as a generator. The main dimensions of the system are provided in Table 1. For more details of the experimental set-up, please refer to [16].
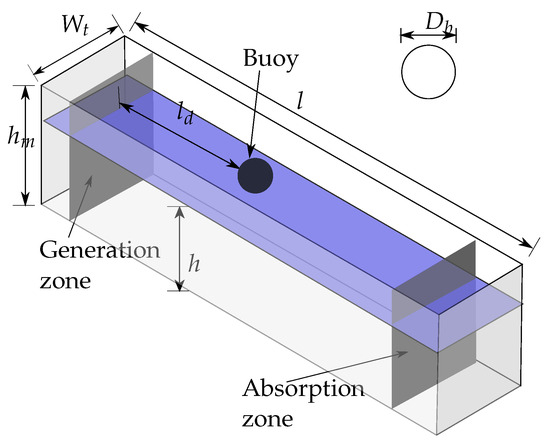
Figure 1.
Schematic view of the wave channel and point absorber [16].
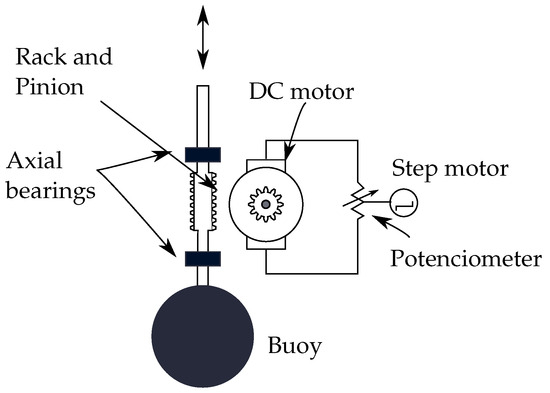
Figure 2.
Controllable point absorber wave energy converter [16].

Table 1.
Dimensions in meters of the tank illustrated in Figure 1.
3. Mathematical Model
3.1. Hydrodynamic Model
The experimental results are compared with the mathematical results obtained from a numerical model, which was developed previously in [16]. The model assumes the WEC as a single-degree-of-freedom body, the hydrodynamic coefficients, added mass , radiation damping and excitation force are obtained using Ansys-AQWA 2024R1 software and are depicted in Figure 3. In the same figure is also shown the response amplitude operator of the system, where it is possible to see the resonant frequency, around 1.3 Hz, and the narrow broadband of frequencies where the system operates. The hydrostatic stiffness S of the system is also obtained from AQWA, with a value of N/m.
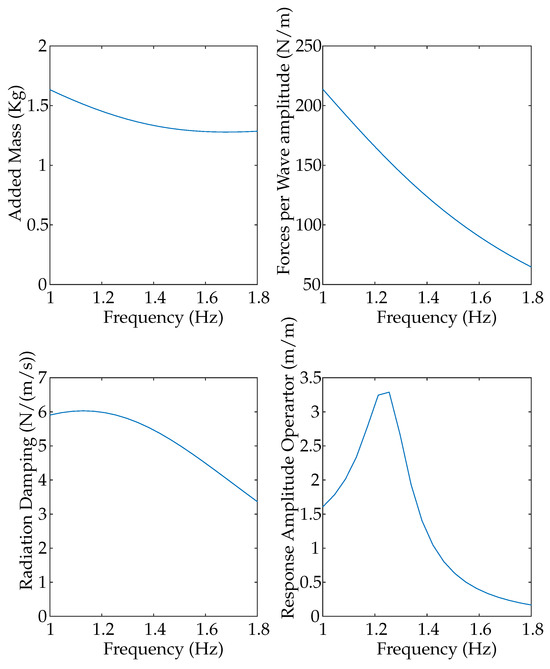
Figure 3.
Hydrodynamic coefficients obtained from ANSYS-AQWA.
The PTO system, which is visualised in Figure 2, consists of a direct mechanical rack and pinion drive, where the rack is connected to the vertical shaft and the pinion to the DC motor shaft used as a generator; the output of the generator is connected to a potentiometer that regulates the resistive load. The equation governing the DC motor, with the resistive load coupled to the system, can be represented as in Equation (1).
where is the proportional constant between EMF and the angular velocity of the motor, the motor inductance, the internal resistance of the motor, the external load resistance, the potentiometer knob angle and the current. The term is neglected.
Coupling the WEC dynamics equation with the controllable PTO equations, the global equation system are obtained and depicted in (2).
where J is the motor angular inertia, D the viscous friction coefficient, z the vertical displacement of the buoy and r the pinion radius. The electric motor is characterised using a KEYSIGHT oscilloscope model DSOX2024A (Keysight Technologies, Santa Rosa, CA, USA). and the characteristics are summarised in Table 2.

Table 2.
Electric DC machine characteristics and parameters.
For more details of the mathematical model, refer to [16].
3.2. Resistive Control
In this work, a resistive control strategy is implemented; the PTO is modelled as a system that purely provides damping to the system, which is therefore proportional to the velocity of the device, as shown in Equation (3):
Then, the power is given by Equation (4).
From (5), it can be observed that the power can be modified by changing , which is varied by modifying the value of the resistive load by changing the value of angle . and are linearly dependent according to .
3.3. Model Validation
In order to validate the mathematical model, a comparison between the voltage, current and power generated is performed for a constant value of ° and for a constant wave frequency of Hz. The results are depicted in Figure 4.
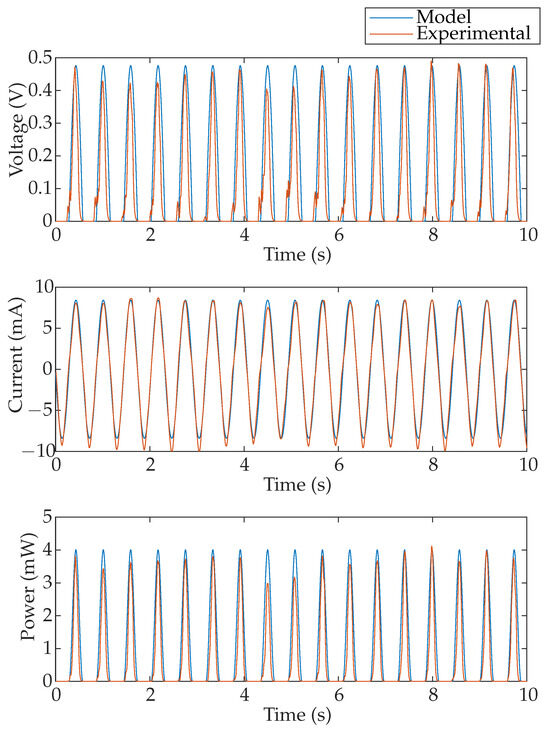
Figure 4.
Voltage, current and power comparison between experiments and mathematical predictions, for a constant angle °.
To measure voltage and current using the INA219 device, from Adafruit Industries, New York, NY, USA, the ground (negative connector) must be connected to the common GND. As a result, the sensor can only detect positive voltage values, omitting the negative sequence from the graphs. However, since the power in both the positive and negative half-cycles is nearly identical, it can be assumed that the total energy is approximately double the value shown. On the other hand, the set-up generation reaches up to 0.5 V, while the current rises to about 8 mA. The INA219 resolution can be configured to either 32 V/1 A or 16 V/400 mA; the latter is selected, resulting in a voltage minimal resolution of 3.907 mV and a current minimal resolution of 97.7 μA, considering the 12-bit ADC of the INA219. These resolution values are sufficient for the presented low-power prototype, and enough detail is provided in the graph included in the paper for easy interpretation.
The results from Figure 4 show that the power obtained experimentally presents variations in amplitude; this could be explained by the non-linearities in the experimental wave channel.
Additionally, a study was conducted to analyse the effect of the angle on the generated power, with the angle ranging from 0° to 30°. Experimentally, the power was obtained using the maximum value reached in a 5 s window, in order to minimise the power variations. Both experimental and mathematical power results from this analysis are presented in Figure 5. From this figure, it is possible to find small discrepancies between the model and experiments; in particular, the maximum power from the mathematical model is 4.02 mW and it is found for the angle °; experimentally, the maximum power is 4.86 mW and it is found at °. The error bars show the variations in the experimental power explained previously in Figure 4.
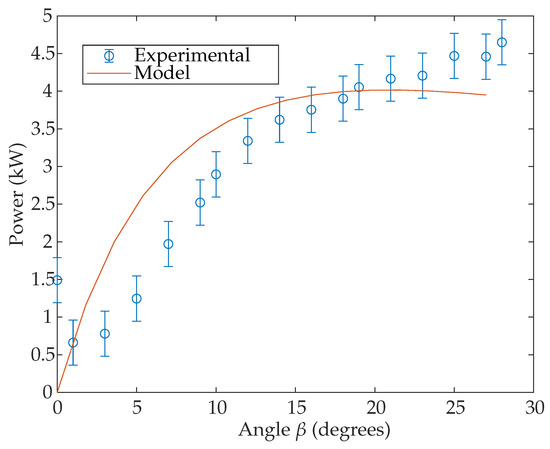
Figure 5.
Maximum power per studied angle . Experimental, with average value in circles and errors bar in blue and model results in red.
4. Reinforcement Learning (RL)
In this work, the Q-learning method is selected; this method corresponds to a temporal difference method, which learns optimal policies directly from interactions without needing a model of the environment. Its off-policy nature enables efficient learning regardless of the agent’s actions. Q-learning handles random transitions and rewards well, making it robust for various scenarios. With sufficient exploration, it reliably converges to the optimal policy, making it effective for many decision-making tasks. This method is based on discrete action and states that are refreshed at each step of the , according to Equation (6).
where and correspond to the current state and action, respectively, corresponds to the learning rate, corresponds to the reward obtained by selecting a certain action, corresponds to the discount factor, which determines how much the agent cares about the rewards in the distant future relative to those in the immediate future, and A corresponds to the action space [17,18].
RL on Resistive Control
In this work, the Q-learning algorithm is applied to optimise the PTO damping coefficient using Equation (5). The objective is to maximise the energy extraction from the wave generator without relying on a model of the system dynamics. For this purpose, at each time step, the control signal generates a change in the damping of the PTO system, , by varying the resistance of the resistive load, or, in other words, modifying the value of . This action results in a change in state and a reward that depends on the generated power. The main elements of the algorithm, namely state and action spaces, reward function, learning and exploration rates, and the discount factor, are described below:
- State Space: This corresponds to the vector that is formed based on the dimension of the vector that stores all the values of the angle as shown in Equation (7):where is the length of the vector and corresponds to the vector that stores all possible values for the angle , which is defined with a minimum value, a maximum value and the step between each value as shown in Equation (8):
- Action Space: Considering the selected state space, the action space is defined in Equation (9):where represents a decrease, an increase and 0 maintaining the value of , so that in each state there are a maximum of three actions, with the exception of the boundary states, corresponding to the states and . In the first case, a decrease in is not allowed since the agent is already at the minimum possible value, analogous to the upper limit case.
- Reward Function: This represents the objective that is expected to be maximised by the controller. Therefore, in this case, the reward function needs to be a function of the absorbed power. To prevent the device from making excessive movements in extreme wave conditions that could disrupt the proper functioning of the system, the agent is penalised with a reward of if the established limit value, denoted as , is exceeded. If it is equal to or less than this value, the average power raised to a factor u is obtained, as in [17], which aims to amplify the value because the difference between the average power obtained between neighbouring values of can be very low and must be evident to avoid convergence problems in the algorithm.
- Exploration Strategy: To address the exploration–exploitation dilemma [18], an -greedy strategy is followed, which defines the action taken at each time step as follows:where is the exploration rate. This means that, during the initial stages of algorithm execution, the agent is instructed to explore as many state–action pairs as possible and then gradually shift the focus to exploiting the data obtained from initial learning. The exploration rate is expressed as follows:
5. Experimental Procedure
In order to test the RL algorithm in the experimental set-up described in Section 2, a series of steps in a closed-loop system were implemented; the schematic representation of these steps is represented in Figure 6.
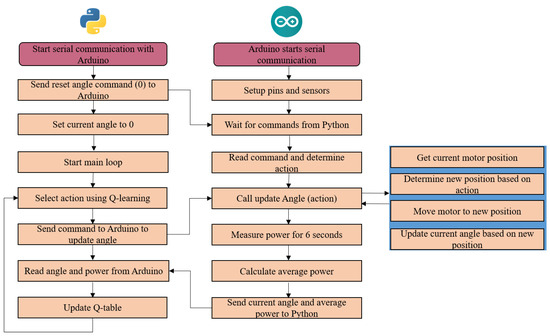
Figure 6.
Algorithm to achieve the experimental results.
To control the angular position of the stepper motor, that regulates the angle , an Arduino microcontroller was used in communication to the Python 3.12.0-based Q-Learning algorithm. The Arduino was programmed to interface with a power sensor (Adafruit INA219, from Adafruit Industries, New York, NY, USA) and a stepper motor driver (DRV8825, from pololu robotics and electronics, Las Vegas, NV, USA), receiving commands via serial communication. The Python script initiated the serial connection, sent commands to adjust the motor’s angle, and received feedback on the motor’s position and power consumption. The Q-Learning algorithm selected actions to optimise motor positioning based on received sensor data. For each iteration, the Arduino adjusted the motor’s position according to the received command, measured power consumption over a 6 s interval and sent the averaged power data back to the Python script. The Q-Learning agent used this data to update its policy and improve performance over 200 episodes. This set-up allowed for continuous learning and adjustment of the motor’s position to achieve optimal power efficiency.
6. Results and Discussion
The algorithm and the experimental set-up are initially tested using a regular wave of 0.02 m wave height and 1.4 Hz wave frequency. The initial angle was set to zero and was equal to 90°. The extracted power is plotted against the number of episodes and shown in Figure 7. It can be seen that after 40 episodes the algorithm finds the maximum power and that experimentally and numerically the results are very similar reaching the maximum power of 4.01 mW and 4.19 mW. In Figure 8, the selected angle is plotted against the episode, starting from 0 until both theoretically and experimentally it reaches the optimal angle that maximises the power; there is a difference of 4° between the final experimental and theoretical angle, that is part of the uncertainties of the model; nevertheless, the difference from the maximum power at that final episode is only 0.18 mW.
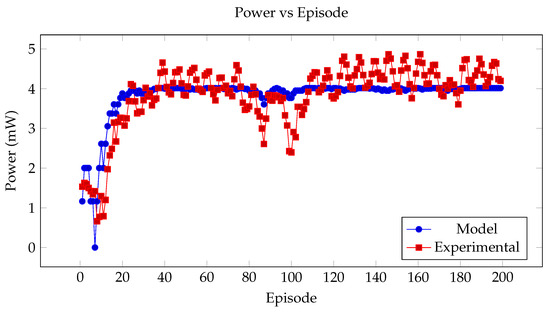
Figure 7.
Comparison of model and experimental power output over episodes.
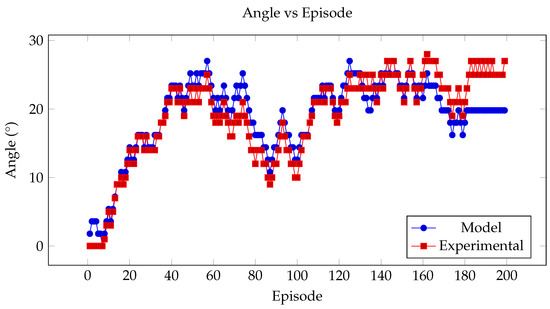
Figure 8.
Comparison of model and experimental selected angle over episodes.
Considering that the wave energy potential of this wave is 237.5 mW, the maximum power for the model and experiments along with the theoretical wave energy potential and the efficiency at the beginning of the test and the end of the training is presented in Table 3.

Table 3.
Power performance and efficiency.
It is possible to see that by using the RL strategy the efficiency from the initial state to the optimised stated improves by 12% for the theoretical case and 11.3% for the experimental case.
In order to study the algorithm behaviour for other wave conditions, this is applied for regular waves of frequencies 1 Hz, 1.5 Hz and 1.8 Hz. These results are shown in Figure 9. From this figure, it is possible to conclude that the algorithm is able to find the maximum power for each case and these results are consistent with the RAO shown in Figure 3.
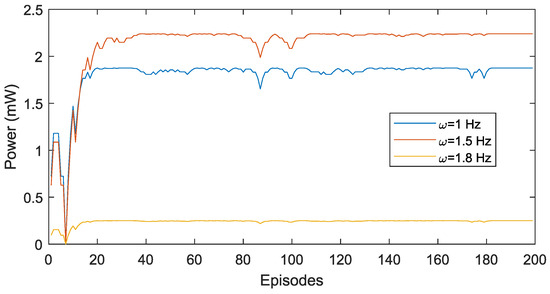
Figure 9.
Model maximum power output per episode for three different wave frequency conditions.
7. Conclusions
The potential of wave energy as a sustainable solution for global energy demands, particularly in coastal regions, is substantial. This study aimed to contribute to maximising the energy extraction capabilities of wave energy converters (WECs) by employing a model-free approach based on reinforcement learning (RL) combined with resistive control. Specifically, the application of the Q-learning algorithm was experimentally validated using a single-body point absorber, demonstrating the simplicity and feasibility of this approach in a practical setting. The use of resistive control offers a straightforward solution compared to more complex reactive or predictive strategies, making it a viable choice for real-world implementations.
The experimental results showed that Q-learning could effectively optimise the power take-off (PTO) damping coefficient, resulting in energy output that closely aligns with theoretical predictions. The observed discrepancies between the experimental and modelled outcomes were minimal and largely attributable to experimental uncertainties, underscoring the robustness of the model-free RL approach. The stability observed in power output after approximately 40 episodes highlights the potential of Q-learning for the real-time optimisation of WECs for all the wave conditions studied.
Furthermore, the results indicate that using the RL strategy led to an improvement in efficiency of 12% for the theoretical case and 11.3% for the experimental case from the initial state to the optimised state. This highlights the effectiveness of the Q-learning approach in maximising energy capture.
This work helps bridge the gap between theoretical modelling and experimental validation in the field of wave energy conversion. The findings suggest promising directions for future studies, including the exploration of more sophisticated RL algorithms such as actor–critic methods and the investigation of adaptive mechanisms to enhance the system responsiveness to dynamic oceanic conditions. These improvements could further enhance the energy capture efficiency and operational robustness of WEC systems.
The practical implications of this study are significant for engineering applications. By validating the Q-learning approach in a controlled experimental environment, it is now possible to implement this algorithm in real-world wave energy systems in a straightforward manner. The simplicity of the resistive control strategy reduces the complexity and cost of deployment, making it accessible for practical engineering use. Additionally, the robustness and adaptability demonstrated by the algorithm suggest its suitability for varying ocean conditions, providing a reliable method to optimise energy capture in diverse marine environments.
Author Contributions
Conceptualisation, F.G.P., P.G.C. and J.R.; Data curation, F.G.P. and P.G.C.; Formal analysis, F.G.P., C.E.B., J.R. and T.D.; Investigation, F.G.P., C.E.B. and J.R.; Methodology, F.G.P., P.G.C. and J.R.; Software, F.G.P., P.G.C. and J.R.; Supervision, F.G.P.; Validation, F.G.P. and J.R.; Visualisation, T.D.; Writing—original draft, F.G.P., C.E.B. and J.R.; Writing—review and editing, F.G.P., C.E.B., J.R. and T.D. All authors have read and agreed to the published version of the manuscript.
Funding
This research received no external funding.
Data Availability Statement
The original contributions presented in the study are included in the article, further inquiries can be directed to the corresponding author.
Acknowledgments
We thank the Group of Renewable Ocean and Wave Energy GROW-E, UBB, the Department of Mechanical Engineering UBB and the Department of Electric and Electronic Engineering UBB.
Conflicts of Interest
The authors declare no conflicts of interest.
Abbreviations
The following abbreviations are used in this manuscript:
| WEC | Wave Energy Converter |
| MPC | Model Predictive Control |
| PTO | Power Take-Off |
| RL | Reinforcement Learning |
| LPT | Linear Potential Theory |
| BEM | Boundary Element Method |
| PLA | Polylactic Acid |
| DC | Direct Current |
References
- Salter, S. Wave power. Nature 1974, 7720, 249–260. [Google Scholar] [CrossRef]
- Mørk, G.; Barstow, S.; Kabuth, A.; Pontes, M. T Assessing the global wave energy potential. In Proceedings of the International Conference on Offshore Mechanics and Arctic Engineering-OMAE, Shanghai, China, 6–11 June 2010; Volume 3, pp. 447–454. [Google Scholar]
- Golbaz, D.; Asadi, R.; Amini, E.; Mehdipour, H.; Nasiri, M.; Nezhad, M.M.; Naeeni, S.T.O.; Neshat, M. Ocean Wave Energy Converters Optimization: A Comprehensive Review on Research Directions. arXiv 2021, arXiv:2105.07180. [Google Scholar]
- Coe, R.; Bacelli, G.; Wilson, D.; Abdelkhalik, O.; Korde, U.; Robinett, R., III. A comparison of control strategies for wave energy converters. Int. J. Mar. Energy 2017, 20, 45–63. [Google Scholar] [CrossRef]
- Maria-Arenas, A.; Garrido, A.; Rusu, E.; Garrido, I. Control Strategies Applied to Wave Energy Converters: State of the Art. Energies 2019, 12, 3115. [Google Scholar] [CrossRef]
- Anderlini, E.; Forehand, D.I.; Stansell, P.; Xiao, Q.; Abusara, M. Control of a point absorber using reinforcement learning. IEEE Trans. Sustain. Energy 2016, 7, 1681–1690. [Google Scholar] [CrossRef]
- Anderlini, E.; Forehand, I.D.; Bannon, E.; Xiao, Q.; Abusara, M. Reactive control of a two-body point absorber using reinforcement learning. Ocean Eng. 2018, 148, 650–658. [Google Scholar] [CrossRef]
- Budal, K.; Falnes, J. Optimum Operation of Wave Power Converter; Internal Report; Norwegian University of Science and Technology: Trondheim, Norway, 1976; pp. 1–12. [Google Scholar]
- Hasankhani, A.; Tang, Y.; Van Zwieten, J.; Sultan, C. Comparison of Deep Reinforcement Learning and Model Predictive Control for Real-Time Depth Optimization of a Lifting Surface Controlled Ocean Current Turbine. In Proceedings of the 2021 IEEE Conference on Control Technology and Applications (CCTA), San Diego, CA, USA, 8–11 August 2021. [Google Scholar] [CrossRef]
- Tiron, R.; Pinck, C.; Reynaud, E.G.; Dias, F. Is Boufouling a Critical Issue For Wave Energy Converters? In Proceedings of the 22nd International Offshore and Polar Engineering Conference, Rhodes, Greece, 17–23 June 2012. [Google Scholar]
- Bruzzone, L.; Fanghella, P.; Berselli, G. Reinforcement Learning control of an onshore oscillating arm Wave Energy Converter. Ocean Eng. 2020, 206, 107346. [Google Scholar] [CrossRef]
- Zou, S.; Zhou, X.; Khan, I.; Weaver, W.W.; Rahman, S. Optimization of the electricity generation of a wave energy converter using deep reinforcement learning. Ocean. Eng. 2022, 244, 110363. [Google Scholar] [CrossRef]
- Anderlini, E.; Husain, S.; Parker, G.G.; Abusara, M.; Thomas, G. Towards real-time reinforcement learning control of a wave energy converter. J. Mar. Sci. Eng. 2020, 8, 845. [Google Scholar] [CrossRef]
- Chen, K.; Huang, X.; Lin, Z.; Xiao, X.; Han, Y. Control of a Wave Energy Converter Using Model-Free Deep Reinforcement Learning. In Proceedings of the 2024 UKACC 14th International Conference on Control (CONTROL), Winchester, UK, 10–12 April 2024; pp. 1–6. [Google Scholar] [CrossRef]
- Chen, K.; Huang, X.; Lin, Z.; Xiao, X.; Han, Y. Design and Tank Testing of Reinforcement Learning Control for Wave Energy Converters. IEEE Trans. Sustain. Energy 2024, 15, 2534–2546. [Google Scholar] [CrossRef]
- Pierart, P.; Rubilar, M.; Rothen, J. Experimental Validation of Damping Adjustment Method with Generator Parameter Study for Wave Energy Conversion. Energies 2023, 16, 5298. [Google Scholar] [CrossRef]
- Anderlini, E.; Forehand, D.I.; Bannon, E.; Abusara, M. Control of a Realistic Wave Energy Converter Model Using Least-Squares Policy Iteration. IEEE Trans. Sustain. Energy 2017, 8, 1618–1628. [Google Scholar] [CrossRef]
- Sutton, R.S.; Barto, A.G. Reinforcement Learning; MIT Press: Cambridge, MA, USA, 2018. [Google Scholar]
Disclaimer/Publisher’s Note: The statements, opinions and data contained in all publications are solely those of the individual author(s) and contributor(s) and not of MDPI and/or the editor(s). MDPI and/or the editor(s) disclaim responsibility for any injury to people or property resulting from any ideas, methods, instructions or products referred to in the content. |
© 2024 by the authors. Licensee MDPI, Basel, Switzerland. This article is an open access article distributed under the terms and conditions of the Creative Commons Attribution (CC BY) license (https://creativecommons.org/licenses/by/4.0/).