Article

Differences in the Genesis and Sources of Hydrocarbon Gas Fluid from the Eastern and Western Kuqa Depression

by
Xianzhang Yang
1,
Taohua He
2,3,*,
Bin Wang
1,
Lu Zhou
1,
Ke Zhang
1,
Ya Zhao
2,
Qianghao Zeng
2,
Yahao Huang
2,
Jiayi He
2,3 and
Zhigang Wen
2,*
1
Petroleum Exploration & Production Research Institute, Tarim Oilfield Company, PetroChina, Korla 841000, China
2
Hubei Key Laboratory of Petroleum Geochemistry and Environment, Yangtze University, Wuhan 430100, China
3
Key Laboratory of Exploration Technologies for Oil and Gas Resources, Ministry of Education, Yangtze University, Wuhan 430100, China
*
Authors to whom correspondence should be addressed.
Energies 2024, 17(20), 5064; https://doi.org/10.3390/en17205064
Submission received: 9 September 2024 / Revised: 1 October 2024 / Accepted: 9 October 2024 / Published: 11 October 2024
(This article belongs to the Section H: Geo-Energy)

Abstract

:
The Kuqa Depression is rich in oil and gas resources and serves as a key production area in the Tarim Basin. However, controversy persists over the genesis of oil and gas in the various structural zones of the Kuqa Depression. This study employs natural gas composition analysis, gas carbon isotope analysis and gold pipe thermal simulation experiments, to comprehensively analyze the differences in the genesis and sources of hydrocarbon gas fluid from the eastern and western Kuqa Depression. The results show that the Kuqa Depression is dominated by alkane gas, with an average gas drying coefficient of 95.6, with nitrogen and carbon dioxide as the primary non-hydrocarbon gases. The average of δ13C1, δ13C2 and δ13C3 values in natural gas are −27.70‰, −20.43‰ and −21.75‰, respectively. Based on comprehensive natural gas geochemical maps, the CO2 in the natural gas from the Tudong and Dabei areas, as well as the KT-1 well of the Kuqa Depression, is thought to be of organic origin. Additionally, natural gas formation in the Tudong area is relatively simple, consisting entirely of thermally generated coal gas derived from the initial cracking of kerogen. The natural gas in the KT-1 well and the Dabei area are mixed gasses, formed by the initial cracking of kerogen from highly evolved lacustrine and coal-bearing source rocks, exhibiting characteristics resembling those of crude oil cracking gas. The methane (CH4) content of natural gas in the Dabei area is high and the carbon isotopes are unusually heavy. Considering the regional geological background, potential source rock characteristics and geochemical features may be related to the large-scale invasion of dry gas contributed by CH4 from highly evolved, underlying coal-bearing source rocks. Consequently, the CH4 content in the mixed gas is generally high (Ln (C1/C2) can reach up to 5.38), while the relative content of heavy components is low, though remains relatively unchanged. Thus, the map of the relative content of heavy components still reflects the characteristics of the original gas genesis (initial cracking of kerogen). Mixed-source gas was analyzed using thermal simulation experiments and natural gas composition ratio diagrams. The contributions of natural gas from deep, highly evolved coal-bearing source rocks in the KT-1 well and the Dabei area accounted for more than 90% and approximately 60%, respectively. This analysis provides theoretical guidance for natural gas exploration in the research area.

1. Introduction

Natural gas is recognized as a clean energy source and plays an increasingly significant role in today’s energy structure [1,2]. The increasing exploration efforts indicate that large natural gas reservoirs are becoming more difficult to discover. The limited hydrocarbon supply from a single source suggests that the formation and evolution of natural gas in complex geological settings could become a research focal point. The Tarim Basin is rich in natural gas deposits. As a large, complex, superimposed basin, its central and northern areas contain effective Cambrian marine source rocks and Triassic to Jurassic lakeshore and coal source rocks. These provide abundant hydrocarbons for the formation of large-scale oil and gas fields, with proven natural gas resources reaching up to 5.22 × 10¹² m3 [3]. The long history of thermal evolution, the diverse distributions of hydrocarbon source rocks and the multi-phase charging characteristics have led to the differential distribution of natural gas in the Kuqa Depression. This has resulted in mixed-source reservoir formations. Zou et al. (2006) suggested that natural gas in the Kuqa Depression originated from Triassic lacustrine and Jurassic coal-bearing source rocks, supplying hydrocarbons from multiple sources, consisting mainly of coal gas with a small amount of associated crude oil [4]. Similarly, Liu et al. (2008) proposed that the natural gas originates from different sources and injection times of coal-type gas, leading to varying degrees of dryness and differences in east–west distribution [5]. Fan et al. (2022) indicate that the primary source of natural gas in the Tugelming area of the Kuqa Depression is Jurassic source rocks [6]. Yang et al. (2024) believe that the Bozi–Dabei area experienced three distinct stages of oil and gas injection, with the third stage being the primary period of gas injection [7].
The formation of natural gas is closely related to that of crude oil, involving the thermal degradation of primary sedimentary organic matter and various secondary processes occurring at different times or involving different source rocks. Geochemical tracing can be used to analyze the abundance of genetic (i.e., hydrocarbon matrix properties) and post-genetic information (i.e., secondary modification and the history of gas migration and concentration) in natural gas by examining the content and isotope signatures of each component [8,9,10,11,12]. The identification of natural gas sources and genesis has led to the development of relatively complete geochemical analysis techniques and frameworks. However, compared to hydrocarbon sourcing for single reservoirs, the quantitative analysis of mixed-source gas remains underdeveloped, requiring more accurate end-member gas identification and screening [13,14,15,16,17,18,19,20,21,22]. The formation of mixed-source natural gas is closely related to the complex geological conditions in the basin and screening standard end-member gases within the basin is a complex task. Additionally, source-rock crushing technology must contend with factors such as reservoir and source rock maturity, isotope fractionation during gas migration, geological limitations and sample selection within the basin. The golden tube thermal simulation system helps study natural gas formation, isotope fractionation and the cracking of crude oil, offering advantages in screening end-member gases and exploring deep source rocks. Given the complexity of the qualitative and quantitative descriptions of mixed-source natural gas in the early Kuqa Depression, this article aims to systematically describe the geochemical characteristics of natural gas in the Kuqa Depression. Additionally, this aims to quantitatively study these highly evolved, mixed-source natural gas reservoirs through thermal simulation technology, to promote the in-depth exploration of natural gas in the Kuqa Depression and similar geological conditions.

2. Geologic Setting

The Kuqa Depression is located on the northern edge of the Tarim Basin, bordered by the southern Tianshan fault–fold belt in the north through a thrust fault and connected to the northern uplift in the south. It extends from the Yangxia Sag in the east to the Wushi Sag in the west. It is a narrow, elongated NE-SW belt, with a wide central section and narrowing in the east–west direction, covering an exploration area of approximately 3.7 × 10⁴ km2 [23,24]. With abundant oil and gas resources, it serves as the primary natural gas-producing region in the Tarim Basin [24,25,26,27]. The Kuqa Depression is a Mesozoic–Cenozoic sedimentary depression developed on a foundation of Paleozoic folds. It has undergone three stages of tectonic evolution: the Late Permian to the Early–Middle Triassic foreland basin stage, the Late Triassic to the Middle Jurassic extensional rift stage and the regenerated foreland basin stage since the Cretaceous period [7,25,28]. This evolution led to the formation of the current structural pattern of “five structural belts (slopes) and three sags” characterized by “north-south zoning and east-west segmentation”. These structural zones and sags include the Northern Monoclinic Belt (NMB), the Kelasu Structure Belt (KSB), the Yiqikelike Structural Belt (YSB), the Qiulitage Structural Belt (QSB) and the Southern Slope Belt (SGS), along with the structural patterns of the Baicheng Sag, Yangxia Sag and Wushi Sag [23,29,30,31]. This study area is located in the eastern part of the Yiqikelike Structural Belt, the Dabei area of the Kelasu Structure Belt and the KT-1 well of the Northern Monoclinic Belt.
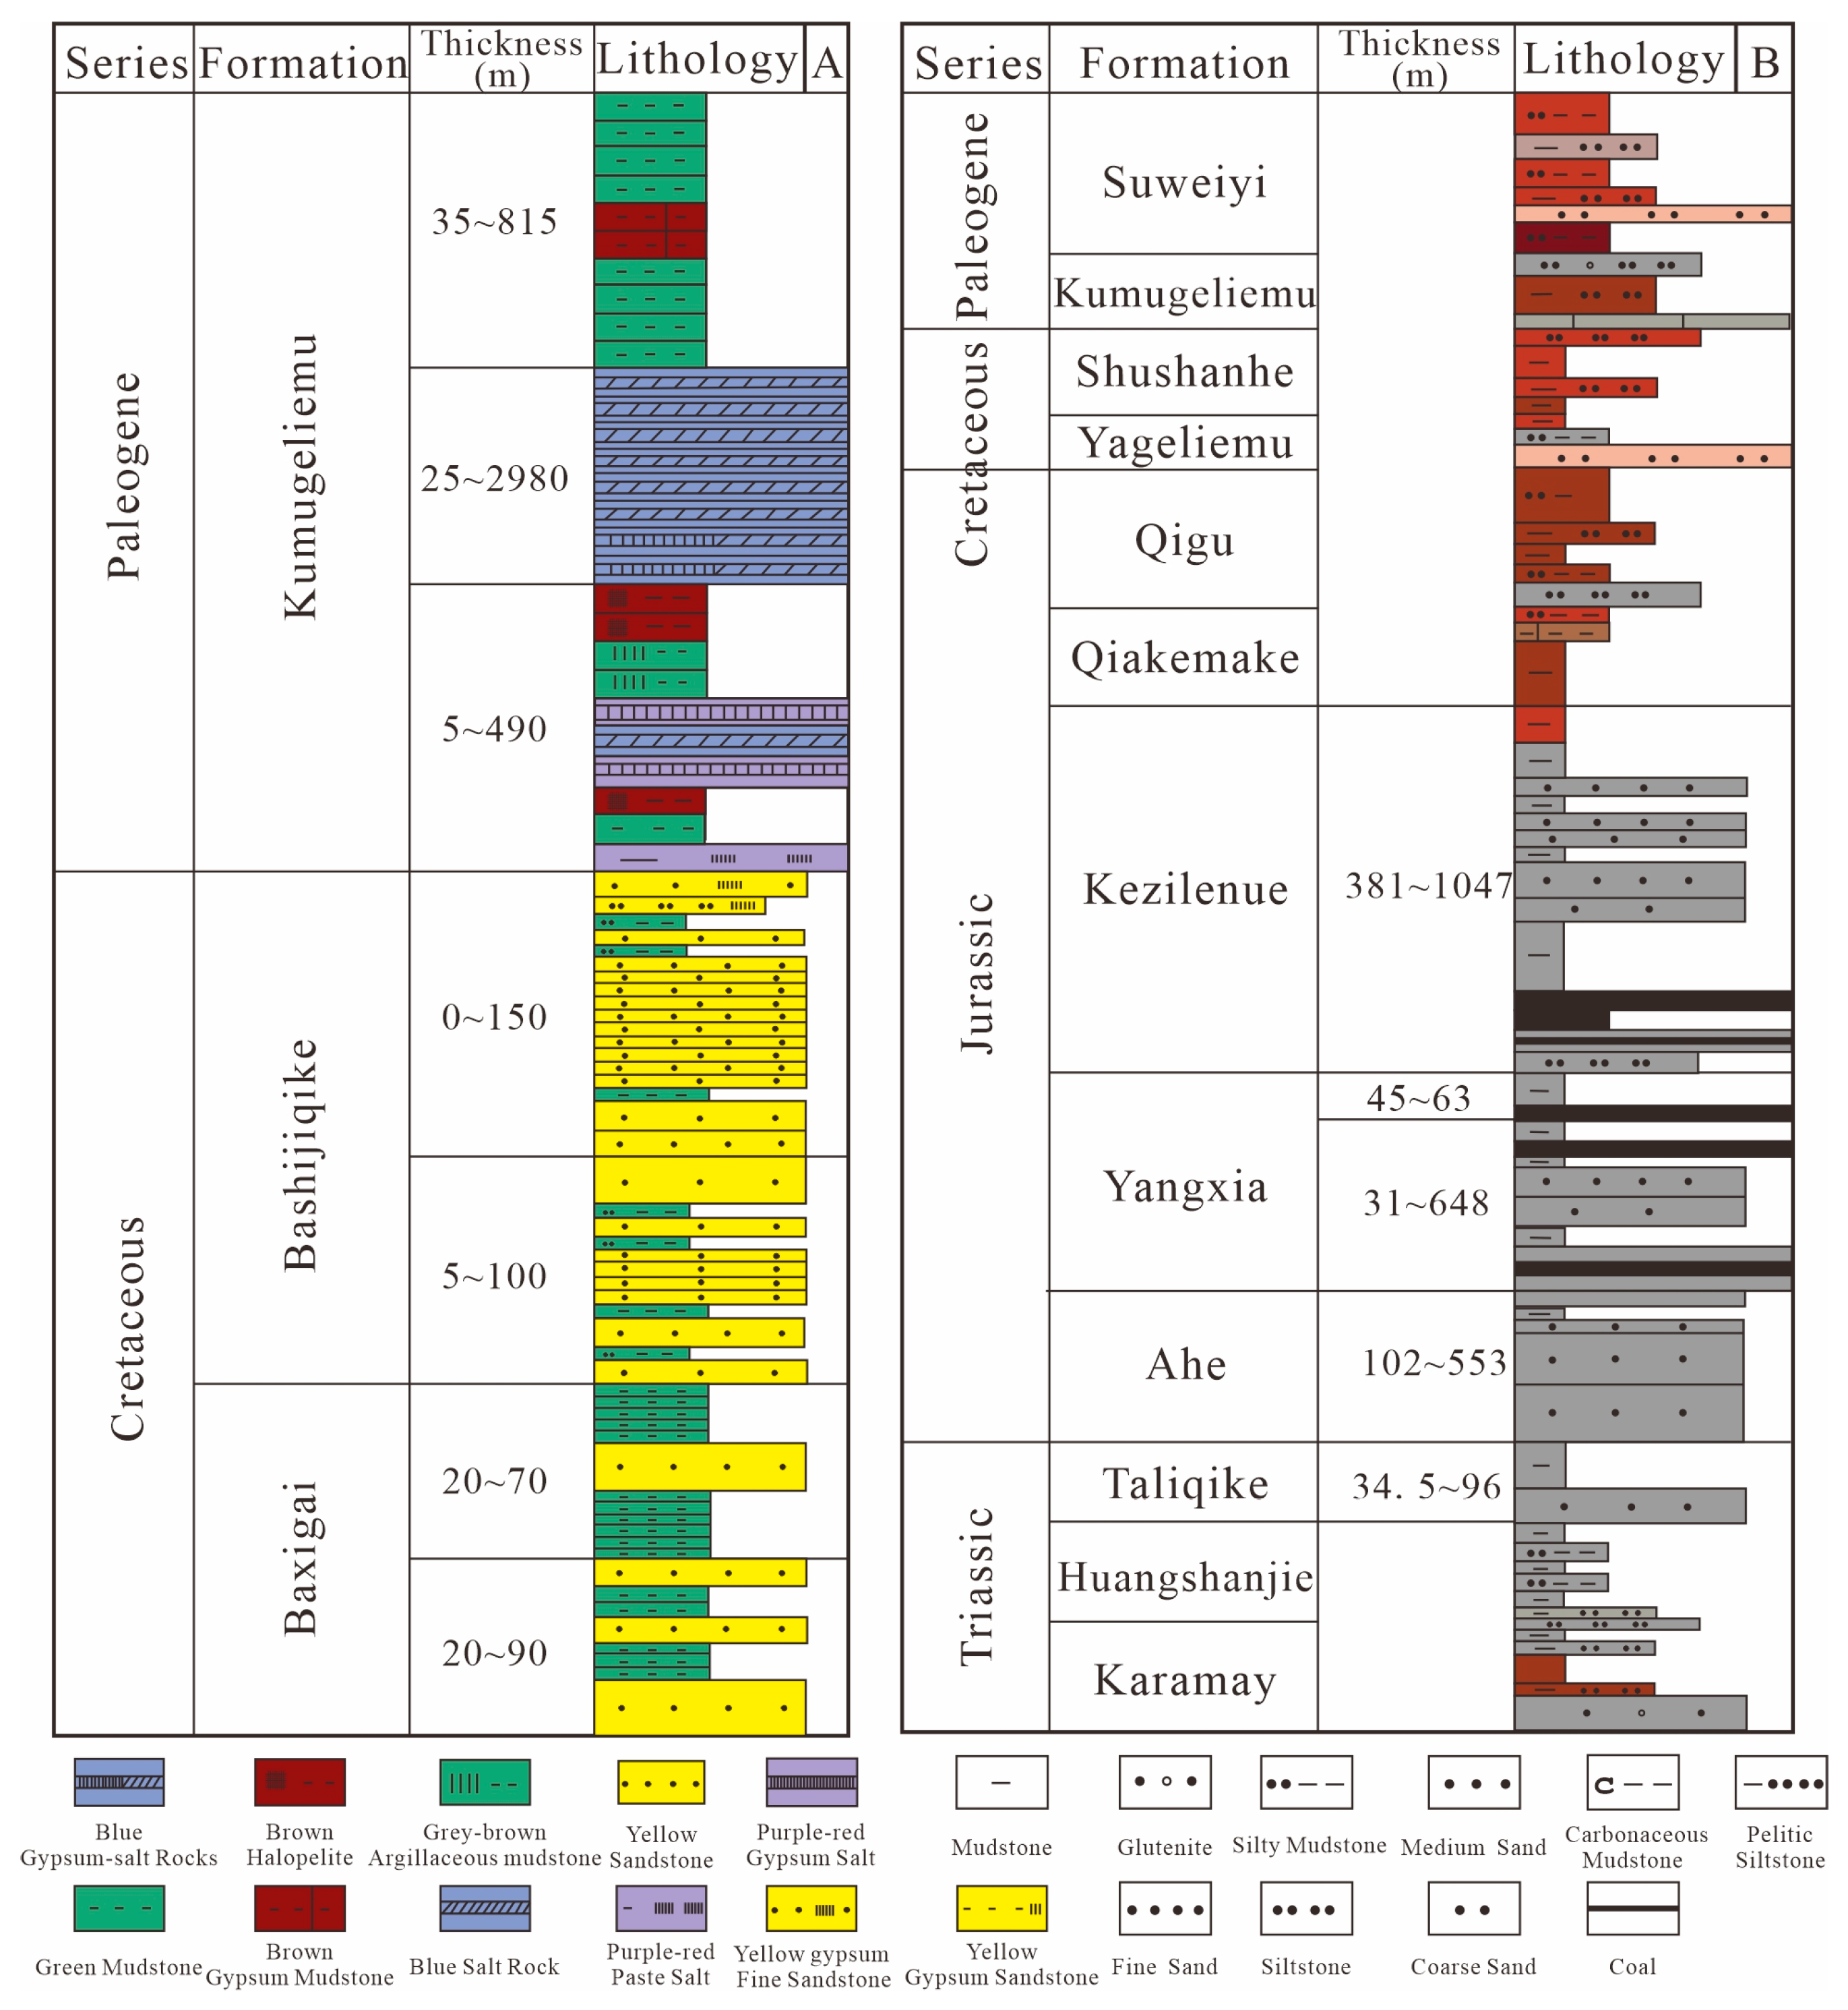
The Yiqikelike Structural Belt is located adjacent to the South Tianshan Mountains in the north, connected to the Qiulitage Structural Belt and Yangxia Sag in the south and bordering the Northern Monocline Belt and Kelasu Thrust Belt in the west. It has an east–west length of about 1.4 × 10⁴ m and a north–south breadth of about 2 × 10⁴ m and is characterized by a single “M-shaped” anticline oriented in the NWW-SEE direction (Figure 1) [6,32]. Influenced by the Yanshan Movement and the Himalayan Orogeny, the Tugeerming backslope was severely damaged, resulting in significantly different stratigraphic deposits [6,32,33]. The strata in the core of the anticline are severely weathered and eroded, exposing metamorphic rocks from the Proterozoic Erathem [33,34]. The strata on both sides of the anticline are well-preserved, with an overall absence of the upper part of the Lower Cretaceous to the Paleocene Kumugelemu Group strata. In contrast, the southern wing strata generally lack the upper Middle Jurassic to Cretaceous strata and in some areas, the Paleogene strata are also missing. The Neogene Jidike Formation to the Quaternary strata are symmetrically distributed on both the north and south wings of the anticline [33,34]. The study areas located in the eastern part of the Tugerming region of the Yiqikelike Structural Belt, with predominantly Meso-Cenozoic stratigraphy, and in the Paleozoic are missing (Figure 2) [6,25,34]. Triassic Huangshanjie Formation (T3h) is dominated by lacustrine dark mudstone; Taliqike Formation (T3t) is coal-bearing source rock and its lithology is dominated by carbonaceous mudstone and black-gray mudstone [35,36]. The overlying Jurassic strata are lacustrine coal bearing strata, of which the Yangxia Formation (J1y) is the coal-bearing source rock, mainly composed of black-gray mudstone, interbedded with coal seams and carbonaceous mudstone. The Kezilenuer Formation (J2kz) is also a coal-bearing source rock, with dark-colored mudstone interbedded with thick coal seams [35,36].
The Kelasu Structural Belt is located in the northern part of the Kuqa Depression, between the Northern Monoclinic Belt and the Baicheng Sag. It is an important structural belt with a near east–west (EW) trend, featuring three large fracture zones from north to south: the Baicheng Fracture Zone, the Keshen Fracture Zone and the Bozi-Kelasu Fracture Zone (Figure 1) [29]. From east to west, it can be divided into five blocks based on the development of traps: Awat, Bozi, Dabei, Keshen and Kela [7,29]. The study area is located in the Dabei block and the main source rocks are the T3h, T3t, J1y, J2kz and Qiakemake Formation (J2q) (Figure 2), of which the T3h and J2q are dominated by lacustrine mudstones and the rest of the strata are coal strata [34,35,36]. The hydrocarbon reservoirs are the Bashijiqike Formation (K1bs) and the Baxigai Formation (K1bx) of the Cretaceous system, with brown medium sandstone and fine sandstone as the main lithologies. The Paleogene Kumugeliemu Formation (E1-2km) gypsum salt layer serves as a regional cap rock and is of great significance for the preservation of oil and gas [7,35,37]. The Northern monoclinic belt is located in the front of the Tianshan orogenic belt and is widely developed with short axis fault anticlines and a nosing structure formed by oblique extrusion. These structures are mainly controlled by the Kebei Fracture and the Tianshan pre-mountainous retrograde fracture. The KT-1 well in the study area is located in the middle of the Northern monoclinic belt and the Kelasu structural belt (Figure 1), with sufficient oil and gas sources.

3. Samples and Methods

Natural gas samples were collected from the eastern part of the Yiqikelike Structural Belt (YSB) in the Kuqa Depression, the Dabei block of the Kelasu Structural Belt (KSB) and the Northern Monoclinic Belt (NMB), with a total of 38 natural gas samples collected. Among these, samples such as D-1, D-12, D-102 and D-11 were located in the Keshen Fracture Zone; D-3, D-302 and D-304 were located in the Baicheng Fracture Zone; T-2, T-201, T-204 and T-3 were located in the Tugeerming Structural Zone and the KT-1 well was located in the Northern Monoclinic Belt. Natural gas composition analysis and the carbon isotope analysis of natural gas monomer compounds were performed on the obtained natural gas samples. For the analysis of mixed-source gas, two low-maturity rock core samples from water-based shallow drilling were selected: Jurassic coal-bearing carbonaceous mudstone and Triassic lacustrine mudstone from the MQ1 well.
The gas composition test was conducted using an Agilent 7890A Gas Chromatograph (GC) equipped with a Flame Ionization Detector (FID) and a thermal conductivity detector (TCD) (Agilent Technologies, Santa Clara, CA, USA). The chromatographic column utilized was a Plot Al2O3 50 m × 0.53 mm × 0.25 μm. The initial temperature was 30 °C, held for 10 min and then heated to 180 °C at a rate of 10 °C/min, held for 20 min.
The carbon isotope composition test was conducted using an Agilent 6890 Gas Chromatograph (GC) (Agilent Technologies, Santa Clara, CA, USA) coupled with a MAT 253 PLUS isotope Mass Spectrometer (MS) (Thermo Fisher Scientific Inc., Bremen, Germany) and the analysis was performed according to the national standard GB/T18340.2-2010 [38]. The test error was ±0.1‰ (VPDB). Helium was used as the carrier gas, with a flow rate of 3 mL/min and a split ratio of 10:1. The hydrocarbon gas was burned and converted into CO2, which was then introduced into the mass spectrometer. The chromatographic column was a fused silica capillary column (Plot 30 m × 0.32 mm × 0.25 μm). The initial temperature was 40 °C, followed by heating at a rate of 8 °C/min to 80 °C, then at a rate of 5 °C/min to 260 °C and maintained at this temperature for 10 min.
Thermal modeling experiments of coal-bearing source rock and lacustrine source rock were performed at the Guangzhou Institute of Geochemistry, Chinese Academy of Sciences. The experimental process and related procedures and instruments are summarized below [39].

4. Results

4.1. Composition and Distribution Characteristics of Natural Gas Components

The composition of natural gas components is presented in Table 1, comprising both hydrocarbon and non-hydrocarbon gases. The natural gas composition in the Kuqa Depression primarily consists of hydrocarbon gases, with CH4 being the main component, ranging from 65.28% to 98.06% and averaging 88.34%. The C2H6 content ranges from 0.32% to 14.10%, with an average of 2.98%, while the C3H8 content varies from 0.012% to 6.00%, with an average of 0.87%. Non-hydrocarbon gases are mainly N2 and CO2, with N2 content ranging from 0.02% to 28.10% and averaging 5.50%, and CO2 content ranging from 0.005% to 22.31%, with an average of 1.62%.
There are some differences in the gas components within different tectonic zones of the Kuqa Depression. The Dabei area and KT-1 well are characterized by dry gas with a dryness coefficient greater than 95. The average dryness coefficient of the Dabei area is 98.1 and for the KT-1 well, it is 99.3. In contrast, the average dryness coefficient in the Tudong area is 87, indicating wet gas.
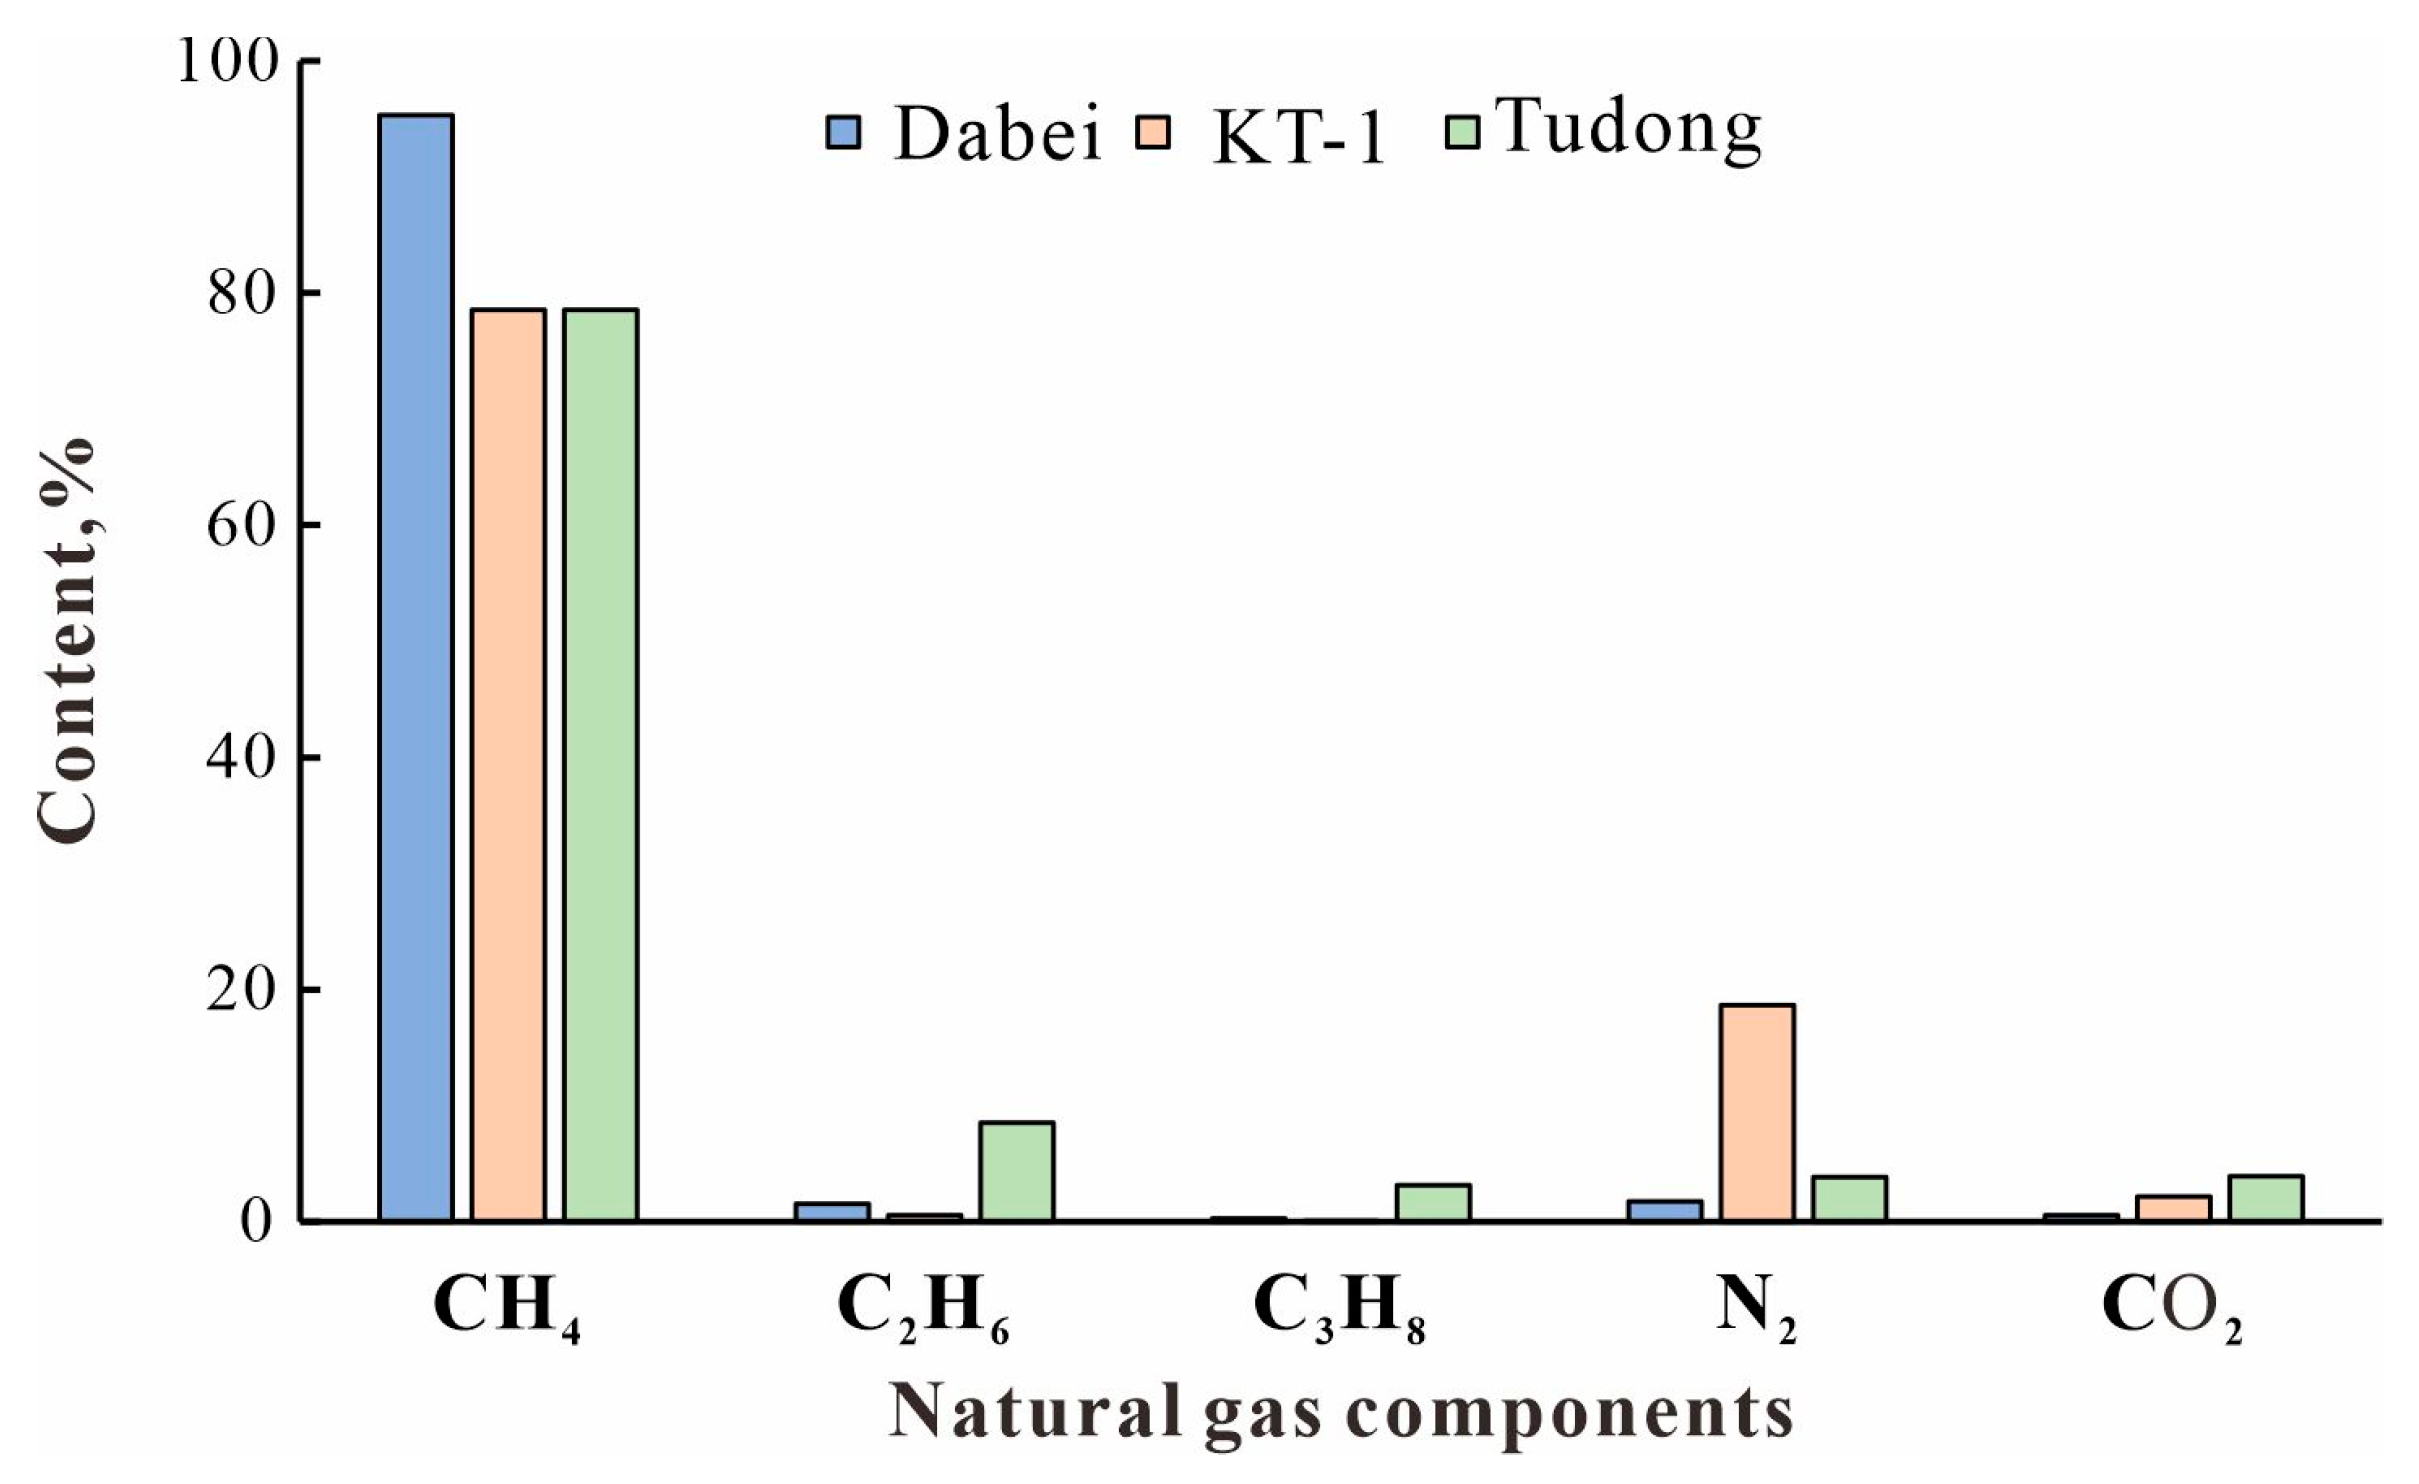
The hydrocarbon gas content of natural gas in the Dabei area is the highest, with an average CH4 content of 95.36%, an average ethane content of 1.54% and average N2 and CO2 contents of 1.74% and 0.56%, respectively (Figure 3). The hydrocarbon gas content of natural gas in the Tudong area follows, with average contents of 78.50% for CH4, 8.52% for C2H6, 3.81% for N2 and 3.89% for CO2. The non-hydrocarbon gas content in the KT-1 well is relatively high compared to the Dabei and Tudong areas, with average contents of 18.66% for N2, 2.12% for CO2 and 78.58% for CH4, while C2H6’s is 0.55%.
Table 1. Distribution characteristics of natural gas components in different fracture zones of Kuqa Depression.
WellDepth/mFormationGas Components/%Drying CoefficientData
CH4C2H6C3H8iC4H10nC4H10N2CO2
D-303856.5–3878K1bs94.012.090.470.090.172.500.0197.1This study
D-154069–4330K1bs + K1bx93.682.240.500.090.152.800.0196.9
D-94802–4900K1bs93.801.210.180.040.043.560.1798.5
D-135132–5261K1bs97.970.880.090.020.020.730.2599.0
D-1025315–5479K1bs94.602.010.400.090.011.810.4397.3
D-125461–6038K1bs + K1bx96.600.830.070.010.021.930.2299.0
D-125524–5620K1bs98.060.810.070.010.020.800.2099.1
D-165543–5727K1bs + K1bx97.601.200.210.040.070.530.2598.5
D-125650.5–5916K1bs + K1bx 96.600.820.070.010.021.880.2199.0
D-165681–5727K1bs94.000.960.170.030.060.414.3198.7
D-2025711–5845K1bs93.901.550.320.070.072.750.5297.9
D-125716–5833K1bs97.501.080.110.020.031.010.2598.7
D-125740–5800K1bx95.680.770.070.010.012.420.5299.1
D-115751–6008K1bs90.852.780.460.080.084.100.1996.4
D-2085755–5830/96.231.720.290.060.070.860.52397.8
D-115788–5823K1bs94.413.210.590.110.131.030.2195.9
D-2045917–6038/93.991.740.290.060.072.610.4697.8
D-2015932.45–6145/94.921.850.310.070.071.660.6597.6
D-3016754–7005K1bs95.773.080.530.10.100.120.2096.2
D-76758.35–6856K1bs97.820.790.060.010.010.540.7399.1
D-3046873–6991K1bs95.941.110.120.020.021.440.9898.7
D-3066939–7051.5K1bs96.811.190.130.030.031.100.5198.6
D-37154.5–7278K1bs96.101.200.200.040.041.570.5098.5
D-3027209–7244K1bs94.181.260.120.020.012.580.7898.5
D-48022–8265K1bs92.912.190.350.080.072.730.8597.2
KT-16168/55.91 0.32 0.01 //40.193.2499.4
KT-16183.86/89.55 0.77 0.03 //8.211.4199.1
KT-16184.78/94.00 0.70 0.03 //1.873.2899.2
KT-16209.81/62.49 0.33 0.02 //32.714.3599.4
KT-16249.62/67.84 0.37 0.02 //28.103.5799.4
KT-16289.4/55.72 0.27 0.02 //41.362.5699.5
KT-16289.6/76.04 0.36 0.02 //21.941.6099.5
KT-16300/70.01 0.32 0.01 //27.502.0199.5
T-2/J2kz83.496.112.33//2.510.9190.8[32]
T-2/J2kz75.5614.105.30//2.441.5079.6
T-2/J1y86.907.651.83//0.022.3490.2
T-24171–4175J1a80.0012.006.00//1.001.0091.6
T-2013475–3486J2kz80.0012.104.50//01.2082.8
T-2014150–4185J1y65.304.041.110.200.245.0622.3192.1This study
T-2014647–4693J1a64.284.001.070.200.3025.661.7092.1
T-2042935–4146.5J1y + J2kz84.937.472.570.560.640.332.7188.3
T-33350–3360J1y80.659.873.730.800.790.772.7684.2
T-3023360–3392J1y84.787.842.6850.570.630.312.5187.8

4.2. Distribution Characteristics of Carbon Isotopes in Natural Gas

The carbon isotope composition data of natural gas from different gas reservoirs in the Kuqa Depression are presented in Table 2. The δ13C1 of natural gas in the Kuqa Depression ranges from −37.80‰ to −25.24‰, with an average content of −27.70‰. δ13C2 ranges from −27.70‰ to −15.33‰, with an average content of −20.43‰. δ13C3 ranges from −25.50‰ to −18.90‰, with an average content of −21.75‰. The carbon isotope of CO2 ranges from −22.49‰ to −4.69‰, with an average content of −17.18‰.
Significant variations exist in natural gas carbon isotopes among different structural zones in the Kuqa Depression (Figure 4). The natural gas in the Tudong area exhibits relatively lighter isotopic values. The δ13C1 ranging from −37.80‰ to −31.84‰, with an average content of −34.38‰; δ13C2 ranges from −27.70‰ to −23.33‰, with an average content of −25.63‰; δ13C3 ranges from −25.50‰ to −21.99‰, with an average content of −23.85‰, and the average content of CO2 carbon isotopes is −10.65‰. Alkane natural gas in the Dabei region shows intermediate isotopic values. The δ13C1 ranges from −33.10‰ to −25.70‰, with an average content of −29.29‰; δ13C2 ranges from −22.6‰ to −18.90‰, with an average content of −20.76‰; δ13C3 ranges from −24.9‰ to −18.90‰, with an average content of −20.69‰, and the average content of CO2 carbon isotopes is −16.60‰.
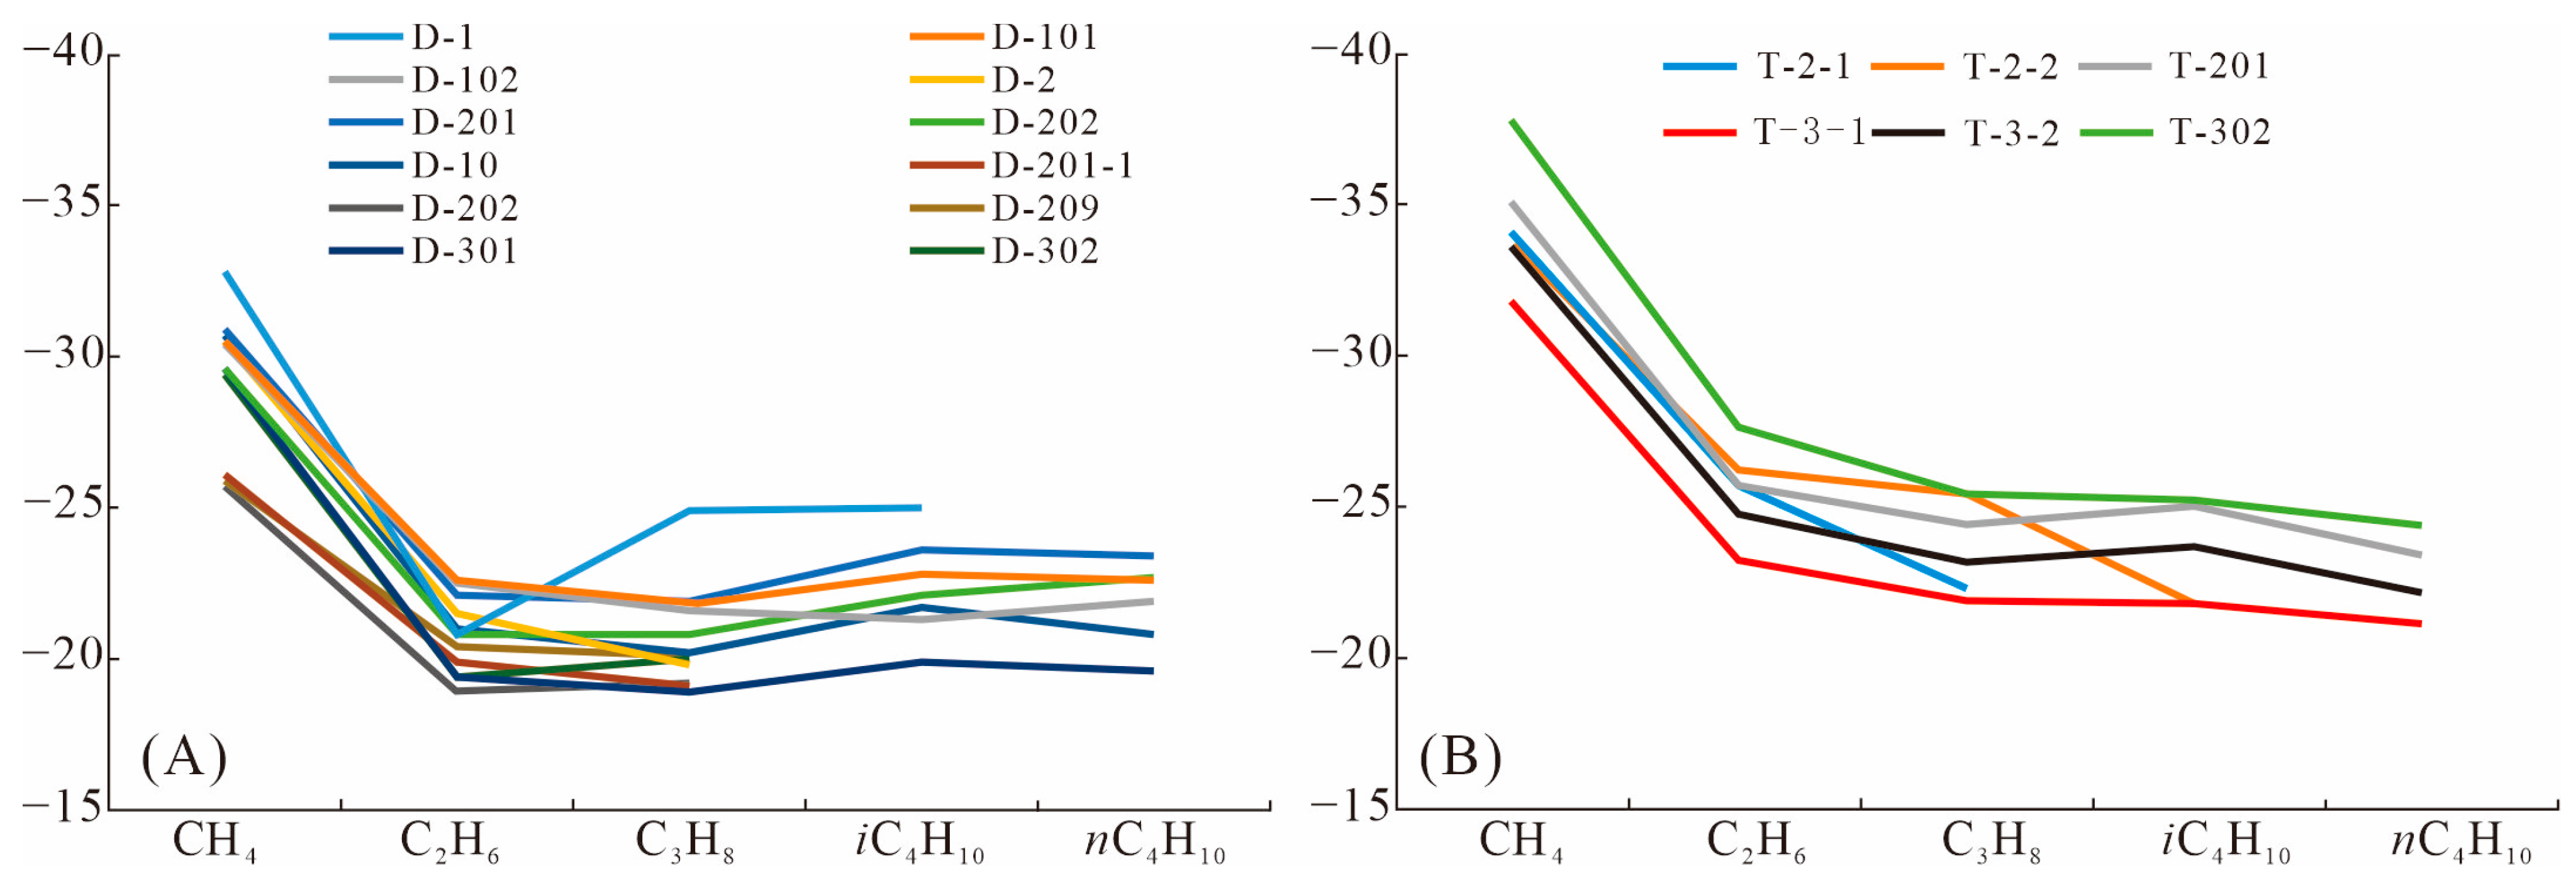
Natural gas from the KT−1 well exhibits relatively heavier carbon isotope. The δ13C1 ranges from −29.31‰ to −25.24‰, with an average content of −26.99‰; δ13C2 ranges from −16.55‰ to −15.33‰, with an average content of −15.91‰. The average content of CO2 carbon isotopes is −20.14‰. The natural gas carbon isotopes in the Dabei and Tudong areas of the Kuqa Depression, as well as in the KT−1 well, exhibit a clear positive trend in carbon isotope compositions (δ13C1 < δ13C2 < δ13C3 < δ13C4). In some wells in the Dabei area, the carbon isotope compositions have been locally inverted (Figure 5).
Table 2. Characteristics of carbon isotope distribution of natural gas in different fracture zones of Kuqa Depression.
WellDepth/mFormationCarbon Isotope of Gas Components/‰Data
CO2CH4C2H6C3H8iC4H10nC4H10
D-15552–5586E + K1bs/−33.10−21.40///This study
D-15584.5–5586K1bs/−32.80−20.90−24.90−25.00/
D-1015725–5783K−18.30−30.50−22.60−21.80−22.80−22.60
D-1025425–5479K−12.50−30.40−22.50−21.60−21.30−21.90
D-1045922–5949K−21.80−27.10−21.40///
D-1045981–5985K−18.60−26.70−19.20///
D-25658–5669.5K1bs−9.60−30.80−21.50−19.80//
D-2015932.45–6112.50K1bs−19.00−30.90−22.10−21.90−23.60−23.40
D-2025711–5845K1bs−16.40−29.70−20.80−20.80−22.10−22.70
D-105228–5320K1bs/−30.70−21.00−20.20−21.70−20.80
D-205876–5976K1bs/−26.10−19.90−19.10//
D-2015941–5973K1bs/−25.70−18.90−19.20//
D-2095776–5878K1bs/−25.90−20.40−20.10//
D-3016930–7012K1bs/−29.60−19.40−18.90−19.90−19.60
D-3027209–7244K1bs/−29.40−19.40−20.00//
T-24122–4220J2q/−34.12−25.79−22.40//[32]
T-24171–4175J2q/−33.80−26.30−25.50−21.91−21.24
T-2013475–3486J2kz/−35.10−25.80−24.50−25.10−23.50
T-33457–3472J1y−4.69−31.84−23.33−21.99−21.91−21.24This study
T-33350–3360J1y−14.43−33.63−24.84−23.27−23.78−22.26
T-3023119J2kz−12.83−37.80−27.70−25.45−25.298−24.47
KT-16168.6T−16.95−28.27−15.78///
KT-16183.9T−19.43−26.74−15.33///
KT-16184.8T−21.80−27.08−15.71///
KT-16209.8T−19.10−29.31−16.13///
KT-16249.6T−22.49−25.24−15.78///
KT-16289.4T−21.09−25.76−15.96///
KT-16289.6T−22.37−25.86−16.00///
KT-16300.0T−17.92−27.65−16.55///

5. Discussions

5.1. Comprehensive Identification of Natural Gas Genesis Types

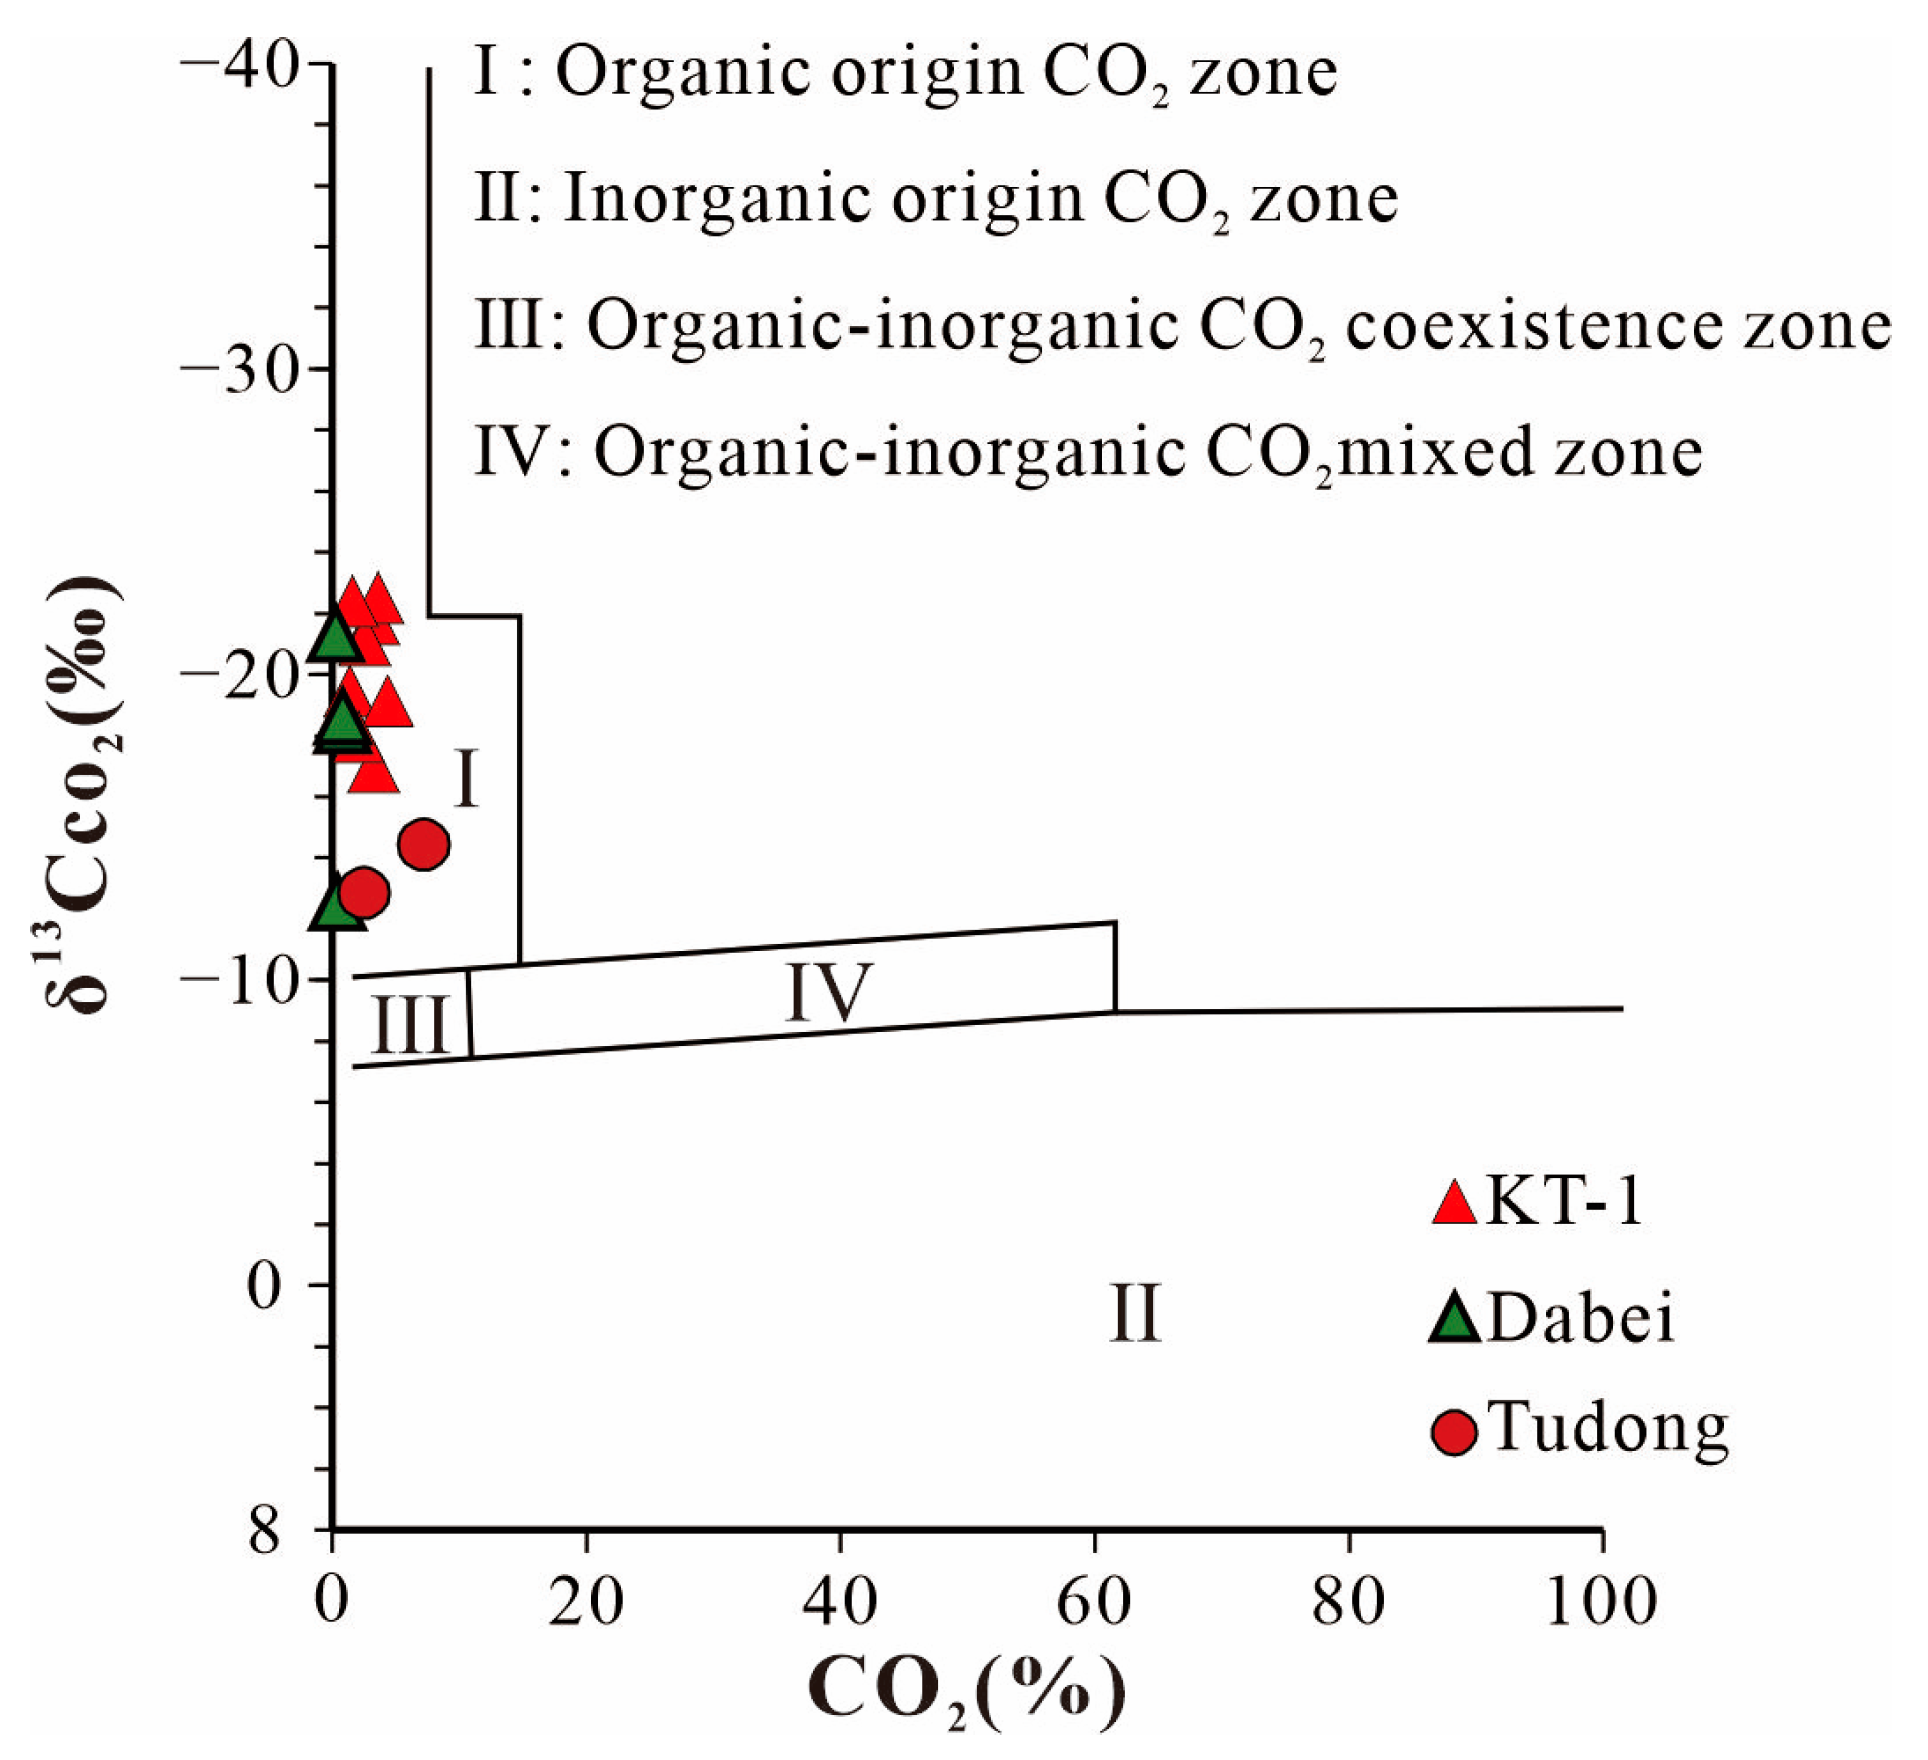
Carbon dioxide (CO2) is the main component of non-hydrocarbon gases in natural gas in the Kuqa Depression. The CO2 content and carbon isotope indices are widely used to distinguish between CO2 of organic and inorganic origin [40,41,42]. Both domestic and international scholars have conducted extensive research on the content and carbon isotope distribution characteristics of CO2 from different origins. Dai Jinxing et al. (1995) established a CO2 genesis identification map based on the carbon isotopes and their corresponding fractions of CO2 from 207 genesis sites in China, as well as from more than 100 countries. It is suggested that CO2 with carbon isotope values below −10‰ and corresponding components below 20% is organic in origin [40,41,42,43]. By analyzing the CO2 components and corresponding carbon isotope values in the natural gas from the KT-1 well, and the Dabei and Tudong well areas in the Kuqa Depression, it is evident that the CO2 in these regions is of organic origin (Figure 6).
The genesis of natural gas is complex and diverse and the carbon isotope composition and gas component ratios serve as the foundation for identifying the gas source. Therefore, it is typically combined with the geological background of the basin, gas components and carbon isotope compositions to comprehensively determine the genesis of the natural gas [44,45]. Previous research indicates that natural gas is classified into organic (biogenic) and inorganic (abiogenic) gas and the geological and geochemical characteristics of the two types differ significantly [44,46,47]. The primary criterion for distinguishing between them is the carbon isotope composition sequence, specifically the positive sequence (δ13C1 < δ13C2 < δ13C3 < δ13C4) and the negative sequence (δ13C1 > δ13C2 > δ13C3 > δ13C4). It is widely accepted that a positive carbon isotope sequence is an important criterion for identifying organic hydrocarbon gases. Currently, the vast majority of commercially developed natural gas in China exhibits a positive carbon isotope sequence, indicating they are organic hydrocarbon gases. In the past, negative carbon isotope sequences were traditionally considered an important indicator of inorganic hydrocarbon gases. However, recent research has revealed that in areas where sedimentary basin source rocks are over-mature, some natural gases with a positive carbon isotope sequence may also exhibit negative carbon isotope characteristics after modification, such as shale gas from the Longmaxi Formation in the southern Ordos Basin and the southern Sichuan Basin in China [44,46,47,48,49]. The carbon isotope sequences of natural gas in the Tudong and Dabei areas of the Kuqa Depression generally exhibit positive sequence characteristics, although some sequences are locally inverted (Figure 5), such as in the D-1 and D-201 wells. These indicate that the natural gas in these areas is of organic origin and suggests that some of the natural gas in the Dabei area is a mixture of gases.
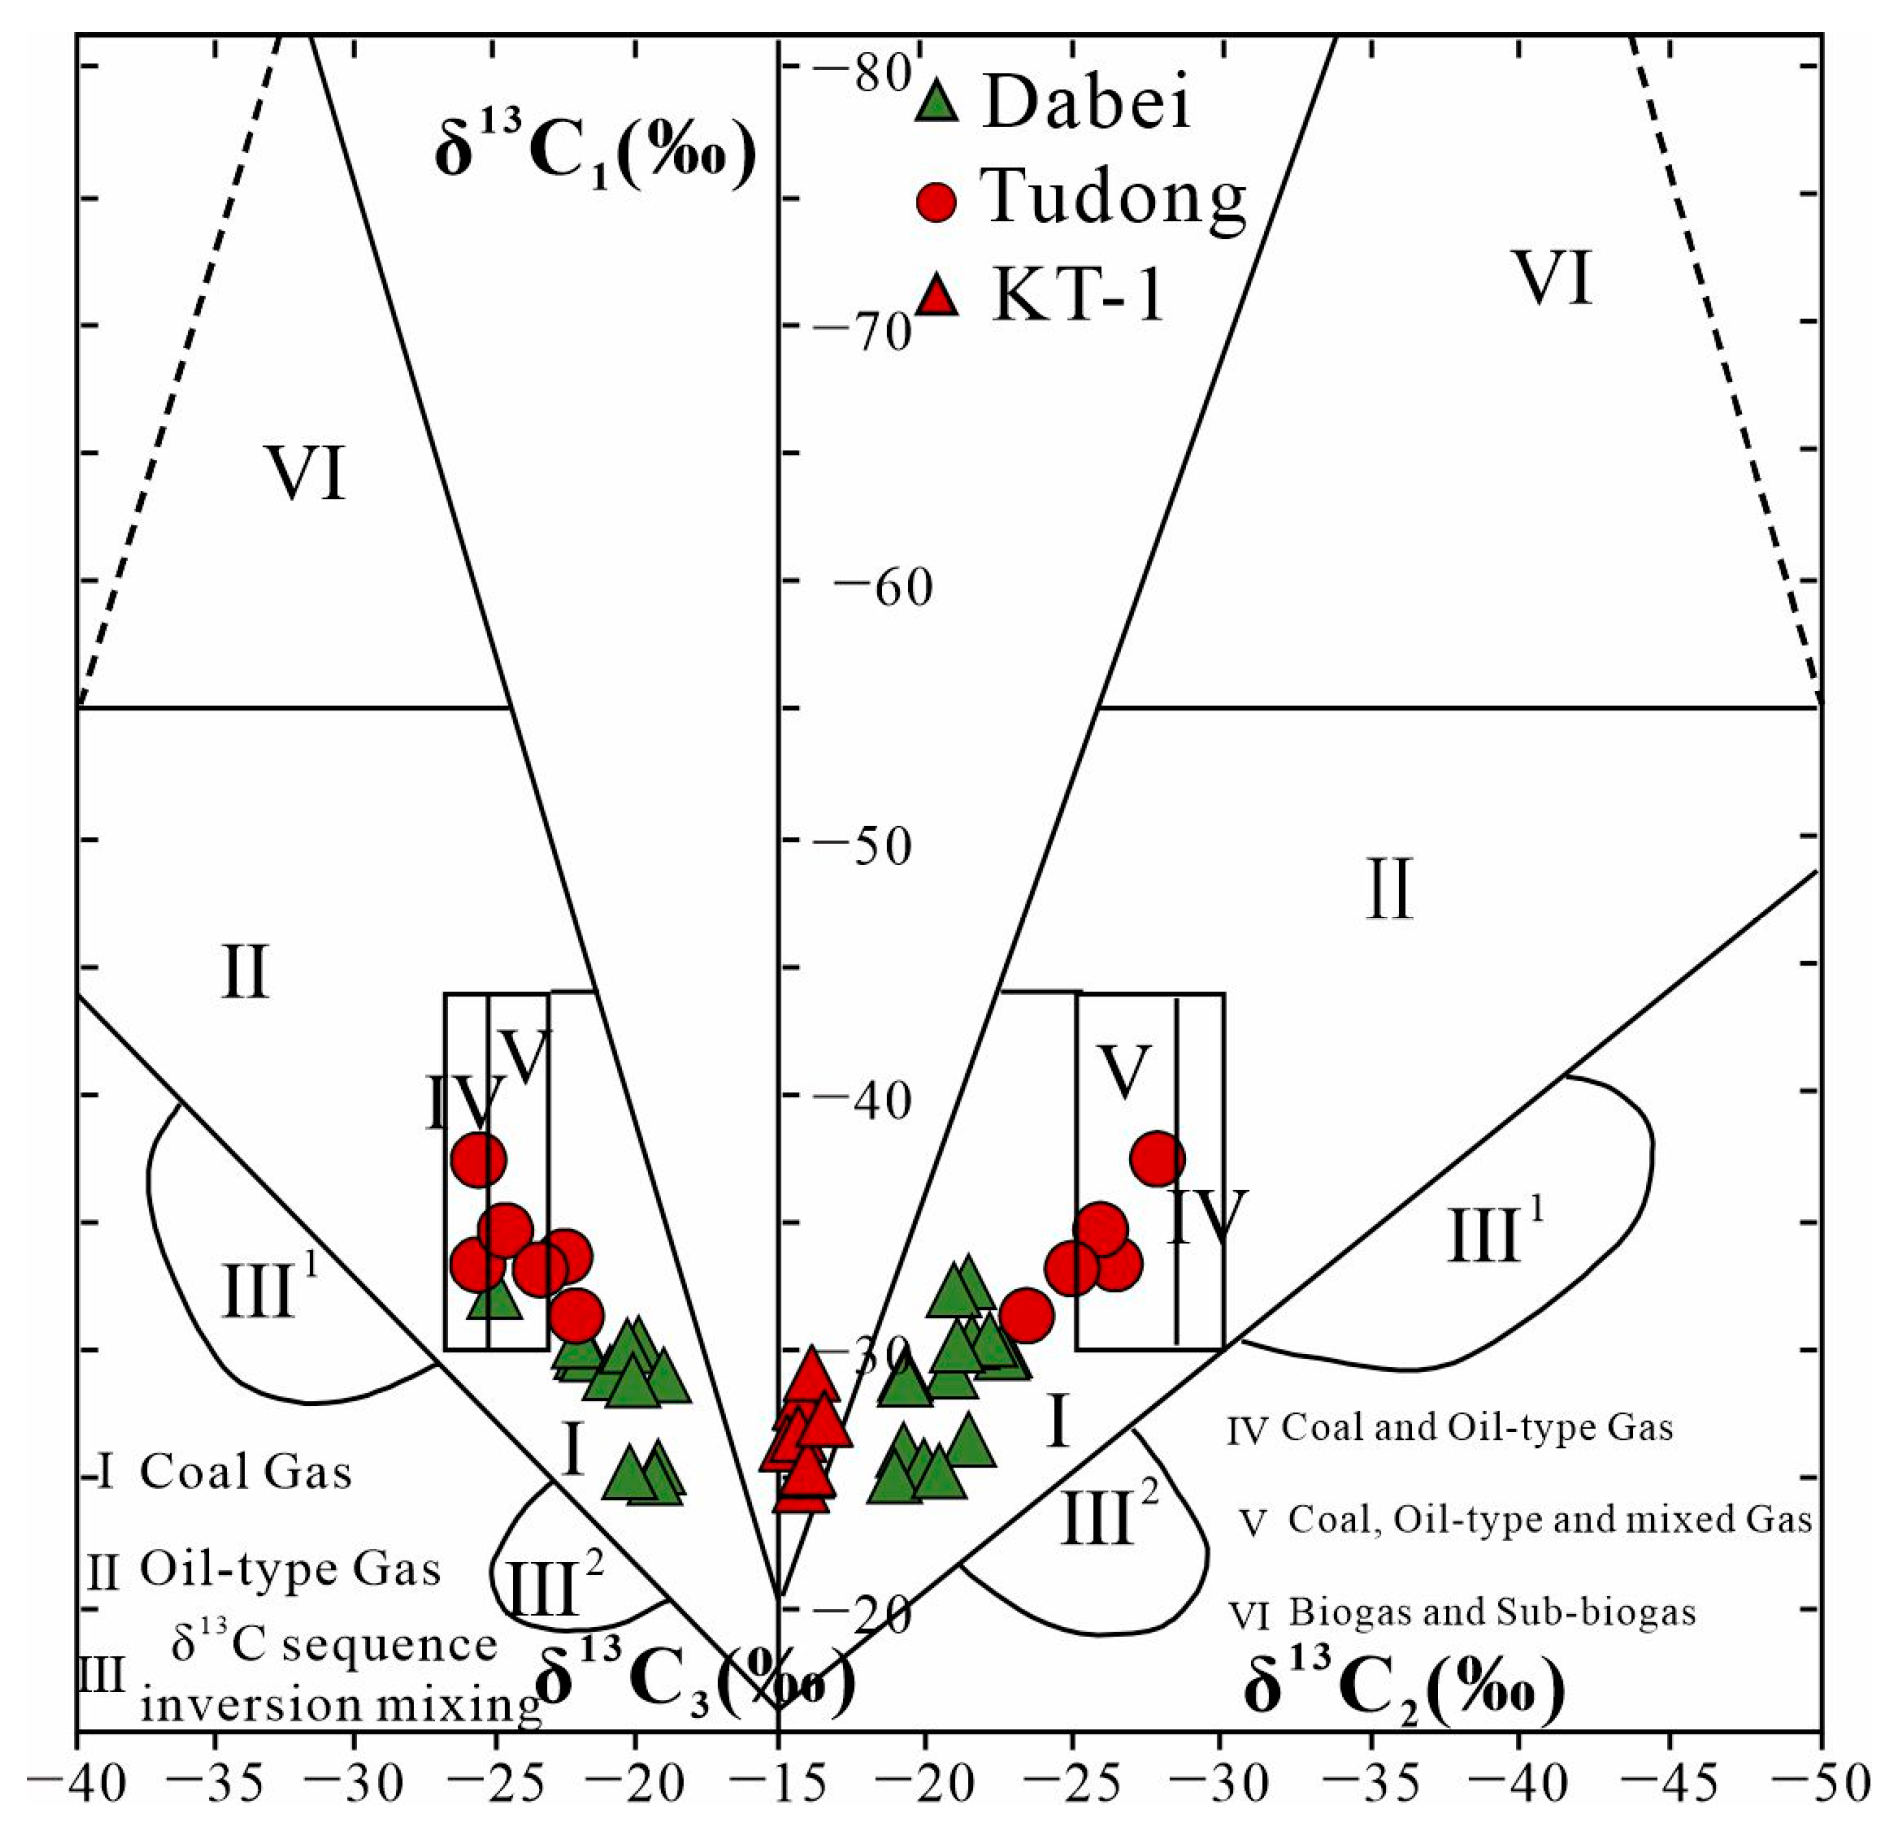
Organic gas generally includes coal type gas, oil type gas, or a mixture of oil type gas and coal type gas [44,45,46,47,48,49]. The carbon isotope composition of natural gas is of great significance for studying the maturity and genesis of natural gas, with the carbon isotope values of δ13C1, δ13C2 and δ13C3 being the most frequently utilized indicators. Dai et al. synthesized the carbon isotope series data for hydrocarbon gases of different origins from more than one thousand domestic and international sources and created a comprehensive judgment atlas of δ13C113C213C3 organic hydrocarbon gas [50,51,52]. Compared with this atlas (Figure 7), t the natural gas in the KT-1 well of the Kuqa Depression is primarily located in Zone III2, representing an inverted carbon isotope series mixed gas zone. The natural gas in the Tudong well zone is predominantly found in Zones I, IV and V, indicating that the natural gas in the Tudong area is mainly coal-type gas, with some mixing of oil-type gas. The natural gas in the Dabei area is predominantly located in Zones I and IV, indicating that it is primarily coal-type gas.
δ13C1 and δ13C2 are of great significance for recognizing humic gas, humic mud gas and biogas, as well as deep-shallow mixed gas [51,52,53]. Combined with the δ13C113C2 organic genesis alkane gas judgment plate, it is evident that the natural gas in the Tudong and Dabei areas is humic gas, with relatively heavy δ13C1 and δ13C2 in the Dabei area. The natural gas in the KT-1 well is a late-stage shallow mixed gas (Figure 8).
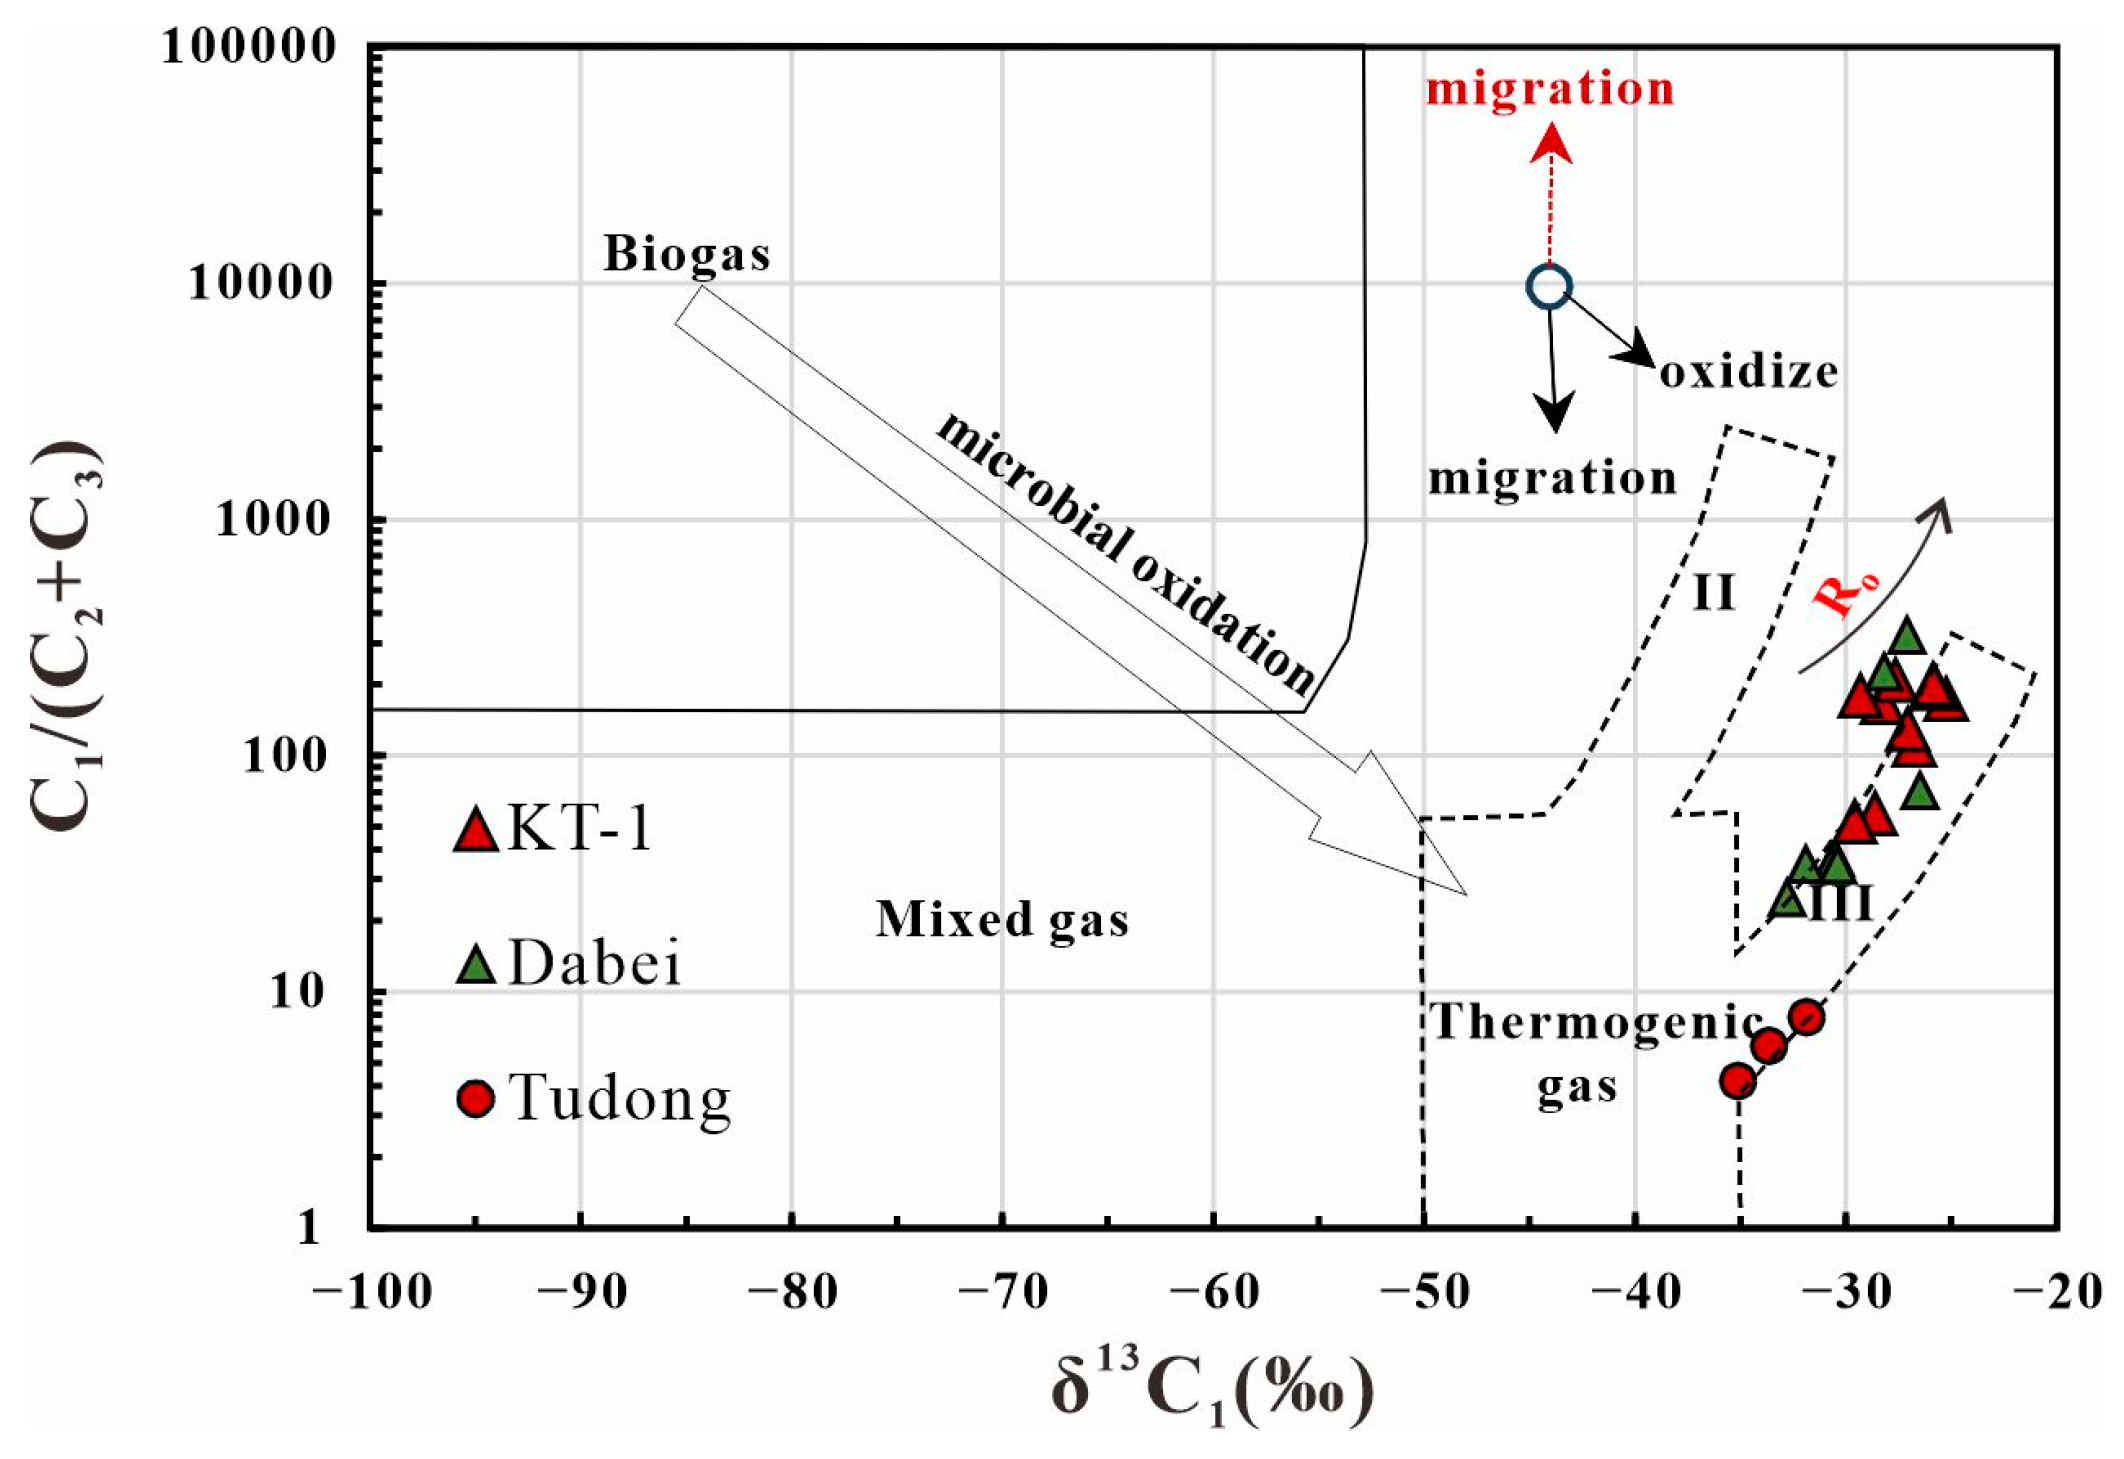
The composition of natural gas and their corresponding carbon isotopes are often used to distinguish different types of natural gas genesis. The “Bernard” plate is one of the most frequently utilized plates for identifying natural gas genesis by both domestic and international scholars, and it is also of great significance for distinguishing processes such as migration, mixing and biological oxidation [44,54,55]. Previous studies have suggested that δ13C1 less than −55‰ indicate biogenic gas, while a δ13C1 greater than −55‰ indicates thermogenic gas. According to the “Bernard” plate, the natural gas in the KT-1 well, Tudong and Dabei areas of the Kuqa Depression are all thermogenic gas, derived from kerogen type III. Additionally, the maturity of natural gas in the Tudong area is lower than that in the KT-1 well and Dabei areas. It can also be observed from the graph that there may be dry gas migration and mixing in the natural gas from the Dabei area and KT-1 well, which results in higher methane content (Figure 9).
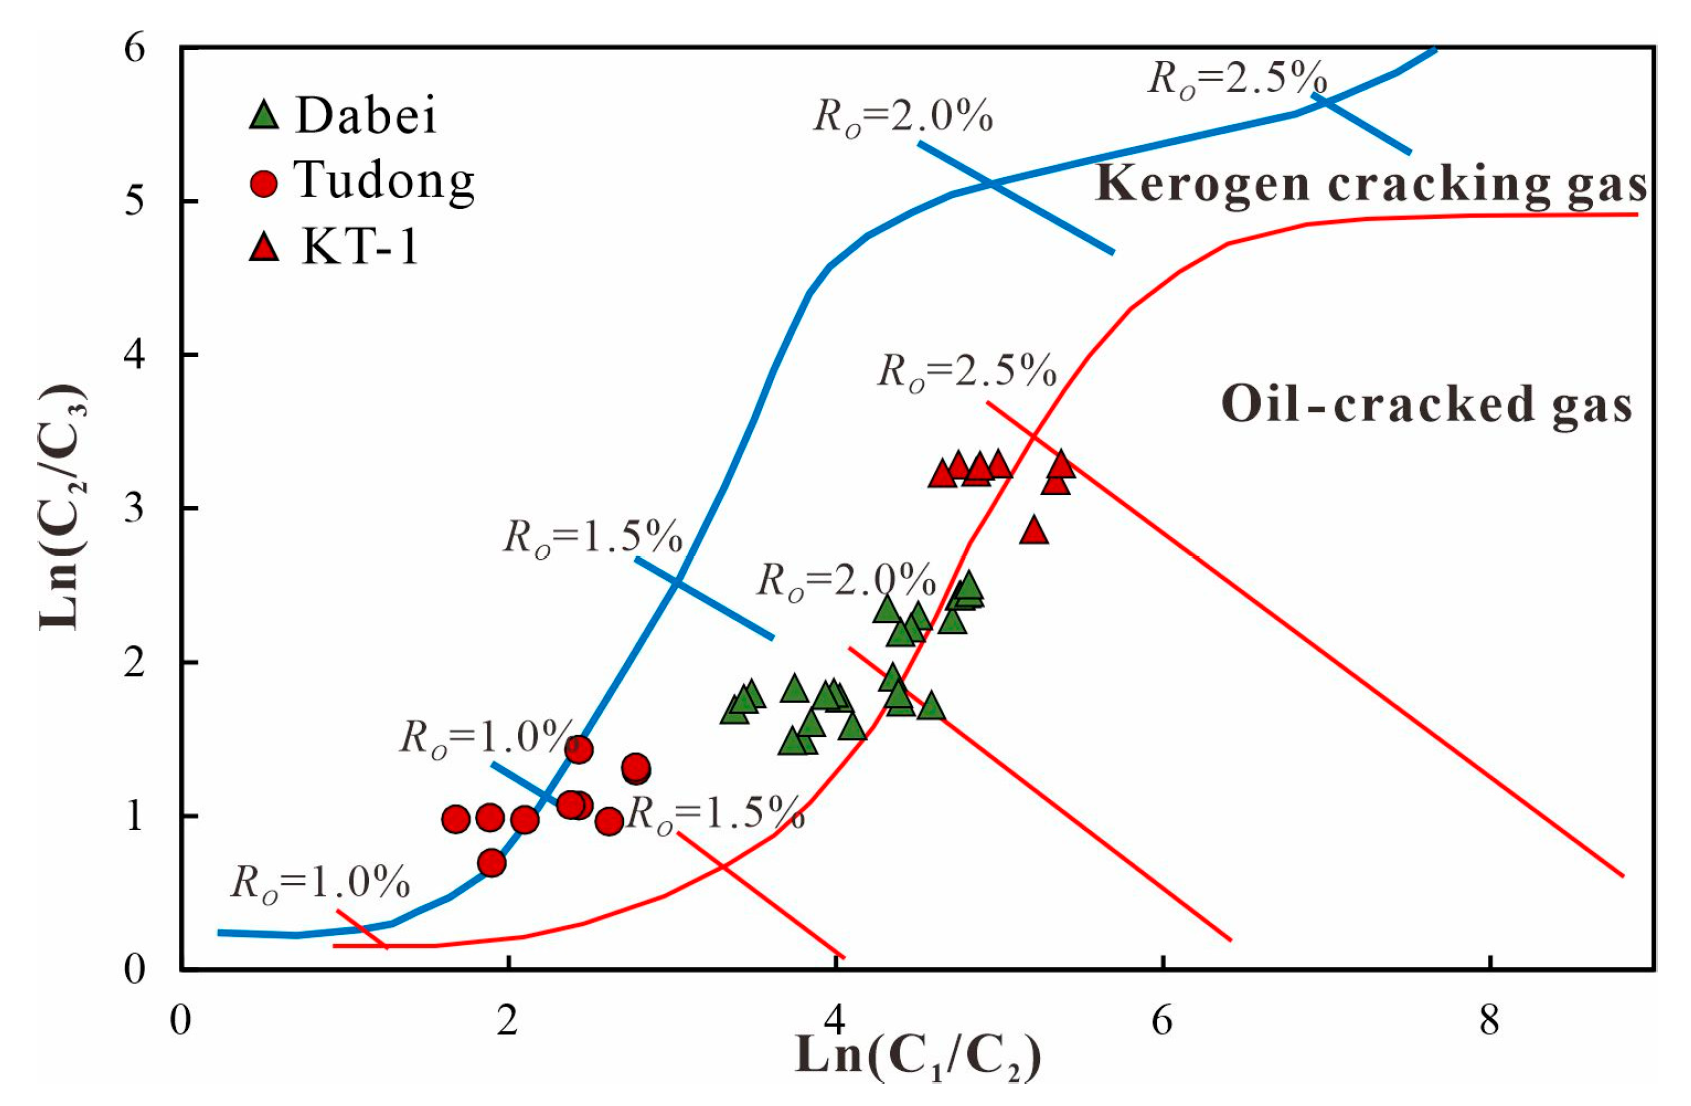
Prinzhofer et al. (1995) identified significant compositional differences between oil-cracking gas and kerogen-cracking gas through thermal simulation experiments [56,57,58] and they proposed the use of Ln (C1/C2) vs. Ln (C2/C3) and (δ13C213C3) vs. Ln (C2/C3) diagrams to distinguish between the two types of gases. Based on the Ln (C1/C2) vs. Ln (C2/C3) plate, the natural gas maturity in the Tudong area is relatively low, with Ro ranging from 1.3% to 1.6%, indicating a high-maturity evolution stage. The natural gas is caused by kerogen cracking. The maturity of natural gas in the Dabei area is relatively high, with Ro ranging from 1.6% to 2.3%, in the high to over-maturity evolution stage and is mostly kerogen-cracking gas, although some wells also contain oil-cracking gas. The natural gas maturity of the KT-1 well is the highest, with Ro ranging from 2.3% to 2.5%, indicating the over-mature stage, and is mainly composed of oil-cracking gas (Figure 10).
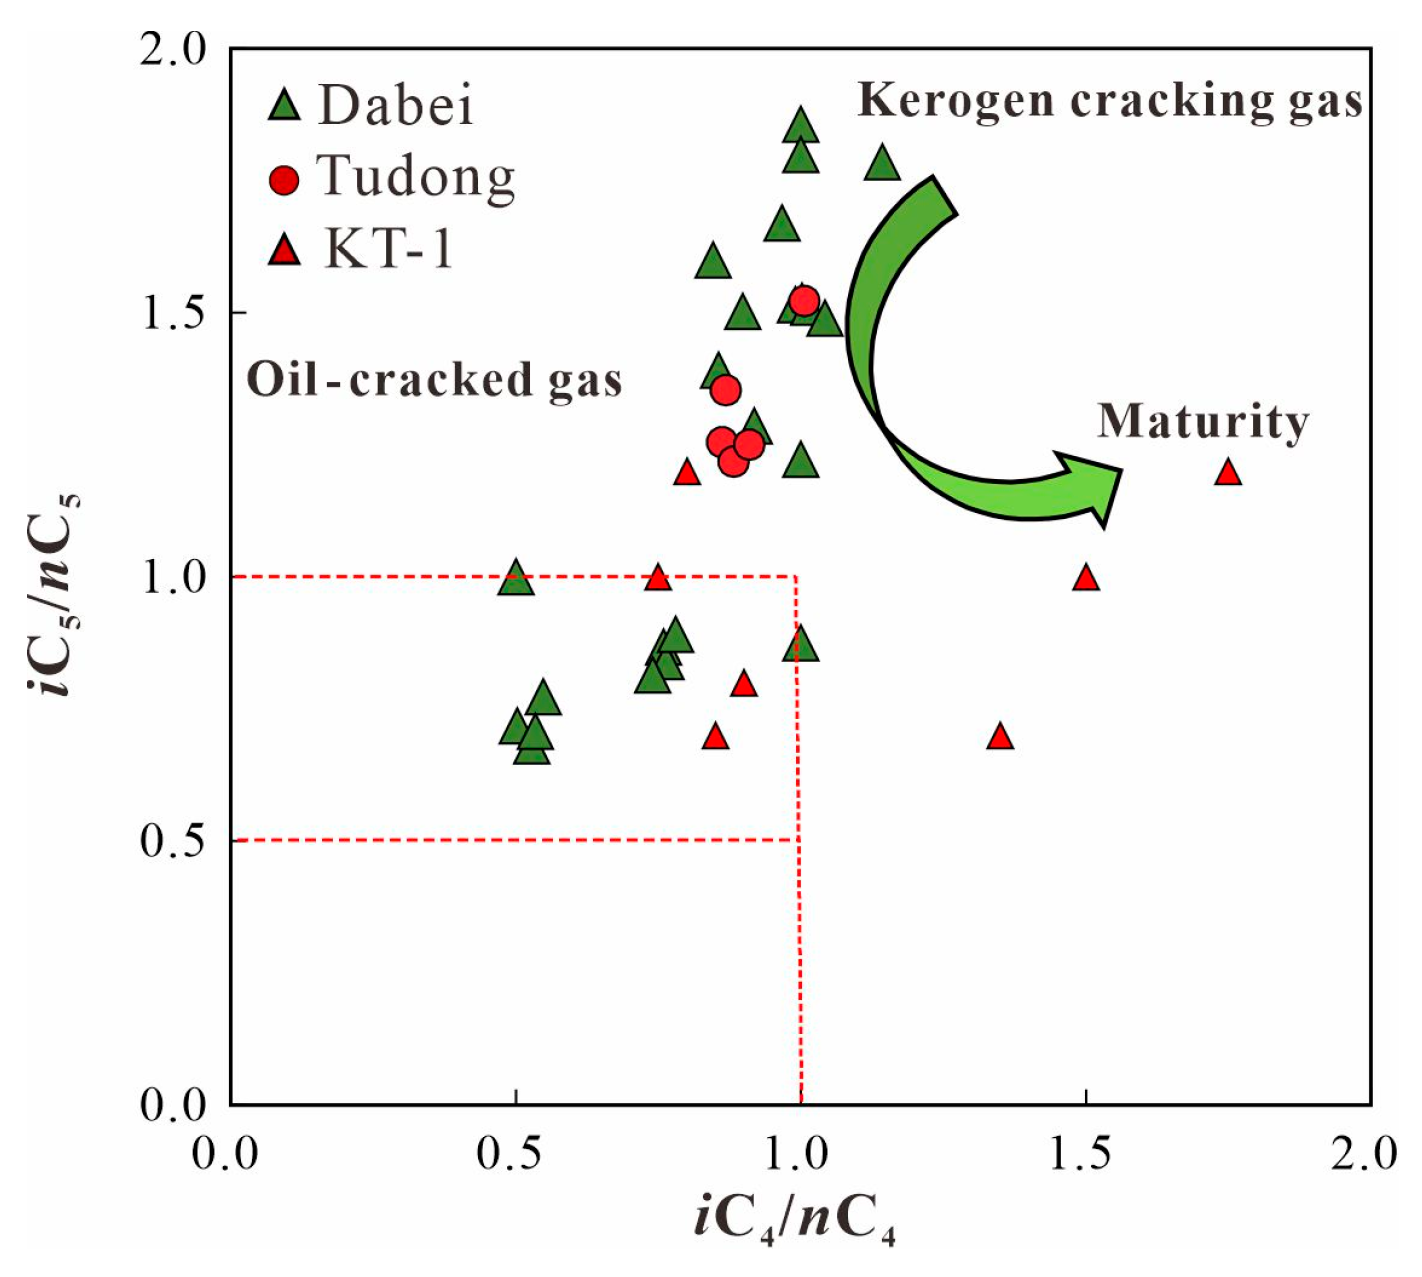
The ratio of iC4/ nC4 and iC5/ nC5 in natural gas is affected by various factors, such as source type, maturity and migration [59]. Previous studies have shown that when iC4/ nC4 and 0.5 < iC5/ nC5 < 1.0, it is oil-cracking gas; when iC4/ nC4 > 1 and iC5/ nC5 > 1.0, it is kerogen-cracking gas [60]. Based on the distribution characteristics of the iC4/ nC4 and iC5/ nC5 ratios in the Kuqa Depression (Figure 11), it can be concluded that the natural gas in the Tudong and Dabei areas, as well as the KT-1 well, is primarily kerogen-cracking gas, with part of the natural gas in the Dabei area and KT-1 well behaving as oil-cracked gas.

5.2. Reasons for High CH4 Content and Abnormal Carbon Isotope in Natural Gas in the Dabei Areas

CH4 is the main gas component in the Dabei area, with a concentration reaching 98.06% and an average dryness coefficient of 98.1, indicating typical dry gas. The δ13C1 and δ13C2 values are relatively heavy in the Tudong area, with δ13C1 ranging from −25.70‰ to −33.10‰ and δ13C2 ranging from −18.90‰ to −22.60‰. The δ13C2 of natural gas is closely related to the hydrocarbon source materials and serves as an effective indicator of the source material type. It is widely accepted that the δ13C2 value of coal type gas is higher than −28‰ and the δ13C3 value is higher than −25‰, while oil-type gas shows the opposite trend [41,44,46,47,48,49].
From the data presented above, natural gas in the Dabei area is mainly coal-type gas. However, the Ln (C1/C2) value, combined with the iC4/nC4 ~ iC5/nC5 plate, indicates the presence of some oil-cracked gas in the Dabei area. The “Bernard” diagram indicates that 13C enriches in δ13C s, migrating upward and mixing within the Dabei area, leading to abnormally high C1/(C2 + C3) ratio in the shallow sections and heavier δ13C in the CH4 within the natural gas.
Wang et al. (2022) and Lei et al. (2007) indicated that the natural gas in the central–eastern Kelasu structural belt mainly originates from the Upper Triassic T3h source rocks, with its sedimentary center located in the Kela–Dabei structural belt [29,34,61]. Yang et al. (2024) suggests that two primary phases of hydrocarbon charging occurred in the Dabei area, during the second period (6–4 Ma) and the third period (1–0 Ma) [7]. The first and second phases mainly involved a mix of oil and gas, while the third phases predominantly gas charging [7]. Additionally, the natural gas in the Dabei area exhibits mixed-source characteristics, consisting of over-mature Triassic dry gas and oil-associated gas from the J2q oil [7]. The natural gas in the Dabei area is mainly a high-maturity product derived from coal-bearing source rocks of humic organic matter. During the third phase of gas charging, CH4-dominated dry gas with relatively heavy carbon isotopes migrated into traps under high charging pressure through the source rocks, forming reservoirs. Thus, the possibility of gas mixing from the same source but different periods is unlikely. Given the contributions of Jurassic coal-bearing source rocks and Triassic lacustrine source rocks to the deep tight sandstone gas reservoirs in the Dabei–Keshen area. The mixing of gases from different sources or the mixture of oil-type gas with coal-derived gas may explain the high CH4 content and abnormally heavy carbon isotopes in Dabei natural gas.
In summary, natural gas in the Dabei area is primarily a high-maturity product of humic organic matter from coal-bearing source rocks. The migration of 13C from deep coal-bearing source rocks into the upper layers leads to abnormally high C1/(C2+C3) ratio in shallow sections and heavier 13C values in C4 within the natural gas. However, this migration and mixing process, involving only the influx of over-mature dry gas C4, did not alter the composition of heavy hydrocarbons, thereby preserving the original kerogen-cracking or crude-oil-cracking characteristics.

5.3. Evaluation of Natural Gas Mixed Source Ratio in Dabei Area and KT-1 Well

The natural gas from the KT-1 well and the Dabei area exhibits characteristics of both the initial kerogen-cracking gas and oil-cracking gas, suggesting the possibility of mixed-source gas. However, despite the deep burial of the source rocks in the study area and a historical thermal evolution level reaching approximately 3.0%, the reservoirs themselves are relatively shallow and have not reached the temperature required for oil cracking. Thus, the presence of oil-cracking gas may be an illusion. Consequently, the natural gas from the KT-1 well and the Dabei area is likely a mixture of kerogen-cracking gas from various source rocks, particularly those with different lithologies.
To verify this hypothesis, we conducted two sets of thermal simulation experiments using different types of source rocks (details will be discussed in another article). The results showed that for coal-bearing source rocks, as thermal evolution increased, the relative content of CH4 and C2H6 gradually increased. Finally, the slopes of Ln (C1/C2) and Ln (C2/C3) flattened, with the values exceeding the upper limit range of the Kutan and Dabei natural gas. Thus, coal-bearing source rocks could represent the end-member of their over-mature source rock. In contrast, for lacustrine source rocks, as thermal evolution increased, the relative content of methane and ethane also increased, but the slopes of Ln (C1/C2) and Ln (C2/C3) were steeper and remained within the distribution range of the Kutan and Dabei natural gas, while covering the lower limit of their distribution range. This suggests that lacustrine source rocks may represent another end-member of their highly mature source rocks.
Simulations with varying mixing ratios (from 0:10, 1:9, …, 9:1 and 10:0) were performed and based on the principle of mass conservation; the distribution curves of the mixed components from these end-elements were calculated. As shown in Figure 12, over 90%, of the Kutan natural gas originates from over-mature coal-bearing source rocks, while the proportion of over-mature coal-bearing source rock gas in the Dabei area ranges between 40% to 90%. This is directly related to the relatively shallower burial depth of the Dabei source rocks and their lower level of thermal evolution, leading to a reduced contribution of over-mature natural gas compared to the Kutan area.

6. Conclusions

(1)
The analysis of the natural gas composition indicates that the CO2 in the natural gas from the Tudong, Dabei areas and the KT-1 well in the Kuqa Depression is of organic origin. Among these, the natural gas in the Tudong area, located in the eastern part of the Kuqa Depression, has a relatively simple genesis as thermogenic coal gas from the initial cracking of kerogen, while the natural gas in the KT-1 well and Dabei area may have a mixed origin;
(2)
The natural gas in the KT-1 well and Dabei areas has a high CH4 content and abnormally heavy carbon isotopes, likely due to the large-scale influx of dry gas, primarily contributed by CH4 from the underlying highly evolved coal-bearing source rocks. As a result, the CH4 content in the mixed gas is generally high and the related Ln(C1/C2) ratio is abnormally high at 5.38, leading to the appearance of oil-cracking gas on the Ln(C1/C2) vs. Ln(C2/C3) plate;
(3)
Thermal simulation experiments of the two primary source rock types (coal-bearing and lacustrine source rocks) in the study area and the resulting artificial mixing source ratio curves indicate that over 90% of the natural gas in the KT-1 well is contributed by deep, over-mature coal-bearing source rocks. In contrast, around 60% of the natural gas in the Dabei area is sourced from these same deep, over-mature coal-bearing rocks.

Author Contributions

Conceptualization and writing of the original draft, X.Y. and T.H.; funding acquisition, T.H. and Z.W.; investigation, B.W.; data curation, Y.H. and J.H.; methodology, Y.Z. and Q.Z.; visualization, L.Z. and K.Z. All authors have read and agreed to the published version of the manuscript.

Funding

Financial supports were provided by the National Natural Science Foundation of China (NO. 42272160), the open fund of SINOPEC Key Laboratory of Petroleum Accumulation Mechanisms (NO. 33550007-22-ZC0613-0040) and the Open Fund of Key Laboratory of Exploration Technologies for Oil and Gas Resources (Yangtze University), Ministry of Education (NO. K202307).

Data Availability Statement

Detailed information describing the experimental data is in the main text.

Acknowledgments

We acknowledge the precious advice of the editors and reviewers.

Conflicts of Interest

Authors Xianzhang Yang, Bin Wang, Lu Zhou, and Ke Zhang were employed by the Petroleum Exploration & Production Research Institute, Tarim Oilfield Company, PetroChina. The remaining authors declare that the research was conducted in the absence of any commercial or financial relationships that could be construed as a potential conflict of interest.

References

  1. Li, J.; She, Y.; Gao, Y.; Li, M.; Yang, G.; Shi, Y. Natural gas industry in China: Development situation and prospect. Nat. Gas Ind. B 2020, 7, 604–613. [Google Scholar] [CrossRef]
  2. Li, W.; Wang, J.; Jia, C.; Lu, S.; Li, J.; Zhang, P.; Wei, Y.; Song, Z.; Chen, G.; Zhou, N. Carbon isotope fractionation during methane transport through tight sedimentary rocks: Phenomena, mechanisms, characterization, and implications. Geosci. Front. 2024, 15, 101912. [Google Scholar] [CrossRef]
  3. Jia, C.; Gu, J.; Zhang, G. Geological Conditions for the Formation of Large and Medium-sized Gas Fields in Kuqa Depression. Sci. Bull. 2002, 47 (Suppl. S1), 49–55, (In Chinese with English Abstract). [Google Scholar]
  4. Zou, Y.; Zhao, C.; Wang, Y.; Zhao, W.; Peng, P.; Shuai, Y. Characteristics and origin of natural gases in the Kuqa Depression of Tarim Basin, NW China. Org. Geochem. 2006, 47, 322. [Google Scholar] [CrossRef]
  5. Liu, Q.; Qiu, S.; Li, J.; Liu, W.; Zhang, D.; Zhou, Q.; Hu, A. Natural gas geochemistry and its origins in Kuqa depression. Sci. China Ser. D Earth Sci. 2008, 51 (Suppl. S1), 174–182. [Google Scholar] [CrossRef]
  6. Fan, S.; Lu, Y.; Li, L.; Wei, H.; Zhang, H.; Shen, L. Geochemical characteristics, distribution and petroleum geological significance of Triassic-Jurassic source rocks in the Tugeerming and surrounding areas of Kuqa Depression, Tarim Basin. Nat. Gas Geosci. 2022, 33, 2074–2086, (In Chinese with English Abstract). [Google Scholar]
  7. Yang, H.; Shi, W.; Du, H.; Shi, L.; Wang, X.; Dong, G.; Mo, T.; Zuo, T.; Xu, L.; Jiang, X. Hydrocarbon charging periods and maturities in Bozi-Dabei area of Kuqa depression and their indication to the structural trap sequence. Acta Pet. Sin. 2024. Available online: https://link.cnki.net/urlid/11.2128.TE.20240417.1121.004 (accessed on 9 September 2024). (In Chinese with English Abstract).
  8. Schiener, E.; Stober, G.; Faber, E. Geochemical surface exploration for hydrocarbons in the North Sea. AAPG Bull. 1984, 68, 363–368. [Google Scholar]
  9. Mattavelli, L.; Ricchiuto, T.; Grignani, D.; Cahoell, M. Geochemistry and habitat of natural gases in Po basin, Northern Italy. Am. Assoc. Pet. Geol. Bull. 1983, 67, 2239–2254. [Google Scholar]
  10. Schoell, M. The hydrogen and carbon isotopic composition of methane from natural gases of various origins. Geochim. Cosmochim. Acta 1980, 44, 649–661. [Google Scholar] [CrossRef]
  11. Schoell, M. Genetic characteristics of natural gases. AAPG Bull. 1983, 67, 2225–2238. [Google Scholar]
  12. Whiticar, M.J. Carbon and hydrogen isotope systematics of bacterial formation and oxidation of methane. Chem. Geol. 1999, 161, 291–314. [Google Scholar] [CrossRef]
  13. Dai, J.; Qi, H.; Song, Y. On the indicators for identifying gas from oil and gas from coal measure. Acta Pet. Sin. 1985, 6, 31–38. [Google Scholar]
  14. Dai, J.; Qi, H. The relationship δ13C-Ro of the coal-derived gas in China. Chin. Sci. Bull. 1989, 34, 690–692. [Google Scholar]
  15. Dai, J. Natural gas carbon isotope characteristics and various natural gas identification. Nat. Gas Geosci. 1993, 4, 1–40. [Google Scholar]
  16. Xu, Y.; Shen, P. A preliminary study on geochemical characteristics of coal-type gas in Zhongyuan-Huabei oil-gas area. Acta Sediment Ologica Sin. 1985, 3, 37–46. [Google Scholar]
  17. Shen, P.; Shen, Q.; Wang, X.; Xu, Y. The gas hydrocarbon isotope characteristics and the coal-type gas identification. Sci. China Ser. B 1987, 6, 647–656. [Google Scholar]
  18. Liu, W.; Xu, Y. A two-stage model of carbon isotopic fractionation in coal-gas. Geochimica 1999, 28, 359–365. [Google Scholar]
  19. Chen, A.; Zhang, W.; Xu, Y. Application research and Isotope characteristics of pyrolysis simulation production of sedimentary rock. Sci. China Ser. B 1993, 23, 209–217. [Google Scholar]
  20. Berner, U.; Faber, E. Maturity related mixing model for methane, ethane and propane, based on carbon isotopes. Adv. Org. Geochem. 1987, 13, 67–72. [Google Scholar] [CrossRef]
  21. Faber, E.; Gerling, P.; Dumke, I. Gaseous hydrocarbon of unknown origin found while drilling. Org. Geochem. 1987, 13, 875–879. [Google Scholar] [CrossRef]
  22. Stahl, W.; Carey, J. Source rock identification by isotope analyses of natural gases from fields in the Val Varde Delaware Basins, West Texas. Chem. Geol. 1975, 16, 257–267. [Google Scholar] [CrossRef]
  23. Wang, Z. Formation Mechanism and Enrichment Regularities of Kelasu Subsalt Deep Large Gas Field in Kuqa Depression, Tarim Basin. Nat. Gas Geosci. 2014, 25, 153–166, (In Chinese with English Abstract). [Google Scholar]
  24. Wang, Q.; Yang, H.; Cai, Z.; Yang, X.; Zhang, L.; Jiang, J.; Zhou, L. Major break through and significance of petroleum exploration in Well Tuotan 1 on the south slope of Kuqa Depression, Tarim Basin. China Pet. Explor. 2023, 28, 28–42, (In Chinese with English Abstract). [Google Scholar]
  25. Jia, C.; Zhou, X.; Wang, Z.; Li, Q.; Pi, X.; Cai, Z.; Hu, X. Petroleum geological characteristics of Kela 2 gas field. Chin. Sci. Bull. 2002, 47 (Suppl. S1), 91–96, (In Chinese with English Abstract). [Google Scholar] [CrossRef]
  26. He, D.; Zhou, X.; Yang, H.; Lei, G.; Ma, Y. Geological Structure and Its Controls on Giant Oil and Gas Fields in Kuqa Depression, Tarim Basin:A Clue from New Shot Seismic Data. Geotecton. Metallog. 2009, 33, 19–32, (In Chinese with English Abstract). [Google Scholar]
  27. Guo, X.; Liu, K.; Jia, C.; Song, Y.; Zhao, M.; Lu, X. Effects of early petroleum charge and overpressure on reservoir porosity preservation in the giant Kela-2 gas field, Kuqa depression, Tarim Basin, northwest China. AAPG Bull. 2016, 100, 191–212. [Google Scholar] [CrossRef]
  28. Zhang, S.; Zhang, B.; Zhu, G.; Wang, H.; Li, Z. Geochemical evidence for coal-derived hydrocarbons and their charge history in the Dabei Gas Field, Kuqa Thrust Belt, Tarim Basin, NW China. Mar. Pet. Geol. 2011, 28, 1364–1375. [Google Scholar] [CrossRef]
  29. Lei, G.; Xie, H.; Zhang, J.; Wang, Y.; Huang, S.; Ye, M.; Zhang, G. Structural features and natural gas exploration in the Kelasu structural belt, Kuqa Depression. Oil Gas Geol. 2007, 28, 816–835, (In Chinese with English Abstract). [Google Scholar]
  30. Wang, Q.; Xu, Z.; Zhang, R.; Yang, H.; Yang, X. New fields, new types of hydrocarbon explorations and their resource potentials in Tarim Basin. Acta Pet. Sin. 2024, 45, 15–32, (In Chinese with English Abstract). [Google Scholar]
  31. Wang, Q.; Deng, H.; Mo, T.; Zhang, H.; Cheng, B.; Wang, Y.; Liao, Z. Carbon and hydrogen isotopic compositions of C7 hydrocarbons and their geochemical significance in light oils/condensates from the Kuqa Depression, Tarim Basin, NW China. Org. Geochem. 2024, 192, 104783. [Google Scholar] [CrossRef]
  32. Liu, Y.; Li, H.; Zhao, G.; Liu, M.; Dong, C.; Li, J.; Xiao, Z. Geochemical Characteristics of Natural Gas and Hydrocarbon Charging History of the Tugeerming Area in the Eastern Kuqa Depression. Geoscience 2022, 36, 988–997, (In Chinese with English Abstract). [Google Scholar]
  33. Bao, J.; Zhu, C.; Zhang, Q.; Li, M.; Lu, Y. Geochemical characteristics of natural gas from different structural units of the Kuqa Depression, the Tarim Basin. Oil Gas Geol. 2007, 28, 664–668, (In Chinese with English Abstract). [Google Scholar]
  34. Wang, K.; Zhang, R.; Zeng, Q.; Wang, J.; Xia, J.; Mo, T. Characteristics and formation mechanism of Lower Cretaceous deep and ultra-deep reservoir in Bozi-Dabei area, Kuqa depression. J. China Univ. Min. Technol. 2022, 51, 311–328, (In Chinese with English Abstract). [Google Scholar] [CrossRef]
  35. Wang, Z.; Wang, C.; Xu, K.; Zhang, H.; Chen, N.; Deng, H.; Hu, X.; Yang, Y.; Feng, X.; Du, Y.; et al. Characteristics and controlling factors of tectonic fractures of ultra-deep tight sandstone: Case study of the Lower Cretaceous reservoir in Bozi-Dabei area, Kuqa Depression, Tarim Basin. Nat. Gas Geosci. 2023, 34, 1535–1551, (In Chinese with English Abstract). [Google Scholar]
  36. Liang, D.; Zhang, S.; Chen, J.; Wang, F.; Wang, P. Organic geochemistry of oil and gas in the Kuqa depression, Tarim Basin, NW China. Org. Geochem. 2003, 34, 873–888. [Google Scholar] [CrossRef]
  37. Jiang, X.; Shi, L.; Mo, T.; Yang, H.; Du, H.; Shi, W.; Dong, G. Characteristics and causes of difference of physical properties of deep andultra deep tight sandstone reservoirs: A case study of the BashijiqikeFormation in Bozi area of Kuqa Depression. Bull. Geol. Sci. Technol. 2024. (In Chinese with English Abstract). [Google Scholar] [CrossRef]
  38. GB/T18340.2-2010; Organic Geochemical Analysis Method for Geological Samples—Part 2: Determination of Organic Carbon Stable Isotopic Component—Isotopic Mass Spectrometry. China Standard Press: Beijing, China, 2005.
  39. Huang, Y.; Liao, Y.; Liu, W.; Chen, C.; Xu, T.; Wang, Y.; Peng, P. Comparison of two liquid hydrocarbon collection methods in gold tube pyrolysisand their influence on hydrocarbon phase state characteristics. Geochimica 2020, 49, 528–538, (In Chinese with English Abstract). [Google Scholar]
  40. Dai, J.; Song, Y.; Hong, F.; Dai, C. Inorganic enetic carbon dioxide gas accumulations and their characteristics in east part of China. China Offshore Oil Gas 1994, 8, 3–10, (In Chinese with English Abstract). [Google Scholar]
  41. Song, Y.; Xu, Y. Origin and identification of natural gases. Pet. Explor. Dev. 2005, 32, 24–29. [Google Scholar]
  42. Dai, J.X.; Song, Y.; Dai, C. Inorganic Gas and Its Reservoir Froming Conditions in Eastern China; Science Press: Beijing, China, 1995. [Google Scholar]
  43. Zuo, Y.; Zheng, Z.; Shao, D.; Wang, H.; Yang, L.; Wang, C.; Zhang, Y. Reviews on CO2 Genesis, Controlling Factors of Hydrocarbon Accumulation and Degassing Model. Sci. Technol. Eng. 2021, 21, 12356–12367, (In Chinese with English abstract). [Google Scholar]
  44. Meng, Q.; Shi, J.; Zhao, H.; Huang, J.; Liu, Y.; Wang, Y.; Xie, X.; Xu, Y. Origin of natural gas from the Ordovician paleo-weathering crust and gas-filling model in Jingbian gas field, Ordos basin, China. Nat. Gas Geosci. 2023, 34, 1696–1709, (In Chinese with English Abstract). [Google Scholar]
  45. Meng, Q.; Wang, X.; Shi, G.; Lei, Y.; Zhao, H.; Zhao, Q.; Yin, J.; Gao, C. The 13C-depleted methane in terrigenous shale gas: A case study in the Triassic Yanchang Formation, Ordos Basin. Mar. Pet. Geol. 2022, 141, 105688. [Google Scholar] [CrossRef]
  46. Dai, J.; Ni, Y.; Gong, D.; Huang, T.; Liu, Q.; Hong, F.; Zhang, Y. Characteristics of carbon isotopic composition of alkane gas in large gas fields in China. Pet. Explor. Dev. 2024, 51, 223–233. [Google Scholar] [CrossRef]
  47. Dai, J. Significance of the study on carbon isotopes of alkane gases. Nat. Gas Ind. 2011, 31, 1–6+123, (In Chinese with English Abstract). [Google Scholar]
  48. Dai, J.; Zou, C.; Liao, S.; Dong, D.; Ni, Y.; Huang, J.; Wu, W.; Gong, D.; Huang, S.; Hu, G. Geochemistry of the extremely high thermal maturity Longmaxi shale gas, southern Sichuan Basin. Org. Geochem. 2014, 74, 3–12. [Google Scholar] [CrossRef]
  49. Dai, J.; Xia, X.; Wei, Y.; Tao, S. Carbon isotope characteristics of characteristics of natural gas in the Sichuan basin, China. Exp. Pet. Geol. 2001, 23, 115–121+132, (In Chinese with English Abstract). [Google Scholar]
  50. Dai, J. Coal-derived gas theory and its discrimination. Chin. Sci. Bull. 2018, 63, 1291–1305+1290, (In Chinese with English Abstract). [Google Scholar] [CrossRef]
  51. Cheng, X.; Dou, L.; Wang, J.; Li, W.; Wen, Z. Geochemical characteristics and genesis of natural gas in the Bongor Basin. Earth Sci. Front. 2018, 25, 112–120, (In Chinese with English Abstract). [Google Scholar]
  52. Zhang, M.; Song, D.; Wang, T.; He, F.; Zhang, W.; An, C.; Liu, Y.; Lu, Z. Geochemical characteristics and sources of natural gas in Hangjinqi area of Ordos Basin. Pet. Geol. Exp. 2024, 46, 124–135, (In Chinese with English Abstract). [Google Scholar]
  53. Han, Z.; Li, J.; Gou, Y.; Yan, Q.; Wang, S.; Li, J.; Liu, J.; Ge, S. The application of methane and ethane carbon isotopes as an identification index for gas origin study. Nat. Gas Geosci. 2016, 27, 665–671, (In Chinese with English Abstract). [Google Scholar]
  54. Wang, X.; Li, X.; Wang, X.; Shi, B.; Luo, X.; Zhang, L.; Lei, Y.; Jiang, C.; Meng, Q. Carbon isotopic fractionation by desorption of shale gases. Mar. Pet. Geol. 2015, 60, 79–86. [Google Scholar] [CrossRef]
  55. Wang, X.; Liu, P.; Meng, Q. Physical selectivity on isotoplogues of gaseous alkanes by shale pore network: Evidence from dynamic adsorption process of natural gas. J. Nat. Gas Sci. Eng. 2021, 97, 104252. [Google Scholar] [CrossRef]
  56. Li, J.; Li, Z.; Wang, X.; Wang, D.; Xie, Z.; Li, J.; Wang, Y.; Han, Z.; Ma, C.; Wang, Z.; et al. New indexes and charts for genesis identification of multiple natural gases. Pet. Explor. Dev. 2017, 44, 503–512. [Google Scholar] [CrossRef]
  57. Prinzhofer, A.A.; Huc, A.Y. Genetic and post-genetic molecular and isotopic fractionations in natural gases. Chem. Geol. 1995, 126, 281–290. [Google Scholar] [CrossRef]
  58. Shi, J.; Li, J.; Li, Z.; Qi, Q.; Hao, A. Organic geochemical characteristics and genetic type of natural gas in the Tazhong uplift, Tarim Basin. J. Northeast Pet. Univ. 2016, 40, 19–25, (In Chinese with English Abstract). [Google Scholar]
  59. Wang, P.; Shen, Z.; He, C.; Wang, J.; Huang, F.; Pan, S.; Yin, S. The geochemical characteristics of butane and its application. Nat. Gas Geosci. 2017, 28, 529–538, (In Chinese with English Abstract). [Google Scholar]
  60. Qin, S.; Huang, C.; Zhang, B.; Yang, Y.; Yuan, M. Relationships of the iC4/nC4 and iC5/nC5 ratios with maturity of coal-derived gases of Triassic Xujiahe Formation in central Sichuan Basin, SW China. Pet. Explor. Dev. 2019, 46, 496–503. [Google Scholar] [CrossRef]
  61. Wang, K.; Zhang, R.; Yu, Z.; Yang, Z.; Tang, Y.; Wei, H. Characteristics and controlling factors of Jurassic A he reservoir of the northern tectonic belt, Kuqa Depression, Tarim Basin. Nat. Gas Geosci. 2020, 31, 623–635, (In Chinese with English Abstract). [Google Scholar]
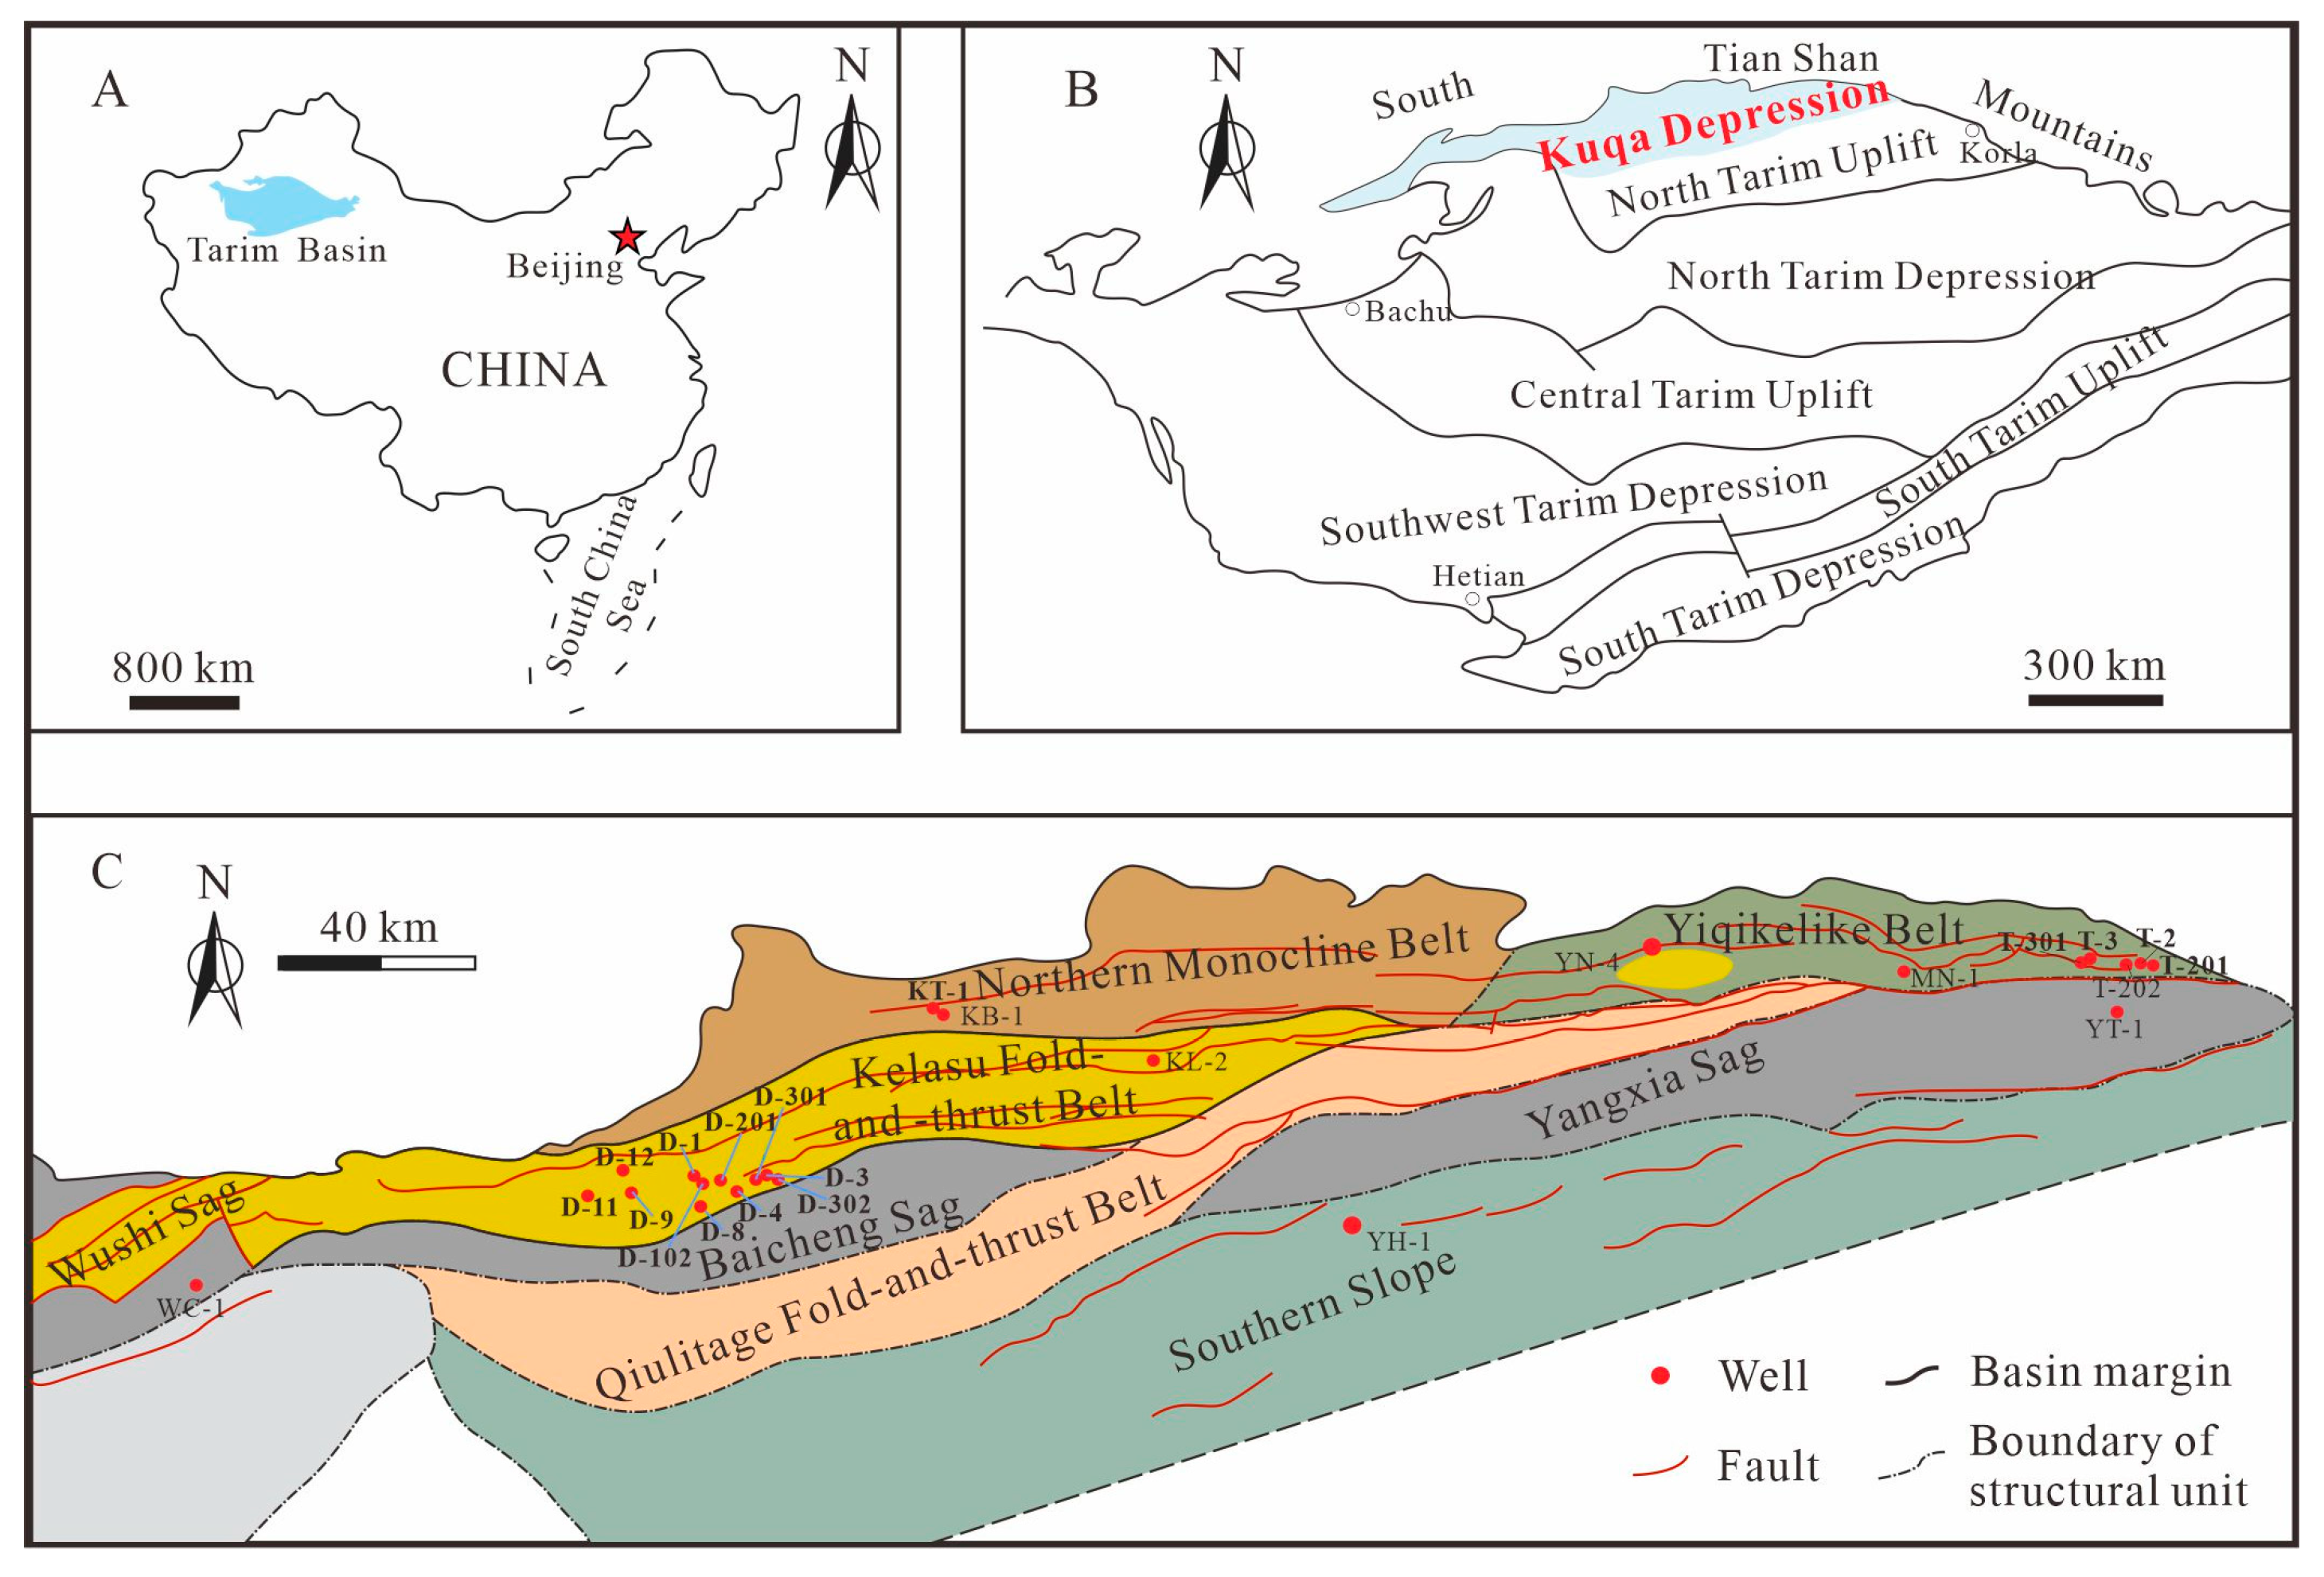
Figure 1. (A) The location of the Tarim Basin in northwestern China. (B) Tectonic unit division map of the Tarim Basin. (C) Tectonic unit division map of the Kuqa Depression.
Energies 17 05064 g001
Figure 2. Stratigraphic column of the Tugeerming area in the eastern part of Kuqa Depression; Bozi–Dabei area in the western part. A: stratigraphic column of the Bozi–Dabei area; B: stratigraphic column of the Tugeerming area.
Energies 17 05064 g002
Figure 3. Distribution of natural gas components in different reservoirs of Kuqa Depression.
Energies 17 05064 g003
Figure 4. Carbon isotope box plots of natural gas from different reservoirs in Kuqa Depression.
Energies 17 05064 g004
Figure 5. Carbon isotope folding diagram of natural gas in Dabei area and Tudong area in Kuqa Depression. (A) is the carbon isotope folding diagram of natural gas in Dabei area; (B) is the carbon isotope folding diagram of natural gas in Tudong area.
Energies 17 05064 g005
Figure 6. Diagram of natural gas carbon dioxide genesis in Dabei area, Tudong area and KT-1 well in the Kuqa Depression (Modified from [42]).
Energies 17 05064 g006
Figure 7. Correspondence of δ13C113C213C3 for natural gas from the Dabei and Tudong areas and the KT-1 well in the Kuqa Depression.
Energies 17 05064 g007
Figure 8. Correspondence between natural gas δ13C1 vs. δ13C2 in the Dabei and Tudong areas and the KT-1 well in the Kuqa Depression.
Energies 17 05064 g008
Figure 9. Correspondence between δ13C1 and C1/C2+3 in the Dabei and Tudong areas and the KT-1 well of the Kuqa Depression (modified from [55]).
Energies 17 05064 g009
Figure 10. Comparisons between thiadiamondoids in the STGL oil and some typical TSR-altered samples [38,39]. Note that the STGL oil samples, marked in red, have low concentrations of thiadiamondoids with values ranging between 5.84 mg/g oil and 7.08 mg/g oil, with a mean value of 6.49 mg/g oil [21].
Energies 17 05064 g010
Figure 11. Correspondence between iC4/nC4 and iC5/nC5 for natural gas in the Dabei and Tudong areas and the KT-1 well of the Kuqa Depression (Modified from [60]).
Energies 17 05064 g011
Figure 12. Analysis of mixed natural gas sources in the Dabei area and the KT-1 well of the Kuqa Depression.
Energies 17 05064 g012
Disclaimer/Publisher’s Note: The statements, opinions and data contained in all publications are solely those of the individual author(s) and contributor(s) and not of MDPI and/or the editor(s). MDPI and/or the editor(s) disclaim responsibility for any injury to people or property resulting from any ideas, methods, instructions or products referred to in the content.