Article

Gas Flow Blockage Treatment in Shale Gas: Case Study of Qusaiba Hot Shale, Saudi Arabia

by
Abdulrahman A. AlQuraishi
1,
Abdullah O. AlMansour
1,*,
Khalid A. AlAwfi
2,
Faisal A. Alonaizi
1,
Hamdan Q. AlYami
1 and
Ali M. AlGhamdi Ali
2
1
Mining and Hydrocarbon Technology Institute, King Abdulaziz City for Science and Technology, Riyadh 11442, Saudi Arabia
2
Department of Petroleum and Natural Gas Engineering, College of Engineering, King Saud University, Riyadh 11362, Saudi Arabia
*
Author to whom correspondence should be addressed.
Energies 2024, 17(20), 5025; https://doi.org/10.3390/en17205025
Submission received: 20 August 2024 / Revised: 25 September 2024 / Accepted: 7 October 2024 / Published: 10 October 2024
(This article belongs to the Section H: Geo-Energy)

Abstract

:
Organic-rich hot Qusaiba shale is the primary source rock of most of the Paleozoic hydrocarbon reservoirs of eastern and central Arabia. Representative near-surface Qusaiba shale samples were collected and characterized from one of its outcrop sections at the Tayma quadrangle in northwest Saudi Arabia. The petrophysical and geochemical characterization indicated porosity and permeability of 8.2% and 2.05 nD, respectively, with good total organic carbon (TOC) of 2.2 mg/g and mature kerogen of gas-prone type III. The tight characteristics of the formation can lead to high capillary pressure and extensive post-fracking water retention, leading to flow blockage and a reduction in gas productivity. Three different surfactants and one ionic liquid, namely, Triton X-100, Triton X-405 and Zonyle FSO surfactants and Ammoeng 102 ionic liquid, were tested as additives to fracking fluid to investigate their effectiveness in optimizing its performance. The chemical solutions exhibited no sign of instability when exposed to solution salinity and temperatures up to 70 °C. The investigated chemicals’ performance was examined by measuring methane/chemical solutions’ surface tension and their ability to alter shale’s wettability. The results indicate that Zonyl FSO is the most effective chemical, as it is able to significantly reduce surface tension and, hence, capillary pressure by 66% when added at critical micelle concentration (CMC). Using Zonyl FSO surfactant at a maximum tested concentration of 0.2% induced a relatively smaller capillary pressure drop (54%) due to the drastic drop in the contact angle rendering shale very strongly water-wet. Such a drop in capillary pressure can lower the fracking fluid invasion depth and therefore ease the liquid blockage removal during the flowback stage, enhancing gas recovery during the extended production stage. Triton X-100 at CMC was the second most effective surfactant and was able to induce a quite significant 47% drop in capillary pressure when added at the maximum tested concentration of 0.05%. This was sufficient to remove any liquid blockage but was less likely to alter the wettability of the shale. Based on the findings obtained, it is suggested to reduce the blockage tendency during the fracking process and elevate any existing blockage during the flowback stage by using Zonyl FSO at CMC where IFT is at its minimum with a higher contact angle.

1. Introduction

Unconventional shale gas has become increasingly important in recent years due to the increasing energy demand and advancements in tight shale production technologies. Shale consists of clay-size particles and varying fractions of silt and fine sand characterized by organic matter-filled pores and ultralow permeability [1]. Shale hydrocarbon production is highly challenging due to the rapid pressure and hence, recovery decline resulting from its tight characteristics and liquid retention blocking the gas flow of shale gas. In order to overcome the tight characteristics of shale, hydraulic fracturing has been widely implemented; this is a process in which a large volume of fracturing fluid, mainly composed of water-based polymer, is pumped to prop open the formation. Liquid retention and flow blockage in tight shale gas are attributed to the accumulation of condensation in the vicinity of wellbores due to pressure dropping below the dew point pressure. In addition, fracturing fluid invasion and accumulation at the matrix–fracture interface during the hydraulic fracturing process can also block the gas flow from fracked formations [2,3]. It is reported that 60 to 80% of injected fracturing fluid remains trapped during the flowback stage [4]. Such entrapment due to high capillary pressure, among other factors, can lead to gas flow blockage and consequent limitation of reservoir productivity [5,6,7].
Several techniques were suggested and implemented to handle this blockage problem, including gas cycling, supercritical CO2 injection, solvent injection, and wettability alteration using fluorinated surfactants/polymers [8]. Shale gas treated with surfactants shows higher fluid flowback and enhanced gas recovery [9]. This was attributed to the reduction in gas–water surface tension (SFT), alteration of rock wettability and/or decreasing water imbibition during the fracturing process [10,11]. SFT reduction enhances the solubilization and encapsulation of unrecovered fracturing fluid into the hydrocarbon phase during the flowback stage, inducing the mobilization of any remaining blocking liquid [12,13]. In addition, lowering the surface tension tends to expose more fracture–matrix interface pores for injected fluid to displace, decreasing the invasion depth and hence inducing less damage [14].
Surfactant(s) adsorption in Marcellus and Collingwood shale was investigated by [15]. Surfactant effectiveness in altering formation wettability and reducing gas–fracking fluid surface tension was tested and subsequently proved. The effectiveness of Alpha Foamer in the presence and absence of Betain C60 cosurfactant in enhancing fracturing fluid efficiency at various pressures, temperatures, and solution salinities was investigated [16]. Significant reductions in surface tension and the contact angle were observed, with extra reductions at elevated pressure and temperature. Such reductions promoted the desorption of gas from the shale matrix during fracking fluid flowback and extended production stages. The same approach was implemented to investigate BIO-TERGE® AS-40 surfactant and the surfactant was effective in lowering the surface tension and contact angle, leading to enhanced gas desorption [17]. Microemulsion and a conventional surfactant were also investigated and resulted in a better hydrocarbon production and minimized flow blockage with a better microemulsion performance [18,19,20]. This performance is attributed to the microemulsion thermodynamic stability and strong IFT reduction [21,22,23,24]. Field treatments of some fractured Appalachian, Barnett, and Fayetteville Basin wells were conducted using microemulsion. The resulting gas production was higher than that obtained with basic fracturing fluid [25].
Wijaya and Sheng investigated surfactants’ role in blockage removal and enhanced hydrocarbon recovery both experimentally and numerically [26]. Their numerical findings indicate that surfactants induce shallow entrapment depth during the fracturing process that is easier to remove during the flowback stage. Furthermore, the addition of a surfactant increases hydrocarbon’s relative permeability due to the reduction in interfacial/surface tension and wettability alteration to a more water-wet state. This work aims to experimentally investigate the efficiency of three commercial surfactants and one ionic liquid (IL) to ease liquid blockage and enhance the gas productivity of Qusaiba shale, one of Saudi Arabia’s unconventional high-potential formations. This is investigated by measuring the methane gas/chemical solution surface tension and the solutions’ ability to alter shale wettability to a more water-wet condition.

2. Qusaiba Shale Geological Setting

Saudi Arabia’s gas demand is projected to grow annually at a rate as high as 6.6% until 2030 [27]. This growth rate necessitates considerable efforts to meet such increasing demand, including tapping the country’s unconventional resources. Assessments indicate that Saudi Arabia has significant unconventional resources in both Paleozoic and Mesozoic lithostratigraphic units [28,29,30]. Over the past few years, assessment was extended to the Jurassic shale and tight carbonates of the Mesozoic era. These include Dhuruma, Tuwaiq, Hanifah and Jubaila formations acting as source rocks of the Mesozoic petroleum system in Jafurah basin, a new unconventional play.
The Silurian Qusaiba formation investigated in this work is made of deep marine coarsening-upward succession. It is exposed at the Tabuk basin, mainly at Tayma and Qalibah quadrangles [31], and at the western escarpment of Qusaiba Depression in the Qassim region of Saudi Arabia. Stratigraphically, Qusaiba formation consists mainly of light to dark gray shales (mudstone) interbedded with thin siltstone and sandstone layers [32] overlain by Sharawra Formation. Qusaiba’s expected reserves are estimated at 37 billion barrels of oil and 808 trillion cubic feet of gas [33]. Figure 1 presents the sampling location and the tectono-stratigraphic succession of the Paleozoic of the Tabuk and Widyan basins, showing the Qalibah group of Uqlah and Qusaiba Formations. Qusaiba formation base consists of organic-rich micro-laminated shale that is generally referred to as “Qusaiba hot shale” [34]. Hot shale’s organic type and maturity have been evaluated, and it has been found to possess an average total organic carbon (TOC) of 5 wt.% [32,34,35,36,37,38]. TOC is matured for oil generation along some basin margins while it is over-matured for gas generation in deeper parts of some basins [39]. Part of the light oil and gas was migrated to the upper Paleozoic succession in Central Arabia [32,34,35] while the majority remains within Qusaiba formation [40].
A detailed petrophysical analysis of the organic-rich Qusaiba shale revealed organic, inorganic, and micro-fracture pores. Inorganic pores are found to be related to mica and clay particles [41,43] while organic pores are related to calcareous fossils’ dissolution and the escape of gas with relatively high carbon content [41].

3. Materials and Experimental Methodology

3.1. Fluids

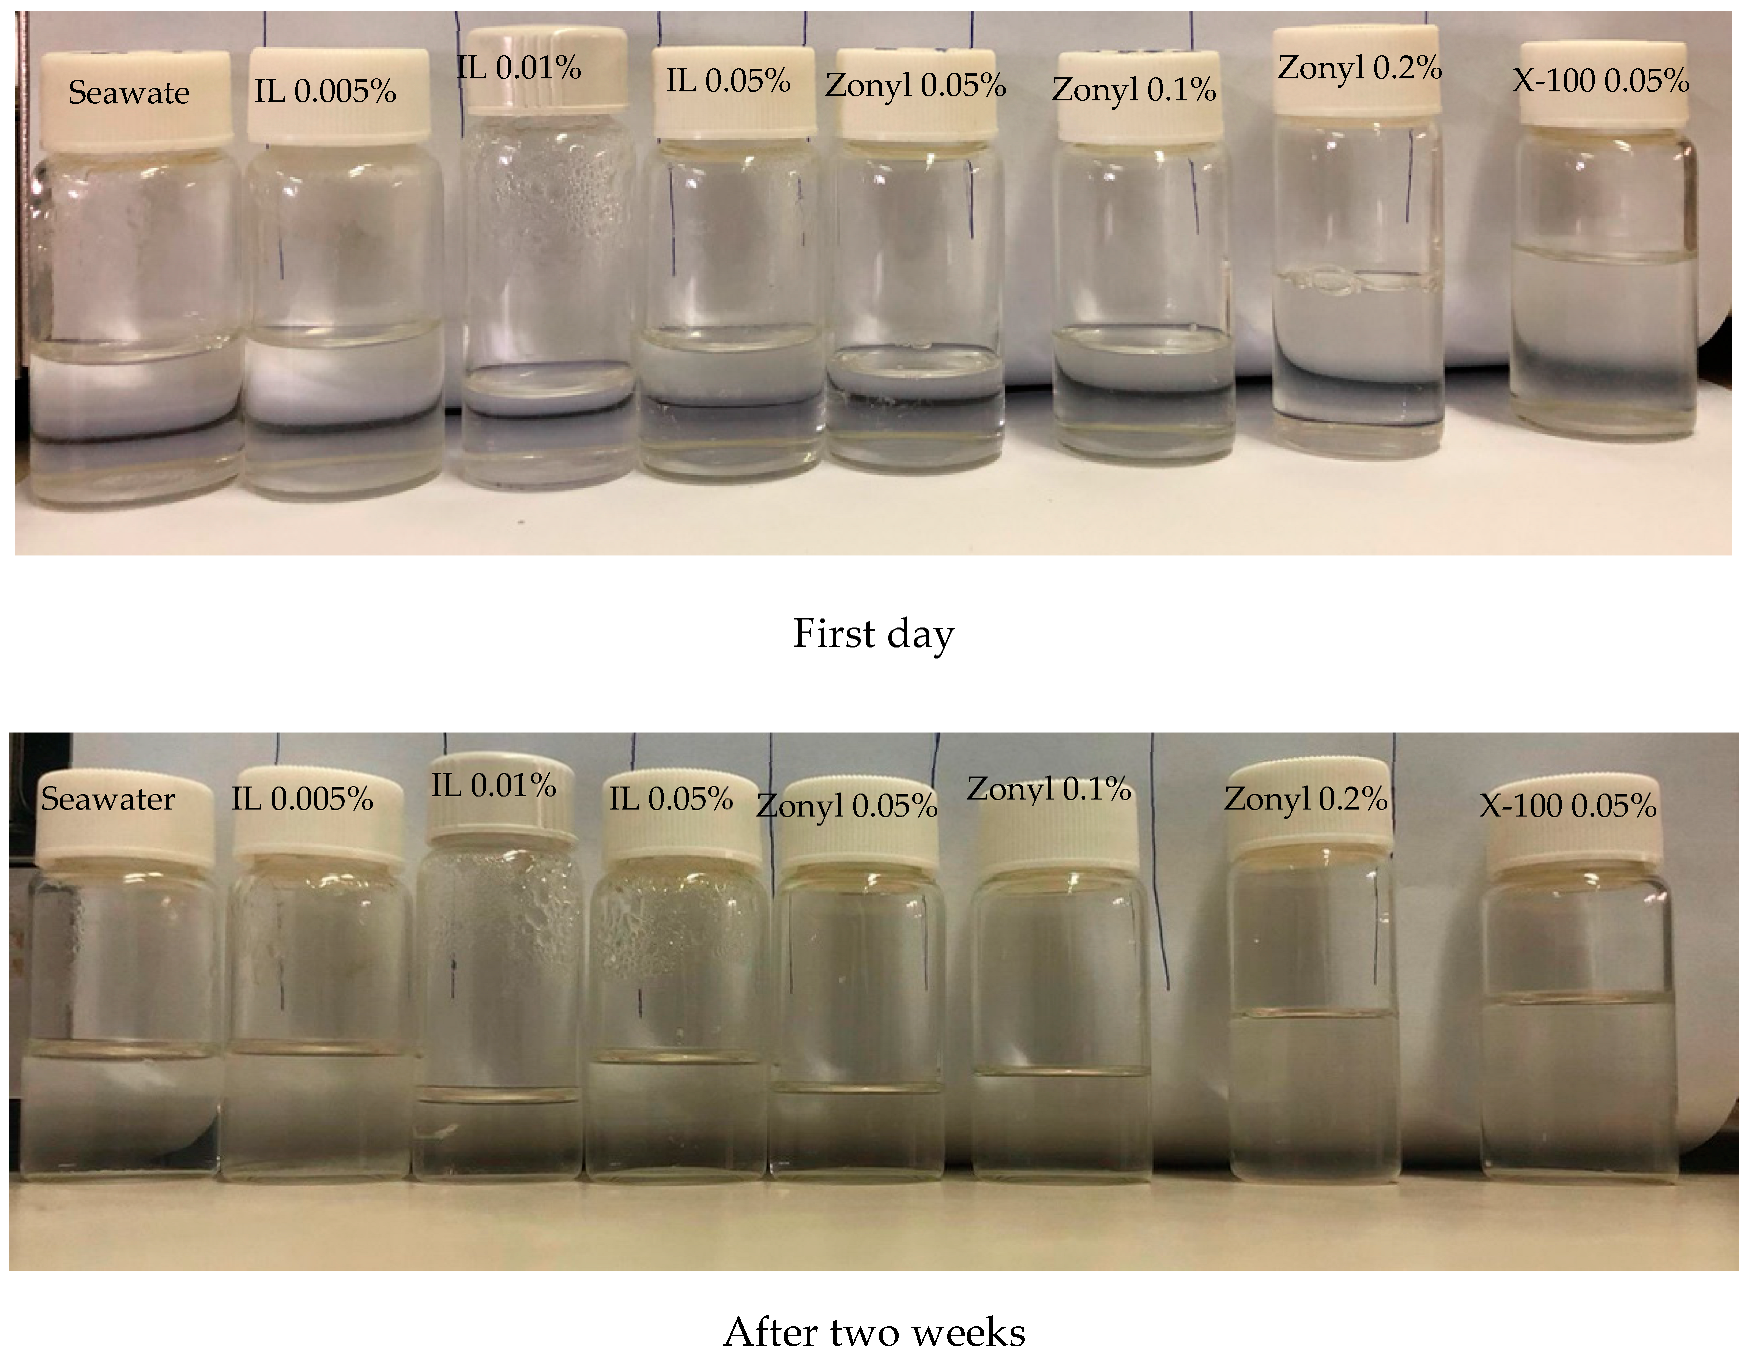
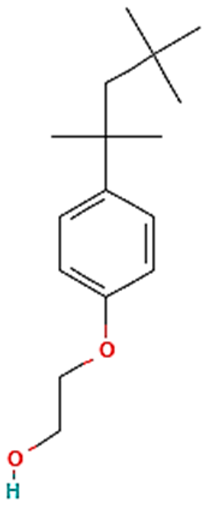
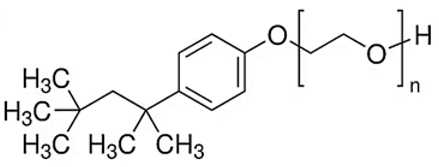
Arabian Gulf seawater was used to prepare the aqueous solutions. The total dissolved salt (TDS), chemical analyses, PH, turbidity, density, and viscosity are presented in Table 1. These were measured using ion chromatography system (ICS-5000) from Thermo Fisher Scientific Dionex (Sunnyvale, CA, USA), a pH meter and a turbidity meter (Avantor, PA, USA), a DMA HP Anton paar density (Anton Paar, Graz, Austria), and Brookfield viscosity meter (Brookfield Engineering Laboratories, Inc., Middleboro, MA, USA), respectively. Three surfactants (Triton X-100, Triton X-405 and Zonyle FSO) and one ionic liquid (Ammoeng 102) all diluted in seawater at different concentrations were prepared and tested. The types of chemicals, their formulas and the chemicals’ structures are presented in Table 2. The chemical solutions’ stability was tested for two weeks at 70 °C to observe any degradation in the chemical solutions that could result in their ineffectiveness. All solutions appeared to be clear, indicating no signs of instability at the set temperature, salinity level or at the investigated chemical concentrations (Figure 2). The gaseous phase used in this study was pure methane, which has a purity of 99.995%; this was used to represent the shale gas.

3.2. Porous Medium

Multiple lower-Qusaiba hot shale samples were obtained from its outcrops at the Tayma quadrangle in the north-western region of Saudi Arabia. The samples collected were light to dark gray, highly cemented, thinly laminated micaceous shale with a wide range of grain sizes. X-ray Fluorescence (XRF) and X-ray Diffraction (XRD) analyses were conducted and the outputs are presented in Table 3 and Figure 3.
The XRF results of two shale samples were found to be positive for Silica, Sulfur, Potassium, Titanium and high levels of Iron Oxides, as well as quartz, pyrite, anhydride and mica in addition to clay minerals as cementing materials. The relatively high presence of Calcium Oxide was attributed to the thermal dissolution of calcareous materials and/or fossils. The XRD pattern presented in Figure 3 indicates illite and kaolinite are the dominant clay minerals, comprising 51.6% and 11.8% of the total, respectively. Quartz was the second most dominant mineral (23.5%); in addition, lower mica content in the form of biotite (7.6%), sulfides in form of pyrite (4.02%) and a trace of evaporites minerals composed entirely of anhydrite (1.4%) were also determined to be present. TOC and pyrolysis were performed to determine the potential for shale hydrocarbon generation and thermal maturity [41]. A Tmax value of 471 °C with TOC of 2.2 mg/g indicated good potential for hydrocarbon generation with gas-prone type III mature kerogen. In comparison, the organic-rich basal hot shale of the Qusaiba formation in the subsurface of east-central Saudi Arabia, as well as in north-west Saudi Arabia, had an average TOC content of about 5 wt.%, with maximum values as high as 20 wt.% [32]. This lower TOC value is attributed to the oxidation of the collected surface samples [10].

3.3. Instruments and Methodology

Porosity and pore throat size distribution (PSD) were determined using a Micromeritics AutoPore IV Mercury Intrusion Porosimeter (MIP) (Norcross, GA, USA). Mercury was injected into a bulk compacted shale sample at different pressures up to 60,000 psi. The pressure versus intrusion volume was used to determine the shale PSD using Washburn’s equation. Conformance and compression corrections were implemented in order to obtain an accurate intrusion volume and, hence, porosity and PSD.
Shale matrix permeability was measured using a Core Lab SMP-200 permeameter (Core Lab Instruments, USA). This test is frequently performed on a crushed sample to reduce the time required to obtain accurate measurements. The permeameter is capable of measuring permeability in the range of 10−15 to 10−6 Darcy utilizing Gas Research Institute protocol 95/0496.
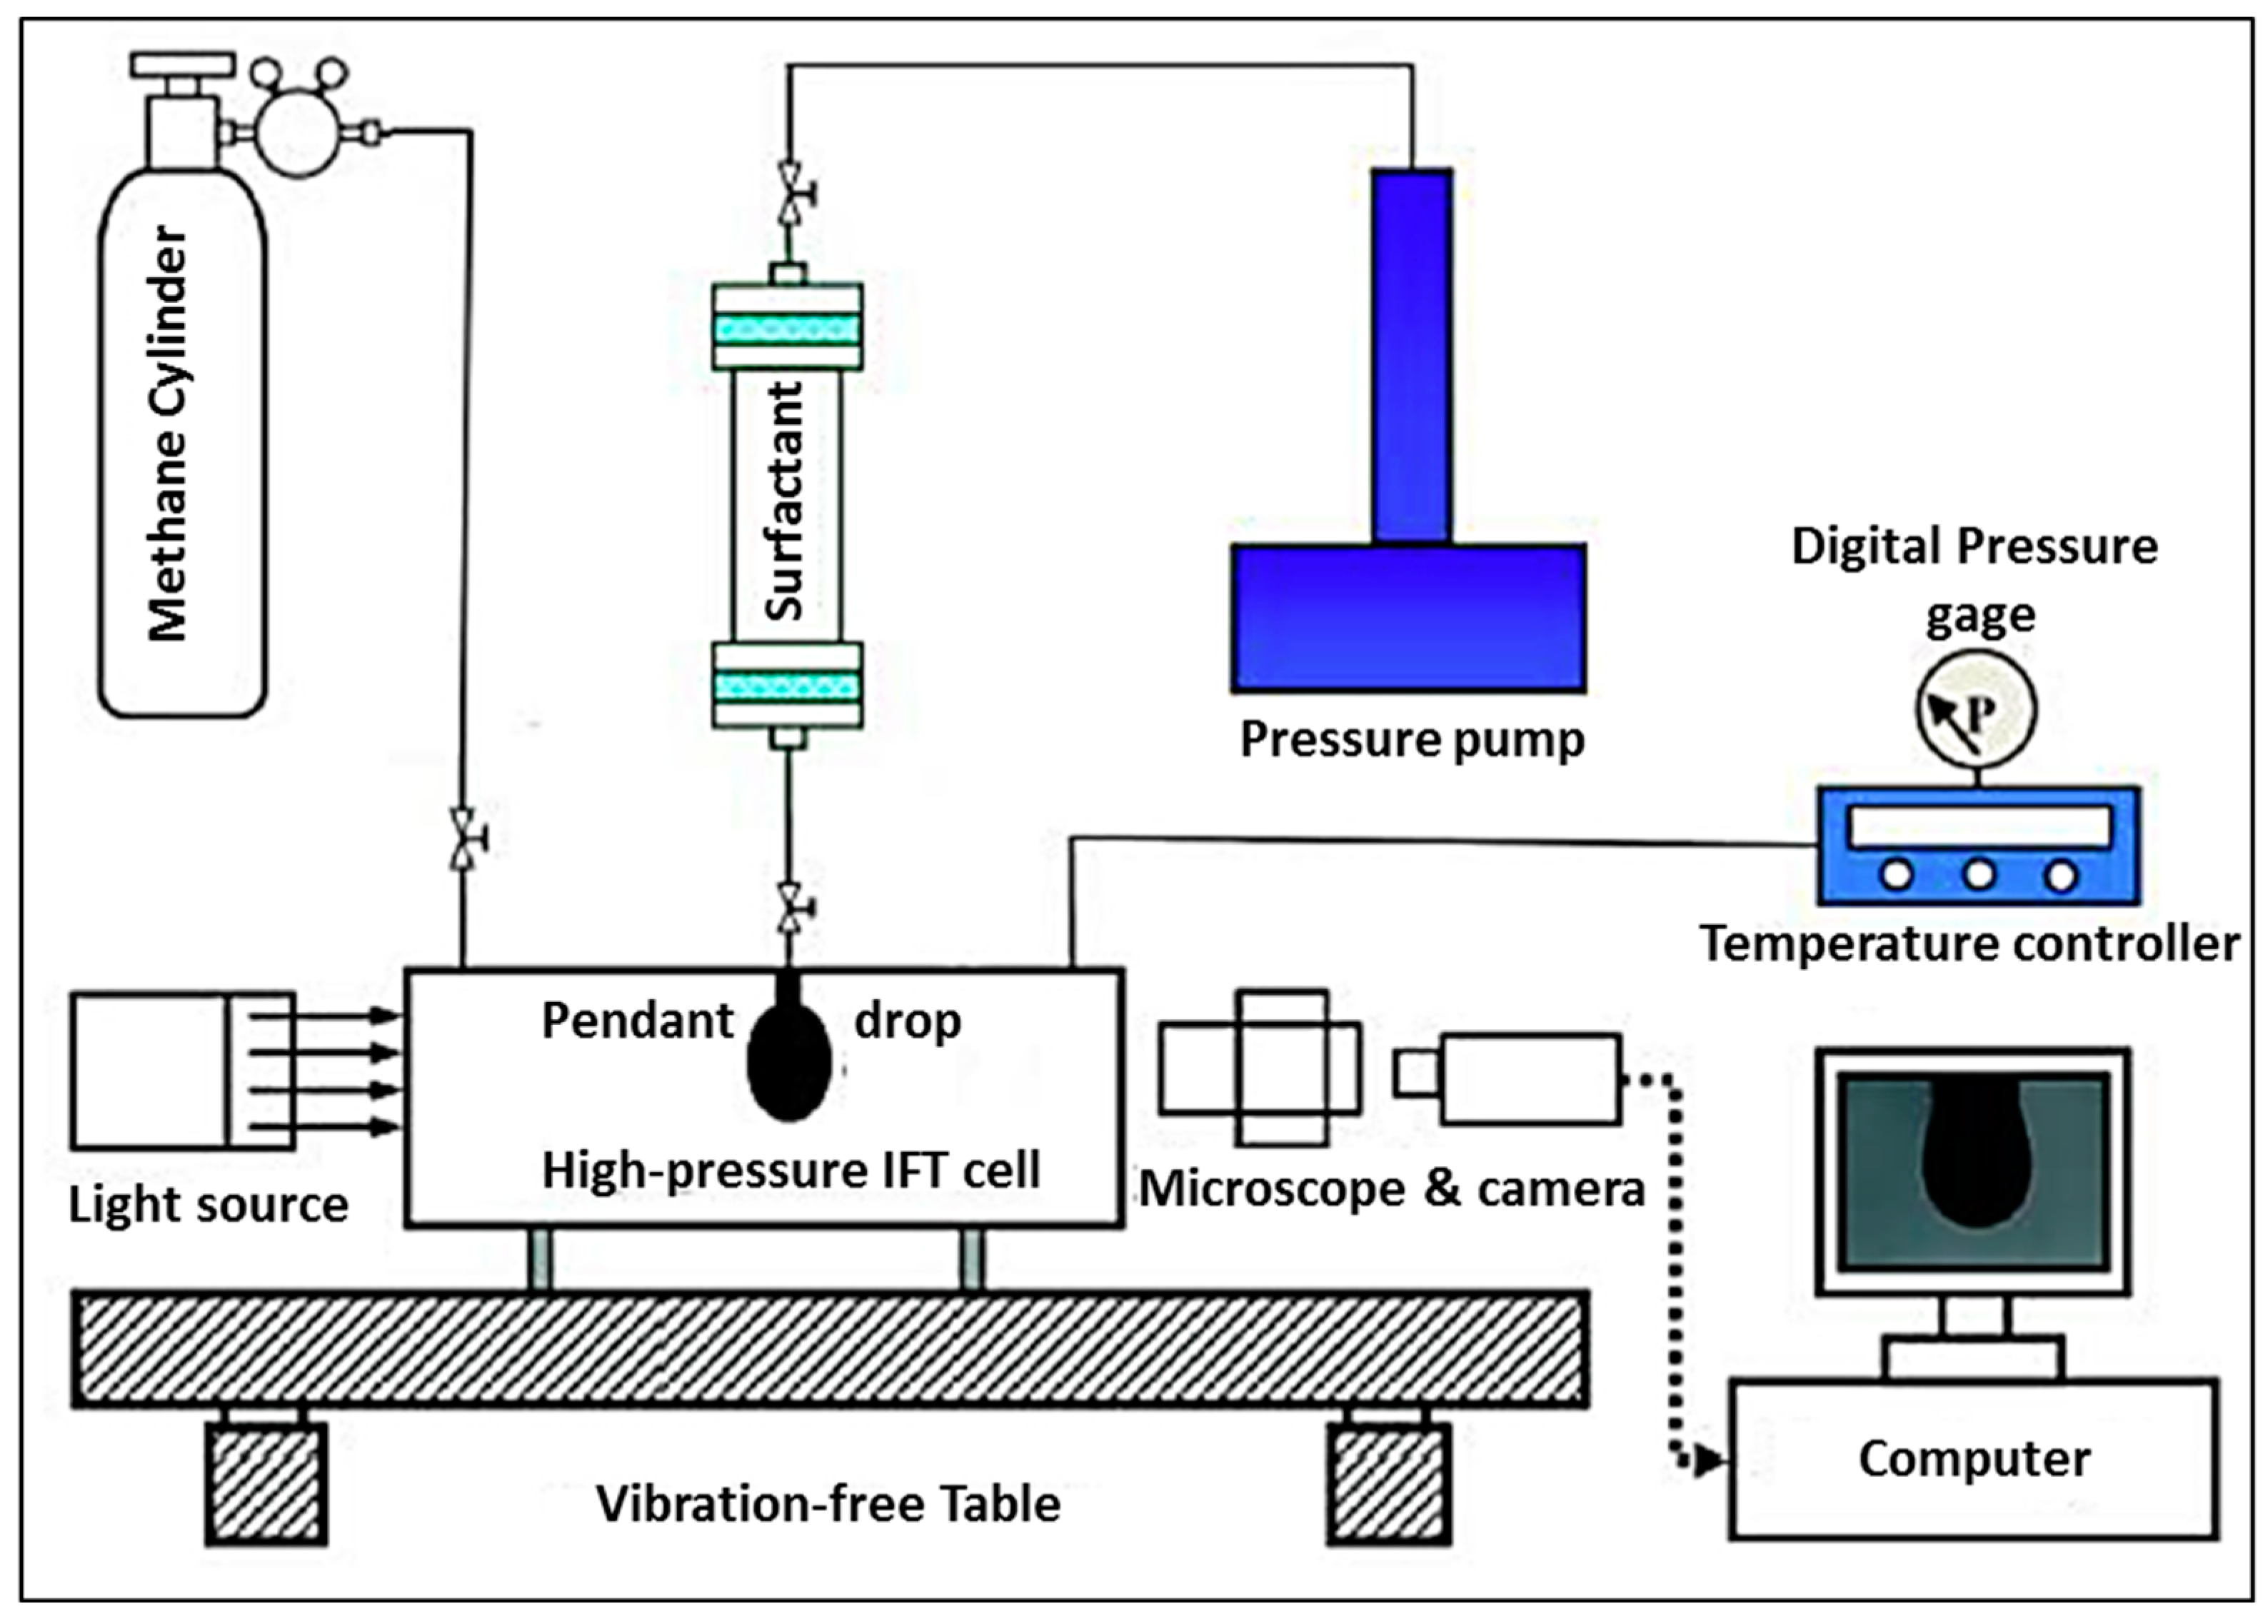
A Temco Core lab pendant drop tensiometer was used to measure the gas–chemical solutions’ surface tension and contact angle on a shale substrate. The schematic of the setup is illustrated in Figure 4. The setup is capable of measuring tension and contact angle at temperatures and pressures of up to 350 °F and 10,000 psi, respectively. The setup was first calibrated using a stainless-steel high-precision sphere of known diameter. The circumference was fitted to the acquired sphere profile for a particular selected magnification and the fitting parameters were used as calibration factors. To verify the accuracy of the calibration parameters, DI water–air surface tension was measured and checked with reference readings from the literature.
To measure the surface tension, we began by filling a cell with aqueous solution pressured to the set value. Methane gas was then injected upward through an appropriate-sized needle inserted vertically at the bottom of the pressured cell to form a pendant bubble of the right size at the tip of the needle. A digital camera was used to capture the pendant bubble image, which was then analyzed by the setup software for surface tension measurement. Several measurements were obtained for each solution to verify the accuracy of the tension readings and the average value was considered. With minor modifications, the setup could be used to obtain contact angle measurements. These were performed using a flat surface screwed to the inserted needle tip where a polished flat shale sample was placed. In this test, the injection needle was inserted from the top and directed downward towards the shale sample. First, the cell was filled with methane gas pressured to the predetermined value. Aqueous solution was then injected downward to form a drop of chemical solution at the surface of the solid substrate. A picture was taken by the camera and the contact angle where the fluid(s) interface met the solid surface was measured.
Fluids densities are essential input parameters for the measurements of surface tension. An Anton paar DMA HP density meter was used to measure the solutions’ densities at the predetermined experimental pressure and temperature utilizing the oscillating U-tube method. The instrument is designed to measure the density of liquids and gases at temperature and pressure ranges of −10 °C to +200 °C and 0 to 700 bars, respectively.

4. Results

4.1. Shale Characterization

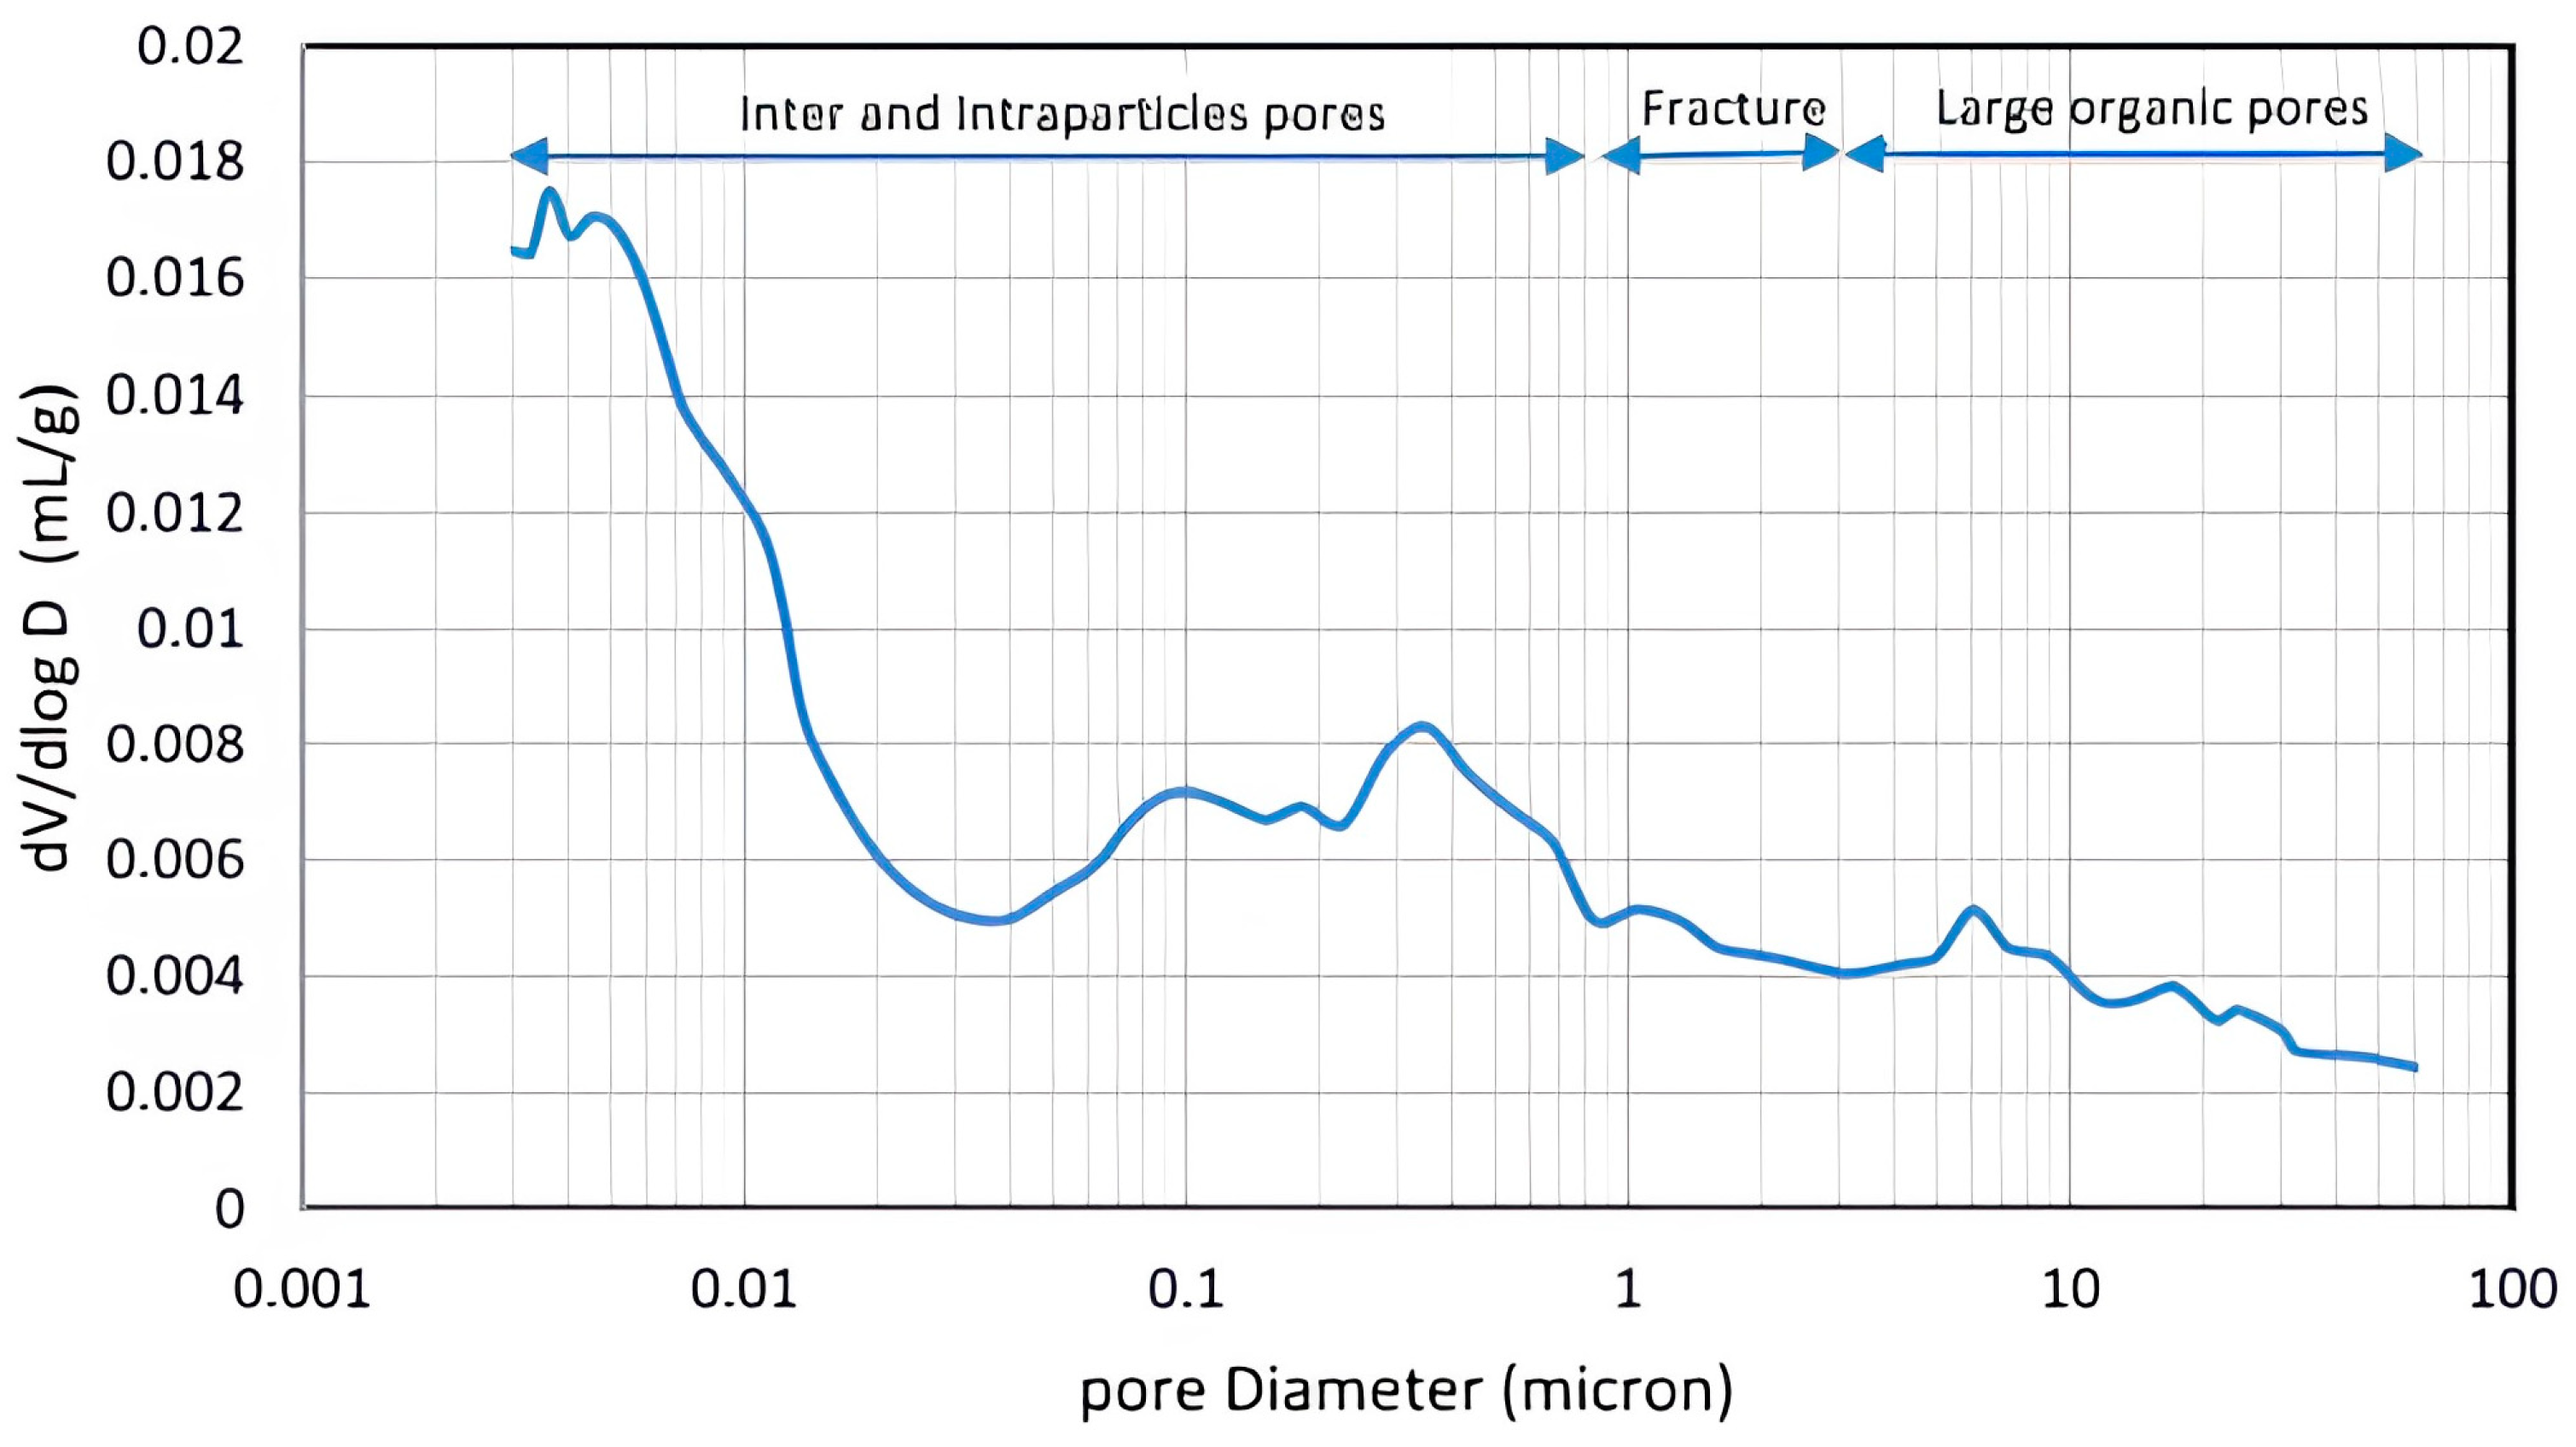
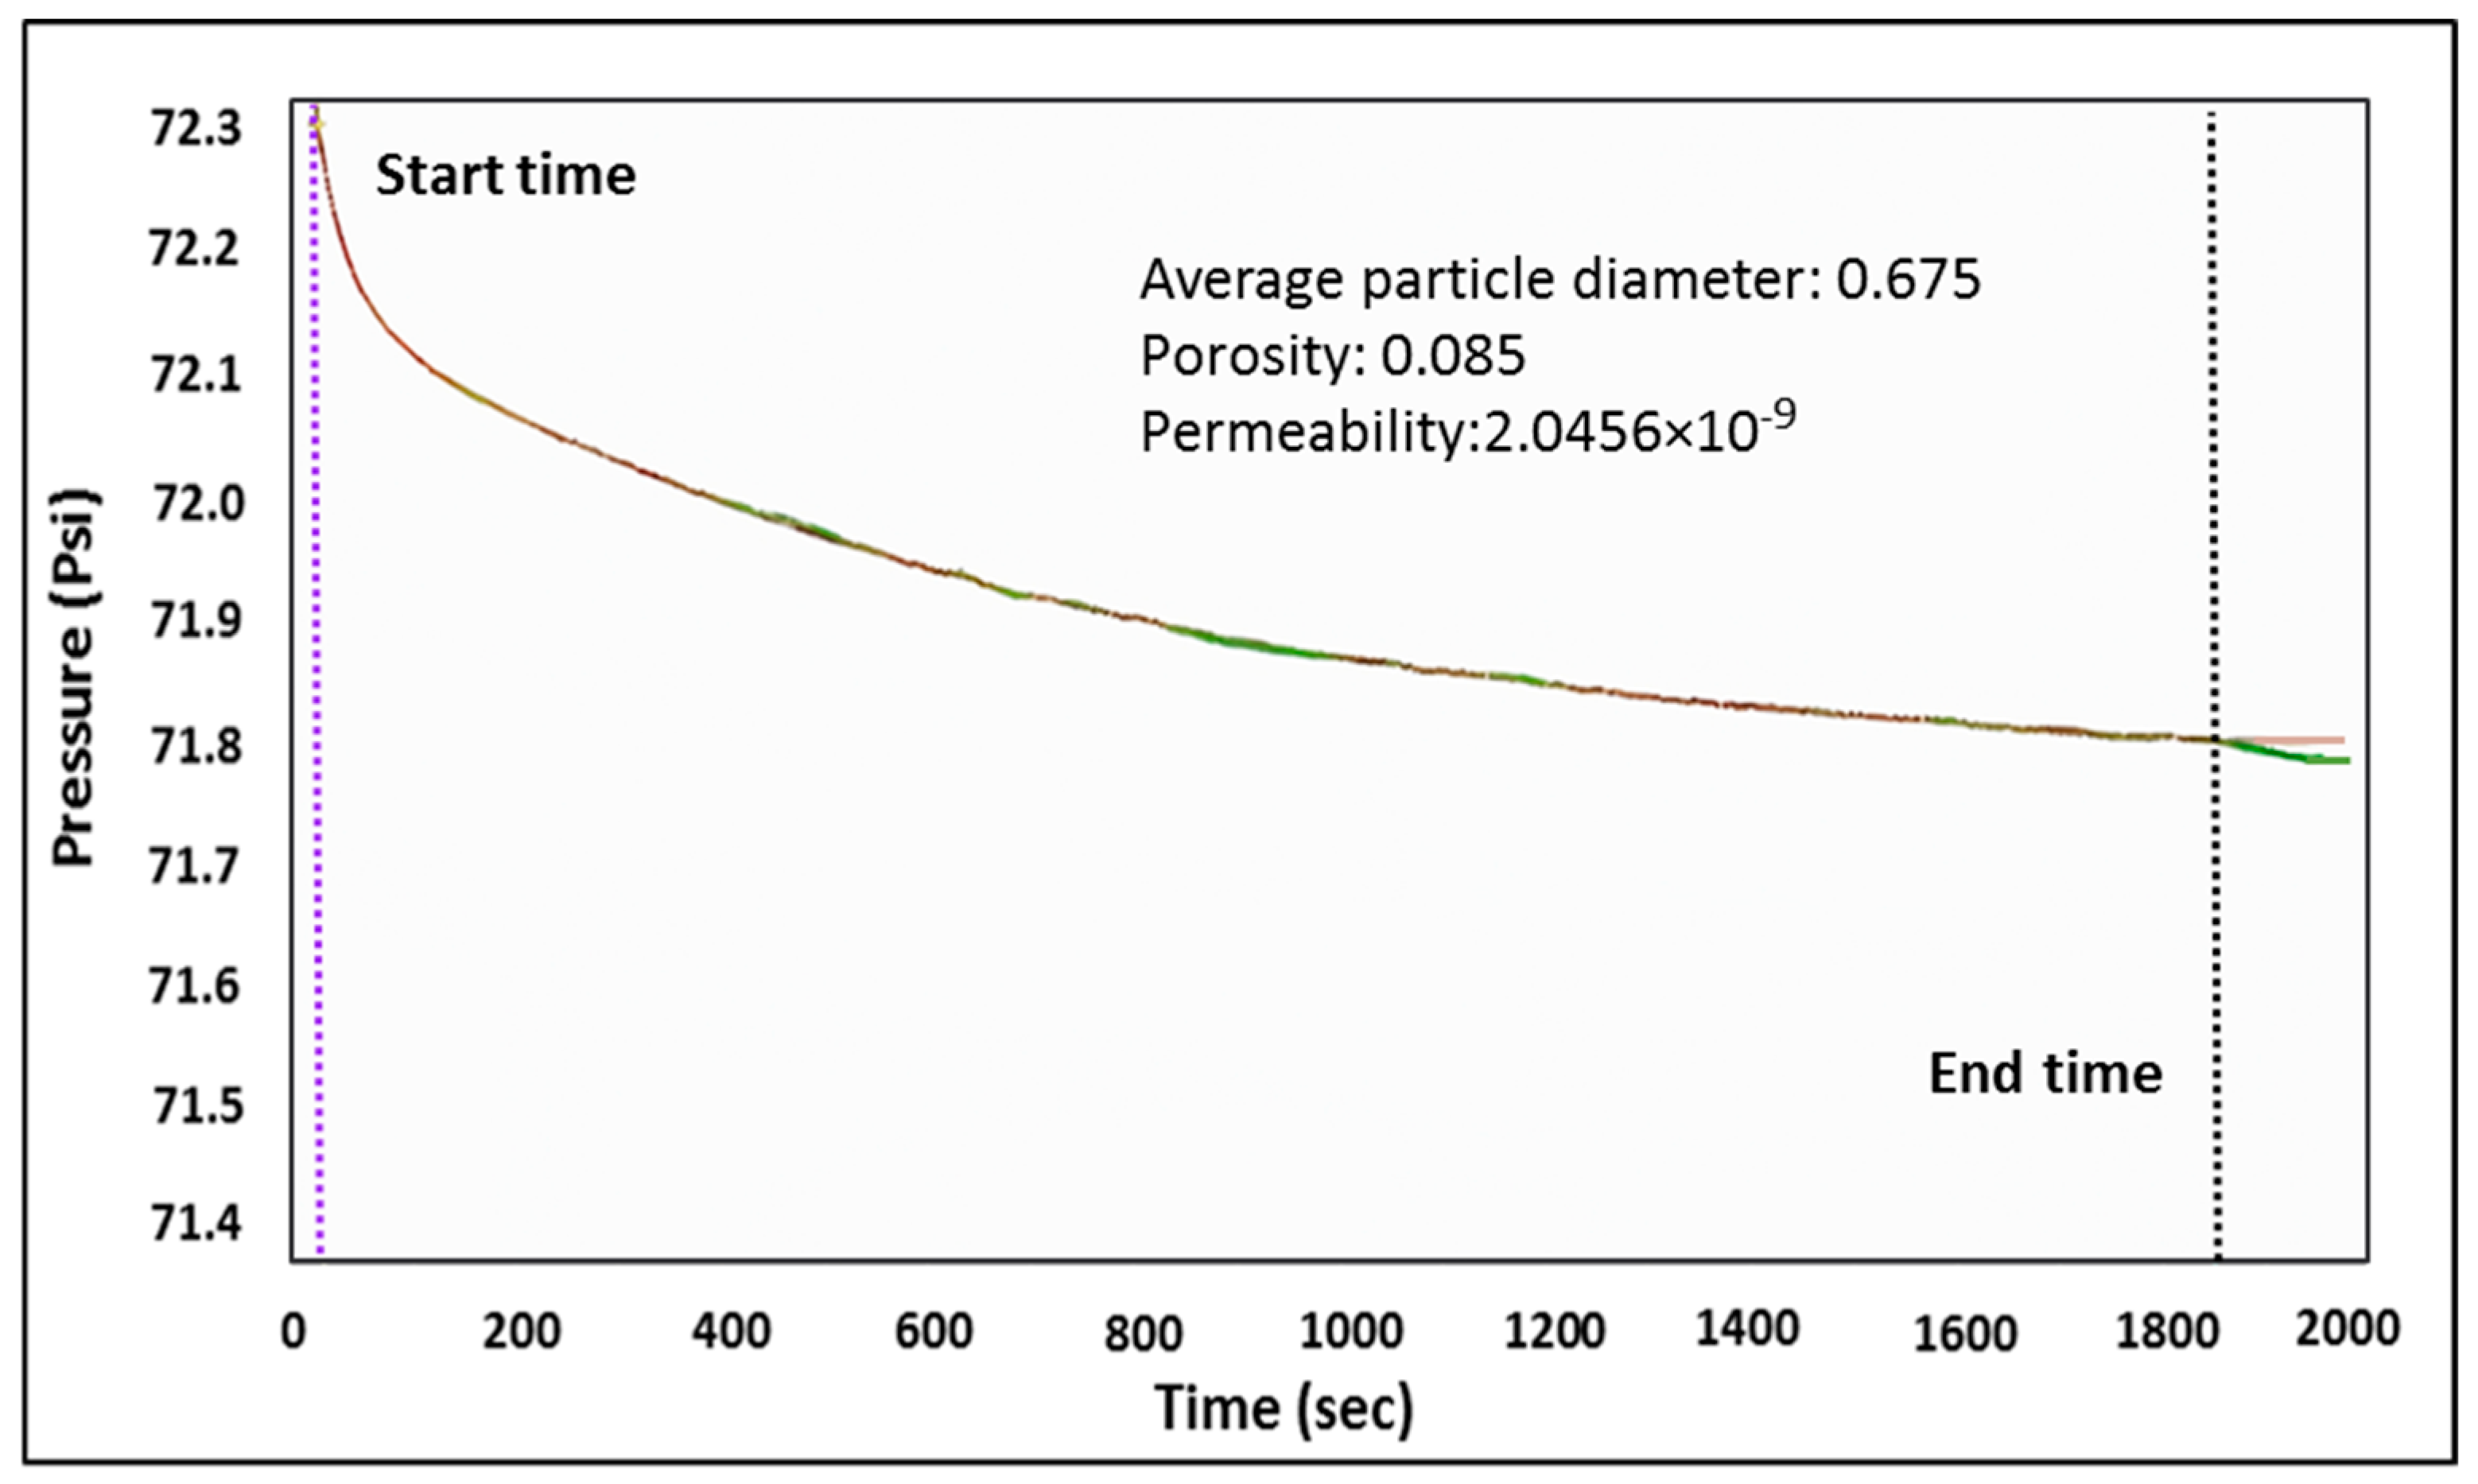
Petrophysical analyses were performed, including measurements of shale porosity, PSD and permeability. Porosity and PSD were determined on a representative bulk compacted shale sample and are illustrated in Figure 5. The evaluation of the partial porosity for each pore throat diameter range was conducted using the parameter dV/d(logD). The result shows multimodal behavior with four main peaks, indicating a medium pore range of 0.003–0.03 µm and three large porosity bands ranging from 0.04 to 0.8 µm, 0.8–3.0 µm and 3–60 µm. The first and second bands refer to the interparticle and intraparticle pores, while the third band covers the micro-fracture pores. SEM/EDS analysis indicated the presence of carbon within the pores of the last band, indicating the organic pores on the surface of shale flakes and organic pores surrounding the mica crystal that could be related to the dissociation of calcareous fossils. Large organic pores were also observed and were believed to have formed due to escaped gas [41]. Shale porosity was measured and found to be 7.8% with an average total pore diameter of 0.017 µm, while the permeability was determined to be 2.05 × 10⁻⁶ mD, as indicated by the pressure decay profile modeled in Figure 6.

4.2. Fluids Characterization

4.2.1. Chemical Solutions—Methane Gas Surface Tension

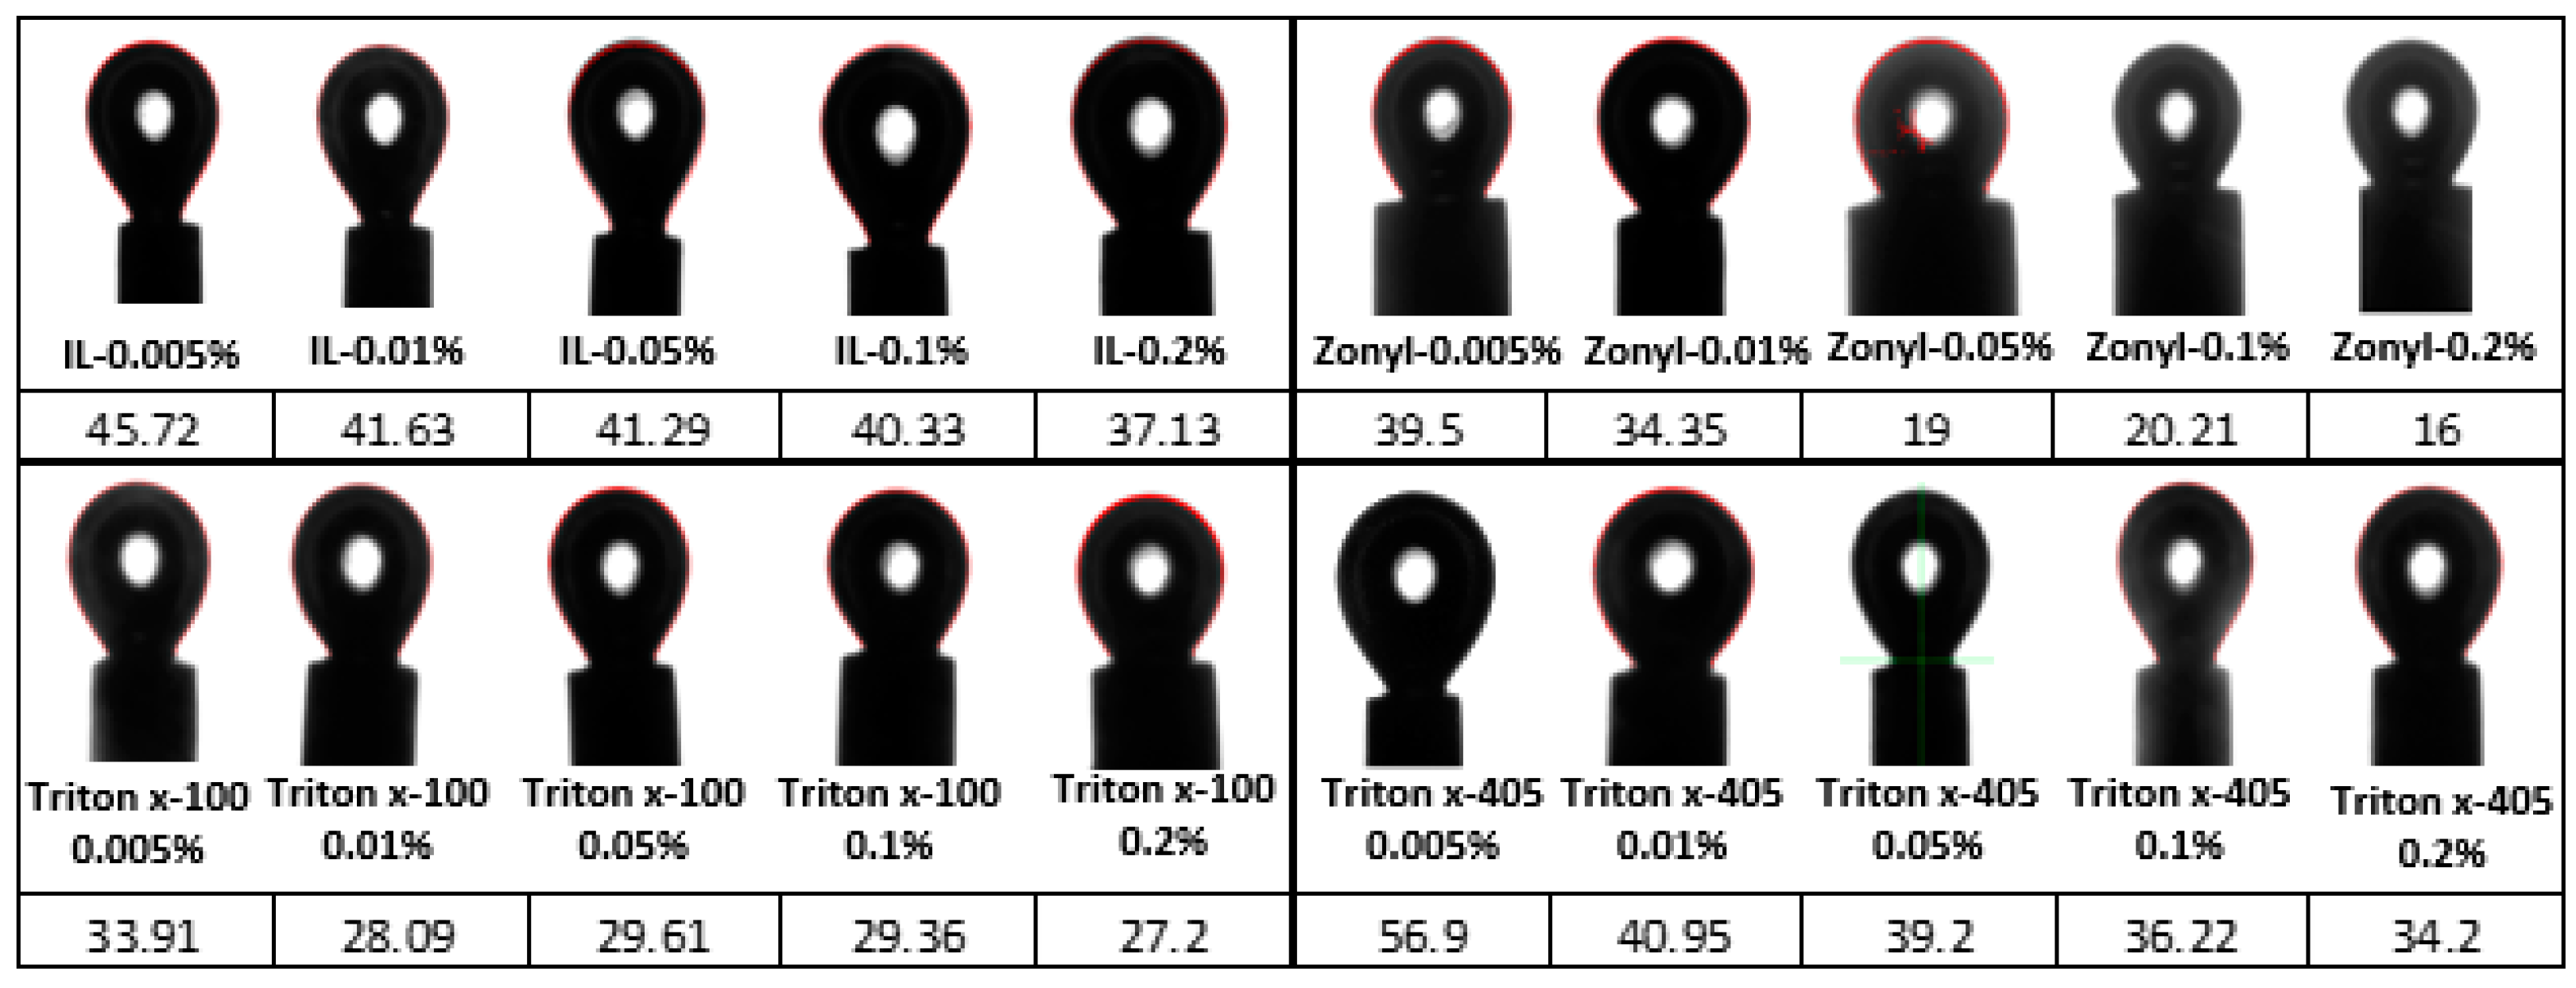
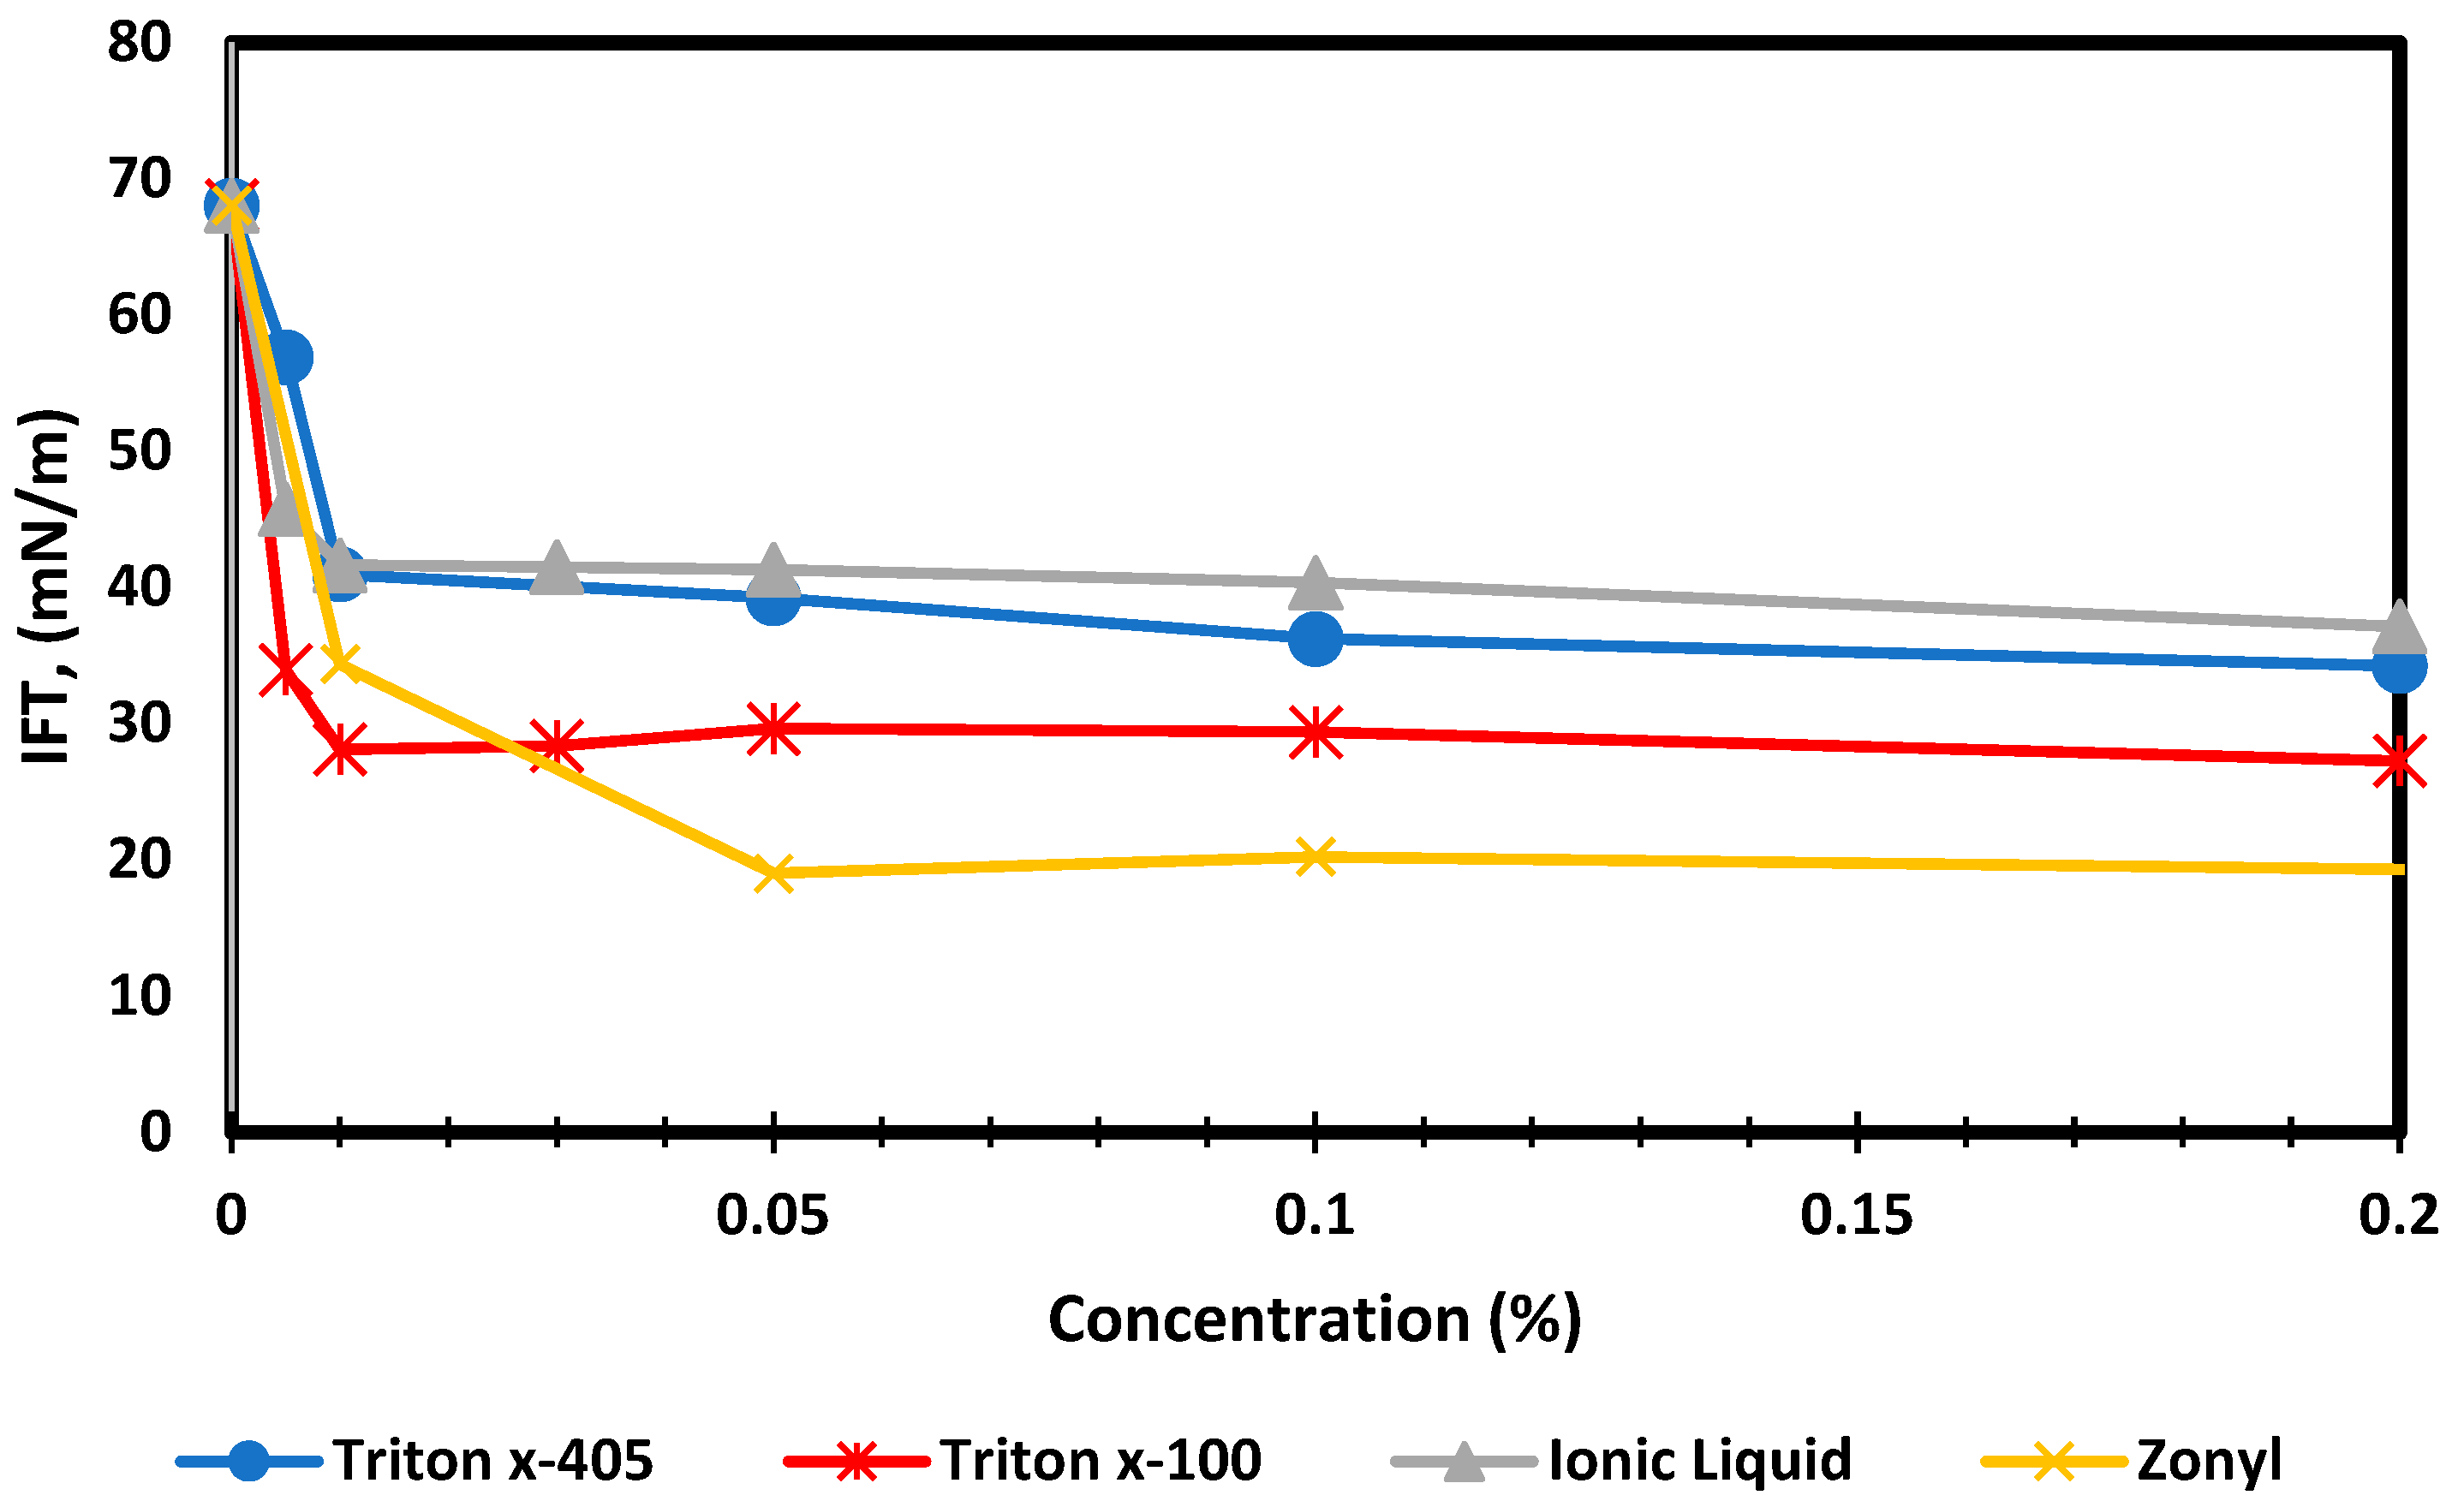
Measurements were conducted to investigate the effect of different chemical concentrations on surfactant-treated fracturing fluid–methane surface tension at 130 psia and 30 °C. Such conditions were chosen to simplify the experimental work with the knowledge that increasing the temperature and pressure would positively lower the interfacial tension [44,45]. Figure 7 and Figure 8 indicate a reduction in aqueous solutions–methane surface tension as the chemical concentration increases. Surface tension started at 68 mN/m at 0% concentration and dropped at different rates as the different chemicals were added at different concentrations. High surface tension can cause high capillary pressure and, hence, higher water retention, leading to blockage of gas flow at the flowback stage and also leading to gas production. The chemicals added to the fracturing fluid tended to decrease the partition at the gas/fracturing fluid interface, reducing the surface tension and easing the flowback of invaded fracturing fluid and enhancing the recovery of gas into the created fracture during the extended production stage [45].
Zonyl FSO provided the optimum reduction in surface tension, which was reduced to 20 mN/m as reported at the critical micellar concentration (CMC) of 0.015%. Triton X-100 was able to decrease the surface tension to 28 mN/m at CMC of 0.01%, while Ammoeng 102 IL and Triton X-405 provided the smallest drop in the surface tension reading of 40 mN/m, both at a CMC of 0.01%. For all chemicals, no extra surface tension reduction was observed at chemical concentrations above the determined CMC values. With that said, Zonyl FSO and Triton X-100 surfactants appear to be the most effective with respect to their ability to reduce the fracturing fluid–gas surface tension and, hence, capillary pressure.

4.2.2. Wettability Alteration

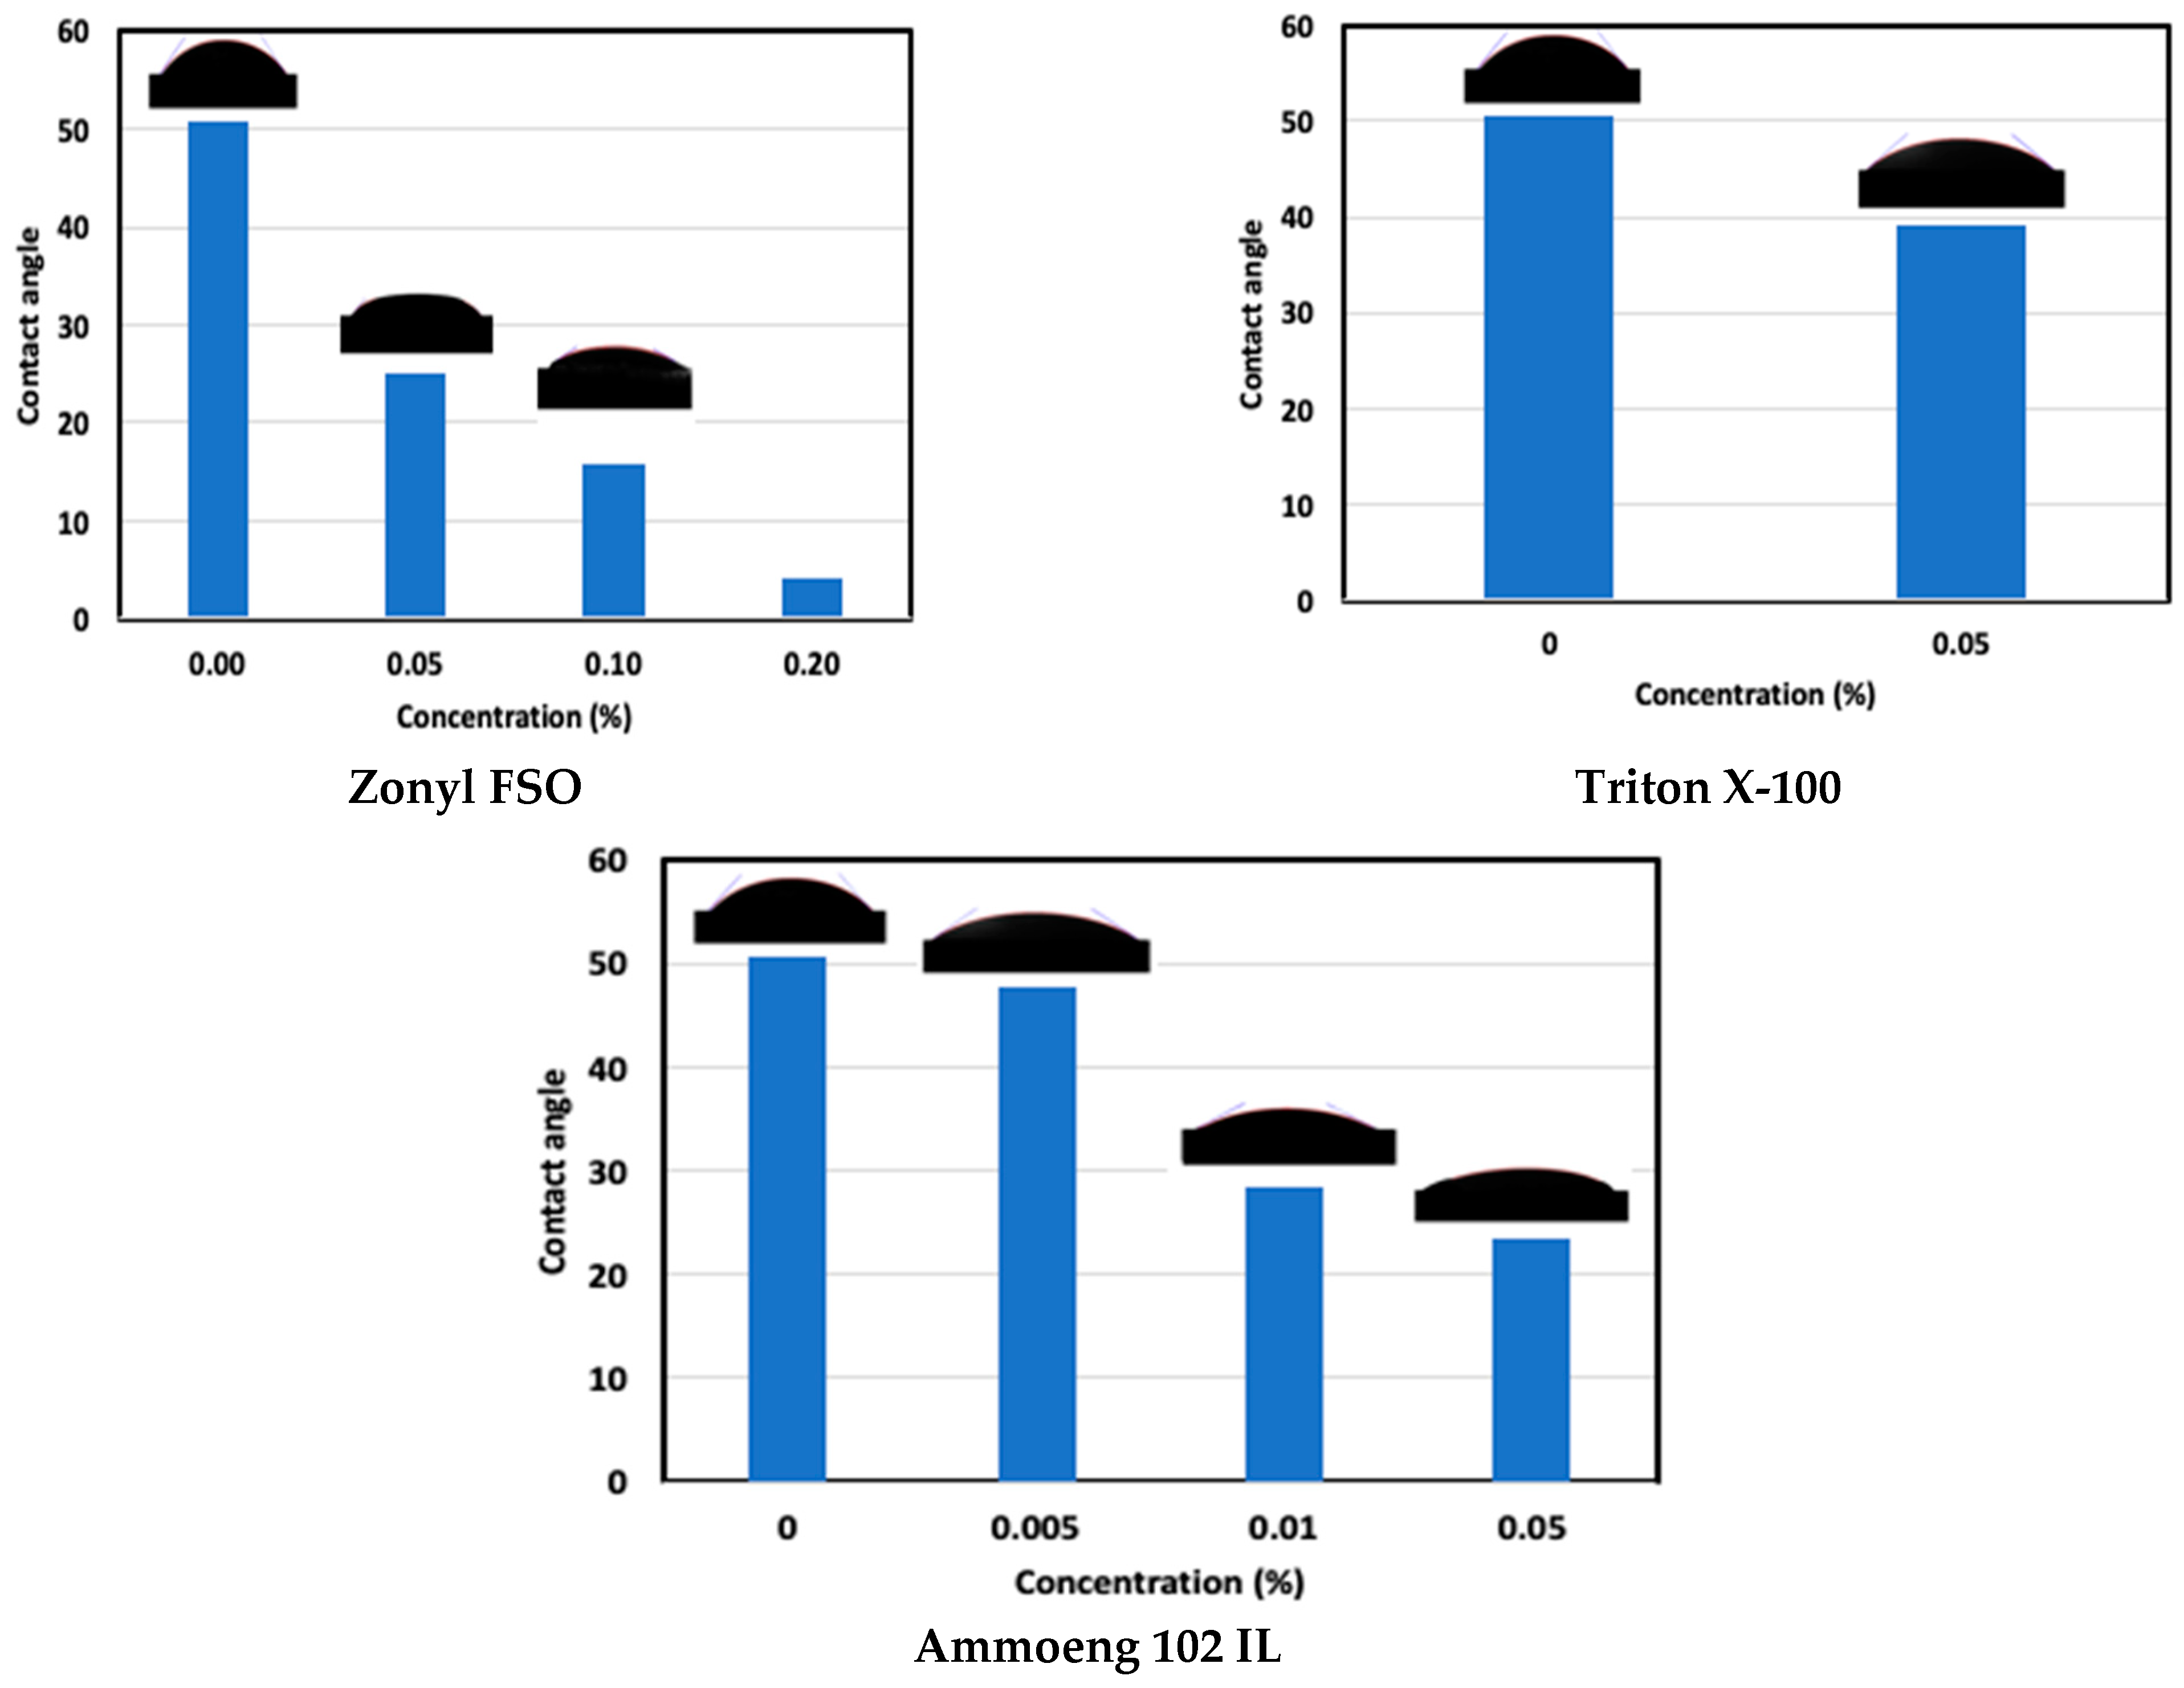
Chemicals that alter rock’s wettability in oil-wet conditions are usually chosen for water blockage removal. On the other hand, surfactants with the tendency to alter rock’s wettability in water-wet conditions are also needed to decrease water’s relative permeability. The efficiency of the selected chemical solutions in altering shale wettability was investigated by measuring the contact angle between chemical solutions and shale rock substrates in the presence of gaseous phase. The contact angle of 40 K ppm seawater in the absence of surfactant was used as a base case for comparison. The measured contact angles for Zonyle FSO, Ammoeng 102 IL and Triton X-100 solutions at different concentrations are plotted in Figure 9. Clearly, the chemicals were able to alter shale’s wettability and as the concentration increased, rock’s wettability shifted to more water-wet conditions at different levels. When exposed to seawater, shale showed water-wet characteristics with a contact angle of 50°, indicating a high shale–brine capillary force. The aqueous solution of Zonyl FSO was the most efficient chemical in terms of wettability alteration, exhibiting a significant drop in contact angle as the concentration increased; a contact angle as low as 2° was recorded at the maximum tested concentration of 0.2%. Ammoeng 102 IL was the second most efficient chemical, with its contact angle dropping to 23° at the maximum investigated concentration of 0.05%. Triton X-100 showed a much smaller drop in contact angle with a value of approximately 39° at the maximum tested concentration of 0.05%.

5. Discussion

The chemicals added to water-based fracturing fluid tend to lower the interfacial/surface tension, promoting the hydrocarbon phase/fracturing fluid solubility and, hence, the removal of the blockage resulting from fracturing fluid entrapment in matrix pores during the flowback stage [13]. Reducing capillary pressure can also help to reduce the imbibition driving force; hence, fracturing fluid invasion depth during the fracturing process leads to easy handling of blockage during the flowback stage [11,14]. Zonyl FSO was able to drastically reduce the surface tension with a mild effect on the contact angle and, consequently, drastically decreased the capillary pressure by 66% from 14,917 psi at 0% concentration to 5072 psi at 0.015%. Such a drop is believed to be effective in causing milder blockages during the fracking stage and facilitating easy removal of any existing blockage at the matrix–fracture interface during the flowback stage. Increasing the surfactant concentration will lower the contact angle and hence offset the capillary pressure drop. Increasing the Zonyl FSO concentration further to the maximum tested concentration of 0.2% had no effect on surface tension but drastically reduced the contact angle to 2ο, rendering shale very strongly water-wet. In such conditions, the drop in capillary pressure promoted by surfactant addition decreased by 54%. Such a drop is still good enough to elevate the blockage during the flowback stage in addition to effectively increasing the gas recovery at the extended production stage due to the increasing gas relative permeability and reduced water relative permeability caused by the wettability being altered to a strongly water-wet condition.
Triton X-100 was the second most effective among the tested chemicals, reporting a capillary pressure drop of 47% when added to fracturing fluid at the maximum tested concentration of 0.05%. On the other hand, Ammoeng 102 IL provided the smallest capillary pressure drop of 19% at a CMC of 0.01%. As the concentration increased to 0.05 wettability, alteration to a more water-wet condition reversed the capillary pressure trend and the drop increased to 26 psi. These values are believed to be insufficient for blockage removal during flowback stage and efficient gas recovery during the extended production stage. Triton X-405 had similar surface tension to Ammoeng 102 IL and its contact angle was not measured, hence the capillary pressure trend was not calculated.
Based on the discussion above, it is suggested to lower the blockage tendency during the fracking process and elevate any existing blockage during the flowback stage by using Zonyl FSO at a CMC where IFT is at its minimum with a higher contact angle. This way, the capillary pressure drop is high enough and with minimal offset that can be imposed by the decrease in the contact angle. As blockage is removed, a higher surfactant concentration can be added in order to alter the shale’s wettability to a strongly water-wet condition, leading to improved gas recovery.

6. Conclusions

Liquid entrapment in tight shale gas can lead to liquid blockage and gas flow restriction. Adding chemicals to hydraulic fracturing fluid can mitigate the water blockage during the flowback stage and boost shale gas productivity during extended production. Several chemicals were screened to investigate and compare their effectiveness as additives to fracturing fluid used for fracking Qusaiba hot shale, a local source rock with good total organic carbon content and mature kerogen of gas-prone type III. The following conclusions are the main findings of this work:
  • The chemicals tested in this work showed excellent tolerance to salinity up to seawater salinity of 40 K ppm and temperature as high as 70 °C.
  • Reductions in the surface tension and contact angle were observed at different levels for all chemicals tested; however, a significant reduction was observed for Zonyl FSO.
  • An effective capillary pressure drop of 66% was observed for Zonyl FSO at CMC. Such a drop can induce a lower invasion depth during the fracking stage and promote liquid blockage removal during the flowback stage.
  • An increase in Zonyl FSO concentration to 0.2% had a minimal effect on surface tension but drastically decreased the contact angle, rendering shale very strongly water-wet. Such a wettability shift induced a smaller capillary pressure drop (54%); however, this could be effective in promoting gas desorption during extended production stage.
  • Triton X-100 at CMC of 0.05% was the second most effective surfactant, as it was able to reduce the capillary pressure by 47%, which is good enough to elevate any liquid blockage throughout the flowback stage.

Author Contributions

Methodology, K.A.A., H.Q.A. and A.M.A.A.; Writing—original draft, A.A.A.; Writing—review & editing, A.O.A. and F.A.A. All authors have read and agreed to the published version of the manuscript.

Funding

This research received no external funding.

Data Availability Statement

The original contributions presented in the study are included in the article, further inquiries can be directed to the corresponding author.

Conflicts of Interest

The authors declare no conflict of interest.

References

  1. Eseme, E.; Urai, J.L.; Krooss, B.M.; Littke, R. Review of Mechanical Properties of Oil Shales: Implications for Exploitation and Basin Modelling. Oil Shale 2007, 24, 159–174. [Google Scholar] [CrossRef]
  2. Pagels, M.; Willberg, D.M.; Edelman, E.; Zagorski, W.; Frantz, J. Quantifying fracturing fluid damage on reservoir rock to optimize production. In Proceedings of the Unconventional Resources Technology Conference, Denver, CO, USA, 12–14 August 2013. Paper URTEC-1578948-MS. [Google Scholar]
  3. Gdanski, R.D.; Fulton, D.D.; Shen, C. Fracture face skin evolution during cleanup. In Proceedings of the Annual Technical Conference and Exhibition, Society of Petroleum Engineers, San Antonio, TX, USA, 24–27 September 2006. Paper SPE-101083-MS. [Google Scholar]
  4. Environmental Resources Management (ERM). Recovered Water Management Study in Shale Wells. 2014. Available online: http://www.iogp.org/wp-content/uploads/2016/10/water-mgmt_OGP_Final_Report_22.pdf (accessed on 7 August 2016).
  5. Bennion, D.B.; Thomas, F.B.; Bietz, R.F. Low Permeability Gas Reservoirs: Problems, Opportunities and Solutions for Drilling, Completion, Stimulation and Production. In Proceedings of the Gas Technology Conference, Calgary, AB, Canada, 28 April–1 May 1996. SPE 35577. [Google Scholar]
  6. Dehghanpour, H.; Lan, Q.; Saeed, Y.; Fei, H.; Qi, Z. Spontaneous imbibition of brine and oil in gas shales: Effect of water adsorption and resulting microfractures. Energy Fuel 2013, 27, 3039. [Google Scholar] [CrossRef]
  7. Sun, Y.; Bai, B.; Wei, M. Microfracture and Surfactant Impact on Linear Cocurrent Brine Imbibition in Gas- Saturated Shale. Energy Fuel 2015, 29, 1438. [Google Scholar] [CrossRef]
  8. Phan, T.; Kazempour, M.; Nguyen, D.; Champion, N. Treating liquid banking problem to increase shale gas wells productivity. In Proceedings of the International Conference and Exhibition on Formation Damage Control, Society of Petroleum Engineers, Lafayette, LA, USA, 7–9 February 2018. Paper SPE-189523-MS. [Google Scholar]
  9. Kim, J.; Zhang, H.; Sun, H.; Li, B.; Carman, P. Choosing surfactants for the Eagle Ford shale formation: Guidelines for maximizing flowback and initial oil recovery. In Proceedings of the Low Perm Symposium, Society of Petroleum Engineers, Denver, CO, USA, 5–6 May 2016. Paper SPE-180227-MS. [Google Scholar]
  10. Kumar, V.; Pope, G.A.; Sharma, M.M. Improving the gas and condensate relative permeability using chemical treatments. In Proceedings of the Gas Technology Symposium, Calgary, AB, Canada, 15–18 May 2006. Paper SPE-100529-MS. [Google Scholar]
  11. Wijaya, N.; Sheng, J.J. Effect of desiccation on shut-in benefits in removing water blockage in tight water-wet cores. Fuel 2019, 244, 314–323. [Google Scholar] [CrossRef]
  12. Paktinat, J.; Williams, C.; Pinkhouse, J.A.; Clark, G.A.; Penny, G.S. Case histories: Damage preventions by leak off control of fracturing fluids in Appalachian gas reservoirs. In Proceedings of the International Symposium and Exhibition on Formation Damage Control, Society of Petroleum Engineers, Lafayette, LA, USA, 15–17 February 2006. Paper SPE-98145-MS. [Google Scholar]
  13. Xu, L.; Fu, Q. Ensuring better well stimulation in unconventional oil and gas formations by optimizing surfactant additives. In Proceedings of the Western Regional Meeting, Society of Petroleum Engineers, Bakersfield, CA, USA, 21–23 March 2012. Paper SPE-154242-MS. [Google Scholar]
  14. Liang, T.; Achour, S.H.; Longoria, R.A.; DiCarlo, D.A.; Nguyen, Q.P. Flow physics of how surfactants can reduce water blocking caused by hydraulic fracturing in low permeability reservoirs. J. Pet. Sci. Eng. 2017, 157, 631–642. [Google Scholar] [CrossRef]
  15. Zhou, L.; Das, S.; Ellis, B.R. Effect of surfactant adsorption on the wettability alteration of gas-bearing shales. Environ. Eng. Sci. 2016, 33, 766–777. [Google Scholar] [CrossRef]
  16. Hussien, O.S.; Elraies, K.A.; Almansour, A.; Husin, H.; Shuhili, J.A. Beyond fracking: Enhancement of shale gas desorption via surface tension reduction and wettability alteration. J. Nat. Gas Sci. Eng. 2018, 57, 322–330. [Google Scholar] [CrossRef]
  17. Hussien, O.S.; Elraies, K.A.; Almansour, A.; Husin, H.; Belhaj, A.; Ern, L. Experimental study on the use of surfactant as a fracking fluid additive for improving shale gas productivity. J. Pet. Sci. Eng. 2019, 183, 106426. [Google Scholar] [CrossRef]
  18. Paktinat, J.; Pinkhouse, J.A.; Stoner, W.P.; Williams, C.; Carder, G.A.; Penny, G.S. Case histories: Post-frac fluid recovery improvements of Appalachian Basin gas reservoirs. In Proceedings of the Eastern Regional Meeting, Society of Petroleum Engineers, Morgantown, WV, USA, 14–16 September 2005. Paper SPE-97365-MS. [Google Scholar]
  19. Zelenev, A.S.; Ellena, L. Microemulsion technology for improved fluid recovery and enhanced core permeability to gas. In Proceedings of the 8th European Formation Damage Conference, Society of Petroleum Engineers, Scheveningen, The Netherlands, 27–29 May 2009. Paper SPE-122109-MS. [Google Scholar]
  20. Agee, D.; Yudho, A.; Schafer, L.; Thouvenin, E.; Grant, G.; Garnier, A.; Wijanarko, A. Post-fracturing fluid recovery enhancement with microemulsion. In Proceedings of the International Symposium and Exhibition on Formation Damage Control, Society of Petroleum Engineers, Lafayette, LA, USA, 10–12 February 2010. Paper SPE-128098-MS. [Google Scholar]
  21. Sharma, M.K.; Shah, D.O. Introduction to Macro and Microemulsions; ACS Publications: Washington, DC, USA, 1985. [Google Scholar] [CrossRef]
  22. Katz, C.A.; Calzola, Z.J.; Mbindyo, J.K. Structure and solvent properties of microemulsions. J. Chem. Educ. 2008, 85, 263. [Google Scholar] [CrossRef]
  23. Rostami, A.; Nasr-El-Din, H.A. Microemulsion vs. surfactant assisted gas recovery in low permeability formations with water blockage. In Proceedings of the Western North American and Rocky Mountain Joint Meeting, Society of Petroleum Engineers, Denver, CO, USA, 16–18 April 2014. Paper SPE-169582-MS. [Google Scholar]
  24. Dong, B.; Meng, M.; Qiu, Z.; Lu, Z.; Zhang, Y.; Zhong, H. Formation damage prevention using microemulsion in tight sandstone gas reservoir. J. Pet. Sci. Eng. 2019, 173, 101–111. [Google Scholar] [CrossRef]
  25. Penny, G.S.; Pursley, J.T. Field studies of drilling and completion fluids to minimize damage and enhance gas production in unconventional reservoirs. In Proceedings of the European Formation Damage Conference, Society of Petroleum Engineers, Scheveningen, The Netherlands, 30 May–1 June 2007. Paper SPE-107844-MS. [Google Scholar]
  26. Wijaya, P.N.; Sheng, J.J. Mitigating near-fracture blockage and enhancing oil recovery in tight reservoirs by adding surfactants in hydraulic fracturing fluid. J. Pet. Sci. Eng. 2020, 185, 106611. [Google Scholar] [CrossRef]
  27. Jadwa Investment Report. Natural Gas and The Vision 2030. 2016. Available online: http://argaamplus.s3.amazonaws.com/0dad8cce-b3f5-4f13-a7f5-7f292e7f8f1b.pdf (accessed on 1 October 2016).
  28. Holditch, S.A. Tight Gas Sands. J. Pet. Technol. 2006, 58, 86–93. [Google Scholar] [CrossRef]
  29. Rogner, H. An assessment of world hydrocarbon resources. Annu. Rev. Energy Environ. 1996, 22, 217–262. [Google Scholar] [CrossRef]
  30. Hakimi, M.H.; Wan, H.A.; Alqudah, M.; Makeen, Y.M.; Mustapha, K.A. Organic geochemical and petrographic characteristics of the oil shales in the Lajjun area, Central Jordan: Origin of organic matter input and preservation conditions. Fuel 2016, 181, 34–45. [Google Scholar] [CrossRef]
  31. Vaslet, D.; Janjou, D.; Robelin, C.; Al-Muallem, M.S.; Halawani, M.A.; Brosse, J.M.; Brecton, J.P.; Courbouleix, S.; Roobol, M.J.; Dagain, J. Explanatory Notes of the Geologic Map of the Tayma Quadrangle, Sheet 27C, International Index NG-37-2; Saudi Geological Survey: Jeddah, Saudi Arabia, 1994. [Google Scholar]
  32. Cole, G.A.; Abu-Ali, M.A.; Aoudeh, S.M.; Carrigan, W.J.; Chen, H.H.; Colling, E.L.; Gwathney, W.J.; Al-Hajji, A.A.; Halpern, H.I.; Jones, P.J.; et al. Organic geochemistry of the Paleozoic petroleum system of Central Saudi Arabia. Energy Fuels 1994, 8, 1425–1442. [Google Scholar] [CrossRef]
  33. Ackerman, W.C. Saudi Arabia’s Natural Gas Aspirations: The Domestic Outlook. Middle East Institute, 9 February 2022. [Google Scholar]
  34. Jones, P.J.; Stump, T.E. Depositional and tectonic setting of the lower Silurian hydrocarbon source rock facies, Central Saudi Arabia. AAPG Bull. 1999, 83, 314–332. [Google Scholar]
  35. Mahmoud, M.D.; Vaslet, D.; Husseini, M.I. The lower Silurian Qusaiba formation of Saudi Arabia. An important hydrocarbon source rock. Am. Assoc. Petrol. Geol. Bull. 1992, 76, 1491–1506. [Google Scholar]
  36. Abu-Ali, M.A.; Rudkiewicz, J.-L.L.; McGillivray, J.G.; Behar, F. Paleozoic petroleum system of Central Saudi Arabia. Geo Arab. 1999, 4, 321–336. [Google Scholar] [CrossRef]
  37. Slatt, R.M.; Rodriguez, N.D. Comparative sequence stratigraphy and organic geochemistry of gas shales: Commonality or coincidence. J. Nat. Gas Sci. Eng. 2012, 8, 68–84. [Google Scholar] [CrossRef]
  38. Konert, G.; Afifi, A.M.; Al-Hajri, S.A.; Droste, H.J. Paleozoic stratigraphy and hydrocarbon habitat of the Arabian Plate. AAPG Bull. 1999, 83, 1320–1336. [Google Scholar]
  39. Arouri, R.K.; Van Lear, J.P.; Jenden, J.D.; Carrigan, J.W.; Al-Hajji, A.A. Controls on hydrocarbon properties in Paleozoic petroleum system in Saudi Arabia: Exploration and development implications. AAPG Bull. 2010, 94, 163–188. [Google Scholar] [CrossRef]
  40. Faqira, M.; Bhullar, A.; Abdelghayoum, A. Silurian Qusaiba Shale Play: Distribution and Characteristics. In Proceedings of the AAPG Conference, Austin, TX, USA, 5–10 December 2010. [Google Scholar]
  41. AlQuraishi, A.; AlLaboun, A.; AlGhamdi, F.; AlHussinan, S. Silurian Qusaiba shale: Petrophysical, mineralogical and geochemical analysis. J. Pet. Sci. Eng. 2020, 192, 107209. [Google Scholar] [CrossRef]
  42. Laboun, A.A. Tectono-stratigraphy of the exposed Silurian deposits in Arabia. Arab. J. Geosci. 2009, 2, 119–131. [Google Scholar] [CrossRef]
  43. Aboulresh, M.O. An integrated characterization of the porosity in Qusaiba shale, Saudi Arabia. J. Petrol. Sci. Eng. 2017, 149, 75–78. [Google Scholar] [CrossRef]
  44. Sun, Y.Z.; Sun, J.P.; Zhang, H.J.; Liu, L.F. Recovery of origin organic parameters of the outcropping source rocks from Southern China. Energy Explor. Exploit. 2002, 20, 365–370. [Google Scholar] [CrossRef]
  45. Rossen, W.R. Foams in enhanced oil recovery. In Foams: Theory, Measurements and Applications; Rossen, W.R., Prud'homme, R.K., Khan, S., Eds.; Marcel Dekker Inc.: New York, NY, USA, 1996; pp. 413–464. [Google Scholar]
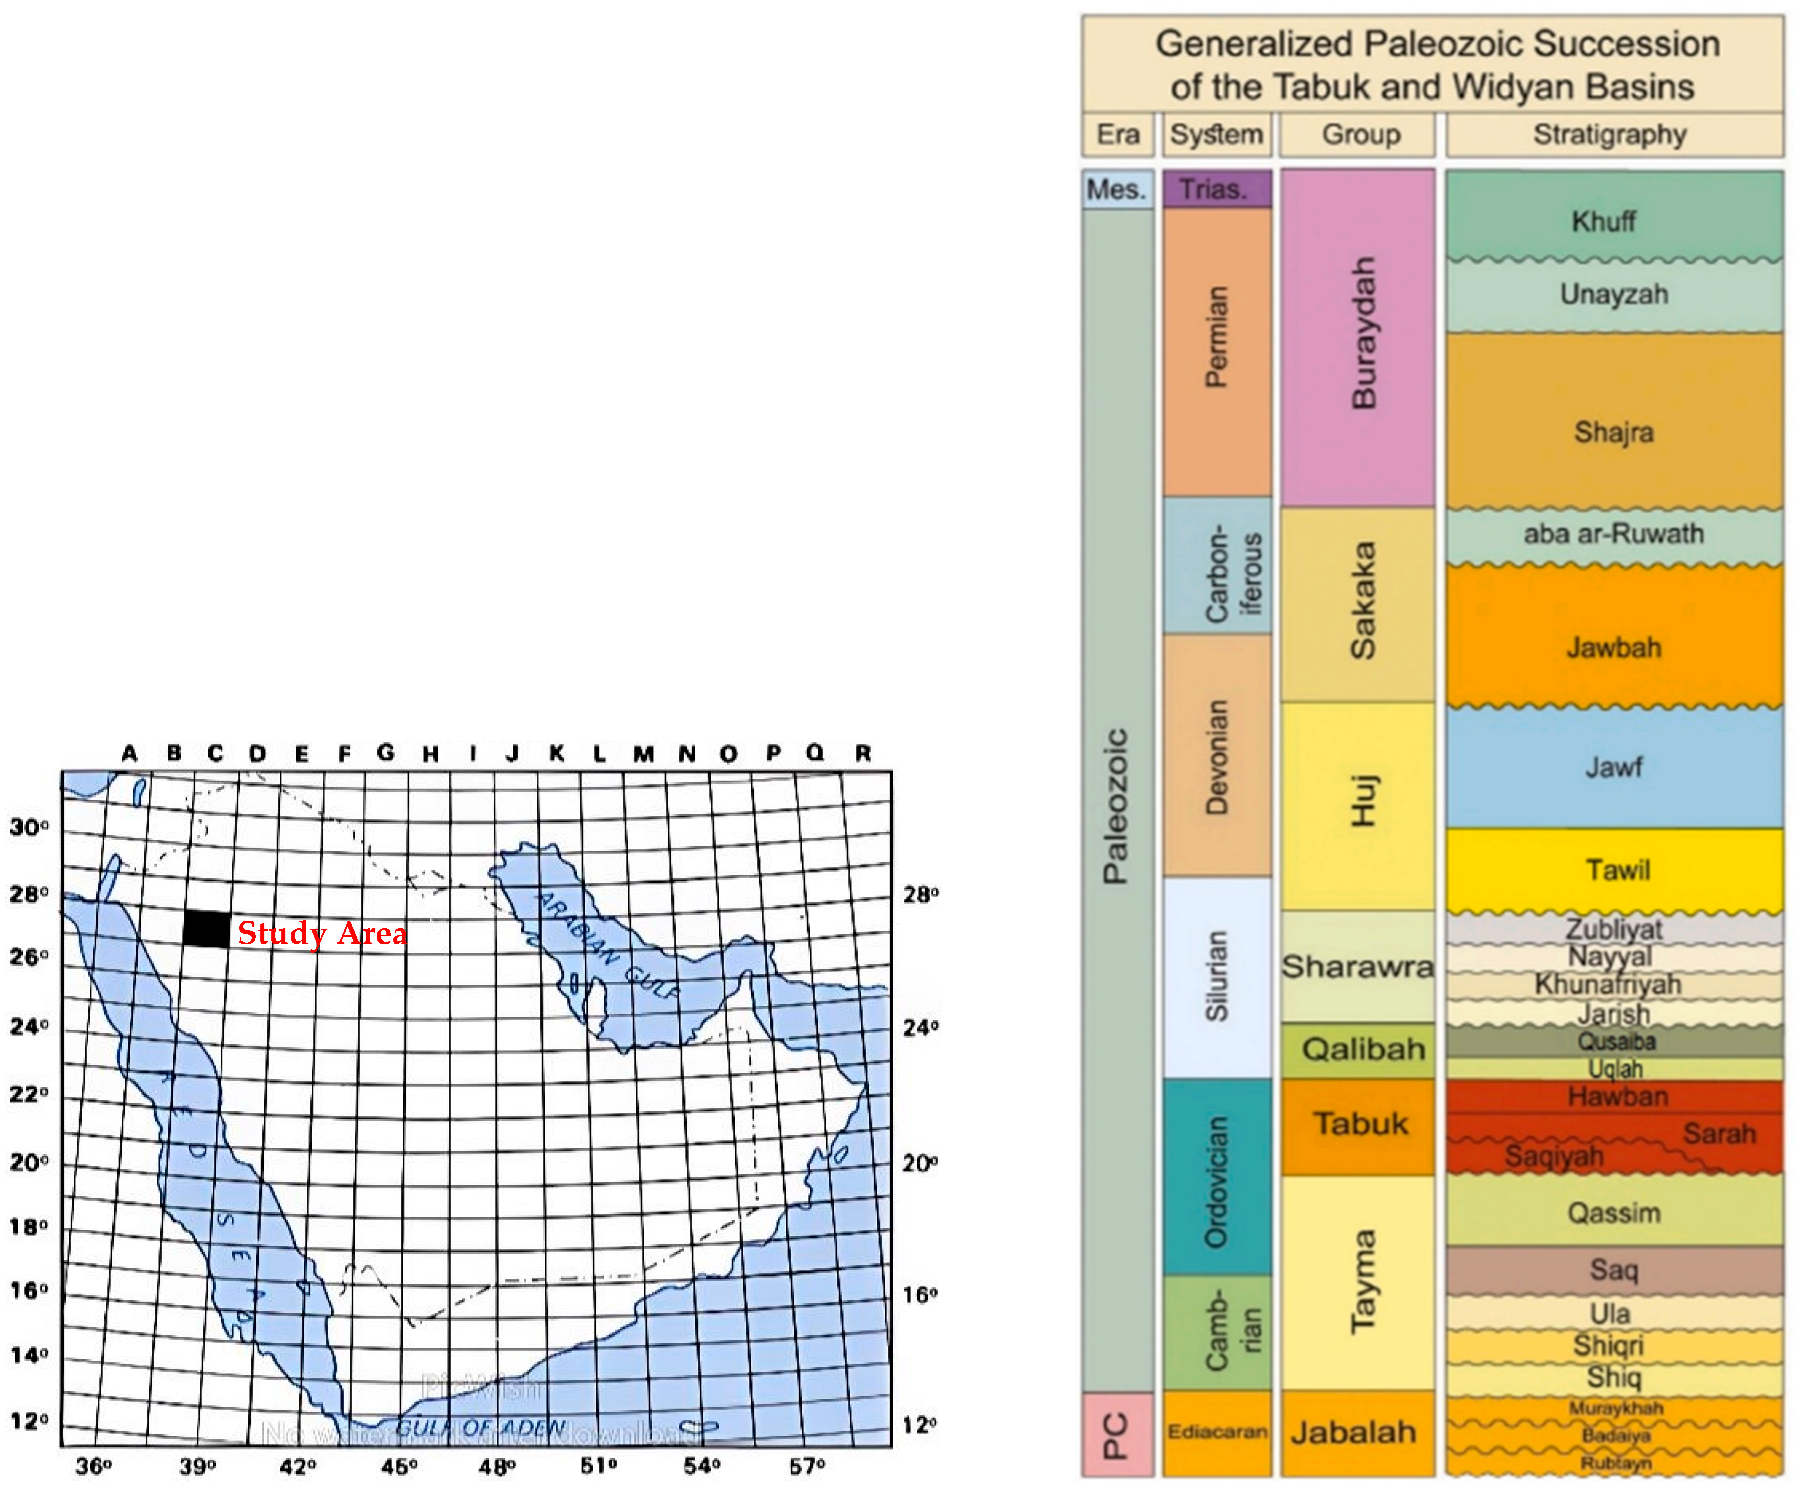
Figure 1. Map of the outcrop sampling location and the generalized tectono-stratigraphic succession of the Paleozoic Tabuk and Widyan basins showing the Qalibah group of Uqlah and Qusaiba Formations [41,42].
Energies 17 05025 g001
Figure 2. Pictures of solutions tested before and after heating for two weeks.
Energies 17 05025 g002
Figure 3. Mineralogical analysis of Qusaiba shale [41].
Energies 17 05025 g003
Figure 4. Schematic diagram of surface tension and wettability experiment setup.
Energies 17 05025 g004
Figure 5. Pore size distribution of Qusaiba shale.
Energies 17 05025 g005
Figure 6. Qusaiba shale permeability using pressure decay technique.
Energies 17 05025 g006
Figure 7. Drop images captured of different chemicals solutions/methane gas at different concentrations.
Energies 17 05025 g007
Figure 8. Surface tension of different chemicals solutions/methane gas at different concentrations.
Energies 17 05025 g008
Figure 9. Contact angle measurements of three chemical solutions at different concentrations.
Energies 17 05025 g009
Table 1. Properties and chemical analysis of sea water.
pH7.1Turbidity
NTU
2.21Ca
mg/L
766K
mg/L
810NO−3
mg/L
37
Density gm/cc1.0256Total Alkalinity174Mg
mg/L
2648Cl
mg/L
36,585F
mg/L
2.19
Viscosity
cp
1.08HCO−3
mg/L
212Na
mg/L
22,353S
mg/L
5015TDS mg/L68,358
Table 2. Chemicals’ commercial names, types, molecular formulas and chemical structures.
ChemicalZonyl FSOTriton X-100Triton X-405Ammoeng IL
TypeAnionicNonionicNonionic
Molecular FormulaAmmonium bis [2-(perfluoroalkyl) ethyl] phosphate 4Octylphenol EthoxylateOctylphenol EthoxylateTetra-alkyl ammonium sulfate
Chemical StructureEnergies 17 05025 i001Energies 17 05025 i002
R = octyl (C8)
x = 9.5 (avg)
Energies 17 05025 i003
R = octyl (C8)
x = 35 (avg)
Energies 17 05025 i004
Table 3. XRF elemental oxides of Qusaiba shale in weight % [41].
SampleAl2O3SiO2SO2K2OCaOTiO2Fe2O3
QS18.6732.744.855.6823.312.6522.10
QS26.9833.639.654.8812.852.3429.66
Disclaimer/Publisher’s Note: The statements, opinions and data contained in all publications are solely those of the individual author(s) and contributor(s) and not of MDPI and/or the editor(s). MDPI and/or the editor(s) disclaim responsibility for any injury to people or property resulting from any ideas, methods, instructions or products referred to in the content.