
A Study on the Measurement of Regional Energy Consumption Efficiency and Decomposition of Its Influencing Factors in China: New Evidence for Achieving SDGs

Abstract
1. Introduction
2. Literature Review
2.1. The Influencing Factors of Energy Consumption Efficiency
2.2. Energy Consumption Efficiency Evaluation and DEA Method
2.3. LMDI Method and Driving Effect Analysis
3. Methods
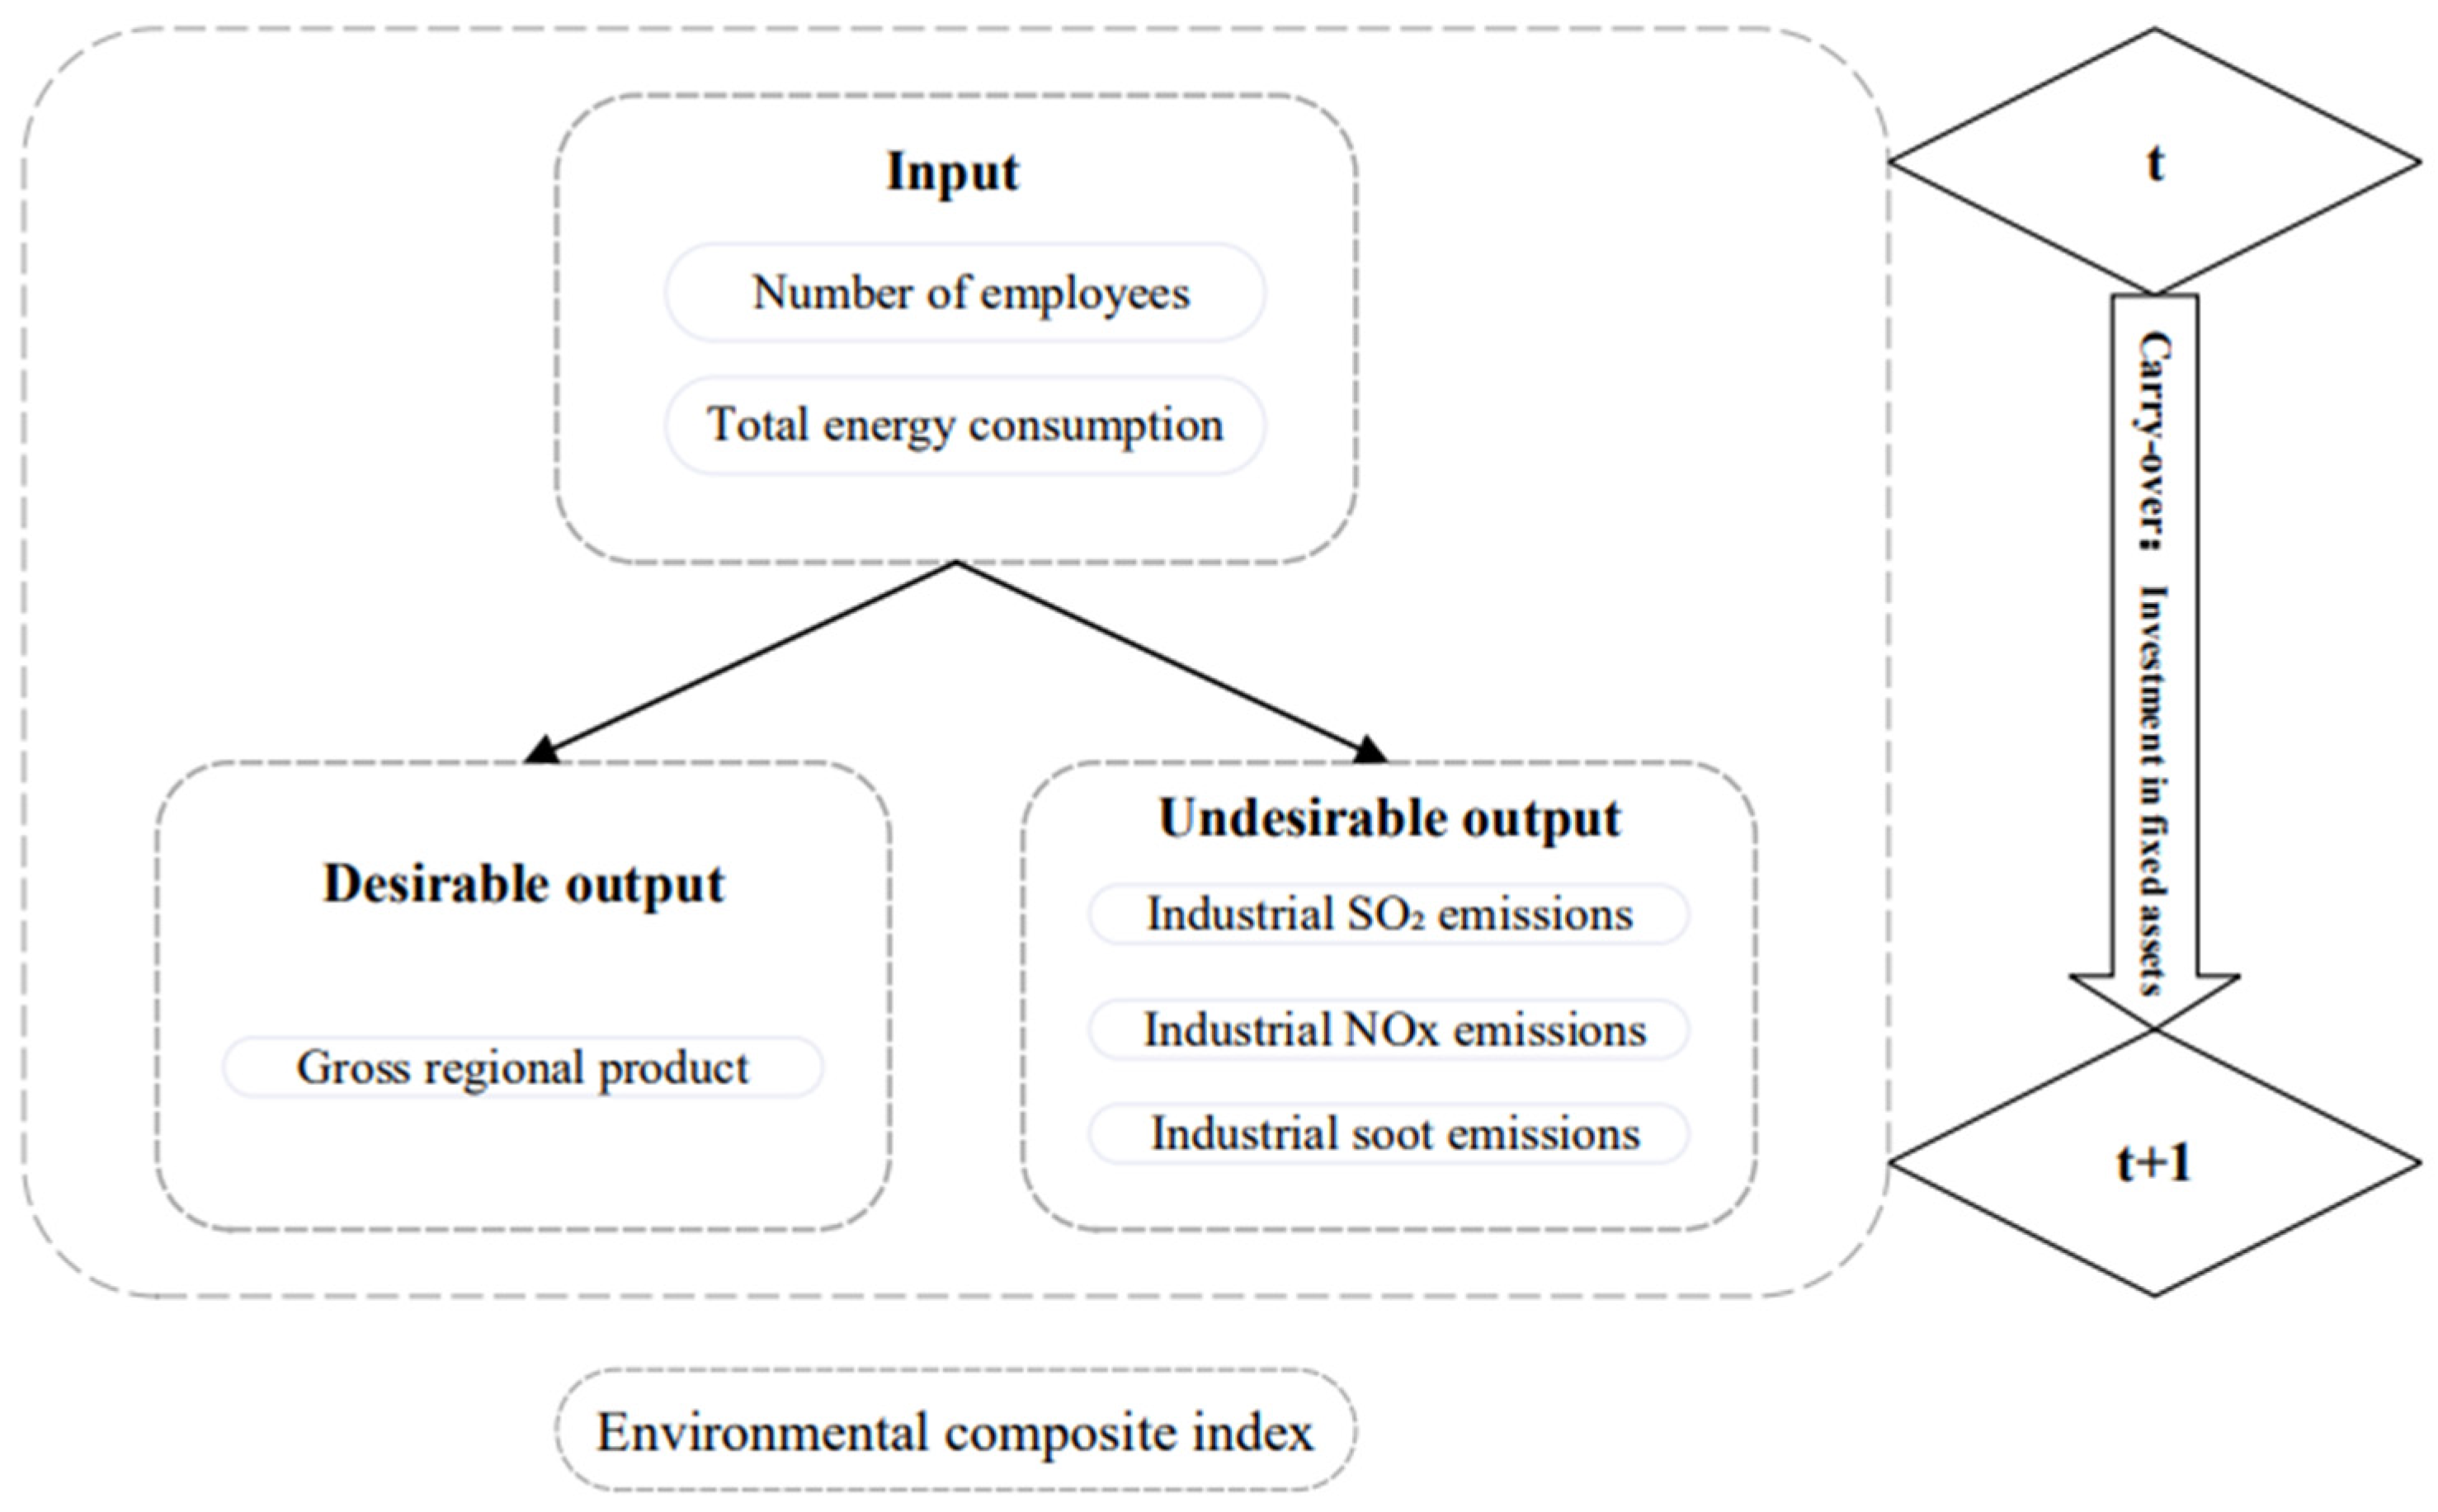
3.1. EBM–DEA Model
3.2. LMDI
4. Results
4.1. Data Description
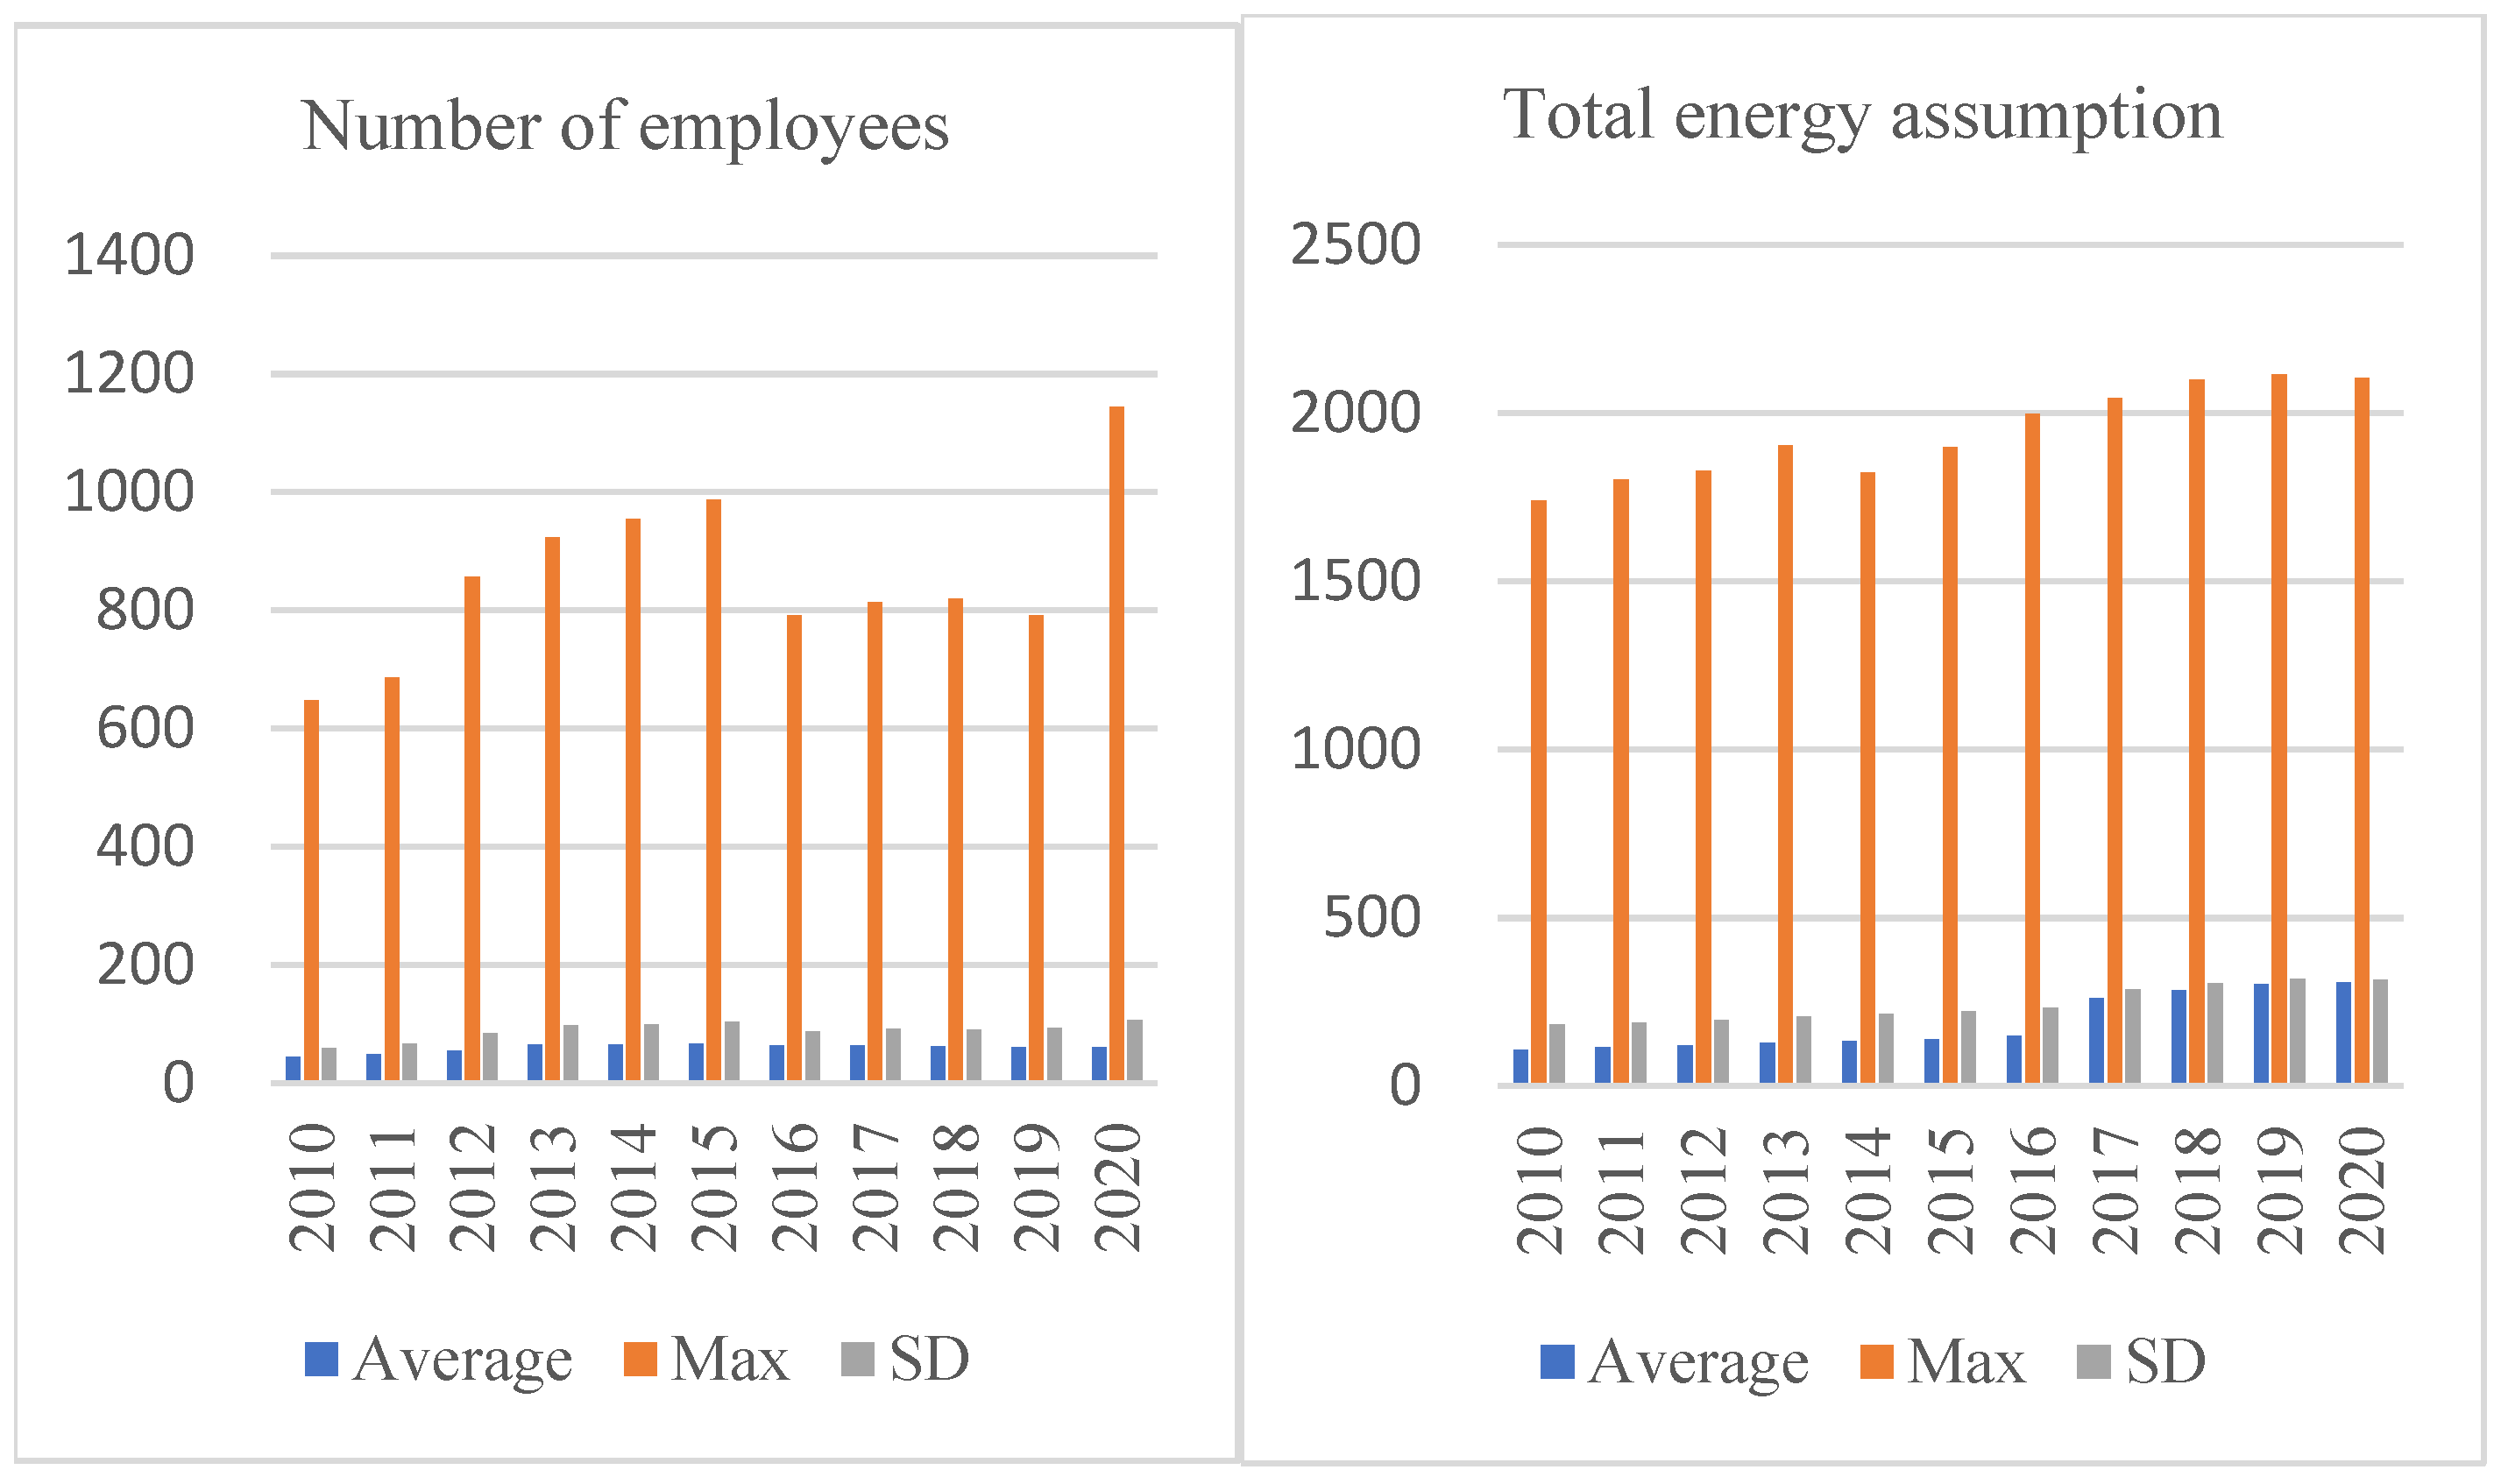
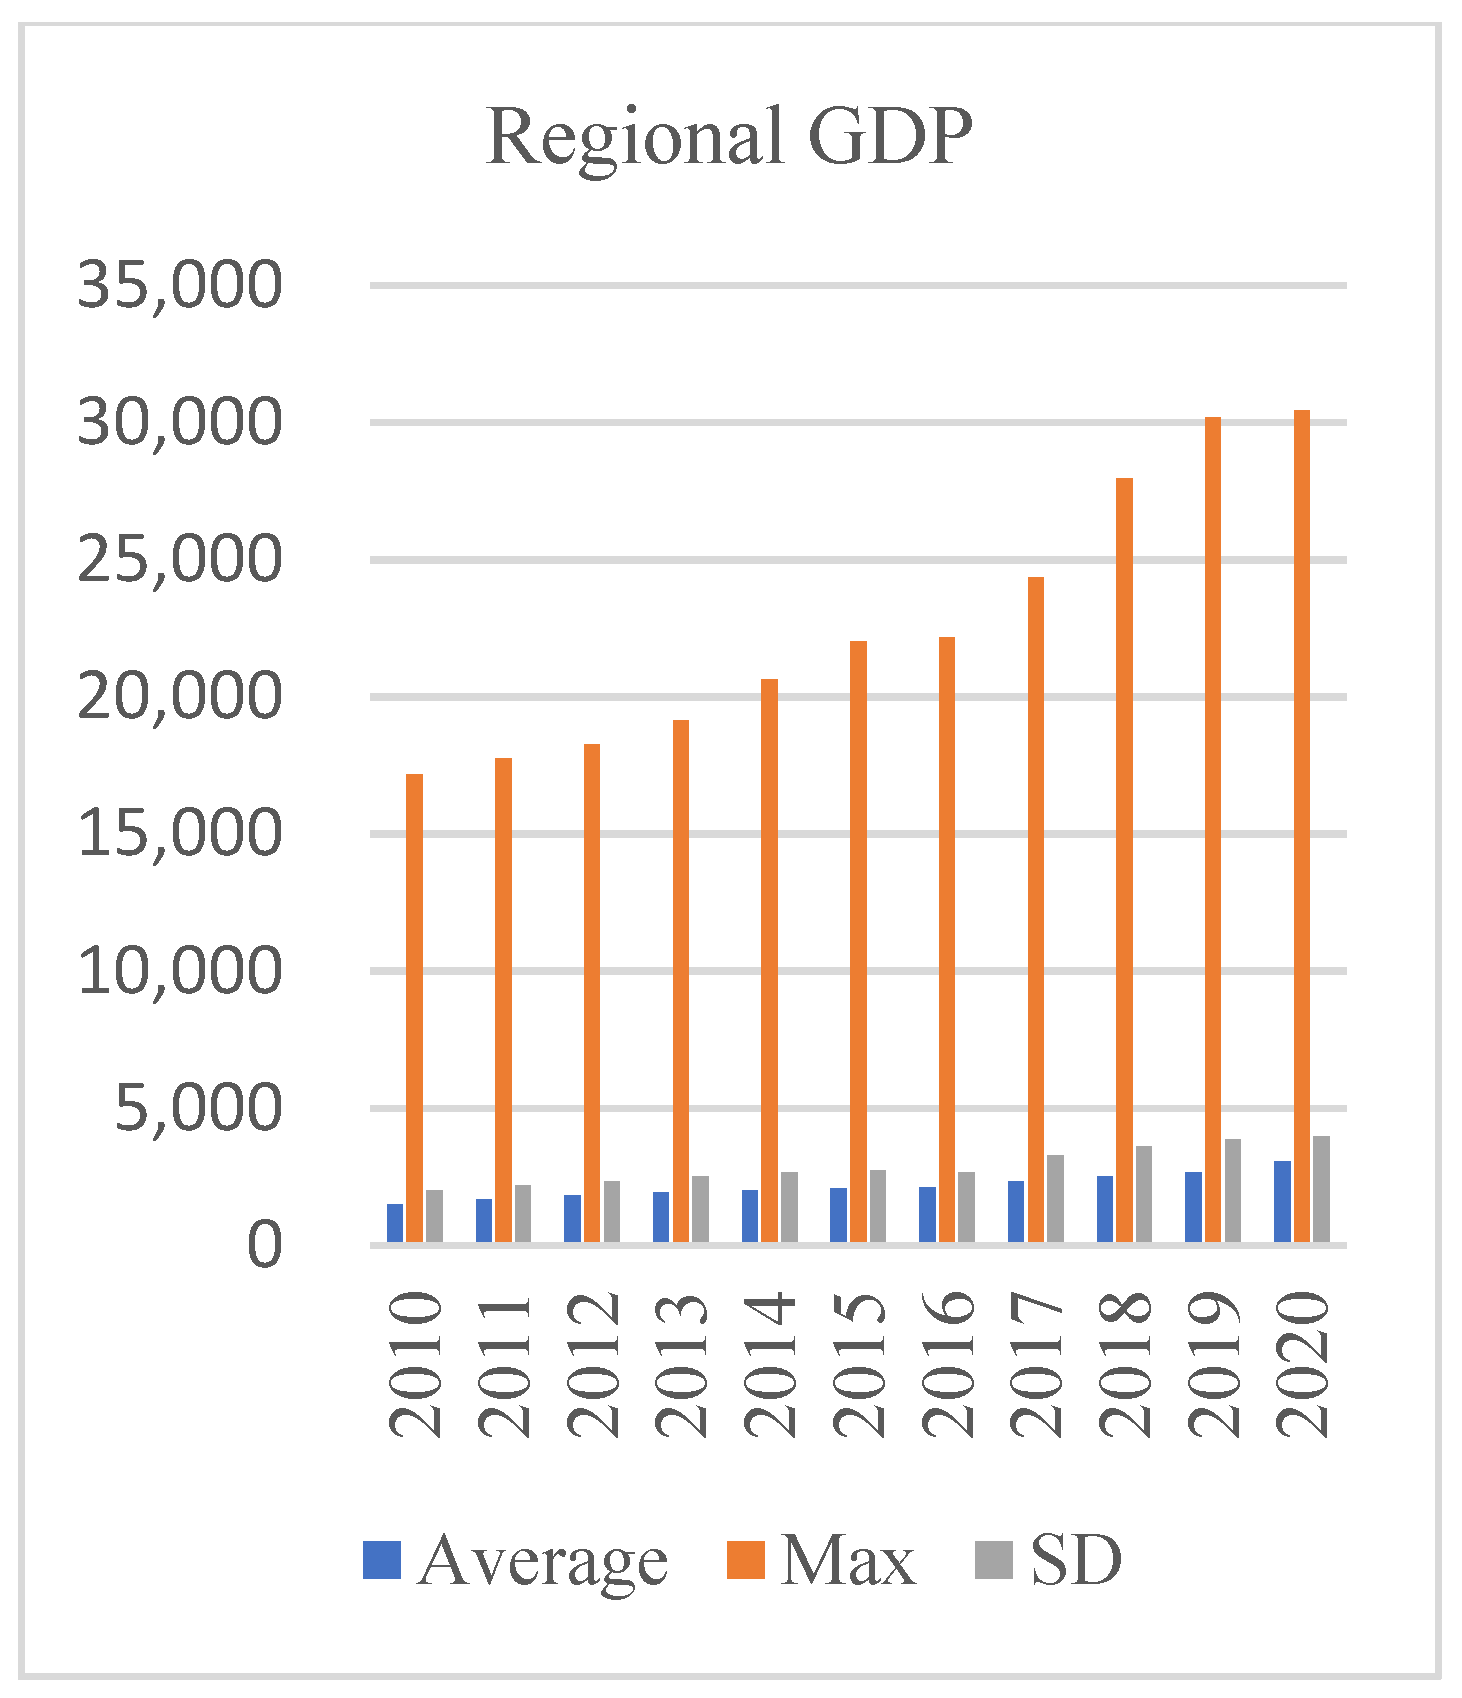
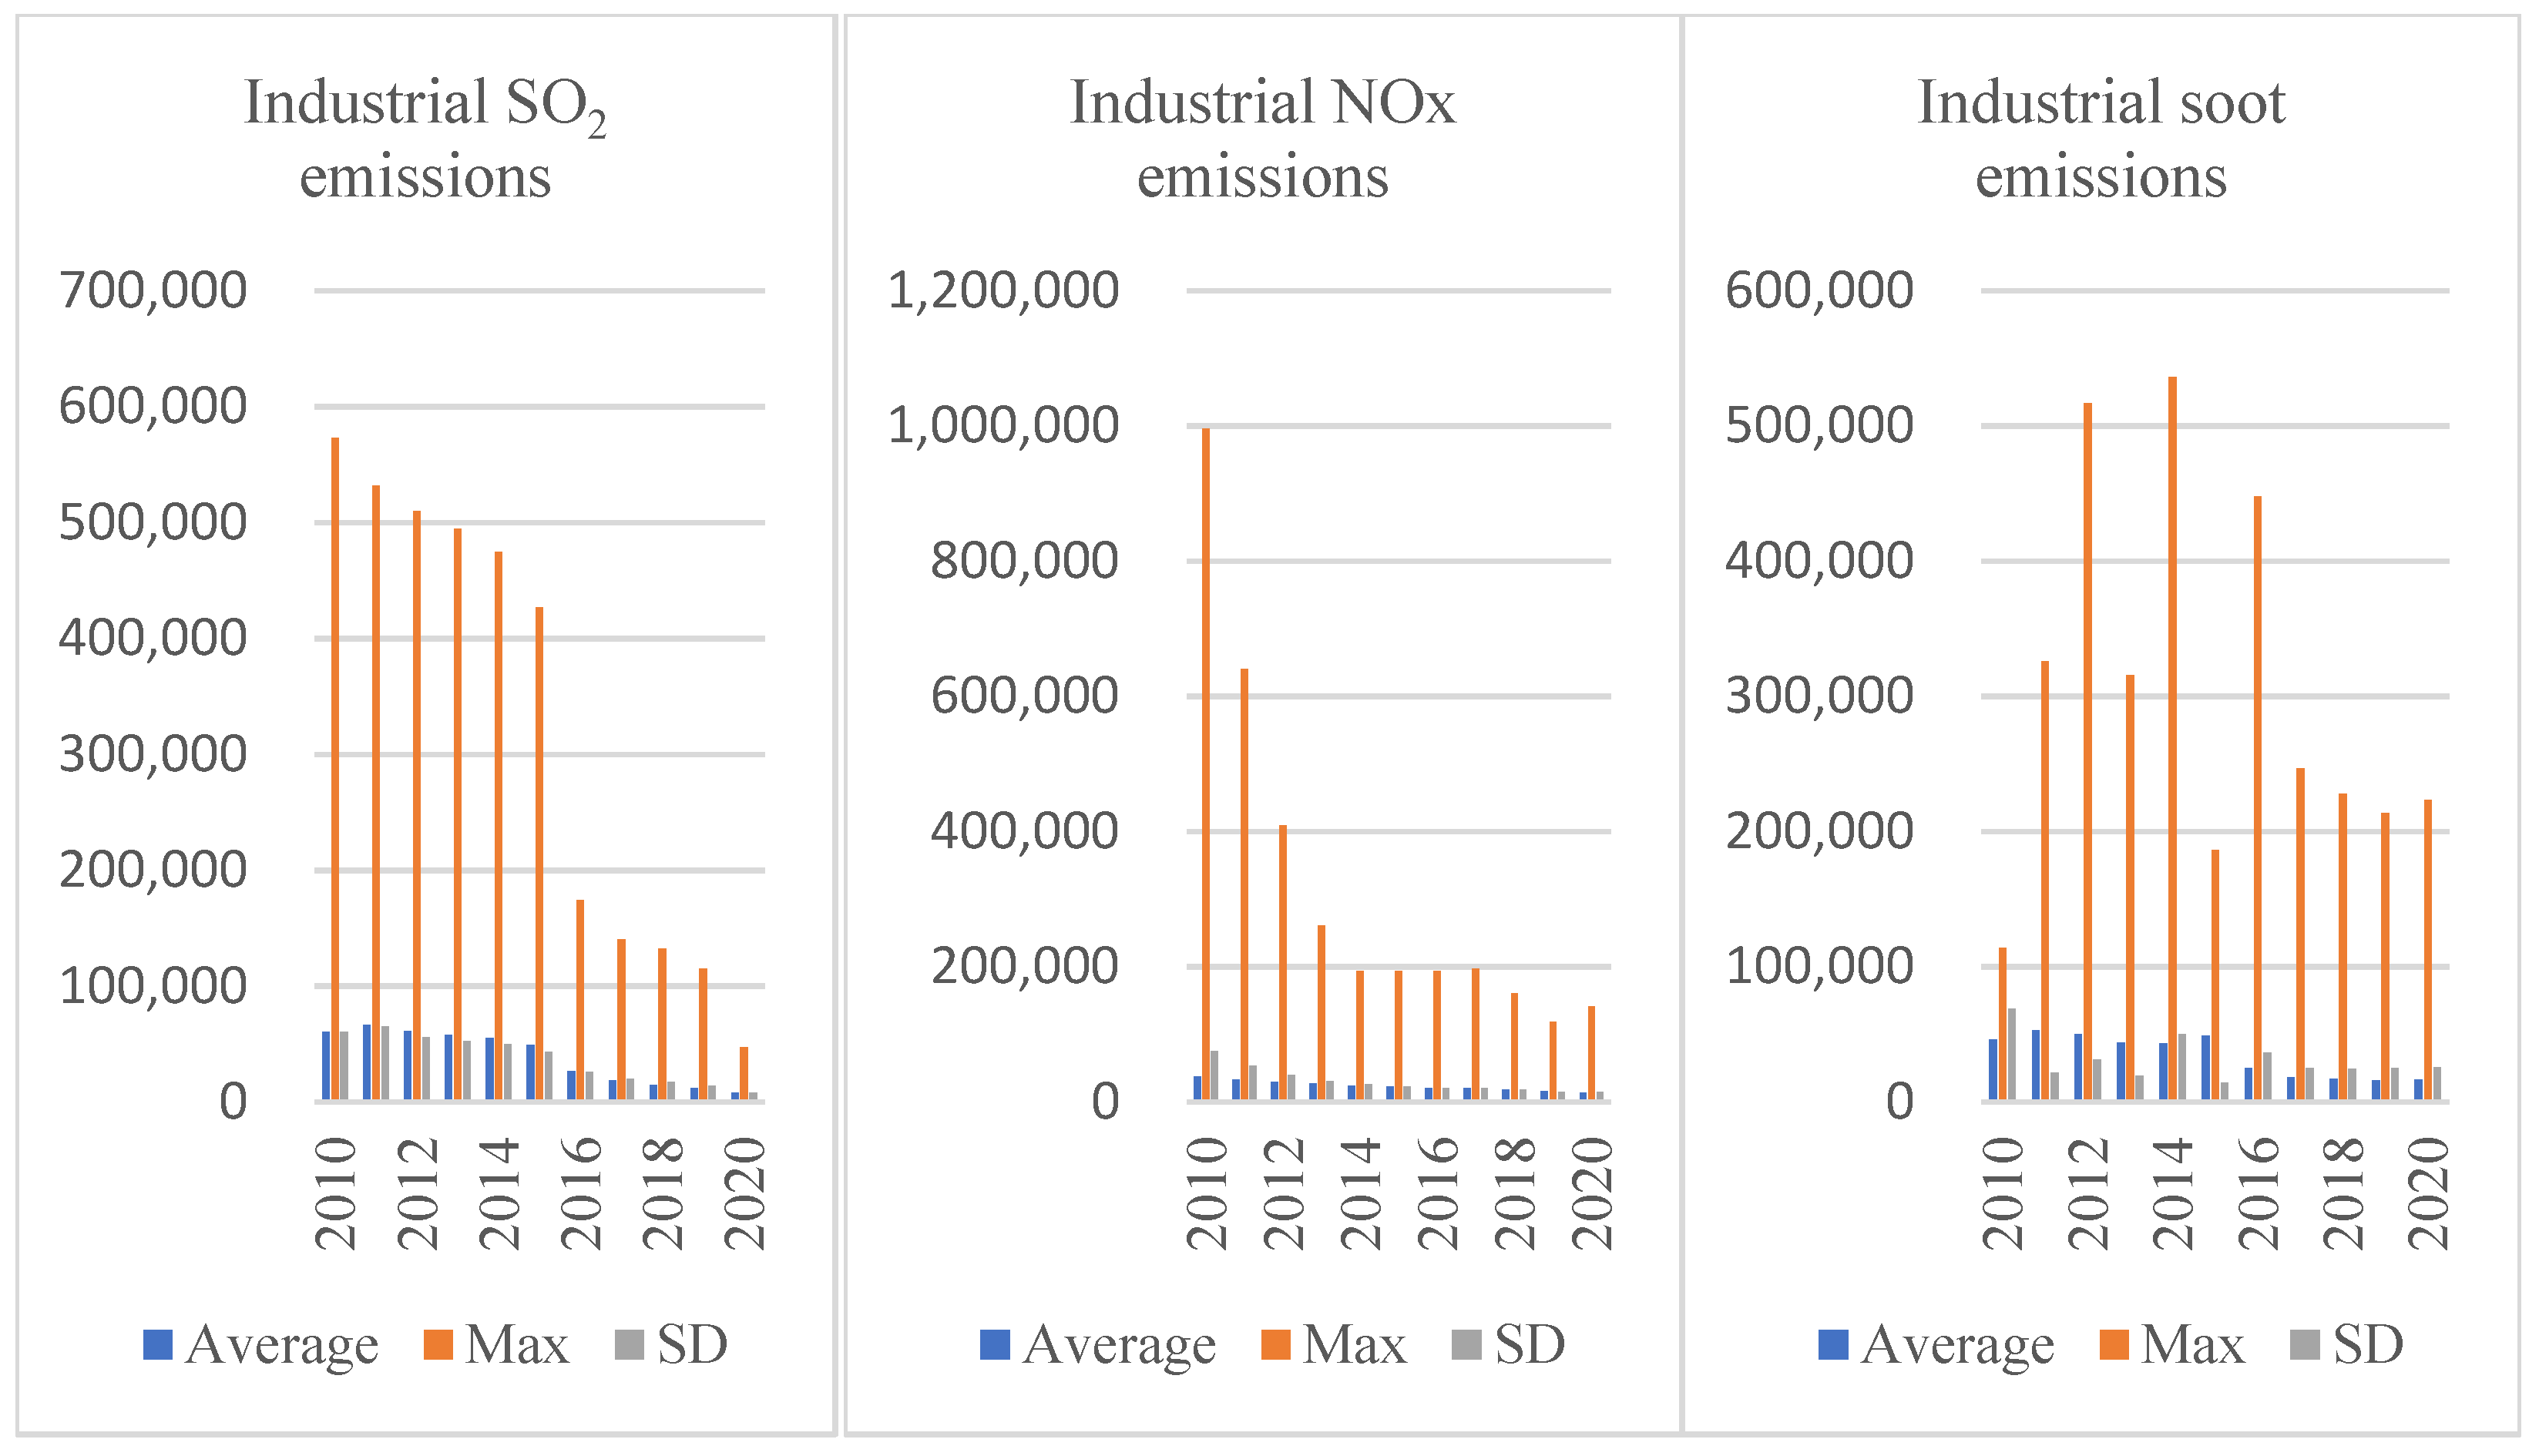
4.2. Descriptive Statistics
4.3. Analysis of Energy Consumption Efficiency in Cities of China
4.3.1. Total Efficiency Analysis
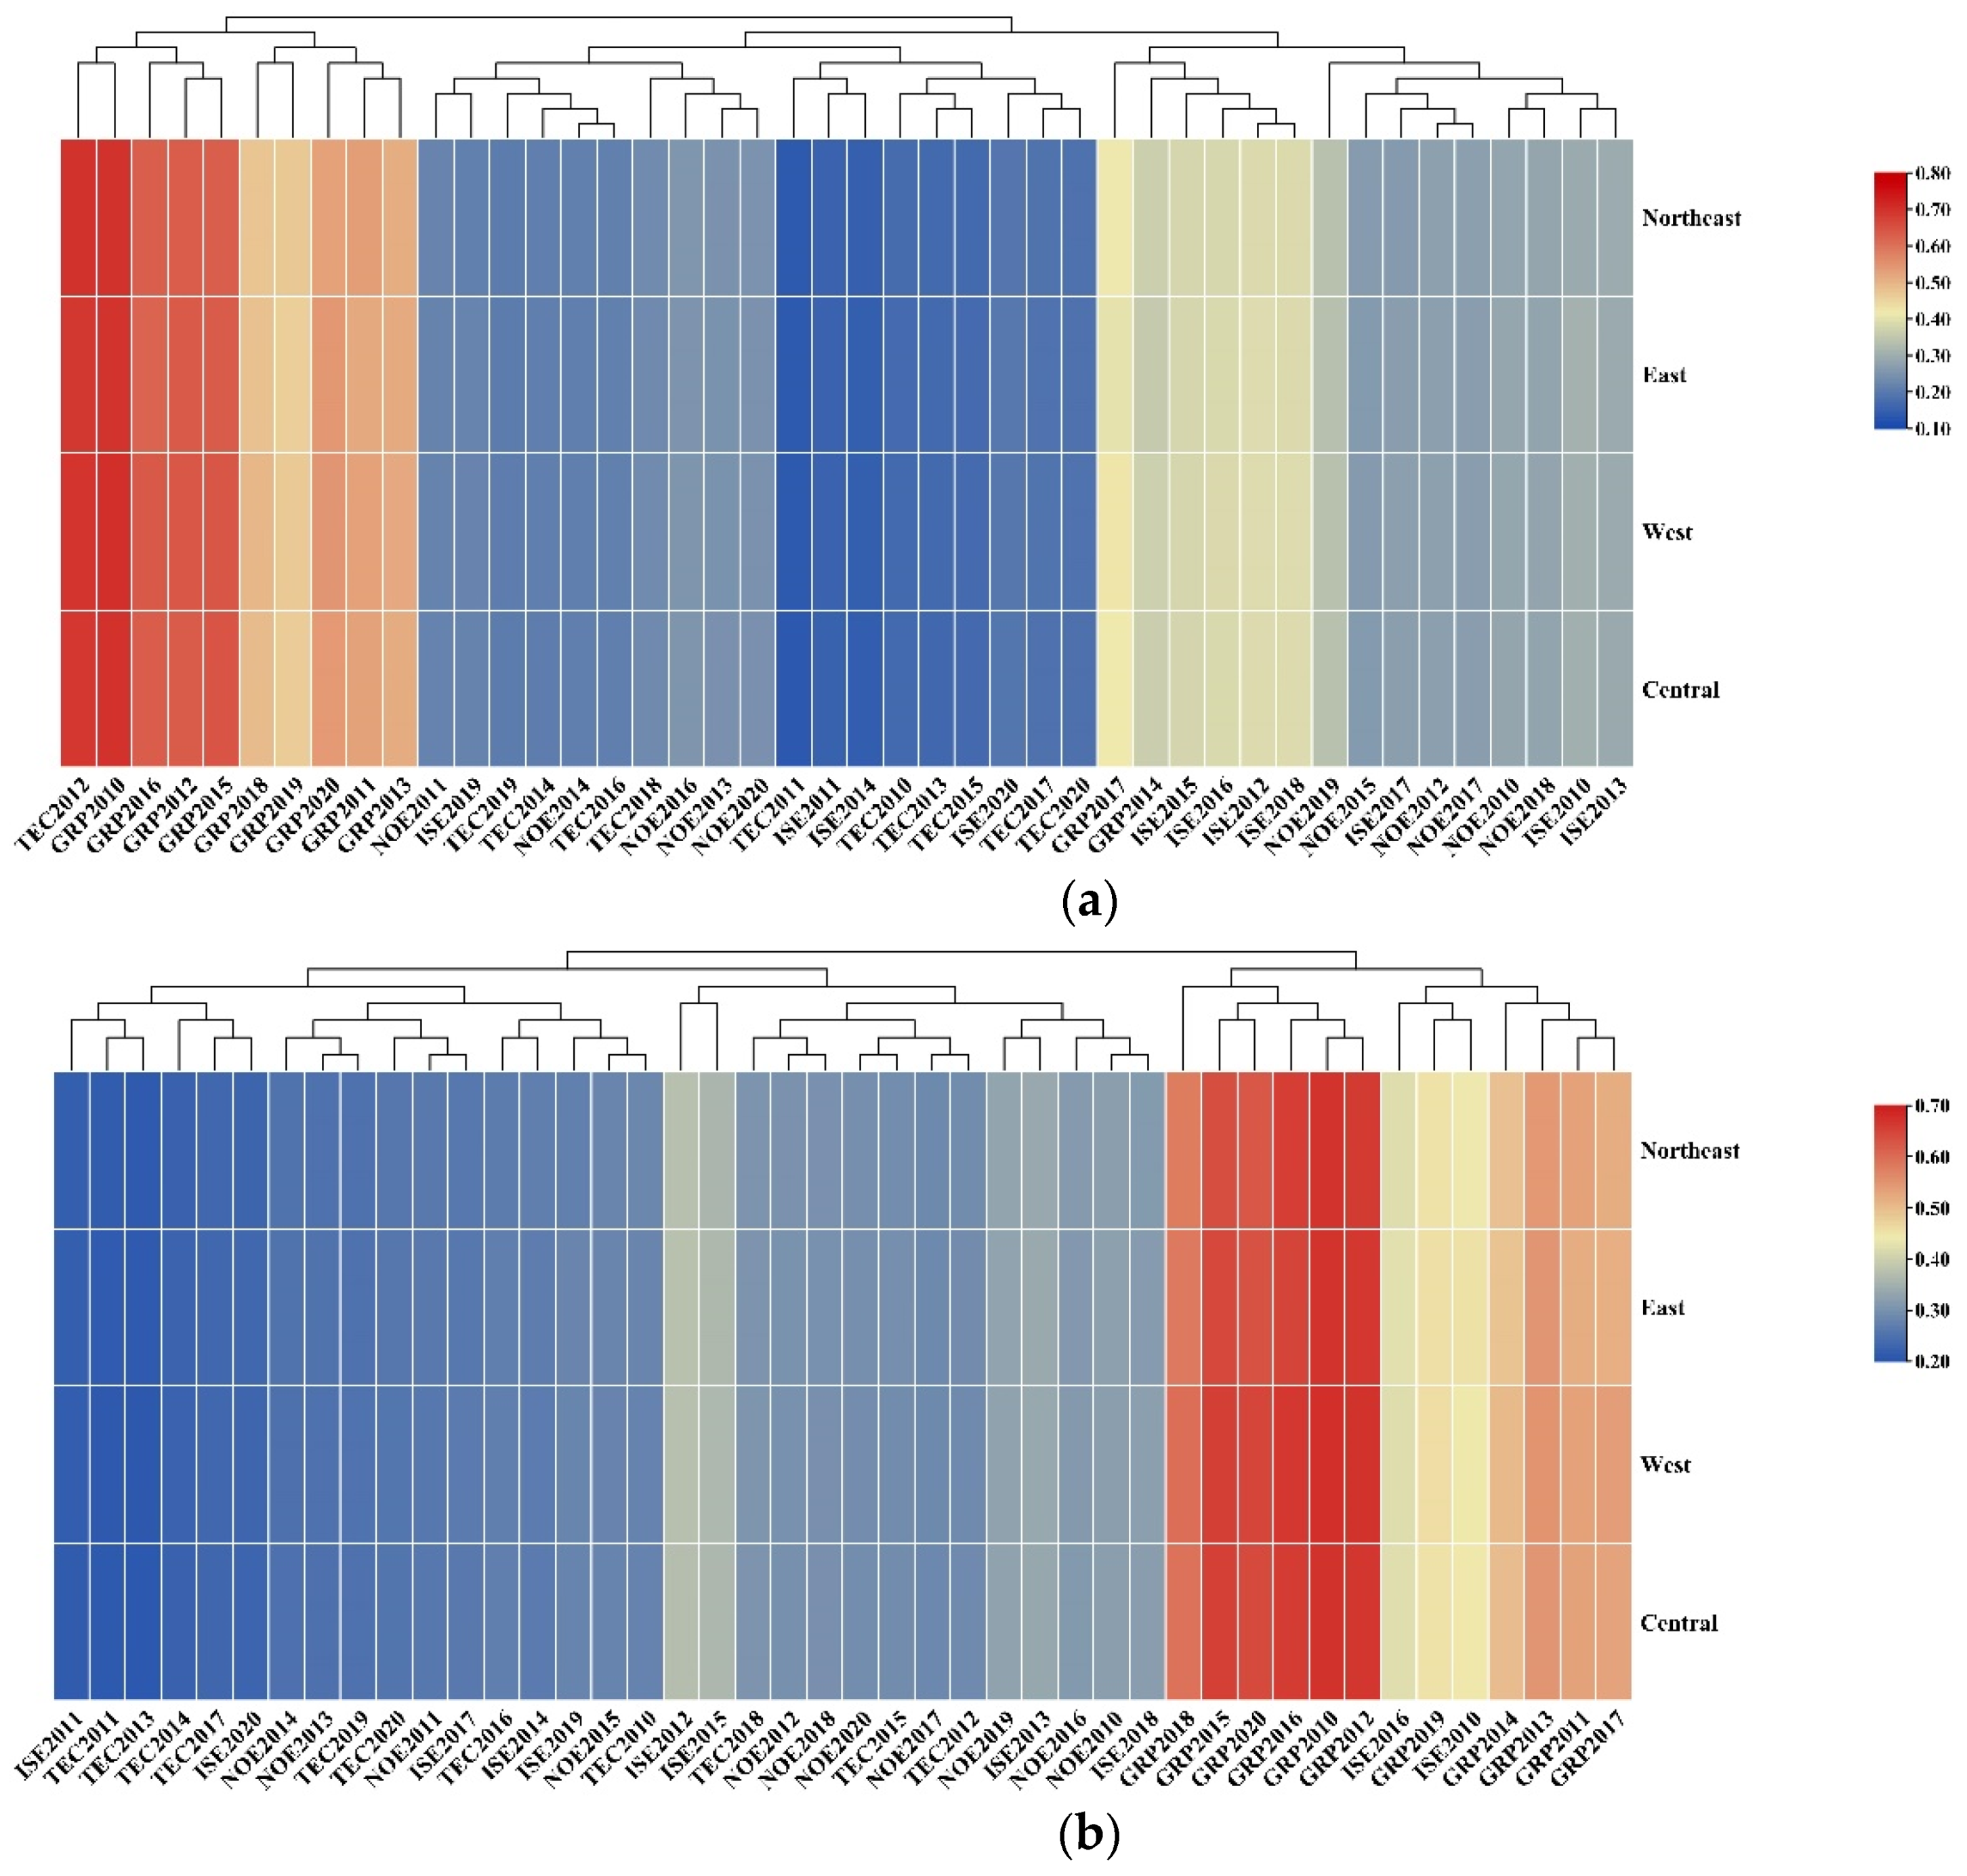
4.3.2. Efficiency Analysis of Sub-Indicators
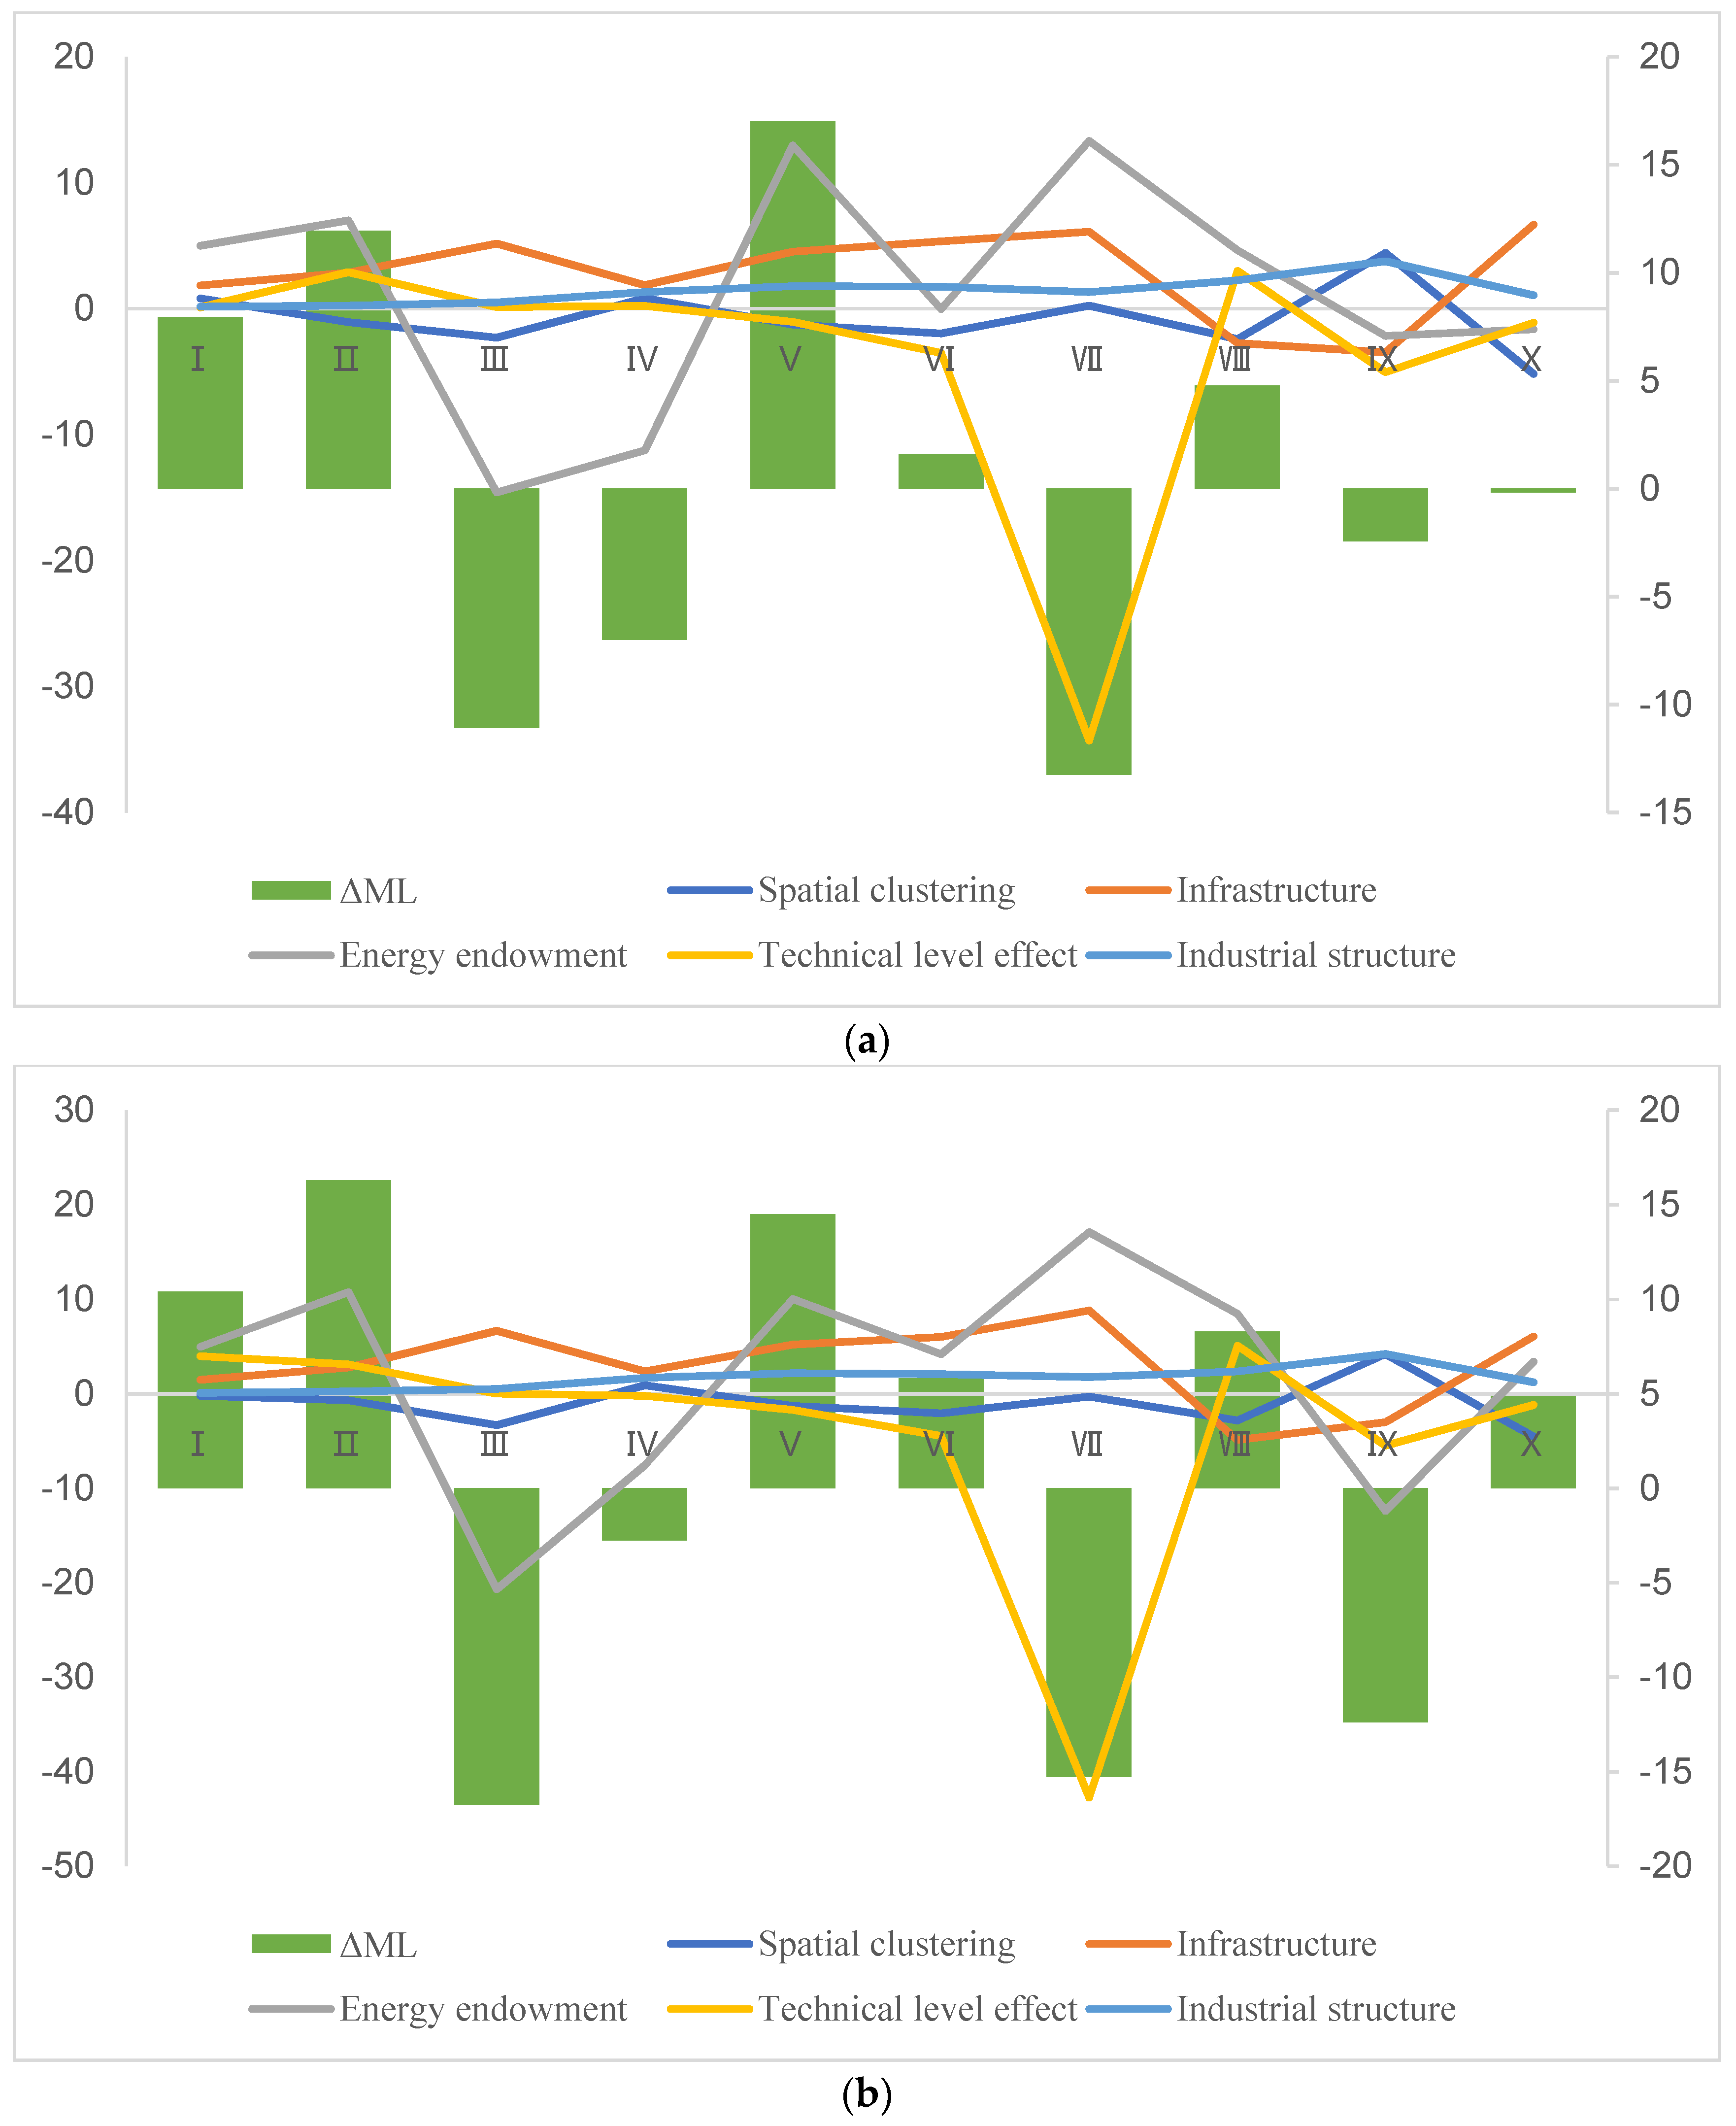
4.4. Analysis of the Driving Effect of Energy Consumption Efficiency in Cities of China
4.5. Multiple Paired Sample Friedman Test for Energy Consumption Efficiency by Region
5. Conclusions and Suggestions
5.1. Conclusions
5.2. Suggestions
5.2.1. Tailoring Policies to Local Conditions and Improving Overall Energy Consumption Efficiency in Various Regions of China
5.2.2. Adjusting Energy Consumption Structure and Reducing Energy Intensity
5.2.3. Increase Investment in Science and Technology and Promote Technological Progress and Innovation
Author Contributions
Funding
Institutional Review Board Statement
Informed Consent Statement
Data Availability Statement
Conflicts of Interest
Appendix A

| DMU | District | DMU | District | DMU | District | DMU | District | DMU | District | DMU | District | DMU | District | DMU | District |
|---|---|---|---|---|---|---|---|---|---|---|---|---|---|---|---|
| Ankang | Western | Datong | Central | Heihe | Northeast | Jiuquan | Western | Nanjing | Eastern | Shaoyang | Central | Urumchi | Western | Yingtan | Central |
| Anqing | Central | Dantong | Northeast | Hengshui | Eastern | Kaifeng | Central | Nanning | Western | Shaoxing | Eastern | Wuxi | Eastern | Yingkou | Northeast |
| Anshun | Western | Deyang | Western | Hengyang | Central | Kelamayi | Western | Nanping | Eastern | Shenzhen | Eastern | Wuhu | Central | Yongzhou | Central |
| Anyang | Central | Dezhou | Eastern | Huhehaote | Western | Kunming | Western | Nantong | Eastern | Shenyang | Northeast | Wuzhong | Western | Yulin | Western |
| Anshan | Northeast | Dingxi | Western | Hulunbeier | Western | Laibin | Western | Nanyang | Central | Shiyan | Central | Wuzhou | Western | Yulin | Western |
| Bazhong | Western | Dongguan | Eastern | Huludao | Northeast | Lanzhou | Western | Neijiang | Western | Shijiazhuang | Eastern | Wuhan | Central | Yuxi | Western |
| Baicheng | Northeast | Dongying | Eastern | Huzhou | Eastern | Langfang | Eastern | Ningbo | Eastern | Shizuishan | Western | Wuwei | Western | Yueyang | Central |
| Baishan | Northeast | Eerduosi | Western | Huaihua | Central | Leshan | Western | Ningde | Eastern | Shuangyashan | Northeast | Xian | Western | Yunfu | Eastern |
| Baiyin | Western | Ezhou | Central | Huaian | Eastern | Lijiang | Western | Panzhihua | Western | Shuozhou | Central | Xining | Western | Yuncheng | Central |
| Baise | Western | Fangchenggang | Western | Huaibei | Central | Lishui | Eastern | Panjin | Northeast | Siping | Northeast | Xianning | Central | Zaozhuang | Eastern |
| Bengbu | Central | Foshan | Eastern | Huainan | Central | Lianyungang | Eastern | Pingdingshan | Central | Songyuan | Northeast | Xianyang | Western | Zhanjiang | Eastern |
| Baotou | Western | Fuzhou | Eastern | Huanggang | Central | Liaoyang | Northeast | Pingliang | Western | Suzhou | Eastern | Xiangtan | Central | Zhangjiajie | Central |
| Baoji | Western | Fushun | Northeast | Huangshan | Central | Liaoyuan | Northeast | Pingxiang | Central | Suqian | Eastern | Xiaogan | Central | Zhangjiakou | Eastern |
| Baoding | Eastern | Fuzhou | Central | Huangshi | Central | Liaocheng | Eastern | Putian | Eastern | Suzhou | Central | Xinzhou | Central | Zhangye | Western |
| Baoshan | Western | Fuxin | Northeast | Huizhou | Eastern | Lincang | Western | Puyang | Central | Suizhou | Central | Xinxiang | Central | Zhangzhou | Eastern |
| Beihai | Western | Fuyang | Central | Jixi | Northeast | Linfen | Central | Qitaihe | Northeast | Suining | Western | Xinyu | Central | Changchun | Northeast |
| Beijing | Eastern | Ganzhou | Central | Jian | Central | Linyi | Eastern | Qiqihaer | Northeast | Taizhou | Eastern | Xinyang | Central | Changsha | Central |
| Benxi | Northeast | Guyuan | Western | Jilin | Northeast | Liuzhou | Western | Qinhuangdao | Eastern | Taiyuan | Central | Xingtai | Eastern | Changzhi | Central |
| Binzhou | Eastern | Guangan | Western | Jinan | Eastern | Liuan | Central | Qingdao | Eastern | Taian | Eastern | Xuzhou | Eastern | Zhaotong | Western |
| Bozhou | Central | Guangyuan | Western | Jining | Eastern | Liupanshui | Western | Qingyuan | Eastern | Taizhou | Eastern | Xuchang | Central | Zhaoqing | Eastern |
| Cangzhou | Eastern | Guangzhou | Eastern | Jiamusi | Northeast | Longyan | Eastern | Qingyang | Western | Tangshan | Eastern | Xuancheng | Central | Zhenjiang | Eastern |
| Changzhou | Eastern | Guigang | Western | Jiaxing | Eastern | Longnan | Western | Qujing | Western | Tianjin | Eastern | Yaan | Western | Zhengzhou | Central |
| Chaoyang | Northeast | Guiyang | Western | Jiayuguan | Western | Loudi | Central | Quanzhou | Eastern | Tianshui | Western | Yantai | Eastern | Zhongshan | Eastern |
| Chaozhou | Eastern | Guilin | Western | Jiangmen | Eastern | Luzhou | Western | Rizhou | Eastern | Tieling | Northeast | Yanan | Western | Chongqing | Western |
| Chenzhou | Central | Haerbin | Northeast | Jiaozuo | Central | Luoyang | Central | Sanmenxia | Central | Tonghua | Northeast | Yancheng | Eastern | Zhoushan | Eastern |
| Chengdu | Western | Handan | Eastern | Jieyang | Eastern | Luohe | Central | Sanming | Eastern | Tongliao | Western | Yangzhou | Eastern | Zhoukou | Central |
| Chengde | Eastern | Hanzhong | Western | Jinchang | Western | Maanshan | Central | Xiamen | Eastern | Tongchuan | Western | Yangjiang | Eastern | Zhuhai | Eastern |
| Chizhou | Central | Changzhou | Eastern | Jinhua | Eastern | Maoming | Eastern | Shantou | Eastern | Tongling | Central | Yangquan | Central | Zhuzhou | Central |
| Chifeng | Western | Hefei | Central | Jinzhou | Northeast | Meishan | Western | Shanwei | Eastern | Weihai | Eastern | Yichun | Northeast | Zhumadian | Central |
| Chongzuo | Western | Hechi | Western | Jincheng | Central | Meizhou | Eastern | Shangluo | Western | Weifang | Eastern | Yibin | Western | Ziyang | Western |
| Chuzhou | Central | Heyuan | Eastern | Jinzhong | Central | Mianyang | Western | Shangqiu | Central | Weinan | Western | Yichang | Central | Zibo | Eastern |
| Dazhou | Western | Hezhou | Western | Jingmen | Central | Mudanjiang | Northeast | Shanghai | Eastern | Wenzhou | Eastern | Yichun | Central | Zigong | Western |
| Dalian | Northeast | Hebi | Central | Jingzhou | Central | Nanchang | Central | Shangrao | Central | Wuhai | Western | Yiyang | Central | Haikou | Eastern |
| Daqing | Northeast | Hegang | Northeast | Jiujiang | Central | Nanchong | Western | Shaoguan | Eastern | Wulanchabu | Western | Yinchuan | Western | Sanya | Eastern |
References
- BP plc. BP Statistical Review of World Energy 2022; BP plc: London, UK, 2022; p. 3. [Google Scholar]
- Lu, L.-C.; Chiu, S.-Y.; Chiu, Y.-H.; Chang, T.-H. Sustainability efficiency of climate change and global disasters based on greenhouse gas emissions from the parallel production sectors—A modified dynamic parallel three-stage network DEA model. J. Environ. Manag. 2022, 317, 115401. [Google Scholar] [CrossRef] [PubMed]
- Bloch, H.; Rafiq, S.; Salim, R. Coal consumption, CO2 emission and economic growth in China: Empirical evidence and policy responses. Energy Econ. 2012, 34, 518–528. [Google Scholar] [CrossRef]
- Kraft, J.; Kraft, A. On the Relationship Between Energy and GNP. J. Energy Dev. 1978, 3, 401–403. [Google Scholar]
- Asafu-Adjaye, J. The relationship between energy consumption, energy prices and economic growth: Time series from Asian developing countries. Energy Econ. 2000, 22, 78–84. [Google Scholar] [CrossRef]
- Bellke, A.; Dobnik, F.; Drecer, C. Energy consumption and economic growth: New insights into the cointegration relationship. Energy Econ. 2011, 33, 782–789. [Google Scholar] [CrossRef]
- Zhang, Y.; Wang, W.; Liang, L.W.; Wang, D.P.; Cui, X.H.; Wei, W.D. Spatial-temporal pattern evolution and driving factors of China’s energy efficiency under low-carbon economy. Sci. Total Environ. 2020, 739, 140197. [Google Scholar] [CrossRef] [PubMed]
- Newell, R.G.; Jaffe, A.B.; Stavins, R.N. The Induced Innovation Hypothesis and Energy-Saving Technological Change. Q. J. Econ. 1999, 114, 941–975. [Google Scholar] [CrossRef]
- Ang, B.W.; Zhang, F.Q. A survey of index decomposition analysis in energy and environmental studies. Energy 2000, 25, 1149–1176. [Google Scholar] [CrossRef]
- Wei, C.; Shen, M.H. Impact factors of energy productivity in China: An empirical analysis. Chin. J. Popul. Resour. Environ. 2007, 4, 28–33. [Google Scholar]
- Capello, R.; Camagni, R. Beyond Optimal City Size: An Evaluation of Alternative Urban Growth Patterns. Urban Stud. 2000, 37, 1479–1496. [Google Scholar] [CrossRef]
- Liu, X.; Sweeney, J. Modelling the impact of urban form on household energy demand and related CO2 emissions in the Greater Dublin Region. Energy Policy 2012, 46, 359–369. [Google Scholar] [CrossRef]
- Burgess, R. The Compacity Debate: A Global Perspective; Routledge: London, UK, 2002. [Google Scholar]
- Doms, M.E.; Dunne, T. Energy intensity, electricity consumption, and advanced manufacturing-technology usage. Technol. Forecast. Soc. Change 1995, 49, 297–310. [Google Scholar] [CrossRef]
- Mielnik, O.; Goldemberg, J. Foreign direct investment and decoupling between energy and gross domestic product in developing countries. Energy Policy 2002, 30, 87–89. [Google Scholar] [CrossRef]
- Wu, F.; Fan, L.W.; Zhou, P.; Zhou, D.Q. Industrial energy efficiency with CO2 emissions in China: A nonparametric analysis. Energy Policy 2012, 49, 164–172. [Google Scholar] [CrossRef]
- Lin, B.Q.; Moubarak, M. Renewable energy consumption—Economic growth nexus for China. Renew. Sustain. Energy Rev. 2014, 40, 111–117. [Google Scholar] [CrossRef]
- Jules-Daniel, W.; Joëlle, N. The impact of green innovation on energy intensity: An empirical analysis for 14 industrial sectors in OECD countries. Energy Econ. 2018, 71, 47–61. [Google Scholar]
- Sinton, J.E.; Fridley, D.G. What goes up: Recent trends in China’s energy consumption. Energy Policy 2000, 28, 671–687. [Google Scholar] [CrossRef]
- Fisher-Vanden, K.; Jefferson, G.H.; Liu, H.M.; Tao, Q. What is Driving China’s Decline in Energy Intensity? Resour. Energy Econ. 2004, 26, 77–97. [Google Scholar] [CrossRef]
- Edelstein, P.; Kilian, L. How sensitive are consumer expenditures to retail energy prices? J. Monet. Econ. 2009, 56, 766–779. [Google Scholar] [CrossRef]
- Filipovic, S.; Golusin, M. Environmental taxation policy in the EU—New methodology approach. J. Clean. Prod. 2015, 88, 308–317. [Google Scholar] [CrossRef]
- Hu, J.L.; Wang, S.C. Total-factor energy efficiency of regions in China. Energy Policy 2006, 34, 3206–3217. [Google Scholar] [CrossRef]
- Fare, R.; Grosskopf, S.; Pasurka, C.A. Pollution abatement activities and traditional productivity. Ecol. Econ. 2007, 62, 673–682. [Google Scholar] [CrossRef]
- Oh, D.H. A global Malmquist-Luenberger productivity index. J. Product. Anal. 2010, 34, 183–197. [Google Scholar] [CrossRef]
- Chang, M.C. A comment on the calculation of the total-factor energy efficiency (TFEE) index. Energy Policy 2013, 53, 500–504. [Google Scholar] [CrossRef]
- Zhu, W.; Zhu, Y.; Yu, Y. China’s regional environmental efficiency evaluation: A dynamic analysis with biennial Malmquist productivity index based on common weights. Environ. Sci. Pollut. Res. 2020, 27, 39726–39741. [Google Scholar] [CrossRef]
- Miketa, A. Analysis of energy intensity developments in manufacturing sectors in industrialized and developing countries. Energy Policy 2001, 29, 769–775. [Google Scholar] [CrossRef]
- Sun, J.W.; Meristo, T. Measurement of Dematerialization/Materialization: A Case Analysis of Energy Saving and Decarbonization in OECD Countries, 1960–1995. Technol. Forecast. Soc. Change 1999, 60, 275–294. [Google Scholar] [CrossRef]
- Mulder, P.; Groot, H.D. International Comparisons of Sectoral Energy- and Labour-Productivity Performance: Stylised Facts and Decomposition of Trends; Discussion Paper 10910477; Tinbergen Institute: Amsterdam, The Netherlands, 2004. [Google Scholar]
- Mulder, M.P. Energy productivity across developed and developing countries in 10 manufacturing sectors: Patterns of growth and convergence. Energy Econ. 2005, 27, 429–453. [Google Scholar]
- Lu, Y.; Cui, P.; Li, D. Carbon emissions and policies in China’s building and construction industry: Evidence from 1994 to 2012. Build. Environ. 2016, 95, 94–103. [Google Scholar] [CrossRef]
- Xiang, X.; Ma, X.; Ma, Z.; Ma, M.; Cai, W. Python-LMDI: A Tool for Index Decomposition Analysis of Building Carbon Emissions. Buildings 2022, 12, 83. [Google Scholar] [CrossRef]
- Lu, Y.; Cui, P.; Li, D. Which activities contribute most to building energy consumption in China? A hybrid LMDI decomposition analysis from year 2007 to 2015. Energy Build. 2017, 165, 259–269. [Google Scholar] [CrossRef]
- Chontanawat, J.; Wiboonchutikula, P.; Buddhivanich, A. An LMDI decomposition analysis of carbon emissions in the Thai manufacturing sector. Energy Rep. 2019, 6, 705–710. [Google Scholar] [CrossRef]
- Yasmeen, H.; Wang, Y.; Zameer, H. Decomposing factors affecting CO2 emissions in Pakistan: Insights from LMDI decomposition approach. Environ. Sci. Pollut. 2020, 27, 3113–3123. [Google Scholar] [CrossRef] [PubMed]
- Belloumi, M.; Achour, H. Decomposing the influencing factors of energy consumption in Tunisian transportation sector using the LMDI method. Transport Pol. 2016, 52, 64–71. [Google Scholar]
- Chong, C.H.; Liu, P.; Ma, L.; Li, Z.; Ni, W.; Li, X.; Song, S.Z. LMDI decomposition of energy consumption in Guangdong Province, China, based on an energy allocation diagram. Energy 2017, 133, 525–544. [Google Scholar] [CrossRef]
- Chen, X.H.; Zhou, F.Y.; Hu, D.B.; Yi, G.D.; Cao, W.Z. An improved evaluation method to assess the coordination between mineral resource exploitation, economic development, and environmental protection. Ecol. Indic. 2022, 138, 108808. [Google Scholar] [CrossRef]
- Chong, C.H.; Tan, W.X.; Ting, Z.J.; Liu, P.; Ma, L.; Li, Z.; Ni, W.D. The driving factors of energy-related CO2 emission growth in Malaysia: The LMDI decomposition method based on energy allocation analysis. Renew. Sustain. Energy Rev. 2019, 115, 109356. [Google Scholar] [CrossRef]
- Paulo, M.; De Oliveira-De, J. Effect of generation capacity factors on carbon emission intensity of electricity of Latin America & the Caribbean, a temporal IDA-LMDI analysis. Renew. Sustain. Energy Rev. 2019, 101, 516–526. [Google Scholar]

| Factor | Representation | Abbreviation |
|---|---|---|
| Spatial clustering effect | ||
| Infrastructure effect | ||
| Energy endowment effect | ||
| Technology level effect | ||
| Industrial structure effect |
| Variable | Meaning | Indicator Attribute | Unit |
|---|---|---|---|
| Number of employees | Number of employees in urban enterprises | Input | 10,000 people |
| Total energy consumption | Comprehensive consumption of various energy sources by national and non-material production sectors during a certain period of time | Input | 10,000 tons |
| Regional GDP | Final results of production activities of all resident units in the local area during a certain period of time | Desirable output | CNY 100 million |
| Industrial SO2 emissions | Amount of SO₂ emitted by enterprises in the production process | Undesirable output | 10,000 tons |
| Industrial NOx emissions | Amount of NOx emitted by enterprises in the production process | Undesirable output | 10,000 tons |
| Industrial smoke emissions | Weight of particulate matter emitted by enterprises during the production process | Undesirable output | 10,000 tons |
| Efficiency without Exogenous Variables | Sample Size | Median | Standard Deviation | Statistic | p | Cohen’s f |
|---|---|---|---|---|---|---|
| Efficiency in northeast China | 11 | 0.195 | 0.062 | 14.673 | 0.002 *** | 0.214 |
| Efficiency in east China | 11 | 0.146 | 0.066 | |||
| Efficiency in west China | 11 | 0.176 | 0.059 | |||
| Efficiency in central China | 11 | 0.16 | 0.062 |
| Efficiency with Exogenous Variables | Sample Size | Median | Standard Deviation | Statistic | p | Cohen’s f |
|---|---|---|---|---|---|---|
| Efficiency in northeast China | 11 | 0.255 | 0.058 | 16.309 | 0.001 *** | 0.353 |
| Efficiency in east China | 11 | 0.204 | 0.057 | |||
| Efficiency in west China | 11 | 0.195 | 0.049 | |||
| Efficiency in central China | 11 | 0.193 | 0.054 |
Disclaimer/Publisher’s Note: The statements, opinions and data contained in all publications are solely those of the individual author(s) and contributor(s) and not of MDPI and/or the editor(s). MDPI and/or the editor(s) disclaim responsibility for any injury to people or property resulting from any ideas, methods, instructions or products referred to in the content. |
© 2024 by the authors. Licensee MDPI, Basel, Switzerland. This article is an open access article distributed under the terms and conditions of the Creative Commons Attribution (CC BY) license (https://creativecommons.org/licenses/by/4.0/).
Share and Cite
Miao, X.; Wu, Y.; Ren, F. A Study on the Measurement of Regional Energy Consumption Efficiency and Decomposition of Its Influencing Factors in China: New Evidence for Achieving SDGs. Energies 2024, 17, 531. https://doi.org/10.3390/en17020531
Miao X, Wu Y, Ren F. A Study on the Measurement of Regional Energy Consumption Efficiency and Decomposition of Its Influencing Factors in China: New Evidence for Achieving SDGs. Energies. 2024; 17(2):531. https://doi.org/10.3390/en17020531
Chicago/Turabian StyleMiao, Xiumei, Yong Wu, and Fangrong Ren. 2024. "A Study on the Measurement of Regional Energy Consumption Efficiency and Decomposition of Its Influencing Factors in China: New Evidence for Achieving SDGs" Energies 17, no. 2: 531. https://doi.org/10.3390/en17020531
APA StyleMiao, X., Wu, Y., & Ren, F. (2024). A Study on the Measurement of Regional Energy Consumption Efficiency and Decomposition of Its Influencing Factors in China: New Evidence for Achieving SDGs. Energies, 17(2), 531. https://doi.org/10.3390/en17020531