Abstract
This study sought to generate, evaluate, and recommend possible national policies for the government of the Democratic Republic of the Congo (DRC) to implement to most effectively boost growth and investment in renewable energy technologies (RETs) through 2065 using Open Source Energy Modelling System (OSeMOSYS). The novelty of this study stems in-part from the scarcity of RET modelling completed for specific West African countries rather than for broader regions. Market-based instruments were identified as the policy type most practical for DRC. From modelling the resulting energy systems for policy pathways involving a 16% RET subsidy, a 70% fossil fuel tax, and both in combination relative to no-policy baseline scenarios, the scenarios including the tax had the lowest net costs (USD304–306 B) and the highest proportion of RETs (above 90%). Additionally, despite the current reliance on hydropower to fulfil 98% of its energy needs, hydropower played a very minor role in all of a modelled scenarios (no future investment beyond residual capacity). Finally, a post-modelling market potential assessment was performed on the technology that dominated off-grid supply across policy pathways: a 0.3 kW small solar home system (SHS). Based on learning rates for solar photovoltaics (PV), demand for a small SHS in DRC (>160 million units in total) was found to be sufficient to substantially reduce the unit cost as deployment scales. Ultimately, this study yielded four recommendations for the DRC government: (1) Pursue financial incentives to catalyse DRC’s renewable energy supply. (2) Tax fossil fuel energy production. (3) Re-evaluate focus on hydropower. (4) Promote DRC as a healthy market for solar home systems.
1. Introduction
Decarbonising global energy systems is mandatory for maintaining a liveable planet. All scenarios developed by the Intergovernmental Panel on Climate Change with a 66% chance of keeping the global mean temperatures below 1.5 °C (in line with the Paris Agreement) require global fossil fuel energy generation to peak before 2030, followed by rapid declines [1]. The majority of energy demand growth in the next several decades is projected to be in low- and middle-income countries (LMICs) as billions of people gain access to the lights and appliances that are part of everyday life in advanced economies [2]. Many of these people will be increasing their intensity of energy use, but many more will gain access for the first time.
Compared to other world regions, energy demand in sub-Saharan Africa is expected to grow the fastest, with a population set to double by 2050 [2]. Satisfying this demand will require an unprecedented increase in energy production, especially as the global community makes progress toward achieving Sustainable Development Goal 7 (provide energy access for all) [3]. If this expansion relies predominantly on fossil fuels, then by 2050, African energy systems will have an emissions intensity twice as high as those in the rest of the world [4]. Therefore, a critical requirement for meeting the Paris Agreement is ensuring that sub-Saharan African countries leapfrog traditional fossil fuel energy development to instead generate a large majority of their energy supply from renewable sources.
Achieving this leapfrogging involves intentional national energy planning strategies that prioritise renewable energy technologies (RETs) over fossil fuels. However, these strategies remain infeasible and unrealistic while RETs are more costly in the Democratic Republic of the Congo (DRC). Table A5 includes a breakdown of costs by technology used in the modelling for this study, demonstrating that the total cost (capital + operating costs) for RETs is higher than for fossil-based technologies. However, governments can implement policies to overcome these cost disparities. A recent study showed that not only does the decarbonisation of the energy supply contribute most to overall emissions mitigation, but it is also highly responsive to policy signals [5]. Many other studies have modelled possible scenarios to achieve varying outcomes of RET penetration in the energy systems of LMICs and then subsequently make policy recommendations to inform energy planning such as for Chile [6], Costa Rica [7], Egypt [8], Ethiopia [9], and Tanzania [10]. This study builds on past research by taking the less commonly used inverse approach of developing model scenarios based on the implementation of novel policies and then analysing the energy system outcomes. In this way, this study employs an original approach, and its results are intended to be practical for a LMIC government.
In 2020, an estimated 82 million people in DRC did not have access to electricity, the most of any country in the world [11]. Due to political, infrastructural, and economic fragility, centralised grid expansion efforts in DRC have not led to increased energy access, and the current policy environment is not favourable for private energy investment. DRC was selected as the country of focus for this study because it has a substantial immediate need for energy access and insufficient policies to attract the private investment required to enable this access.
The primary research question for this study is: what actions should DRC government take to most cost effectively develop the most sustainable energy system as demand increases? Thus, the overall research objective that follows from this question is to generate, evaluate, and recommend possible national policies for the government of DRC to implement to most effectively boost growth and investment in renewable energy generation over the next several decades.
2. Background
2.1. DRC Power Sector
Only nine percent, or roughly eight million people, out of a total population of around 90 million have access to electricity in DRC [11]. Most of the current access is through on-grid connections. In 2014, the National Society of Electricity (SNEL) was re-designated as a “business corporation”, the same as any other company operating in DRC, liberalising the grid for private sector ownership and operation. Thus, all parts of both on- and off-grid power can legally involve private players. Because SNEL has struggled to maintain operations, additional private generation and T&D contributions will be required [12]. A large rural population, poor road infrastructure, and huge swaths of rainforest mean that off-grid access must develop concurrently. As a result, both utility-scale on-grid and decentralised off-grid electricity generation technologies were included in this study.
The current generation profile for DRC is 98% renewable energy, almost exclusively from hydropower [13], but the country generates less than five gigawatts (GW) of hydropower out of a potential of 100–110 GW [14]. Thus, the future role of hydropower was carefully considered in the current study’s scenario results.
2.2. DRC Policy Environment
In October 2021, DRC formally updated the ambition of its nationally determined contribution (NDC) to a 21% reduction in economy-wide emissions by 2030 relative to projected business as usual emissions (BAU) (430 Mt CO2e) [15] (DRC does not have a more specific NDC sub-target focused on emissions reduction or mitigation in the energy sector). A 19% reduction is conditional on international funding (referred to as foreign direct investment (FDI)), representing more than USD44 B of the estimated USD48.68 B in funding required to meet the full NDC [15]. DRC is not atypical: twenty-six African countries have conditional NDCs that rely on external investment [16]. Conditional funding has become a common characteristic of NDCs for LMICs.
Sources from both the academic and grey literature indicate that DRC is not currently conducive to external investment in RETs because of a lack of energy policies impacting RETs explicitly [12,17,18]. The most recent energy policy was passed in 2014, which liberalised on-grid electricity generation and T&D, established the Electricity Regulation Authority (ARE) and the National Agency for Electrification and Energy Services in Rural and Peri-Urban Areas (ANSER), but did not address the RET cost or investment [19]. Making DRC a favourable country for business investment will substantially increase the chance of success for its NDC.
The DRC National Development Plan for 2019–2023 includes five major strategic pillars. Pillar IV, Territory Development, has major objectives for the electricity sector including leveraging greater private participation to finance the sector and intensifying investments in RETs. The funding section of the plan highlights accelerating reforms to improve the business climate and implementing specific incentive measures offering tax and customs advantages by sector as two major strategies for attracting the FDI needed [3]. The importance of these strategies is further highlighted by DRC’s stated goals of 30% electrification by 2025 and 60% electrification by 2030 [20]. Therefore, a priority gap for the DRC government to address is understanding which policies could be introduced to improve the business environment for RET investment.
2.3. Possible Policy Interventions
There are many different policies that governments can employ to catalyse RET uptake and financing. The Renewable Energy Policy Network broadly categorises RET policies into three types that are applicable regardless of the level of development of a country: targets, regulatory, and fiscal incentives/public financing [21]. Applicability of each of these renewable energy policy types for DRC was evaluated in turn.
Target-based policies typically entail a country committing to a specific percentage of RETs that will make up its energy mix by a certain date. Renewable energy targets are legally enforceable in the European Union [22]. However, mandatory targets are not likely to be enforceable in DRC. No precedence of environmental case law, political instability, a lack of funding for enforcement personnel and programs, and a history of noncompliance oversight are all barriers to the enforcement of national environmental targets in DRC [23]. In addition, targets, by definition, assert an ideal end state but do not inform the pathway to reach that goal. For DRC, currently at 98% renewable energy production, a future target would have little usefulness. For these reasons, renewable energy targets were not used to build scenarios for this study.
Regulatory policies include feed-in policies, net metering/billing, and tendering/auctions that typically allocate funding for RET projects based on the cost of electricity [21]. Past research has shown that regulatory policies focused on renewable energy can have substantially different effects depending on a country’s level of economic development. For example, feed-in tariffs, which guarantee payment to renewable energy suppliers through long-term contracts and/or above-market rates and are very popular in developed economies, may not support renewable energy development in LMICs [24,25]. Only four of the twenty-nine LMICs profiled in 2021 by the Renewable Energy Policy Network have implemented feed-in tariffs. The most common renewable energy regulatory policy used by LMICs in 2021 was tendering/auctions [21]. These and other types of regulatory policies are effective at attracting FDI in LMICs [25,26,27]. Although regulatory policies are worth evaluating for use in DRC, their inherent complexity and various possible implementations make them difficult to integrate in energy modelling, so this type of policy was not analysed further in this study.
Finally, fiscal incentives and public financing are market-based instruments that impact the cost of energy technologies. Research by Yang and Park [28] found that when developing countries have renewable energy financial incentives in place, any aid earmarked for renewable energy generation that the country receives is more likely to translate to actual gains in RET production. Additionally, a study including both advanced economies and LMICs found that financial incentive policies such as grants and subsidies were associated with increased renewable energy capacity installation in all countries [29]. Financial incentives were the focus for this study because the implementation of subsidies and taxes depend mostly on costs, which are simple to adjust in energy system models.
2.4. Justification for Subsidy
In this study, the amount of subsidy introduced in the relevant scenarios was based on the exemption of value-added tax (VAT) and customs import duties in DRC applied specifically to RETs. Studies in the context of other LMICs provide evidence that these types of tax exemptions reduce RET costs. In Colombia, a combined VAT and customs tariff exemption was introduced as part of a larger law promoting RETs, and Castillo-Ramírez, Mejía-Giraldo, and Molina-Castro [30] estimated this to result in a 19.82% reduction in the levelised cost of energy (LCOE) based on lowered capital and operating costs. In Chile, Servert et al. [31] found that VAT and customs exemptions for different solar technologies led to price reductions in all cases, however, the effect size depended on the ratio of imported components needed for the technology. Grounded in these precedents, a similar subsidy was developed for DRC.
Currently, DRC has a standard VAT rate of 16% that is applied to all goods and services bought or sold for use or consumption in-country [32]. VAT exemptions are applied to specific types of goods. Notably, “equipment, material, and chemicals imported by mining and oil companies for prospecting, exploration, and research” are VAT-exempt, providing a financial incentive for fossil fuel-based energy production [33]. DRC import duties add up to an additional 19% to the cost of RETs. In theory, RETs should be exempt from VAT and customs import duties in DRC, but this has not been properly codified. Thus, the exemption is applied inconsistently, and, in many cases, not at all [34]. For two scenarios in this study, a conservative 16% subsidy (cost reduction) was applied to the capital cost of RETs for simplicity, which the DRC government could achieve through the uniform application of a VAT exemption, or, if necessary, through a partial reduction in customs import duties.
2.5. Justification for Tax
For two scenarios in this study, a 70% tax (cost increase) was applied to the capital cost of fossil fuel technologies (this was the minimum additional tax to substantially change the results based on model sensitivity testing). Fossil fuel subsidy reform dominates the literature on applying financial disincentives to fossil fuel energy production [35,36]. However, unlike most other countries, DRC does not have post-tax subsidies on petroleum, coal, or natural gas that could be eliminated [37], so these approaches are not applicable. However, as detailed in the previous section, one straightforward tactic DRC government might employ to implement a fossil fuel tax would be to eliminate the current VAT-exemption in place for fossil fuel-based energy production. In financial terms, removing the VAT-exemption (fossil fuel subsidy) would be equivalent to introducing a 16% tax.
A fossil fuel tax is a type of carbon tax, and carbon taxes in the form of financial penalties on emissions have been applied in other LMICs. For example, in South Africa, a carbon tax applying to emissions from the industrial, transport, and power sectors was implemented in 2019, in part aiming to encourage current emitters to transition to renewable energies [38]. Recently, in Indonesia in July 2022, a carbon tax that applies to coal-fired power plants and oil was formalised into law at an initial base rate of USD2.11 per tonne, with detailed increases and additional programs to follow in due course [39]. Although the specific financial mechanism may be different, applying a fossil fuel tax in DRC is in line with other LMIC carbon tax schemes focused on supporting RET growth.
3. Methods
Various secondary datasets were used to source inputs and constraints to leverage Open Source Energy Modelling System (OSeMOSYS), which is a bottom–up, least cost energy systems optimization model that is useful for energy infrastructure planning at a country, regional, or global level [40]. OSeMOSYS has been used for scenario analysis for energy system planning in other LMICs such as in Bangladesh [41] and in Ethiopia [42]. Figure 1 shows the Reference Energy System (RES) used in this study, detailing all the technologies used and how they relate to each other. Parameter data values used in modelling are available in Appendix A, and for values not explicitly stated, those from Cannone et al. [43] were used (see Table A5 for a summary of all technologies included in the modelling). Note that no nuclear technologies were included since these were not defined as viable in DRC by Cannone et al. [43]. Instead, large-scale generation can be fulfilled by hydropower.
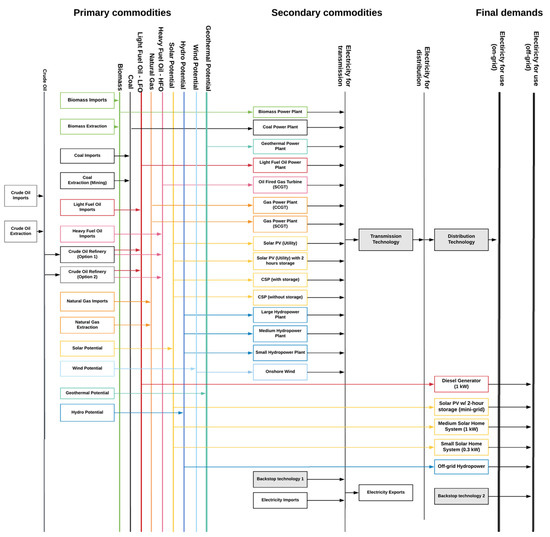
Figure 1.
RES for the DRC power sector, adapted from [43].
Based on the OSeMOSYS scenario outputs, a subsequent market potential assessment was conducted on the highest contributing technology to establish its market size and determine whether there is sufficient demand to trigger further cost reductions in DRC.
The Electricity Model Base for Africa (TEMBA) reference dataset [44] was used to set the annual industrial, residential, and commercial electricity demand for DRC (using the “SpecifiedAnnualDemand” parameter in OSeMOSYS). The selected model period for this study was set as 2021–2070. DRC-specific data from the Global Electrification Platform (GEP) [45] provided a projection for the annual least cost on-grid and off-grid generation, assuming 100% electrification by 2030. For the purposes of this study, the GEP split was used from 2021 through 2030, the last year of projection. In all subsequent years, the 2030 split was used (i.e., ~59% on-grid generation and ~41% off-grid generation) (see Figure 2). This assumption is a known limitation because the on/off-grid split is likely to change beyond 2030, but no other data sources were found to inform alternate ratios.
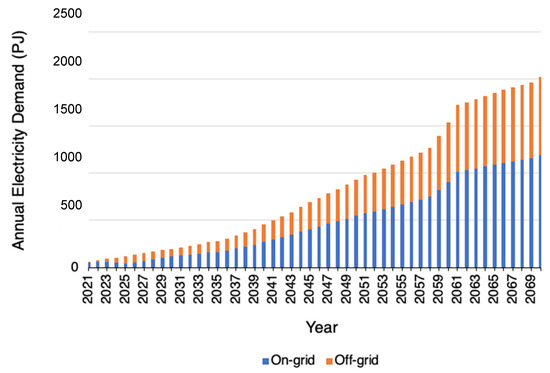
Figure 2.
On- and off-grid generation ratio used to meet the annual demand for all years, adapted from [45].
On- and off-grid, renewable, and non-renewable energy technologies were defined in the model to emulate the DRC power sector. Attributes of each technology incorporated in the model include the capacity factors, cost data, and operational life. Additionally, as needed, constraints were applied to technologies to limit their capacity and/or activity for specified year(s) to capture the resource potential limitations of DRC.
For a comprehensive summary of the modelling assumptions, see Appendix A (Table A1, Table A2, Table A3, Table A4, Table A5, Table A6, Table A7, Table A8, Table A9, Table A10 and Table A11 and Figure A1).
Five off-grid technologies were defined (Table 1) and constrained to limit off-grid generation to a forecasted percent of total generation by year [45]. Collectively, activity from these five technologies must fulfil (but cannot exceed) the annual off-grid demand for the model period, subject to additional scenario-specific constraints. Achieving this using OSeMOSYS required grouping these five technologies and introducing constraints to force the production activity of this off-grid technologies group to exactly meet the off-grid demand for all years.

Table 1.
Off-grid technologies included in the model scenarios.
Table 2 provides an overview of the five scenarios modelled using OSeMOSYS. Renewable Friendly (RF), Fossil Hostile (FH), and Renewable Friendly + Fossil Hostile (RF + FH) are collectively referred to as the policy pathways. Note that additional capital cost increases and reductions were modelled, but the values described in the scenario overview in Table 2 represent the smallest change necessary to have a noticeable effect on the model outputs. See Appendix A for details on the additional modelling assumptions.
Table 2.
Off-grid technologies included in model scenarios.
3.1. Scenario 1: Unconstrained
No additional constraints other than those described in the previous sections were used (i.e., the model is unrestricted in selecting the mix of off-grid technologies described in Table 1 to meet the off-grid demand for all years). An unconstrained scenario is useful for comparison to the other scenarios because on- and off-grid demand can be met with the least cost technologies in an environment where no new policies have been introduced.
3.2. Scenario 2: Business as Usual
This scenario is intended to best mirror the current energy production development trajectory for DRC into the future. Importantly, it does not introduce constraints to maintain the current generation technology mix into the future, but rather maintains the current policy environment. Additional minimum investment constraints were applied according to Table A10. It was assumed that no investment is made in off-grid renewable technologies. To achieve this, the activity limits placed on the grouped off-grid technologies were removed and instead placed on the diesel generator technology, forcing all future off-grid generation beyond residual capacity to be realised by this technology.
3.3. Scenario 3: Renewable Friendly
Capital costs for all RETs (concentrated solar power, geothermal, hydro, solar, and wind) were reduced by 16% from 2022, simulating the introduction of VAT/customs import duty exemptions. Note that in this study, biomass was not considered a RET, since electricity generation using biomass emits greenhouse gases. The rates of capital cost reduction defined in Table A7 were maintained.
3.4. Scenario 4: Fossil Hostile
Capital costs for all non-RETs (biomass, coal, oil, and natural gas) were increased by 70% in 2022, simulating the introduction of a tax on energy generation from these technologies. Sensitivity testing model runs using incremental +10% increases in capital costs from +20% to +70% found that the most pronounced change in model outputs was achieved with a 70% increase in 2022 (with negligible changes in model results for tax amounts < 70%). The rates of capital cost reduction defined in Table A7 were not maintained, meaning that the higher price in 2022 for these technologies was held constant for the entire modelling period.
3.5. Scenario 5: Renewable Friendly + Fossil Hostile
The final scenario combines the capital cost changes made in scenarios 4 and 5.
3.6. Market Potential Assessment
Based on the modelling outputs, a market potential assessment was conducted on the off-grid technology that dominated all policy pathways (0.3 kW small solar home system). This analysis not only quantifies the projected cost savings as capacity increases, but also provides a tangible market potential forecast to spur business investment [46].
The factor β can parametrise the learning rate (LR) of a technology in logarithmic terms, capturing the “progress ratio” for a technology, or how much the cost of a technology is reduced when its installed capacity doubles [47]. The initial number of units and the initial capital cost of the technology can then be represented as A0 and UC0, respectively, while the new cumulative number of units and new capital cost can be represented as A and UC. Therefore, for a given year, the new capital cost incorporating learning-by-doing is calculated as Equation (1) [46]. For solar PV, the mean LR for one-factor learning curve models is 23%, which was used in this study [48]. Rubin et al. [49] provide low-end and high-end LRs (10% and 47%, respectively) for solar PV, which were also used to provide the lower and upper bounds for the UC values calculated using
4. Results
4.1. Generation and Capacity Profile
Figure 3 provides a view of the annual electricity production results for all five scenarios, while Figure 4 provides a complementary snapshot of the cumulative capacities by technology for each scenario. By 2065, production from RETs will be 66.2% for UNC, 30.3% for BAU, 81.8% for RF, 90.1% for FH, and 91.4% for RF + FH.
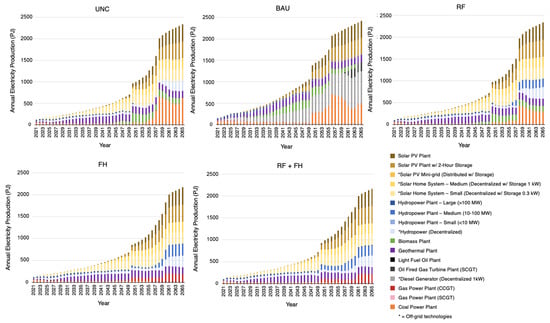
Figure 3.
Electricity production for the model period in petajoules across all scenarios.
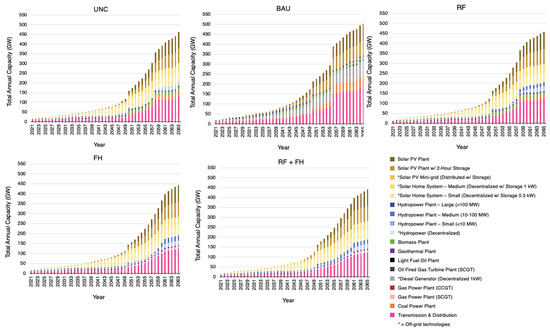
Figure 4.
Annual capacity for the model period across scenarios.
Although DRC’s planned hydropower projects were included in the BAU scenario and all subsequent scenarios, the on-grid hydropower capacity remained well below the technical potential for the country. Like geothermal, generation from on-grid utility scale solar PV (both with and without two hours of storage) was present across all scenarios and contributed close to 50% of the on-grid supply. Coal production after 2050 contributed to as much as one-third of production for the UNC, BAU, and RF scenarios. All production from coal ceases by 2056 in the FH and RF + FH scenarios, which is in-part replaced by production from combined-cycle gas turbine (CCGT) natural gas plants.
As expected from the constraints applied to BAU to prevent the expansion of off-grid RETs, all off-grid demand was fulfilled by distributed diesel generators. Disregarding BAU, the four other scenarios had a consistent split of which technologies supplied off-grid capacity. By 2065, these three RETs will reach 42.3% or 50 GW of off-grid capacity for a small SHS, 37.1% or 43.8 GW for a medium SHS, and 20.6% or 24.3 GW for decentralised hydropower.
4.2. Initial Total System Costs by Scenario
Calculating the total power sector costs involves combining the capital, fixed, and variable cost model outputs for each scenario. In OSeMOSYS, the total fixed costs are equivalent to the operating costs required to run all power generation technologies, and the total variable costs are equivalent to all fuel costs associated with the various imported and extracted resources that serve as inputs for fossil fuel power plants (RETs have no variable cost). However, these three types of costs were provided undiscounted in the model outputs, so a discounting equation (Equation (2)) was applied before they were totalled
where t is the number of years after 2021, the first year of the model period (e.g., t = 44 represents 2065, the last year included in the analysis), and r is the global discount rate of 10% [40]. Based on this calculation, Figure 5 shows the total discounted power sector costs.

Figure 5.
Total discounted power sector costs for all modelled scenarios.
The total costs for the BAU scenario were ~57% more than the average cost of the other four scenarios, representing an additional ~USD178 B of additional investment required over 45 years. A substantial portion of this added cost for BAU can be attributed to the additional T&D infrastructure necessary in this scenario.
For the remaining four scenarios, the discounted capital costs were very similar, with the two cheapest scenarios (RF and RF + FH) differing by USD80 M, a relatively insignificant amount over more than four decades and in relation to the billions of dollars of total investment required. However, the costs in Figure 5 do not account for the costs to the DRC government of implementing the policies required to enable the technology development trajectories of the RF, FH, and RF + FH scenarios.
4.3. Revenue from Fossil Fuel Tax
For the 70% tax levied on fossil fuel production present in the FH and RF + FH scenarios, activity from non-RETs generated revenue for the DRC government. Using model outputs, this revenue was estimated to evaluate the financial impact of the policy. In both scenarios, the only non-RETs active over the model period were coal and single-cycle gas turbines (SCGT). The tax would therefore be borne by the companies operating these power plants, assuming that future activity from these plants follows the scenario outputs. The undiscounted costs in the FH and RF + FH scenarios for these technologies (including costs for all imported or extracted fuels consumed) are summarised in Table A5.
Next, coal and natural gas costs were discounted based on the specific years they were incurred and totalled. The resulting total discounted costs for FH were USD13.46 B, and USD12.29 B for RF + FH for fossil generation. Multiplying each by the 70% tax penalty yielded USD9.422 B and USD8.603 B in revenue (or cost reduction) for FH and RF + FH, respectively. Estimating the financial impact of the tax in this way assumes that the DRC government can apply this penalty unilaterally to capital, operating (fixed), and fuel costs, which may be difficult. Consequently, this estimation may overstate the total revenue attributable to the policy. On the other hand, in reality, fossil fuel production over many decades in DRC may not be as low as in the FH and RF + FH scenarios, which would produce additional revenue from increased fossil fuel generation activity.
4.4. Losses from Renewable Energy Technology Subsidy
In the RF and RF + FH scenarios, a 16% subsidy was applied to RETs to catalyse additional renewable energy generation to meet the demand. To quantify the cost to the DRC government of introducing this subsidy, a similar approach can be taken as with the tax, but with analysis focused instead on the UNC scenario. For this scenario, the costs of all technologies are unaffected by the policies introduced to create the subsequent scenarios, so it was assumed that the VAT and customs import duties are collected on all technologies when they are installed including RETs. VAT and customs import duties are not applicable to fixed costs, and RETs do not have variable costs because they do not require fuel, so only capital costs are relevant. Calculating the undiscounted capital costs for all RETs in the UNC scenario yielded a total of $39.9 B. Sixteen percent of this value is $6.384 B, providing an estimate for the government revenue lost (or cost incurred) in the RF and RF + FH scenarios when the subsidy is introduced.
4.5. Revised Total System Costs
Based on the calculations above, the updated total system costs inclusive of the policy impacts of each scenario are shown in Figure 6. Costs for the UNC and BAU scenarios remained the same, while the RF scenario cost increased from the subsidy, and the FH scenario cost decreased from the tax. The RF + FH scenario cost both increased from the subsidy and decreased from the tax, but since the revenue generated from the tax exceeded the cost of the subsidy, the net change for RF + FH was a cost reduction. Previously, before the policy costs were included, the RF scenario was the cheapest overall, but with the updated system costs that account for the policy costs, the FH scenario becomes the cheapest. The policy pathway scenarios remained cost competitive with each other when the total cost for the model period including the government costs was considered.

Figure 6.
Updated total discounted costs of all scenarios, inclusive of policy costs (tax and subsidy) for relevant scenarios.
4.6. Emissions Profile
Plotting CO2e emissions over the model period demonstrated differences in emissions over time based on the emissions associated with operational energy production technologies unique to each scenario (Figure 3). The BAU scenario represents the most likely development of the DRC energy system without additional intervention. The policy scenarios are necessary to bring the emissions profile in line with UNC. Although UNC is the least cost scenario, it cannot be “achieved”, since doing nothing would align development with BAU, so UNC was used only as a reference. The BAU scenario diverged significantly from the other scenarios because of the presence of fossil fuel subsidies and an inconsistent application of the renewable energy VAT and customs import duty exemption, both of which were all or partly corrected through the fossil fuel tax applied in FH and RF + FH and the RET subsidy applied in RF and RF + FH.
The BAU scenario had the highest annual emissions overall for the entire duration, likely largely due to the constraint on off-grid RETs. Around 2055, the BAU emissions dipped substantially, which is likely attributable to several fossil fuel plants built earlier in the modelling period meeting the ends of their operational lives at the same time. The emissions trajectories for the remaining scenarios stayed constant until around 2050 and then began to diverge. As described previously, DRC’s current NDC is a 2030 target of a 21% reduction. Therefore, in this study, emissions across scenarios were evaluated against a hypothetical emissions reduction rate of 21% from 2021 to 2030 that was held constant past 2030 for the remainder of the model period, assuming that DRC will commit to post-2030 emissions reduction NDCs or targets that are at least as ambitious as the present one (see the blue dotted line in Figure 7). Notably only the FH and RF + FH scenarios achieved a level of ambition in-line with the NDC. These results show that as electricity demand increases substantially in DRC in the coming decades, the power sector is likely to make a larger contribution to emissions than in the past, signifying the importance of more substantial emissions mitigation actions in other sectors.
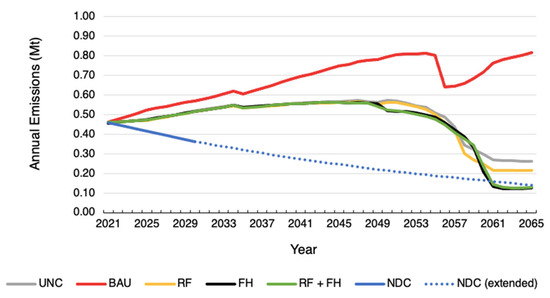
Figure 7.
Model period CO2e emissions plotted for all scenarios compared to the current 2030 NDC and future projected NDC for DRC.
Considering the cumulative emissions for the period from 2021 through to 2065, the RF + FH scenario had the lowest level of emissions, followed closely by the FH scenario. The RF and UNC scenarios had similar cumulative emissions, while emissions for BAU were the greatest (46% higher than the RF + FH scenario).
4.7. Post-Modelling Market Potential Assessment
A one-factor learning curve calculation was applied in this study based on the modelled scenario outputs. Known as a market potential assessment, this analysis shows the additional cost reduction possible from the projected demand due to learning-by-doing. This assessment was performed on OSeMOSYS model outputs and was separate from and subsequent to the modelling. In four out of five scenarios (including RF + FH, the scenario with the highest proportion of RETs), 50 GW of a small SHS cumulative capacity was reached by the end of the model period, demonstrating a substantial contribution to off-grid generation. Notably, because OSeMOSYS is a least cost model, the significant investment in small SHSs across most scenarios indicates that this technology provides the cost-optimal solution for meeting off-grid demand (see the technology costs and energy demand included in the modelling in Table A5 and Table A11, respectively). An off-grid technology was prioritised for this additional assessment since off-grid supply could make up more than 40% of the total energy generation in DRC by 2030 [46]. As a worked example, because the rated power of the small SHS is 0.3 kW, then for a specified year, the total cumulative capacity of the small SHS in each year in kW divided by their 0.3 kW size yields the values of A needed for Equation (1). Capital cost inputs in OSeMOSYS are represented in USD/kW, so for a specified year result in the initial per unit costs used for UC0 in Equation (1). Using the model cost inputs and capacity outputs from the RF + FH scenario and Equations (1)–(3) yielded the values in Table 3. There was no small SHS capacity added in the scenario in 2021, so the values for A0 and UC0 used in Equation (1) were based on the initial capacity added in 2026.
Table 3.
Parameters for small SHS market potential calculation using a 23% LR and Equation (1).
Figure 8 plots the relationship between the unit cost and manufacturing volume at all three learning rates, and the resulting curves were fit with power function trendlines. From an initial capital unit cost of USD519.30 in 2021, the unit cost of the small SHS is projected to reduce considerably once 166 million units are deployed. For the high, mean, and low LRs, the minimised cost at that level of deployment is USD51.82 (90% reduction), USD134.86 (74% reduction), and USD201.08 (61% reduction), respectively. For all three learning rates, by 2031, there is at least a 50% cost reduction when 33.2 million units are installed, which is roughly one-fifth of the total volume needed to support off-grid demand through to 2065. At a 23% LR, in later years, the trajectory of cost reduction from the projected demand converged toward the costs incorporated in the RF + FH scenario (Table 4).
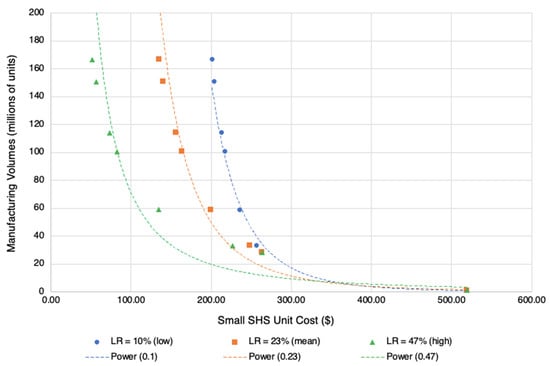
Figure 8.
Additional post-model capital cost reduction for a 0.3 kW SHS driven by installed capacity at three possible learning rates for solar PV in the RF + FH scenario fit with power function trendlines.
Table 4.
Comparison of capital unit costs for a 0.3 kW SHS used as inputs for the RF + FH scenario and the demand-based capital unit costs for the same system from the market potential assessment using a 23% LR.
After the initial year of 2026, the unit costs from the market potential assessment were higher than those input in the model, but the difference between the two costs decreased over time. For the 47% LR, the market potential assessment unit costs were much lower than the model input unit costs. As a result, for LRs greater than 23%, the annual capital unit cost reductions from the projected demand are likely to be higher than those achieved by the RF + FH policies alone.
Overall, in the context of the RF + FH scenario and the policies that enable it, the market potential assessment suggests that there is sufficient demand for small SHSs in the DRC market to substantially reduce the unit cost as deployment scales.
5. Discussion
Seven key takeaways summarise the results from the model runs and succeeding market potential assessment. (1) In no scenario does on-grid hydropower come close to DRC’s potential for this renewable energy resource. (2) Instead, solar PV approaches or hits its on-grid capacity limit in all scenarios. (3) Likewise, supply from off-grid SHSs dwarfs decentralised hydro, with the 0.3 kW SHS contributing the most of all the off-grid technologies in scenarios where off-grid RETs are permitted. (4) The generation mix in 2065 was the highest for the RF + FH scenario at 91.4% and next highest for FH at 90.1%. (5) Only the FH and RF + FH scenarios have emissions profiles that ultimately meet DRC’s projected future NDC. (6) Accounting for the total discounted capital, fixed, and variable costs for the model period, RF is the cheapest scenario, however, FH becomes the most affordable scenario once the costs and benefits to the government of the policies implied by the scenarios are considered. (7) A market potential assessment on the 0.3 kW SHS shows that at only one-fifth of the total deployment in all policy pathways, more than 50% of the cost reduction from learning-by-doing is achieved.
5.1. Generation and Capacity Profile
In the current study, the RF, FH, and RF + FH scenarios all included policies that are favourable for decentralised RETs, and renewables make up 70%, 90%, and 91%, respectively, of the total energy production in 2065. Diverging from the current hydropower dominated energy mix in DRC, hydropower comprises only a small amount of the total capacity in all scenarios modelled in this study. In fact, no scenarios included further investment in large hydropower beyond residual capacity. Despite DRC’s large hydropower potential, and even under the hydropower capital cost reductions included in the RF and RF + FH scenarios, hydropower is not a least cost option for meeting demand. These results are consistent with analysis by Oyewo et al. [14], who concluded that the power production intended for the continually delayed large hydropower Grand Inga project could instead be achieved through solar PV and other renewables. Results from this study suggest that having hydropower play more than a very minor role in future energy production for DRC will not be the cost-optimal solution.
5.2. Total System Costs
Across the five scenarios, the total discounted system costs exceed the Africa Energy Outlook cost projection [13]. The IEA’s sustainable development in Africa scenario estimates USD199.4 B in total energy costs for DRC for the period from 2019 to 2040 [13]. Converting to 2021 USD as used in this study, this amounts to a total cost of USD215.1 B. From 2021 to 2040, the cheapest scenarios in this study were RF and RF + FH, both costing approximately USD247.4 B, which is 15% more expensive, while also including two fewer years. Since no other future cost projections for the DRC energy system were identified for comparison, this study provides a helpful contribution to the literature on the cost of a sustainable transition. The IEA cost provides a lower bound and this study’s total system cost is an upper bound, but with more recent data, the current study’s USD247.4 B output for 2021–2040 may provide a more up-to-date picture of the costs.
5.3. Emissions Profile
A similar comparison to other research can be made for emissions. Relative to UNC, which includes no policy intervention, the cumulative emissions from the FH scenario were 5.19% lower. Modelling covering five LMICs by Abbas et al. [50] found that every 1% increase in environmental taxes (including market-based financial instruments) resulted in a 0.22–0.91% reduction in CO2e emissions. Based on this finding, the 70% tax on fossil fuel energy production in FH would be expected to reduce emissions 15.4–63.7%. Therefore, DRC’s energy mix may not be as responsive to environmental tax interventions as other countries. A possible explanation for this difference might be DRC’s lower level of development relative to Brazil, Russia, India, China, and South Africa (BRICS), the countries covered in the study by Abbas et al. [50]. Additionally, the total emissions impact of the proposed fossil fuel tax in this study would extend beyond the power sector, meaning that emissions reductions from the FH scenario are likely to be underestimated. Another reason may be that DRC’s emissions from energy production are already very low at 98% renewable, which is different from BRICS countries. A comparison to results from countries more like DRC would be more relevant, but this was not possible based on the existing literature.
5.4. Market Potential Assessment
Profit margins for companies that manufacture SHSs for distribution in developing countries are low. Viable business models must therefore rely on large sale volumes to generate sufficient revenue to make this product segment worthwhile. The results of the market potential assessment on a 0.3 kW sized SHS showed that at volumes of more than 150 million units, which were present across all policy pathways, the unit capital costs decrease as deployment rises at the expected LRs for solar PV.
5.5. Limitations and Future Research
Many of the results in this study are particularly sensitive to cost inputs for both RETs and non-RETs, with capital cost making the largest difference, since this makes up more than 90% of the total costs for all RETs. Where available, technoeconomic parameters specific to DRC were prioritised, followed by Africa-specific data, and as a last resort, global data. Energy and cost data specific to DRC and other sub-Saharan African countries is often out-of-date, and, when accessible, typically only as secondary datasets from non-peer reviewed sources.
TEMBA was the only data source identified that provided an annual energy demand projection for 2021–2070 specific to DRC. According to TEMBA, the total annual industrial, commercial, and residential energy demand in DRC will increase more than 32 times over this time period [44]. Future research is recommended to understand differences in the policy pathway effects used in this study under alternate demand projections.
A review of the research base for power systems planning in West African countries found that the majority of studies have been conducted by foreign scholars, organisations, and research agencies [51]. This study contributes to that majority. A key benefit of the OSeMOSYS modelling method is its much lower complexity and learning time, which should make it easier for uptake by LMIC energy planners. However, OSeMOSYS-based literature in West African countries is scarce [51]. It is hoped that the transparency of this study will spur engagement and discourse with DRC entities who are best equipped to leverage it for positive change.
6. Conclusions
This study set out to answer the research question of which actions and policies the DRC government can implement to build a sustainable and cost-effective energy system. Specifically, this entails encouraging the growth of and investment in a national energy system that uses a high mix of renewable energy. The results and analysis of the scenarios modelled in this study highlight two policy pathways as the most favourable for the DRC energy system: Fossil Hostile and Renewable Friendly + Fossil Hostile. Each has its advantages. Fossil Hostile had the lowest net costs (USD304 B) for the results period, even considering the cost reduction from the subsidy for Renewable Friendly + Fossil Hostile. In terms of renewable mix and emissions, however, Renewable Friendly + Fossil Hostile (91% RETs and 20.80 Mt) performed slightly better than Fossil Hostile (90% RETs and 20.83 Mt) by 2065. Out of the three policy scenarios, Renewable Friendly had the highest ratio of fossil fuel capacity, the poorest emissions profile (both cumulatively at 21.32 Mt and over time), and it was the costliest (USD315 B). In summary, four policy recommendations addressed to the DRC government arose from this study, which satisfy the overall research objective.
Recommendation 1.
Pursue financial incentives to catalyse DRC’s renewable energy supply.
Based on DRC’s level of development and political administrative capabilities, market-based instruments are the most sensible policy for increasing renewable energy capacity. Implement renewable energy financial incentives in the near-term to achieve compounding results in RET growth, FDI, and development.
Recommendation 2.
Tax fossil fuel energy production.
Because a fossil fuel tax was part of both of the two most favourable policy pathways, explore implementing this policy. In particular, a simple starting place could be eliminating the VAT exemption for fossil fuel production operations.
Recommendation 3.
Re-evaluate focus on hydropower.
Limited budgets require a careful allocation of funds. This study showed a marked lack of hydropower in the DRC energy mix across all scenarios, with a much greater focus on solar energy. Perform additional analysis to validate the results from this study: the cheapest renewable solutions for the long-term may not involve large hydropower projects.
Recommendation 4.
Promote DRC as a healthy market for solar home systems.
The market potential assessment performed as part of this study shows that 0.3 kW SHSs are deployed in the policy pathways at sufficient volumes to drive down the unit capital costs. Use the results of this study in communications with external organisations to promote FDI in this RET, which looks to be essential for DRC’s sustainable energy evolution.
Author Contributions
Conceptualisation, J.D.; Methodology, J.D.; Software, M.H.; Validation, G.O.; Formal analysis, J.D.; Investigation, J.D.; Resources, C.C., R.Y. and N.T.; Data curation, C.C.; Writing—original draft preparation, J.D.; Writing—review and editing, G.O.; Visualisation, J.D.; Supervision, G.O. and M.H.; Project administration, J.D.; Funding acquisition, M.H. All authors have read and agreed to the published version of the manuscript.
Funding
For this research, Climate Compatible Growth (CCG) contributed in funding the time dedication of the co-authors for the production of this material, and CCG funded the publishing fees associated with the publishing of this material (APC).
Data Availability Statement
The datasets and modelling files presented in this study are openly available in the Zenodo repository DOI:10.5281/zenodo.7779511, reference number 7779511.
Acknowledgments
This material has been produced under the Climate Compatible Growth (CCG) programme, which brings together leading research organizations and is led out of the STEER Centre, Loughborough University. CCG contributed in funding the time dedication of the co-authors for the production of this material, and CCG funded the publishing fees associated with the publishing of this material. CCG is funded by the Foreign, Commonwealth and Development Office (FCDO) from the UK government. However, the views expressed herein do not necessarily reflect the UK government’s official policies.
Conflicts of Interest
The authors declare no conflict of interest. The funders had no role in the design of the study; in the collection, analyses, or interpretation of data; in the writing of the manuscript, or in the decision to publish the results.
Appendix A. Additional Modelling Assumptions
A critical component of this study is the use of Open Source Energy Modelling System (OSeMOSYS), which is a bottom–up energy systems optimisation model that is useful for energy infrastructure planning at a country, regional, or global level. Fundamental to OSeMOSYS is its optimisation objective to generate the lowest net present cost energy system to meet the endogenously defined demand for a geography. Unique modelling scenarios can be specified using researcher-defined energy generation technologies and by inputting the cost, activity, capacity, and/or emissions constraints that the model must obey [40]. In an effort to make this study as practical as possible and to allow it to serve as an input for future research, emphasis was put on ensuring data retrievability; model reusability, repeatability, reconstructability, and interoperability; and overall auditability, recommended by [52] as best practices in energy modelling for policy support.
See Table A1 for descriptions of all the technologies included in the OSeMOSYS model for this study.
Table A1.
One-to-one mapping of all the power generating technologies included in all of the modelled scenarios and their respective technology codes.
Table A1.
One-to-one mapping of all the power generating technologies included in all of the modelled scenarios and their respective technology codes.
| Technology | OSeMOSYS Technology Code Used |
|---|---|
| Biomass Power Plant | PWRBIO001 |
| Coal Power Plant | PWRCOA001 |
| Geothermal Power Plant | PWRGEO |
| Light Fuel Oil Power Plant | PWROHC001 |
| Oil Fired Gas Turbine (SCGT) | PWROHC002 |
| Off-Grid Diesel Generator (Decentralised) (1 kW) | PWROHC003 |
| Gas Power Plant (CCGT) | PWRNGS001 |
| Gas Power Plant (SCGT) | PWRNGS002 |
| Solar PV (Utility) | PWRSOL001 |
| Solar PV (Utility) with 2-h storage | PWRSOL001S |
| Solar PV (Distributed) with 2-h storage (mini-grid) | PWRSOL002 |
| Medium Solar PV (Decentralised) with 2-h storage (1 kW off-grid solar home system) | PWRSOL003 |
| Small Solar PV (Decentralised) with 2-h storage (0.3 kW off-grid solar home system) | PWRSOL004 |
| CSP without Storage | PWRCSP001 |
| CSP with Storage | PWRCSP002 |
| Large Hydropower Plant (Dam) (>100 MW) | PWRHYD001 |
| Medium Hydropower Plant (10–100 MW) | PWRHYD002 |
| Small Hydropower Plant (<10 MW) | PWRHYD003 |
| Off-Grid Hydropower | PWRHYD004 |
| Onshore Wind | PWRWND001 |
For the parameter data values not mentioned explicitly in this document, values from Cannone et al. [43] were used. An overview of the relevant OSeMOSYS parameters is provided in Table A2.
Table A2.
Names, descriptions, and units of key OSeMOSYS parameters necessary for modelling [40,53].
Table A2.
Names, descriptions, and units of key OSeMOSYS parameters necessary for modelling [40,53].
| OSeMOSYS Parameter | Description | Units |
|---|---|---|
| CapitalCost | The one-time cost of creating a technology (assumed as overnight cost, so not spread over more than one year) | USD/kW |
| CapacityFactor | Ratio of actual energy output over maximum energy output applied to each timeslice | - |
| FixedCost | Recurring annual costs for operating and maintaining a technology | USD/kW/year |
| OperationalLife | How long a technology can function after it is created | years |
| SpecifiedAnnualDemand | Aggregated total demand for the year | PJ/year |
| SpecifiedDemandProfile | The annual fraction of energy-service or fuel demand that is required in each timeslice (sums to 1 for all technologies) | |
| ReserveMargin | The reserve level of installed capacity for a particular year | GW |
| TotalAnnualMaxCapacityInvestment | Constraint to put an upper limit on investment in new capacity of a technology for a specified year | GW/year |
| TotalAnnualMinCapacityInvestment | Constraint to put a lower limit on investment in new capacity of a technology for a specified year | GW/year |
| TotalAnnualMaxCapacity | Constraint to put an upper limit on the sum of all technology capacity allowed for a specific year | GW/year |
| TotalAnnualMinCapacity | Constraint to put a lower limit on the sum of all technology capacity allowed for a specific year | GW/year |
| TotalTechnologyAnnualActivityUpperLimit | Constraint to put an upper limit on the amount of production activity for a technology in a specific year | PJ/year |
| TotalTechnologyAnnualActivityLowerLimit | Constraint to put a lower limit on the amount of production activity for a technology in a specific year | PJ/year |
| VariableCost | Cost per unit of activity for a technology | USD/kW |
| CapitalCost | The one-time cost of creating a technology (assumed as overnight cost, so not spread over more than one year) | USD/kW |
| CapacityFactor | Ratio of actual energy output over maximum energy output applied to each timeslice | - |
| FixedCost | Recurring annual costs for operating and maintaining a technology | USD/kW/year |
| OperationalLife | How long a technology can function after it is created | years |
| SpecifiedAnnualDemand | Aggregated total demand for the year | PJ/year |
| SpecifiedDemandProfile | The annual fraction of energy-service or fuel demand that is required in each timeslice (will sum to 1 for all technologies) |
Appendix A.1. Electricity Demand Profile
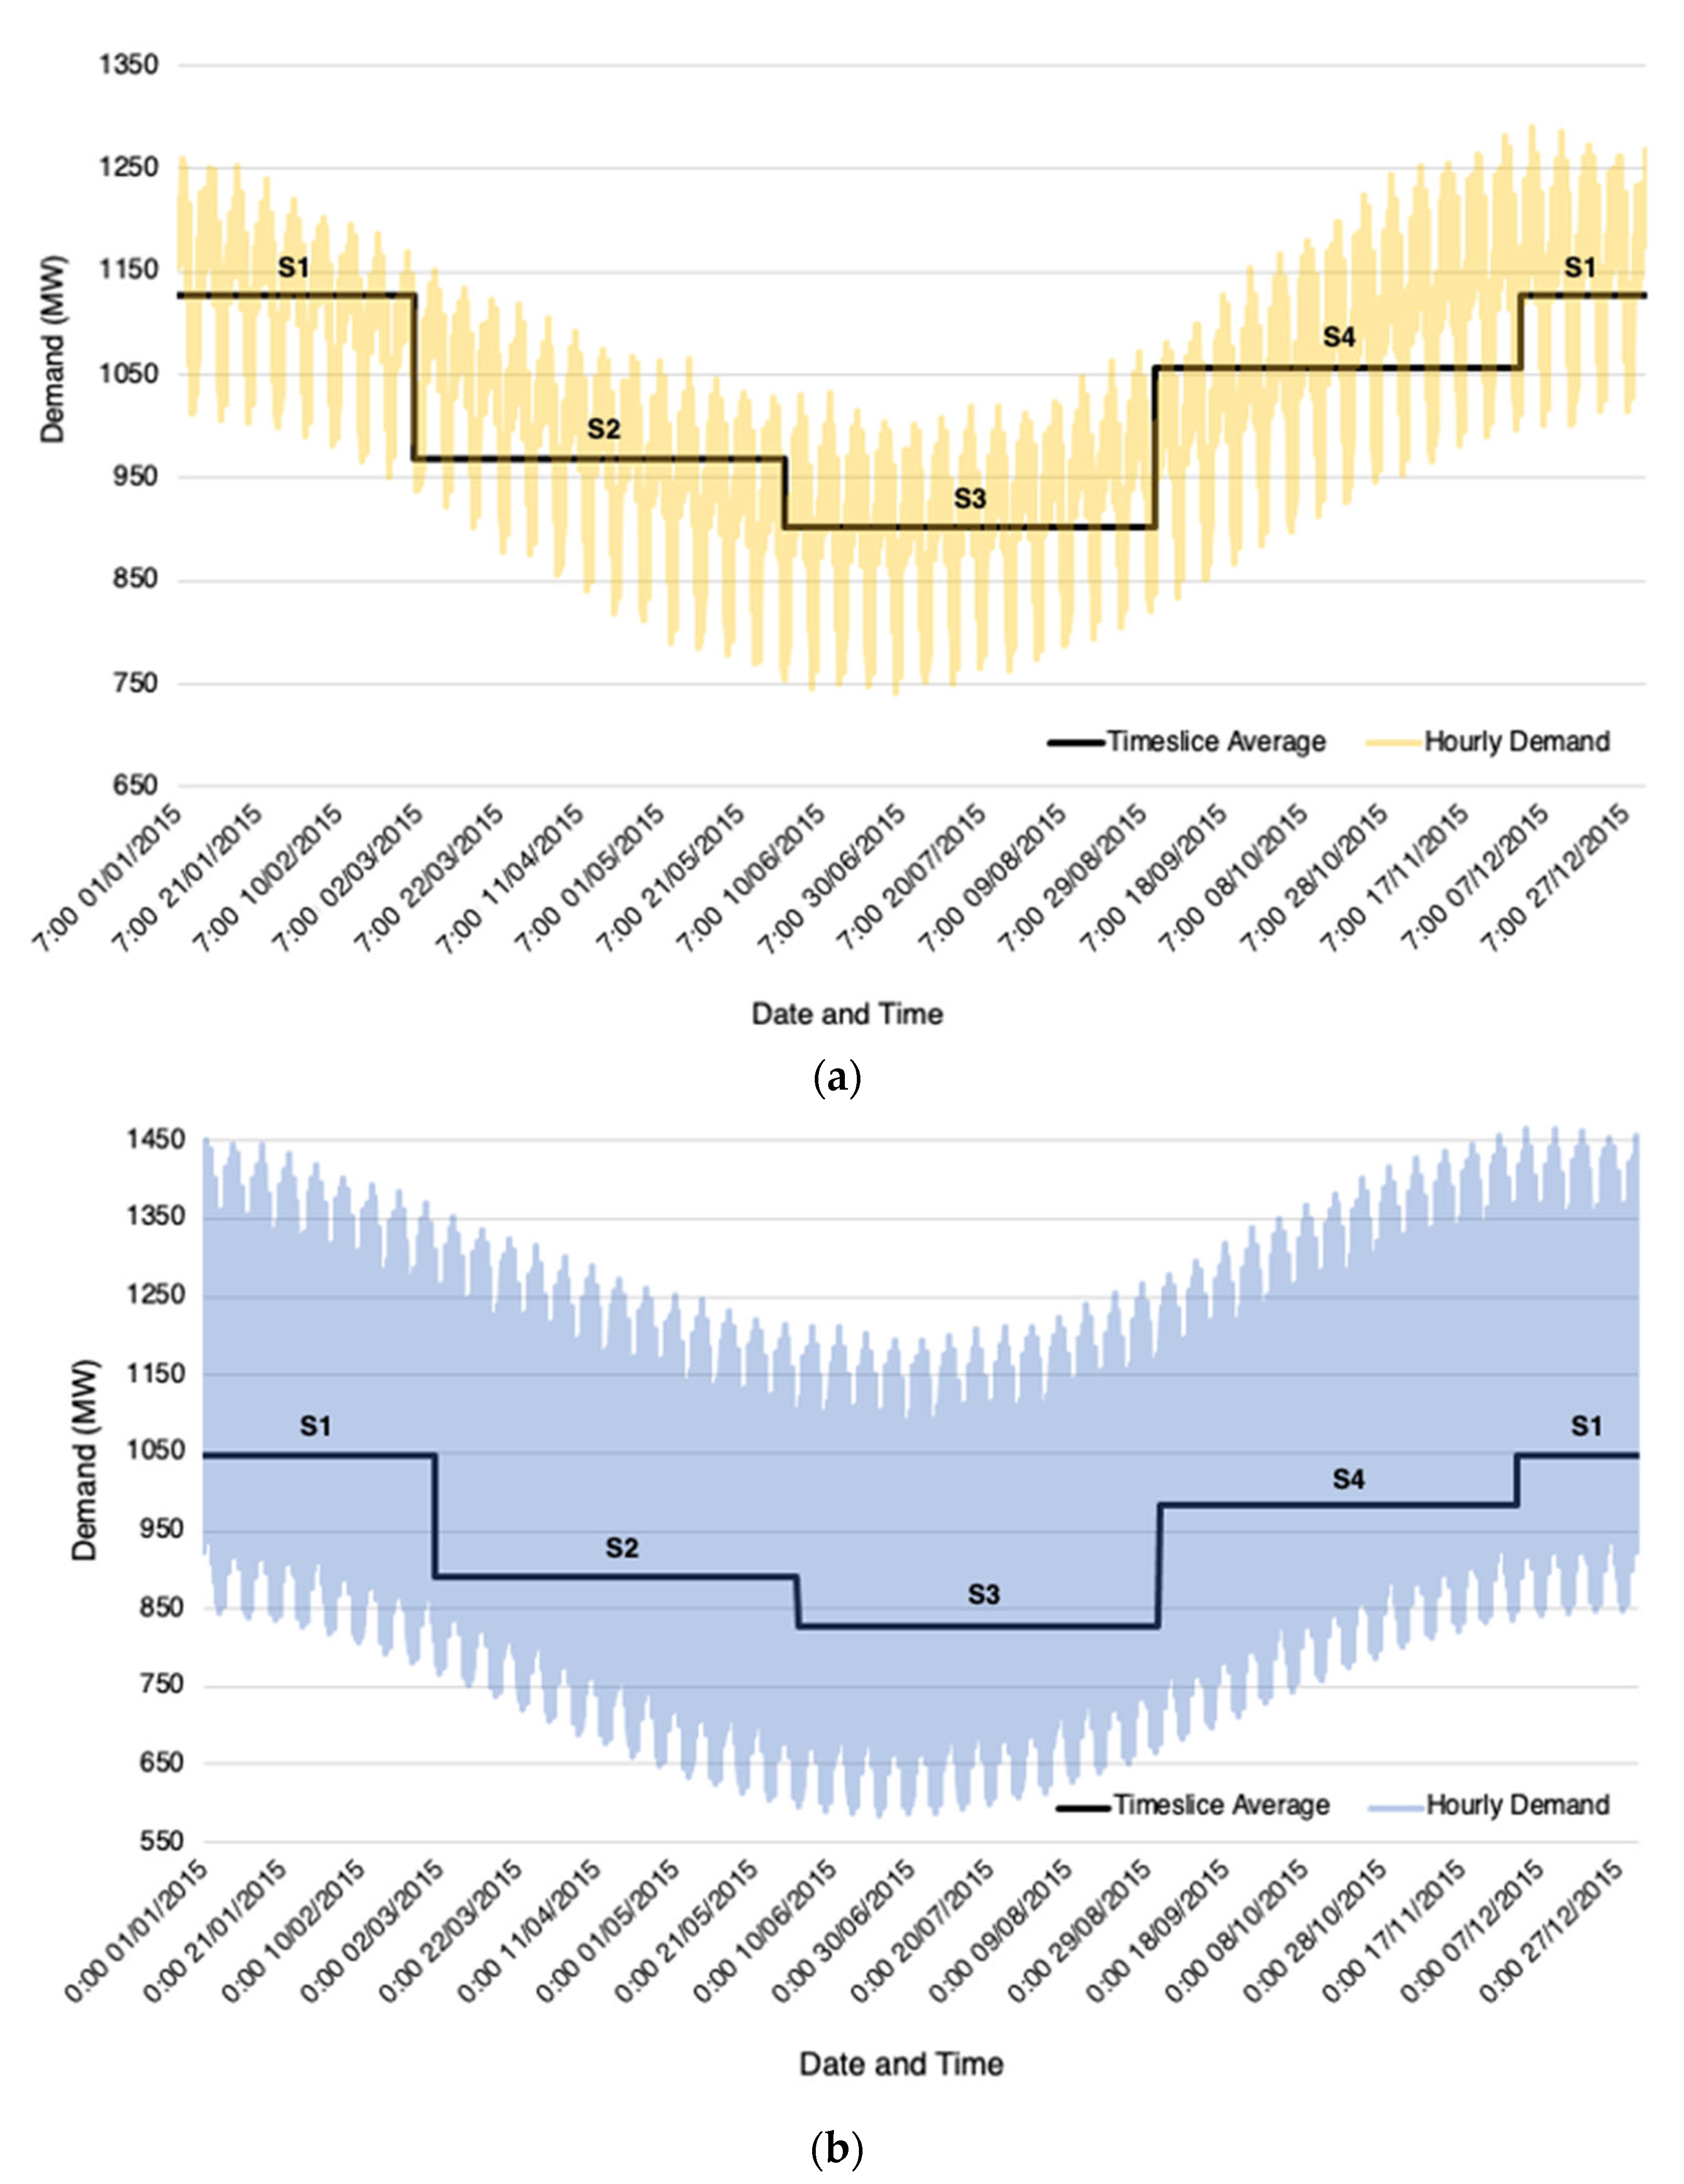
Energy demands on the grid fluctuate from moment to moment, but to better represent temporal demand, country data can be aggregated by the hour. For DRC, the most recent hourly demand dataset identified was based on the calendar year 2015 and was extracted from the PLEXOS-World dataset, which provides country-specific energy data [54].
Demands were assumed to be for electricity consumption within DRC and did not include additional demands for electricity export. For this study, the year was segmented into four seasons (S1 from December to February, S2 from March to May, S3 from June to August, and S4 from September to November) and two dayparts (D1 “day” from 07:00 to 19:00 and D2 “night” from 19:00 to 07:00 West African Standard Time). Thus, the four seasons and two dayparts combine to form eight timeslices.
Figure A1 shows the average annual demand by timeslice for both dayparts in comparison to the annual demand data. Reasonable model solve times and the overall shape of the annual demand profile matching the timeslice averages justified the use of eight timeslices. In addition, for some technologies, data inputs such as capacity factors were not available at more specific time granularities, so using more than eight timeslices would have introduced unnecessary model complexity. It is important to note that the consolidation of a year into timeslices is a simplification of reality, which is true of all models.
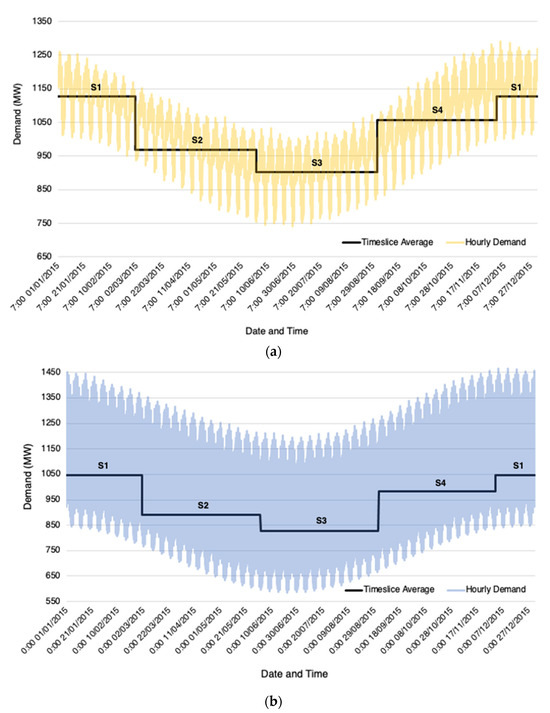
Figure A1.
(a) The 2015 hourly demand versus the timeslice average for D1 “day” hours and (b) D2 “night” hours for all four seasons in DRC, adapted from [55].
Figure A1.
(a) The 2015 hourly demand versus the timeslice average for D1 “day” hours and (b) D2 “night” hours for all four seasons in DRC, adapted from [55].
Appendix A.2. Supplying Off-Grid Generation
Five different off-grid technology types were defined for this study: one oil-based diesel generator, and four RETs (Table 1). Because of DRC’s large hydro potential, off-grid hydropower was included. Other studies promote the use of mini-grids and solar home systems (SHSs) as off-grid solutions in the Congo River Basin or in developing African countries with low electrification rates like DRC [14,56], so these technologies were included in the modelling. Collectively, activity from these five technologies must fulfil (but cannot exceed) the annual off-grid demand for all years as defined in Figure 2, subject to additional scenario-specific constraints. Achieving this using OSeMOSYS required grouping these five technologies and introducing constraints to force the production activity of this off-grid technologies group to exactly meet the off-grid demand (Table A3).
Table A3.
Constraints applied in all scenarios except BAU to the off-grid dummy grouping technology in order to force the model to exactly meet but not exceed or fall short of the aggregated off-grid demand for all years. For the BAU scenario, these constraints on the dummy grouping technology were removed and instead applied directly to the off-grid diesel generator technology to force it to meet all aggregated off-grid demand for all years.
| Technology | Dummy Grouping Technology | TotalTechnologyAnnualActivityLowerLimit (GW) | TotalTechnologyAnnualActivityUpperLimit (GW) |
|---|---|---|---|
| Off-Grid Diesel Generator (Decentralised) (1 kW) | “Off-grid technologies” | Total off-grid demand minus 0.01 | Total off-grid demand plus 0.01 |
| Solar PV (Distributed) with 2-h storage (mini-grid) | |||
| Medium Solar PV (Decentralised) with 2-h storage (1 kW off-grid solar home system (SHS)) | |||
| Small Solar PV (Decentralised) with 2-h storage (0.3 kW off-grid solar home system) | |||
| Off-Grid Hydropower |
Appendix A.3. Residual Capacity
For some technologies, known currently installed capacities needed to be accounted for in the model. These capacities installed before the beginning of the model period are known as residual capacities. All residual capacities are listed in Table A4.
Table A4.
Residual capacities for technologies introduced in all scenarios from 2021 and then kept constant for all future years across all scenarios [43].
Table A4.
Residual capacities for technologies introduced in all scenarios from 2021 and then kept constant for all future years across all scenarios [43].
| Technology | Residual Capacity (GW) |
|---|---|
| Oil Fired Gas Turbine (SCGT) | 0.013 |
| Gas Power Plant (SCGT) | 0.025 |
| Solar PV (Distributed) with 2-h storage (mini-grid) | 0.018895 |
| Large Hydropower Plant (Dam) (>100 MW) | 2.533 |
| Medium Hydropower Plant (10–100 MW) | 0.418 |
| Off-Grid Hydropower | 0.1416 |
| Power Transmission | 1.18897 |
Appendix A.4. Capacity Factors
For all solar PV and wind technologies included in the model, capacity factors were updated based on hourly solar and wind generation potential for 2019 from Renewables Ninja for Kinshasa, DRC (−4.3217, 15.3126) [57,58]. Capacity factors for hydropower technologies were based on 15-year averages from the PLEXOS-World dataset [44]. Hourly capacity factors were consolidated into the eight timeslices previously defined. All capacity factors are listed in Table A5.
Table A5.
Foundational technoeconomic data used as model inputs for the UNC scenario. NB: Other scenarios use updated costs as outlined in the Methods section.
Table A5.
Foundational technoeconomic data used as model inputs for the UNC scenario. NB: Other scenarios use updated costs as outlined in the Methods section.
| Technology | OSeMOSYS Technology Code Used | On-Grid or Off-Grid | Capital Cost (USD/kW in 2021) [20,59,60,61,62] | Fixed Cost (USD/kW/yr in 2021) [59,60,62,63] | Operational Life (Years) [59,60,62,63,64] | Efficiency [59,60,62,64] | Average Capacity Factor [57,58,59,60,62] |
|---|---|---|---|---|---|---|---|
| Biomass Power Plant | PWRBIO001 | On-grid | 2500 | 75 | 30 | 35% | 0.5 |
| Coal Power Plant | PWRCOA001 | On-grid | 2500 | 78 | 35 | 37% | 0.85 |
| Geothermal Power Plant | PWRGEO | On-grid | 3500 | 120 | 25 | 80% | 0.79 |
| Light Fuel Oil Power Plant | PWROHC001 | On-grid | 1200 | 35 | 25 | 35% | 0.8 |
| Oil Fired Gas Turbine (SCGT) | PWROHC002 | On-grid | 1450 | 45 | 25 | 35% | 0.8 |
| Off-Grid Diesel Generator (Decentralised) (1 kW) | PWROHC003 | Off-grid | 750 | 23 | 10 | 16% | 0.3 |
| Gas Power Plant (CCGT) | PWRNGS001 | On-grid | 1200 | 35 | 30 | 48% | 0.85 |
| Gas Power Plant (SCGT) | PWRNGS002 | On-grid | 700 | 20 | 25 | 30% | 0.85 |
| Solar PV (Utility) | PWRSOL001 | On-grid | 900 | 17.91 | 24 | 100% | S1D1: 0.250 S2D1: 0.308 S3D1: 0.350 S4D1: 0.263 S1D2: 0.044 S2D2: 0.042 S3D2: 0.046 S4D2: 0.041 |
| Solar PV (Utility) with 2-h storage | PWRSOL001S | On-grid | 1360 | 17.91 | 24 | 100% | |
| Solar PV (Distributed) with 2-h storage (mini-grid) | PWRSOL002 | Off-grid | 4139 | 86.4 | 24 | 100% | |
| Medium Solar PV (Decentralised) with 2-h storage (1 kW off-grid solar home system) | PWRSOL003 | Off-grid | 2700 | 16.5 | 20 | 100% | |
| Small Solar PV (Decentralised) with 2-h storage (0.3 kW off-grid solar home system) | PWRSOL004 | Off-grid | 1731 | 16.5 | 20 | 100% | |
| CSP without Storage | PWRCSP001 | On-grid | 3900 | 40.58 | 30 | 100% | 0.45 |
| CSP with Storage | PWRCSP002 | On-grid | 5572 | 57.97 | 30 | 100% | 0.45 |
| Large Hydropower Plant (Dam) (>100 MW) | PWRHYD001 | On-grid | 3000 | 90 | 50 | 100% | 0.34 |
| Medium Hydropower Plant (10–100 MW) | PWRHYD002 | On-grid | 2500 | 75 | 50 | 100% | 0.34 |
| Small Hydropower Plant (<10 MW) | PWRHYD003 | On-grid | 3000 | 90 | 50 | 100% | 0.34 |
| Off-Grid Hydropower | PWRHYD004 | Off-grid | 3000 | 90 | 50 | 100% | 0.34 |
| Onshore Wind | PWRWND001 | On-grid | 1429 | 59.56 | 25 | 100% | S1D1: 0.018 S2D1: 0.018 S3D1: 0.036 S4D1: 0.021 S1D2: 0.031 S2D2: 0.029 S3D2: 0.094 S4D2: 0.034 |
[20]: DRC-specific data. [57,58]: DRC-specific averages calculated using hourly data. [59,60,61,62]: Africa-specific data. [63]: Global data. [64]: Africa-specific data.
Appendix A.5. Financial
A discount rate of 10% was used across all model scenarios since this is in-line with the public cost of capital for renewable projects in DRC [65]. All cost inputs were in 2021 USD, and all foundational technoeconomic parameter model inputs are listed in Table A5.
Appendix A.6. Power System Flexibility
Deep analysis of system flexibility was out of scope of this study. However, constraints on the maximum annual activity constraints were placed on all non-fossil fuel technologies in all scenarios to ensure that the DRC power system could still operate successfully, even at very high proportions of renewable generation (see Table A6). These specific flexibility assumptions are recommended by Cannone et al. [43] in the starter data kit for energy system modelling in DRC.
Table A6.
Maximum annual activity limit placed on renewable technologies for flexibility [43].
Table A6.
Maximum annual activity limit placed on renewable technologies for flexibility [43].
| Technology Description | Annual Activity Upper Limit (% of Total Annual Demand) |
|---|---|
| Solar PV Plant | 15% |
| Solar PV with 2 h storage | 15% |
| Onshore Wind Plant | 15% |
| Geothermal Plant | 15% |
| Biomass Plant | 30% |
Appendix A.7. Projected Technology Capital Cost Reduction
For most electricity supply technologies, capital costs are projected to decrease each year based on additional research and development, changes in input prices, resource efficiency, and volumes of technology deployment [49]. In this study, the rates of capital cost reduction were calculated using the National Renewable Energy Laboratory’s Annual Technology Baseline [66], which provides capital cost projections in terms of USD per kilowatt (kW) by technology up to 2050. The year-over-year percentage decrease in technology cost was averaged from 2021 to 2030 and from 2030 to 2050. Capital costs beyond 2050 were held constant in the absence of additional data. Although capital costs for technologies varied across scenarios, these rates of decrease in cost were applied consistently. Further details on the defined capital cost reductions rates are listed in Table A7.
Table A7.
Specific short-, medium-, and long-term capital cost reduction rates applied to generation technologies as model inputs for all scenarios unless stated otherwise [20,43,66].
Table A7.
Specific short-, medium-, and long-term capital cost reduction rates applied to generation technologies as model inputs for all scenarios unless stated otherwise [20,43,66].
| Technology | Annual Capital Cost Reduction Rate | ||
|---|---|---|---|
| 2022–2030 | 2031–2050 | 2051–2070 | |
| Biomass Power Plant | 0.65% | 0.65% | 0% |
| Coal Power Plant | 1.4% | 1.4% | 0% |
| Geothermal Power Plant | 1.8% | 0.05% | 0% |
| Light Fuel Oil and Oil Fired SCGT Power Plants and Off-Grid Diesel Generator | 1.7% | 1.7% | 0% |
| SCGT and CCGT Gas Power Plants | 0% | 0% | 0% |
| Solar PV (Utility) | 4.7% | 1.3% | 0% |
| Solar PV (Utility) with 2-h storage | 6.3% | 1.1% | 0% |
| Solar PV (Distributed) with 2-h storage (mini-grid) | 4.6% | 1.3% | 0% |
| Medium Solar PV (Decentralised) with 2-h storage (1 kW off-grid solar home system) | 9.4% | 1.3% | 0% |
| Small Solar PV (Decentralised) with 2-h storage (0.3 kW off-grid solar home system) | 9.4% | 1.3% | 0% |
| CSP with and without storage | 4.3% | 0.1% | 0% |
| Small, Medium, and Large Hydropower Plants | 0.6% | 0% | 0% |
| Off-Grid Hydropower | 0% | 0% | 0% |
| Onshore Wind | 3.0% | 0.8% | 0% |
Appendix A.8. Constraints on Renewable Resource Potential and Annual Investment
Capacities can be constrained for the model period in OSeMOSYS using the maximum capacity and/or maximum investment parameters. To reflect DRC’s maximum hydropower capacity of 100–110 GW [12], capacity was capped at 50 GW for both large hydropower (>100 MW) and medium hydropower (10–100 MW) for all years. Geothermal was capped at 6.5 GW for all years [67]. Renewable technologies were also constrained in terms of annual capacity investment permitted in the model for all years (Table A8).
Table A8.
Maximum capacity investments included in the model by renewable technology type. Justifications from [2,68,69,70].
Table A8.
Maximum capacity investments included in the model by renewable technology type. Justifications from [2,68,69,70].
| Technology Type | Annual Max Capacity Constraint (GW) | Justification |
|---|---|---|
| Hydro | 5 | 20% of annual global hydro additions in 2020 |
| Wind | 5 | ~USD10 B annual investment limit for the cheapest technology |
| On-grid solar | 5 | |
| Off-grid solar | 2.5 | ~USD5 B annual investment limit for the cheapest solar technology |
Justifications for these limits explain how they prevent the model from producing unrealistic results. Table A9 summarises how these constraints were applied using OSeMOSYS parameters.
Table A9.
Summary of the constraints applied in specified model scenarios for all years.
Table A9.
Summary of the constraints applied in specified model scenarios for all years.
| Technology | TotalAnnualMaxCapacity (GW) 1 | TotalAnnualMaxCapacityInvestment (GW) 1 | TotalTechnologyAnnualActivityUpperLimit (GW) 1 | TotalAnnualMinimum Capacity (GW) 2 |
|---|---|---|---|---|
| Biomass Power Plant | - | - | 30% of total annual demand for all years | - |
| Large Hydropower Plant | 50 | 5 | - | - |
| Medium Hydropower Plant | 50 | 5 | - | 2022: 0 2025: 0.375 2030: 0.475 |
| Small Hydropower Plant | 15 | 5 | - | 2022: 0.088 2025: 0.266 2030: 0.119 |
| Off-Grid Hydropower | - | 5 | - | - |
| Geothermal Power Plant | 6.5 | - | 15% of total annual demand for all years | 2022: 0.004 2025: 0 2030: 0.005 |
| Solar PV w/2-h storage | - | - | 2022: 0.061 2025: 0.159 2030: 0.208 | |
| Other On-Grid Solar Power Plants | - | 5 | - | |
| Off-Grid Solar | - | 2.5 | - | - |
1 Applied to all scenarios. 2 Applied to BAU, RF, FH, and RF + FH.
Additional minimum investment constraints were applied by totalling the capacities for 343 utility-scale energy projects planned in DRC from 2022 to 2030 (Table A10). The maximum capacity for oil extraction was set to zero for all years because 100% of all DRC petroleum consumption for energy use comes from imported sources [71]. The scenarios BAU, RF, FH, and RF + FH all included these minimum investment constraints and prevented oil extraction. In BAU, it was assumed that no investment was made in off-grid renewable technologies. To achieve this, the activity limits placed on the grouped off-grid technologies were removed and instead placed on the diesel generator technology, forcing all off-grid generation to be realised by this technology (Table A3).
Table A10.
Government planned renewable energy projects through 2030 [20]. See source for further detail on individual planned projects.
Table A10.
Government planned renewable energy projects through 2030 [20]. See source for further detail on individual planned projects.
| Technology Description | Total Annual Minimum Capacity (GW) | ||
|---|---|---|---|
| 2022 | 2025 | 2030 | |
| Geothermal Plant | 0.004 | 0 | 0.005 |
| Medium Hydropower Plant | 0 | 0.375 | 0.475 |
| Small Hydropower Plant | 0.088 | 0.266 | 0.119 |
| Solar PV with 2-h storage | 0.061 | 0.159 | 0.208 |
Appendix A.9. Final Energy Demand
Table A11 provides the projected energy demand used in the study.
Table A11.
Breakdown of projected energy demand for DRC in petajoules used in this study. NB: Additional available estimated end-use electricity demands (denoted with *) were included to obtain accurate annual demand totals, however, analysis of these technologies was out of the scope of this study because they are not part of the DRC power sector. See [44] for demands for all years.
| Final Energy Demand (PJ) | 2021 | 2030 | 2040 | 2050 | 2060 | 2070 |
|---|---|---|---|---|---|---|
| Industrial | 42.0700 | 62.8529 | 139.9481 | 267.2040 | 404.8351 | 553.5227 |
| Residential | 16.8842 | 32.6876 | 72.7820 | 138.9633 | 210.5402 | 287.8673 |
| Commercial | 4.6380 | 8.9790 | 19.9926 | 38.1720 | 57.8336 | 79.0747 |
| *Residential Electric Stove | 0.2900 | 8.5853 | 98.9638 | 304.7263 | 580.8630 | 715.5472 |
| *Electric Motorcycle | 9.3143 | 85.7553 | 123.2501 | 140.0570 | 140.0570 | 140.0570 |
| *Electric Car | 0 | 0 | 0 | 42.6659 | 149.3308 | 213.3297 |
| TOTAL | 63.5921 | 198.8601 | 454.9366 | 931.7885 | 1543.4596 | 2020.9131 |
References
- Rogelj, J.; Popp, A.; Calvin, K.V.; Luderer, G.; Emmerling, J.; Gernaat, D.; Fujimori, S.; Strefler, J.; Hasegawa, T.; Marangoni, G.; et al. Scenarios towards Limiting Global Mean Temperature Increase below 1.5 °C. Nat. Clim. Chang. 2018, 8, 325–332. [Google Scholar] [CrossRef]
- IEA. World Energy Outlook 2021; IEA: Paris, France, 2021.
- United Nations Development Programme. Accelerating SDG 7 Achievement—Policy Brief 3: Financing SDG 7; United Nations Development Programme: New York, NY, USA, 2021. [Google Scholar]
- van der Zwaan, B.; Kober, T.; Longa, F.D.; van der Laan, A.; Jan Kramer, G. An Integrated Assessment of Pathways for Low-Carbon Development in Africa. Energy Policy 2018, 117, 387–395. [Google Scholar] [CrossRef]
- Bertram, C.; Riahi, K.; Hilaire, J.; Bosetti, V.; Drouet, L.; Fricko, O.; Malik, A.; Nogueira, L.P.; van der Zwaan, B.; van Ruijven, B.; et al. Energy System Developments and Investments in the Decisive Decade for the Paris Agreement Goals. Environ. Res. Lett. 2021, 16, 074020. [Google Scholar] [CrossRef]
- Ferrada, F.; Babonneau, F.; Homem-de-Mello, T.; Jalil-Vega, F. Energy Planning Policies for Residential and Commercial Sectors under Ambitious Global and Local Emissions Objectives: A Chilean Case Study. J. Clean. Prod. 2022, 350, 131299. [Google Scholar] [CrossRef]
- Godínez-Zamora, G.; Victor-Gallardo, L.; Angulo-Paniagua, J.; Ramos, E.; Howells, M.; Usher, W.; De León, F.; Meza, A.; Quirós-Tortós, J. Decarbonising the Transport and Energy Sectors: Technical Feasibility and Socioeconomic Impacts in Costa Rica. Energy Strategy Rev. 2020, 32, 100573. [Google Scholar] [CrossRef]
- Rady, Y.Y.; Rocco, M.V.; Serag-Eldin, M.A.; Colombo, E. Modelling for Power Generation Sector in Developing Countries: Case of Egypt. Energy 2018, 165, 198–209. [Google Scholar] [CrossRef]
- Pappis, I.; Sahlberg, A.; Walle, T.; Broad, O.; Eludoyin, E.; Howells, M.; Usher, W. Influence of Electrification Pathways in the Electricity Sector of Ethiopia—Policy Implications Linking Spatial Electrification Analysis and Medium to Long-Term Energy Planning. Energies 2021, 14, 1209. [Google Scholar] [CrossRef]
- Rocco, M.V.; Fumagalli, E.; Vigone, C.; Miserocchi, A.; Colombo, E. Enhancing Energy Models with Geo-Spatial Data for the Analysis of Future Electrification Pathways: The Case of Tanzania. Energy Strategy Rev. 2021, 34, 100614. [Google Scholar] [CrossRef]
- IEA. SDG 7 Database: Access to Electricity; IEA: Paris, France, 2022.
- World Bank. Increasing Access to Electricity in the Democratic Republic of Congo; World Bank: Washington, DC, USA, 2020. [Google Scholar]
- IEA. Africa Energy Outlook 2019; IEA: Paris, France, 2019; p. 250. [Google Scholar]
- Oyewo, A.; Farfan, J.; Peltoniemi, P.; Breyer, C. Repercussion of Large Scale Hydro Dam Deployment: The Case of Congo Grand Inga Hydro Project. Energies 2018, 11, 972. [Google Scholar] [CrossRef]
- MEDD. Revision to Scale of Nationally Determined Contribution [Contribution Déterminée à l’échelle Nationale Révisée; MEDD: Hong Kong, China, 2021. [Google Scholar]
- Senshaw, D.A.; Kim, J.W. Meeting Conditional Targets in Nationally Determined Contributions of Developing Countries: Renewable Energy Targets and Required Investment of GGGI Member and Partner Countries. Energy Policy 2018, 116, 433–443. [Google Scholar] [CrossRef]
- Kusakana, K. A Review of Energy in the Democratic Republic of Congo. In Proceedings of the Conference: ICDRE, Copenhagen, Denmark, 27–28 June 2016; Volume 11. [Google Scholar]
- UK Aid. The Last Frontier for Energy Access: The Renewable Energy Opportunity in the Democratic Republic of Congo; UK Aid: Bath, UK, 2019. [Google Scholar]
- ARE. Law Number 14/011 17 June 2014 Relating to the Electricity Sector [Loi Numéro 14/011 17 June 2014 Relative Au Secteur de l’É Lectricité]. 2014. Available online: https://are.gouv.cd/wp-content/uploads/2020/12/loi_electricite.pdf (accessed on 2 July 2021).
- ANSER. Local Electrification Plans for the Territories of the Democratic Republic of Congo to 2030 [Plans Locaux D’Electrifcation des Territoires de la Republique Democratique du Congo À L’Horizon 2030]; L’Agence Nationale d’Electrification et des Services Energétiques en Milieux Rural et Périurbain: Kinshasa, Democratic Republic of the Congo, 2020; Available online: https://anser.gouv.cd/wpfd_file/plans-locaux-delectrification-des-territoires-de-la-republique-democratique-du-congo-a-lhorizon-2030/ (accessed on 2 July 2021).
- REN21. Renewables 2021 Global Status Report; REN21: Paris, France, 2021. [Google Scholar]
- European Parliament. Directive (EU) 2018/2001 of the European Parliament and of the Council of 11 December 2018 on the Promotion of the Use of Energy from Renewable Sources; European Parliament: Strasbourg, France, 2018.
- Ruppel, O.C.; Bwiza, D.K. Environment under Reconstruction: Environmental Law and Policy in the Democratic Republic of Congo. Verfass. Recht Übersee 2013, 46, 473–485. [Google Scholar] [CrossRef]
- Ndiritu, S.W.; Engola, M.K. The Effectiveness of Feed-in-Tariff Policy in Promoting Power Generation from Renewable Energy in Kenya. Renew. Energy 2020, 161, 593–605. [Google Scholar] [CrossRef]
- Romano, A.A.; Scandurra, G.; Carfora, A.; Fodor, M. Renewable Investments: The Impact of Green Policies in Developing and Developed Countries. Renew. Sustain. Energy Rev. 2017, 68, 738–747. [Google Scholar] [CrossRef]
- Kim, J.E. Regulation Trumps Economics? Examining Renewable Energy Policy, Diffusion and Investment in 80 Developing Countries. Energy Res. Soc. Sci. 2020, 70, 101613. [Google Scholar] [CrossRef]
- Kim, Y.; Rhee, D.-E. Do Stringent Environmental Regulations Attract Foreign Direct Investment in Developing Countries? Evidence on the “Race to the Top” from Cross-Country Panel Data. Emerg. Mark. Financ. Trade 2019, 55, 2796–2808. [Google Scholar] [CrossRef]
- Yang, S.; Park, S. The Effects of Renewable Energy Financial Incentive Policy and Democratic Governance on Renewable Energy Aid Effectiveness. Energy Policy 2020, 145, 111682. [Google Scholar] [CrossRef]
- Liu, W.; Zhang, X.; Feng, S. Does Renewable Energy Policy Work? Evidence from a Panel Data Analysis. Renew. Energy 2019, 135, 635–642. [Google Scholar] [CrossRef]
- Castillo-Ramírez, A.; Mejía-Giraldo, D.; Molina-Castro, J.D. Fiscal Incentives Impact for RETs Investments in Colombia. Energy Sources Part B Econ. Plan. Policy 2017, 12, 759–764. [Google Scholar] [CrossRef]
- Servert, J.F.; Cerrajero, E.; Fuentealba, E.; Cortes, M. Assessment of the Impact of Financial and Fiscal Incentives for the Development of Utility-Scale Solar Energy Projects in Northern Chile. Energy Procedia 2014, 49, 1885–1895. [Google Scholar] [CrossRef]
- PwC. Congo, Democratic Republic of the: Corporate—Other Taxes; PwC: London, UK, 2022. [Google Scholar]
- International Trade Administration. Democratic Republic of the Congo—Country Commercial Guide: Tariffs; International Trade Administration: Washington, DC, USA, 2021.
- USAID. Power Africa Off-Grid Solar Market Assessment: Democratic Republic of the Congo; USAID: Washington, DC, USA, 2019. [Google Scholar]
- Jakob, M.; Steckel, J.C.; Klasen, S.; Lay, J.; Grunewald, N.; Martínez-Zarzoso, I.; Renner, S.; Edenhofer, O. Feasible Mitigation Actions in Developing Countries. Nat. Clim. Chang. 2014, 4, 961–968. [Google Scholar] [CrossRef]
- Skovgaard, J.; van Asselt, H. The Politics of Fossil Fuel Subsidies and Their Reform: Implications for Climate Change Mitigation. WIREs Clim. Chang. 2019, 10, e581. [Google Scholar] [CrossRef]
- International Monetary Fund. How Large Are Global Energy Subsidies?: Country Level Subsidy Estimates; International Monetary Fund: Washington, DC, USA, 2015. [Google Scholar]
- South African Revenue Services. Carbon Tax; South African Revenue Services: Cape Town, South Africa, 2021. [Google Scholar]
- Parliament of the Republic of Indonesia. Harmonization of Tax Regulations [Harmonisasi Peraturan Perpajakan]; Parliament of the Republic of Indonesia: Jakarta, Indonesia, 2022. [Google Scholar]
- Howells, M.; Rogner, H.; Strachan, N.; Heaps, C.; Huntington, H.; Kypreos, S.; Hughes, A.; Silveira, S.; DeCarolis, J.; Bazillian, M.; et al. OSeMOSYS: The Open Source Energy Modeling System. Energy Policy 2011, 39, 5850–5870. [Google Scholar] [CrossRef]
- Olsson, J.M.; Gardumi, F. Modelling Least Cost Electricity System Scenarios for Bangladesh Using OSeMOSYS. Energy Strategy Rev. 2021, 38, 100705. [Google Scholar] [CrossRef]
- Boke, M.T.; Moges, S.A.; Dejen, Z.A. Optimizing Renewable-Based Energy Supply Options for Power Generation in Ethiopia. PLoS ONE 2022, 17, e0262595. [Google Scholar] [CrossRef]
- Cannone, C.; Allington, L.; Pappis, I.; Barron, K.C.; Usher, W.; Pye, S.; Brown, E.; Howells, M.; Walker, M.Z.; Ahsan, A.; et al. Selected ‘Starter Kit’ Energy System Modelling Data for DR Congo (#CCG). Res. Sq. 2021. [Google Scholar] [CrossRef]
- Pappis, I.; Sridharan, V.; Usher, W.; Howells, M. KTH-dESA/Jrc_temba: TEMBA 2.1; Zenodo: Geneva, Switzerland, 2021. [Google Scholar]
- Global Electrification Platform Congo (Democratic Republic) 2020. Available online: https://electrifynow.energydata.info/explore/cd-2 (accessed on 2 July 2021).
- Oluleye, G.; Gandiglio, M.; Santarelli, M.; Hawkes, A. Pathways to Commercialisation of Biogas Fuelled Solid Oxide Fuel Cells in European Wastewater Treatment Plants. Appl. Energy 2021, 282, 116127. [Google Scholar] [CrossRef]
- McDonald, A.; Schrattenholzer, L. Learning Rates for Energy Technologies. Energy Policy 2001, 29, 255–261. [Google Scholar] [CrossRef]
- Itten, R.; Frischknecht, R. Life Cycle Inventories of Electricity Mixes and Grid. Eng. Environ. Sci. 2014, 230. [Google Scholar] [CrossRef]
- Rubin, E.S.; Azevedo, I.M.L.; Jaramillo, P.; Yeh, S. A Review of Learning Rates for Electricity Supply Technologies. Energy Policy 2015, 86, 198–218. [Google Scholar] [CrossRef]
- Abbas, S.; Gui, P.; Chen, A.; Ali, N. The Effect of Renewable Energy Development, Market Regulation, and Environmental Innovation on CO2 Emissions in BRICS Countries. Environ. Sci. Pollut. Res. 2022, 29, 59483–59501. [Google Scholar] [CrossRef]
- Bissiri, M.; Moura, P.; Figueiredo, N.C.; Silva, P.P. Towards a Renewables-Based Future for West African States: A Review of Power Systems Planning Approaches. Renew. Sustain. Energy Rev. 2020, 134, 110019. [Google Scholar] [CrossRef]
- Howells, M.; Quiros-Tortos, J.; Morrison, R.; Rogner, H.; Niet, T.; Petrarulo, L.; Usher, W.; Blyth, W.; Godínez, G.; Victor, L.F.; et al. Energy System Analytics and Good Governance—U4RIA Goals of Energy Modelling for Policy Support. Res. Sq. 2021. [Google Scholar] [CrossRef]
- Moksnes, N.; Welsch, M.; Gardumi, F.; Shivakumar, A.; Broad, O.; Howells, M.; Taliotis, C.; Sridha, V. 2015 OSeMOSYS User Manual; Royal Institute of Technology: Stockholm, Sweden, 2015. [Google Scholar]
- Brinkerink, M.; Gallachóir, B.Ó.; Deane, P. Building and Calibrating a Country-Level Detailed Global Electricity Model Based on Public Data. Energy Strategy Rev. 2021, 33, 100592. [Google Scholar] [CrossRef]
- Brinkerink, M.; Deane, P. All Demand UTC 2015; Tab: Ogaki, Japan, 2020. [Google Scholar]
- Bertheau, P.; Oyewo, A.; Cader, C.; Breyer, C.; Blechinger, P. Visualizing National Electrification Scenarios for Sub-Saharan African Countries. Energies 2017, 10, 1899. [Google Scholar] [CrossRef]
- Pfenninger, S.; Staffell, I. Long-Term Patterns of European PV Output Using 30 Years of Validated Hourly Reanalysis and Satellite Data. Energy 2016, 114, 1251–1265. [Google Scholar] [CrossRef]
- Staffell, I.; Pfenninger, S. Using Bias-Corrected Reanalysis to Simulate Current and Future Wind Power Output. Energy 2016, 114, 1224–1239. [Google Scholar] [CrossRef]
- IRENA. Planning and Prospects for Renewable Power: Eastern and Southern Africa; IRENA: Bonn, Germany, 2021. [Google Scholar]
- IRENA. Planning and Prospects for Renewable Power: West Africa; IRENA: Bonn, Germany, 2018. [Google Scholar]
- IRENA. Solar PV in Africa: Costs and Markets; IRENA: Bonn, Germany, 2016. [Google Scholar]
- IRENA. Africa 2030: Roadmap for a Renewable Energy Future; IRENA: Bonn, Germany, 2015. [Google Scholar]
- Ray, D. Lazard’s Levelized Cost of Energy Analysis—Version 15.0; Lazard: New York, NY, USA, 2021; p. 21. [Google Scholar]
- European Commission. Joint Research Centre. Energy Projections for African Countries; Publications Office: Luxembourg, 2019. [Google Scholar]
- Agutu, C.; Egli, F.; Williams, N.J.; Schmidt, T.S.; Steffen, B. Accounting for Finance in Electrification Models for Sub-Saharan Africa. Nat. Energy 2022, 7, 631–641. [Google Scholar] [CrossRef]
- National Renewable Energy Laboratory. Annual Technology Baseline; National Renewable Energy Laboratory: Golden, CO, USA, 2022.
- Makuku, L. Inventory of Geothermal Sources in the DRC and Their Development Plan for the Electrification of Locals Areas. Case of the Eastern Part of the DRC. IOP Conf. Ser. Earth Environ. Sci. 2019, 249, 012016. [Google Scholar] [CrossRef]
- IEA. Solar PV Tracking Report; IEA: Paris, France, 2021.
- IEA. Hydropower Tracking Report; IEA: Paris, France, 2021.
- IEA. Wind Power Tracking Report; IEA: Paris, France, 2021.
- International Trade Administration. Democratic Republic of the Congo—Country Commercial Guide: Oil & Gas; International Trade Administration: Washington, DC, USA, 2021.
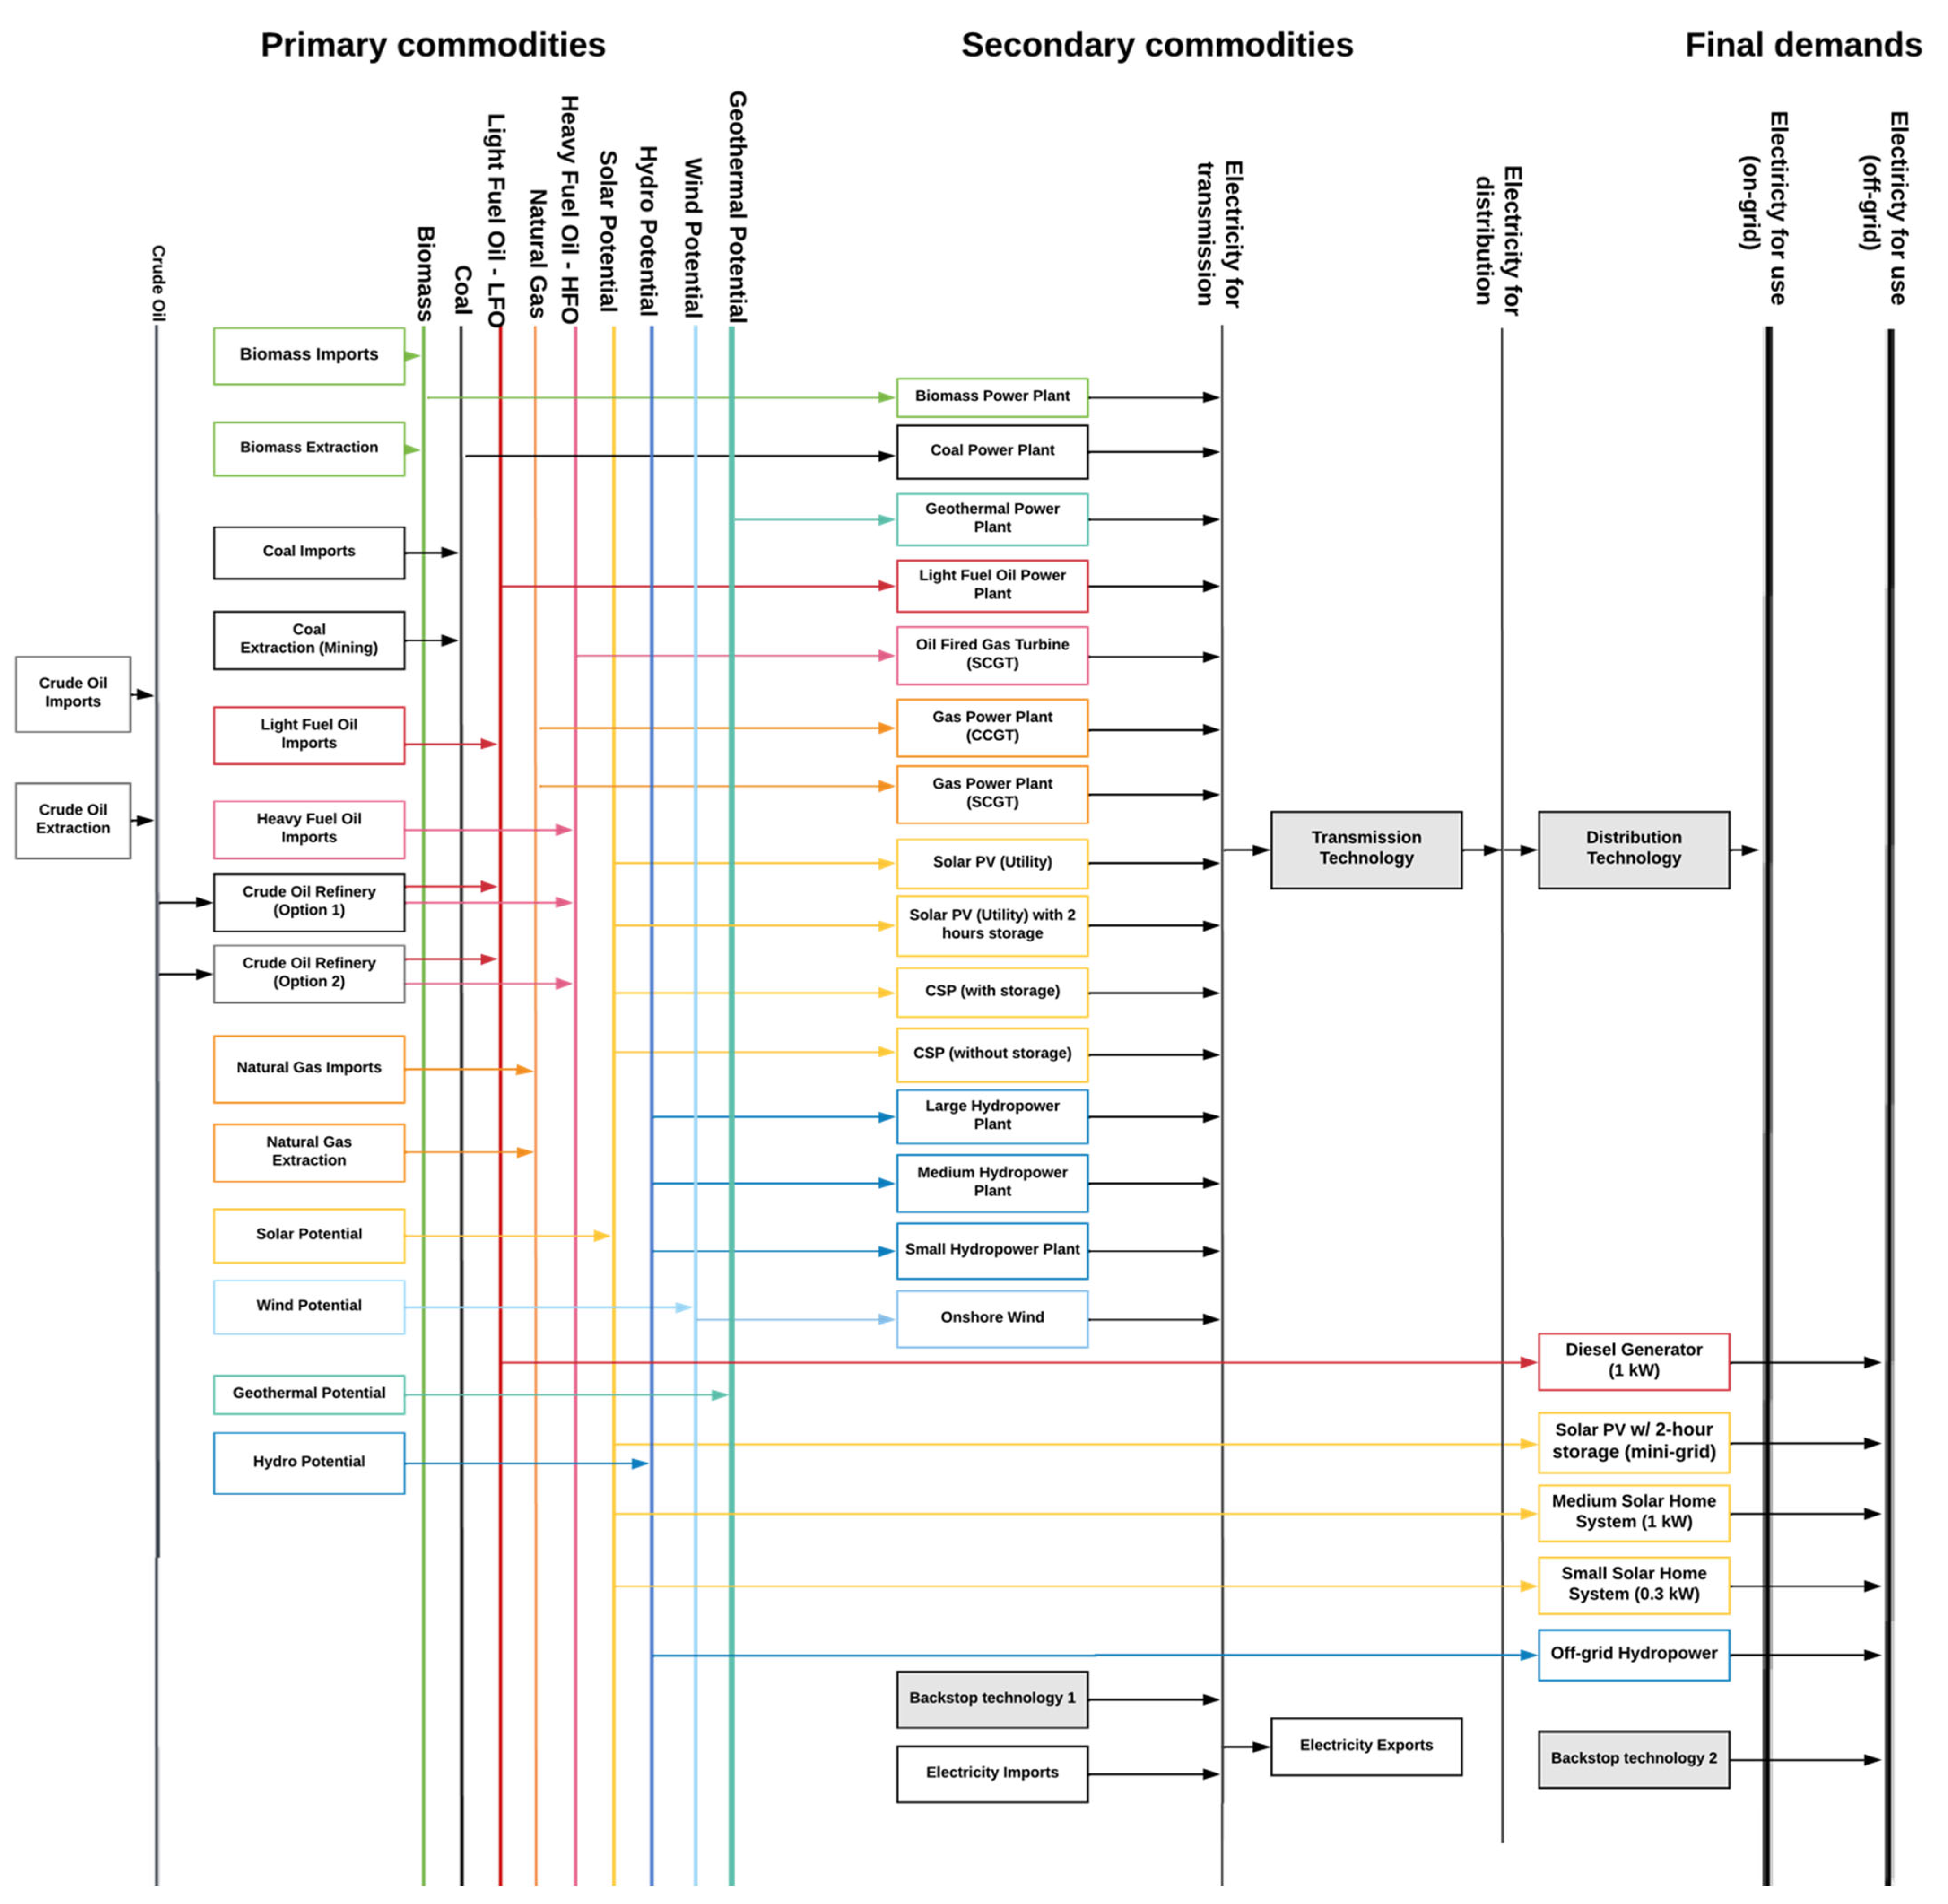

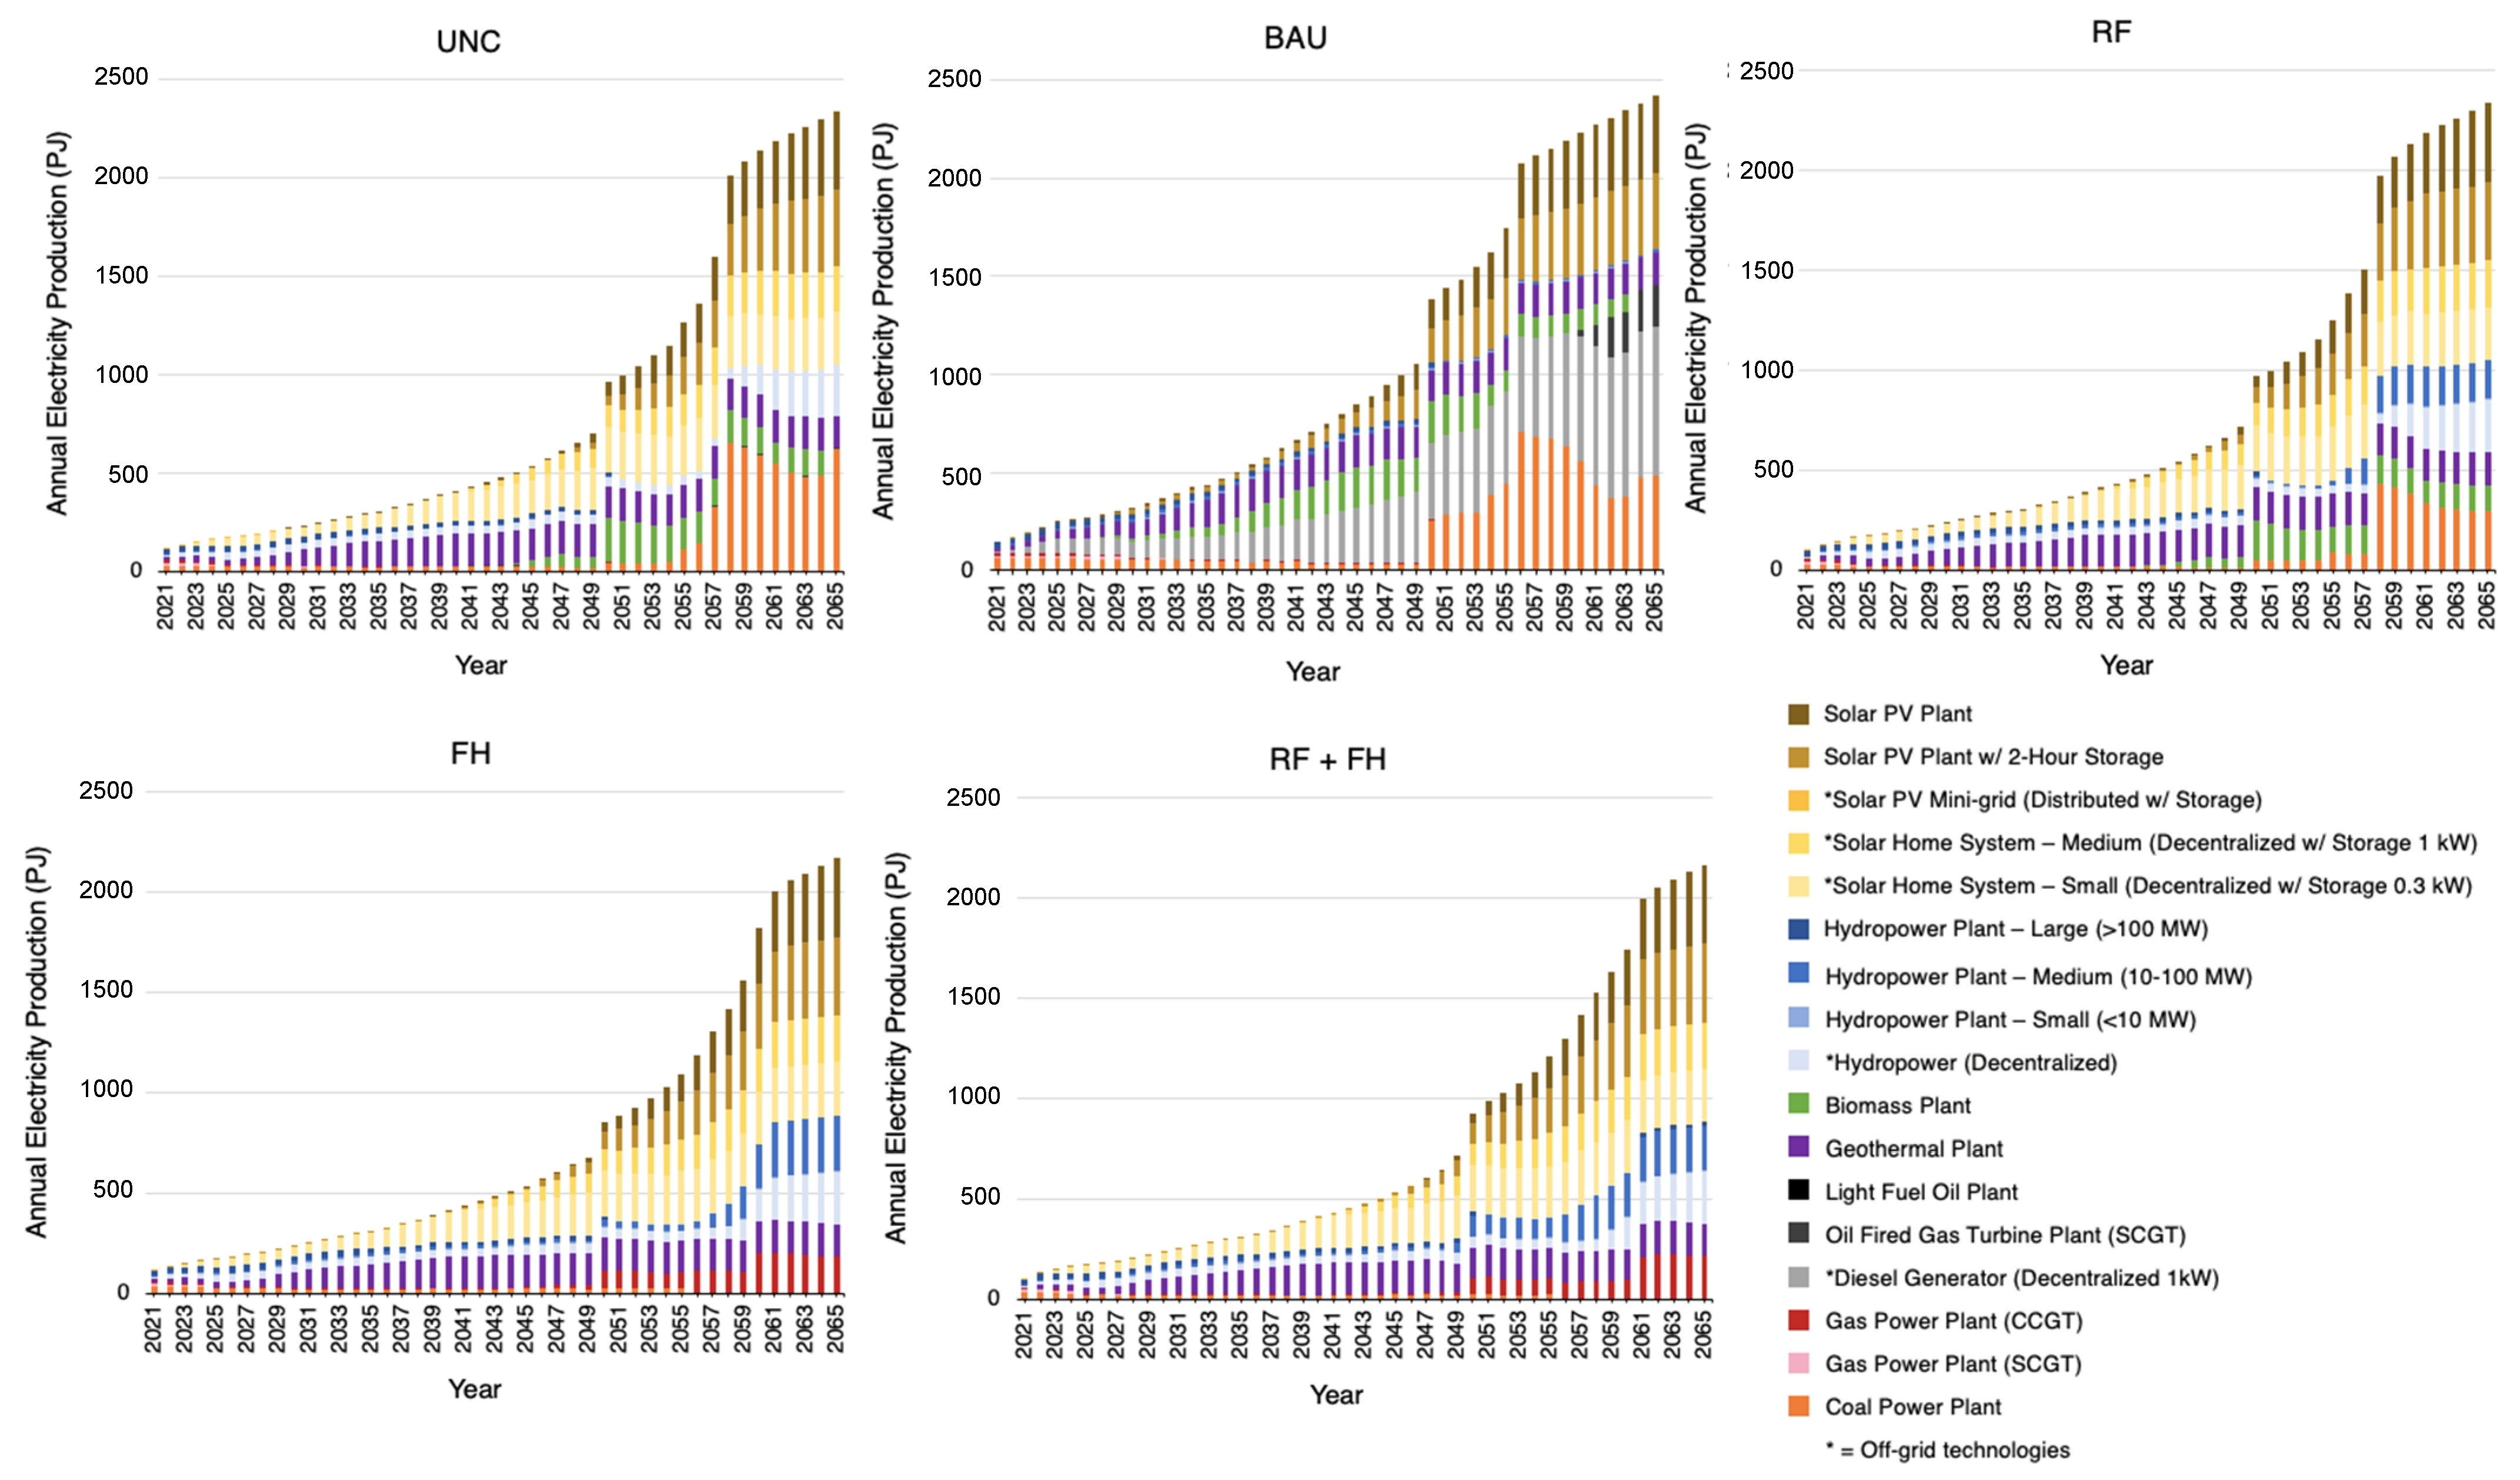
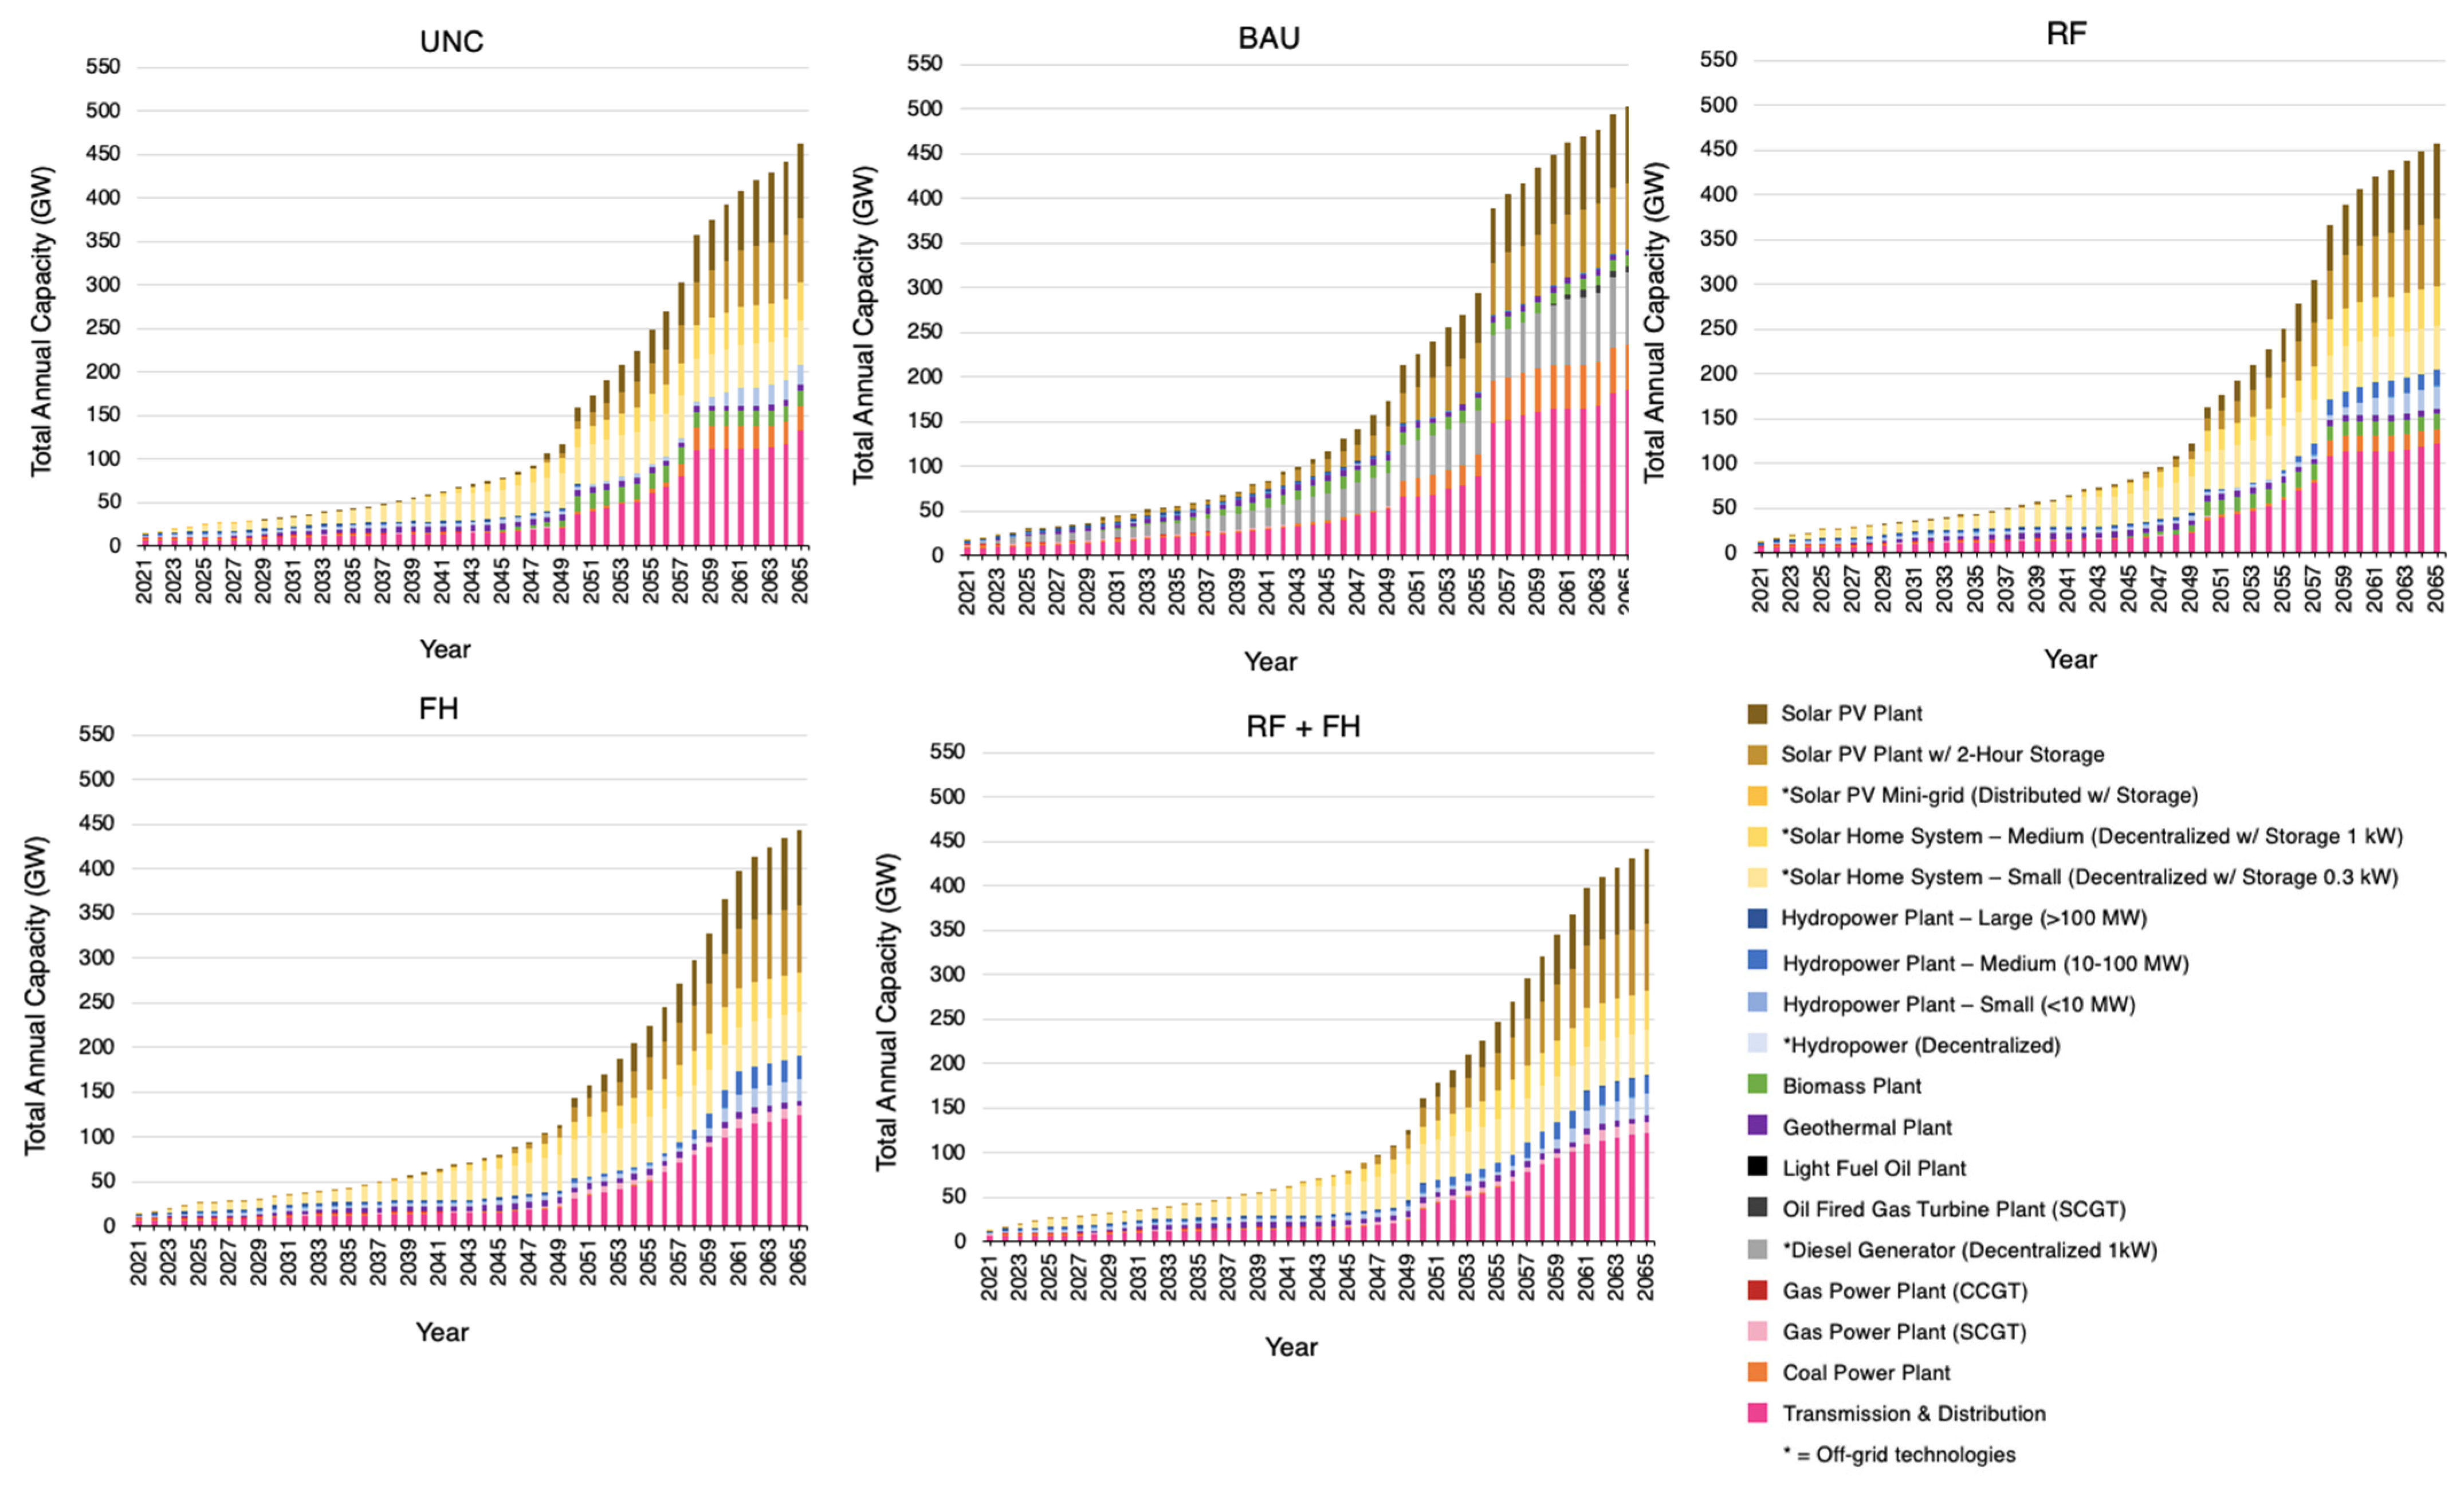
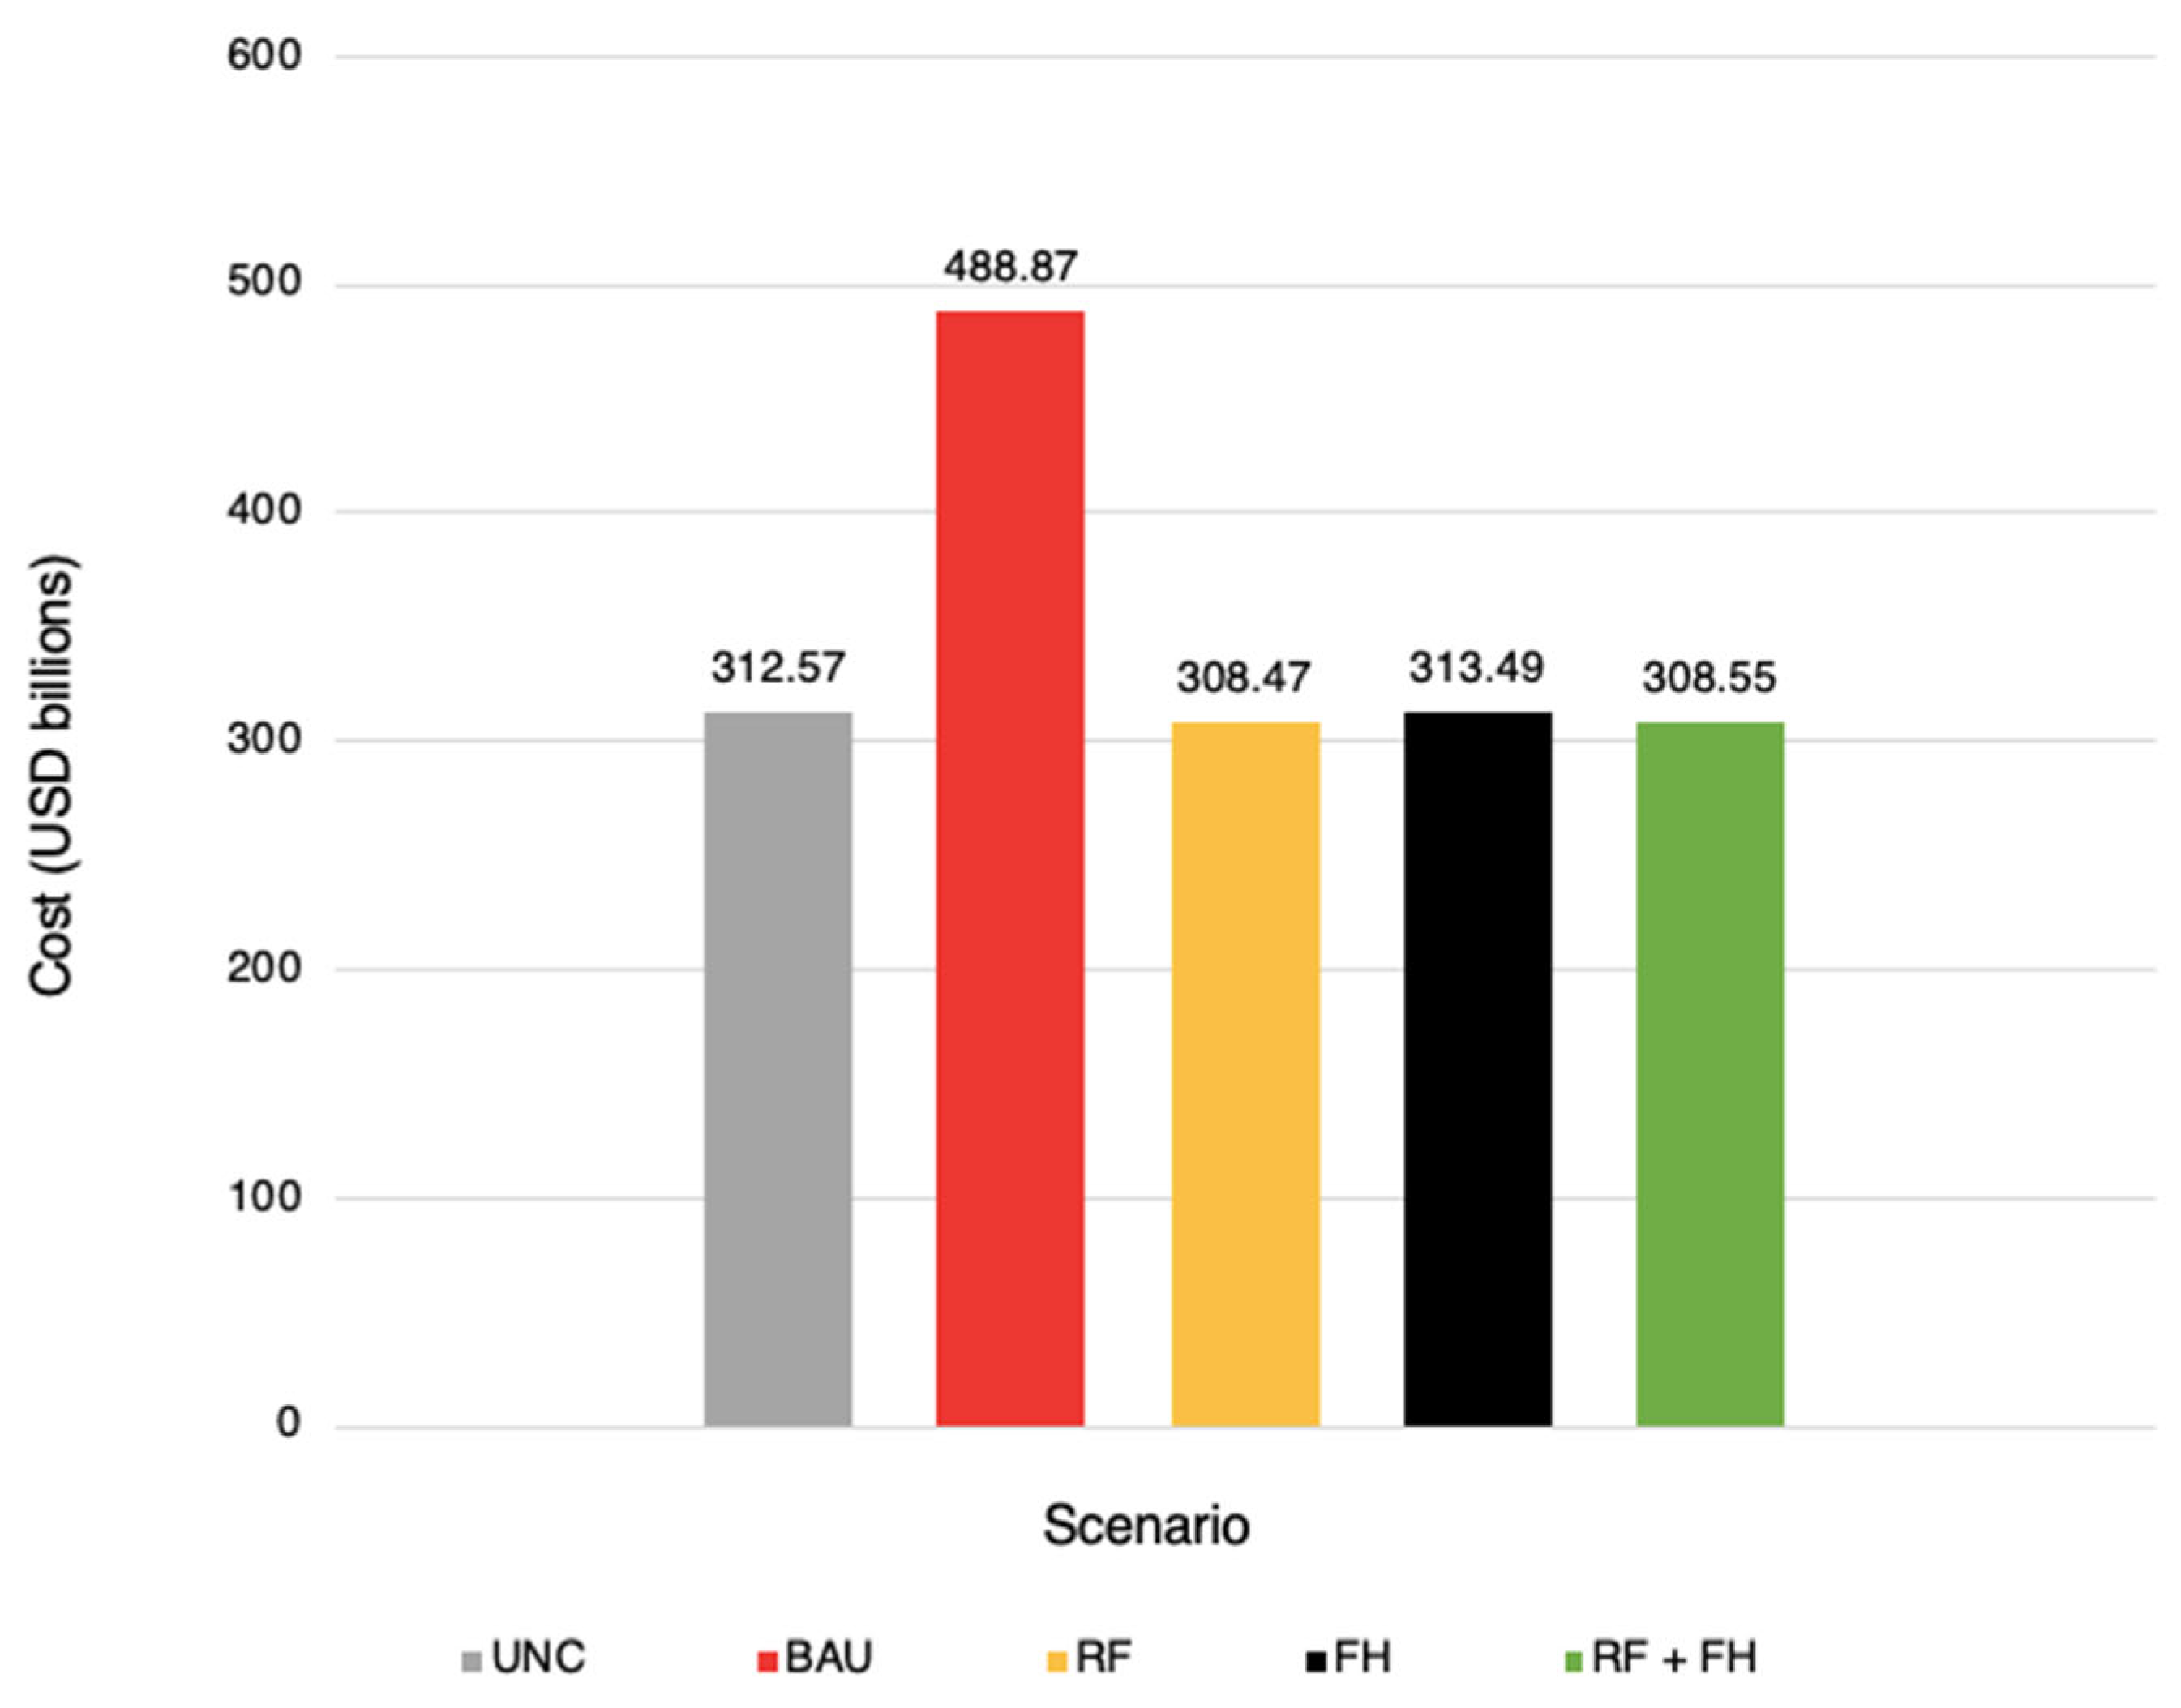
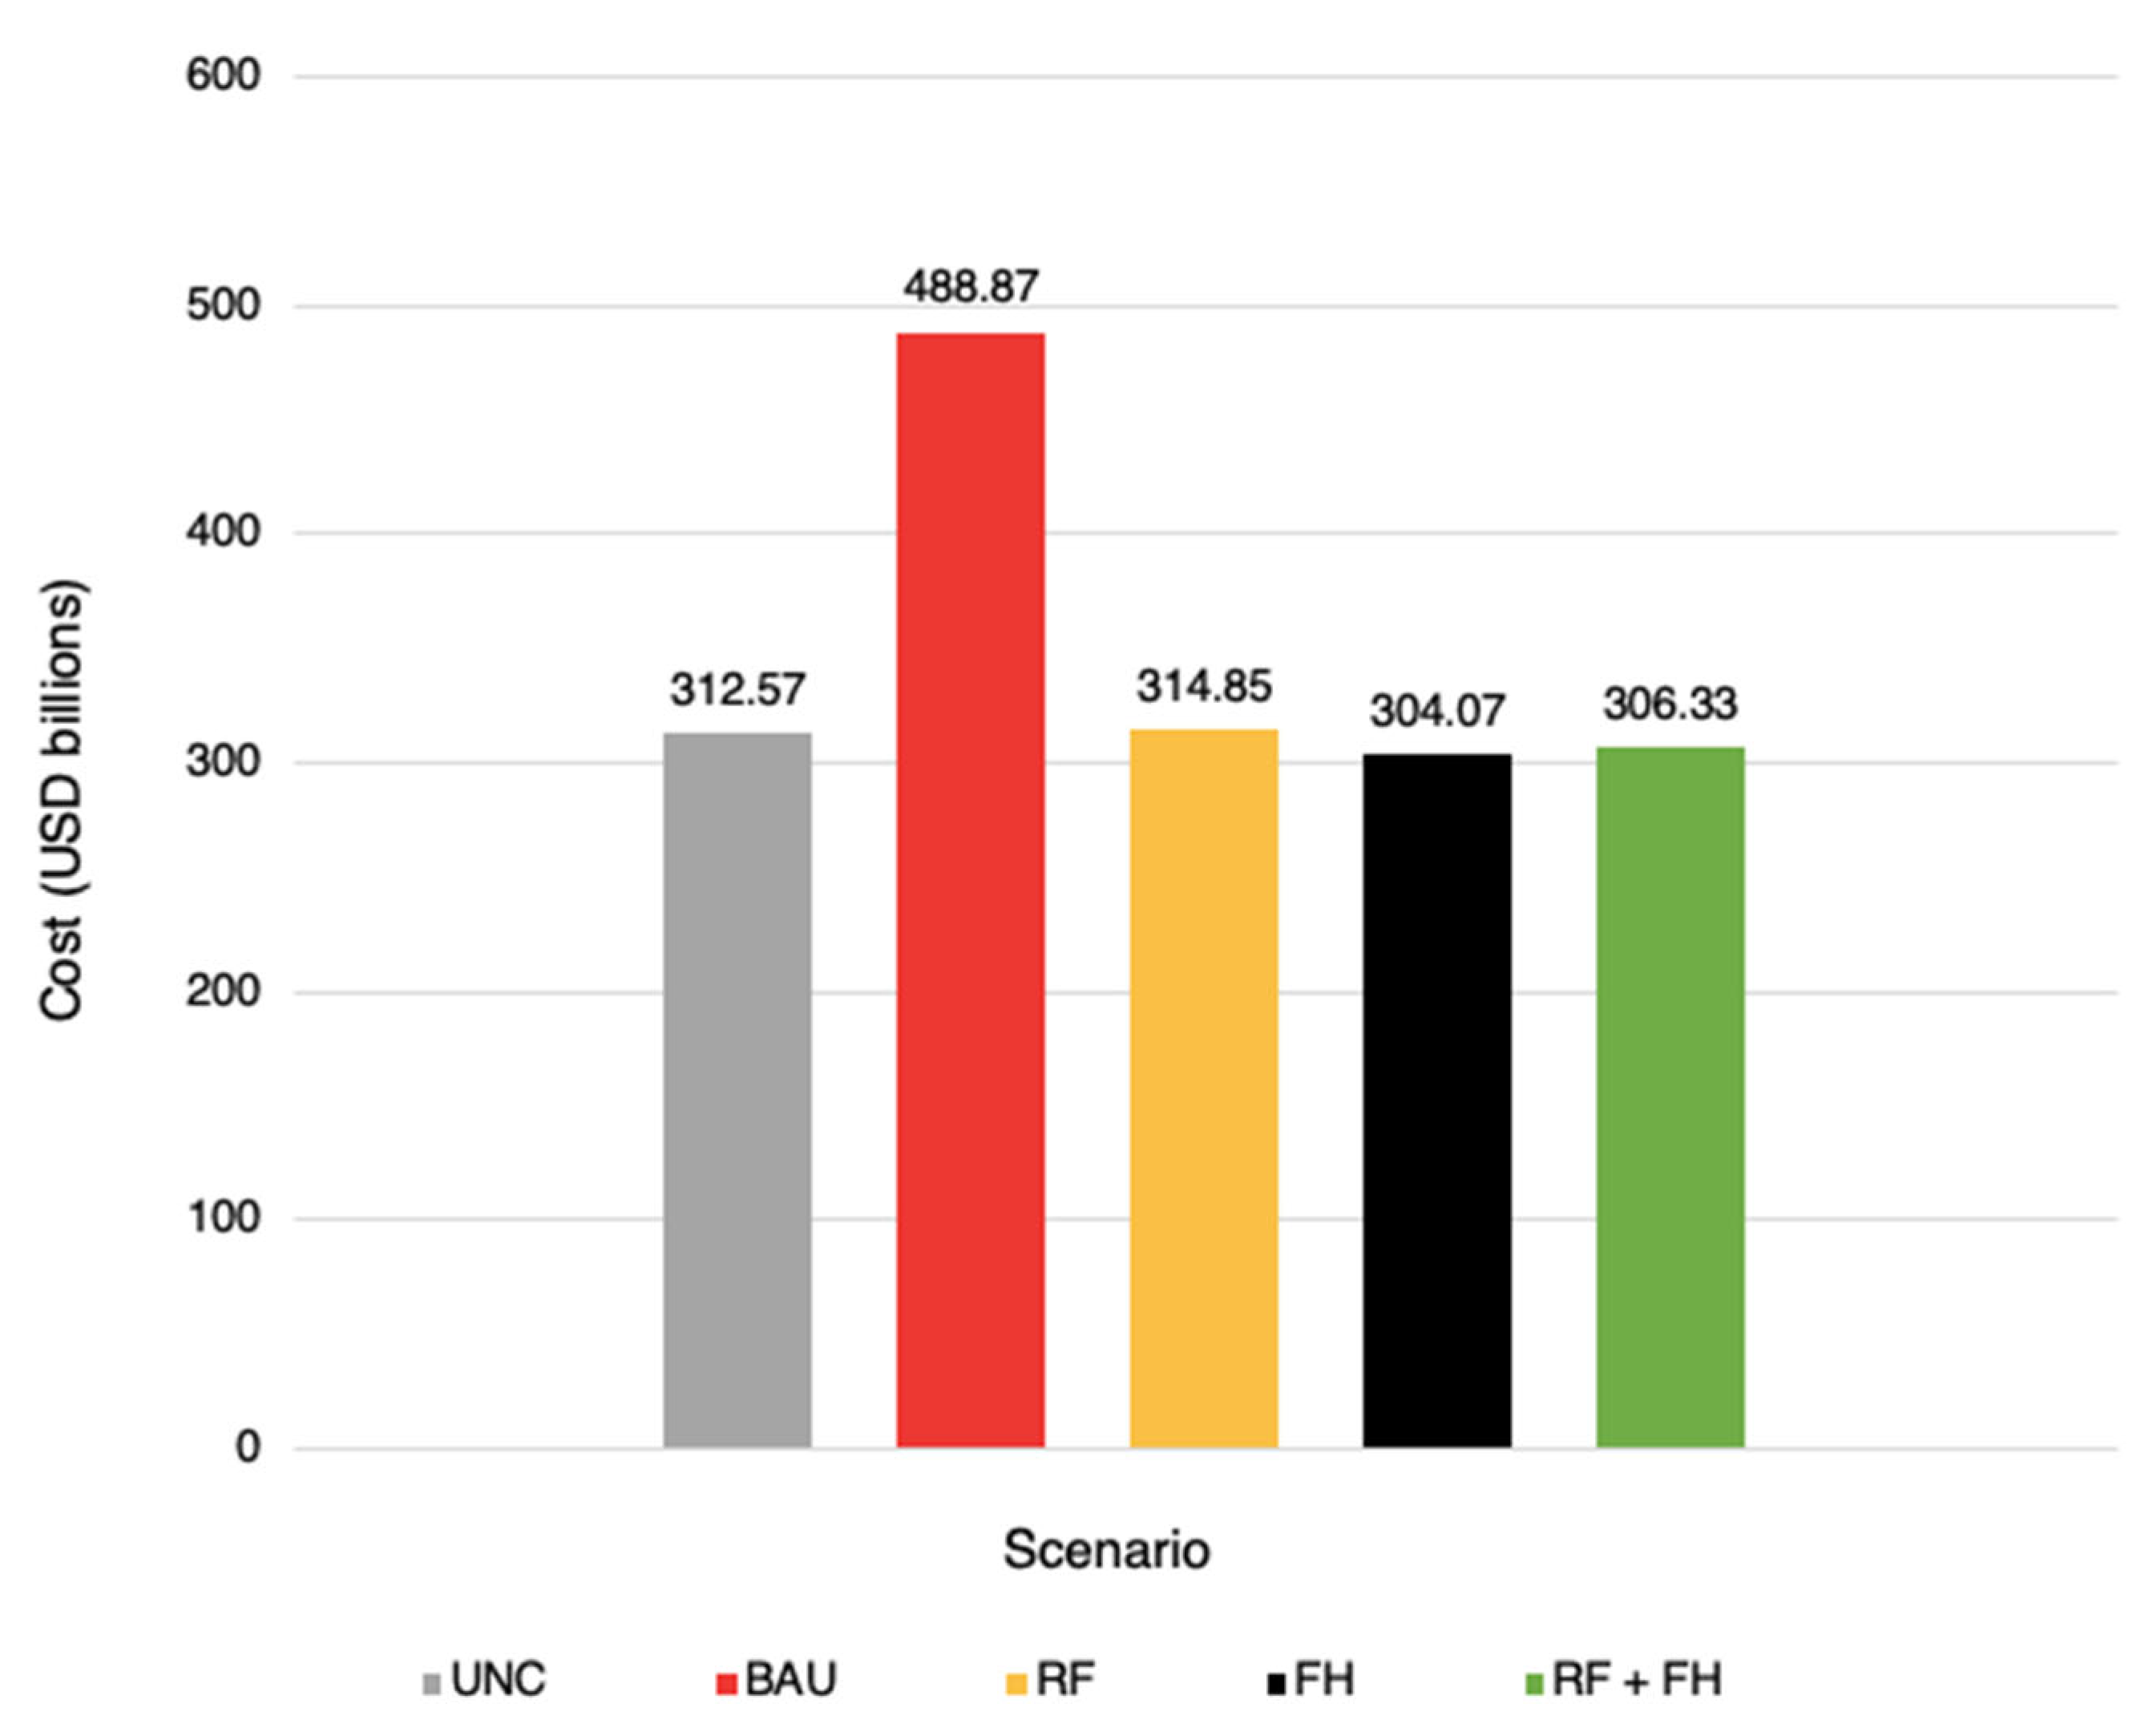

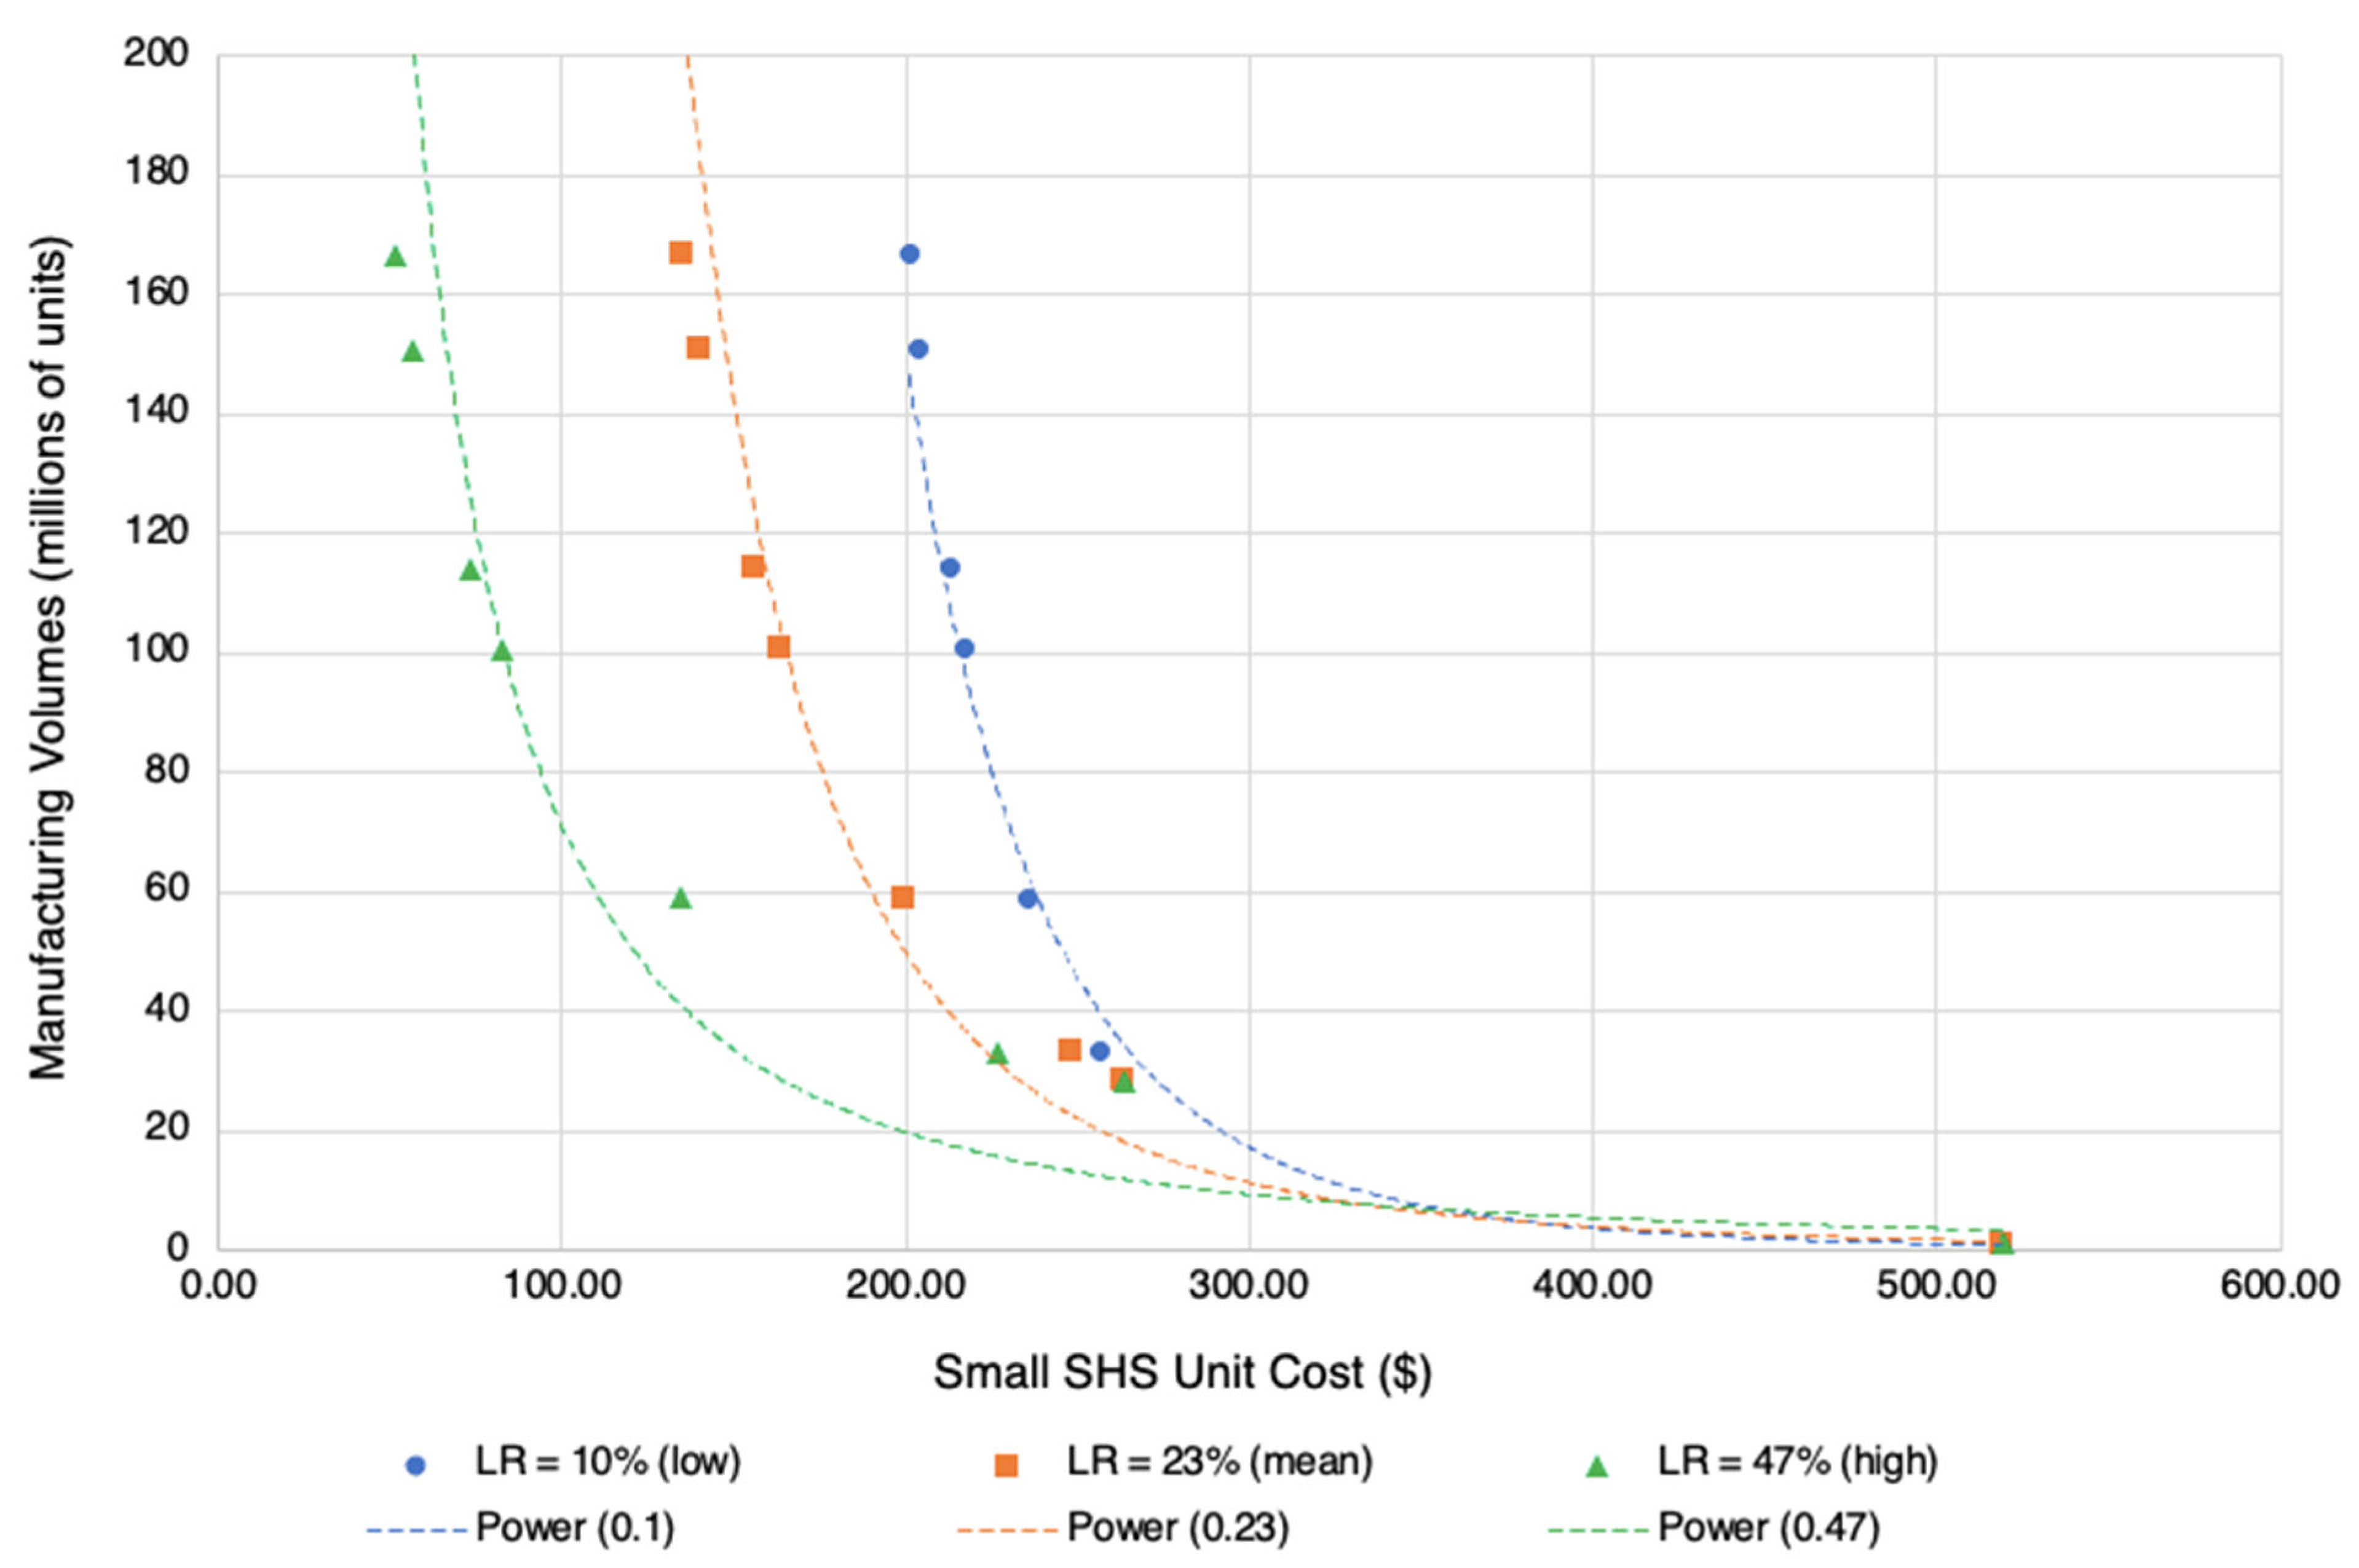
Disclaimer/Publisher’s Note: The statements, opinions and data contained in all publications are solely those of the individual author(s) and contributor(s) and not of MDPI and/or the editor(s). MDPI and/or the editor(s) disclaim responsibility for any injury to people or property resulting from any ideas, methods, instructions or products referred to in the content. |
© 2024 by the authors. Licensee MDPI, Basel, Switzerland. This article is an open access article distributed under the terms and conditions of the Creative Commons Attribution (CC BY) license (https://creativecommons.org/licenses/by/4.0/).