Abstract
To better address and improve the issues related to DC power quality, this paper proposes an identification method tailored for DC power quality disturbances. First, it explores the underlying mechanisms and waveform characteristics of common DC power disturbances. By integrating the results of time–frequency analysis obtained through the S-transform, five distinct features are designed and extracted to serve as classification indicators. The SABO algorithm is subsequently employed to optimize the BP neural network, assisting in determining the optimal input weights and hidden layer thresholds. This optimization technique helps prevent the network from becoming stuck in local minima, thereby enhancing its robustness and generalization capabilities. This paper presents a simulation system for AC/DC power systems to conduct experimental verification. The system simulates various DC power quality issues and monitors abnormal waveforms. According to the designated classification index, the features of simulated disturbance signals are extracted. The SABO-BP classification prediction model is then used to automatically classify and identify the samples. The experimental results demonstrate high accuracy in classification and identification using the proposed method. In comparison to the BP neural network method, the SABO-BP method demonstrates an 8.207% improvement in accurately identifying disturbance signals. It is capable of accurately identifying direct current power quality signals, thereby assisting in the evaluation and control of power quality issues.
1. Introduction
In emerging power systems dominated by new energy sources, it is common for the voltage and current to exhibit complex and unpredictable behaviors [1]. The power system exhibits the characteristics of “dual highs” and “dual randomness”, which pose a significant threat to the secure and stable operation of the power system. The effective identification of power quality issues is crucial for implementing corresponding measures to comprehensively manage them [2]. Research in the field of AC power quality has reached a level of maturity, while the corresponding aspect related to DC power quality remains an area that requires further investigation [3]. A DC microgrid does not involve the synchronization, harmonic, reactive power control, and frequency control of a traditional AC power grid, and it has higher power quality [4]. However, the relevant system has not been established, and the definition of DC energy quality is not uniform [5]. Existing studies only focus on the formation mechanisms and suppression methods of various disturbances. A few scholars have analyzed the occurrence mechanism and treatment methods of typical DC energy quality phenomena, such as voltage ripple and voltage fluctuation. They have also established DC energy quality evaluation standards based on AC system standards [6]. However, there are few studies on specific identification methods [7] for DC energy mass disturbances.
The accurate classification of power quality disturbance signals depends on the proficient use of signal detection and pattern recognition. Short-time Fourier transform (STFT) [8], wavelet transform (WT) [9], Hilbert yellow transform (HHT) [10], etc., are commonly used power signal detection methods. Currently, there is no unified technical standard for detecting the quality disturbance signals of direct current (DC) power, especially ripple detection. Furthermore, the existing detection methods mainly focus on time-domain analysis, which cannot capture the instantaneous frequency and other relevant frequency domain characteristics of the signals. Scholars have borrowed and improved upon the detection methods for AC power quality issues, as seen in reference [10], which utilizes a windowed Fourier transform to mitigate spectral leakage and enhance detection accuracy. LUO [11] applied the variational mode decomposition method to calculate the pre-decomposition scale of the signal using the orthogonal decomposition method in order to detect the instantaneous frequency, instantaneous amplitude, and start and end time of the ripple signal. However, this approach is prone to mode mixing. The characteristics of several commonly used signal analysis methods are summarized in Table 1. On the whole, STFT is not suitable for the analysis of transient signals due to the presence of spectrum aliasing and leakage phenomena. WT is highly susceptible to noise interference, making it challenging to differentiate signals such as temporary voltage rise and drop. HHT is suitable for analyzing mutation signals, although its overall performance is subpar. The S transform combines the benefits of WT and STFT and replaces the wavelet basis function with a Gaussian window, addressing the limitation of fixed window width in the STFT. The S transform exhibits superior time–frequency characteristics and is less susceptible to noise. As a result, it is well-suited for detecting power-quality interference signals.

Table 1.
Characteristic comparison of common signal analysis methods.
After successfully detecting the interference, it is necessary to utilize a pattern recognition scheme to accurately classify it. This step is typically based on machine learning theory and seamlessly integrated with intelligent optimization algorithms to construct classifiers. Common classification algorithms are KNN [12], SVM [13], DT [14], and BP [15] among others. Several common classification algorithms and their characteristics are shown in Table 2. Mahbooba [16] used the chaotic search principle to obtain the random training set of the basis classification, and then constructed the decision tree. Patil [17] used SVM to classify signals, and a good classification effect was obtained, but the optimization of kernel function should be considered. Mohamed E [18] proposed an intelligent random vector function link network (RVFLN) optimized by the beluga whale optimizer (WWO) algorithm to predict the performance of new solar photovoltaic thermal air conditioners [19], which greatly improved the prediction speed. In ref. [20], a back propagation neural network (BPNN) was used to establish a classification model. A single BP has fast computation speed and strong generalization ability, which is suitable for classification problems, but it is easy to fall into local optimality. Tang [21] used particle swarm optimization (PSO) to update the positions of individual and group extreme values, allocate optimal initial weights and thresholds to the BP neural network, and introduce variation factors to enhance the model’s capacity for seeking optimal solutions. Building upon the foundation of the artificial bee colony (ABC) algorithm, Chen [22] combined three adaptive evolutionary strategies—dynamic self-adaptive factors, probability selection, and gradient initialization—to create the adaptive evolutionary artificial bee colony (AEABC) algorithm. Then, it was used to construct an AEABC-BPNN classification prediction model. Gnyawali [10] used a genetic algorithm (GA) to optimize the BP neural network, effectively addressing the drawbacks associated with prolonged BP training times and the risk of the neural network’s weight and bias converging to local optima. However, due to the slow BP convergence, it is easy to fall into the local minimum, and it is difficult to approach the target with high precision. How to select suitable optimization algorithm for different research objects to build a BP neural network prediction model is still the focus of current research.

Table 2.
Common classification algorithms.
At present, there are few studies on the disturbance signal of DC energy quality, and the detection and recognition are not sufficiently accurate. In order to solve this problem, a novel identification method for DC energy mass disturbance is proposed in this paper. In order to solve this problem, a new identification method for DC energy mass disturbance is proposed in this paper. First, the S transform, a time–frequency analysis method, is used to extract the features of the signal. From the aspects of graphic features, time–frequency domain analysis, and statistical principles, five kinds of disturbance characteristic indexes are extracted from each disturbance signal as the basis of signal classification. The SABO algorithm is used to optimize the weights and thresholds of the BP neural network, improve the searching ability of the algorithm, build a classification model of the SABO-BP neural network, and realize effective classification of signals. The simulation results show that the proposed scheme can detect and identify each disturbance signal effectively. Compared with other classification models, the SABO-BP model has higher accuracy and a shorter running time.
2. Direct Current Energy Mass Disturbance Problem
The dynamic load in a DC microgrid is characterized by two main categories: transient power quality disturbances and steady power quality disturbances. Transient power quality disturbances include voltage dips caused by short circuit faults, voltage fluctuations caused by motor restarts, and voltage dips or rises resulting from large load switching. Steady power quality disturbances encompass ripples caused by load imbalance. These factors contribute to the complexity of the dynamic load in a DC microgrid [1].
2.1. DC Voltage Interruption
Based on the duration of interruption in DC voltage, it can be classified into short-duration interruptions and long-duration interruptions. Short-duration interruptions are typically caused by factors such as electrode faults, occurrences of metal short circuits, misoperations in protective systems, and equipment failures. Conversely, long-duration interruptions can be attributed to reasons such as line and equipment maintenance, occurrences of permanent failures, and continuous three-phase short circuits on the AC power side. Efforts should be made to identify and address both short-duration and long-duration interruptions in order to ensure the reliable operation of the DC power system.
2.2. DC Voltage Dip
Voltage dip in DC distribution grids is the most common power quality issue. It refers to an event where the DC voltage instantaneously drops to a range of 10% to 90% of the rated voltage amplitude within a continuous one-minute timeframe. The main causes of voltage dips include the sudden withdrawal of distributed energy sources, such as photovoltaic or wind power, in DC distribution grids, rapid drops in output from distributed energy sources causing fluctuations in line currents, and the large-scale connection of loads within the system. Voltage dip mitigation measures are crucial to ensure the stability and reliability of DC power systems, especially in the presence of distributed energy sources [23]. The calculation formula for the amplitude of DC voltage dip is as follows:
where ud and un are the voltage amplitude before and after the voltage dip; udN is the rated voltage value of normal operation; and usag is the voltage drop value.
2.3. DC Voltage Temporarily Rise
Voltage transients in DC distribution grids refer to sudden increases in line voltage that exceed 1.1 times the rated operating voltage of the system but typically do not exceed 1.8 times. These increases are followed by a rapid return to the rated voltage within a short period, usually within 1 min. The primary causes of this phenomenon include the sudden decrease in alternating current (AC) and direct current (DC) loads, as well as temporary increases in the output of distributed energy sources due to unpredictable fluctuations in natural factors such as wind speed, sunlight, temperature, and more [24]. These voltage transients can impact the stability and performance of DC power systems, necessitating the implementation of mitigation strategies.
2.4. DC Voltage Fluctuation
DC voltage fluctuation generally refers to the phenomenon that the actual voltage amplitude deviates from the rated value in a period of time.
The formula of voltage change rate is as follows:
where ε is the voltage change rate; udmax is the maximum voltage amplitude of DC voltage; udmin is the minimum voltage amplitude of DC voltage; Δud is the difference between the two amplitudes; and Δt is the difference between the two moments.
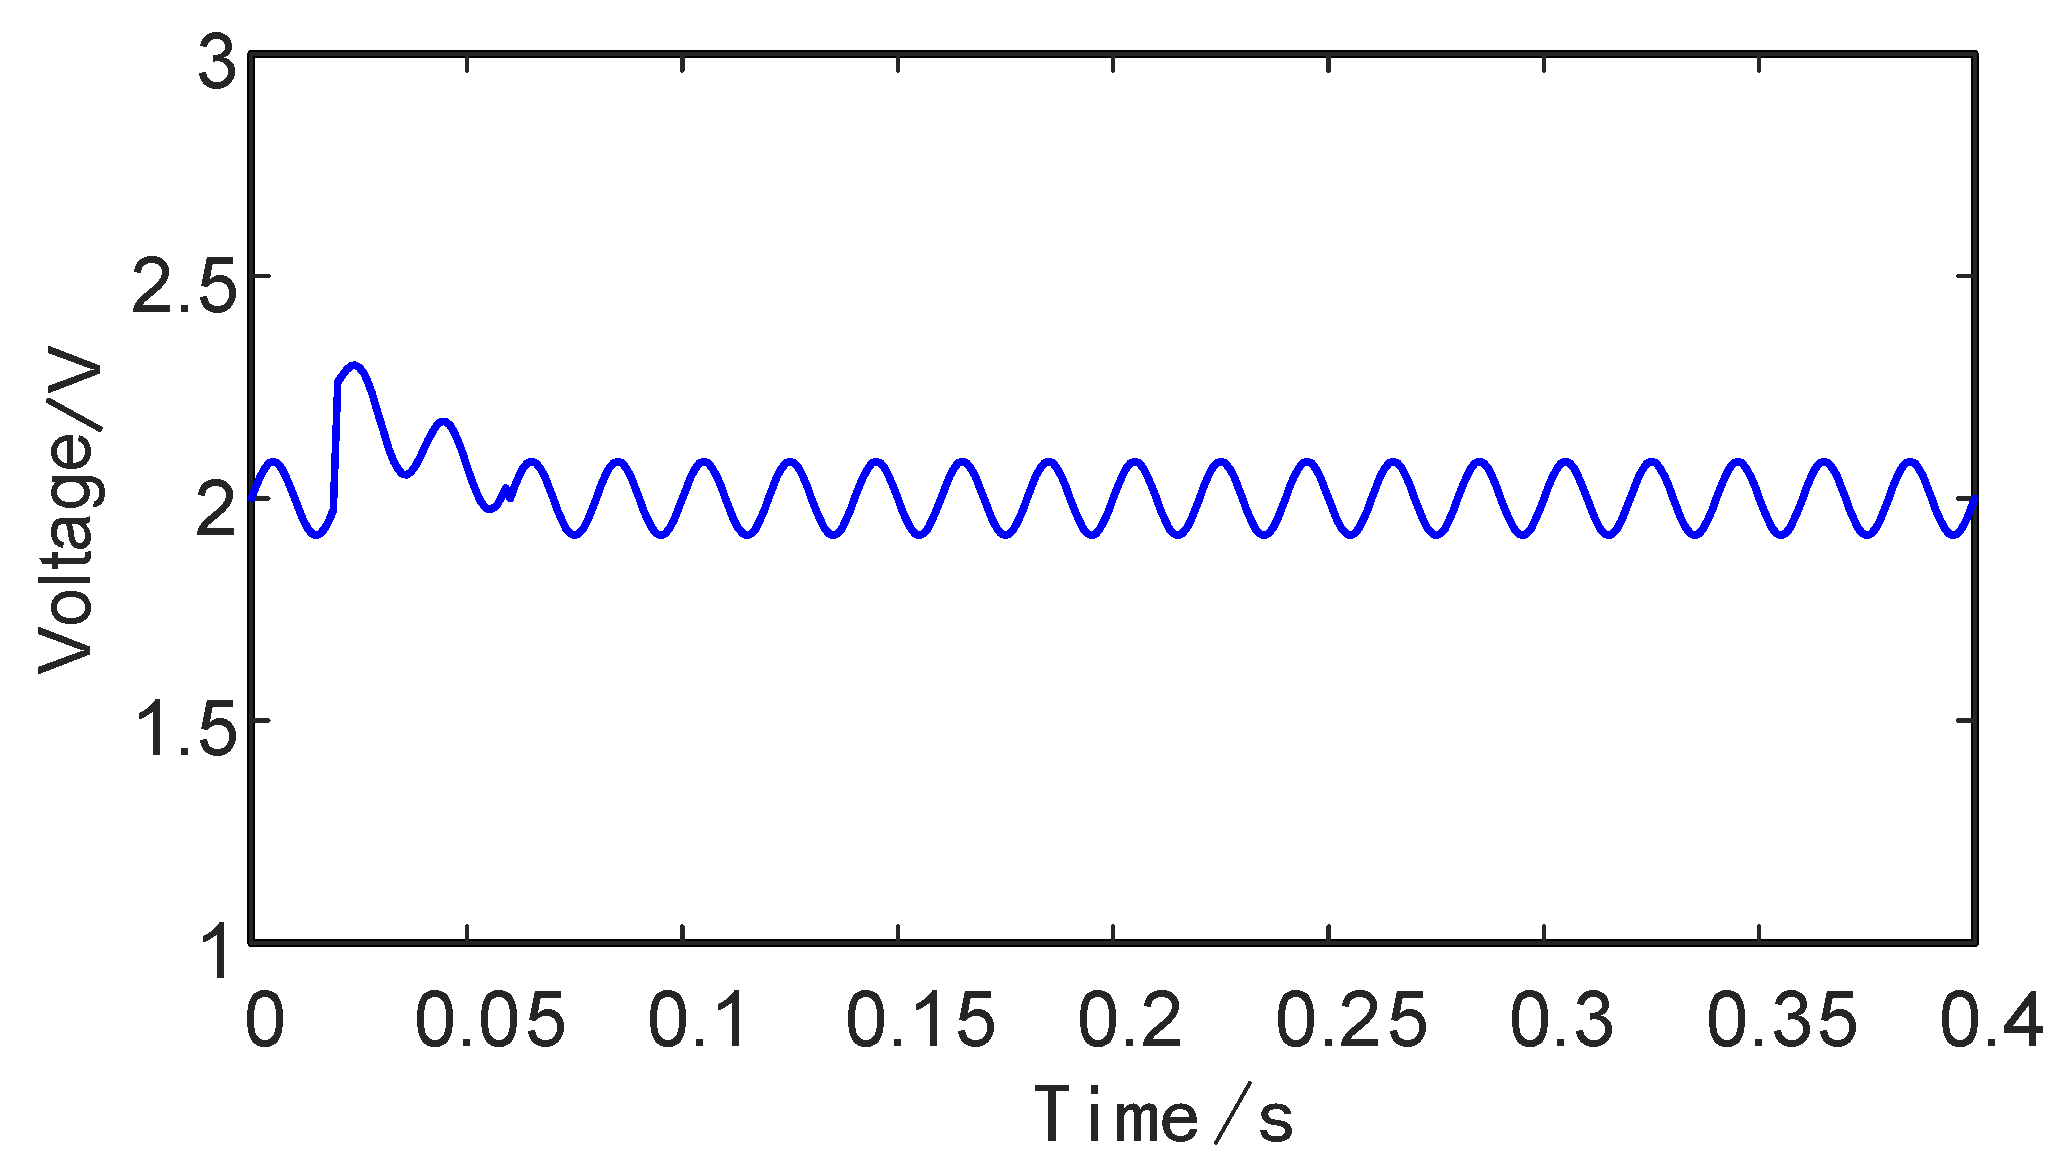
The primary factors contributing to fluctuations in DC voltage include: (1) frequent start and stop cycles of short-duration equipment within the system, as well as system short circuits; (2) the on/off operation of high-power AC equipment within the DC distribution network, resulting in voltage fluctuations along the DC line; (3) the power variation in distributed power supply is due to environmental factors. The diagram in Figure 1 illustrates the typical fluctuation of the DC bus voltage. The fluctuation of microsource power in the distribution network results in a variation in the direct current (DC) voltage of common nodes, causing the voltage to oscillate around the rated voltage.
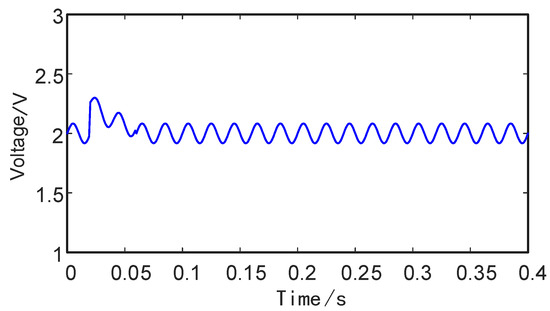
Figure 1.
Voltage fluctuation waveform.
2.5. DC Voltage Ripple
The aforementioned disturbances in DC power are transient power quality issues, while ripple pertains to steady-state power quality problems. Ripple refers to the alternating current (AC) components that are overlaid on a stable direct current (DC) voltage or current. This ripple is typically generated by rectifiers in power electronic converters. Ripple shares certain similarities and differences with harmonics in AC systems. It generally refers to periodic non-sinusoidal wave components with frequencies higher than the fundamental frequency in DC systems.
In relation to the utility frequency, the voltage ripple in DC distribution networks can be classified into first-, secons-, and kth-order ripple, where k represents an integer multiple of the utility frequency [25]. Since there are no established standards specifically for DC distribution systems, evaluating DC voltage ripple can be analogized to harmonics in AC systems. Indicators such as ripple content AH, ripple factor RF, and ripple content at k times the utility frequency RAh are used to quantify the level of voltage ripple.
where Ah is the square mean root value of h power frequency ripple, that is, the effective value; and Ad is the voltage amplitude of the DC bus.
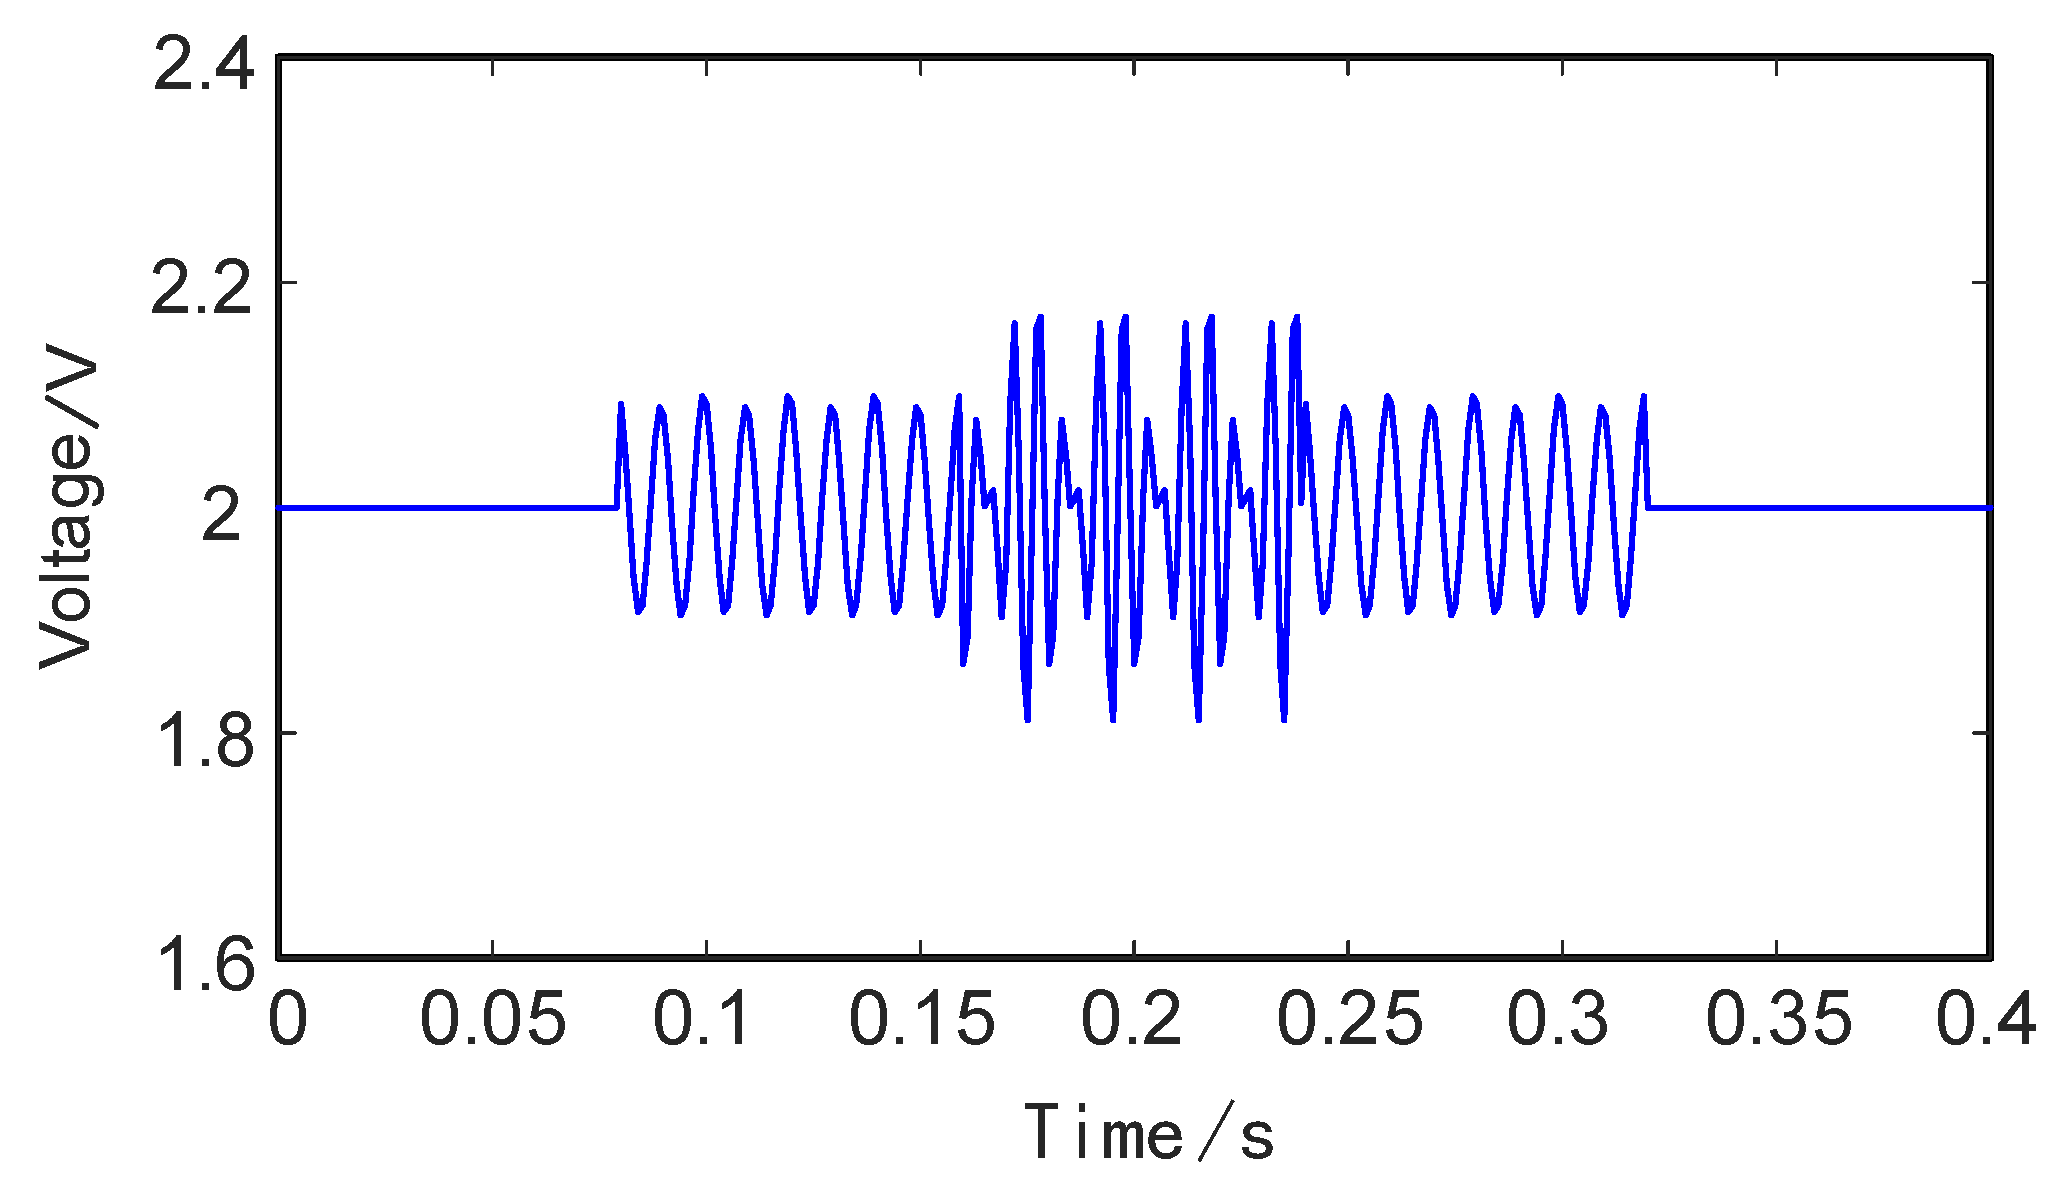
The waveform diagram of a typical DC ripple is shown in Figure 2. The factors contributing to voltage ripple in DC distribution networks can be broadly categorized as follows: (1) AC equipment, such as arc furnaces, connected to the DC distribution network can generate non-fundamental frequency ripple signals; (2) unbalanced three-phase voltages and harmonic components in the AC main grid connected to the DC distribution network; (3) Mmdulation methods used in power conversion devices can result in ripple signals that are related to the modulation waveform [26]. Voltage ripple can reduce power efficiency, accelerate component aging, and strong voltage ripple can even cause resonance in the power grid, leading to overcurrent and overvoltage. This can have a significant impact on the power quality of the DC distribution network.
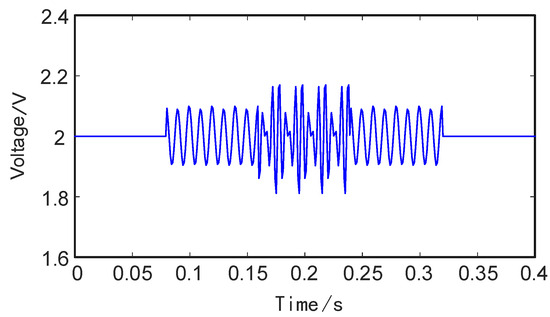
Figure 2.
Voltage ripple shape.
3. Feature Extraction
3.1. S-Transform
The S transform is a reversible time–frequency analysis method that combines the advantages of both the wavelet transform and the Fourier transform. It replaces the wavelet basis function with a Gaussian window, thereby addressing the limitation of a fixed window width [27]. This enhancement results in excellent time–frequency characteristics and reduced sensitivity to noise. Consequently, the S-transform is highly suitable for extracting dynamic signals [28]. The one-dimensional continuous S-change of the signal x(t) is defined as follows:
where x(t) is the signal to be analyzed; w(τ − t, σ) is the Gaussian window; τ is the time translation factor; t is the time; f is the frequency; and σ is the scale factor to which the window function is fixed, which relates the window width to the frequency, so that the window width is no longer fixed. The continuous signal x(t) can be represented in discrete form x(Kt) by sampling, where T is the sampling interval; N is the total number of samples; and K = 0, 1, 2… N − 1.
The signal’s time–frequency domain waveform is projected into a three-dimensional space using the S-transform. The real-frequency diagram encompasses information about the disturbance, including its frequency, amplitude, phase, and frequency domain characteristics.
3.2. Characteristic Index
3.2.1. Rectangle Coefficient
The ratio between the deviation of the effective voltage value within the disturbance start and end times and its maximum deviation is defined as follows:
where URMS(k) is the effective value of the electrode voltage; k is the discrete sampling point; and k1 and k2 are the sampling points corresponding to the start and stop time of the disturbance, respectively. A rectangular coefficient approaching 1 indicates that the waveform shape during the disturbance period resembles a rectangle more closely. By observing the waveform characteristics, it can be inferred that voltage sags and swells exhibit a waveform shape that approximates a rectangular wave when their rectangular coefficient approaches 1.
3.2.2. Standard Deviation of Waveform
The waveform standard deviation characterizes the statistical properties of individual waveforms and is used to reflect the dispersion of a dataset. Its formula is as follows:
where K is the total number of samples; U is the average bus voltage.
For different power quality perturbations, the waveforms deviate from the mean value to different degrees, and the standard deviation of waveforms is also very different.
3.3. Feature Extraction Rule
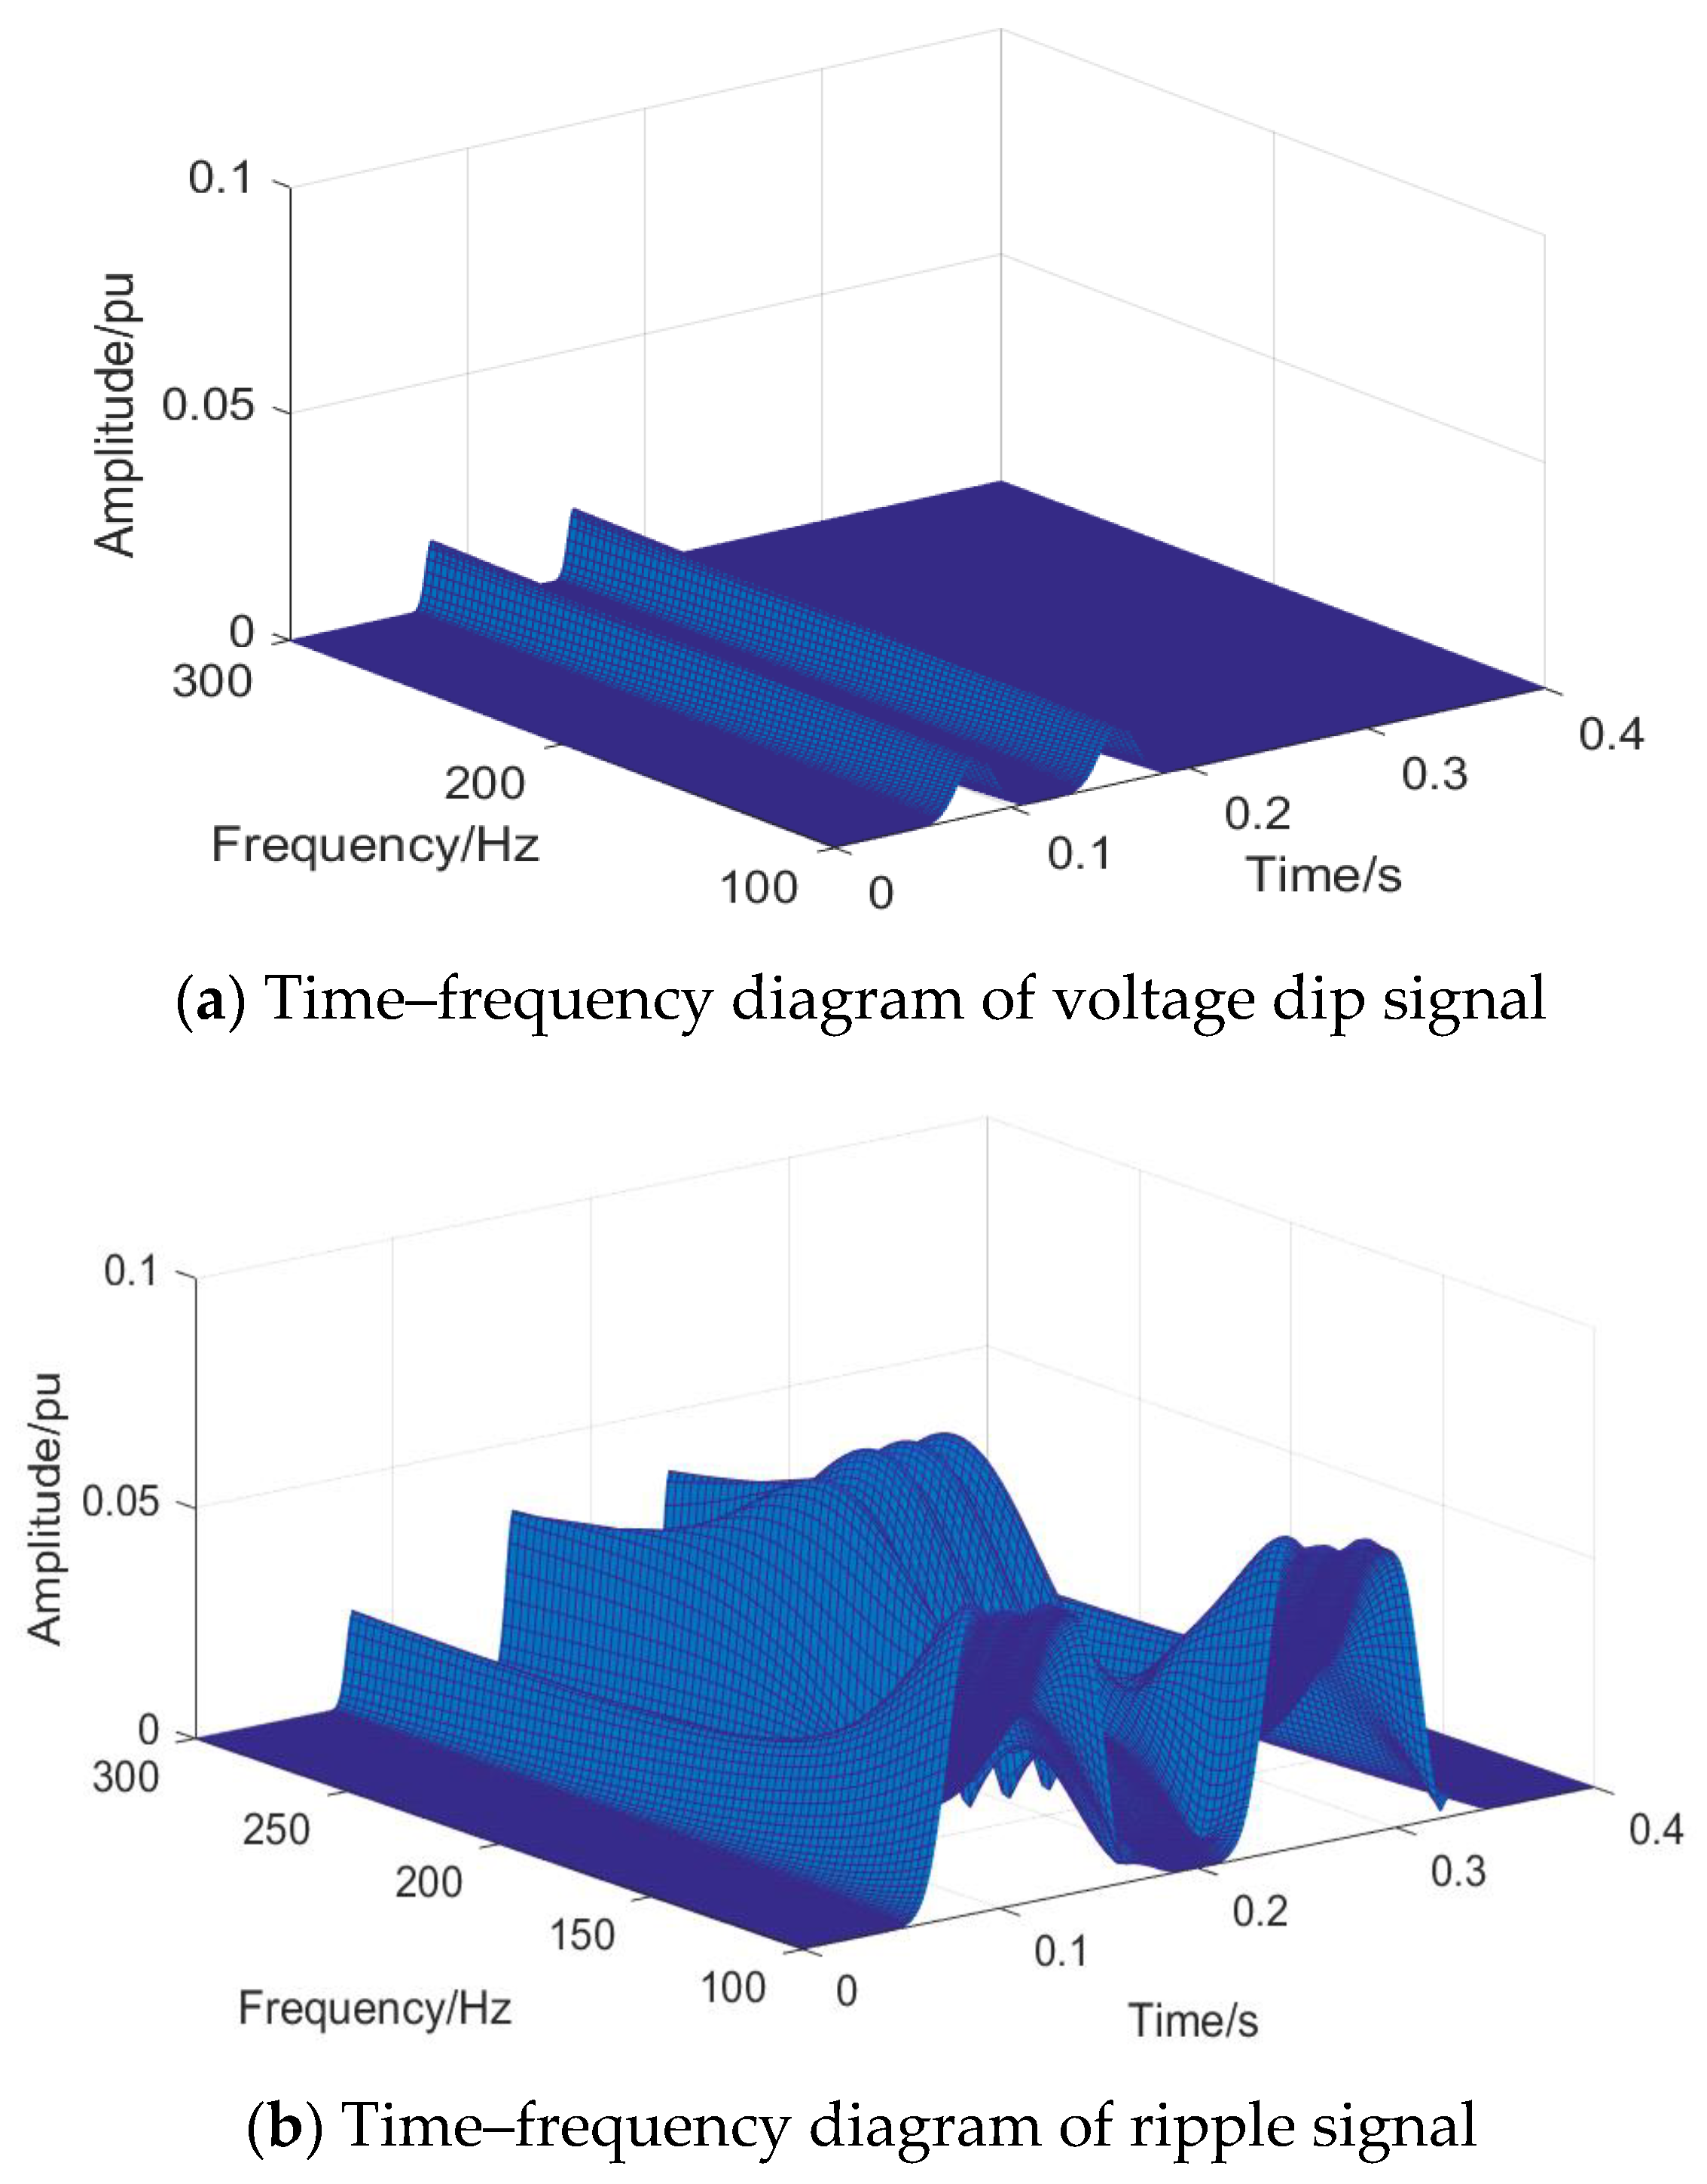
The feature extraction of each disturbance signal is carried out using the S-transform. The time–frequency diagram of a typical signal extracted by the S-transform is shown in Figure 3.
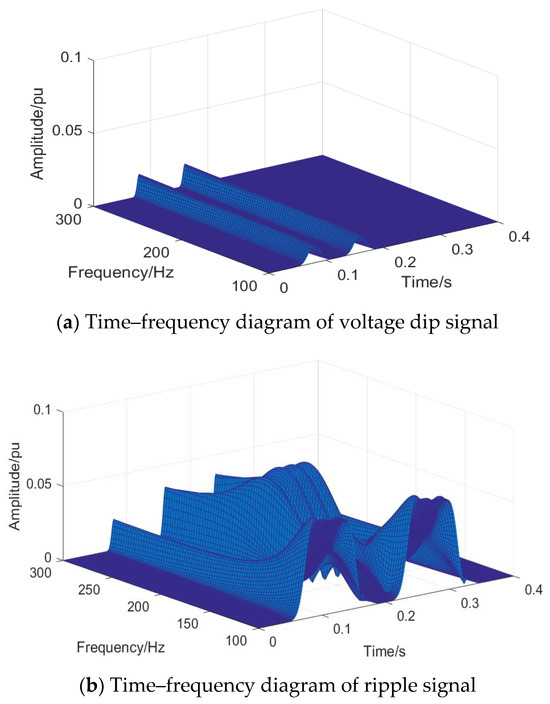
Figure 3.
Signal time–frequency diagram.
By analyzing the S-transform time–frequency diagram of each signal, it is evident that different disturbance signals exhibit distinct changes when the disturbance occurs. Specifically, the amplitude increases temporarily when the voltage rises, surpassing the reference value. Additionally, the amplitude of the fluctuation varies around the reference amplitude over time, with a notable amplitude bump in the middle frequency band. The interrupt and temporary drop values are lower than the base value, but they have different amplitudes [29]. The amplitude of the interrupt signal is closer to 0. The ripple will appear in a high-frequency band with higher amplitude harmonics.
According to the characteristics of the waveforms of different types of DC energy quality problems, such as time–frequency distribution, statistical characteristics, and frequency domain characteristics, five features have been designed and extracted as judgment rules for each type of disturbance. These features are presented in Table 3.

Table 3.
Feature extraction design method.
4. SABO-BP Algorithm
4.1. BP Neural Network
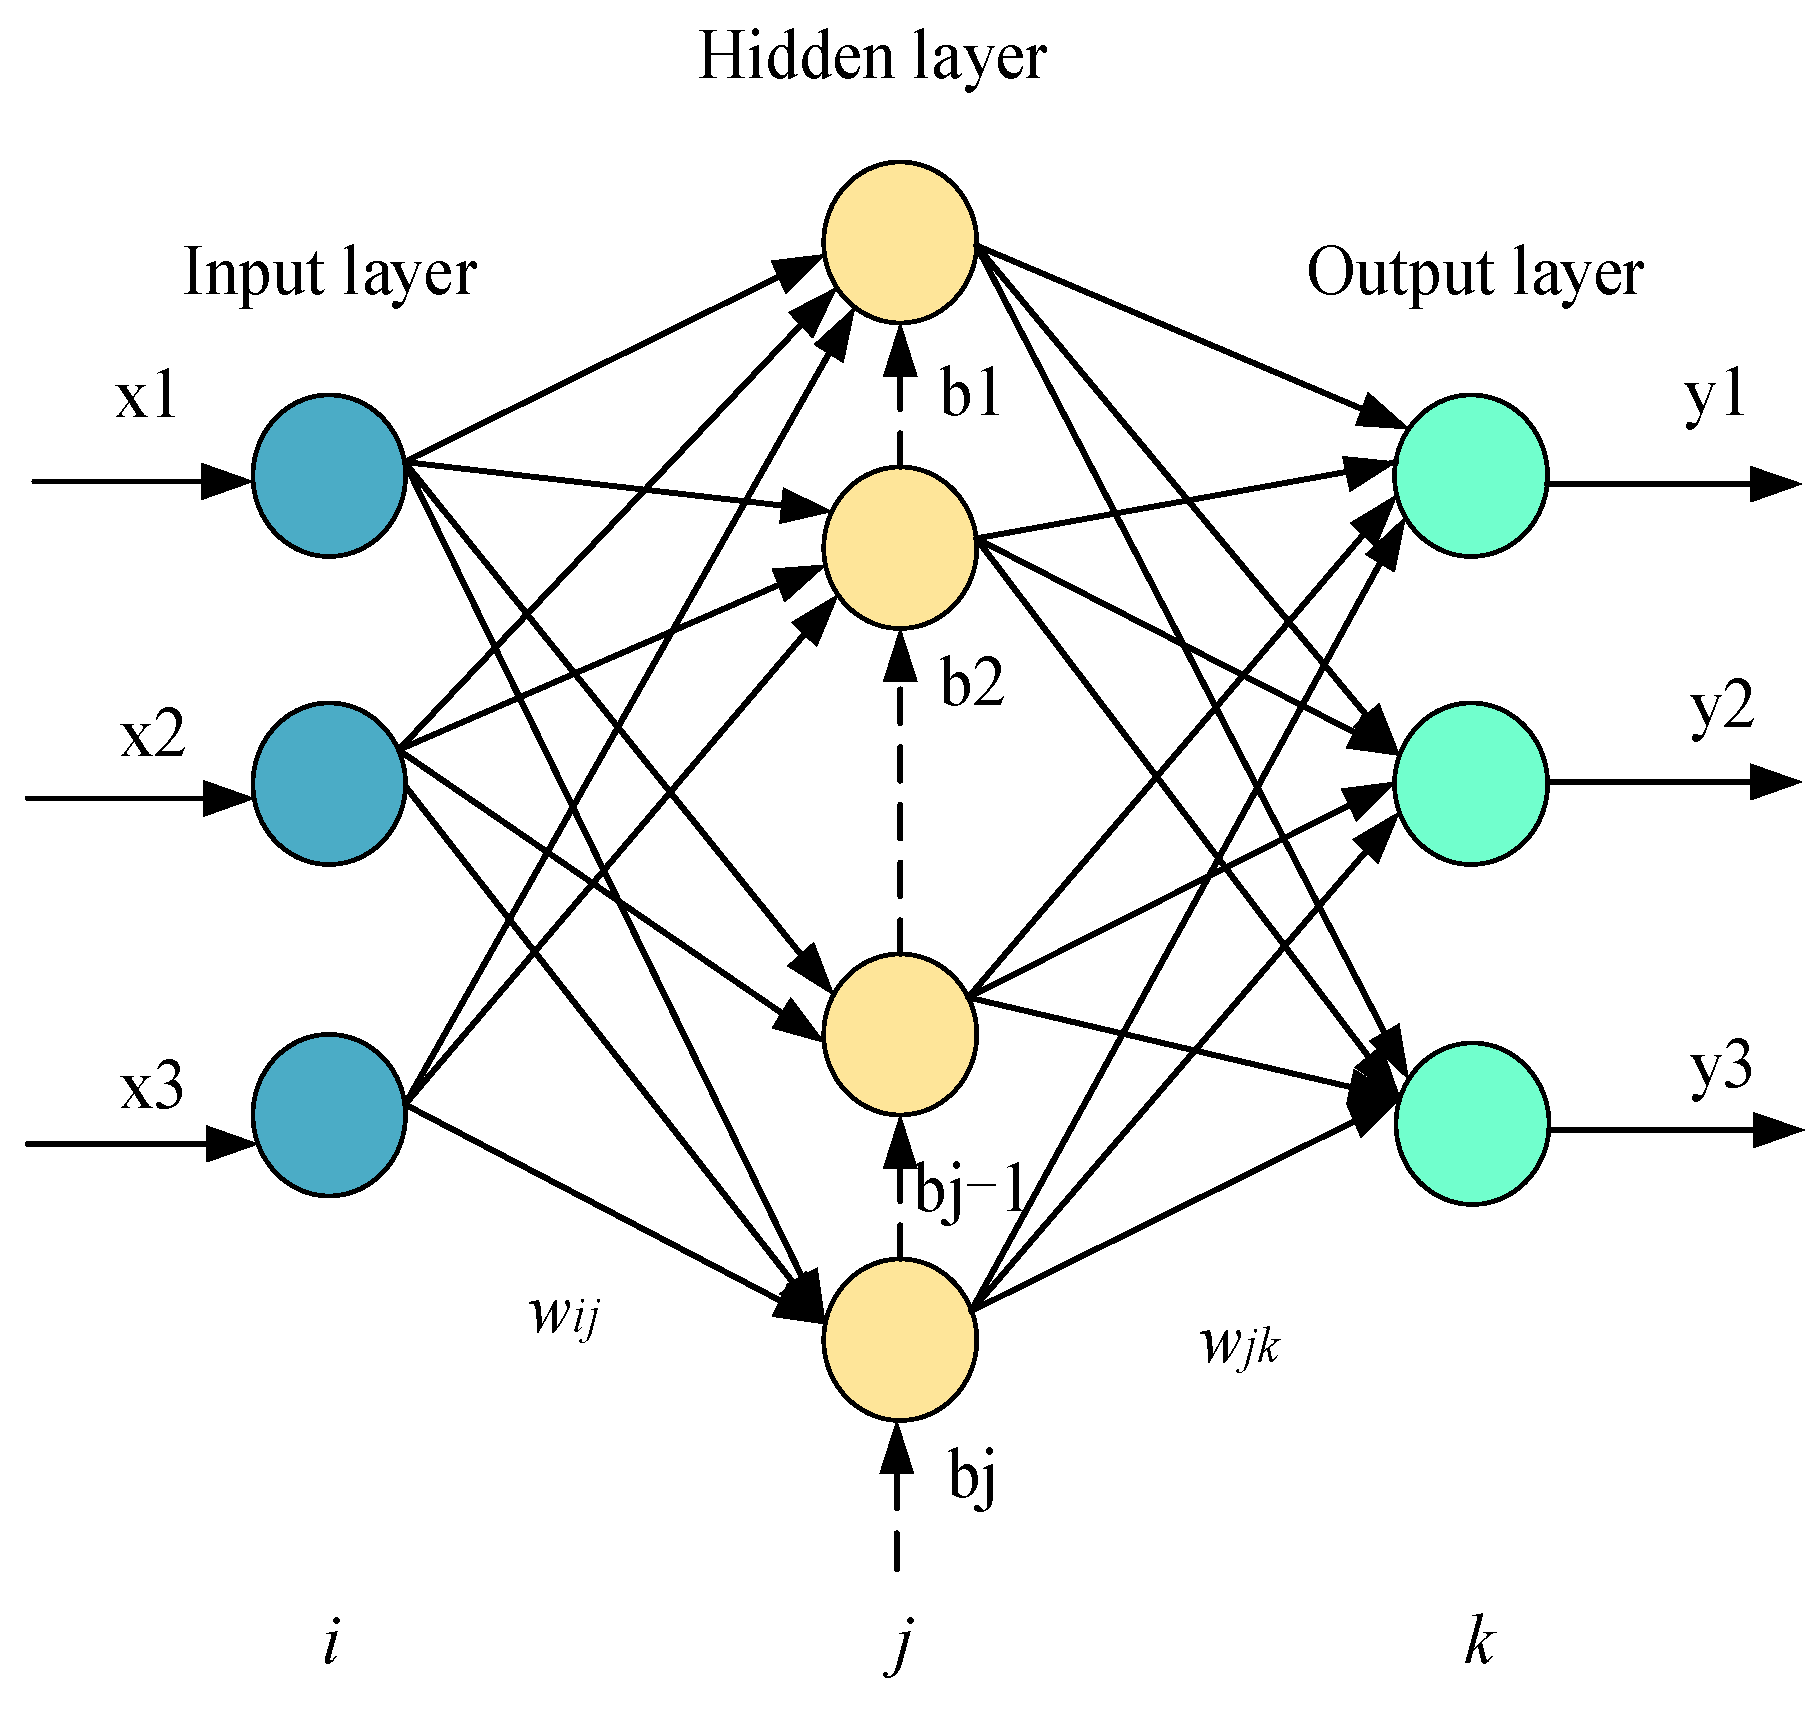
Back propagation neural network (BPNN), which was proposed by Rumelhart and McClelland in 1986 [30], is a multi-layer feedforward neural network that is trained using the error reverse propagation algorithm. The basic structure of a typical BPNN neural network is illustrated in Figure 4.
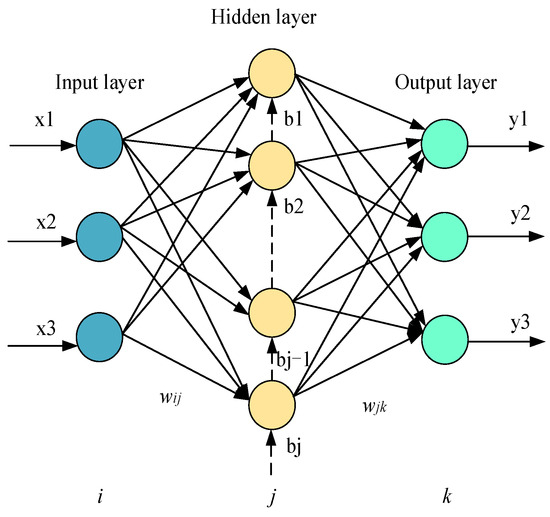
Figure 4.
Schematic diagram of BP neural network model.
In the diagram, xn represents the input variable, and i, j, and k denote the quantities of nodes in the input layer, hidden layer, and output layer, respectively. wij and wjk are the connection weights between layer, while yij and yjk correspond to the output values of the hidden layer and the output layer, respectively.
The distribution of weights between layers and neurons directly determines whether the network can ultimately reach the predetermined error and achieve convergence [31]. Thresholds exist within neurons; only when external stimuli reach a certain threshold will the next neuron be stimulated to work [32]. Improper selection of weights and thresholds can easily lead to slow convergence and becoming trapped in local optima [33]. Therefore, to address the aforementioned issues, the subsequent sections consider the utilization of intelligent optimization algorithms to optimize both weights and thresholds.
4.2. SABO Algorithm
The subtraction average-based optimizer (SABO) [34], proposed by Mohammad Dehghani in 2023, is a mathematically conceptualized optimization algorithm. Its primary concept revolves around updating the positions of members within a population in the search space by utilizing the subtraction average of individuals. This approach effectively mitigates the algorithm’s dependence on specific individuals.
4.2.1. Algorithm Initialization
The solution space for the optimization problem is referred to as the search space. The initial placement of individual search agents within this search space is randomly determined, as shown in Equation (9):
where X represents the overall matrix of the SABO population; Xi denotes the ith individual; Xi,d specifies its position in the dth dimension of the search space; N corresponds to the total number of individuals within the population; m refers to the count of decision variables; ri,d stands for a random number within the interval [0, 1]; and lbd and ubd, respectively, represent the lower and upper bounds of the decision variables in the dth dimension.
Each search particle corresponds to a solution of the optimization problem, and their collection of fitness function values is represented as a vector , as shown in Equation (10):
where represents the fitness function; Fi represents the fitness function.
4.2.2. SABO Algorithm Flow
Unlike most optimization algorithms, the SABO algorithm does not update the position of the search population in the (t + 1)-th iteration solely based on the position of the best search agent in the t-th iteration; instead, it employs the arithmetic mean position of all search agents in the t-th iteration to perform the update for the (t + 1)-th iteration search population. The steps of the SABO algorithm are as follows:
- 1.
- The SABO algorithm introduces “-v”, referred to as the “v-difference” between search agents A and B, defined as follows:
Sign is the signum function; the operation “*” denotes the Hadamard product of two vectors.
- 2.
- The displacement of Xi in the search space is computed by taking the arithmetic mean of the “v-differences” obtained through subtraction with each search agent Xj.
Here, represents the new position of the i-th individual Xi; N is the total number of search particles; i is a vector of dimensionality m; and ri is a random value sampled from a normal distribution.
- 3.
- Location update:
4.3. Establishment of the SABO-BP Model
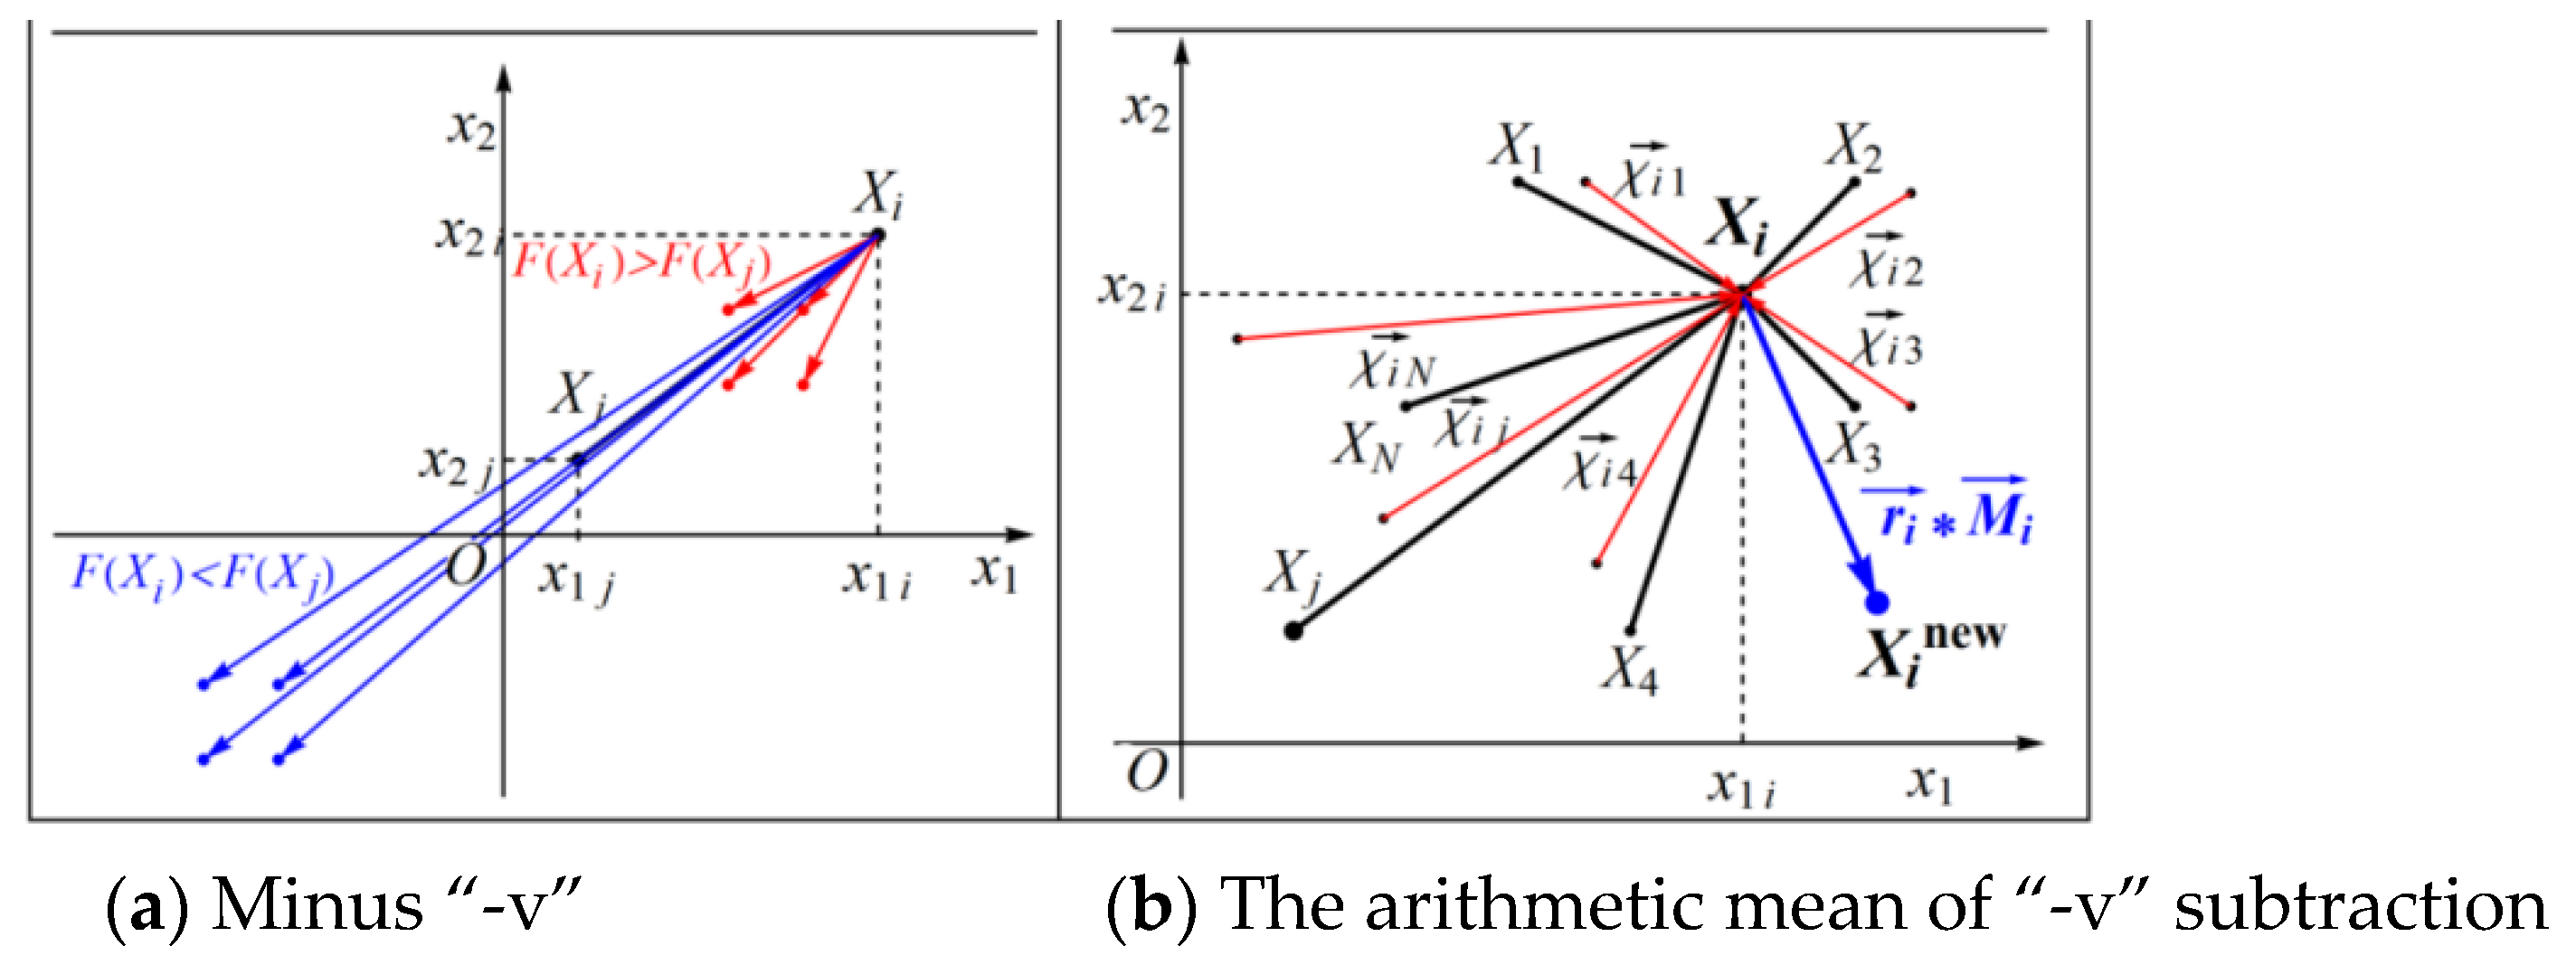
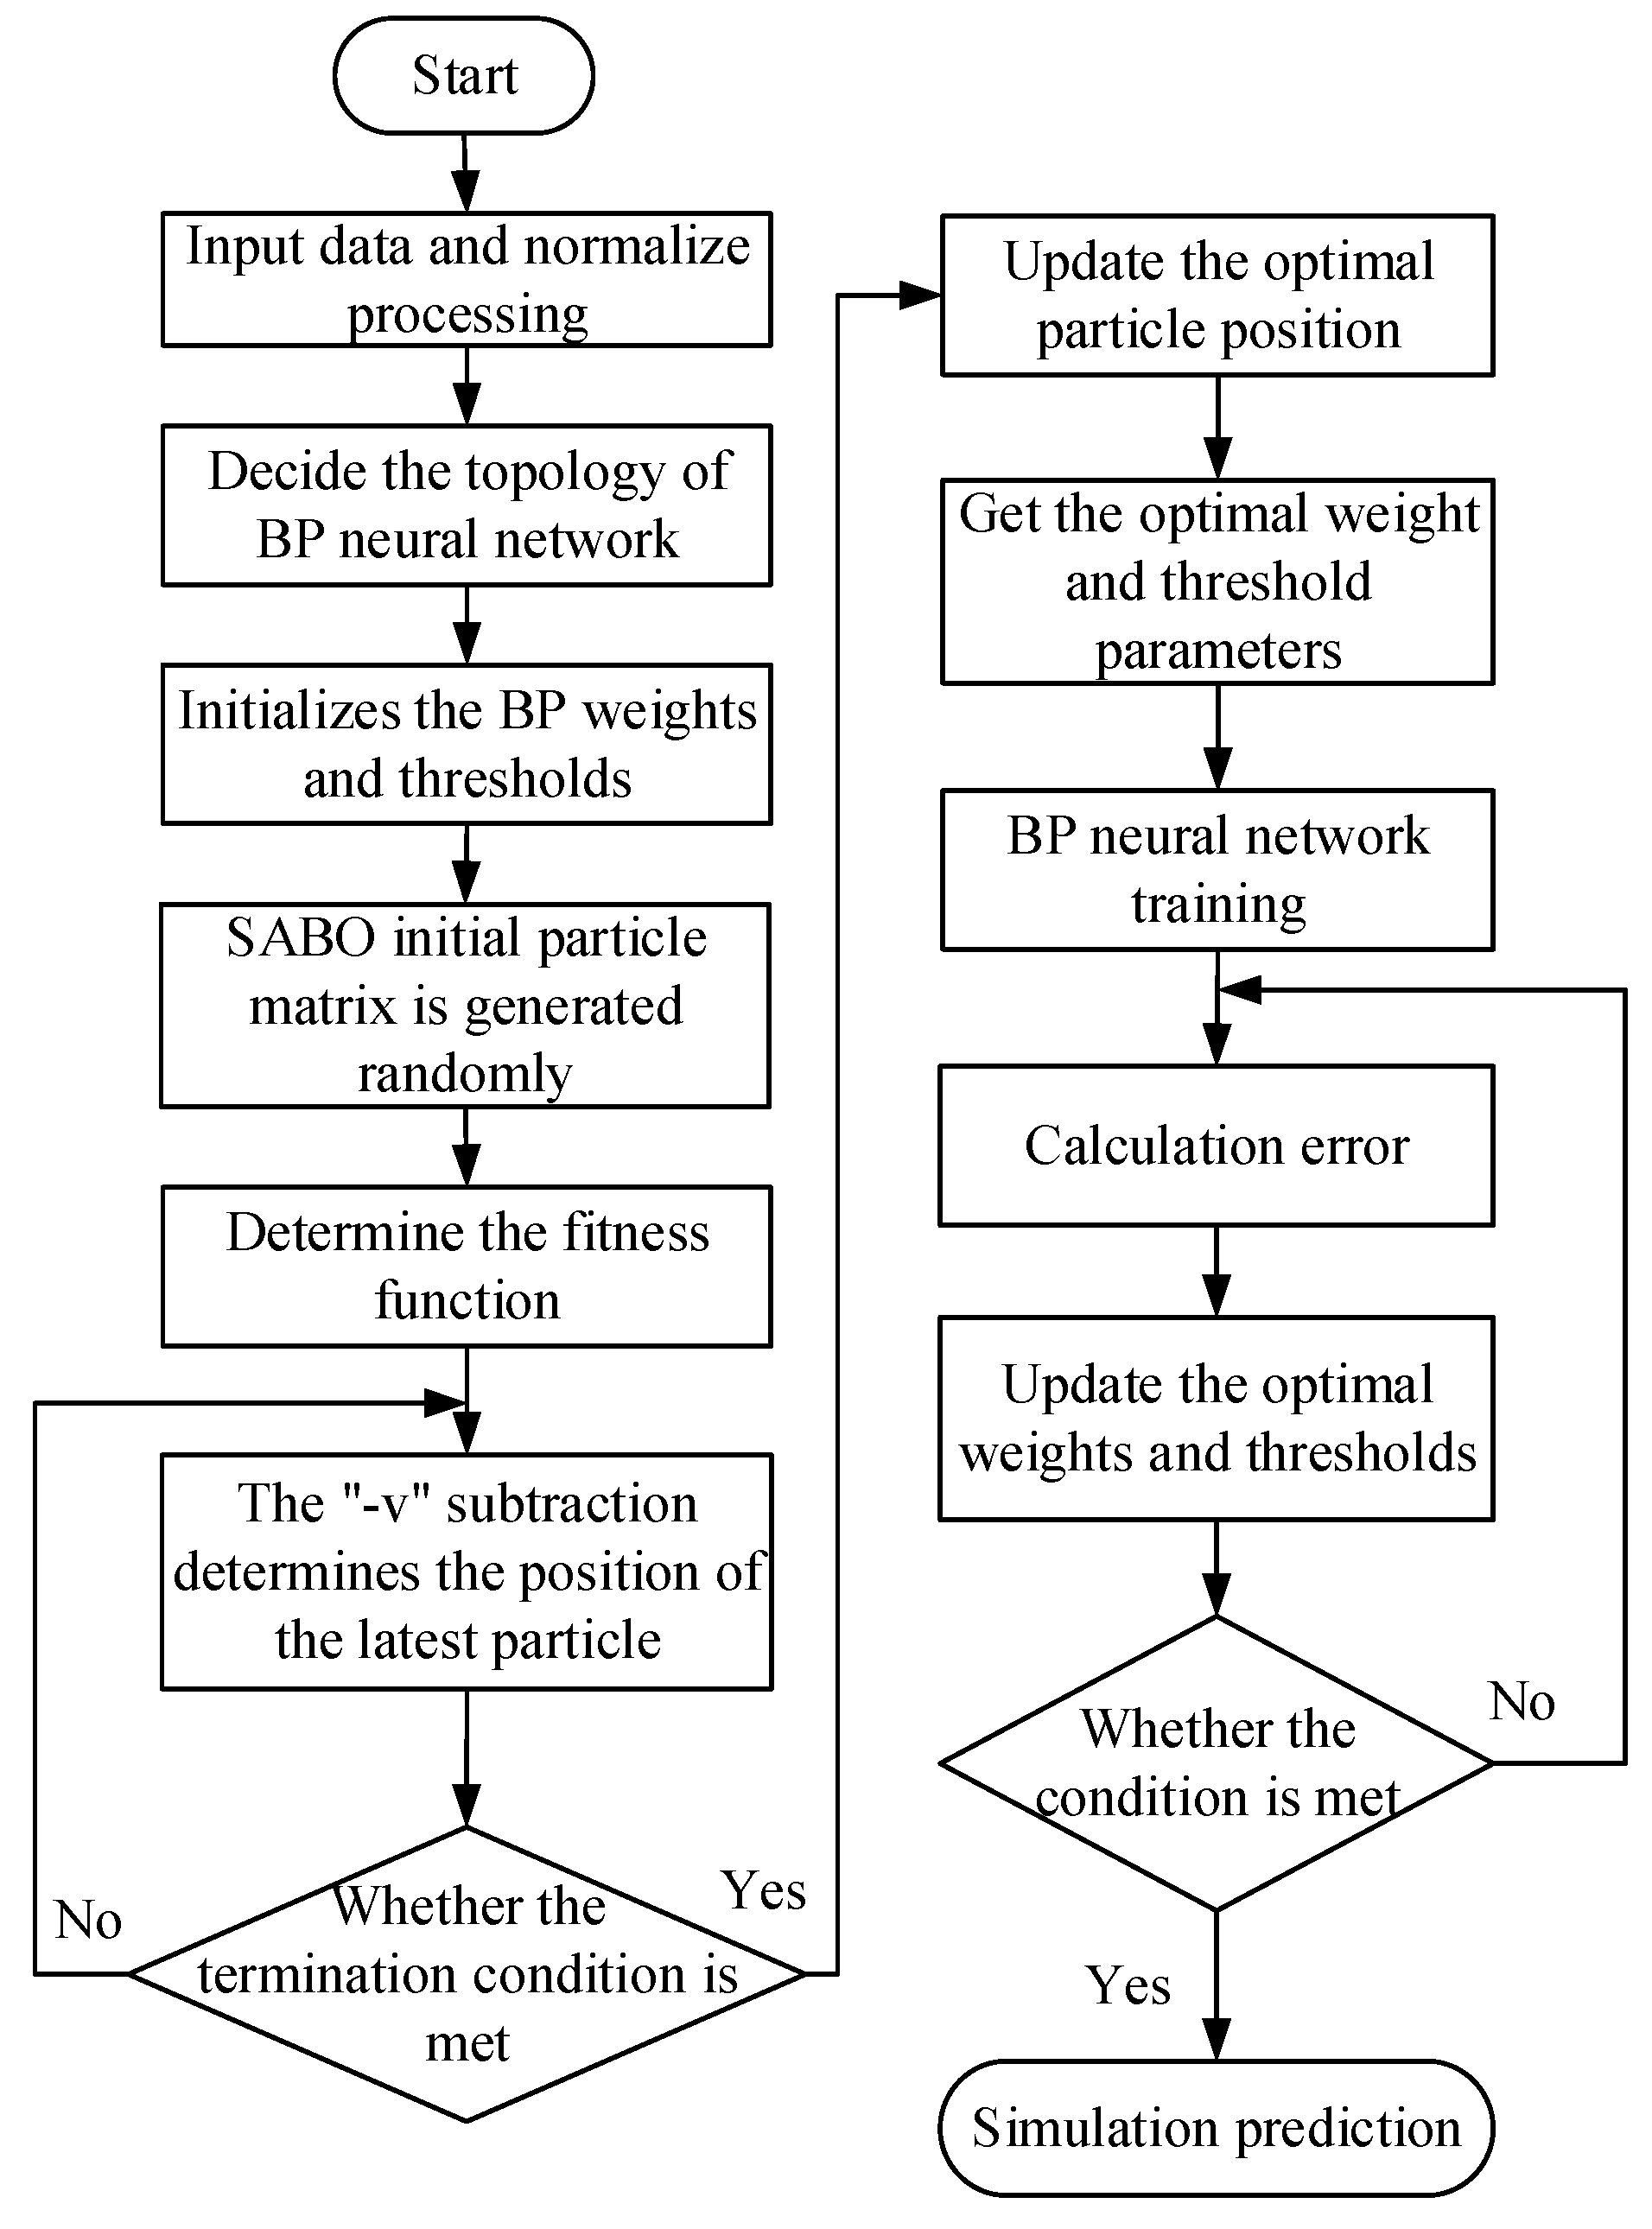
The initial weights and thresholds for the target problem are first determined, and subsequently, the particle positions are updated utilizing SABO’s outstanding global search capabilities. The search principle of the SABO algorithm is illustrated in Figure 5. The subtraction operation “-v” in Xi − ʋXj represents the vector ij, as shown in Figure 5a. Equation (12) represents the motion equation for the search agent Xi, as depicted in Figure 5b, where the average vector i is used to determine the direction in which the search agent moves to its new position . Updating the positions of all search agents completes the first iteration of the algorithm. The operation process of SABO-BP neural network is shown in Figure 6.
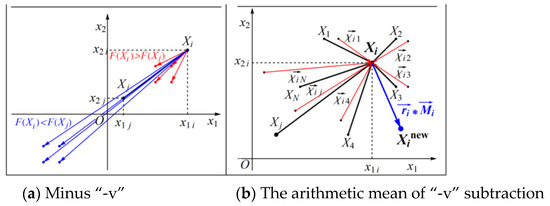
Figure 5.
SABO algorithm schematic diagram.
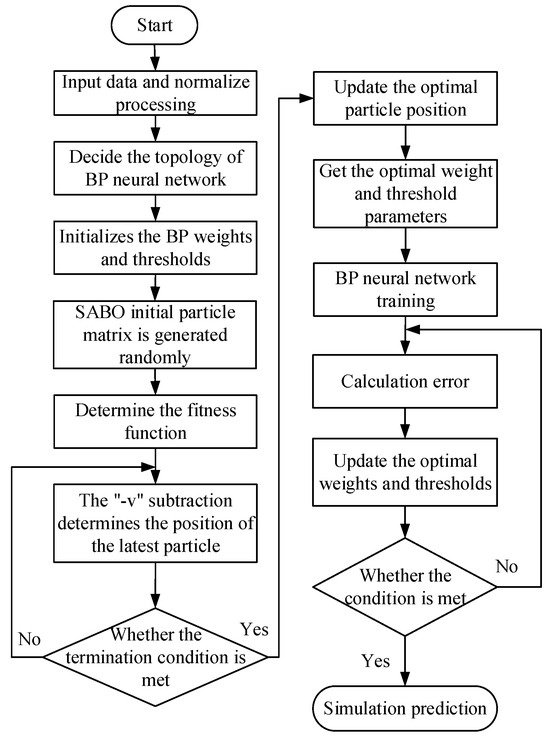
Figure 6.
Operation process of SABO-BP neural network.
The operation flow chart of SABO-BP neural network model is shown in Figure 6. The particle position corresponding to the optimal fitness value is continuously calculated and compared. Each target value is evaluated simultaneously in tandem. These values are then assigned to the BP neural network as weights and thresholds. The continuous calculation of fitness values and subsequent comparisons effectively addresses the issue of BPNN’s susceptibility to local optima. This significantly reduces the number of iterations and enhances its convergence speed.
5. Experimental Results and Analysis
5.1. Experimental Model
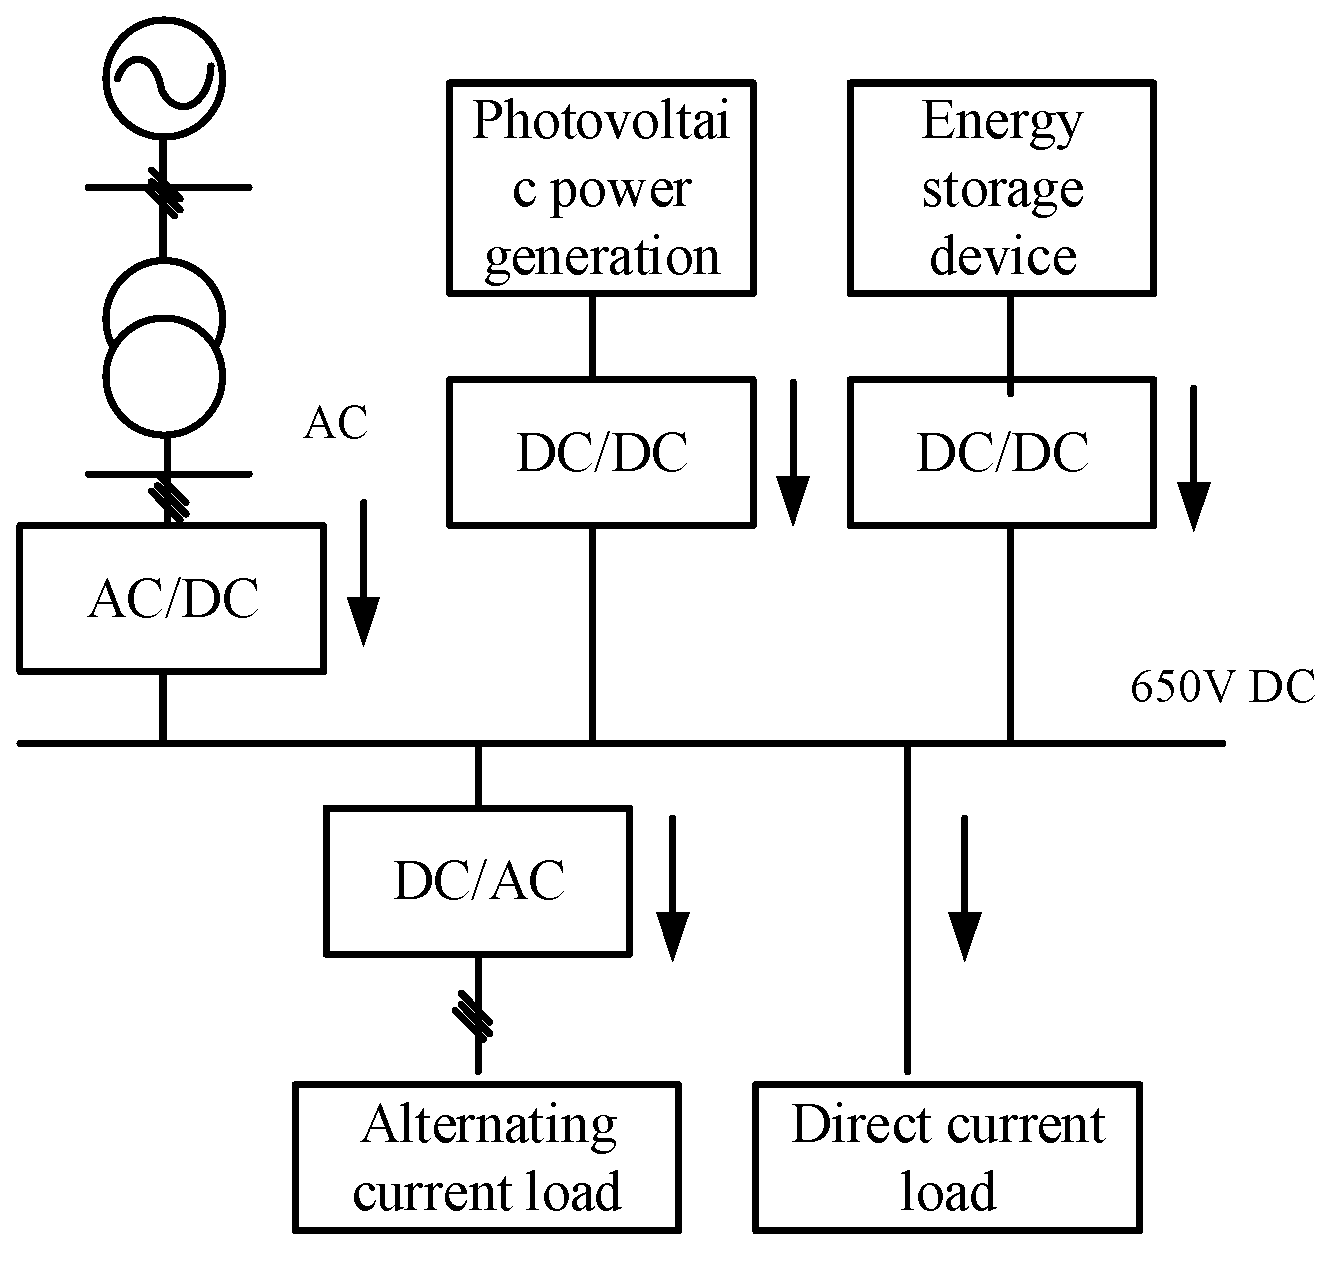
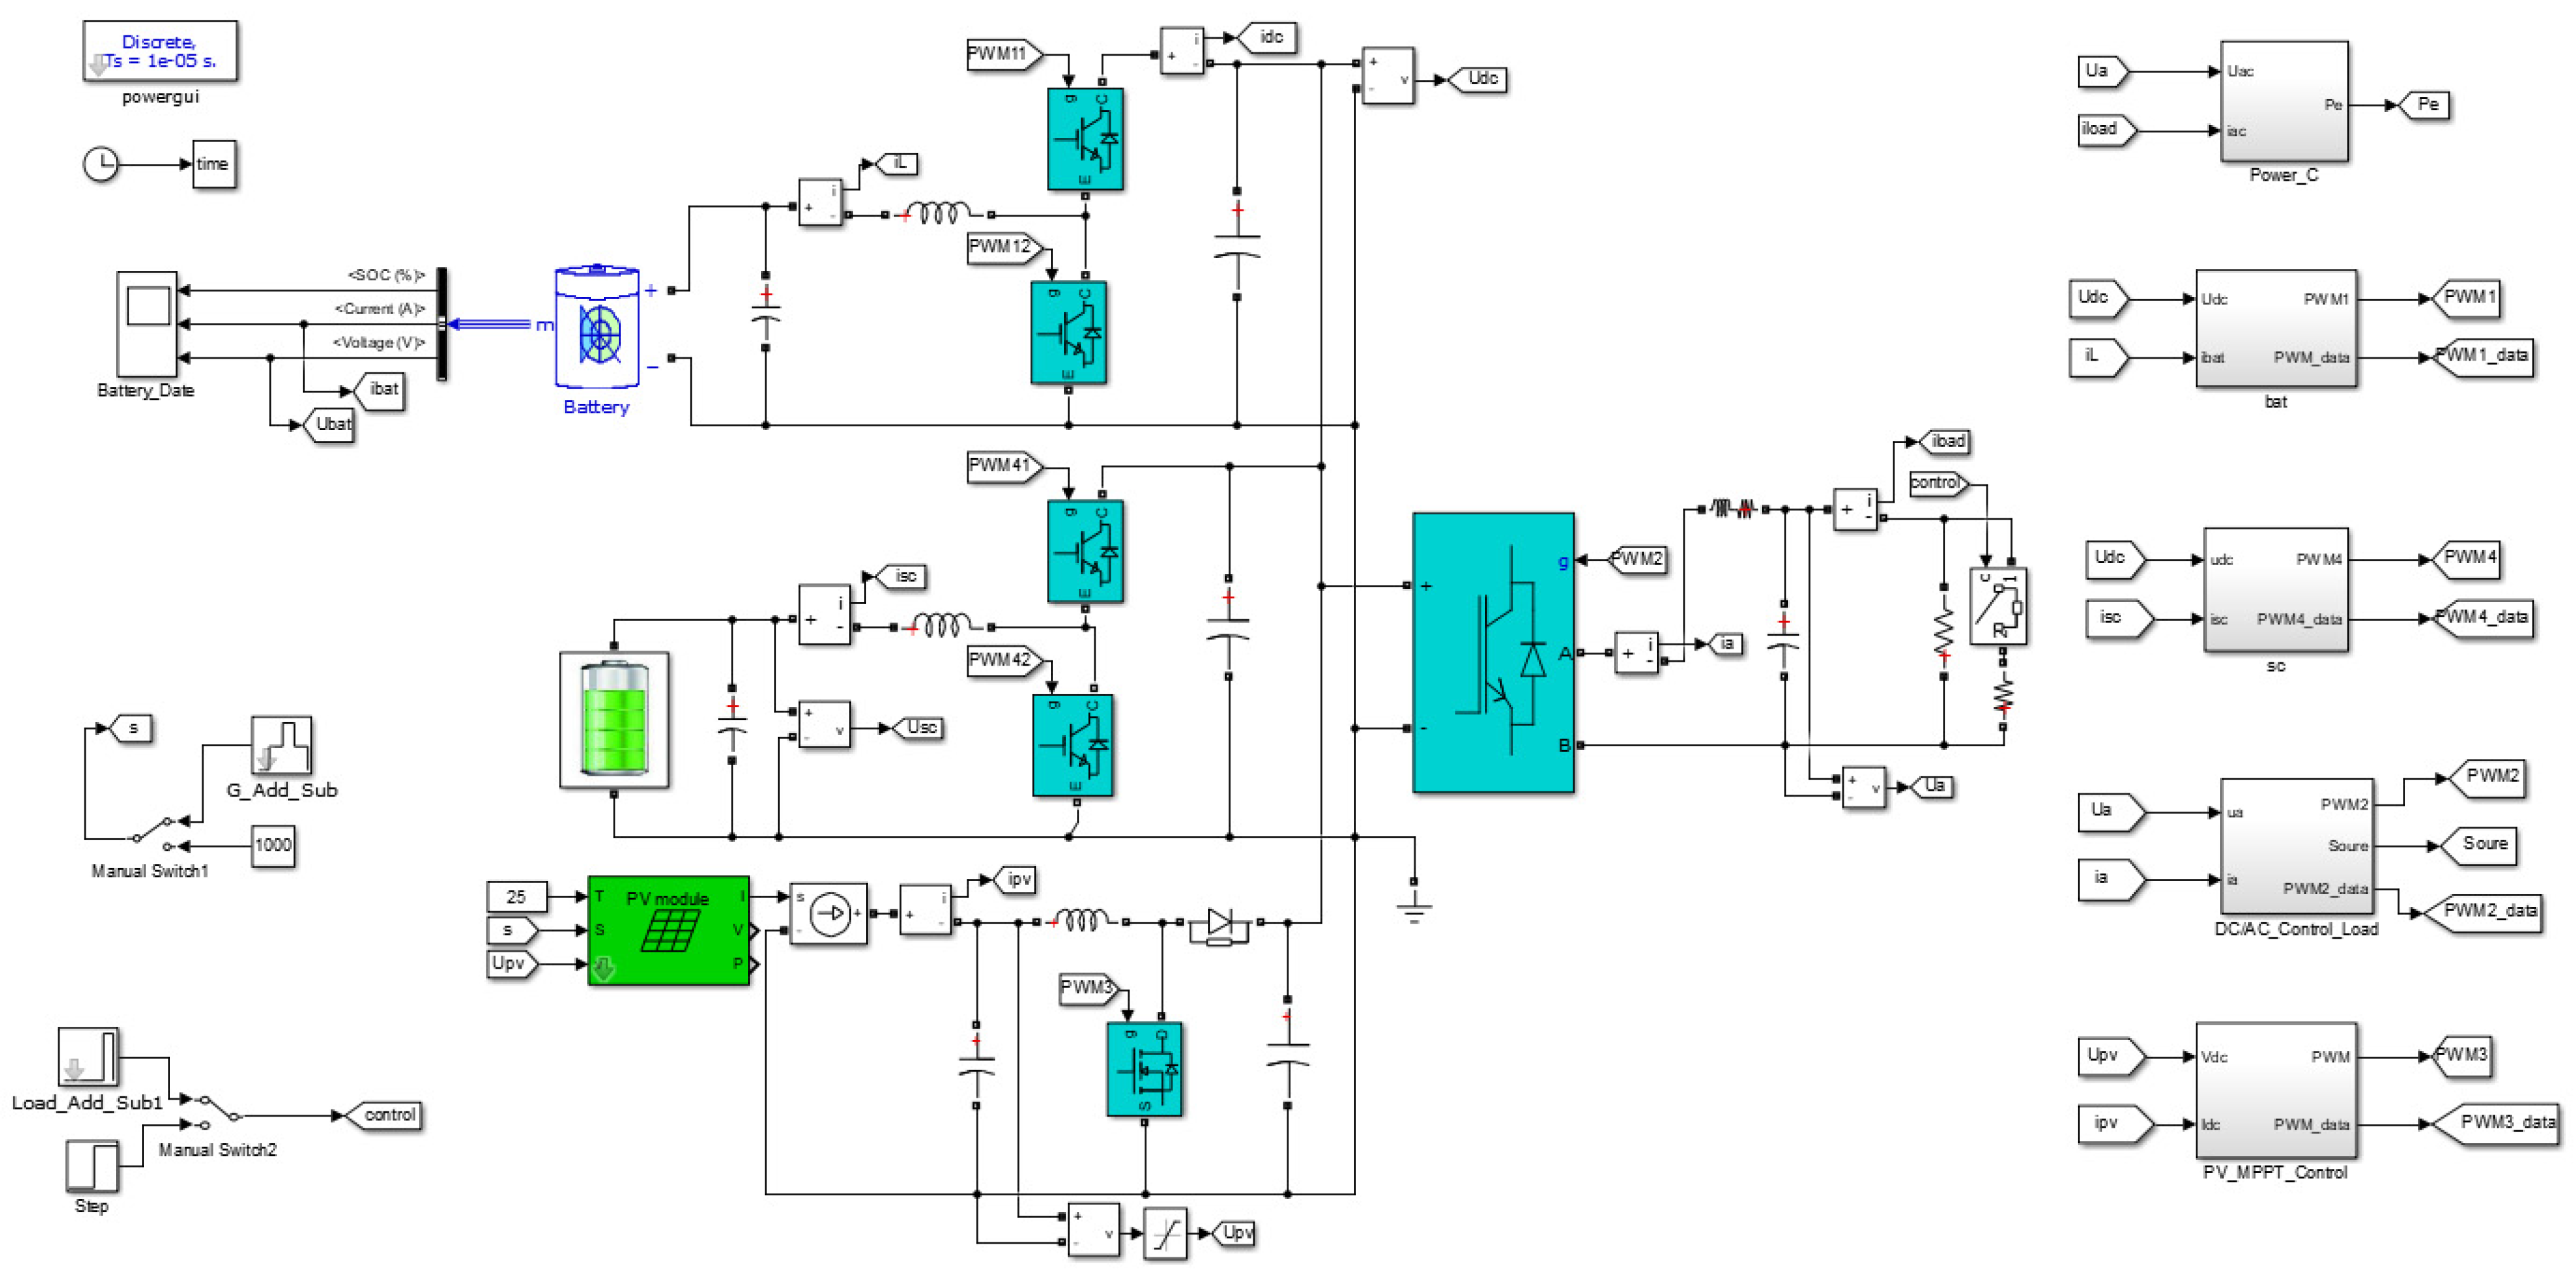
The simulation model of a photovoltaic microgrid was built in MATLAB/Simulink version of R2021a. The research object of this paper is the DC bus voltage of photovoltaic microgrid. The study focuses on the disturbance of the DC bus voltage. The system consisted of a hybrid energy storage device comprising a battery and a supercapacitor, a photovoltaic array, and an AC/DC load module. The system structure diagram is shown in Figure 7, and the simulation model is shown in Figure 8. The system parameters are shown in Table 4. The data sampling frequency is 6.4 kHz, and the simulation step is 1 × 10⁻⁵ s.
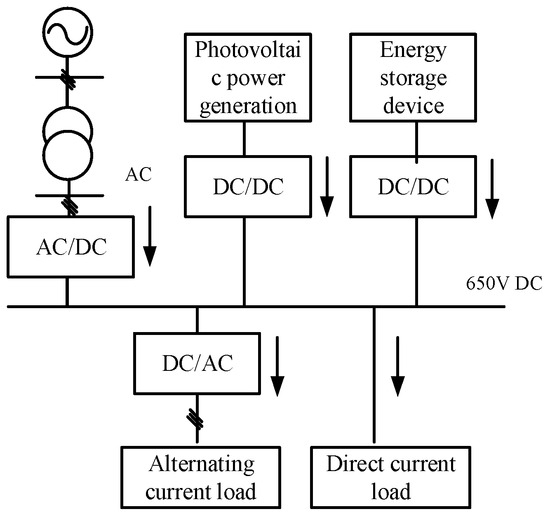
Figure 7.
AC/DC microgrid simulation model.
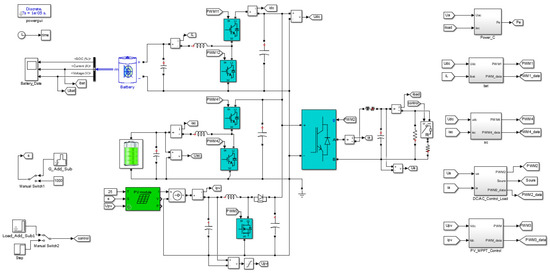
Figure 8.
Simulation model of photovoltaic microgrid.

Table 4.
System parameters.
The DC bus voltage of the system is taken as the research object. According to the generation mechanism of various typical power quality disturbance signals, the system is simulated multiple times. As a result, 200 signals of five typical disturbance signals are obtained, resulting in a total of 1000 data samples.
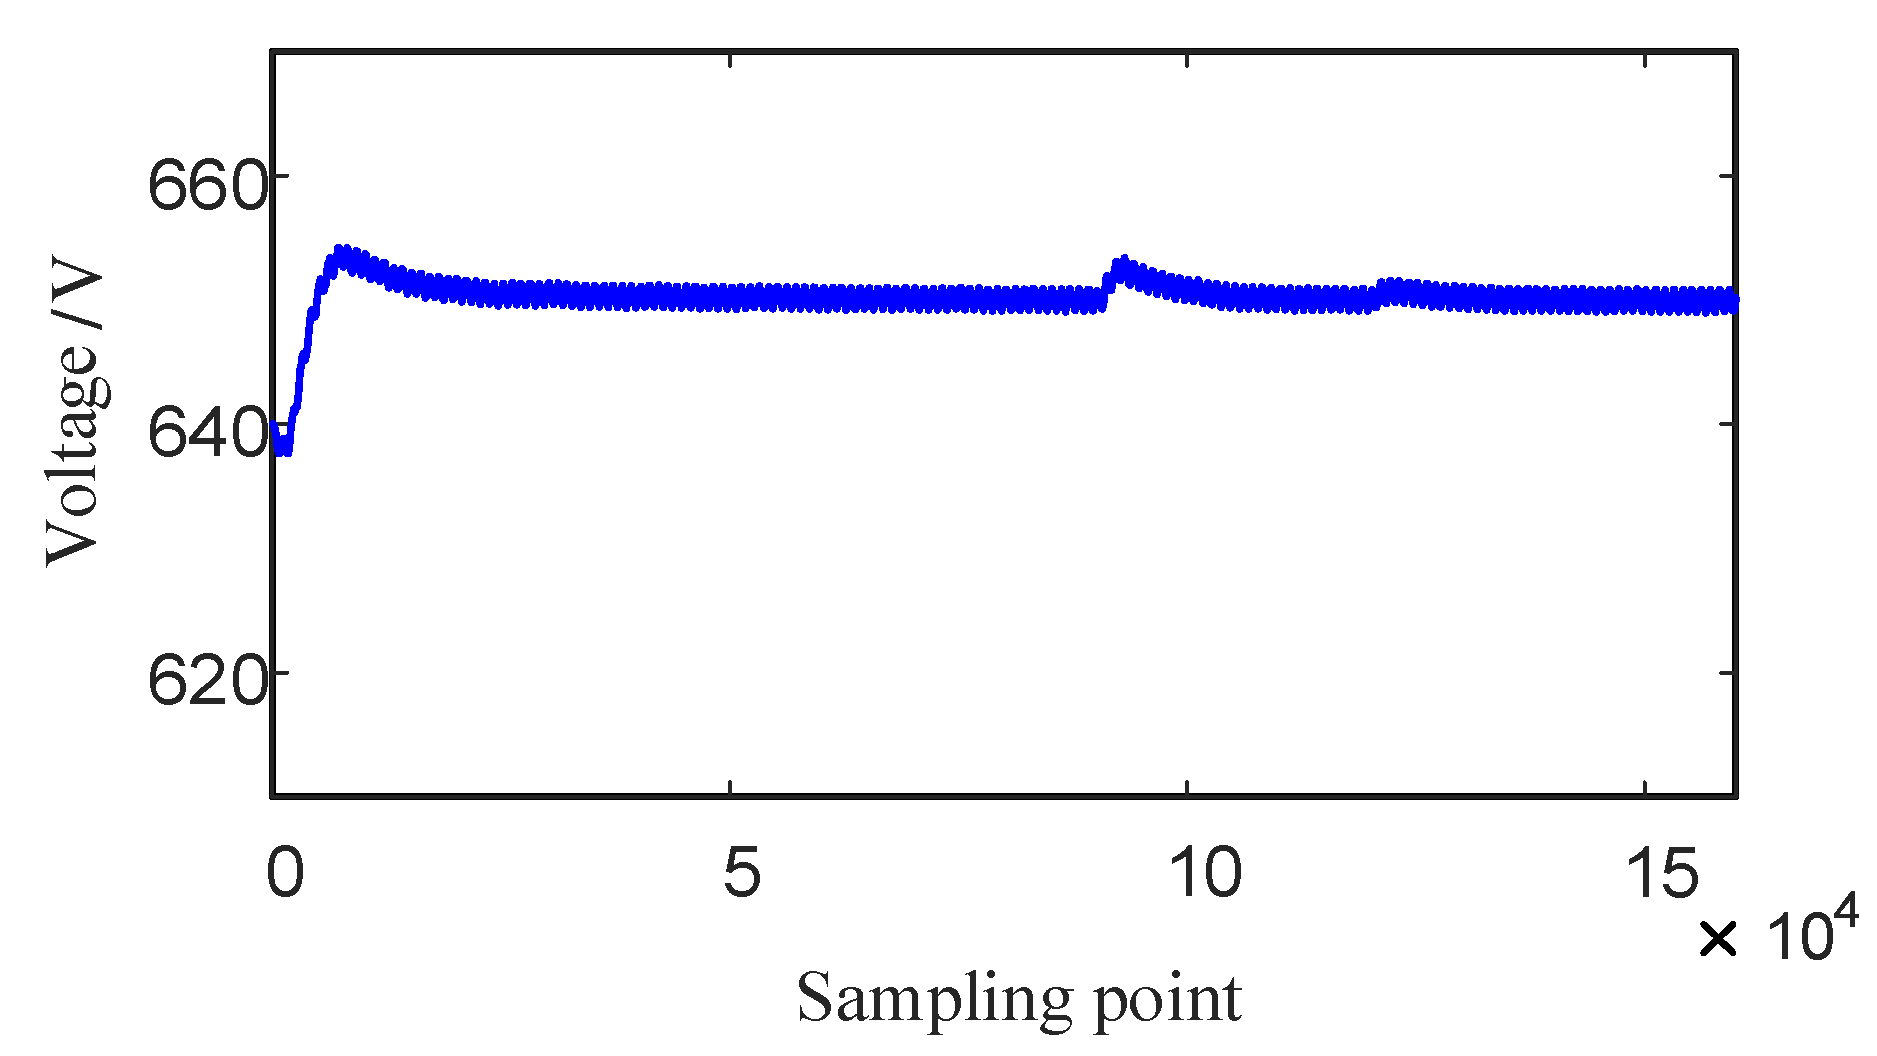
One of the simulated situations where there is a temporary rise in DC voltage is shown in Figure 9. Initially, the ambient light intensity on the photovoltaic array is 600 W/m2, and the power consumed by the system load is 10 kW. When the system is started, the output power of the photovoltaic array is 4.5 kW, but it is insufficient to meet the load demand. At this time, the battery and the supercapacitor are in discharge mode to compensate for the shortage. This helps to dynamically balance the system power and maintain a stable bus voltage value of 650 V. At 0.9 s, the light intensity sharply increases to 1500 W/m2. Consequently, the photovoltaic output power also increases, and the DC bus voltage rises by approximately 5 V. After approximately 0.2 s, the DC bus voltage returns to a stable value. At 1.2 s, the light intensity suddenly increases to 1200 W/m2. The increase in photovoltaic power results in fluctuations in system power, which causes the DC bus voltage to rise by approximately 3 V. The voltage then returns to a stable value after approximately 0.1 s.
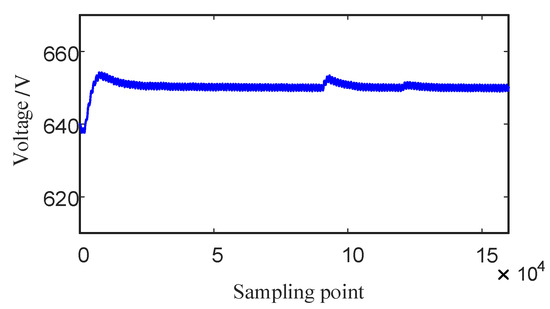
Figure 9.
DC bus voltage temporary rise.
5.2. Experimental Analysis
Based on the system’s normal operating voltage, each disturbance signal is processed without any dimension. Feature F1–F5 were extracted from each waveform, and the average characteristic values of various disturbance waveforms were obtained, as shown in Table 5. Disturbance labels were then added to create a 1000 × 6 matrix, where each row corresponds to a disturbance sample. The first five columns represent eigenvalues, and the sixth column represents the classification label.

Table 5.
Average characteristic values of various waveforms.
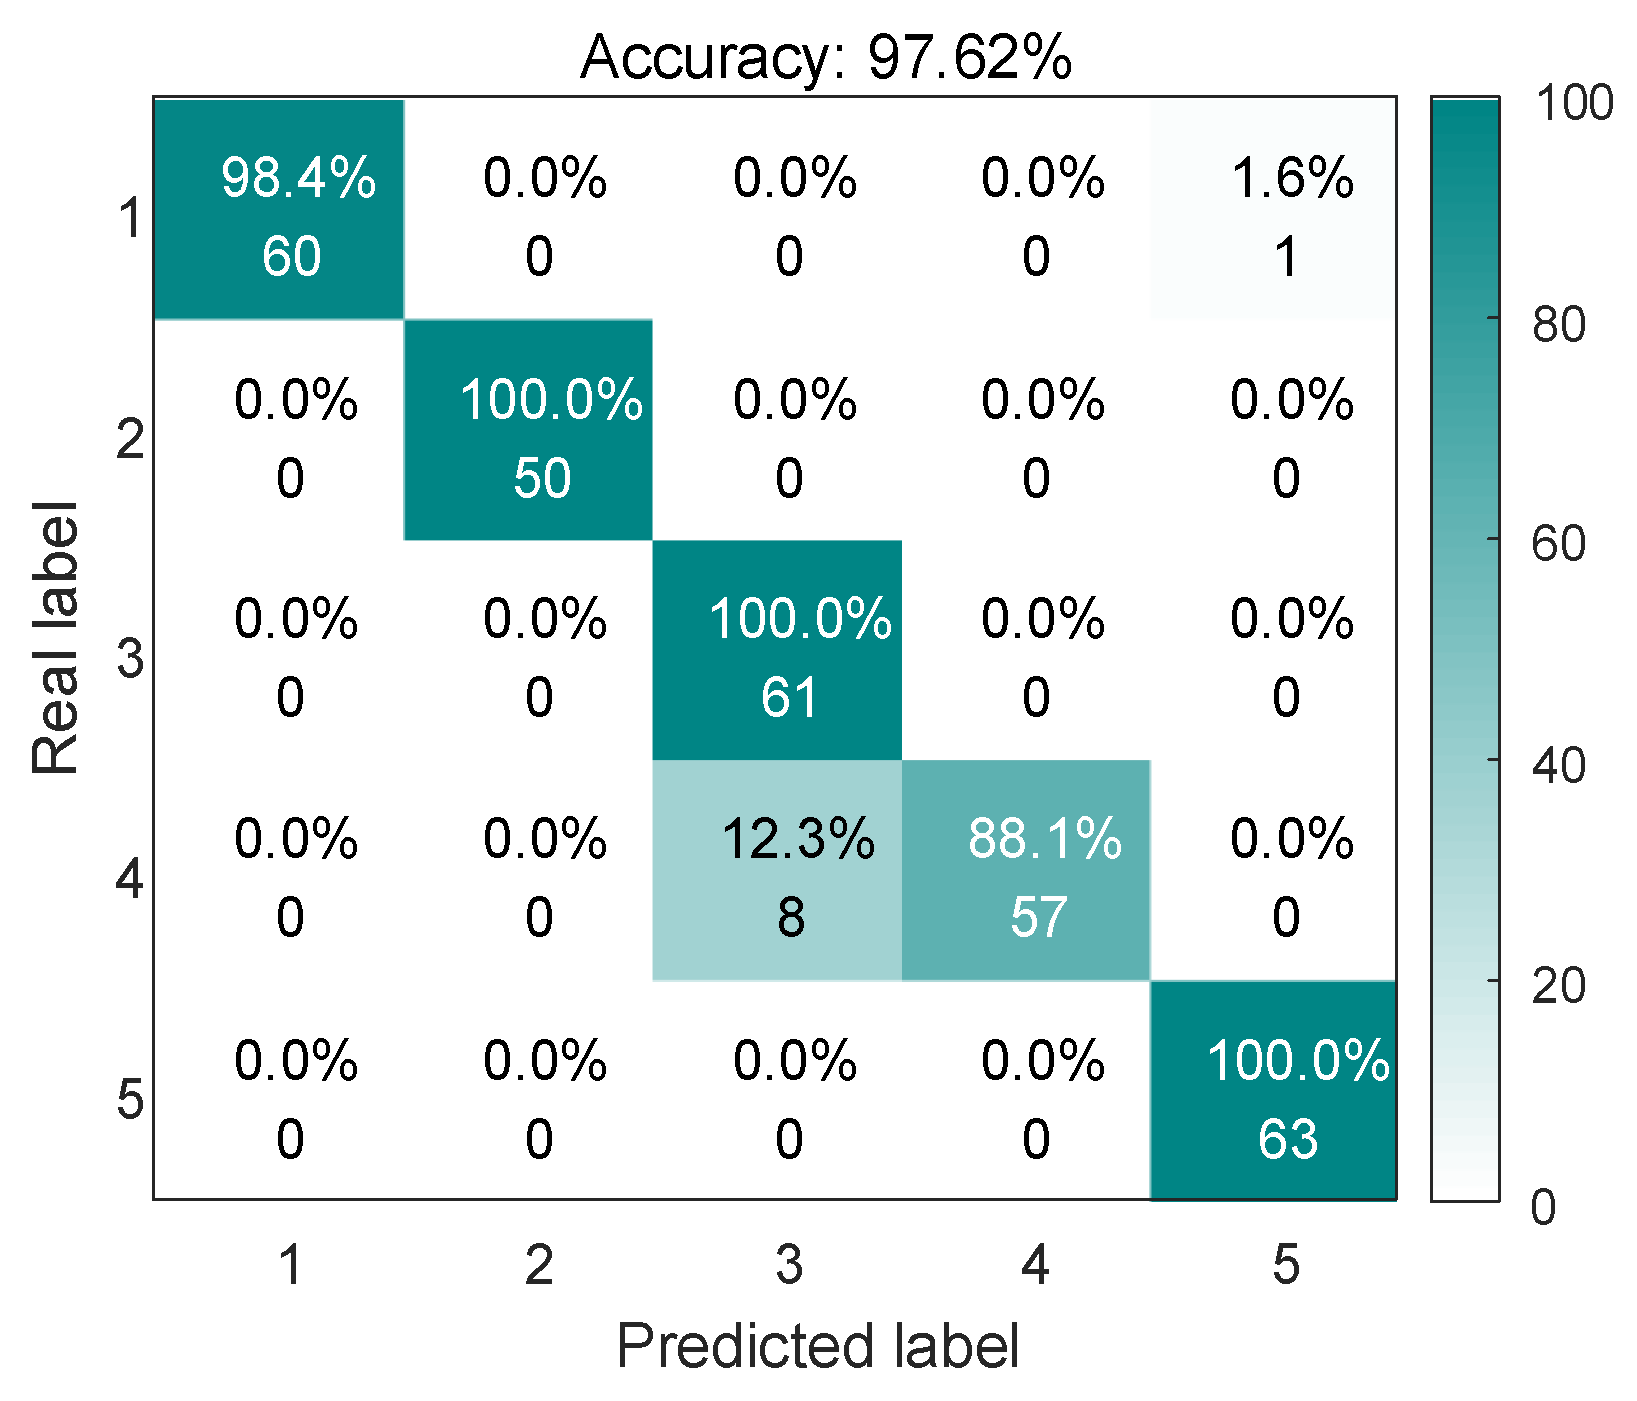
After obtaining the perturbed waveform data, the initial 140 sets of data for each sample type are extracted to form the training dataset, while the remaining 60 sets are reserved for the testing dataset. Subsequently, the training results of the model are assessed through testing. The neural network undergoes training with a maximum of 1000 iterations, using a learning rate of 0.01. The training objective is defined with a minimum error threshold set at 0.000001. The population size of SABO is configured as 30, and the number of evolution generations is set to 30. Following the model training process, the classification results for the disturbances in DC power quality signals are presented in Figure 10, while the corresponding fitness curve is illustrated in Figure 11. The model demonstrates excellent classification performance, achieving a training set accuracy of 97.131% and a testing set accuracy of 97.623%. This indicates that the model has achieved excellent classification results and is performing well on both the training data and unseen test data. The accuracy of voltage interruption recognition can reach 100%. However, the accuracy rate for recognizing ripple and wave disturbances is slightly lower. This can be observed from Table 1. The reason behind this is that F1, F4, and F5 of these three disturbances are quite similar, and there is not a significant difference in their feature quantities.
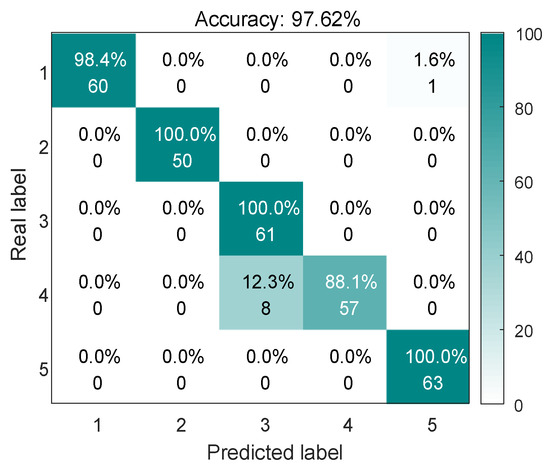
Figure 10.
Classification prediction results of SABO-BP model.
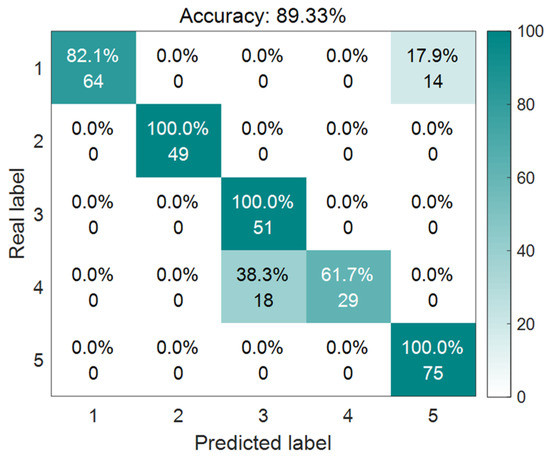
Figure 11.
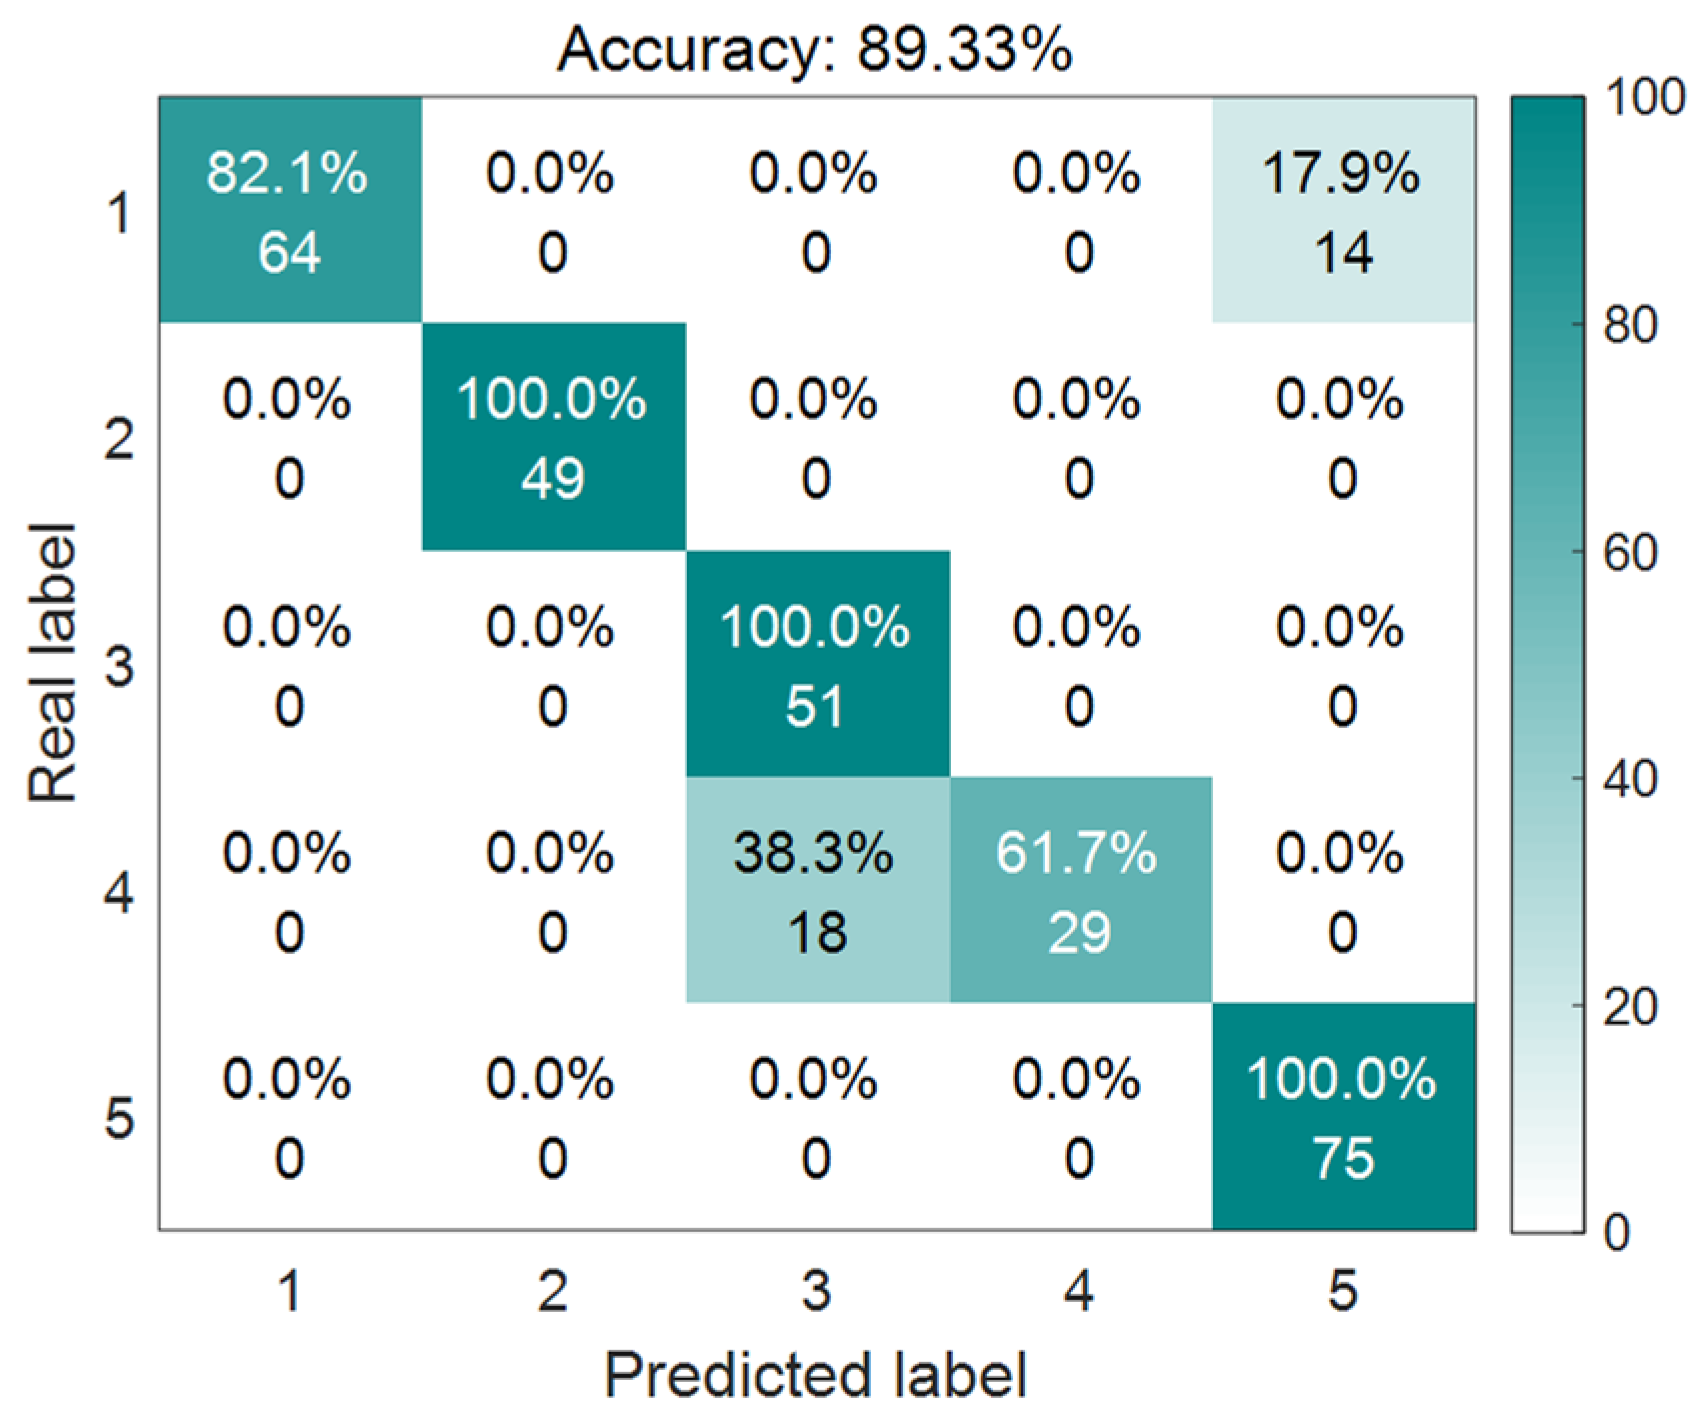
Classification prediction results of BP model.
The classification results of the traditional BP neural network are displayed in Figure 11. Upon comparison, it is evident that the recognition accuracy rate of the SABO-BP method proposed in this paper has improved by 8.207% compared to the BP neural network approach. This indicates that the SABO-BP method achieves a superior classification effect.
To enhance the credibility and applicability of the proposed model, we utilized diverse approaches to develop classification prediction models. These methodologies encompassed SVM, BP neural network, PSO, WOA-optimized BP neural network, and the classification model introduced in this research. Each method was employed to forecast the data for the identical day, yielding a cumulative of five distinct approaches.
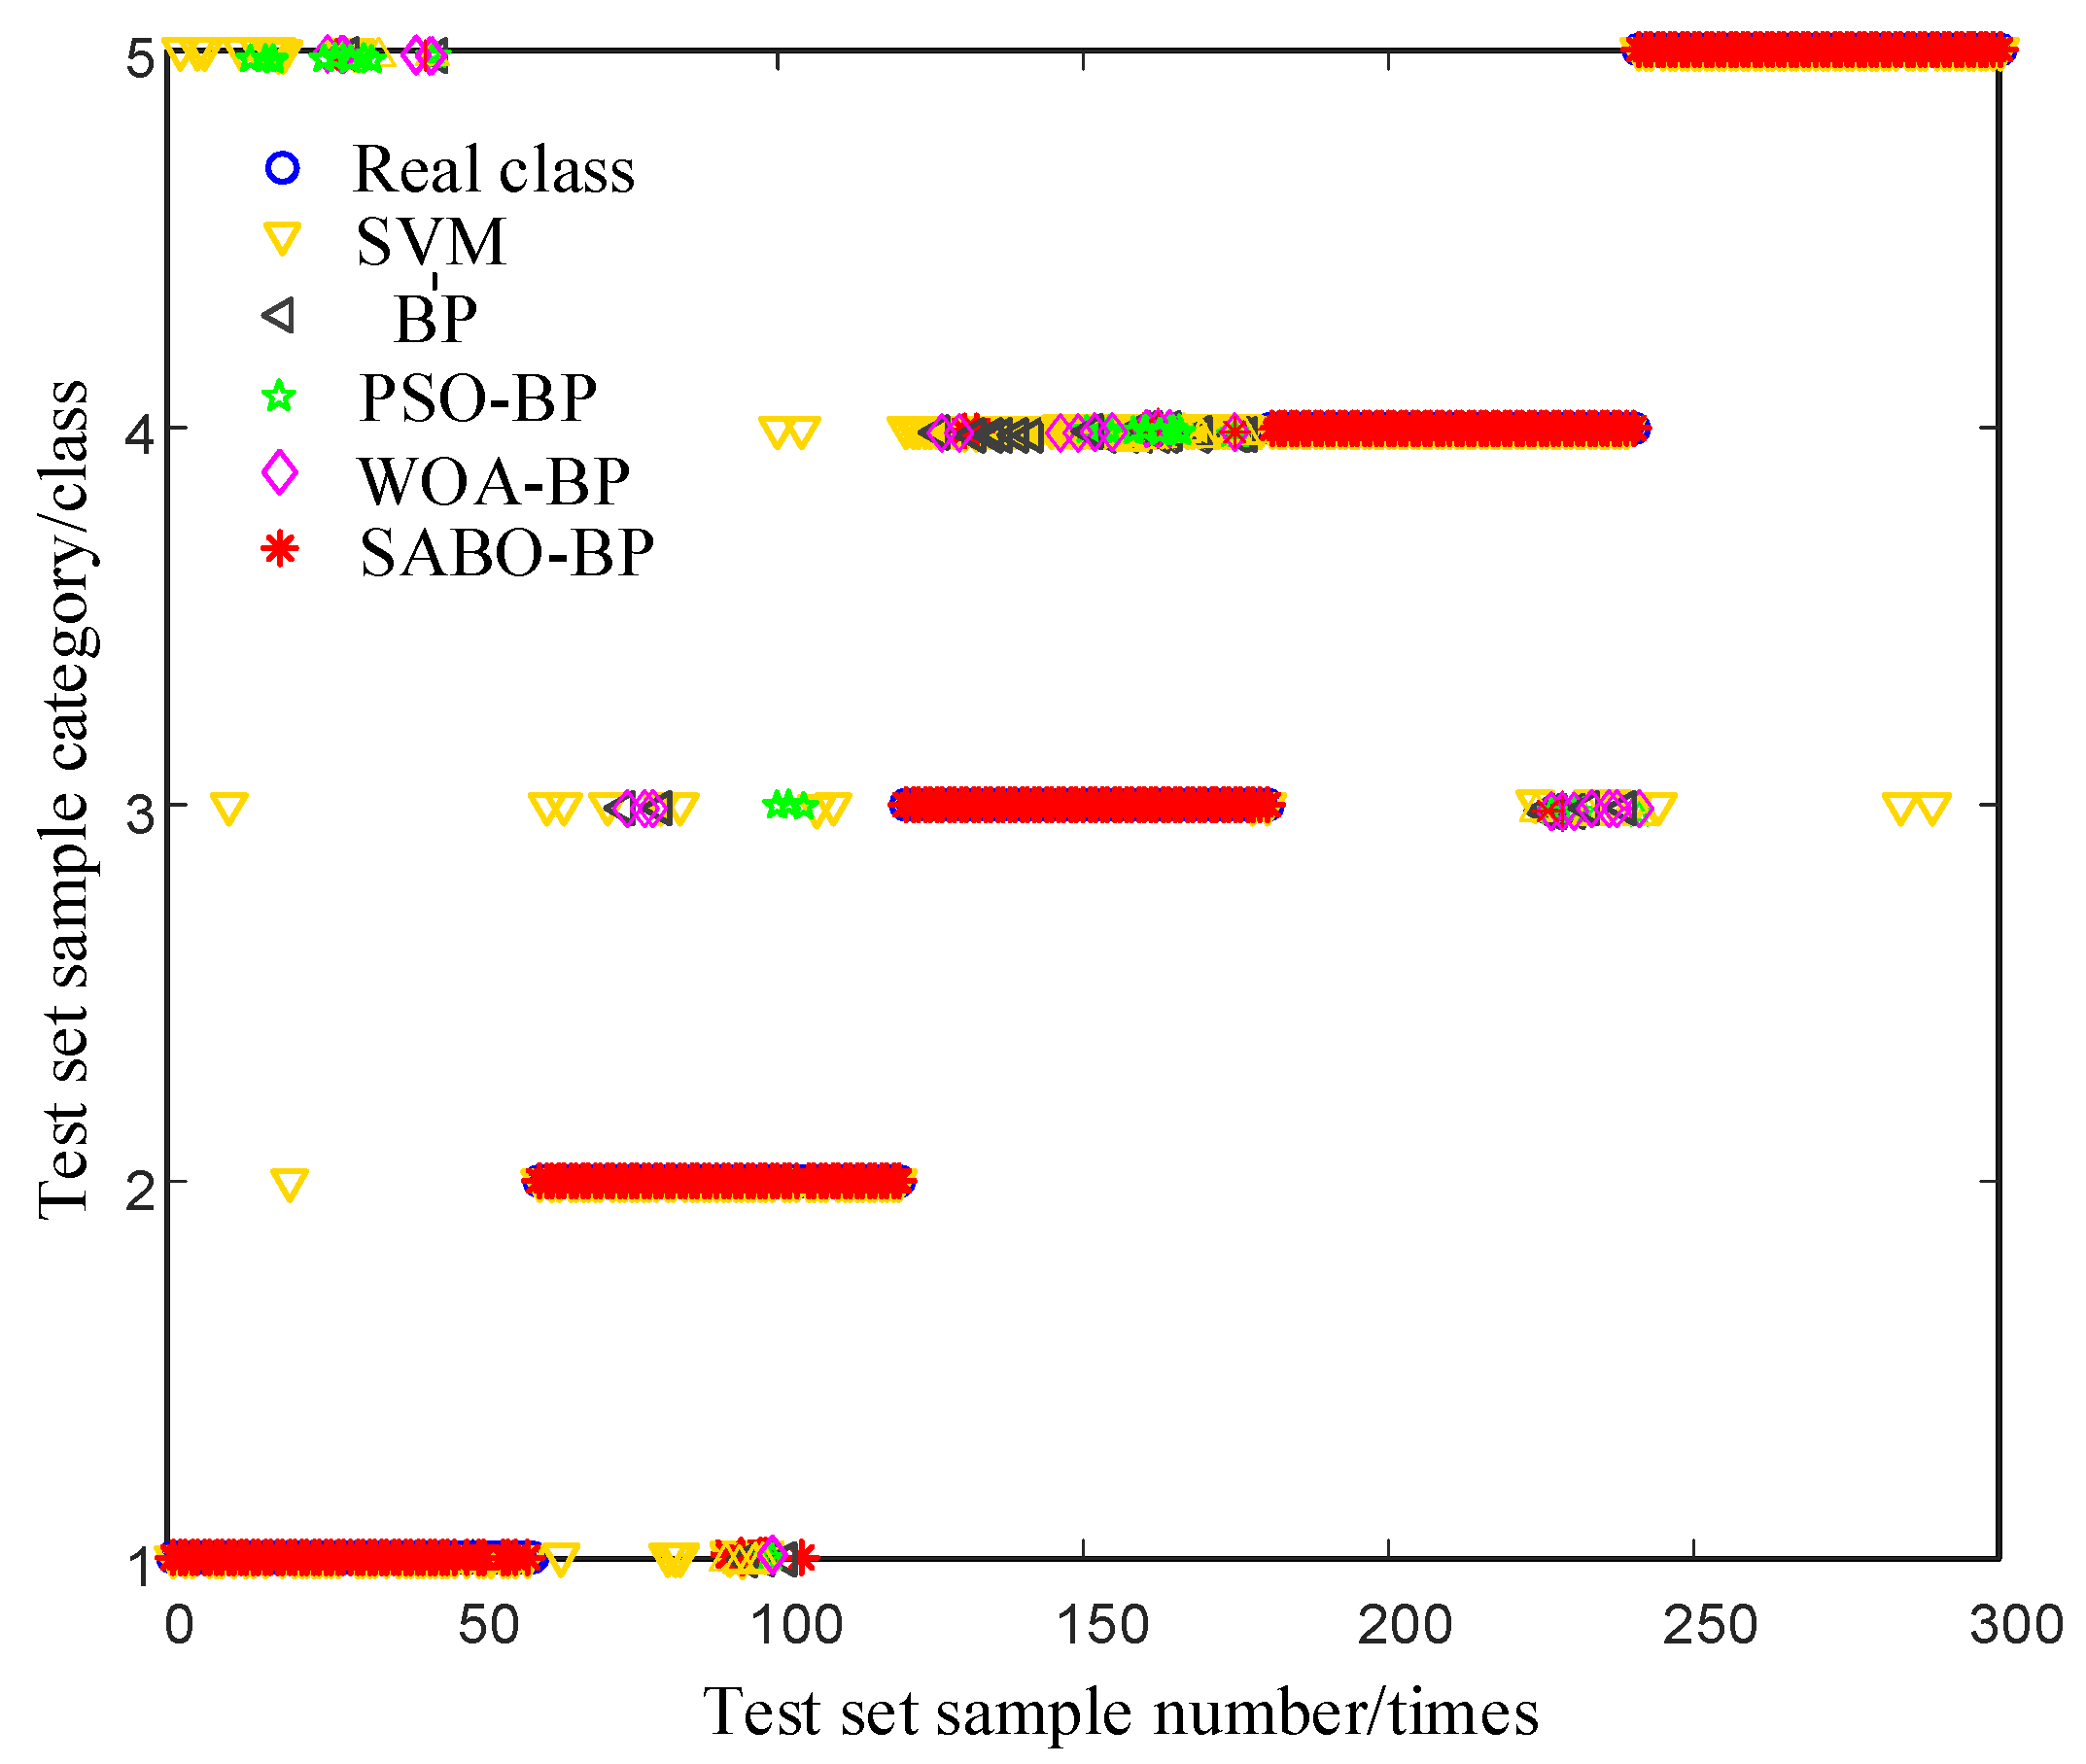
Each scheme was executed ten times, and the average accuracy was calculated. The classification results are displayed in Table 4, while Figure 12 illustrates the comparison of prediction outcomes for one of these predictions.
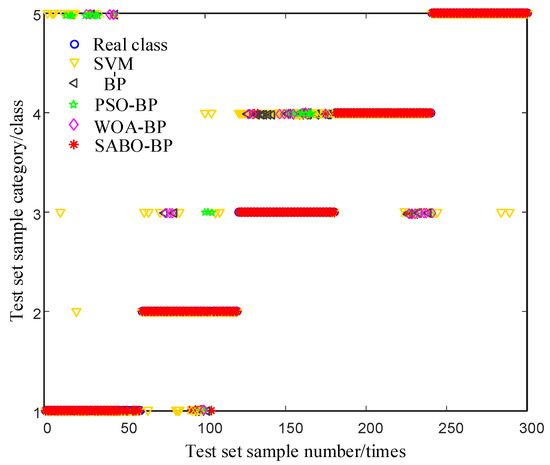
Figure 12.
Comparison of classification effects of several algorithms.
As depicted in Figure 12, the SABO-BP model demonstrates the highest classification accuracy, effectively predicting the true category of disturbed signals. However, errors in the identification of individual signals only occur when the wave and ripple signals are being assessed. The SVM model and BP model exhibit the poorest classification performance, particularly when predicting temporary rise and ripple signals. These models demonstrate numerous errors in signal recognition that fall outside the actual category.
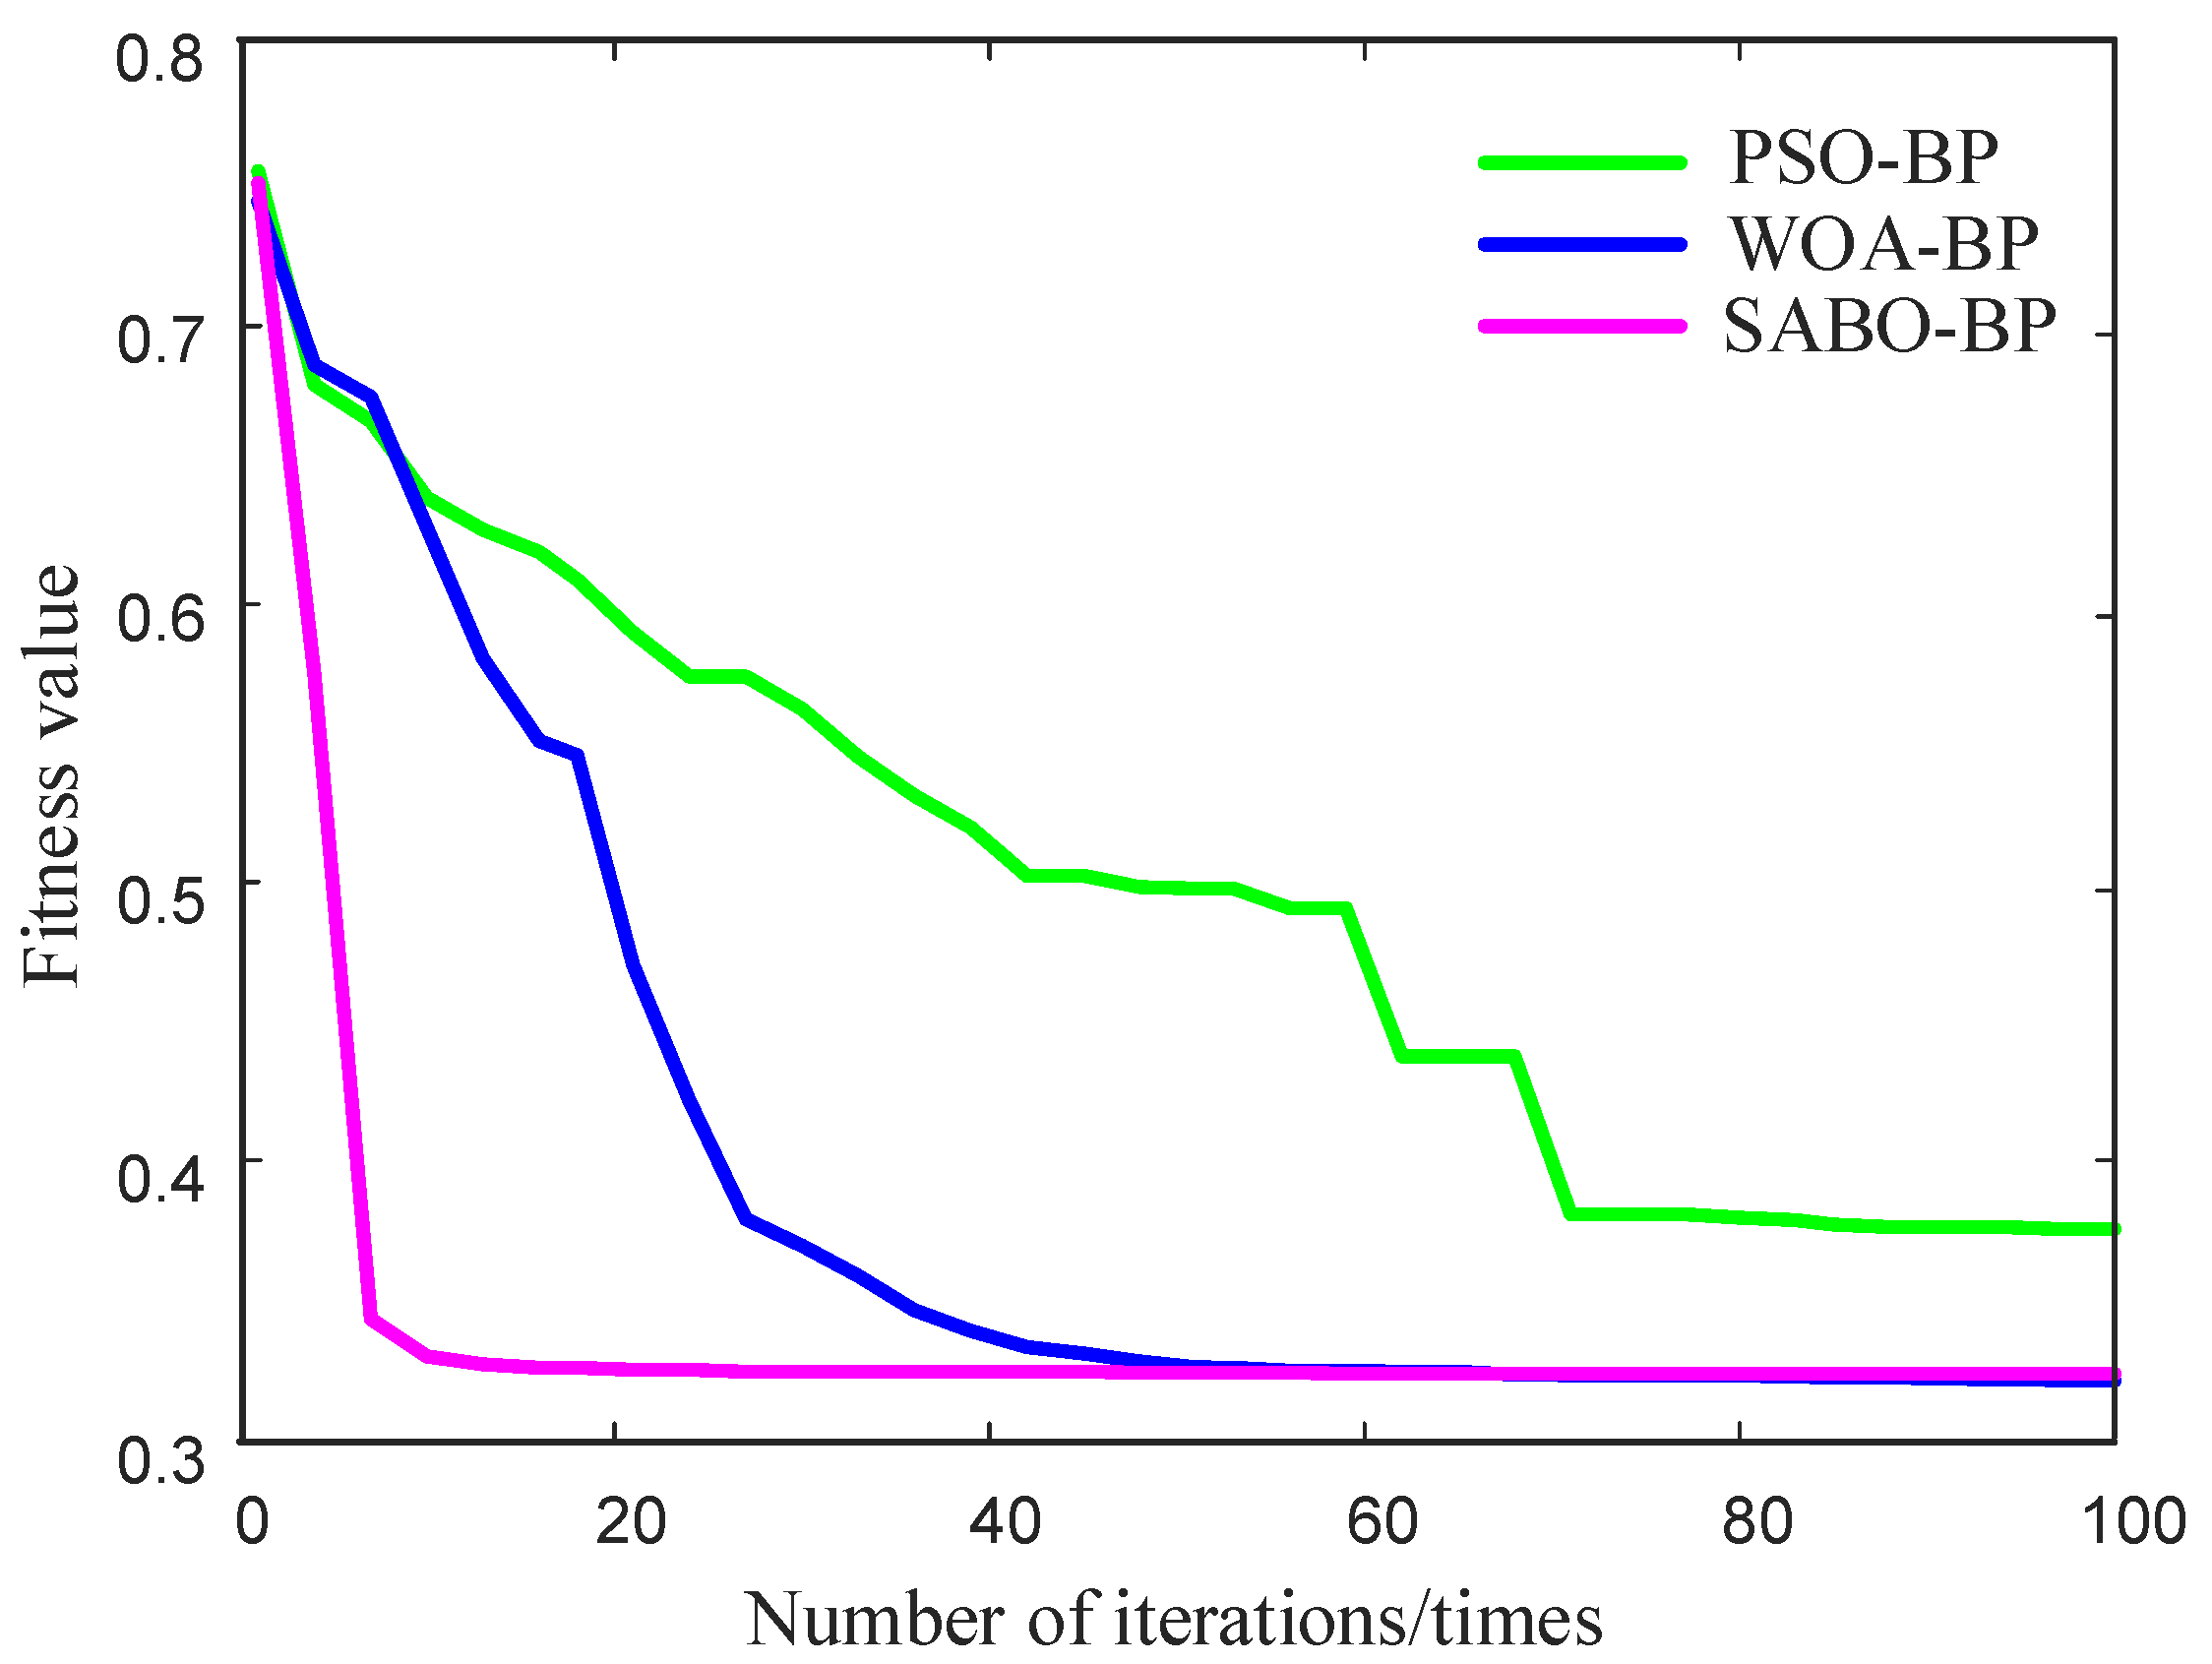
Meanwhile, the fitness curves of different algorithms are examined and contrasted, as depicted in Figure 13. The SABO algorithm has the capability to identify the global optimal threshold of the BP neural network within approximately 10 iterations. The WOA effect is ranked second, requiring around 50 iterations to achieve the global optimal threshold. On the other hand, the PSO algorithm exhibits the least favorable effect, as it is prone to becoming trapped in local optimal situations.
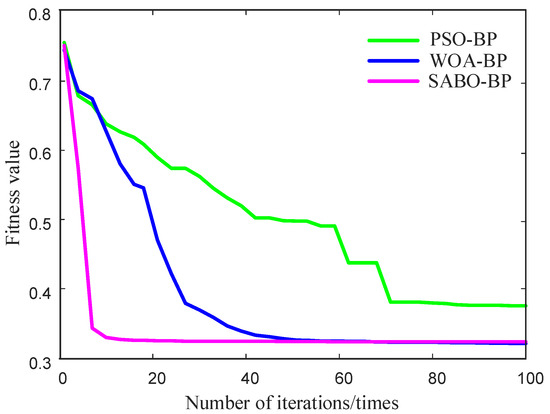
Figure 13.
Fitness curves of each algorithm.
By analyzing the data in Table 6, ELM has the worst sorting effect. It is evident that SVM, despite having the shortest running time, exhibits the poorest classification and prediction performance for disturbances. This is particularly notable in the classification of temporary rise, fluctuation, and ripple. The BP model demonstrates a shorter classification time and superior prediction performance compared to SVM. This makes it more suitable for the classification of power quality disturbance signals. The BP classification model, optimized by intelligent optimization algorithms, achieves higher prediction accuracy. However, it is important to note that this improvement in accuracy comes at the cost of longer running times.

Table 6.
Comparison of classification effect.
Compared to the BP model, the PSO-BP model does not show any significant improvement in prediction performance. On the contrary, the WOA-BP model demonstrates superior prediction accuracy, albeit at the expense of longer computational durations. The SABO-BP model, proposed in this study, demonstrates superior prediction accuracy compared to all other models. The model demonstrates a significant improvement, with increases of 20.731, 8.207, 7.621, and 3.721 percentage points when compared to other models, respectively. Additionally, the duration of the operation is correspondingly reduced. This finding suggests that the SABO-BP model demonstrates superior overall performance, thereby providing further validation of the feasibility and accuracy of the proposed model.
6. Conclusions
Based on an analysis of the formation mechanism and waveform characteristics of power quality issues in DC distribution networks, this study proposes an identification method that is specifically designed for detecting and classifying DC power quality disturbances. First, the S transform is employed to analyze the time–frequency properties of the signal, thereby emphasizing its time–frequency characteristics. Five characteristic indexes have been developed as the foundation for differentiating signals. Second, the weights and thresholds of the BP neural network are optimized using the SABO optimization algorithm. The SABO-BP neural network classification model is then established to effectively classify five different types of disturbance signals.
The proposed method demonstrates a significant improvement in classification accuracy compared to the traditional method. Additionally, it exhibits a better classification effect, making it easier to obtain high-quality power signals in practical applications. However, there is still ample opportunity for optimization in this method, as its running time escalates with the intricacy of the model during the process of classification prediction. The primary focus of the upcoming work will be to reduce the running time of the model while simultaneously enhancing its accuracy.
Author Contributions
Conceptualization, X.D. and P.H.; Methodology, X.D. and P.H.; Original Draft X.D.; Validation, W.C.; Review and Editing, W.C.; Project administration, P.H. and S.X.; Funding acquisition, P.H. and S.X.; Software, Q.L.; Formal analysis, Q.L. and S.X.; Data Curation, A.G., S.Z. and Y.D.; Supervision, S.Z.; Resources, A.G. and Y.D. All authors have read and agreed to the published version of the manuscript.
Funding
Science and Technology Supported by the State Grid (5700-202314248A-1-1-ZN).
Institutional Review Board Statement
Not applicable.
Informed Consent Statement
Not applicable.
Data Availability Statement
Data are contained within the article.
Conflicts of Interest
Authors Wei Cen and Peidong He were employed by the State Grid Sichuan Electric Power Limited Company Service Center. Authors Sixiang Zhao and Ailing Geng were employed by the State Grid Jibei Electric Power Company Limited. The remaining authors declare that the research was conducted in the absence of any commercial or financial relationships that could be construed as a potential conflict of interest.
References
- Justo, J.; Mwasilu, F.; Lee, J.; Jung, J. AC-Microgrids versus DC-Microgrids with Distributed Energy Resources: A Review. Renew. Sustain. Energy Rev. 2013, 24, 387–405. [Google Scholar] [CrossRef]
- Elsayed, A.; Mohamed, A.; Mohammed, O. DC Microgrids and Distribution Systems: An Overview. Electr. Power Syst. Res. 2015, 119, 407–417. [Google Scholar] [CrossRef]
- Planas, E.; Andreu, J.; Garate, J.; de Alegria, I.; Ibarra, E. AC and DC Technology in Microgrids: A Review. Renew. Sustain. Energy Rev. 2015, 43, 726–749. [Google Scholar] [CrossRef]
- Alsaedi, A.; Alharbi, F.; Alahdal, A.; Alahmadi, A.; Ammous, A.; Ammous, K. Low Voltage Direct Current Supplies Concept for Residential Applications. Energy Explor. Exploit. 2022, 40, 1078–1097. [Google Scholar] [CrossRef]
- Al-Ismail, F. DC Microgrid Planning, Operation, and Control: A Comprehensive Review. IEEE Access 2021, 9, 36154–36172. [Google Scholar] [CrossRef]
- Barros, J.; de Apráiz, M.; Diego, R. Power Quality in DC Distribution Networks. Energies 2019, 12, 848. [Google Scholar] [CrossRef]
- Guerrero, J.M.; Davoudi, A.; Aminifar, F.; Jatskevich, J.; Kakigano, H. Guest Editorial: Special Section on Smart DC Distribution Systems. IEEE Trans. Smart Grid 2014, 5, 2473–2475. [Google Scholar] [CrossRef]
- Tao, H.; Wang, P.; Chen, Y.; Stojanovic, V.; Yang, H. An Unsupervised Fault Diagnosis Method for Rolling Bearing Using STFT and Generative Neural Networks. J. Frankl. Inst. 2020, 357, 7286–7307. [Google Scholar] [CrossRef]
- Yan, R.; Gao, R.; Chen, X. Wavelets for Fault Diagnosis of Rotary Machines: A Review with Applications. Signal Process. 2014, 96, 1–15. [Google Scholar] [CrossRef]
- Shang, Y.; Miao, L.; Shan, Y.; Gnyawali, K.; Zhang, J.; Kattel, G. A Hybrid Ultra-Short-Term and Short-Term Wind Speed Forecasting Method Based on CEEMDAN and GA-BPNN. Weather Forecast. 2022, 37, 415–428. [Google Scholar] [CrossRef]
- Luo, D.; Wu, T.; Li, M.; Yi, B.; Zuo, H. Application of VMD and Hilbert Transform Algorithms on Detection of the Ripple Components of the DC Signal. Energies 2020, 13, 935. [Google Scholar] [CrossRef]
- Gou, J.; Ma, H.; Ou, W.; Zeng, S.; Rao, Y.; Yang, H. A Generalized Mean Distance-Based k-Nearest Neighbor Classifier. Expert Syst. Appl. 2019, 115, 356–372. [Google Scholar] [CrossRef]
- Tan, Z.; De, G.; Li, M.; Lin, H.; Yang, S.; Huang, L.; Tan, Q. Combined Electricity-Heat-Cooling-Gas Load Forecasting Model for Integrated Energy System Based on Multi-Task Learning and Least Square Support Vector Machine. J. Clean. Prod. 2020, 248, 119252. [Google Scholar] [CrossRef]
- Mishra, D.; Samantaray, S.; Joos, G. A Combined Wavelet and Data-Mining Based Intelligent Protection Scheme for Microgrid. IEEE Trans. Smart Grid 2016, 7, 2295–2304. [Google Scholar] [CrossRef]
- Wang, L.; Zeng, Y.; Chen, T. Back Propagation Neural Network with Adaptive Differential Evolution Algorithm for Time Series Forecasting. Expert Syst. Appl. 2015, 42, 855–863. [Google Scholar] [CrossRef]
- Mahbooba, B.; Timilsina, M.; Sahal, R.; Serrano, M. Explainable Artificial Intelligence (XAI) to Enhance Trust Management in Intrusion Detection Systems Using Decision Tree Model. Complexity 2021, 2021, 6634811. [Google Scholar] [CrossRef]
- Patil, M.; Tagade, P.; Hariharan, K.; Kolake, S.; Song, T.; Yeo, T.; Doo, S. A Novel Multistage Support Vector Machine Based Approach for Li Ion Battery Remaining Useful Life Estimation. Appl. Energy 2015, 159, 285–297. [Google Scholar] [CrossRef]
- Zayed, M.E.; Aboelmaaref, M.M.; Chazy, M. Design of Solar Air Conditioning System Integrated with Photovoltaic Panels and Thermoelectric Coolers: Experimental Analysis and Machine Learning Modeling by Random Vector Functional Link Coupled with White Whale Optimization. Therm. Sci. Eng. Prog. 2023, 44, 102051. [Google Scholar] [CrossRef]
- Almodfer, R.; Zayed, M.E.; Elaziz, M.A.; Aboelmaaref, M.M.; Mudhsh, M.; Elsheikh, A.H. Modeling of a Solar-Powered Thermoelectric Air-Conditioning System Using a Random Vector Functional Link Network Integrated with Jellyfish Search Algorithm. Case Stud. Therm. Eng. 2022, 31, 101797. [Google Scholar] [CrossRef]
- Bashir, T.; Chen, H.; Tahir, M.; Zhu, L. Short Term Electricity Load Forecasting Using Hybrid Prophet-LSTM Model Optimized by BPNN. Energy Rep. 2022, 8, 1678–1686. [Google Scholar] [CrossRef]
- Tang, X.; Shi, L.; Wang, B.; Cheng, A. Weight Adaptive Path Tracking Control for Autonomous Vehicles Based on PSO-BP Neural Network. Sensors 2023, 23, 412. [Google Scholar] [CrossRef] [PubMed]
- Chen, L.; Wu, T.; Wang, Z.; Lin, X.; Cai, Y. A Novel Hybrid BPNN Model Based on Adaptive Evolutionary Artificial Bee Colony Algorithm for Water Quality Index Prediction. Ecol. Indic. 2023, 146, 109882. [Google Scholar] [CrossRef]
- Wang, Z.; Wu, B.; Xu, D.; Cheng, M.; Xu, L. DC-Link Current Ripple Mitigation for Current-Source Grid-Connected Converters Under Unbalanced Grid Conditions. IEEE Trans. Ind. Electron. 2016, 63, 4967–4977. [Google Scholar] [CrossRef]
- Kapoor, R.; Gupta, R.; Son, L.H.; Jha, S.; Kumar, R. Detection of Power Quality Event Using Histogram of Oriented Gradients and Support Vector Machine. Measurements 2018, 120, 52–75. [Google Scholar] [CrossRef]
- Sacli, M.; Ayan, O.; Silsüpür, M.; Türkay, B. Investigation of Power Quality Analysis of Three-Phase Inverter Topologies for Renewable Energy Systems. In Proceedings of the 2017 10th International Conference on Electrical and Electronics Engineering (ELECO), Bursa, Turkey, 30 November–2 December 2017; pp. 1445–1449. [Google Scholar]
- Kumar, D.; Zare, F.; Ghosh, A. DC Microgrid Technology: System Architectures, AC Grid Interfaces, Grounding Schemes, Power Quality, Communication Networks, Applications, and Standardizations Aspects. IEEE Access 2017, 5, 12230–12256. [Google Scholar] [CrossRef]
- Serdyukov, A.S.; Azarov, A.V.; Yablokov, A.V.; Shilova, T.V.; Baranov, V.D. Research Note: Reconstruction of Seismic Signals Using S-Transform Ridges. Geophys. Prospect. 2021, 69, 891–900. [Google Scholar] [CrossRef]
- Lou, Z.; Li, P.; Ma, K.; Teng, F. Harmonics and Interharmonics Detection Based on Synchrosqueezing Adaptive S-Transform. Energies 2022, 15, 4539. [Google Scholar] [CrossRef]
- Oliveira, R.A.D.; Bollen, M.H.J. Deep Learning for Power Quality. Electr. Power Syst. Res. 2023, 214, 108887. [Google Scholar] [CrossRef]
- Rumelhart, D.E.; Hinton, G.E.; Williams, R.J. Learning Representations by Back Propagating Errors. Nature 1986, 323, 533–536. [Google Scholar] [CrossRef]
- Zhu, C.; Zhang, J.; Liu, Y.; Ma, D.; Li, M.; Xiang, B. Comparison of GA-BP and PSO-BP Neural Network Models with Initial BP Model for Rainfall-Induced Landslides Risk Assessment in Regional Scale: A Case Study in Sichuan, China. Nat. Hazards J. Int. Soc. Prev. Mitig. Nat. Hazards 2020, 100, 173–204. [Google Scholar] [CrossRef]
- Li, Z.-J.; Chen, W.-G.; Shan, J.; Yang, Z.-Y.; Cao, L.-Y. Enhanced Distributed Parallel Firefly Algorithm Based on the Taguchi Method for Transformer Fault Diagnosis. Energies 2022, 15, 3017. [Google Scholar] [CrossRef]
- Irfan, M.M.; Malaji, S.; Patsa, C.; Rangarajan, S.S.; Hussain, S.M.S. Control of DSTATCOM Using ANN-BP Algorithm for the Grid Connected Wind Energy System. Energies 2022, 15, 6988. [Google Scholar] [CrossRef]
- Trojovský, P.; Dehghani, M. Subtraction-Average-Based Optimizer: A New Swarm-Inspired Metaheuristic Algorithm for Solving Optimization Problems. Biomimetics 2023, 8, 149. [Google Scholar] [CrossRef] [PubMed]
Disclaimer/Publisher’s Note: The statements, opinions and data contained in all publications are solely those of the individual author(s) and contributor(s) and not of MDPI and/or the editor(s). MDPI and/or the editor(s) disclaim responsibility for any injury to people or property resulting from any ideas, methods, instructions or products referred to in the content. |
© 2024 by the authors. Licensee MDPI, Basel, Switzerland. This article is an open access article distributed under the terms and conditions of the Creative Commons Attribution (CC BY) license (https://creativecommons.org/licenses/by/4.0/).

