Abstract
Nowadays, electricity consumption is closely linked to the economic growth of cities, states, and countries, providing a better quality of life and security. Overhead power distribution networks at medium- and low-voltage levels are responsible for serving and supplying electricity to the largest consumer class, as they represent most consumer installations. Due to this reason, there is a vast expanse of exposed networks vulnerable to the effects of atmospheric discharges. Therefore, the objective of this article is to implement and evaluate the models available in the literature to represent distribution networks during transient events caused by lightning, using simulation in ATPDraw. These structures pose a significant complexity in their representation, and there are studies that assess more accurate methods for simulating transients in transmission lines, which have different structural and configuration characteristics. Ultimately, the results demonstrate that the choice of which model to implement in a simulation heavily depends on the analysis to be conducted by the researcher, and it can be observed that more accurate methods do not always yield substantial differences in the obtained outcomes.
1. Introduction
Over the years, various studies have been conducted to investigate the best methods and models for representing the structures and equipment of electrical distribution or transmission systems. This article addresses the methods and models used in the representation of medium- and low-voltage networks during transient events caused by lightning. Understanding the behavior of these systems during transient events is essential to support effective decisions regarding maintenance, expansion, and system protection [1,2].
The influence of lightning on electrical systems is highly damaging and has been the subject of study in various fields. However, it can be observed that studies related to these issues have predominantly focused on high-voltage and power lines. These, in turn, differ substantially from medium and low-voltage networks, both in dimensions and vulnerability to problems associated with lightning.
Therefore, this article aims to assess the impact of component representation models in medium- and low-voltage networks on the maximum levels of overvoltage affecting equipment and structures. The central focus is on the analysis of models applicable to medium- and low-voltage networks, operating at 13.8 kV and 380/220 V, respectively. It is noteworthy that these networks have been configured with typical characteristics of structures installed in the southern region of Brazil, widely used in the area. This article will focus on evaluating representation models for the following components: transformers, lightning arresters, conductor cables, concrete poles, insulators, consumers, and grounding systems.
Distribution transformers can be described by models based on equivalent circuits, implemented in network simulations, as demonstrated in [3,4]. The development of these circuits may involve capacitive elements between windings to represent the peak transfer of lightning. Additionally, these models can be represented by parasitic capacitances or nonlinear resistances [5,6]. Although previous studies, such as [3,5,6], have addressed transformer models in broader network analyses, the specific influence of these models has not been explored. This article aims to implement transformer models through different representation circuits to investigate their contribution to overvoltage levels.
To protect the transformer against high levels of overvoltage, surge arresters are installed and represented in simulations by voltage–current curves, such as current-dependent exponential resistors (Type 92) or nonlinear resistors (MOV) [3,5]. In the studies mentioned, representation models were defined, such as Type 92 and MOV, with different focuses, such as energy absorption [3] or network security enhancement [5]. This article will assess the impacts of implementing these different surge arrester models on the overvoltage levels achieved in simulations.
Concrete or wooden poles are represented based on their geometric characteristics using specific methods, as described in [3,6]. Studies such as [7,8] evaluate the behavior of poles and their entire structure during transient events but do not explore their contribution in events where they are integrated into a medium- and low-voltage network. In this article, the concrete pole will be represented in the simulation as an impedance, using values calculated analytically and through numerical simulations to assess whether the implementation will result in significant differences in the obtained overvoltage values.
Isolators can be represented using voltage-controlled switches or as capacitors connected between conductors and the tower, the latter being applicable to high-voltage lines [9]. In studies [4,10], the contribution of isolators in medium- and low-voltage networks was integrated into MODELS using the DE method, focusing on evaluating effective actions in the installation of protective equipment and the impact of variations in soil resistivity on overvoltage. This article adopts the representation of isolators by voltage-controlled switches, exploring different methods to calculate the maximum levels of withstandable voltage on isolators, aiming to assess the impact of these models on overvoltage levels.
In addition to these mentioned structural elements, it is important to address the presence of consumer installations in studies on electromagnetic transients. Accurate modeling for the proper representation of these consumers is complex, but it is essential for conducting simulations with reliable results [11,12]. In contrast to studies [11,12], which treat consumers as load categories in a node and use algorithms to define the consumer load current model, this article adopts a distinct approach. Here, the representation of consumers will be carried out through electrical circuit models, which are more practical and capable of reflecting the behavior of these consumers in low-voltage networks during electromagnetic transients caused by lightning.
Given the inherent complexity, it becomes essential to properly represent each structure and equipment in medium- and low-voltage networks to ensure reliable results. In this challenging context, the analysis of electromagnetic transients resulting from lightning not only plays a fundamental role in guiding improvements but also presents a notably challenging task in implementing various models of structures. This includes evaluating their interaction and the overall system behavior for overvoltage assessment.
2. Lightning Model
Models of lightning discharges have been the subject of study in recent years. Researchers rely on parameters collected from a long-term database at measurement stations to represent lightning phenomena. These measurements assist in understanding the behavior of lightning by analyzing waveforms, temporal parameters, maximum current, subsequent strokes, polarity, and other factors [13,14].
To implement the discharge model, the model and recommendations addressed in [13] are defined. This study suggests key characteristics for implementing return stroke current models, including their maximum value, the duration to reach this peak, and the time required to subsequently decrease. Consequently, the specific parameters used to incorporate lightning phenomena into simulations, such as maximum values and time-related aspects, are indicated in Table 1.

Table 1.
Waveform of the current impulse for each peak value.
For these analyses, a lightning waveform with a peak current of 10 kA and a faster rise time was selected, as indicated in Table 1. The other two waveforms are employed to evaluate how changes in lightning waveform and amplitude affect overvoltage levels and waveforms.
Using the presented time parameters, the lightning model is implemented in the transient simulation program based on the curve suggested by Heidler, as recommended in [13,15]. The Heidler function, presented in Equation (1), allows for the independent adjustment of current amplitude, maximum current derivative, and transferred charge by varying the constants , , and . The result, shown in Figure 1, illustrates the behavior of the Heidler curve, which will be implemented in the simulation.
where is the peak current, is the correction factor for the peak current, , and are constants that define the rise and decay times of the current, and n is the current growth factor [15,16].
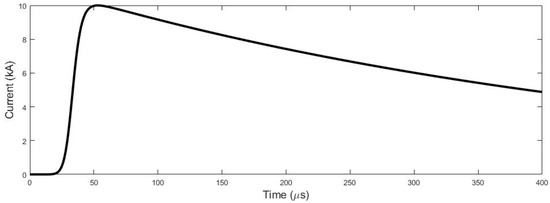
Figure 1.
Waveform of the direct lightning impulse.
3. Evaluation of Models for Representing Aerial Distribution Networks and Structures Presented in the Literature
The use of accurate models is essential for evaluating how networks respond to electromagnetic transients, mitigating lightning damage, identifying vulnerable points, and facilitating preventive decisions to minimize power supply interruptions and overvoltage-related damages. These models ensure the efficiency, reliability, and safety of the network, allowing for simulations before physical implementations, thereby saving time and resources. A study in the southern region of Brazil analyzed typical structures, utilizing field data to evaluate representation models for each component of the distribution networks [17].
3.1. Medium- and Low-Voltage Networks
Overhead distribution networks play an extremely important role in energy systems, and their significance is proportional to the complexity of modeling. There is no clear definition of an average network model suitable for representing these structures, making the analysis of distribution network representation model implementations a significant challenge. Therefore, in this article, a hypothetical configuration of a medium- and low-voltage network is developed based on typical structures in the southern region of Brazil [18].
3.2. Distribution Transformers
Distribution transformers are vital components in power systems, ensuring the safety, efficiency, and continuous supply of electricity. Positioned within distribution network structures, these devices regulate voltage from medium to low levels, serving residential and small commercial areas. Typically mounted on concrete utility poles, they can be either three-phase or single-phase based on load demand. Standardized power ratings, ranging from 5 to 150 kVA, are defined, along with specified insulation levels and withstand capabilities for different network operating levels [19].
Research on transformer behavior suggests that the most effective approach for representing these devices in electromagnetic transient simulations is by utilizing an equivalent circuit. This circuit must accurately replicate the transformer’s dynamic responses during the event. To achieve this, models designed for high frequencies are recommended to capture the equipment’s intricate behavior [20].
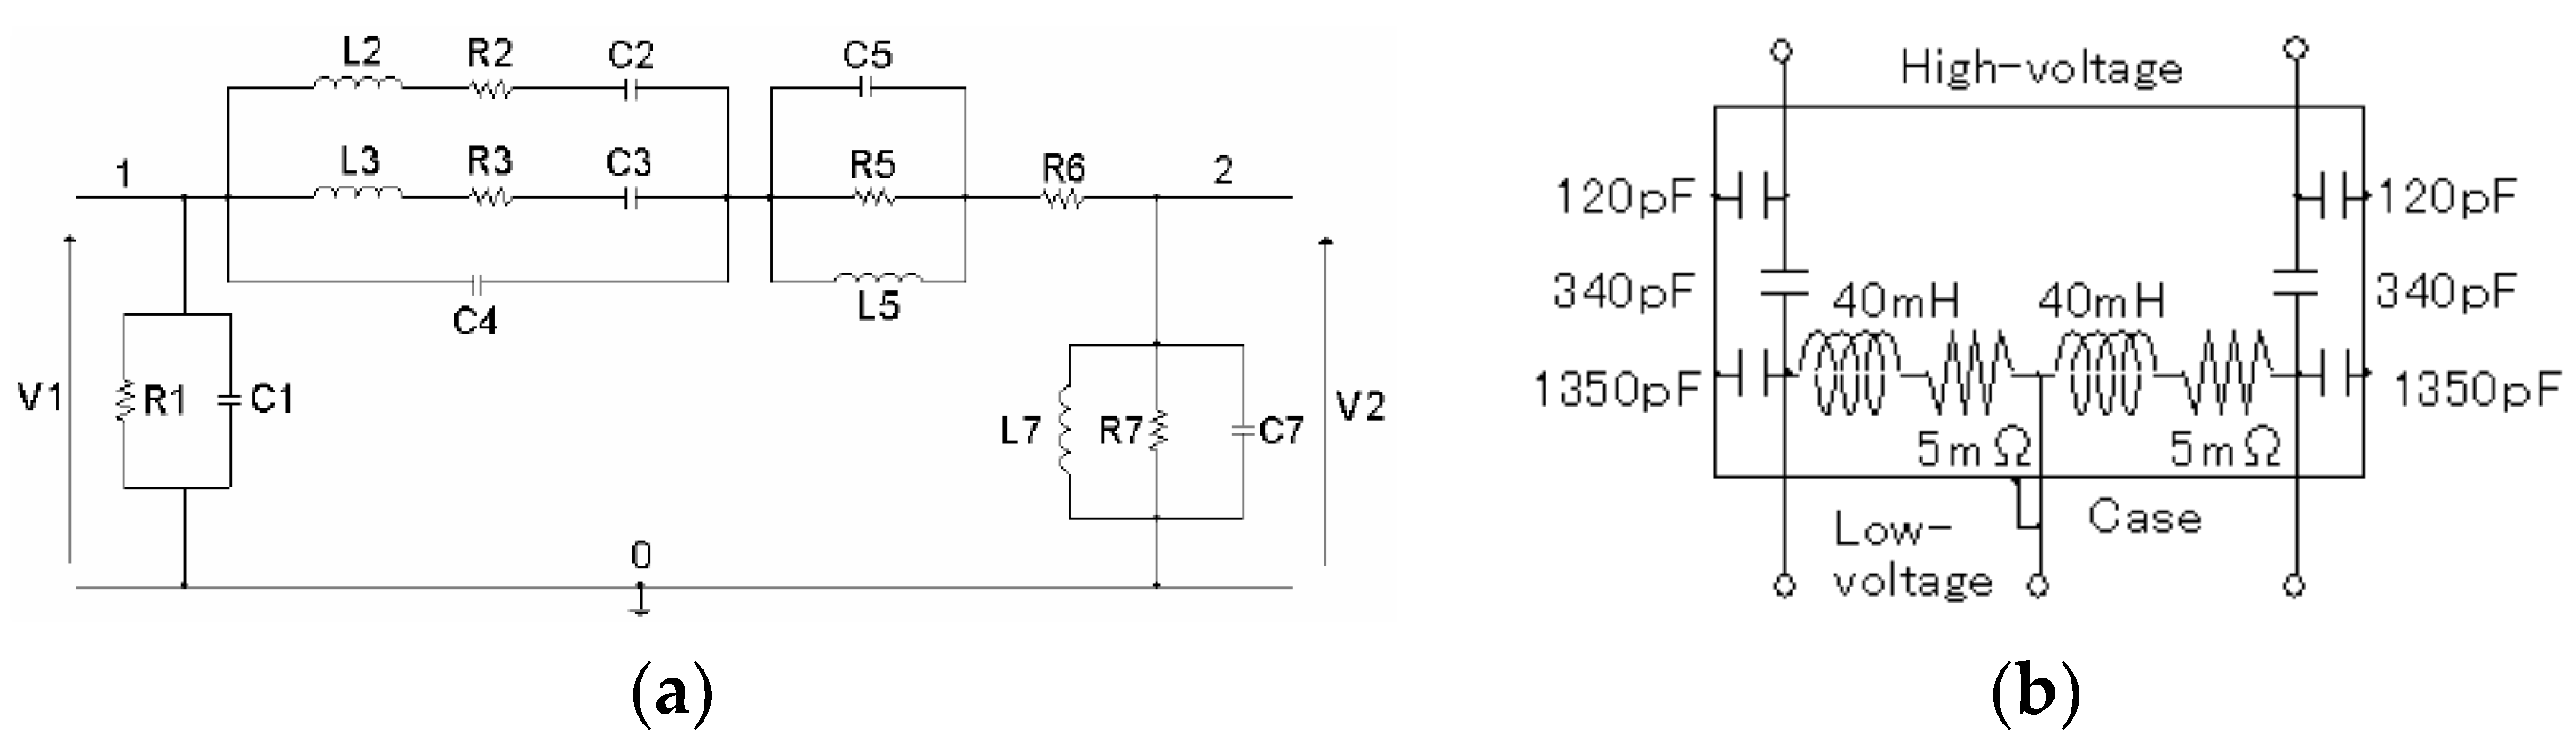
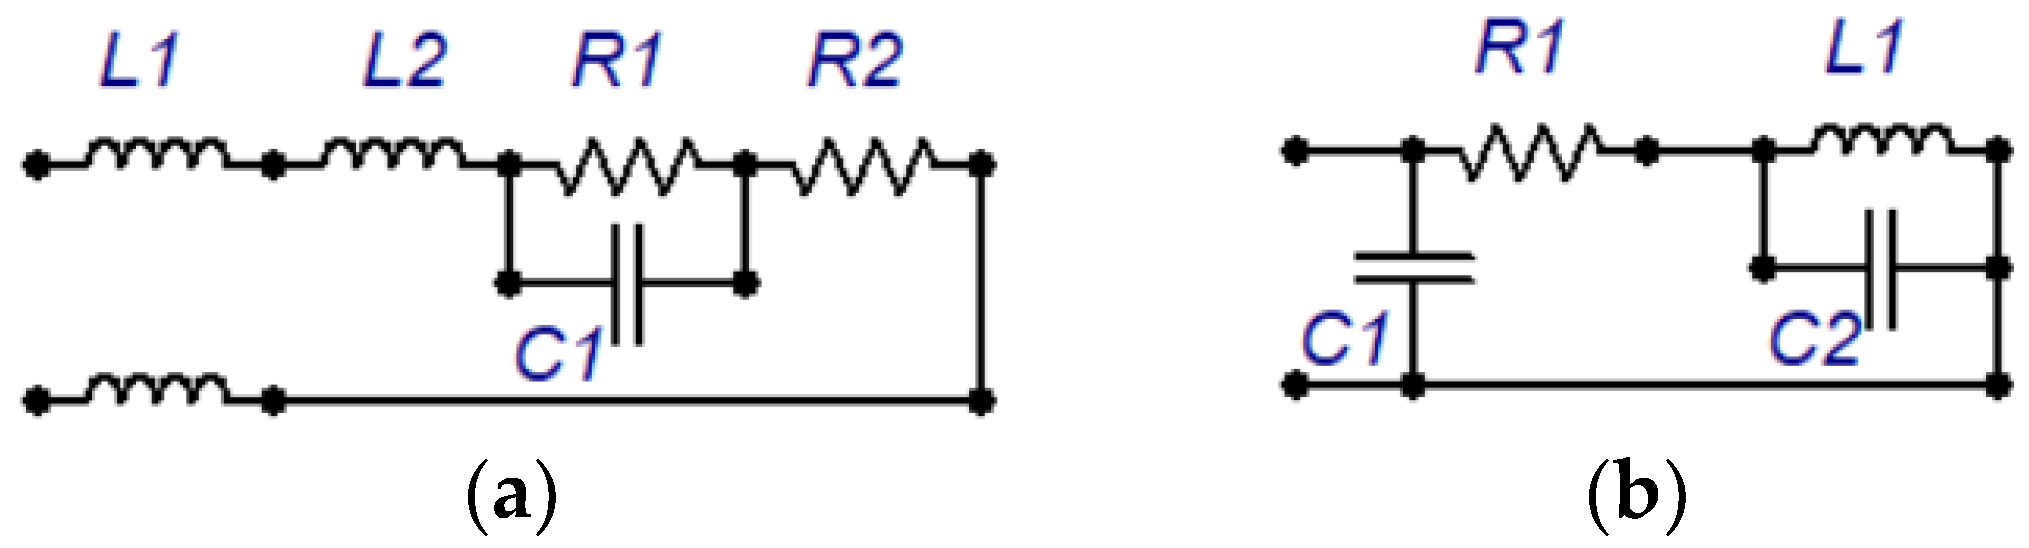
In the realm of studies evaluating transformer behavior and devising surge transfer models, a specific focus is placed on models tailored for distribution transformers. Two notable models are considered for assessment. The first, denoted as Model 1 and introduced by [20], is depicted in Figure 2a. This model encompasses circuits applicable to transformers with capacities ranging from 30 to 175 kVA. For this study, the 45 kVA transformer is selected as a standard reference due to its prevalent use in distribution networks. The component values corresponding to this model are outlined in detail in [20]. The second model, referred to as Model 2 and introduced by [3], with development by [21] is illustrated in Figure 2b, showcasing its circuit configuration and associated component values. These models are subjected to a thorough evaluation as part of the research analysis.
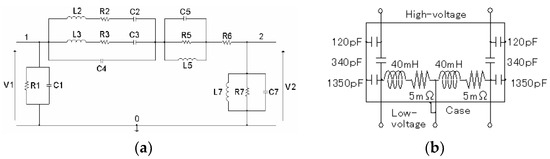
Figure 2.
Transformer models: (a) Model 1; (b) Model 2.
Additionally, for the protection of transformers against atmospheric events, lightning arresters are used. They are usually installed before the medium-voltage bushings and on the low-voltage bushings. These devices will be presented in the following subsection.
3.3. Surge Arresters
Surge arresters are essential devices in distribution networks, safeguarding electrical and electronic equipment against transient overvoltage. They are designed to operate during transients and remain inactive under normal conditions. When installed at equipment power inputs, they limit voltage amplitude and excess energy to the ground. There are medium-voltage surge arresters (MVSAs), installed at transformer poles and medium-voltage terminals, and low-voltage surge arresters (LVSAs), placed at low-voltage terminals [22]. Surge protection devices (SPDs) are mandatory and installed at the metering entrance of consumer units connected to a low voltage, operating on the same principle. Currently, zinc oxide (ZnO) surge arresters are widely used, with standardized nominal voltages of 12, 21, and 30 kV for distribution networks. To represent these devices in simulation models, utilizing residual voltage curves provided by manufacturers is essential. ATPDraw offers easily implementable models based on nonlinear resistances for these devices.
There are three distinct models of nonlinear resistors used in surge arrester simulations. The first one, called Type 99, features a pseudo-nonlinear resistance with a Type 99 branch, initially behaving as an open circuit until the voltage across its terminals surpasses a defined value. From that point on, the branch becomes a closed circuit, reverting to its initial state only when the current in the branch reaches zero. Defining its characteristics point by point on the VxI curve is important. The second model, Type 92, is specific to zinc oxide (ZnO) surge arresters, allowing for highly nonlinear resistive behavior and is essential for understanding the performance of these devices. Lastly, the metal oxide varistor (MOV) model is known as the true nonlinear resistance and involves an iterative method for its resolution, requiring input data, including the nonlinear characteristics of the equipment’s VxI curve. By providing these details, an accurate representation of MOV surge arresters can be achieved in simulation models [23].
- (a)
- Type 99: It is a pseudo-nonlinear resistance model that has a Type 99 branch, which behaves as an open circuit until the voltage across its terminals exceeds the defined value. From that moment on, the branch becomes a closed circuit and will only return to the initial condition when the current in the branch is equal to zero. The characteristics of the VxI curve should be defined point by point [23].
- (b)
- Type 92: This model is suitable for a ZnO surge arrester and is based on Equation (2), allowing for resistive and highly nonlinear behavior [23].
- where is the current in the surge arrester, is the operating voltage, and and are constants defined by the device’s operation.
- (c)
- MOV: It is known as the true nonlinear resistance, consisting of a branch that uses an iterative method for resolution. This solution method involves solving a system of equations, which requires some input data for resolution. Lastly, the nonlinear characteristic of the VxI curve of the equipment must also be provided [23].
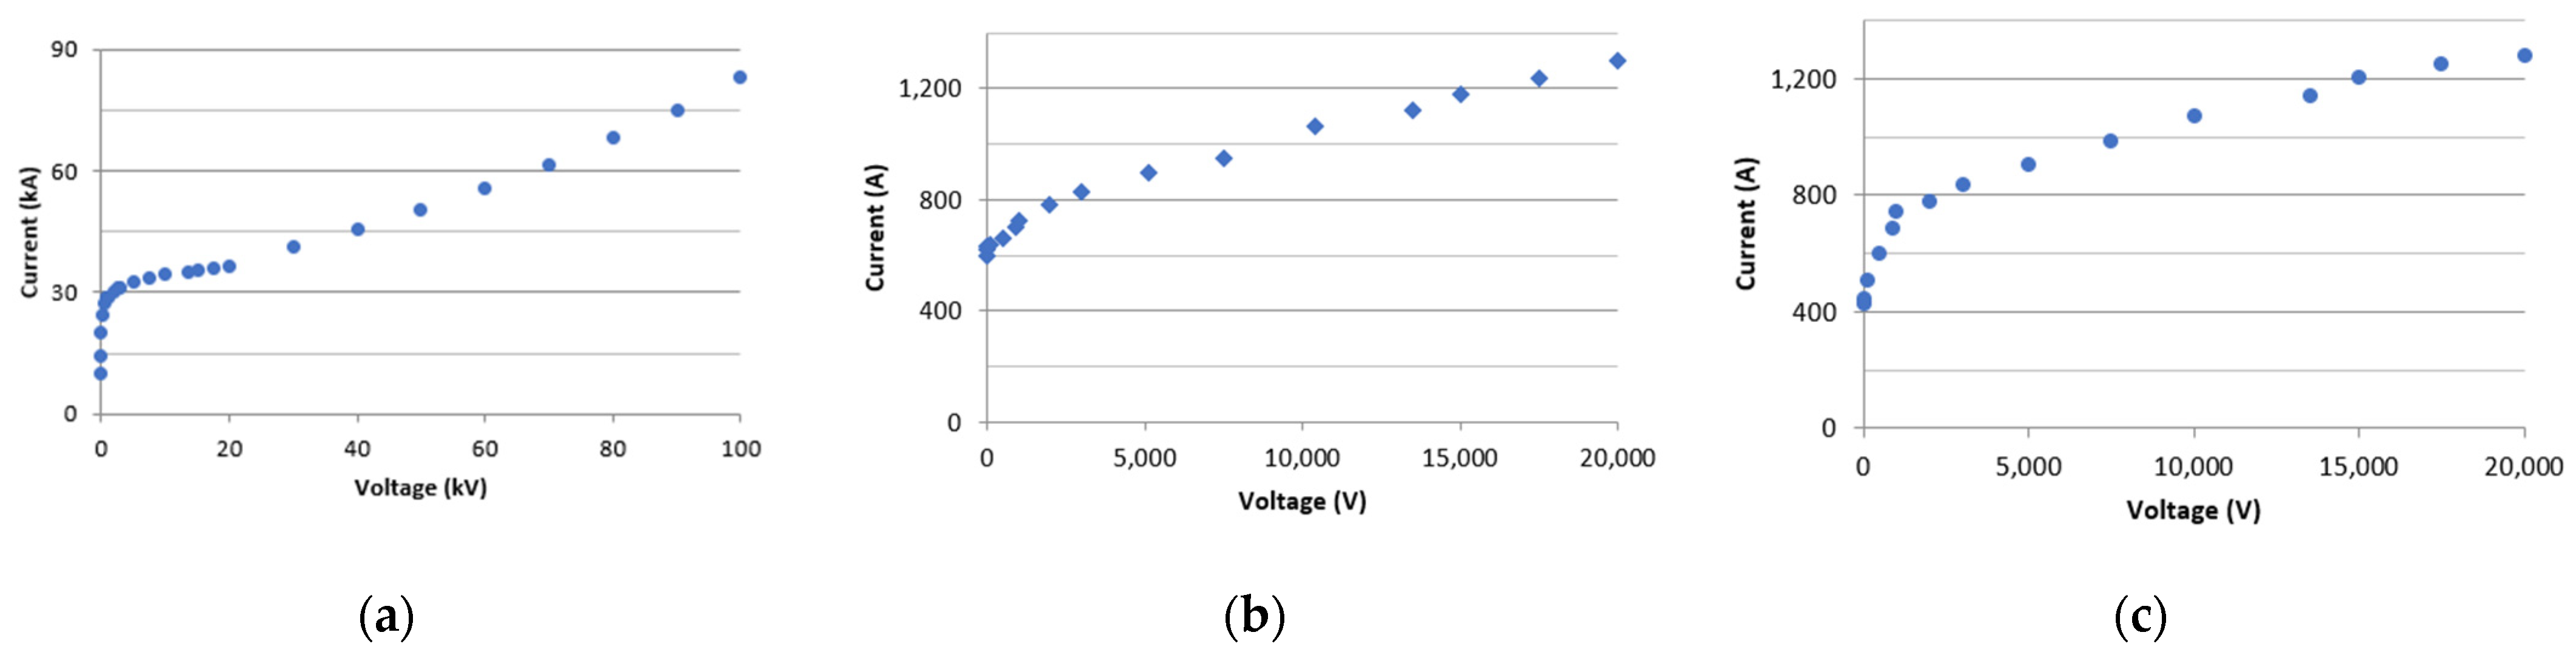
It is important to emphasize that, regardless of the selected model, all of them rely on the VxI operating curve of these devices, which should be available in the datasheets. The VxI curve for the Surge Protection Device (SPD) is derived from the curves outlined in [24]. For the medium-voltage surge arrester (MVSA), the reference point is the datasheet [25], while information from datasheet [26] is utilized for the low-voltage surge arrester (LVSA). These curves are visually represented in Figure 3 below.
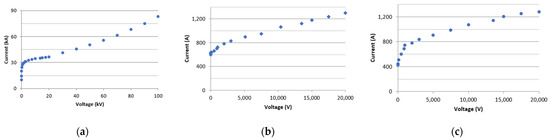
Figure 3.
VxI curve of surge suppressors: (a) MLSA; (b) LVSA; (c) SPD.
3.4. Conductor Cables
Conductor cables in electrical power distribution networks are essential for transmitting electric current from power sources to consumers, ensuring efficiency and safety. Modeling these cables during transient periods is challenging, as it involves frequency-dependent distributed parameters. The choice of modeling domain (modal or phase) further complicates the calculations [27]. Overvoltage calculations require precise steps, including line parameter calculation, synthesis of model parameters, and transient solution determination [28]. To represent conductors, ATPDraw offers the JMarti model [29], although recent studies have proposed the universal line model (ULM) as a more accurate alternative [30]. Implementing the ULM demands significant effort due to its complexity. Comparatively, JMarti, based on modal domain equations, is widely accepted and easily implemented in ATPDraw. Studies have suggested that JMarti suffices for aerial distribution networks, considering their specific characteristics [31]. The chosen model for conductor representation in ATPDraw is the JMarti type LCC, demanding input data like cable installation type, simulation model, soil resistivity, span length, and lightning-related parameters.
3.5. Concrete Poles
Concrete poles are essential structures in distribution networks, supporting the conductor cables that transmit electricity from power sources to consumers. They ensure network safety and stability by maintaining a safe distance between the conductors and the ground. In Brazil, most distribution networks use concrete poles, varying in height between 9, 10, and 11 m based on voltage levels and installation locations. To ensure user safety and facilitate maintenance, specific clearances between phase and neutral conductor cables and the ground are established following guidelines outlined in [18].
The impact of poles in atmospheric events has been studied [7,8], revealing that poles can be analyzed as two electrical components: the embedded portion and the section above the ground. The embedded part is represented by ground resistance, which will be explored further in the following section. This discussion focuses on the above-ground section of the pole, represented by an impedance. The part of the pole represented by grounding resistance will be discussed later. Consequently, the concrete pole’s impedance is influenced by construction factors such as concrete type, reinforcement dimensions, and soil resistivity [7]. These values can be determined through analytical methods or numerical simulations.
The representation of the concrete pole should be performed for the portion above the ground and the part buried in the soil, respectively, represented by an impedance and a grounding resistance.
Therefore, the impedance of the concrete pole depends on its construction characteristics, such as the type of concrete, dimensions of the reinforcement, and soil resistivity, among others [7]. These values can be obtained through analytical methods or numerical simulation. Below is a brief description:
- (a)
- Analytical:
- Using Equation (3), it is possible to calculate the value of the characteristic impedance of the pole, considering the internal characteristics of the reinforcements and the electrical properties of the concrete. This equation is a result of the study by [7], which examines the influence of electromagnetic fields generated by a return stroke, originating from lightning strikes, on the concrete pole structures.where is the height of the pole, is the average radius of the pole, is the angular frequency, and are the relative electrical permittivity of concrete and the electrical permittivity of vacuum, respectively, and is the electrical conductivity of concrete.
- (b)
- Numerical simulation:
- In [32], the use of a simulation process is demonstrated to determine the characteristic impedance of a transmission or distribution structure. Simulation offers the advantage of considering various details of the structure’s body, which is not feasible in an analytical procedure [7]. They utilized the ANSYS® software Q3D Extractor, version 2021R2, to determine the characteristic impedance of a distribution pole and a transmission tower.
3.6. Insulators
Voltage insulators play an important role in power distribution networks by supporting and isolating electrical conductors, ensuring the safe conduction of current, and maintaining a continuous power supply. In medium-voltage (MV) networks, pillar-type insulators are preferred due to their electrical properties and robustness, often eliminating the need for crossarms. For low-voltage (LV) networks, porcelain or glass pulley-type insulators are commonly used, providing support directly on the poles with lower insulation levels. The insulation level is vital for protecting distribution and transmission lines from lightning strikes. It is characterized by parameters such as impulse withstand voltage (IWV) and critical flashover voltage (CFO), indicating the voltage levels that insulators can endure and the threshold causing breakdown, respectively [19].
CFO values are influenced by insulation distances, insulator types, and pole materials and are determined through laboratory tests or analytical methods. For MV networks, 125 kV pillar-type insulators with a CFO of 145 kV are standard, while LV networks employ porcelain pulley-type insulators with a maximum voltage of 1.2 kV and a CFO of 35 kV, both for positive polarity [33]. Due to lightning’s high current, insulators are susceptible to disruptive discharges, leading to breakdown. Various methods are used to determine the voltage threshold for these discharges, including the ones described below.
- (a)
- IEEE Guiding Model: This is suggested by [13], simple, and defined by Equation (4):where CFO is the critical impulse flashover voltage, which is related to the insulation level of the structures.
- (b)
- Disruptive Effect Model—DE Method:
- This method is known as the disruptive effect (DE) method [34], it is based on the concept of the integration method, and its application involves the estimation of some parameters. Equation (5) for this method is presented below.where DE is the constant disruptive effect for the interval where for a specified voltage waveform, is the instantaneous voltage over the insulation, is the initial voltage or minimum voltage to be exceeded to initiate the breakdown process, is the time when is exceeded, and is the time of disruption [35].The parameters and can be estimated using different procedures proposed in various studies in the literature. For distribution network insulators, recent studies [34] suggest the use of Equation (6) below:The best value of α is the one that results in the minimum square deviation of DE, with each value calculated by averaging the DE values corresponding to the voltage levels obtained from tests [34].
To incorporate these methods into the simulation, two approaches can be taken: utilizing a voltage-controlled switch or implementing a MODELS block. The first option can represent both the model in [13] and the disruptive voltage values calculated by the DE method. The second option, particularly suitable for the DE method, facilitates an iterative process to determine insulation disruption by allowing for voltage values to be adjusted iteratively. Researchers implementing this approach typically use three parameters specific to the insulators within the networks, with these parameters being well-defined for insulator strings. However, tests conducted on distribution network insulators by [34] employed a different calculation method, which cannot be seamlessly integrated into existing routines used for insulator string representation.
Consequently, the insulators were treated as voltage-controlled switches for modeling and integration into the circuit model. For the method outlined in the IEEE guide, the CFO value was applied in Equation (4) while for the DE method, disruptive voltage values calculated using Equations (5) and (6) were utilized.
To determine the values of V(t), the surge impedance of the lightning directly striking the network was considered, calculated based on the type of conductor and its height above the ground, as described in Equation (7). The calculated impedance values were 500 Ω for the MV network and 498 Ω for the LV network.
The DE factor is dependent on the waveform of the lightning, and, therefore, different disruptive voltage values were obtained by minimizing the error in Equation (8) while varying the maximum V(t) value.
The values for the constants DEc (kVs), V0 (kV), and α were obtained from [34] for the 24 kV class insulator, considering the similarity between the disruptive voltage values (CFO) of the insulators. The resulting disruptive voltage values for the MV insulator can be seen in Table 2.
Table 2.
Disruptive voltage values.
The disruptive voltage values for the BT isolator can also be obtained using the DE method by using the constants suggested by [33]. The values obtained ranged between 35 and 33 kV, and a fixed value of 35 kV is chosen for this study.
3.7. Consumer Installations
Recipients in low-voltage systems receive electricity at voltages below 1000 volts, encompassing residences, offices, commercial establishments, factories, schools, and more. They are supplied through low-voltage distribution networks designed to deliver secure and consistent electrical power to meet the requirements of this consumer category. To safeguard these consumers, surge protective devices (SPDs) are employed, incorporating at least one element with nonlinear characteristics. The positioning of SPDs at the consumer’s meter is determined based on the desired level of protection [36].
Consumer units exhibit diverse and fluctuating electrical loads contingent upon the equipment utilized in each location. Considering the array of household appliances that can be found in each consumer unit, the loads will inevitably vary across different installations. A circuit representation, illustrated in Figure 4, has been proposed to address this.
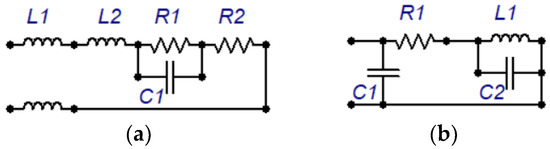
Figure 4.
Equivalent circuit for the load: (a) Model 1; (b) Model 2.
The loads present in consumer units are highly variable and depend on the equipment installed at each location. As there is a variety of household appliances that can be used in each consumer unit, the loads will certainly not be identical across different installations. A circuit representation is proposed, as shown in Figure 4. The components of this circuit represent the installed load in the consumer unit, including L2, C1, R1, and R2, as well as the grounding rod, Rat, and the service entrance to energize the meter, L1, whose values are provided in Table 3.
Table 3.
Parameters of the consumer load model.
3.8. Grounding Systems
Grounding systems play a vital role in ensuring electrical safety, shielding people and equipment from electric shocks, short circuits, and electromagnetic interference. They also provide stability to electrical voltage, safeguard equipment from lightning damage, and enhance energy efficiency. A well-designed grounding system can prolong the lifespan of electrical equipment. In essence, a high-quality grounding system is important for the safety, reliability, and efficiency of electrical systems [37].
In low-voltage installations, a single vertical rod with a diameter and length of 2 or 2.4 m is used for each consumer. In medium-voltage networks, aligned rods interconnected by copper conductors are employed to reduce grounding resistance in areas with a high soil resistivity, where achieving the minimum grounding resistance is challenging [38].
There are two methods to represent grounding resistance:
- (a)
- Fixed-value grounding resistance:
- These grounding values can be obtained through analytical calculations. For the values of grounding resistance of buried vertical rods [39], Equation (9) can be used:where is the soil resistivity [Ωm], L is the length of the rod [m], and d is the diameter of the cross-sectional area of the rod [m].
- Grounding systems in electrical networks are implemented differently, with specific recommendations aimed at equipment protection. One such recommendation involves providing specific clearances for grounding the neutral conductor in high-resistivity soils. Additionally, the installation of interconnected rods is suggested to reduce the grounding resistance values. Equation (10) is used to determine the grounding resistance values [39].where n is the number of vertical rods arranged, is the soil resistivity [Ωm], L is the length of the rod [m], a is the radius of the rod’s cross-sectional area, d is the depth of installation of the grounding system, and the spacing between the rods is the same as their length, 2.4 m.
- (b)
- Frequency-dependent grounding resistance:
- For this representation, the variation of soil parameters is taken into consideration when there is a change in frequency, as groundings behave as impedances. Therefore, based on the considerations made by the studies [27,40], which present the characteristics of the hybrid electromagnetic model (HEM), it is noted that this model, based on field and circuit theories, accurately represents the behavior from DC to a couple of megahertz and takes into account the frequency-dependent soil electrical parameters. Therefore, based on the observed behaviors, this model will be implemented through a library in ATPDraw.
4. Results
The comparison analyses encompassed various simulation models for specific elements: a lightning strike simulation with a 10 kA current and designated time parameters, as shown in Table 1; medium- and low-voltage distribution networks, referring to recommendations and common models, particularly the single-phase P2 structure [18]; distribution transformers modeled as per the specifications for a 45 kVA power rating, model 1 by [20]; surge arresters using the Type 99 model as a reference, with distinct VxI curves for MVSA, LVSA, and SPD; conductor cables implemented using the JMarti model, utilizing specific characteristics from sources like [41,42]; concrete poles values obtained through analytical methods; consumer installations represented using Model 1; and grounding systems initially employing fixed grounding resistance values. General simulations adhered to specific conditions, including a soil resistivity of 500 Ω.m, direct lightning strikes on the structure prior to the transformer, and medium-voltage networks without a neutral conductor. These models and conditions were chosen to facilitate comprehensive analyses and comparisons.
4.1. Calculation and Simulation Tools
The article chooses ATP-EMTP, along with its graphical interface ATPDraw, for simulations due to its widespread usage and acceptance in the scientific community. ATP-EMTP is preferred for simulating electromagnetic and electromechanical transient phenomena in power systems, primarily because of its free availability, versatile model implementation capabilities, and positive reception within the scientific community.
4.2. Results for the Initially Defined Model
To initiate the circuit evaluations, this article will utilize a reference model developed to assess the contribution of the models to overvoltage levels, following the premises defined in the previous section. Given that previous studies have not typically conducted evaluations as comprehensive as those presented in this article, direct comparisons with other results may not be possible. Thus, the modifications implemented in the circuit defined as the reference will be compared exclusively with the results obtained in this simulation.
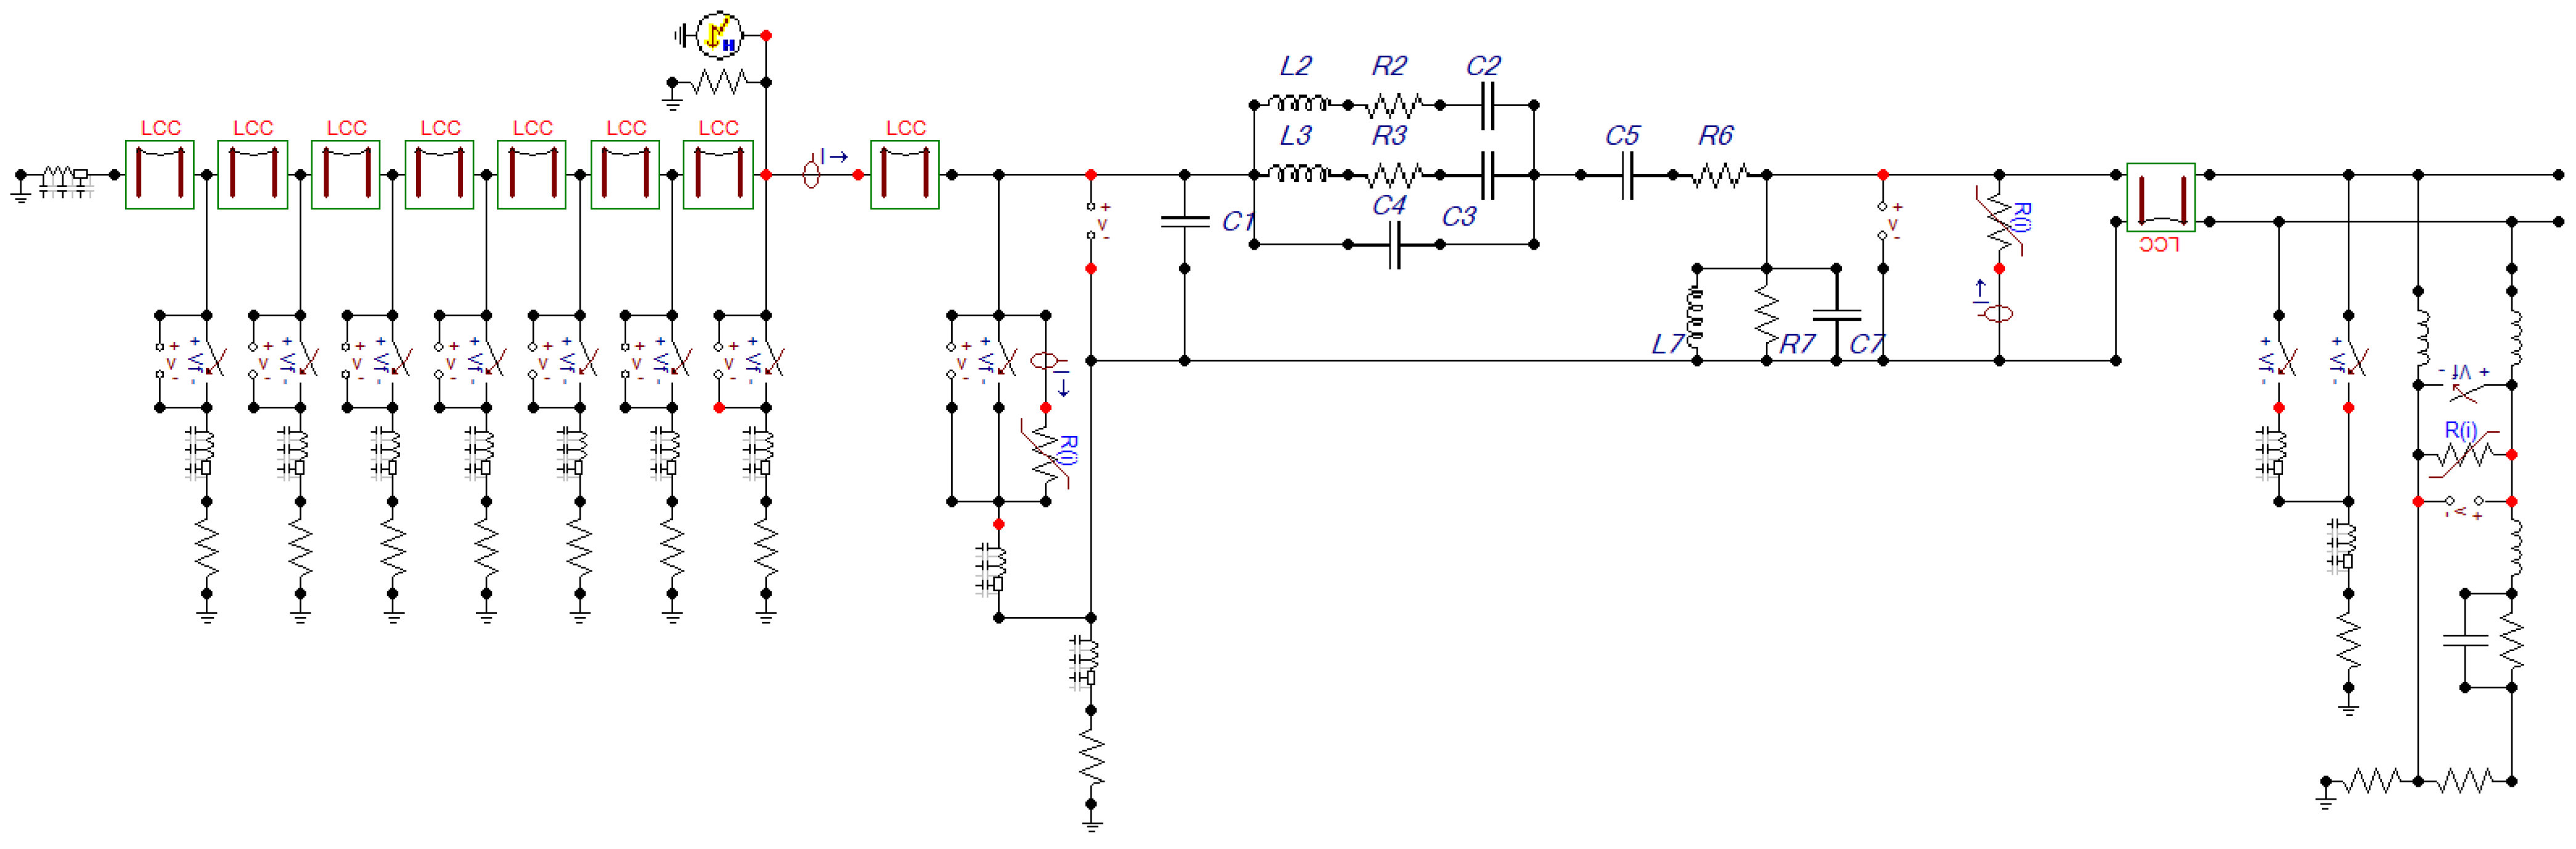
In Figure 5, it is possible to observe the arrangement of the circuit with the initially defined components, implemented in ATP.
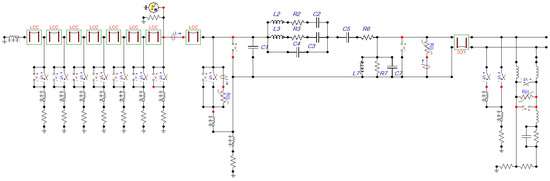
Figure 5.
Circuit with the components initially defined.
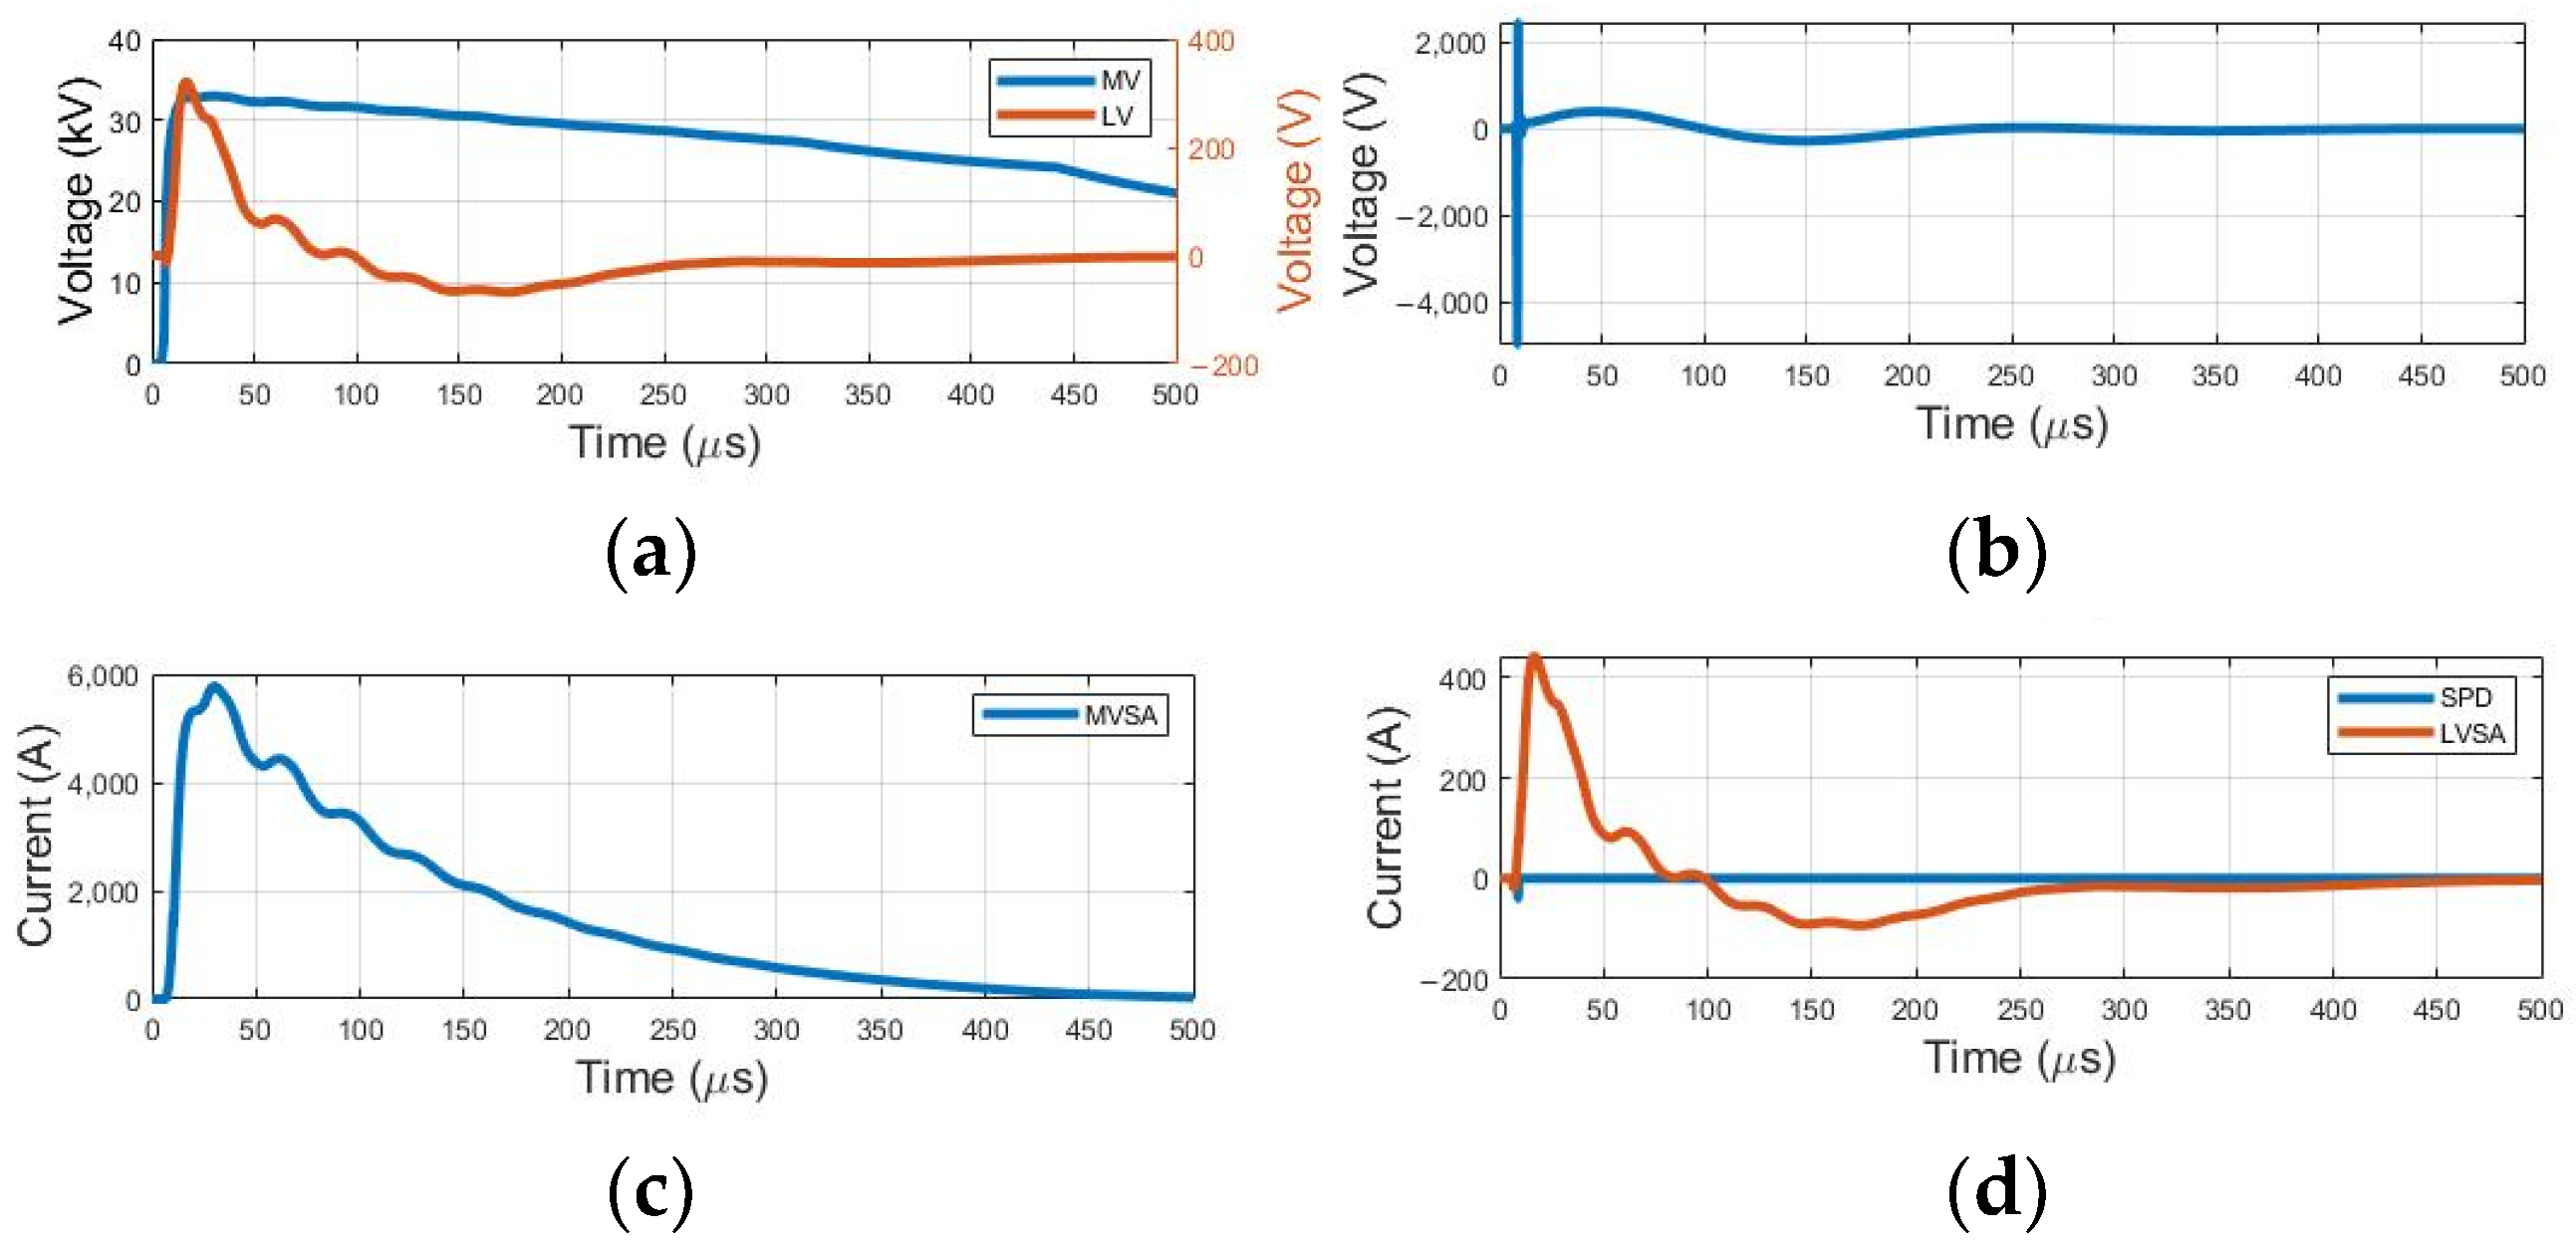
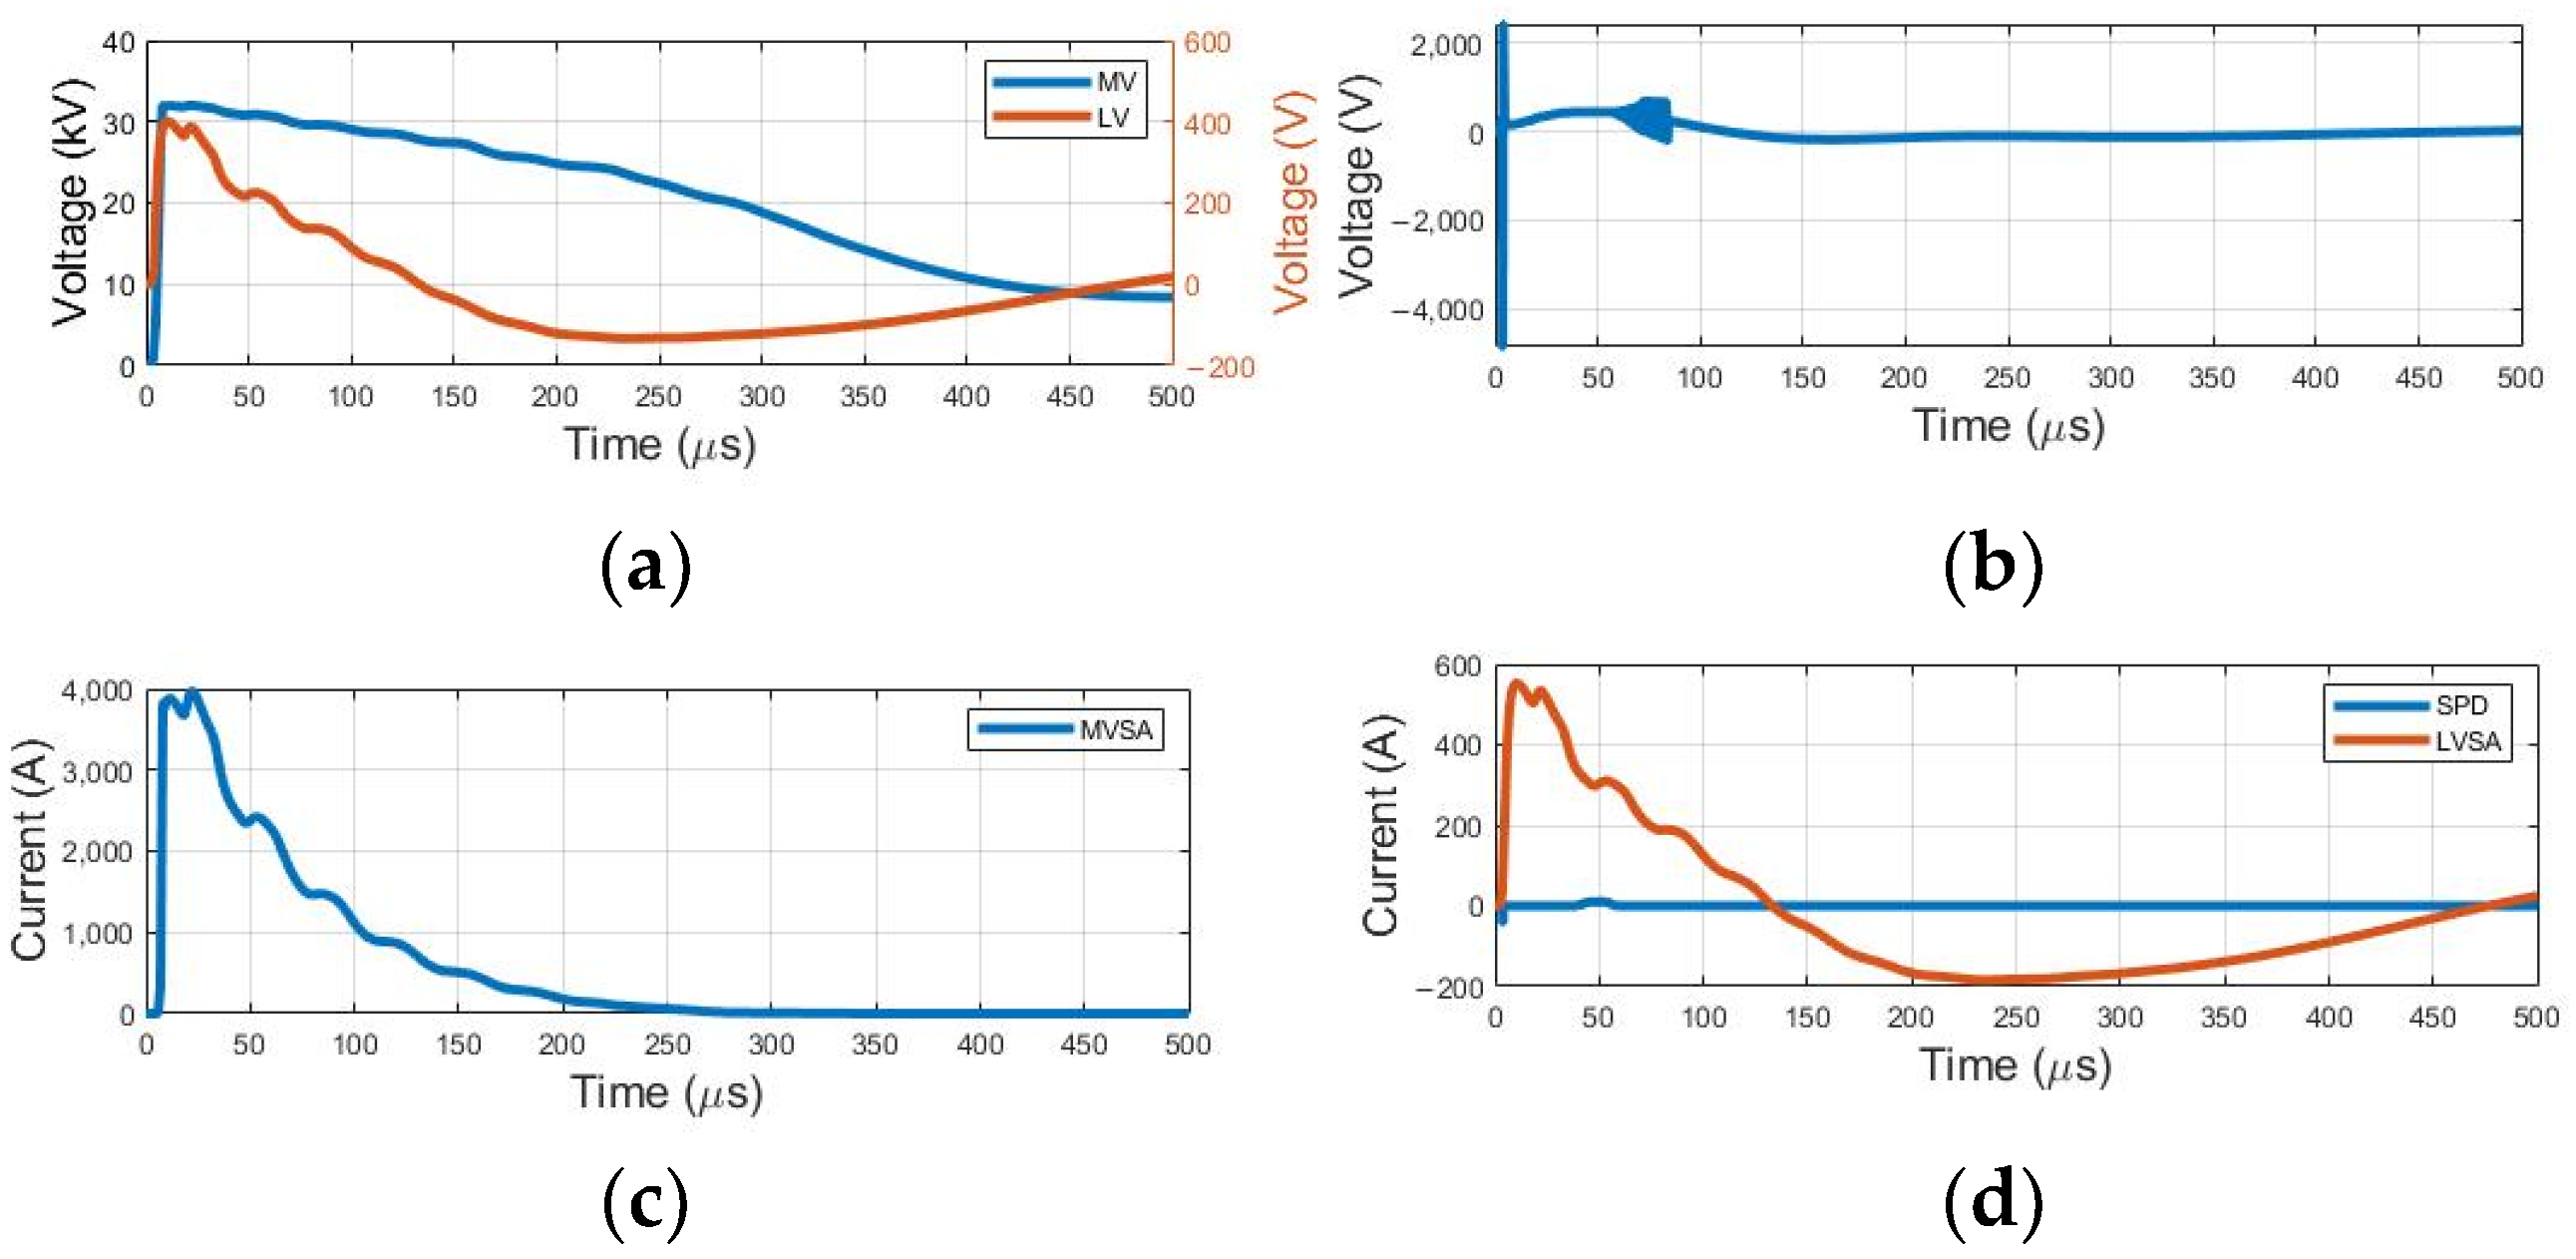
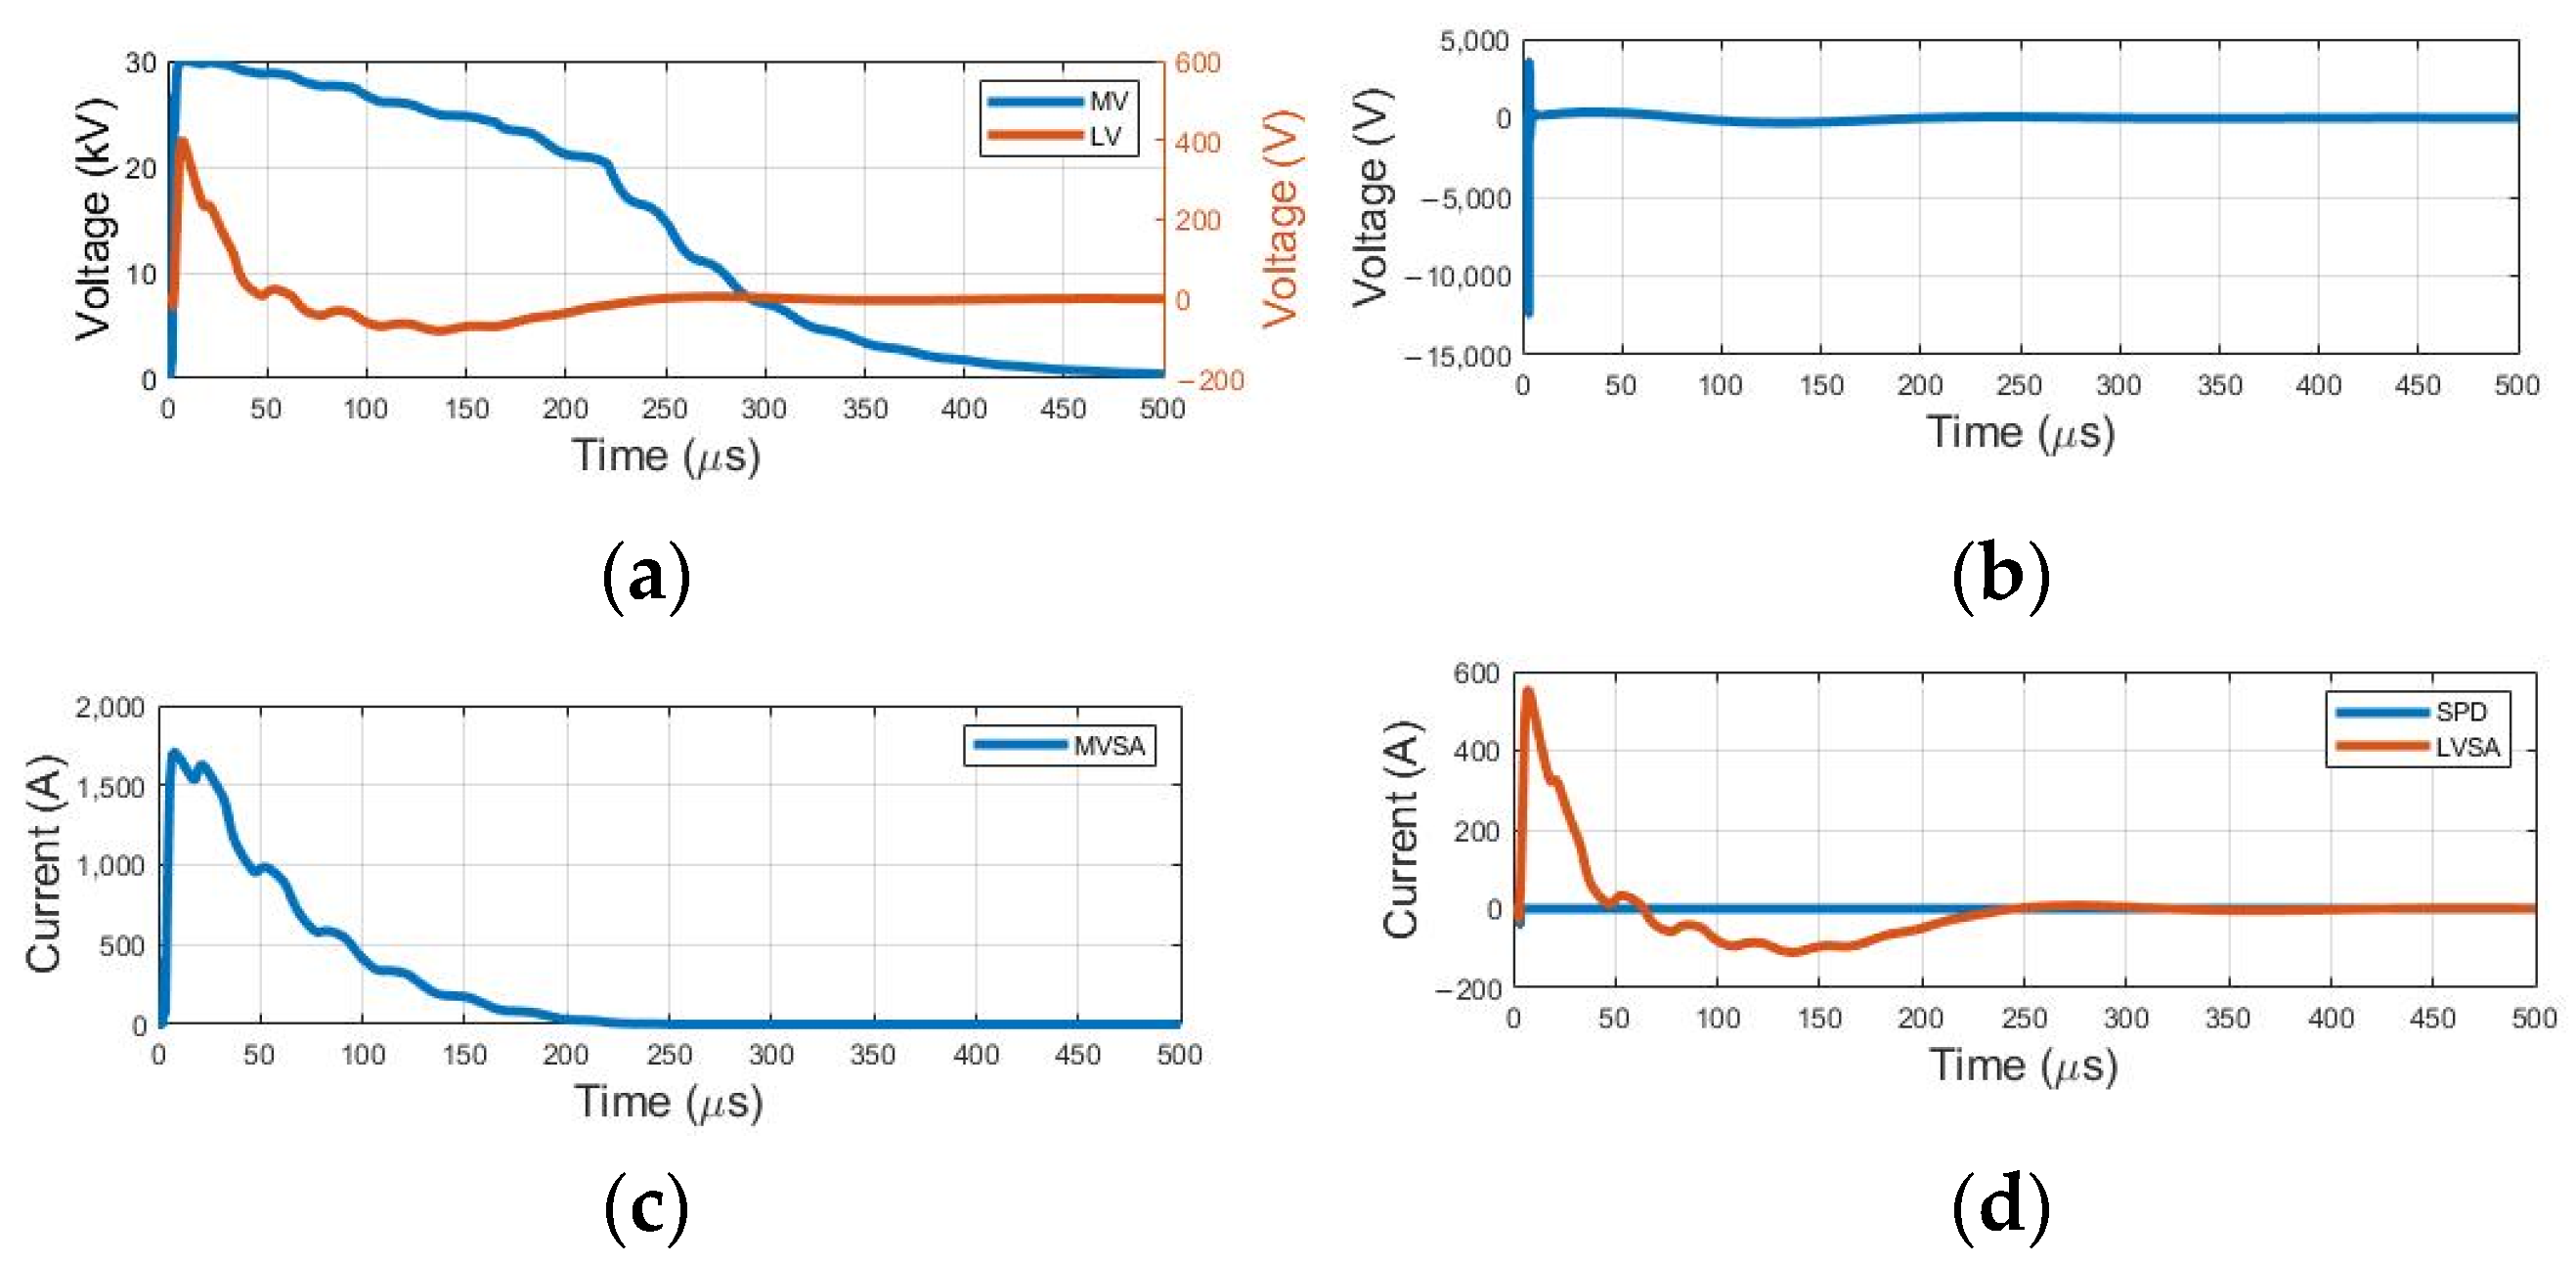
The results shown in Figure 6 are related to the waveforms at the transformer terminals, medium and low voltages, as well as the current in the network protection equipment and the consumer installation. The maximum levels obtained through simulation can be seen in Table 4.
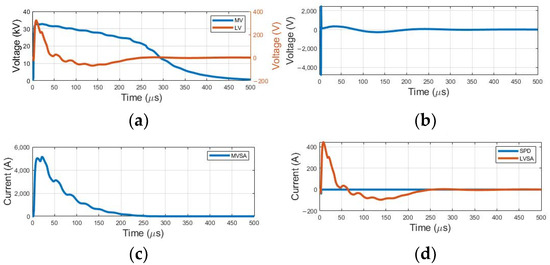
Figure 6.
Voltage and current waveforms: (a) voltage at transformer terminals; (b) voltage at the input of the consumer; (c) current in MVSA; (d) current in SPD and LVSA.
Table 4.
Maximum voltage values: initial definitions.
Considering the curves and maximum overvoltage levels presented, it is evident that these levels are significantly below the transformer’s maximum insulation levels. It is important to note that this discrepancy is due to the presence of surge protection devices, such as surge arresters. The functioning principle of these devices plays a fundamental role in protecting distribution transformers, keeping overvoltage levels well below critical insulation limits.
4.3. Lightning Strike
The following figures show the effects that occur in the maximum voltage and current levels when the lightning waveform is slower, as shown in Figure 7, or has a higher amplitude, as shown in Figure 8.
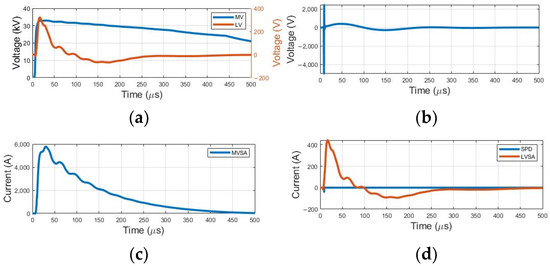
Figure 7.
Voltage and current waveforms for a 10 kA slow waveform lightning: (a) voltage at transformer terminals; (b) voltage at the input of the consumer; (c) current in MVSA; (d) current in SPD and LVSA.
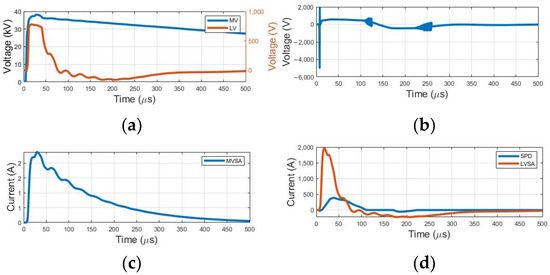
Figure 8.
Voltage and current waveforms for a 40 kA lightning: (a) voltage at transformer terminals; (b) voltage at the input of the consumer; (c) current in MVSA; (d) current in SPD and LVSA.
The maximum levels obtained through simulation can be checked in Table 5.
Table 5.
Maximum voltage values: lightning.
The increase in the rise time values, indicating a slower discharge, leads to minor changes in maximum voltage levels. However, waveform alterations can result in higher energy absorption by protective equipment. With a higher peak level, there is an expected increase in maximum overvoltage levels, accompanied by changes in waveforms.
4.4. Distribution Transformers
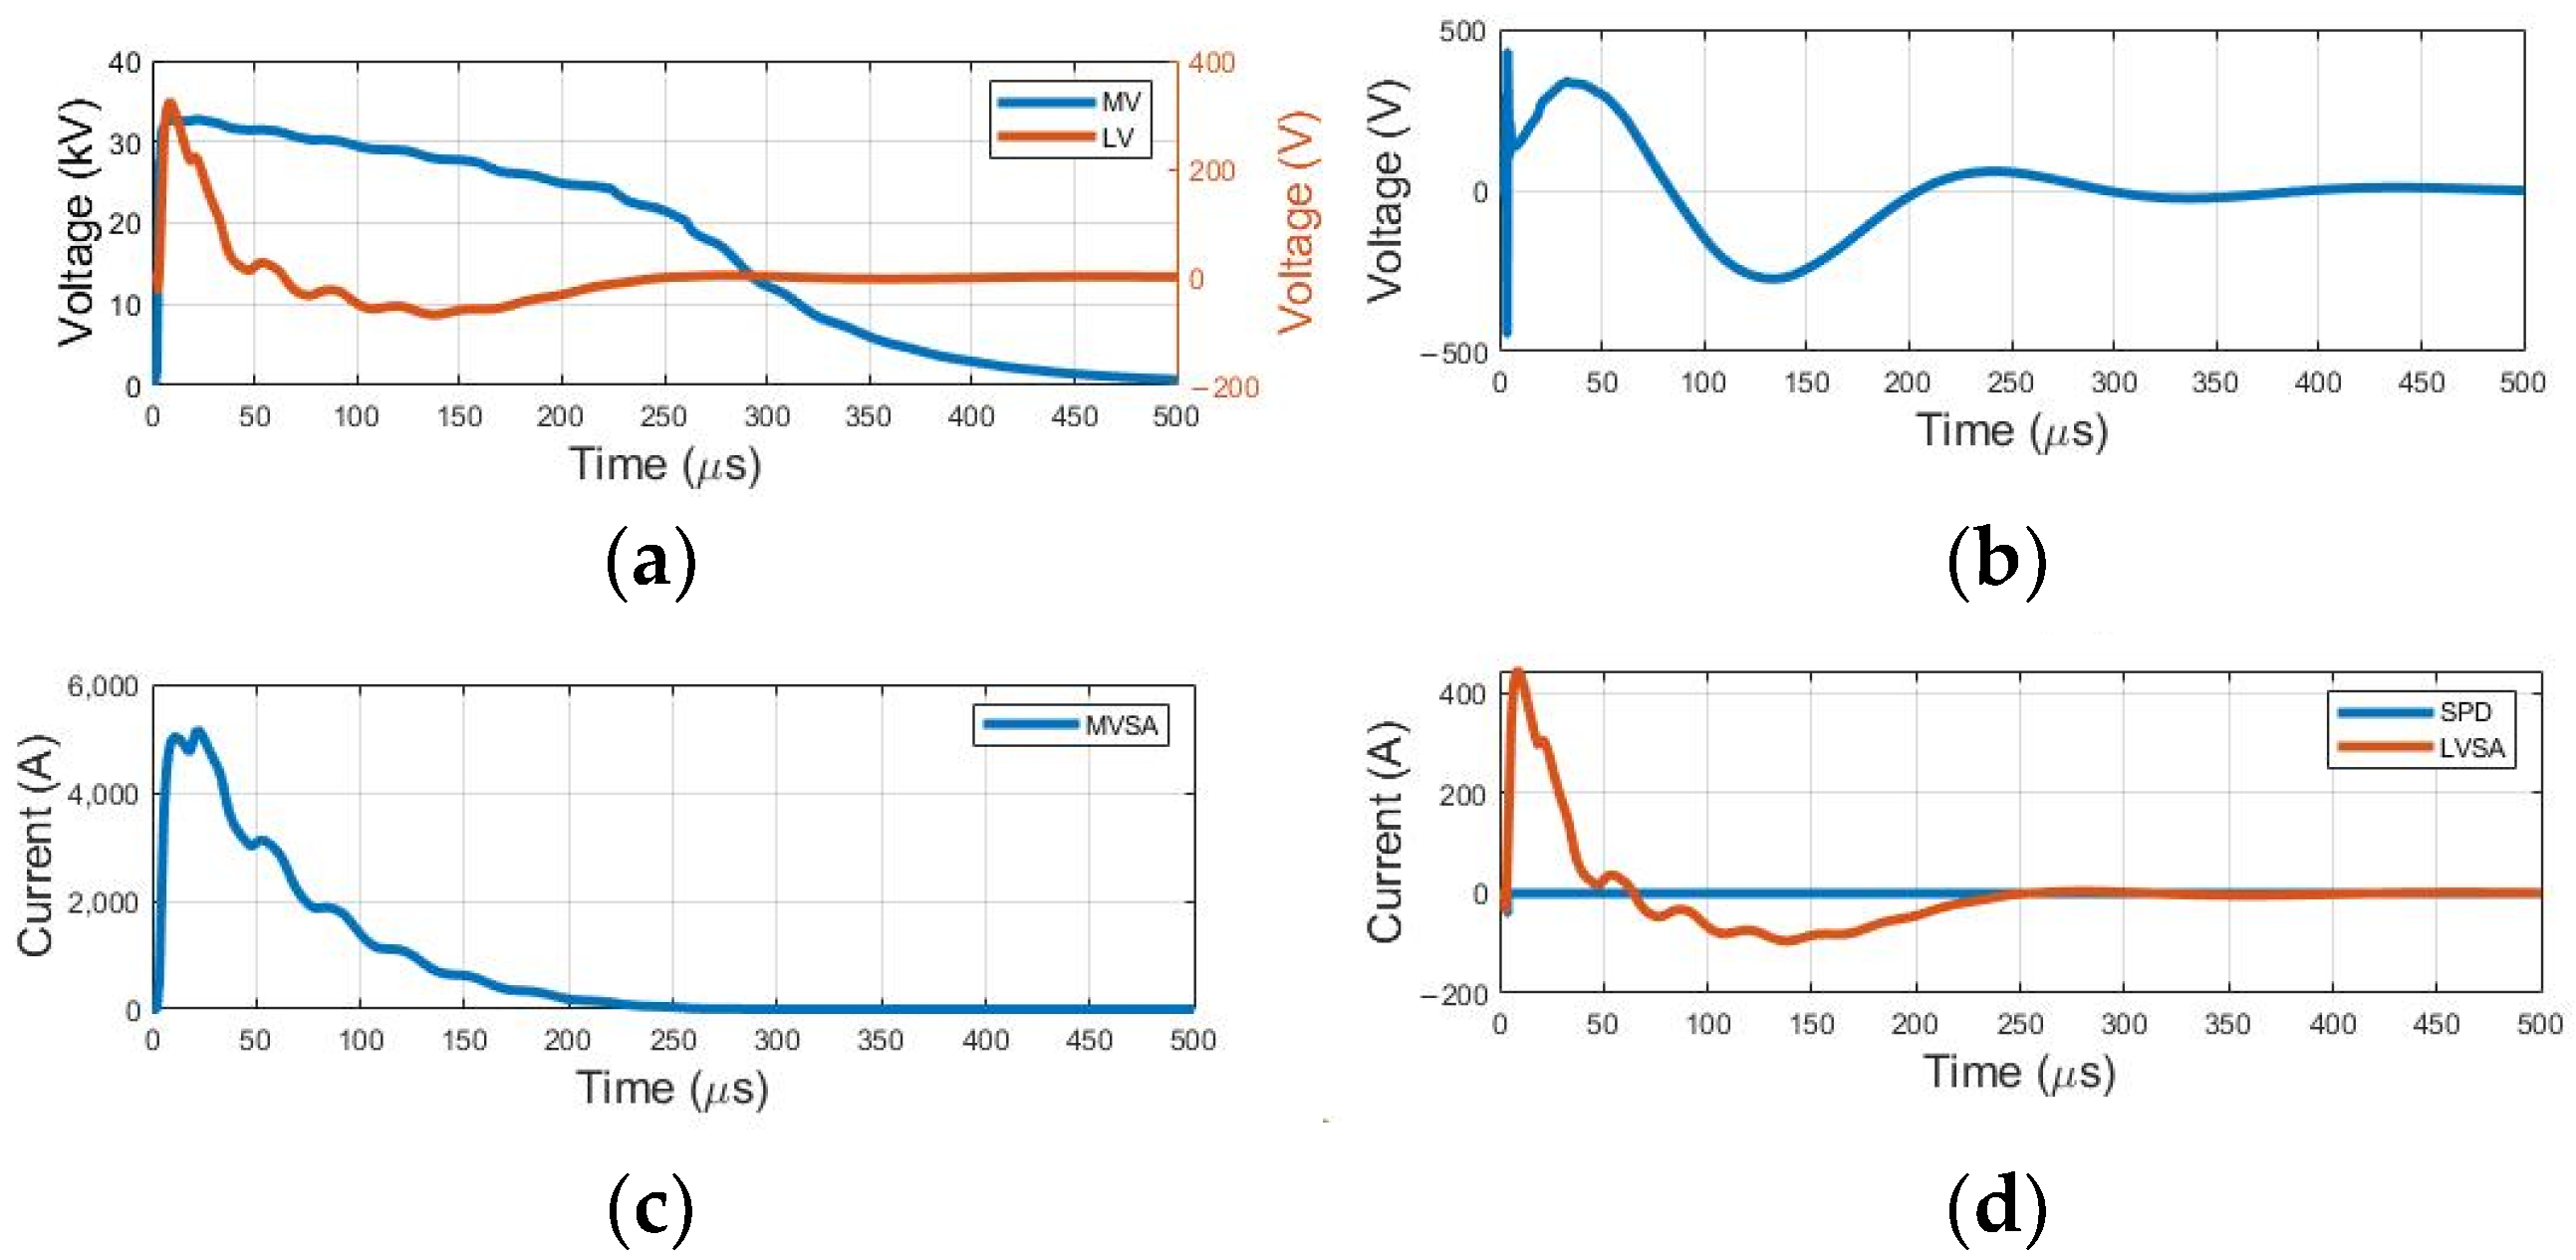
Transformers are important components in distribution systems; however, their representation in these systems requires careful evaluation. After assessing the results obtained with the model adopted as a reference, Model 1, the second model, indicated in Figure 2, is implemented to evaluate its impact on overvoltage levels and other implications in the system. The results presented below pertain to the application of the model, with waveforms and maximum values illustrated in Figure 9 and Table 6, respectively.
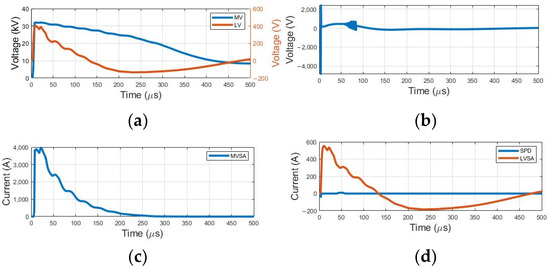
Figure 9.
Voltage and current waveforms for transformer model 2: (a) voltage at transformer terminals; (b) voltage at the input of the consumer; (c) current in MVSA; (d) current in SPD and LVSA.
Table 6.
Maximum voltage values: transformer model 2.
The maximum voltage and current levels reached do not show significant differences compared to those obtained in the reference model. However, there are variations in waveforms, which can impact the amount of energy that needs to be dissipated in protective devices, such as surge arresters, or in structural support components, like insulators. It is worth noting that with the installation of surge arresters, the overvoltage is directed to the low voltage due to the increase in neutral potential. Moreover, the representative circuit may have a minimal impact on the maximum voltage and current levels achieved.
4.5. Surge Arresters
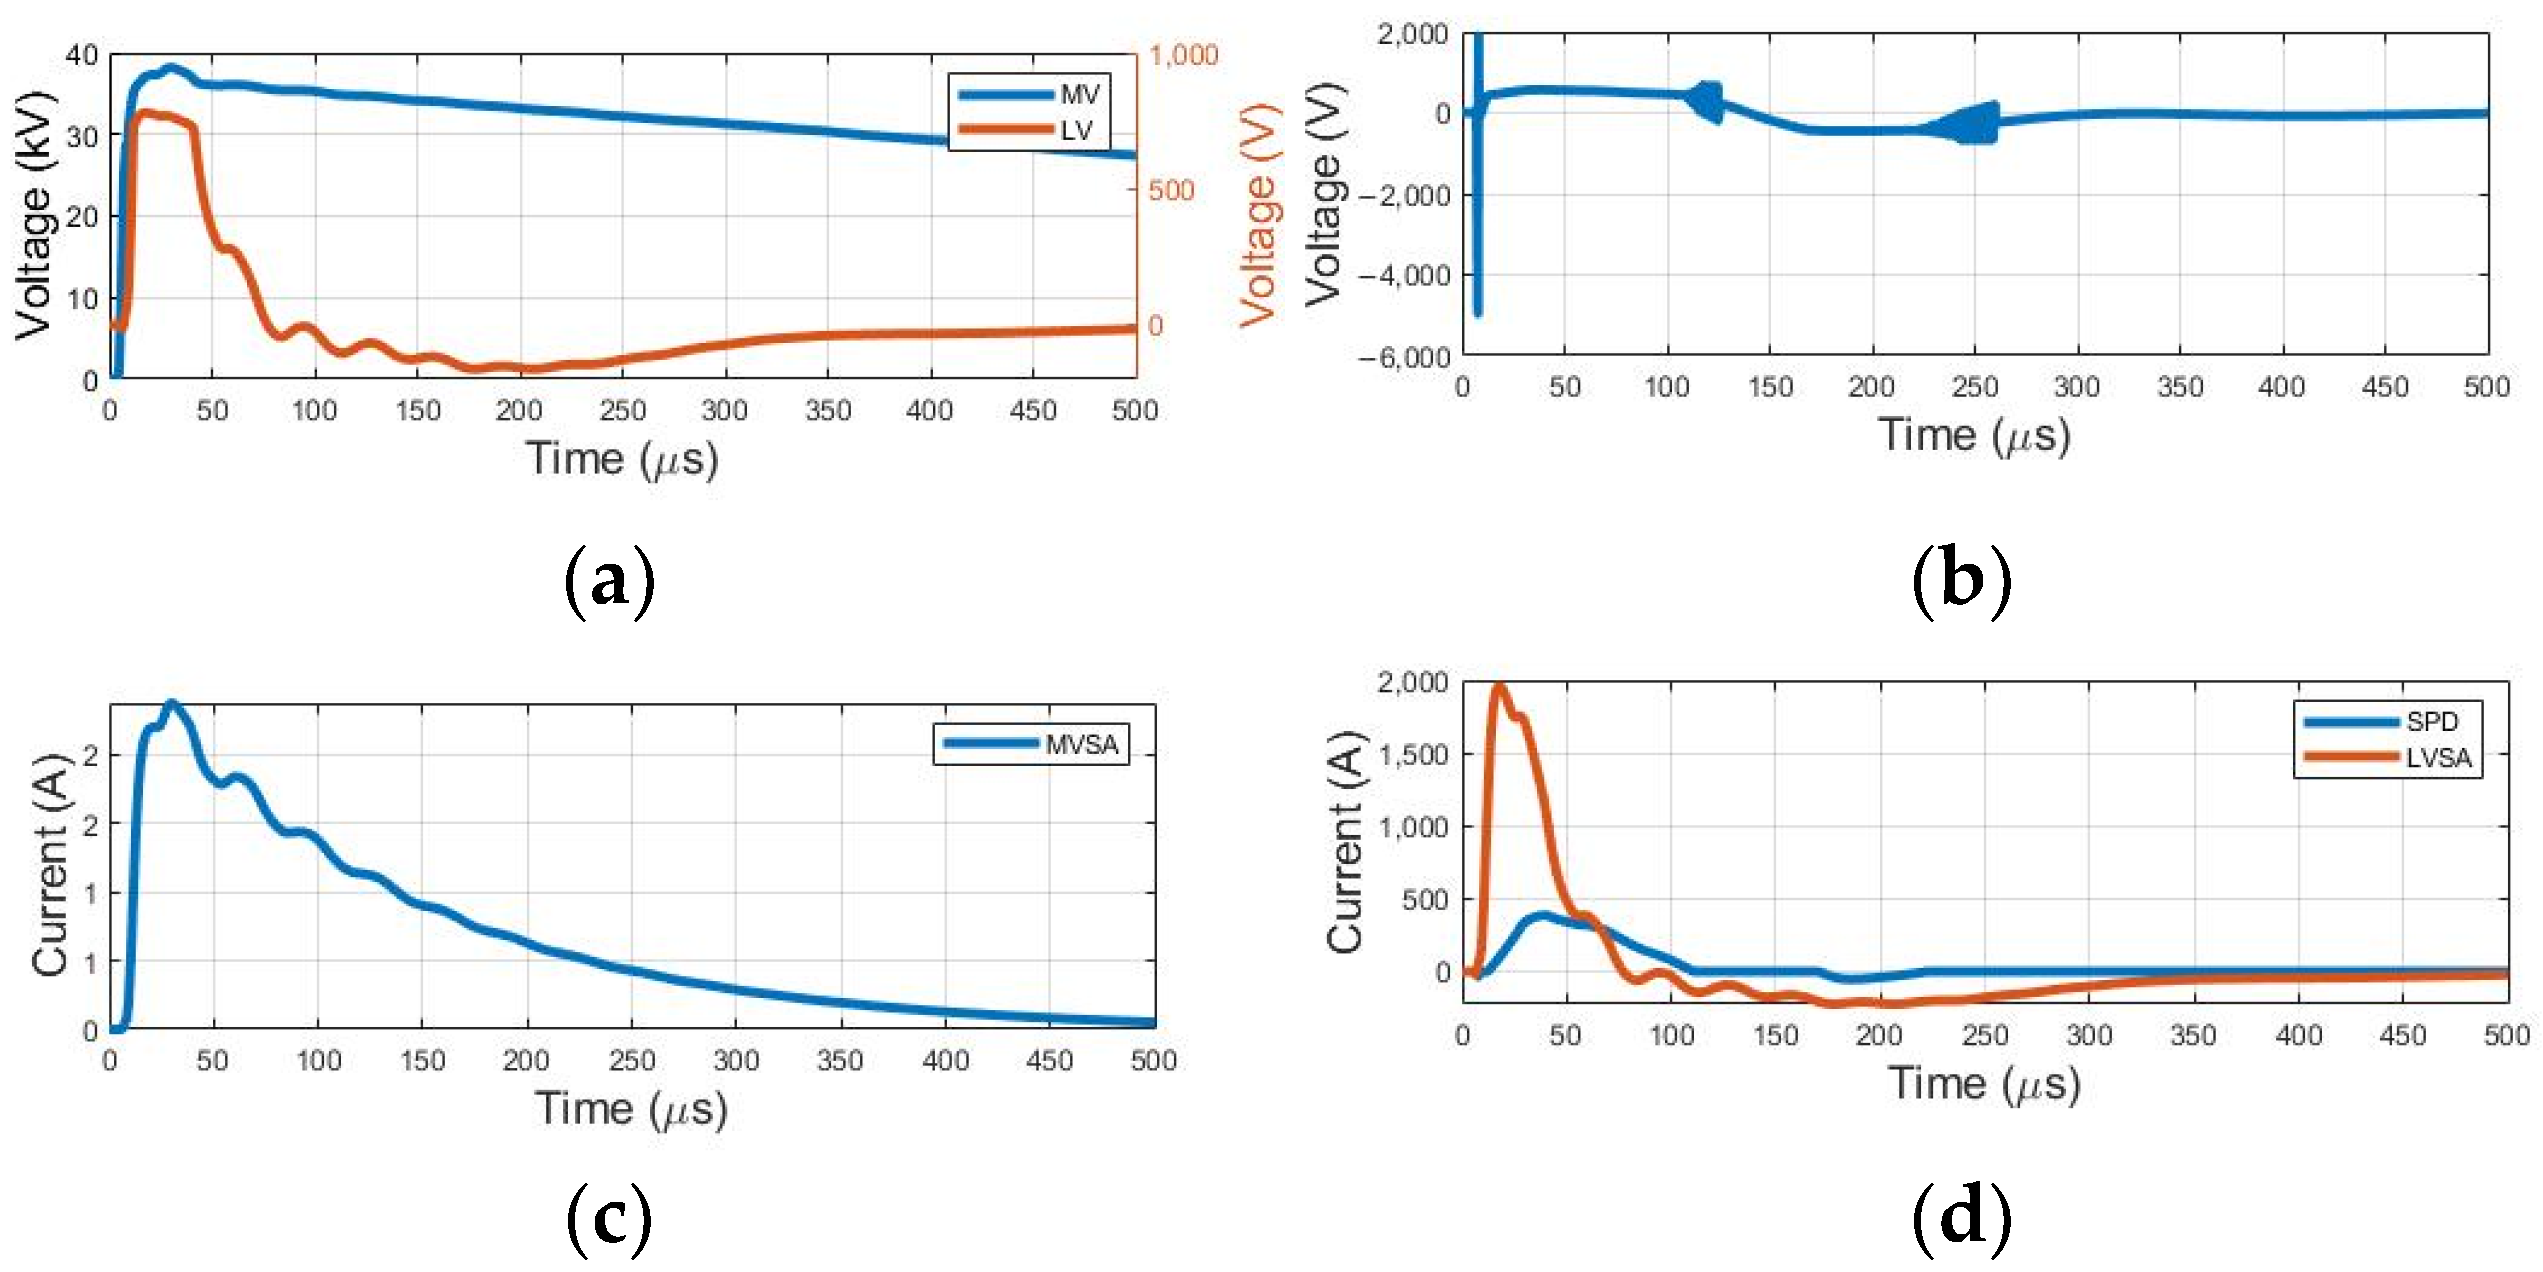
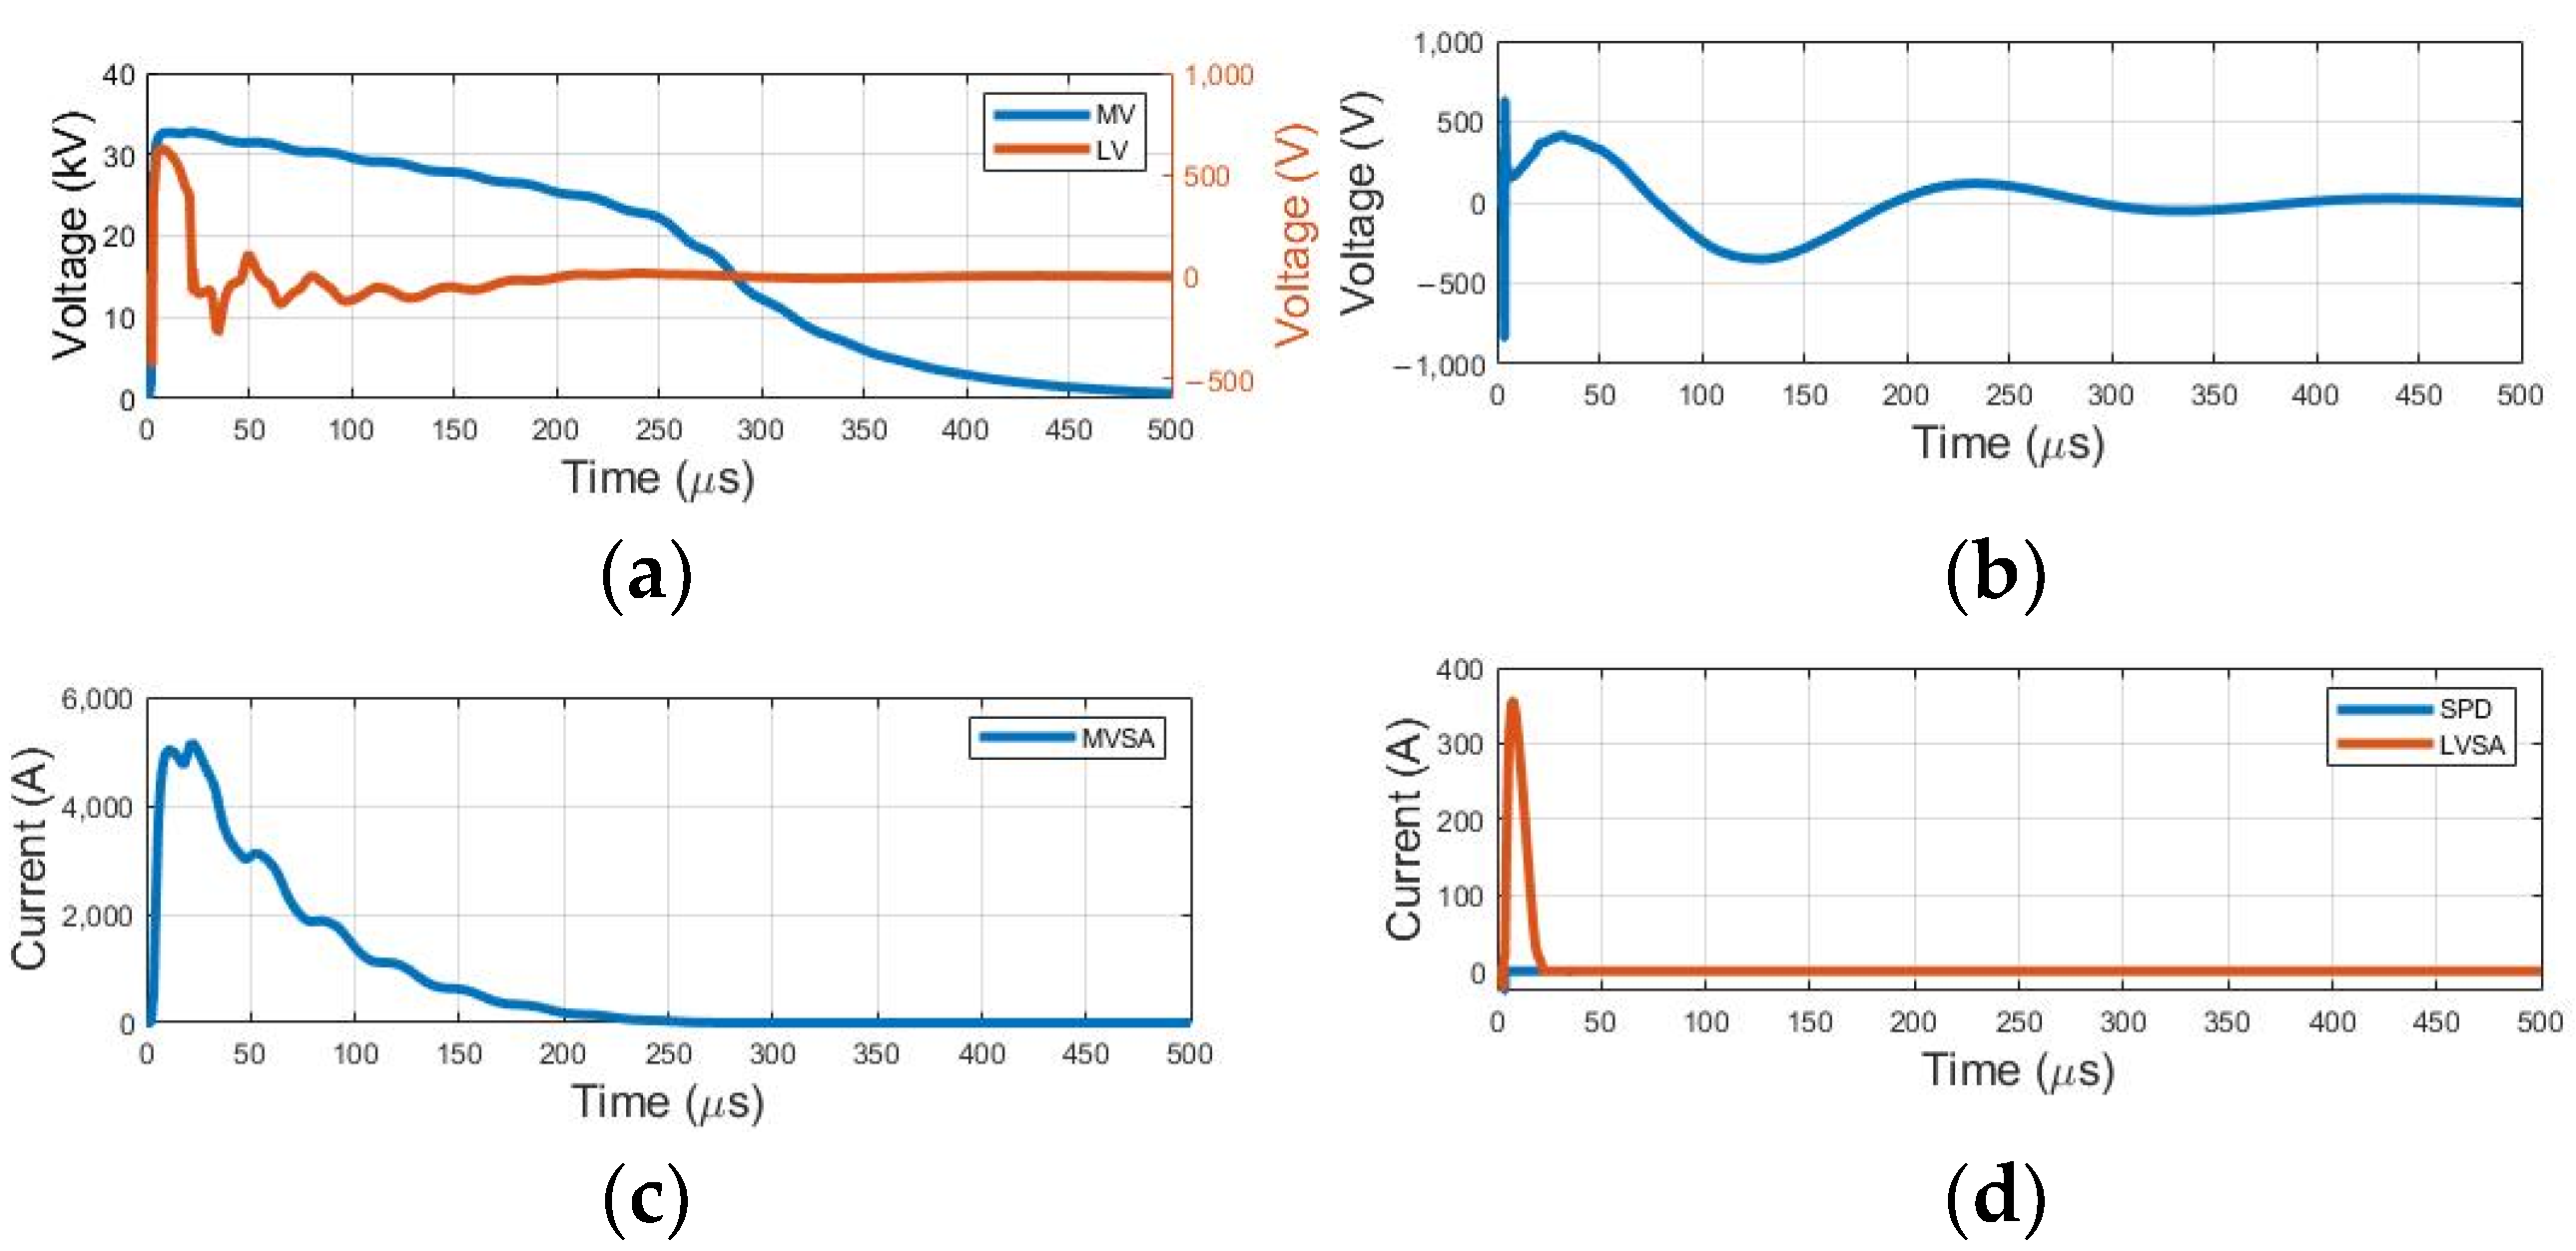
Surge protection devices play a crucial role in safeguarding energy distribution systems against overvoltage. Accurately assessing the effectiveness of these devices is essential to ensure the safety of electrical equipment and related structures. After evaluating the Type 99 model, the performance of the Type 92 and MOV models are analyzed. However, the inserted curves are the same as those of the reference model indicated in Figure 3. In Figure 10, the results obtained with the implementation of the surge arrester with the variable resistor Type 92 can be observed, while the maximum values obtained are presented in Table 7.
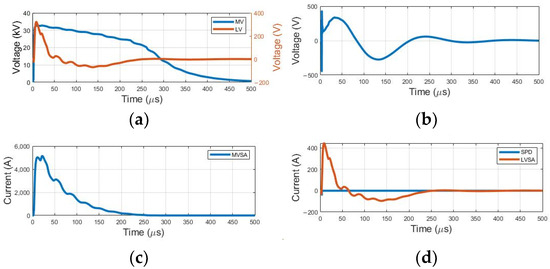
Figure 10.
Voltage and current waveforms for Type 92: (a) voltage at transformer terminals; (b) voltage at the input of the consumer; (c) current in MVSA; (d) current in SPD and LVSA.
Table 7.
Maximum voltage values: surge arrester Type 92.
The waveforms shown indicate that the Type 92 surge arrester does not produce significant changes in the waveforms but leads to a substantial reduction in the maximum overvoltage levels reaching the consumer.
The waveforms obtained for the MOV-type implementation model can be seen in Figure 11, while the maximum values obtained are presented in Table 8.
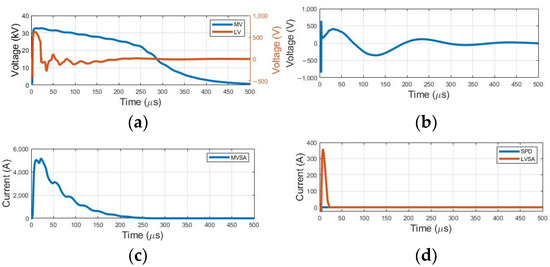
Figure 11.
Voltage and current waveforms for Type MOV: (a) voltage at transformer terminals; (b) voltage at the input of the consumer; (c) current in MVSA; (d) current in SPD and LVSA.
Table 8.
Maximum voltage values: surge arrester Type MOV.
Regarding the MOV Type model, the consideration about the overvoltage level at the consumer remains, but there is also a distinct variation in the surge arrester’s current waveform, showing some noticeable oscillations.
4.6. Concrete Poles
Concrete poles are essential for supporting networks; however, their representation is sometimes overlooked. Therefore, besides incorporating these poles into transient simulations of distribution networks, we will also assess the impact of altering the defined impedance values for the poles using an analytical method, comparing it with a method where impedance values were obtained through simulation. The results of the overvoltage waveform obtained for the implementation of simulated impedance values can be observed in Figure 12.
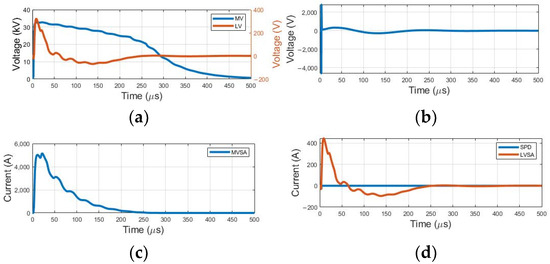
Figure 12.
Voltage and current waveforms: the impedance of the concrete pole are obtained through simulation. (a) Voltage at transformer terminals; (b) voltage at the input of the consumer; (c) current in MVSA; (d) current in SPD and LVSA.
The maximum values obtained are shown in the Table 9.
Table 9.
Maximum voltage values: concrete pole.
When analyzing the waveforms presented in Figure 12 and the maximum values indicated in Table 9, it is evident that the overvoltage levels in the networks will remain very high. This suggests that, like the reference model, the overvoltage levels in the spans of the distribution network are prone to electrical discharges, surpassing the network’s CFO limit and resulting in its shutdown.
4.7. Insulators
Insulators are essential components within distribution networks, serving to maintain a safe distance between energized cables and structures. Additionally, they play a vital role in mitigating the effects of lightning discharges. In fact, insulators are the primary components responsible for defining the insulation levels of networks today.
The waveform results can be observed in Figure 13, while the maximum values obtained are shown in Table 10.
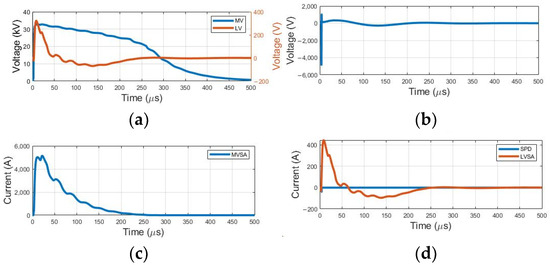
Figure 13.
Voltage and current waveforms: CFO; (a) voltage at transformer terminals; (b) voltage at the input of the consumer; (c) current in MVSA; (d) current in SPD and LVSA.
Table 10.
Maximum voltage values: CFO.
Analyzing the graphs in Figure 13 and the maximum values from Table 10, it becomes evident that reducing the CFO level can lead to increased network interruptions due to electrical discharges. Employing an imprecise calculation method for insulation can yield results inconsistent with real-world events. The decrease in overvoltage levels occurred due to the reduced capacity of the insulators, as indicated by the lower CFO.
4.8. Consumer Installations
Consumers play a vital role in power distribution systems, making their accurate representation critically important. After analyzing the outcomes with Model 1, Model 2 is introduced to assess its impact on overvoltage levels. The resulting waveforms can be observed in Figure 14, while the maximum values attained are detailed in Table 11.
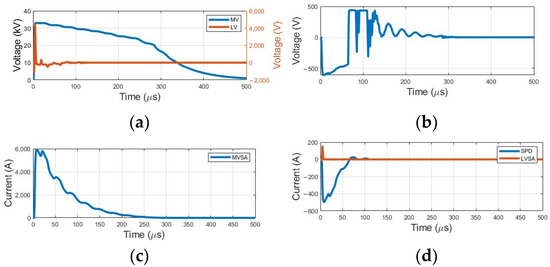
Figure 14.
Voltage and current waveforms: consumer. (a) Voltage at transformer terminals; (b) voltage at the input of the consumer; (c) current in MVSA; (d) current in SPD and LVSA.
Table 11.
Maximum voltage values: consumer.
The maximum voltage and current levels achieved differ from those obtained in the reference model. There was a reduction in current levels at SPD but a significant increase in the LVSA and MVSA levels. Regarding voltage levels at the transformer’s MV terminals, they remain similar due to the presence of lightning arresters and their operating curve. The waveforms that underwent the most significant changes were those of voltage at the consumer’s input and at the transformer’s LV terminals, and they were also the ones that experienced the most alterations concerning the maximum voltage levels. This highlights the importance of implementing accurate consumer models, as they significantly impact the impedance levels in distribution systems, resulting in changes in the maximum levels reached and in waveform characteristics.
4.9. Grounding Systems
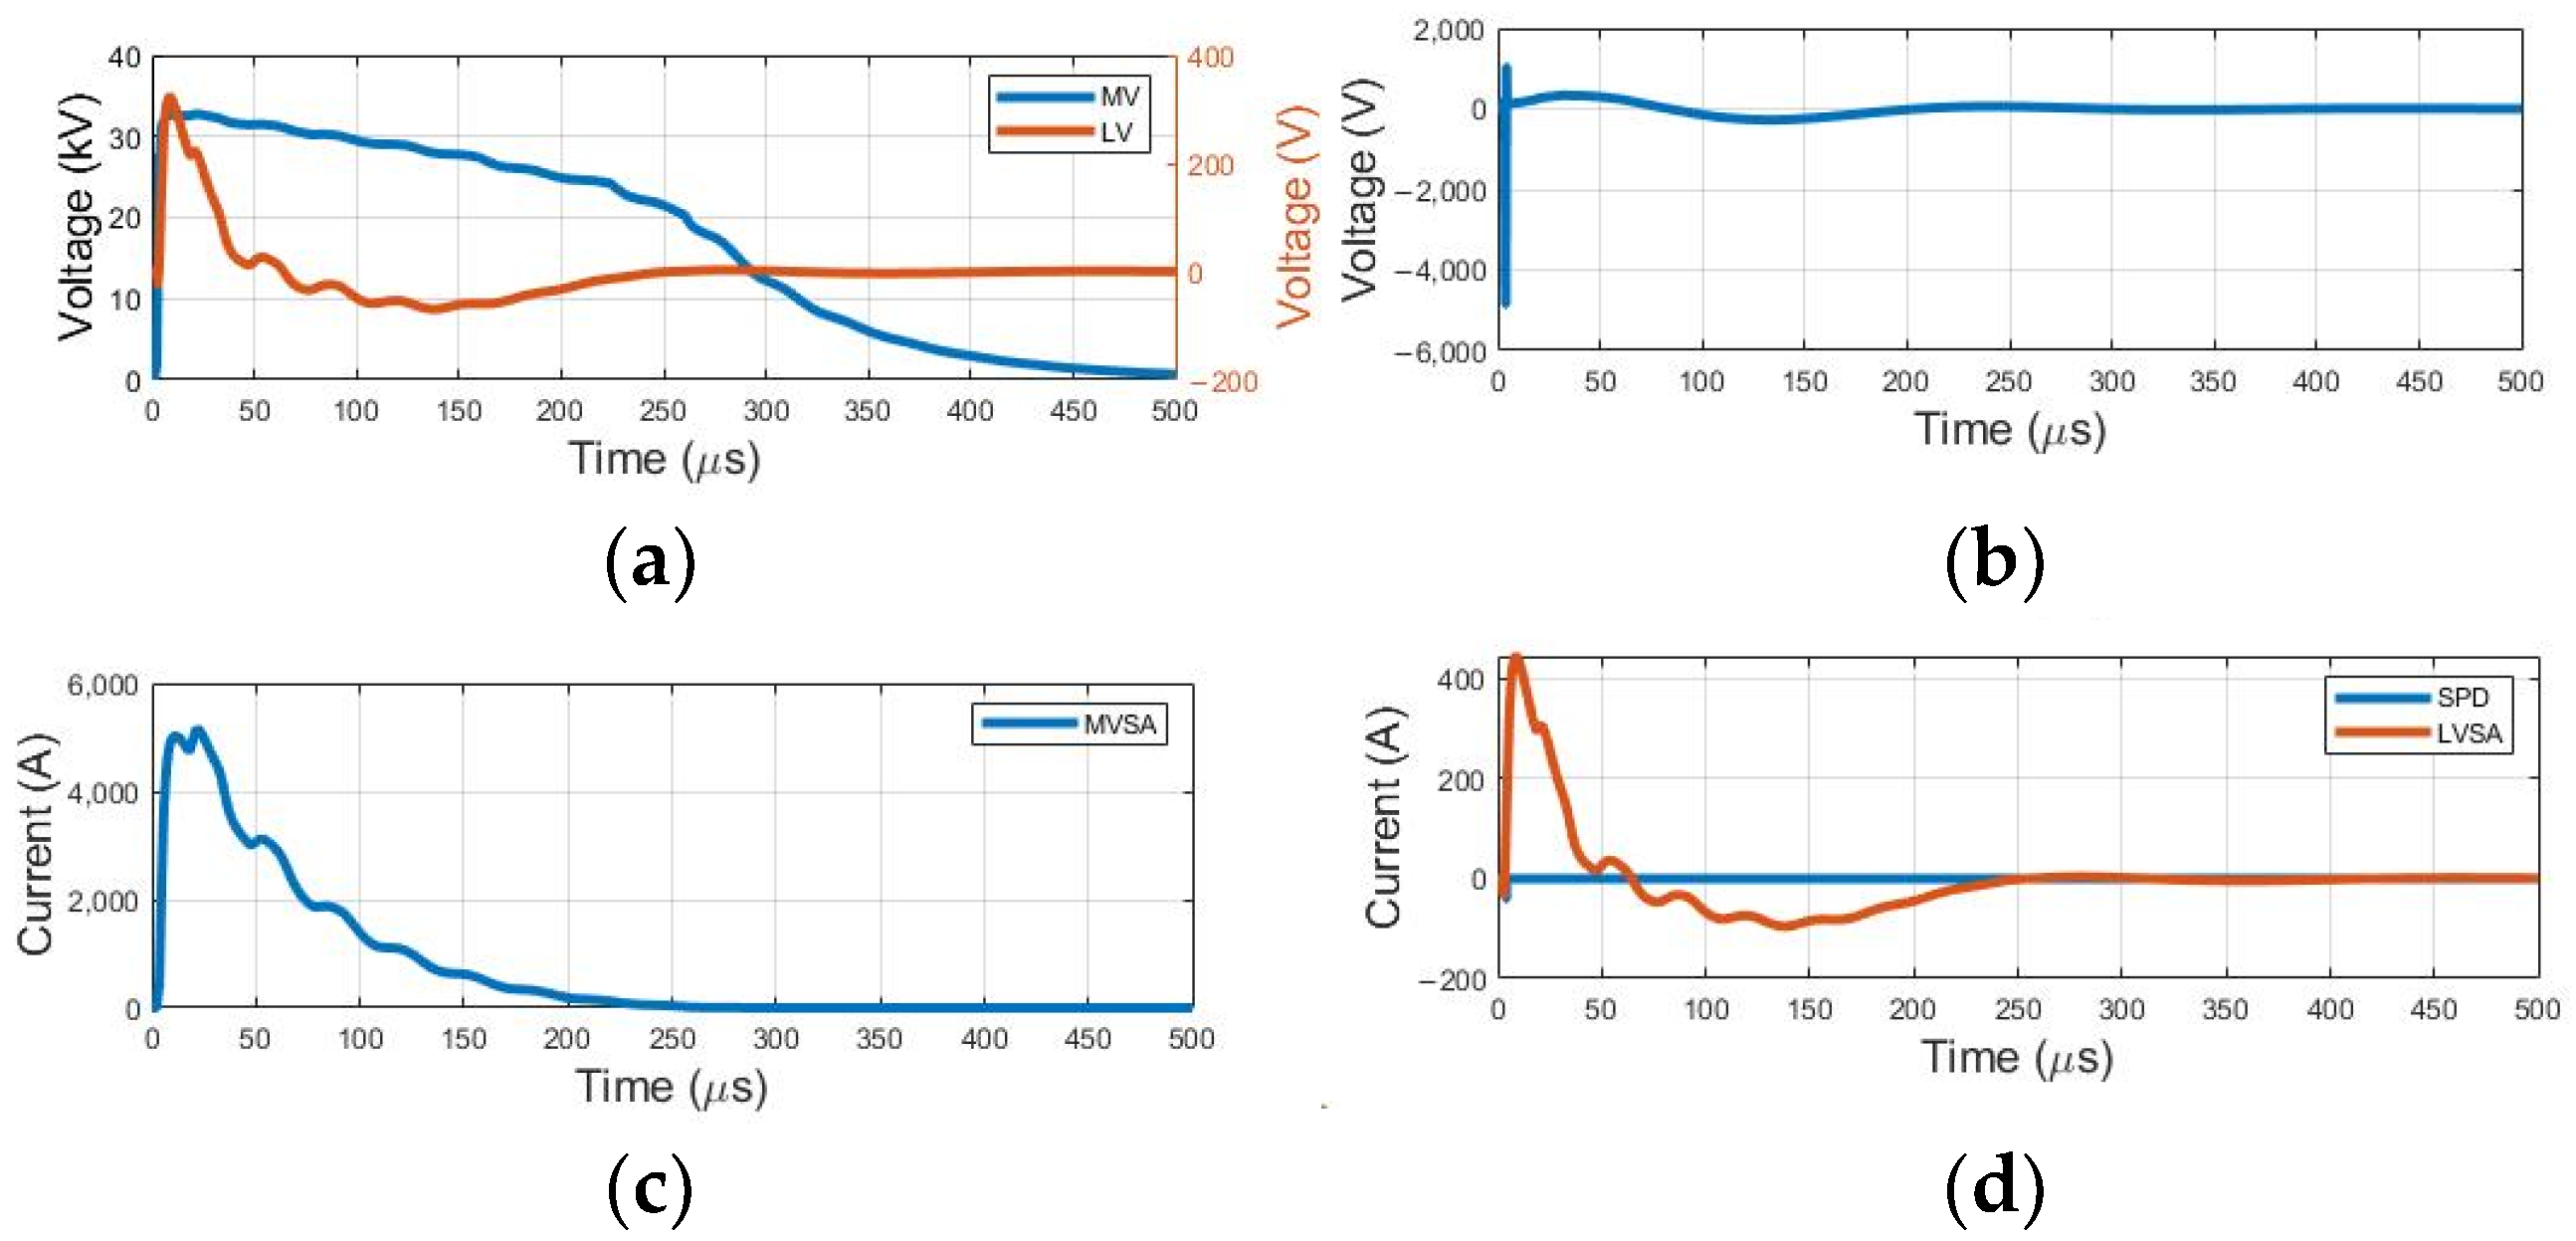
Grounding systems are important for safeguarding energy distribution networks against overvoltage. Accurately assessing their effectiveness is essential to ensure the safety of electrical devices and infrastructure. Therefore, the networks’ performance was evaluated using a fixed grounding resistance value and variable impedance with frequency. The waveform results are depicted in Figure 15, while the maximum values obtained can be found in Table 12.

Figure 15.
Voltage and current waveforms: grounding systems. (a) Voltage at transformer terminals; (b) voltage at the input of the consumer; (c) current in MVSA; (d) current in SPD and LVSA.
Table 12.
Maximum voltage values: grounding systems.
The waveforms for the grounding system models closely resemble those of the reference model. However, the maximum voltage and current levels achieved were lower than those in the reference model. This reduction is evident in MV and LV lightning arresters, as well as in the SPD installed at the consumer’s measurement entry, indicating a significant decrease in maximum current levels. Additionally, there was a decrease in the maximum voltage levels at the transformer terminals and at the consumer’s measurement point. Evaluating these impacts is crucial to ensure adequate protection and extend the lifespan of safety equipment.
5. Discussion
In the discussion of the results, it is essential to emphasize fundamental aspects that emerged during the analysis of the simulations.
The changes in the lightning waveforms lead to an increase in the duration of equipment exposure to high voltage levels, which can result in greater energy absorption by the equipment and, consequently, lead to failures or a reduced lifespan. Increasing the amplitude of the discharge current also causes higher maximum levels of voltage and current, affecting the previously mentioned time parameters and presenting additional challenges.
The modification in the transformer circuit resulted in minimal changes in waveforms, and the maximum values of voltage and current remained practically unchanged. However, upon analyzing the circuit, it was observed that the transformer does not transfer overvoltage through the windings but rather through the elevation of the neutral potential via the MVSA. In other words, the overvoltage transfer circuit should not affect the maximum levels of voltage and current. Despite this, it is crucial to consider the representation of a circuit, as its absence can alter the system’s impedance values and, consequently, impact the currents in the equipment. Therefore, among the available model options, Model 1 is suggested for offering more configuration options for different power levels.
In the analysis of waveforms for the two types of surge protectors, no significant changes were identified in the waveforms and maximum overvoltage values. However, when evaluating these quantities, especially the voltage at the consumer, a significant reduction is noted compared to the reference type (Type 99), making the tested models more suitable, as they align with the expected results in the VxI curve.
Regarding concrete poles, the modification results in practically imperceptible differences, both in waveforms and maximum levels. Although the tests indicate a slight disparity in the results, the recommendation is to use values calculated through simulation. This method encompasses a broader range of parameters for calculating the pole’s impedance, especially when implementing a structure involving multiple low- and medium-voltage poles, which could lead to different conclusions.
The insulation level of the network, as tested in this article, should not cause significant changes in maximum overvoltage levels or waveforms. This is due to the application of the lightning on the pole preceding the transformer span, resulting in extremely high levels of overvoltage at the surge arrester terminals in both implemented situations. In this brief evaluation, no significant differences were identified in overvoltage values and waveforms. However, despite this, the recommendation persists for using the DE method to determine the dielectric breakdown values of the insulator.
The implementation of the grounding system from different approaches revealed that the results obtained for this representation model did not generate significant changes in the waveforms of the originally established model. Although some discrepancies were identified in the maximum values, these did not reach considerably divergent levels. Implementing a variable resistance to represent the grounding rods is a complex task, requiring extensive knowledge in soil parameter analysis methods and the application of external routines to create a file for implementation in ATP. Additionally, many available programs are designed for rods with lengths of 5 m or more, common dimensions in high-voltage lines, while medium- and low-voltage distribution networks (less than 13.8 kV voltage) typically require smaller dimensions, necessitating adaptations in these routines, which is not a simple task. In this context, the recommendation is to opt for an existing routine that complies with the simulation’s technical specifications, if readily accessible. However, in the absence of such a routine, the analytical equations provided in this article enable simulations capable of producing satisfactory results.
6. Conclusions
In summary, this study highlights the importance of understanding and optimizing some components of medium- and low-voltage distribution networks to address electromagnetic transients more effectively. By simultaneously analyzing various models, researchers and professionals can gain significant insights into the behavior of distribution systems under different conditions. This approach contributes to making developing electrical networks more reliable.
The application of the proposed models in practical scenarios is recommended, evaluating their effectiveness in the feeders suggested by the IEEE guide, as well as in different implementations of lightning representation methods, assessing pole impedance and CFO levels in situations of discharges further away from surge arresters. Furthermore, we encourage future research to explore the extension of these models to different operating conditions and network configurations. The continuous improvement of these models will significantly contribute to the reliability and safety of electrical distribution networks, driving continuous advancements in the field.
Author Contributions
T.P.d.R. and A.R. equally contributed to the conception of the idea, the analysis and interpretation of results, and the manuscript’s writing. All authors have read and agreed to the published version of the manuscript.
Funding
This research received no external funding, and the APC was funded by Graduate Program in Electrical Engineering at Federal University of Santa Catarina (PPGEEL/UFSC) by the Brazilian Coordination for the Improvement of Higher Education Personnel (CAPES/PROEX) and the Federal University of Santa Catarina/Brazil (UFSC).
Data Availability Statement
Data are contained within the article.
Conflicts of Interest
The authors declare no conflicts of interest.
References
- Hernández-Sarmiento, J.G.; Moreno, P.; Loo-Yau, J.R.; Moreno-Mojica, A.E. Modelling buried cables illuminated by incident fields for electromagnetic transient analysis in the Laplace domain. Electr. Eng. 2023, 105, 3209–3217. [Google Scholar] [CrossRef]
- Kaouche, S.; Nekhoul, B. Modeling of lightning surges on a grounding system of a tower cascade. Electr. Eng. 2023, 105, 1125–1139. [Google Scholar] [CrossRef]
- Nakada, K.; Sugimoto, H.; Yokoyama, S. Experimental facility for investigation of lightning performance of distribution lines. IEEE Trans. Power Deliv. 2003, 18, 253–257. [Google Scholar] [CrossRef]
- Barradas, R.P.D.S.; Rocha, G.V.S.; Muniz, J.R.S.; Bezerra, U.H.; Nunes, M.V.A.; Silva, J.S.E. Methodology for Analysis of Electric Distribution Network Criticality Due to Direct Lightning Discharges. Energies 2020, 13, 1580. [Google Scholar] [CrossRef]
- Moraes, L.B.; Lopes, G.P.; Violin, A.; Neto, E.T.W.; Ferraz, G.M.F.; Capelini, R.M.; Salustiano, R.; Piantini, A.; Campos, J.M. Assessment of lightning overvoltages on lines with different voltages sharing the same structures. In Proceedings of the 2017 International Symposium on Lightning Protection (XIV SIPDA), Natal, Brazil, 2–6 October 2017. [Google Scholar] [CrossRef]
- Miyazaki, T.; Okabe, S.; Sekioka, S. An Experimental Validation of Lightning Performance in Distribution Lines. IEEE Trans. Power Deliv. 2008, 23, 2182–2190. [Google Scholar] [CrossRef]
- Hintamai, S.; Hokiert, J. Surge impedance of concrete pole due to effect of the electrical proprieties of concrete. In Proceedings of the 2004 IEEE Region 10 Conference TENCON 2004, Chiang Mai, Thailand, 24 November 2004; pp. 397–400. [Google Scholar] [CrossRef]
- Almeguer, H.; Coelho, R.; Coelho, V.; Nosaki, P.; Piantini, A. A Feasibility Study on the use of concrete pole bases as a grounding Topology for Distribution Systems. In Proceedings of the 2013 International Symposium on Lightning Protection (XII SIPDA), Belo Horizonte, Brazil, 7–11 October 2013. [Google Scholar] [CrossRef]
- Furgał, J. Influence of Lightning Current Model on Simulations of Overvoltages in High Voltage Overhead Transmission Systems. Energies 2020, 13, 296. [Google Scholar] [CrossRef]
- Conti, A.D.; Oliveira, V.C.; Rodrigues, P.R.; Silveira, F.H.; Silvino, J.L.; Alipio, R. Effect of a lossy dispersive ground on lightning overvoltages transferred to the low-voltage side of a single-phase distribution transformer. Electr. Power Syst. Res. 2017, 153, 104–110. [Google Scholar] [CrossRef]
- Jhala, K.; Natarajan, B.; Pahwa, A.; Wu, H. Stability of Transactive Energy Market-Based Power Distribution System under Data Integrity Attack. IEEE Trans. Ind. Inform. 2019, 15, 5541–5550. [Google Scholar] [CrossRef]
- Saric, A.; Ciric, R. Integrated fuzzy state estimation and load flow analysis in distribution networks. IEEE Trans. Power Deliv. 2003, 18, 571–578. [Google Scholar] [CrossRef]
- IEEE Std 1410; Guide for Improving the Lightning Performance of Electric Power Overhead Distribution Lines. IEEE: Piscataway, NJ, USA, 2010.
- CIGRE. Lightning Parameters for Engineering Applications; WG C4.407; CIGRE: Paris, France, 2013. [Google Scholar]
- ABNT. Proteção Contra Descargas Atmosféricas; NBR 5419; ABNT: Rio de Janeiro, Brazil, 2015. [Google Scholar]
- Chowdhuri, P.; Anderson, J.; Chisholm, W. Parameters of Lightning Strokes: A Review. IEEE Trans. Power Deliv. 2005, 20, 346–358. [Google Scholar] [CrossRef]
- Prado, A.J.D.; Jus, L.H.; Santos, M.O.; Gennaro, E.M.; Ferreira, A.A.; Pereira, T.G.; Moreira, A.C.; Menzinger, J.S.; Grilo, C.V.C.; Stieler, M.C.; et al. Application of Numeric Routine for Simulating Transients in Power Line Communication (PLC) Systems. In Emerging Waveguide Technology; IntechOpen: London, UK, 2018; pp. 351–371. [Google Scholar] [CrossRef]
- IEC 62271; High-Voltage Switchgear and Controlgear. IEC: London, UK, 2022.
- IEC 60071; Insulation Co-Ordination. IEC: London, UK, 2020.
- Piantini, A.; Kanashiro, A. A distribuition transformer model for calculating transfered voltages. In Proceedings of the 26th International Conference on Lightning Protection, Cracow, Poland, 2–6 September 2002; Volume 2, pp. 429–434. [Google Scholar]
- Fujiwara, N.; Hamada, Y.; Ootsuka, T.; Matsuoka, M. Development of pole transformer model for lightning surge analysis on low-voltage distribution lines. In Proceedings of the IEEJ Power and Energy Society Conference. 1995, p. 401. Available online: https://www.jstage.jst.go.jp/browse/ieejpes/115/0/_contents/-char/en (accessed on 8 August 2023).
- Sabiha, N.A.; Alkhammash, H.I. Performance evaluation of distribution and low-voltage networks under direct lightning flashes with paralleled triac-surge arrester. Electr. Power Syst. Res. 2023, 225, 109851. [Google Scholar] [CrossRef]
- ATPDraw—The Graphical Preprocessor to ATP. Available online: https://www.atpdraw.net/index.php (accessed on 24 August 2018).
- Application Guidelines Overvoltage Protection (LV); ABB High Voltage Technologies Ltd.: Wettingen, Switzerland, 2001.
- Surge Arrester POLIM-D—Techinical Data; ABB High Voltage Technologies Ltd.: Wettingen, Switzerland, 2018; Available online: https://new.abb.com/high-voltage/surge-arresters/medium-voltage-arresters/distribution-systems/polim-d (accessed on 5 July 2023).
- PRBT-S RDS—Datasheet; CLAMPER: Lagoa Santa, Brazil, 2019.
- Garbelim Pascoalato, T.F.; Justo de Araújo, A.R.; Leon Colqui, J.S.; Kurokawa, S.; Pissolato Filho, J. A Comparison of Frequency-Dependent Soil Models: Electromagnetic Transient Analysis of Overhead Transmission Lines Using Modal Decomposition. Energies 2022, 15, 1687. [Google Scholar] [CrossRef]
- Martinez-Velasco, B.G.J. Overview of Overhead Line Models and Their Representation in Digital Simulations. In Proceedings of the International Conference on Power Systems Transients, Rio de Janeiro, Brazil, 24–28 June 2001; pp. 24–28. [Google Scholar]
- Prikler, L.; Hoidalen, H. ATPDraw Version 5.6—User’s Manual; Norwegian University of Technology Trondheim: Trondheim, Norway, 2009. [Google Scholar]
- Zanon, F.O.; Leal, O.E.; De Conti, A. Implementation of the universal line model in the alternative transients program. Electr. Power Syst. Res. 2021, 197, 107311. [Google Scholar] [CrossRef]
- De Conti, A.; Alipio, R. Lightning transients on branched distribution lines considering frequency-dependent ground parameters. In Proceedings of the 2016 33rd International Conference on Lightning Protection (ICLP), Estoril, Portugal, 25–30 September 2016. [Google Scholar] [CrossRef]
- Reis, T.P.D.; Elias, E.P.; Coelho, V.L.; Raizer, A.; Tavares, A.A. Modeling and simulation for determining the characteristic impedance of transmission and distribution line structures. Electr. Power Syst. Res. 2022, 212, 108621. [Google Scholar] [CrossRef]
- Conti, A.; Perez, E.; Soto, E.; Silveira, F.H.; Visacro, S.; Torres, H. Calculation of Lightning-Induced Voltages on Overhead Distribution Lines Including insulation Breakdown. IEEE Trans. Power Deliv. 2010, 25, 3078–3084. [Google Scholar] [CrossRef]
- Braz, C.P.; Piantini, A.; Shigihara, M.; Ramos, M.C. Analysis of different procedures for the application of the Disruptive Effect Model to distribution insulators subject to short tail lightning impulses. Electr. Power Syst. Res. 2014, 113, 165–170. [Google Scholar] [CrossRef]
- Ancajima, A.; Carrus, A.; Cinieri, E.; Mazzetti, C. Optimal selection of disruptive effect models parameters for the reproduction of MV insulators volt-time characteristics under standard and non standard lightning impulses. In Proceedings of the 2007 IEEE Lausanne Power Tech, Lausanne, Switzerland, 1–5 July 2007. [Google Scholar] [CrossRef]
- IEC 61024-1; Protection of Structures Against Lightning. IEC: London, UK, 1998.
- Ghoneim, S.; Hoballah, A.; Sabiha, N. Framework for optimal grounding system design concerning IEEE standard. Electr. Eng. 2019, 101, 1261–1276. [Google Scholar] [CrossRef]
- Ishimoto, K.; Tossani, F.; Napolitano, F.; Borghetti, A.; Nucci, C.A. Influence of the Electromagnetic Pulse on the Overvoltages Due to Direct Lightning to Lines over Soils with Different Ground Conductivity. In Proceedings of the 2021 35th International Conference on Lightning Protection (ICLP) and XVI International Symposium on Lightning Protection (SIPDA), Colombo, Sri Lanka, 20–26 September 2021. [Google Scholar] [CrossRef]
- IEEE Std 142; IEEE Recommended Practice for Grounding of Industrial and Commercial Power Systems. IEEE: Piscataway, NJ, USA, 2007.
- Alipio, R.; Schroeder, M.; Afonso, M.; Oliveira, T.; Assis, S. Electric fields of grounding electrodes with frequency dependent soil parameters. Electr. Power Syst. Res. 2012, 23, 476–488. [Google Scholar] [CrossRef]
- IEC 61089; Round Wire Concentric Lay Overhead Electrical Stranded Conductors. IEC: London, UK, 1991.
- IEC 60811; Electric and Optical Fibre Cables. IEC: London, UK, 2017.


Disclaimer/Publisher’s Note: The statements, opinions and data contained in all publications are solely those of the individual author(s) and contributor(s) and not of MDPI and/or the editor(s). MDPI and/or the editor(s) disclaim responsibility for any injury to people or property resulting from any ideas, methods, instructions or products referred to in the content. |
© 2024 by the authors. Licensee MDPI, Basel, Switzerland. This article is an open access article distributed under the terms and conditions of the Creative Commons Attribution (CC BY) license (https://creativecommons.org/licenses/by/4.0/).