Abstract
Energy poverty, defined as difficulty meeting the minimum requirements for a thermal environment, is becoming a significant social issue. To provide efficient welfare services, information provision and monitoring are required. However, characteristics of energy poverty, such as inconsistent residential patterns, small living spaces, and limited electricity and telecommunication resources, lead to a lack of information. This research introduces the empirical results of the development of the system. Based on the feedback from welfare workers and experts supporting energy poverty, a monitoring system combining various sensors was prototyped. This system measures temperature, humidity, illuminance, air velocity, CO2, black bulb temperature, occupancy, and noise and generates indicators for occupancy and thermal environment monitoring. Applicability assessment was conducted across 55 energy poverty households in Korea during the duration of cooling and heating. Subjects were living in spaces averaging 6.3 sqm within buildings over 43 years old and renting on a monthly or weekly basis. Electricity and communication are partially supplied. Based on the actual measurement data and field surveys, the configuration of an energy poverty monitoring system was proposed. In particular, the applicability of the simple methodology for the determination of black bulb temperature, metabolic rate, and clothing insulation required for a thermal environment evaluation was assessed. The proposed system can be efficiently used for taking care of energy poverty where the installation of conventional monitoring systems is restricted.
1. Introduction
Energy poverty refers to the stratum of society unable or struggling to consume the energy required to meet minimum heating and cooling requirements [1,2]. The social issue of energy poverty has become more prominent with the frequent occurrence of abnormal weather due to global warming, such as heatwaves and cold snaps. This group predominantly comprises those with lower incomes, older individuals, and those in poor health [3]. Their residential buildings are often old and thermally inefficient, directly affected by solar radiation [3]. Due to equipment or financial constraints, many lack adequate heating and cooling appliances, exposing them to the risks associated with extreme weather.
Various welfare activities are conducted to prevent heat-related illnesses in those with energy poverty and provide economic support [4]. Welfare workers deliver goods and food for heat illness prevention and conduct health management through visitation surveys for energy poverty individuals. However, these caring services face challenges in efficient delivery for various reasons. The employment of energy poverty individuals is primarily casual with irregular working hours [5]. They often spend time in shelters during summer and winter due to the absence of heating and cooling appliances. Furthermore, their limited access to mobile phones hinders visit scheduling for welfare goods distribution and consultation. The lack of personnel to manage these individuals and the frequent absence of targets during welfare worker visits complicate the efficient provision of services.
The rapid advancement of IoT and sensor technologies provides a foundation to solve these problems. Research utilizing IoT-based sensor networks to monitor thermal environments, power [6,7,8,9,10,11], and healthcare [12,13,14,15] is actively ongoing [16]. Cabra et al. [12] developed a system utilizing an IoT-based wireless sensor network to monitor temperature and humidity in medical environments. The system, designed for low cost and low power, was integrated and operated with cloud services providing real-time monitoring, log file management, report generation, and alarm functionalities. Through alpha and beta testing, the system’s power consumption, reliability, and its positive impact on the daily routines of medical professionals were evaluated, demonstrating the significant impact of IoT monitoring systems on medical environments. Kim et al. [14] proposed an IoT-based monitoring platform aimed at reducing health risks for workers operating at high temperatures. The health risk levels of the workers were assessed based on data obtained from wearable smart bands, which included skin temperature. The reliability of the system in indoor and outdoor environments was verified, confirming its role as an effective tool in preventing accidents that may occur at high temperatures.
The application of these technologies in various fields is increasing, particularly in addressing energy poverty. Pollard et al. [17] conducted thermal environment monitoring to assess whether increasing awareness of indoor temperatures could improve the health and welfare of those in energy poverty. They installed thermometers in 34 households from 2016 to 2017, measuring indoor temperatures every 30 min. The measured temperature data, along with health-related survey results, were used in the study. The contribution of this study is that it confirms that simple thermal environmental monitoring can play an important role in managing chronic health conditions in winter and increasing the sustainability of healthcare systems. Hurst et al. [18] proposed a method to detect energy poverty using IoT sensor networks. Gas usage patterns collected from smart gas meters were analyzed using decision trees to determine individual households’ energy poverty status. Fergus and Chalmers [19] suggested monitoring the risk of energy poverty using smart meters, data on consumer access to devices, and machine learning. This approach helped detect early signs of financial difficulties in individual households, identifying when welfare services were needed. Díaz et al. [20] proposed a method to detect energy poverty using IoT sensor networks capable of humidity measurement and linguistic protoforms. The thermal environments measured in individual households were automatically converted into linguistic expressions and provided to experts, enabling them to more efficiently determine whether a household was experiencing energy poverty. The contributions of [18,19,20], which propose methods for identifying energy poverty households, are valuable in that they are needed to ensure that energy poverty households are not marginalized and that they receive accurate and early assistance. Other studies [21,22] have also attempted to address energy poverty issues using power and thermal environment monitoring tools and power contract statuses. Maturana [21] analyzed collected data to propose changes in power contracts for individual households, potentially saving 10–40% in annual power bills. Ortiz et al. [22] compared energy poverty and non-poverty households based on collected data, analyzing indoor environment comfort and providing health management recommendations. Considering the scarcity of cases characterizing energy poverty households from the perspectives of thermal comfort and indoor air quality, this study contributes by offering relevant insights. López-Vargas et al. [16] improved upon previous studies’ focus that was solely on energy consumption for detecting energy poverty by utilizing thermal environment monitoring. The developed IoT-based thermal environment monitoring system measured indoor temperature, relative humidity, air quality, and lighting levels hourly, aiding in energy poverty detection. While various studies applying IoT sensor networks have been conducted, they primarily focus on identifying energy poverty. Cases utilizing IoT sensor networks to provide better caring services from a welfare perspective for energy poverty are scarce.
While numerous IoT-based monitoring studies and significant technological advancements exist, monitoring systems designed to support energy poverty households need to be specifically tailored to their harsh situations and the consequent limited measurement conditions. However, there is a lack of research in this area, and challenges remain in addressing energy poverty, such as installing and maintaining sensor systems that involve issues like network communication, environmental conditions at sensor installation sites, and power supply. Therefore, this study analyzes the results of implementing an IoT monitoring system in 55 actual energy poverty households and proposes a support system based on the IoT sensor networks to enhance the efficiency of energy poverty caring services. The proposed system can be implemented as a low-cost wireless sensor network in energy poverty households, allowing efficient support (goods distribution, healthcare, etc.) based on collected data (occupancy, thermal environment monitoring data, etc.).
2. Proposed System
2.1. System Requirements
Typical welfare activities for energy poverty include managing heat-related illnesses and providing support materials for situations like heatwaves and cold snaps. To enhance the efficiency of such welfare activities, the system proposed in this study must first understand the characteristics of energy poverty and derive suitable system requirements. Basic requirements were set based on the characteristics of monitored households identified through field visits, interviews with residents, and discussions with welfare managers, leading to system implementation. Subsequent pilot testing with five households helped refine these requirements by addressing identified issues. The following are the derived characteristics and required conditions for the system:
- Characteristics: Most energy poverty individuals work in casual jobs, leading to irregular occupancy times. They also have low usability of and access to mobile phones, complicating scheduling visits for welfare goods distribution and consultation.Requirements: A display must be equipped on the sensor node to notify households of the welfare worker’s planned visit and display announcements, helping users with limited phone access to recognize this information easily. Additionally, the system should be able to detect the occupancy status of the target households to schedule visits efficiently.
- Characteristics: Target individuals live in densely built areas with unreliable network access, such as Wi-Fi.Requirements: An independent network construction is necessary for the system. The Long Range (LoRa) communication protocol, which offers better penetration capabilities than Wi-Fi, BLE, and ZigBee, should be used to minimize interference between buildings and provide a wide coverage. Such advantages effectively establish a sensing network even in environments with limited network access.
- Characteristics: Possession of limited power plugs and a tendency to minimize power usage due to the cost burden.Requirements: The power supply for sensor nodes should be battery-operated, and the batteries must be replaceable.
- Characteristics: Most households cannot use heating and cooling appliances due to energy costs or infrastructure limitations, often resorting to auxiliary devices such as fans or electric mats. Additionally, buildings are often old, have poor insulation, and are directly affected by solar radiation, leading to frequent occurrences of heat-related illnesses.Requirements: There is an urgent need to provide appropriate countermeasures through thermal environment monitoring. Considering these characteristics, judging occupants’ thermal comfort based solely on temperature and humidity is insufficient. As indicated in a review paper [23], assessing thermal comfort requires a comprehensive approach that includes various parameters, such as radiative heat and airflow, beyond just temperature and humidity.
- Characteristics: Residents mostly live in confined spaces of about 6 sqm.Requirements: The size of the sensor node should be minimized to occupy as little space as possible. A black bulb thermometer, for measuring indoor radiant heat, recommended by ISO 7726 [24] with a diameter of 150 mm is too bulky. So, a small black bulb thermometer should be used to make the sensor node compact and easy to install.
- Characteristics: Residents spend most of their time sitting or lying down watching TV with less movement than average households.
2.2. System Workflow
Based on the requirements identified in Section 2.1, an IoT-based system supporting energy poverty caring services was developed. The overall workflow is shown in Figure 1.
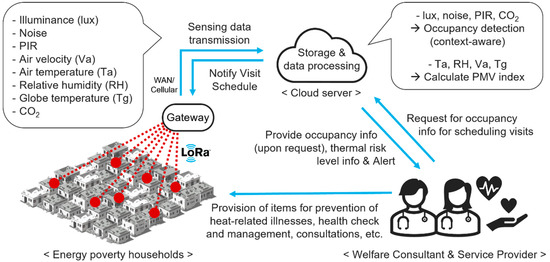
Figure 1.
System workflow.
The proposed system operates as per the following two processes.
(1) Data Collection and Transmission
The proposed system collects real-time data from multiple sensor nodes installed in households affected by energy poverty. These nodes measure thermal environment data, such as dry-bulb temperature, relative humidity, air velocity, and black bulb temperature, and also include sensors for detecting occupancy. Detailed descriptions of the types of sensors used in the sensor nodes are provided in Section 2.3. Each node operates independently using its battery, and the batteries are replaced by social workers or consultants who visit periodically. The sensor nodes use the low-power LoRa communication protocol to transmit the measured data to a gateway. The LoRa is effective for data transmission in urban environments due to its low power consumption and excellent long-range communication capabilities. This communication method minimizes interference between buildings in densely populated energy poverty areas and ensures stable data transmission. The gateway transmits the collected data from multiple nodes to the cloud server via wide-area network (WAN) or cellular networks.
(2) Data Processing and Utilization
The cloud server stores and processes the transmitted data. Data processing includes calculating the thermal comfort index and determining occupancy status. The Predicted Mean Vote (PMV) is used as the thermal comfort index. The PMV evaluates the thermal sensation of occupants, quantifying how people feel in a given thermal environment [25]. The PMV index is calculated using data such as dry-bulb temperature, relative humidity, air velocity, and black bulb temperature and is used to assess the thermal risk levels in households affected by energy poverty. Additional inputs required for the PMV index calculation, such as clo (clothing insulation) and met (metabolic rate), are set based on the opinions of social workers with extensive experience visiting energy poverty households and can reflect seasonal characteristics. The derived thermal comfort data can be used for healthcare and counseling. Furthermore, if the thermal illness risk level exceeds a certain threshold in a hazardous environment, the system automatically sends an alert to the social worker. Additionally, the measured thermal environment data can efficiently determine the type and distribution timing of support items during summer and winter. Occupancy data is used to efficiently coordinate social workers’ and consultants’ visit schedules and routes. This data is sensitive personal information, so the system is configured to provide it only upon request by a social worker. Through these processes, the proposed system maximizes the efficiency of caring services for people affected by energy poverty and contributes to improving their living environments.
2.3. Sensor Node
The sensor node, a core component of the proposed system, plays a vital role in monitoring and improving the living and health conditions of households affected by energy poverty by providing real-time thermal environment and occupancy data. The sensor node comprises a microcontroller unit (MCU), thermal environment sensors, occupancy detection sensors, a LoRa wireless communication module, a display, and a battery.
Acting as the brain of the sensor node, the MCU controls various modules and handles real-time data collection and processing. After initial processing, it commands all sensors to measure, collects the sensing data, and transmits it to the gateway through the LoRa wireless communication module. Various MCUs are available on the market, but the proposed system requires one with a sufficient number of input/output pins for connecting and operating various sensors and modules and adequate storage space for libraries and algorithms for data operations.
The sensor node is equipped with humidity sensors, a black bulb thermometer, and air velocity sensors to monitor the thermal environment in energy poverty households. These sensors measure the thermal environment at 5 min intervals following MCU commands and transmit the data to the MCU. The measured data is calculated into the PMV index, which indicates the level of thermal risk in energy poverty households. The requirements for the accuracy of the thermal environment monitoring sensors vary depending on their purpose. Therefore, the accuracy requirements for each sensor can be set based on the ASHRAE Standard 55 [25]. This standard requires a sensor accuracy of ±0.2 °C for temperature, ±5% for relative humidity, ±1 °C for mean radiant temperature, and ±0.05 m/s for air velocity when measuring thermal comfort in built environments. The mean radiant temperature is a value calculated using temperature, air velocity, and black bulb temperature, and the system uses the formula provided in ISO 7726 [24] for this calculation. Considering the characteristics of energy poverty households, the black bulb thermometer, uses a 40 mm diameter model proposed by Humphreys [26]. Temperature sensors, which can be affected by heat from other sensors, should be placed at a certain height above the top of the case to minimize this influence. The installation location of the sensor node is crucial for accurate thermal environment monitoring. The ASHRAE Standard 55 [25] recommends measuring at a height of 0.6 m from the floor in a seated environment. Additionally, to prevent errors in the black bulb thermometer, which is greatly affected by radiant heat, the sensor node should be placed away from heat-generating electronic devices such as TVs, refrigerators, and electric mats.
Various sensors are mounted on the sensor node to detect the presence of occupants. Occupancy detection sensors play an essential role in energy poverty caring services. Since the working hours of the occupants are irregular, and they often spend some time in external shelters, social workers and consultants need to confirm the actual presence of occupants during visits. This confirmation helps increase the efficiency of visits and prevent the unnecessary waste of human resources. PIR sensors detect human movement and are commonly used for occupancy detection. However, there is a limitation in applying them to energy poverty households as they cannot accurately detect occupancy when there is no movement. Previous studies have researched methods to detect occupancy by combining various sensors to overcome this limitation [27,28]. Additional sensors to detect light, noise, CO2, etc., and their applicability will be discussed in Section 4 based on field surveys.
The LoRa wireless communication module is used for data transmission and reception between the sensor node and the cloud server. The MCU transmits the collected data to the gateway through the LoRa module. The LoRa communication protocol’s excellent penetration and wide coverage is suitable for the dense living environments of energy poverty households. When visits are scheduled for social workers or consultants, or other service-related notices, the corresponding data is transmitted from the cloud server and sent to the LoRa module via the gateway.
Real-time measurement results from the sensors and notices, such as social worker visit schedules, are displayed on a small display mounted on the node. This display allows users to easily check the current thermal environment status, normal operation of the sensor node, and necessary information related to service provision. The display should be mounted at a suitable distance from the temperature sensors because of their heat emissions.
The sensor node operates on its battery, making service provision possible in energy poverty households with limited access to power. The battery is designed to be easily replaceable. Social workers and administrators who visit the households periodically can easily replace the battery, facilitating system maintenance.
3. Methodology
This section describes the implementation and applicability test of the proposed system. Figure 2 describes the methodology used for developing the proposed system. To properly construct the entire system, it was essential to first deeply understand the living environments of the energy poverty households. For this purpose, the characteristics of energy poverty households were investigated by conducting interviews with welfare workers and experts. Based on the initially derived system requirements, a pilot packaging of an IoT-based measurement system was created, and pilot testing and field survey were conducted. Based on the results of the first pilot test, discussions and feedback with experts were conducted. Through this process, the system was redesigned and improved to better suit the characteristics of energy poverty households. After that, 20 improvements of the measurement system were made, and an applicability test was conducted in the winter and summer for 55 energy poverty households. Based on the results of the applicability test, the applicability of core technologies in the proposed system, such as thermal environment monitoring and presence detection methods, was analyzed, and suggestions for an IoT-based monitoring system for energy-poverty households were derived.
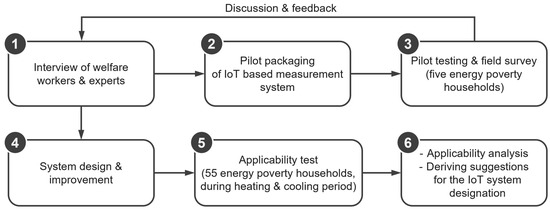
Figure 2.
Flow chart showing the procedures used for developing IoT-based energy poverty care system.
3.1. Implementation
The sensor nodes were designed to be easily installed in the confined spaces of energy poverty households, measured 230 mm long × 210 mm high × 130 mm wide, and were packaged in a tissue box, as shown in Figure 3. The case contained various modules, including an MCU, with thermal environment sensors located externally to minimize the impact of device-generated heat. The CO2 sensor was placed inside the case with an air vent to ensure air circulation. A total of 20 nodes were manufactured and used after calibration in the field tests.
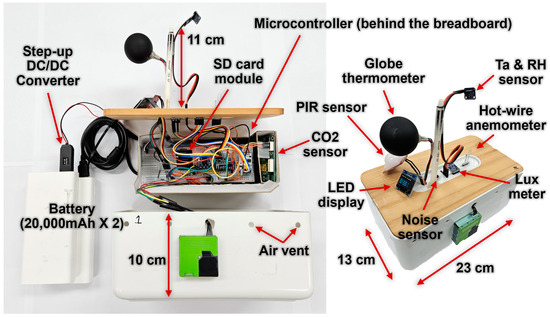
Figure 3.
Manufactured sensor node.
The Arduino Mega 2560 was used in this study. The Arduino Mega offers 54 digital I/O pins and 16 analog input pins, which are suitable for connecting and operating the various sensors and additional modules needed for the system. Its 256 KB of flash memory is sufficient for utilizing libraries for sensor and module control and embedding algorithms for data processing. The sensors used for thermal environment monitoring are listed in Table 1.

Table 1.
Sensor specifications for thermal environment monitoring.
The SHT31-D sensor, measuring dry bulb temperature and relative humidity, is space-efficient and demonstrates an accuracy of ±0.3 °C for temperature and ±2% RH for humidity, meeting the accuracy requirements of ASHRAE Standard 55 [25]. An air flow sensor that uses the hot-wire method was required to measure subtle indoor air flow. The Wind Sensor Rev.P, previously used in preliminary studies [7,29], was selected, although specific accuracy data is lacking. For the black bulb temperature, the SHT75 sensor was used, offering a high accuracy of ±0.3 °C and meeting the requirements of ASHRAE Standard 55 [25]. This sensor was fixed inside a matte black painted table tennis ball of 40 mm diameter and well-sealed to prevent air intrusion. The small, vertically elongated form factor of the sensor was conducive to installation inside the 40 mm black bulb. This design approach has been evaluated in previous studies [30,31] and deemed suitable for use in sensor nodes.
Sensors for presence detection and their specifications are shown in Table 2. Presence was primarily detected using a PIR sensor, specifically the SparkFun OpenPIR. However, PIR sensors cannot detect movement outside their field of view. Therefore, the angles of the PIR sensors were made adjustable in all directions for optimal installation. In addition, a limitation of the PIR sensors in that they cannot detect stationary individuals was addressed by incorporating CO2, illuminance and noise sensors. The SH-300-NDC CO2 sensor, using NDIR technology, measures CO2 concentration with an accuracy of ±3%. The BH1750 illuminance sensor, with a 16-bit resolution and a measurement range up to 65,535 lux, has an accuracy of ±20%, which is sufficient for detecting presence through lighting on/off status. The MAX9814 noise sensor amplifies incoming sound signals and sends them as analog signals to the MCU.

Table 2.
Sensor specifications for presence detection.
For the secure storage of measured data, an SD card module was used in this study. Data was recorded on the SD card as csv files by the MCU with timestamps included. Accurate time information was obtained using a Real Time Clock (RTC) module. A 128 × 64 resolution OLED display, SSD1306, was used to show measurements and device status. Two 74 Wh batteries were used due to the diverse voltage requirements (5 V and 9 V) of the modules operated by the sensor nodes.
Figure 4 shows the block diagram of the constructed sensor node. The MCU receives 5 V power from the battery, which it transforms to supply 3.3 V power to the humidity, black bulb temperature, illuminance, noise, and PIR sensors. The CO2 and airflow sensors, requiring 9 V, are powered by 5 V from a separate battery, which is stepped up to 9 V using a step-up DC/DC converter. Due to the various modules in use, many data input/output ports are needed. Utilizing I2C or SPI communication methods allows for transmitting various sensor data through the same port, saving the number of required ports. In the implemented sensor node, the humidity and illuminance sensors and the OLED display module used I2C communication, while the black bulb thermometer and SD card module utilized SPI communication. The airflow, PIR, and noise sensors used digital input pins, and the CO2 sensor was configured to receive analog signals via analog pins.
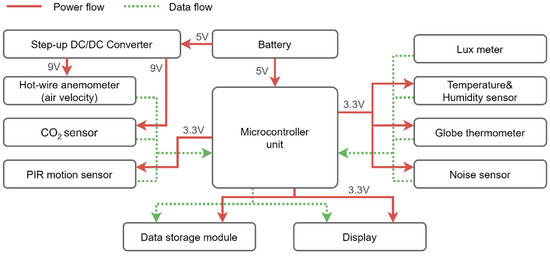
Figure 4.
Block diagram of sensor node.
Calibration was conducted for sensors that required it after the sensor nodes were constructed. The humidity, CO2, and PM2.5 sensors were excluded from calibration as they were factory-calibrated. Precise measurement is required for thermal environment monitoring sensors; thus, they required pre-use calibration. The airflow sensor was calibrated according to the manufacturer’s recommended method. First, it was fixed inside a small plastic bottle, which was then sealed to maintain a stationary state. Theoretically, the measured airflow speed in this state should be 0 m/s, and any deviation was corrected by adjusting the zero point. The black bulb thermometer, being handcrafted, required more precise calibration and validation for its potential use. In this study, the sensor was calibrated using a reference device, the Testo 480, a Class 1 type K thermocouple black bulb thermometer with a diameter of 150 mm. For calibration, the 40 mm diameter black bulb thermometer and the reference sensor were installed side-by-side at the same height in the center of the room. The experiment was conducted over 24 h, with data acquired every 5 min. Outliers caused by direct solar exposure and other factors were removed, and a linear regression analysis was applied to calibrate each black bulb thermometer.
Figure 5 is a box plot comparing the measurements of the 20 calibrated black bulb thermometers with the reference sensor values. The x-axis represents the black bulb temperature measured by the reference device, and the y-axis shows the distribution of black bulb temperatures measured by the 20 sensor nodes. The red line indicates the error range of the used sensors. The figure shows that the calibration was successful, with measurement values falling within the sensor error range.
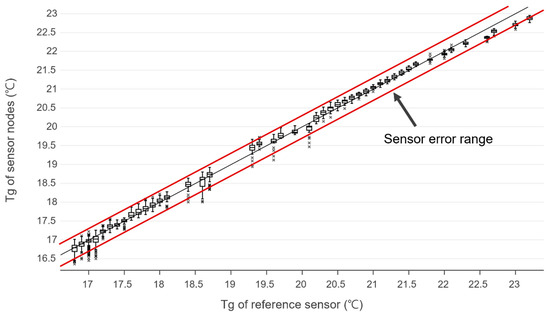
Figure 5.
Calibration results of black bulb thermometer.
3.2. Applicability Analysis
In this study, a pilot test involving 55 households was conducted using the implemented data acquisition system, based on which the applicability analysis and system improvements were carried out. The field test was conducted in Seo-gu of Daegu Metropolitan City, an area densely populated with households experiencing energy poverty. Figure 6 shows the location of the field test. These households tend to cluster in collective buildings where rent is affordable. The buildings in this area are mostly old, with living spaces divided into small rooms sufficient for minimal living. As indicated in Table 3, the target buildings have an average age of 43 years. Consequently, they had severely deteriorated insulation and air permeability in the exterior walls and window systems. They were mainly constructed with cement brick walls up to two stories high, making them vulnerable to ground infiltration and radiant heat from sunlight.
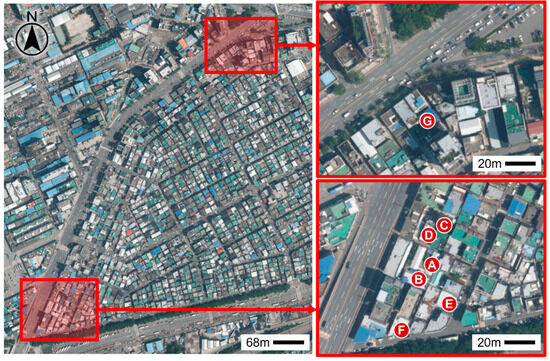
Figure 6.
Location of field test.

Table 3.
Seasonal distribution of target locations.
Table 3 shows the number of households participating in the experiment divided by season. There were 20 households in the summer and 35 in the winter, totaling 55 households. The average age of the participants was 55.4 years, and all were single-person households, except for one. Most occupants were male and worked in daily labor jobs, with an average living area of 6.3 m2.
The acquired data was handled following privacy protection and ethical considerations. To this end, cooperation was sought from the households after consulting with an organization that has been conducting welfare activities in the area for many years. The data was used exclusively for research purposes.
To minimize measurement errors, it is crucial to correctly set the installation location and method of the sensor nodes. This study established the following conditions for sensor node installation to minimize deviation: (1) distance should be maintained from electronic devices such as TVs, refrigerators, and electric mats that generate heat, as they can affect the measurement of radiant heat; (2) areas near entrances should be avoided due to the rapid changes in airflow and humidity when entering or exiting; (3) sensor nodes should be installed at approximately 0.6 m height as recommended by ASHRAE Standard 55 [25]; (4) PIR sensors should be positioned to face the areas where occupants are most active.
Field tests were conducted in July for the summer period and from January to February for the winter period. Twenty sensor nodes, created as per Section 3.1, were sequentially installed in various households. Measurements were taken every 5 min for approximately five days. Out of 55 households, sensor or equipment issues led to complete data loss in three households during summer and seven during winter. Consequently, data acquired from the remaining 45 households were utilized in this study.
Figure 7 shows the distribution of outdoor temperature and relative humidity during the field test period. Climate data were obtained from the Automated Synoptic Observing System (ASOS) observations provided by the Korea Meteorological Administration (KMA). The summer period covered 8 days, from July 24 to July 31, and the winter period covered 22 days, from January 25 to February 6 and February 13 to February 21. The summer temperatures ranged from 24.7 °C to 35.5 °C, with an average of 29.02 °C, and a standard deviation of 2.53 °C. Winter temperatures ranged from −6.9 °C to 14 °C, with an average of 2.8 °C and a standard deviation of 3.76 °C. Humidity in summer ranged from a minimum of 46% to a maximum of 98%, with an average of 74.68% and a standard deviation of 13.05%. In winter, humidity ranged from a minimum of 12% to a maximum of 97%, with an average of 45.49% and a standard deviation of 21.85%. High humidity was observed during winter when it snowed or rained, typically following a prolonged dry period. Considering that the proposed system in this study aims to support caring services for energy poverty, these hot and humid summer conditions and dry, cold winter conditions were deemed suitable for conducting field tests.
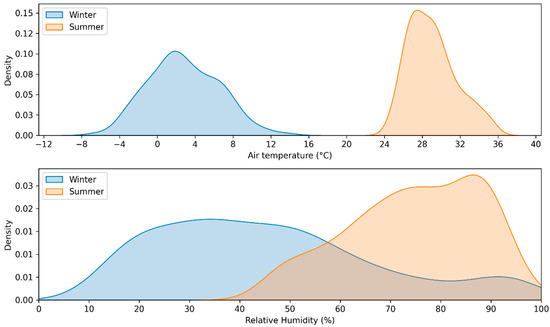
Figure 7.
Distribution of outdoor air temperature and relative humidity during the field test period.
4. Results and Discussion
In the vicinity of the sensor node installation and retrieval, outliers in measurements may occur due to the movement of the sensor nodes. Therefore, in this study, data from the day after the sensor nodes were installed were used, and measurements taken two hours prior to retrieval were excluded from the analysis. The CO2 sensor, the only analog sensor on the node, can record extremely low or high values in case of power supply issues. Consequently, CO2 measurements below 50 ppm or above 4500 ppm, deemed outside the typical measurement range, were adjusted as missing values.
As indicated in Table 4, some parameters collected by the sensor nodes showed a high missing data rate. This is attributed to power supply issues and poor connection due to complex wiring. The CO2 and air velocity sensors, which used a separate battery for 9 V power supply, showed rapid power consumption that led to earlier battery discharge, causing more missing data compared to other sensors operating at 3.3 V.

Table 4.
Data missing rate by measurement parameter.
This study uses the PMV index to assess thermal vulnerability in energy poverty households. However, obtaining consistent values for the six required parameters (temperature, humidity, black bulb temperature, air velocity, clo, met) for the PMV calculation in energy poverty monitoring is challenging. Therefore, the feasibility of alternative formulas and various approximation models was examined.
The PMV calculations were based on the pythermalcomfort module [32], following ASHRAE Standard 55 [25]. While the general range for PMV is −3 (cold) to +3 (hot), this study expressed values beyond this range to identify extreme thermal vulnerability in energy poverty households. To provide a basis for calculating clo, essential for PMV, the primary clothing amount of household members was surveyed. Out of 55 households, 53 participated, excluding the 3 that refused. Based on the insulation table in ASHRAE Standard 55 [25], the clothing insulation was converted to clo values. Table 5 shows these results, with summer having an average of 0.2 clo (light clothing) and winter averaging 0.53 clo (more substantial clothing). Notably, winter clo values showed significant variance, reflecting the characteristics of energy poverty households, which often use localized heating methods due to insufficient heating funds or infrastructural limitations. It leads to observations of both lower and higher clo values. So, it is challenging to accurately assess the thermal environment using winter clo values alone.

Table 5.
Survey results on clothing insulation.
This study evaluated the use of a formula for representative clothing insulation based on outdoor temperature, as suggested by Schiavon and Lee [33] and described in ASHRAE Standard 55 [25]. Using outdoor temperature at 6 am, this formula was deemed suitable for winter clo calculation. Figure 8 compares the PMV values calculated using this formula (clo_tout) and the average clo from the survey. In summer, the difference between the two groups’ average values was minimal (0.24), while in winter, the difference was significant (1.21), which is consistent with the survey’s average clo of 0.53. However, the formula assumes a clo of 1 at temperatures below −5 °C. So, the formula is appropriate for winter clo estimation and is suitable for the system proposed in this study, offering versatility and applicability beyond the surveyed sites.
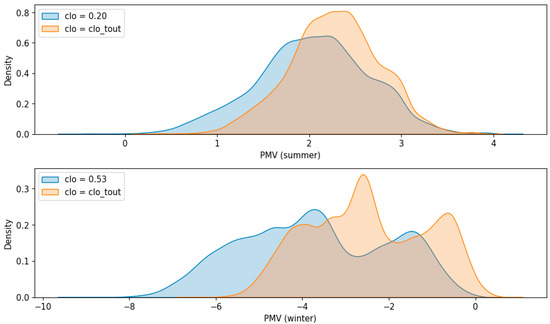
Figure 8.
PMV distribution differences based on clo setting method (clo_tout: clo set according to outdoor temperature).
The average living space of the surveyed households was 6.3 m2 and predominantly involving sedentary or lying-down activities. According to ASHRAE Standard 55 [25], a resting seated position has a met of 1.0, which is considered representative of the metabolic rates of energy poverty households and used for the PMV calculations in this study.
The distribution of PMV by location is shown in Figure 9. In summer, the PMV values showed an average of 2.27, a standard deviation of 0.49, a minimum of 0.27, and a maximum of 3.9. Approximately 6.4% of the total data samples exceeded a PMV of 3 (hot), raising concerns about heat-related illnesses such as heatstroke and prickly heat due to thermal stress in high-temperature environments. In winter, the PMV averaged −2.49, with a standard deviation of 1.36, a minimum of −6.4, and a maximum of 0.59. About 36.9% of the results were below −3 (cold), indicating greater thermal vulnerability in winter than in summer and suggesting the need for more support services for energy welfare during winter.
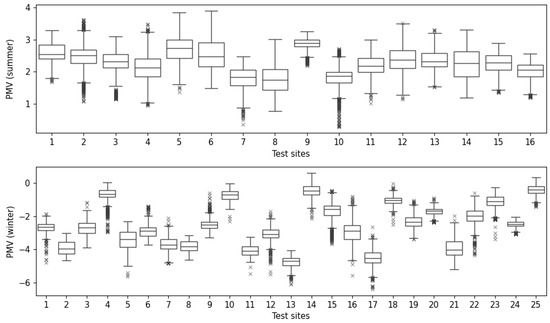
Figure 9.
PMV distribution across test sites.
Figure 10 presents the distribution of indoor-outdoor temperature differences in the buildings where the experiments were conducted. During summer, a similar pattern was observed across all five buildings, with indoor temperatures being, on average, about 3 °C higher than outdoor temperatures. This was attributed to the characteristics of households experiencing energy poverty. These households have limited access to cooling devices such as air conditioners. The buildings they inhabit are typically low-rise and densely packed. Consequently, a high cooling load is formed due to solar radiation, but there is a lack of adequate cooling means, leading to high indoor temperatures. In winter, the indoor temperature was about 13.3 °C higher than the outdoor temperature, showing a greater difference than in summer. This result was due to minimal heating for survival in notably colder winter temperatures in the surveyed area. However, as shown in Figure 9, the thermal environment in winter was more vulnerable than in summer. As Figure 8 indicates, there were buildings (B, C, E) with relatively small indoor-outdoor temperature differences and vulnerable structures. This was attributed to differences in energy characteristics and heating system operations among buildings, indicating the need for energy poverty care that takes into account these building-specific characteristics.
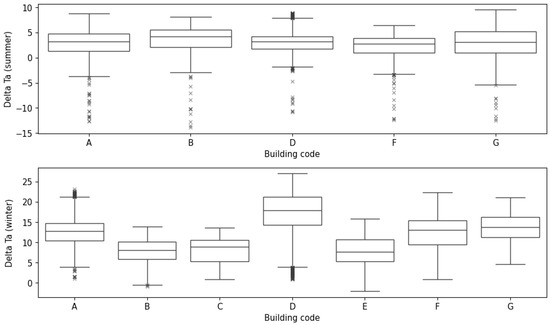
Figure 10.
Distribution of indoor and outdoor temperature differences by target building.
The usability of black bulb thermometers was evaluated by analyzing the difference between the measured black bulb temperatures and indoor temperatures. In summer, an average difference of 0.23 °C and a standard deviation of 0.24 °C were observed. In winter, the average difference was 0.26 °C with a standard deviation of 0.26 °C. Excluding some outlier values, the deviation between black bulb temperatures and indoor temperatures fell within the error range of the temperature sensor. Therefore, the PMV was analyzed assuming the black bulb temperature was identical to the indoor temperature without using a separate black bulb thermometer, and the results are shown in Figure 11. Similar patterns were observed in summer and winter with minor value differences of 0.079 in summer and 0.053 in winter. Considering the complexity of manufacturing black bulb thermometers, the need for self-calibration, and the increase in sensor node volume due to the installation of black bulb thermometers, it was deemed rational and cost-effective for the system proposed in this study to assume the black bulb temperature is identical to the indoor temperature without a separate measurement.
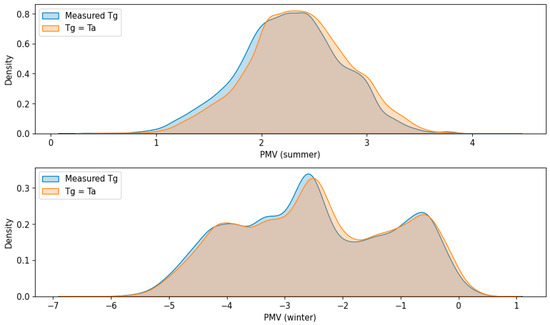
Figure 11.
Differences in PMV distribution according to black bulb temperatures.
Next, the usefulness of air velocity sensors was evaluated by analyzing the measured air velocity values. In summer, the average measured value of air velocity at the target sites was 0.114 m/s with a standard deviation of 0.168 m/s. In winter, the average was 0.075 m/s with a standard deviation of 0.093 m/s, after mainly observing minor airflows. It was judged that such minor variations in airflow do not significantly impact the thermal environment assessment, and to verify that, the PMV was calculated using the average measured values of 0.114 m/s in summer and 0.075 m/s in winter and compared to the PMV calculated using the actual measurements. The results are shown in Figure 12, with similar distributions observed in both summer and winter. In summer, the difference in PMV values was an average of 0.079, while in winter, it was 0.055, thus only showing minor differences. The precise measurement of airflow velocity requires hot-wire type sensors. However, apart from specialized research equipment, the selection of sensors available on the market is limited. Also, due to their measurement technique requiring heat generation, they demand higher voltage than typical sensors, making them unsuitable for power-optimized sensor nodes. Therefore, it was concluded that it is more appropriate to use pre-measured air velocity as an average or representative value for commercial service in the system proposed in this study.
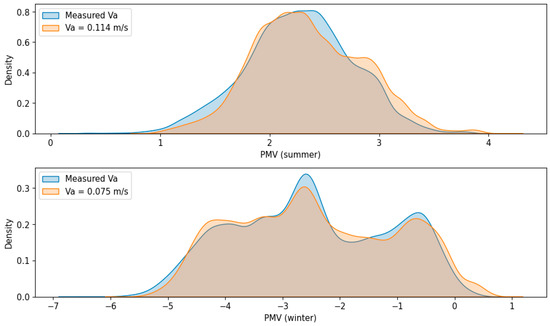
Figure 12.
Differences in PMV distribution according to air velocity.
Lastly, the potential utility of each sensor installed on the sensor node was analyzed to determine occupancy. The observed values were movement (0: no movement; 1: movement observed) measured by the PIR sensor, CO2 concentration measured by the CO2 sensor, light level measured by the lux sensor, and noise level measured by the noise sensor. The actual occupancy was determined by combining these sensor measurements with the primary occupancy patterns obtained through surveys. The CO2 sensor is generally very sensitive to faults and calibration as it is used to maintain ventilation load management in buildings. However, in energy poverty monitoring, it could be used as an auxiliary indicator for occupancy detection and for detecting smoking, even if the sensor’s sensitivity decreases due to malfunctions.
Figure 13 shows the actual measurements from one of the target households. The PIR sensor could not provide valid values for checking individual occupancy using sensor nodes alone, but by using other sensors (CO2, lux, noise) in the IoT kit as auxiliary sensors, the effective determination of occupancy was possible. The colored box section indicates the actual occupied period, while the uncolored section indicates the unoccupied period. Even during actual occupancy periods without movement, especially during sleep, the PIR sensor could not detect occupancy. The CO2 sensor obtained high readings during occupancy due to the narrow living space, but rapid concentration drops occurred during ventilation or entry/exit, posing a challenge for occupancy inference. The lux sensor patterns varied depending on the installation location in the target area, but changes in measurement values were more influenced by lighting use than by sunlight. In the target household shown in Figure 13, the lux sensor showed high readings when the lights were turned on, and values approached zero when the lights were off for sleeping or during sufficient daylight. The noise sensor had high readings during TV viewing while the household was occupied. For a one-person household, values approached zero when the TV was turned off for sleeping or during unoccupied times. As analyzed, there were disadvantages to using individual sensors to determine occupancy, so context-specific compensations were necessary. For example, on the 19th at dawn, the PIR, lux, and noise sensors all showed values close to zero due to sleep, but the CO2 sensor maintained high values, which helped determine occupancy. Conversely, on the 19th at 15:00, there was a decrease in CO2 concentration, suggesting that the occupant was not in, but high values were still observed in the noise and lux sensors, and the PIR sensor detected intermittent movement, so this period was judged to be occupied.
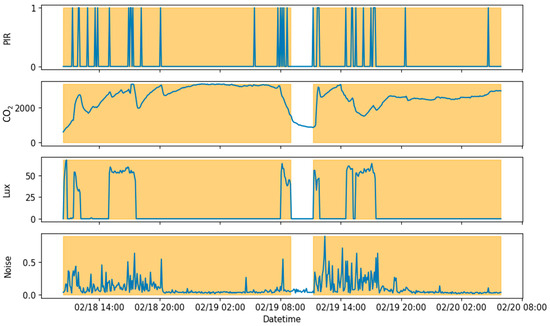
Figure 13.
Example of sensor measurements by occupancy (colored section indicates occupied period).
5. Conclusions
This study proposes an IoT sensor network-based system designed to efficiently provide welfare services for energy poverty households. The system uses a wireless sensor network to monitor the presence of individuals and the thermal environment in real time within households affected by energy poverty. The thermal environment monitoring data is calculated using the PMV index, which is utilized to assess the thermal comfort of individual households. An alert is sent to an administrator if a household is deemed to be thermally hazardous. Additionally, the recorded data is used to offer customized welfare services, such as providing items to prevent heat-related illnesses or health consultations. Presence data also enhances the efficiency of welfare services by aiding scheduled visits by counselors and welfare workers.
In this research, the performance criteria for the IoT kit necessary for effectively monitoring households with energy poverty were determined through interviews with welfare officers, field surveys, and expert meetings. The system was developed and tested in two phases, considering these criteria. Initially, a pilot packaging of the product was tested in five households, leading to the development of an improved version of the system after addressing the identified issues. Subsequently, the system was installed in 55 households experiencing energy poverty, and field surveys were conducted over the summer and winter. Based on the field data, these households’ thermal environments were analyzed, confirming that the proposed system could provide more efficient welfare services. Furthermore, recommendations for effective welfare service provision were derived. The PMV analysis revealed that households with energy poverty are more thermally vulnerable in winter than summer, indicating a need for additional support during winter. The indoor-outdoor temperature difference varied among buildings, suggesting that welfare services should be tailored to building characteristics where energy poverty households with particularly vulnerable conditions reside.
For the efficient packaging of the system, various sensors were considered, and essential factors were identified for a sensor system to effectively determine the thermal risk level in households with energy poverty. For the PMV index calculation, using representative clothing insulation based on outdoor temperature for clo was deemed appropriate, and setting met at 1.0 was considered suitable. Even if the black bulb temperature measurements were replaced with indoor temperature readings, there was no significant deviation in assessing the thermal environments. Considering the reduced utility of the black bulb thermometer, it is recommended to use indoor temperatures in future service implementations. The analysis of airflow measurement values showed that the range of measured airflow speeds did not significantly affect PMV calculation; hence, using the average seasonal airflow measurement values obtained from the field surveys is recommended. Sensors for determining presence (PIR, CO2, illumination, and noise sensors) had limitations for determining occupancy when used individually; they needed to be used complementarily for accurate inference. Based on these field survey analysis results, the proposed system is expected to be effectively implemented and operated, enhancing the quality of welfare services for energy poverty households.
Many studies have been conducted to develop IoT-based monitoring systems for various purposes, and significant technological advancements exist. However, even for the same building, it needs to be designed to accommodate the occupants’ characteristics. This study specifically targets a unique group known as energy poverty households, proposing a monitoring system optimized for their living environments and lifestyles. This distinction is significant as issues related to energy poverty can arise in any country, and resources to address them are limited. Therefore, the proposed IoT-based monitoring system can assist in mitigating these issues. In the future, it will be necessary to consider various methods for improving the thermal environment of energy poverty households using the proposed system and to apply it to actual welfare services to verify its effectiveness.
Author Contributions
Conceptualization and supervision, H.S.; methodology, W.-S.Y. and H.S.; implementation, W.-S.Y. and W.R.; field test, W.-S.Y., H.S. and W.R.; data analysis, W.-S.Y. and W.R.; visualization, W.-S.Y.; writing—original draft preparation, W.-S.Y. and W.R.; writing—review and editing, W.-S.Y., H.S., W.-h.H. and S.-W.L.; funding acquisition, H.S. and W.-h.H. All authors have read and agreed to the published version of the manuscript.
Funding
This work was supported by the National Research Foundation of Korea (NRF) grant funded by the Korean government (MSIT) (No. 2020R1C1C1007127). This work was supported by the Human Resources Program in Energy Technology of the Korea Institute of Energy Technology Evaluation and Planning (KETEP) granted financial resource from the Ministry of Trade, Industry & Energy, Republic of Korea (No. 20204010600060).
Data Availability Statement
The data are not publicly available due to privacy.
Conflicts of Interest
The authors declare no conflicts of interest.
References
- González-Eguino, M. Energy Poverty: An Overview. Renew. Sustain. Energy Rev. 2015, 47, 377–385. [Google Scholar] [CrossRef]
- Energy Poverty. Available online: https://energy.ec.europa.eu/topics/markets-and-consumers/energy-consumer-rights/energy-poverty_en (accessed on 20 November 2023).
- The Energy Vulnerable Class Is Exposed to Heat over 40 °C. It Is Urgent to Prepare and Support Practical Measures for the Heat Wave. Available online: http://dg.kfem.or.kr/index.php?mid=state&document_srl=168061 (accessed on 20 November 2023).
- Ryu, W.; Seo, H.; Hong, W.-H. A Study on Living Conditions and Thermal Environment in Korean Jjok-Bangs. J. Korean Hous. Assoc. 2021, 32, 101–109. [Google Scholar] [CrossRef]
- Ha, C.; Kim, H.M. A Study on the Formation of Urban Poor Communities-Focused on JJOK BANG in Seoul’s Slum Areas; The Seoul Institute: Seoul, Republic of Korea, 2019. [Google Scholar]
- Robinson, J.; Lee, K.; Appiah, K.; Yousef, Y. Energy-Aware Systems for Improving the Well-Being of Older People by Reducing Their Energy Consumption. Int. J. Adv. Life Sci. 2017, 9, 163–175. [Google Scholar]
- Carre, A.; Williamson, T. Design and Validation of a Low Cost Indoor Environment Quality Data Logger. Energy Build. 2018, 158, 1751–1761. [Google Scholar] [CrossRef]
- Zhao, L.; Wu, W.; Li, S. Design and Implementation of an IoT-Based Indoor Air Quality Detector with Multiple Communication Interfaces. IEEE Internet Things J. 2019, 6, 9621–9632. [Google Scholar] [CrossRef]
- Yun, J.; Woo, J. IoT-Enabled Particulate Matter Monitoring and Forecasting Method Based on Cluster Analysis. IEEE Internet Things J. 2021, 8, 7380–7393. [Google Scholar] [CrossRef]
- Mumtaz, R.; Zaidi, S.M.H.; Shakir, M.Z.; Shafi, U.; Malik, M.M.; Haque, A.; Mumtaz, S.; Zaidi, S.A.R. Internet of Things (IoT) Based Indoor Air Quality Sensing and Predictive Analytic—A COVID-19 Perspective. Electronics 2021, 10, 184. [Google Scholar] [CrossRef]
- Saini, J.; Dutta, M.; Marques, G. Predicting Indoor Air Quality: Integrating IoT with Artificial Intelligence. In Internet of Things for Indoor Air Quality Monitoring; Saini, J., Dutta, M., Marques, G., Eds.; Springer International Publishing: Cham, Switzerland, 2021; pp. 51–67. ISBN 978-3-030-82216-3. [Google Scholar]
- Cabra, J.; Castro, D.; Colorado, J.; Mendez, D.; Trujillo, L. An IoT Approach for Wireless Sensor Networks Applied to E-Health Environmental Monitoring. In Proceedings of the 2017 IEEE International Conference on Internet of Things (iThings) and IEEE Green Computing and Communications (GreenCom) and IEEE Cyber, Physical and Social Computing (CPSCom) and IEEE Smart Data (SmartData), Exeter, UK, 21–23 June 2017; pp. 578–583. [Google Scholar]
- Wu, F.; Redouté, J.-M.; Yuce, M.R. WE-Safe: A Self-Powered Wearable IoT Sensor Network for Safety Applications Based on LoRa. IEEE Access 2018, 6, 40846–40853. [Google Scholar] [CrossRef]
- Kim, J.H.; Jo, B.W.; Jo, J.H.; Kim, D.K. Development of an IoT-Based Construction Worker Physiological Data Monitoring Platform at High Temperatures. Sensors 2020, 20, 5682. [Google Scholar] [CrossRef]
- Dimitrievski, A.; Filiposka, S.; Melero, F.J.; Zdravevski, E.; Lameski, P.; Pires, I.M.; Garcia, N.M.; Lousado, J.P.; Trajkovik, V. Rural Healthcare IoT Architecture Based on Low-Energy LoRa. Int. J. Environ. Res. Public Health 2021, 18, 7660. [Google Scholar] [CrossRef]
- López-Vargas, A.; Ledezma-Espino, A. Iot Application for Energy Poverty Detection Based on Thermal Comfort Monitoring. Heliyon 2023, 9, e12943. [Google Scholar] [CrossRef] [PubMed]
- Pollard, A.; Jones, T.; Sherratt, S.; Sharpe, R.A. Use of Simple Telemetry to Reduce the Health Impacts of Fuel Poverty and Living in Cold Homes. Int. J. Environ. Res. Public Health 2019, 16, 2853. [Google Scholar] [CrossRef] [PubMed]
- Hurst, W.; Montanez, C.A.C.; Shone, N. Towards an Approach for Fuel Poverty Detection from Gas Smart Meter Data Using Decision Tree Learning. In Proceedings of the 3rd International Conference on Information Management and Management Science, London, UK, 7–9 August 2020; Association for Computing Machinery: New York, NY, USA, 2020; pp. 23–28. [Google Scholar]
- Fergus, P.; Chalmers, C. Energy Sobriety: A Behaviour Measurement Indicator for Fuel Poverty Using Aggregated Load Readings from Smart Meters. In Towards Energy Smart Homes: Algorithms, Technologies, and Applications; Ploix, S., Amayri, M., Bouguila, N., Eds.; Springer International Publishing: Cham, Switzerland, 2021; pp. 21–47. ISBN 978-3-030-76477-7. [Google Scholar]
- Díaz, D.; Medina, J.; Montoro, A.; López, J.L.; Espinilla, M. Linguistic Summaries for Dwellings Energy Poverty Monitoring. In Proceedings of the International Conference on Ubiquitous Computing & Ambient Intelligence (UCAmI 2022), Córdoba, Spain, 29 November–2 December 2022; Bravo, J., Ochoa, S., Favela, J., Eds.; Springer International Publishing: Cham, Switzerland, 2023; pp. 693–704. [Google Scholar]
- de Maturana, I.A.L. Fighting against fuel poverty by collaborating with social services through energy advice: An innovative case from Spain. GIZAEKOA-Rev. Vasca Econ. Soc. 2020, 17, 71. [Google Scholar] [CrossRef]
- Ortiz, J.; Jiménez Martínez, M.; Alegría-Sala, A.; Tirado-Herrero, S.; González Pijuan, I.; Guiteras Blaya, M.; Canals Casals, L. Tackling Energy Poverty through Collective Advisory Assemblies and Electricity and Comfort Monitoring Campaigns. Sustainability 2021, 13, 9671. [Google Scholar] [CrossRef]
- Čulić, A.; Nižetić, S.; Šolić, P.; Perković, T.; Čongradac, V. Smart Monitoring Technologies for Personal Thermal Comfort: A Review. J. Clean. Prod. 2021, 312, 127685. [Google Scholar] [CrossRef]
- ISO 7726-1998; Ergonomics of the Thermal Environment Instruments for Measuring Physical Quantities. International Organization for Standardization: Geneva, Switzerland, 1998.
- ASHRAE Standard 55-2023; Thermal Environmental Conditions for Human Occupancy. American Society of Heating, Refrigerating and Air-Conditioning Engineers: Peachtree Corners, GA, USA, 2023.
- Humphreys, M.A. The optimum diameter for a globe thermometer for use indoors. Ann. Occup. Hyg. 1977, 20, 135–140. [Google Scholar] [CrossRef]
- Shirsat, K.P.; Bhole, G.P. An Empirical Study on the Occupancy Detection Techniques Based on Context-Aware IoT System. In Proceedings of the International Conference on Sustainable Expert Systems (ICSES 2020), Lalitpur, Nepal, 28–29 September 2020; Shakya, S., Balas, V.E., Haoxiang, W., Baig, Z., Eds.; Springer: Singapore, 2021; pp. 95–105. [Google Scholar]
- Nesa, N.; Banerjee, I. IoT-Based Sensor Data Fusion for Occupancy Sensing Using Dempster–Shafer Evidence Theory for Smart Buildings. IEEE Internet Things J. 2017, 4, 1563–1570. [Google Scholar] [CrossRef]
- Prohasky, D.; Watkins, S. Low Cost Hot-Element Anemometry Verses the TFI Cobra. In Proceedings of the 19th Australasian Fluid Mechanics Conference, Melbourne, Australia, 8–11 December 2014. [Google Scholar]
- Wang, S.; Li, Y. Suitability of Acrylic and Copper Globe Thermometers for Diurnal Outdoor Settings. Build. Environ. 2015, 89, 279–294. [Google Scholar] [CrossRef]
- Aparicio, P.; Salmerón, J.M.; Ruiz, Á.; Sánchez, F.J.; Brotas, L. The Globe Thermometer in Comfort and Environmental Studies in Buildings. Rev. Constr. J. Constr. 2016, 15, 57–66. [Google Scholar] [CrossRef][Green Version]
- Tartarini, F.; Schiavon, S. Pythermalcomfort: A Python Package for Thermal Comfort Research. SoftwareX 2020, 12, 100578. [Google Scholar] [CrossRef]
- Schiavon, S.; Lee, K.H. Dynamic Predictive Clothing Insulation Models Based on Outdoor Air and Indoor Operative Temperatures. Build. Environ. 2013, 59, 250–260. [Google Scholar] [CrossRef]
Disclaimer/Publisher’s Note: The statements, opinions and data contained in all publications are solely those of the individual author(s) and contributor(s) and not of MDPI and/or the editor(s). MDPI and/or the editor(s) disclaim responsibility for any injury to people or property resulting from any ideas, methods, instructions or products referred to in the content. |
© 2024 by the authors. Licensee MDPI, Basel, Switzerland. This article is an open access article distributed under the terms and conditions of the Creative Commons Attribution (CC BY) license (https://creativecommons.org/licenses/by/4.0/).