Article

A Life Cycle Analysis of a Polyester–Wool Blended Fabric and Associated Carbon Emissions in the Textile Industry

1
Department of Industrial Engineering, Adana Alparslan Türkeş Science and Technology University, Sarıçam, Adana 01250, Turkey
2
Department of Electrical and Electronics Engineering, Adana Alparslan Türkeş Science and Technology University, Sarıçam, Adana 01250, Turkey
3
Kıvanç Textile Industry and Commerce Incorporated Company, Seyhan, Adana 01040, Turkey
*
Author to whom correspondence should be addressed.
Energies 2024, 17(2), 312; https://doi.org/10.3390/en17020312
Submission received: 29 October 2023 / Revised: 18 December 2023 / Accepted: 4 January 2024 / Published: 8 January 2024

Abstract

:
The effect of industrialization and technological developments and the rate of population growth have begun to disrupt the ecological balance in the world. A large share of the deterioration of this balance is due to the rapidly increasing energy demands of people. Fossil fuels and renewable energy sources are used to obtain the energy that is needed by human beings. Most of the world’s energy needs are met by fossil fuels such as coal, oil, and natural gas. These resources, which we call fossil fuels, cause many parallel environmental problems, such as global warming, climate change, and carbon emissions, for the world and nature. The most affected by all these experiences, of course, is the entire production sector, which is dependent on energy. However, textile and apparel, which is a pioneer in taking steps towards harmonization with the Green Agreement, is one of the sectors that started the transition to green energy within the scope of the European Union and brands’ net-zero targets. Within the scope of the Green Agreement, Turkey has participated and started to work for a 70% carbon reduction, which is the target for 2030, and carbon neutrality, which is the target for 2050. Therefore, within the scope of these targets, the textile sector of Çukurova Region, which has the highest export rate in Turkey, was chosen. Within the scope of this study, carbon emission, which is one of the global problems, was examined within the framework of the ISO 14067-ISO Product Based Carbon Footprint (CF) standard by examining the production of a textile company, and the results were analyzed in detail. The main innovation of this article is to follow all stages of the fabric called Tricia, which is the most produced product in the textile industry, from its entry as fiber to its exit as fabric in the factory, and to calculate and analyze the amount of carbon that is released into nature. The dynamic and experimental results showed that it was determined that 6.00 tons of carbon dioxide carbon were released in the time it took for the fabric to go to the sewing room as a fabric.

1. Introduction

Fossil fuels and renewable energy sources are used to obtain the energy demanded by human beings. Most of the world’s energy needs are met by fossil fuels such as coal, oil, and natural gas. These resources, which we call fossil fuels, cause many environmental problems in parallel with each other, such as global warming, climate change, and carbon emissions, for the world and nature. A lot of work is being carried out to solve these problems. To reduce carbon emissions, which are one of the most important of these problems, we first need to measure and analyze how and how much carbon we emit. As a result of the forthcoming analyses, it will be possible to reduce and manage carbon emissions. In this study, the carbon emission calculation was conducted on the most exported product of an active factory.
Carbon emission is understood as the release of carbon into the atmosphere, most of which is the effect of human beings and occurs in nature. The majority of carbon emissions are a result of human activities. With the effect of the industrial revolution in the 19th century, the use of coal-fired industrial vehicles caused a serious increase in the GHG density in the atmosphere. Carbon dioxide (CO2), Methane (CH4), Nitrous oxide (N2O), Hydro fluoride carbons (HFCs), Per fluorocarbons (PFCs), and Sulfurhexa fluoride (SF6), which are called GHG gases, are released into the atmosphere, causing the average temperature of the world to increase. GHGs cause a serious climate problem by covering the inner surface of the atmosphere and increasing the temperature on the earth by preventing the reflection of the rays from the sun. This temperature increase causes the melting of glaciers and a serious rise in sea levels. The amount of GHG, the damage and destruction caused by humans to nature, is explained by the carbon footprint. Greenhouse gases are emitted through the production and consumption of goods and services. Carbon footprint refers to the amount of all greenhouse gases, including carbon dioxide gas, in tonnes equivalent of carbon dioxide, and is used to measure the impact of an activity, a person, or a country on climate change [1].
On the one hand, energy crises and rising prices, on the other hand, the necessity of transitioning to clean energy are within the scope of the responsibilities brought by the EU’s Green Deal. The textile and ready-to-wear sector has also put emphasis on green energy initiatives for sustainable production. Every day, investments are made that will bring the sector closer to the zero-carbon target, and new projects are implemented. Recently, Turkey, along with the whole world, has been going through a very active and difficult period that requires new solutions in energy. On the one hand, within the scope of the Paris Agreement and the Green Agreement, which Turkey signed last year, clean energy needs to be rapidly expanded throughout the country. Although investments have been accelerated for this, it does not seem possible to switch to green energy in the short term. On the other hand, there are energy crises all over the world, which also affect Turkey, and energy prices have been following a rising trend for a while. A new energy crisis is at the door due to wars and recent natural disasters. The main contribution of this paper is that all the production steps of the fabric called Tricia, which is produced within the factory of Kıvanç Textile, from the entry as fiber to the exit as fabric in the factory, were followed, and the carbon emissions released to nature are calculated.
This study determined and measured energy consumption in order to track carbon emissions during the production process of a product. In particular, the fabric named Tricia was chosen, because it is the most exported product from the Kıvanç Textile factory, where all production takes place. For this specially selected product, the product-based carbon footprint calculation and energy consumption were measured and analyzed by following all processes one by one. With this feature of this study, its difference from other studies in the literature has been revealed. In this way, it is easy to understand how much carbon the product emits at what stage and which energy consumption influences it. Thanks to this approach and analysis, it becomes possible to eliminate carbon emissions at the source. The main contribution of this study is that it will be possible to intervene in the carbon emission at the source using the conducted product-based carbon emission analyses.

Literature Review

Considering the socioeconomic balances in the textile industry, the policies implemented in China for GHG reduction until 2050 were analyzed by using the life cycle assessment approach and the integrated model. In light of the results obtained, when socioeconomic conditions and climate policies are taken into account, it is predicted that carbon emissions will decrease by 89% and accumulated emissions by 34.5% on an annual basis until 2050. During these studies, it has been observed that energy efficiency and power saving directly contribute to these goals. It has been stated that reducing the carbon emissions of the energy system is essential to reducing the emission of textile products [2]. By following the total production planning, the total carbon footprint for the year 2018 was calculated and analyzed. The carbon footprint values for fabric dyeing, printing, and yarn dyeing are 21.57 kg-CO2e/kg-product, 20 kg-CO2e/kg-product, and 24.39 kg-CO2e/kg-product. These data are compared using the measure of kg-CO2e/kg-product. Results are reported as 32 kg CO2e/kg product and 19.28 kg-CO2e/kg-product. In the study, it was stated that the factors causing this carbon footprint in the units are the use of natural gas, coal, and diesel oil. In order to reduce carbon emissions in fabric production, it has been proposed to terminate the use of fossil fuels and use renewable energy sources instead [3]. As a result of the industrial carbon footprint calculation of the examined product, the denim jacket, it has been determined that the carbon footprint is more than 1000 kg CO2 in the cases where there is a carbon footprint from cutting to sewing and finishing. In the calculations, it is revealed that the largest carbon footprint occurs in the sewing process. At the output of the studies, the carbon footprint of the denim jacket piece was calculated as 1.75 kg CO2. To reduce carbon emissions, it is recommended to optimize production lines, use highly energy-efficient processing equipment, and increase the use of renewable energy sources [4].
Carbon footprint analyses were performed on ten different cashmere fabrics according to the PAS 2050 specification, water footprint network approach, and ISO 14046 standard. According to the results of the analysis, it was stated that knitted cashmere fabrics have a higher carbon footprint than woven cashmere fabrics [5].
Zea mays L. corn husk, which occurs naturally and contains 46% cellulose, has been reported to be important. Low production costs and a low carbon footprint (0.5, 1 and 0.74 kg-CO2e/kg, respectively) are estimated, as the only consumables are NCH, NaOH, and water. These findings led to the conclusion that the production of a non-cotton, glue-free, high-yield, and affordable and robust biotextile fiber from agricultural waste symbolizes a green and sustainable technology, contributing to the reduction in GHG emissions and carbon neutralization [6]. Carbon footprint analyses of imported polyester t-shirts were carried out. In these analyses, it has been explained that the usage stage, which is the last stage of all the stages of polyester t-shirt production and life cycle, causes a carbon footprint. In these processes, it was noted that energy consumption can be reduced by improving energy efficiency and using renewable energy sources in production stages, thus reducing carbon emissions. It was stated that washing with cold water as a process change will save energy and provide a significant effect in reducing the carbon footprint [7]. A comprehensive analysis of GHG emissions from the textile industry, which ranks sixth in energy consumption in China, has been carried out, and the causes and consequences of emissions have been analyzed. In the light of the data obtained, it has been stated that the largest share in GHGs is coal, followed by electricity consumption. It has been stated that the analyses include the efforts of the textile industry in China to take energy-saving measures, and this will account for a large share in reducing emissions [8]. With the numerous scenarios that they provided, the carbon intensity (CO2 emissions/industrial added value) was evaluated. The analysis of the options for lowering carbon dioxide emissions in the Chinese textile industry thus revealed the results. The long-run equilibrium equation in the analyses was established using the Johansen cointegration approach. They created three scenarios—Business as Usual (BAU), medium, and ideal—to anticipate the future development of carbon intensity in the Chinese textile industry. The data that were acquired as a consequence of the research have shown that the carbon intensity is highly influenced by energy cost, energy substitution, labor productivity, and technology. By 2020 and 2025, respectively, they forecasted that the carbon intensity for the BAU scenario, which was expected to be 1.49 t CO2/10,000 CNY in 2010, would decrease to 0.5 and 0.29 t CO2/10,000 CNY. According to the moderate scenario, 0.12 t CO2/10,000 CNY will be the carbon intensity. But they said that by using the BAU estimate as a baseline, they determined that by 2025, there may be a reduction in carbon dioxide emissions of up to 44.8 million tons. They believe that by then, the intensity would have substantially decreased to 0.05 t CO2/10,000 CNY at best [9].
In order to reduce the environmental impact of the growth in energy consumption of the US textile industry, including the carpet industry, and the consequent rapid increase in carbon emissions, analyses were performed to estimate the energy consumption and carbon emissions for all stages of the life cycle of a newly produced carpet. From the manufacture of raw materials to the recycling, disposal, and transportation operations of the item under study, they conducted a life cycle evaluation of the energy and carbon emissions of two types of carpets (wool carpet and nylon carpet). According to the analysis’s findings, producing 0.09 square meters of carpet tile uses 20.42 MJ of energy and results in the generation of 4.80 kg of CO2e, while using 25.42 MJ of energy for nylon carpet and 6.35 kg of CO2e when producing 0.09 square meters of wool carpet. In order to utilize less energy, they recommended that nylon carpet manufacture and the use of wool carpets be made more efficient [10]. They calculated the carbon footprint (CFP) with the carbon that they emitted into nature as a result of the production process of the woolen and cotton fabrics that are produced in Turkey. The production procedures and related production data for the businesses where these fabrics are produced have been researched and analyzed in detail. An applied comparative analysis showed that wool textiles have an almost threefold higher industrial CFP than cotton fabrics. Commercial CFPs for each product were calculated as 14.07 kg-CO2e/kg for pure wool fabrics, 13.55 kg-CO2e/kg for blended wool–polyester fabrics, and 5.34 kg-CO2e/kg for cotton fabrics. As a result of the analysis, it was emphasized that various raw materials, textile techniques, and dye colors that are employed also cause CFP differences. As a result of their analysis, they emphasized that energy consumption such as electricity, steam, and coal are the main sources of industrial CFPs, and key approaches to reducing the CFP of textiles are to improve energy management and improve the output efficiency of production, especially in terms of electricity use [11].
A scientometric literature review and carbon footprint analysis were conducted by examining 7450 articles. The focus of carbon footprint research changed between 1992 and 2019 and ranged from ecology and botany to international trade and home behavior, among other topics. It has been emphasized that water vapor is the longest-standing carbon footprint research topic, and the main node of carbon footprint research occurred in 2008. The main source of information for carbon footprint research is “Veterinary, Livestock, and Science”; comparatively, it was stated that the research results were mainly applied to the subject of “Environmental, Toxicology, and Nutrition”. They explained that carbon footprint research tends to merge with Economics research, and these trends prove to be an important process of the theme shift and knowledge evolution in carbon footprint research [12]. To evaluate the balance or cohesiveness at the community level from a life cycle perspective, they integrated resilience and sustainability. It is claimed that the building and repair following hurricane hazard damage, as well as the routine repairs and maintenance that take place during the life of a property, represent the life cycle cost and carbon footprint. The capacity of the building structure, the size of the carbon footprint, the variation in wind speed intensities within the carbon footprint, and the randomness of carbon formation have all been explained as playing a significant role in the performance of a building [13]. They discussed the structure and geographic variation in the regional agro-industry carbon footprint (ACF) using the input–output table of Hebei province in 2012 and using it as the basic spatial unit in major cities. After conducting their research, they discovered that the ACF in 2012 was about 1.05 × 10⁸ tons, or 6.7% of Hebei’s overall carbon footprint. The analyses suggested that the agro-industry structure should be adjusted for low-carbon, energy-efficient, and emission-free development [14]. They estimated the carbon and water footprints of untreated polyester textiles and recycled polyester textiles and performed comparative analyses. According to the analysis findings, the carbon footprint of raw polyester textile production is 119.59 kg-CO2/100 kg. In order to analyze the carbon emission rates of the various production stages of the product whose carbon footprint is calculated, they divided the production into processes. Terephthalic acid production accounted for the biggest share (45.83%) in the analysis, followed by polyester fabric, ethylene, paraxylene, and ethylene glycol production processes. The overall carbon footprint of recycled discarded polyester is estimated at 1154.15 kg-CO2/100 kg, about ten times the production of raw polyester textiles. After doing a comprehensive assessment of the carbon footprint and water footprint using the product lifecycle evaluation polygon approach, they found that the polyester fabric manufacturing process showed greater environmental impacts for both virgin polyester and recycled polyester [15].
Using the phased expanded multiregional input–output (EE-MRIO) and weighted average structural decomposition analysis (WA) models, they examined the findings of the three-perspective carbon footprint of CFs (by province, per capita, and GDP) at the state level as well as the socioeconomic drivers of state CFs from 2007 to 2017. Despite the fact that provinces with a relatively low carbon footprint density (CFI) are still in wealthy eastern coastal regions, the centers of gravity of CFs and per capita CFs have gradually shifted from populated eastern municipalities and wealthy eastern provinces to underdeveloped western China. With this situation, they concluded that the developed provinces would help improve the national emission reduction in general by introducing advanced production technologies and scientific consumption awareness to eastern China. In the light of these results, it has been suggested that continuous optimization in the consumption structure will contribute more to the reduction in CFs within the scope of demand-side reforms [16].
A model has been created for the measurement and calculation of the carbon emissions of photovoltaic power plants, considering the recently created policies in China regarding the solar energy system. In this model, the whole process, especially production, transportation, and waste, is analyzed to examine and reduce the carbon emissions from the generation of photovoltaic power. For this analysis, studies were carried out on a 1 kW photovoltaic power generation plant. In the light of the analyses, it has been explained that carbon emissions from photovoltaic power supply chains can be effectively reduced by improving raw material development technology, optimizing parts of the production processes, gradually replacing transportation vehicles with electric vehicles, and increasing waste [17]. By examining the life cycle of the silk product, they carried out analyses of carbon emission processes and improvements. Studies have been conducted on the cocoon acquisition, production stages, distribution, consumption, and recycling processes for the silk product. The importance of establishing complete and unified system boundaries was emphasized when measuring carbon emissions in the industrial production of silk products. It was emphasized that models of reasonable washing times and washing stages should be created in order to evaluate the carbon emissions of silk products in household laundry. At the end of the life of silk products, they drew attention to the positive effect on carbon emissions of the recycling phase of silk [18]. They worked in the textile sector in Morocco, where there is intense energy consumption, giving importance to a green transformation with a policy of decarbonization. This study analyzes energy, economic, and environmental impacts by evaluating production, investments, and CO2 emission limits. In addition, because of the analysis, the most suitable and sustainable configurations were suggested for each location, and models with the scope and levels of energy and environmental gains and investments that could inspire the manufacturer were presented. Various geographic locations and factories were examined under six climatic regional conditions [19]. It has been stated that microfiber wastes are formed in the production, and this is removed from the clothing with extra washing processes. It has been observed that the increase in the world population and the growth in the fashion sector cause an increase in the production of clothing and therefore a serious increase in microfibers. They stated that fiber formation increases the mechanical stress in production and the detergent concentration of the washing liquid, and the extra washing processes increase the electricity consumption in these processes. It has been revealed in the analyses that increasing electricity consumption significantly increases carbon emissions. It has been explained that these three parameters directly increase electricity consumption and increase carbon emissions [20].
By establishing a product carbon labelling system, an applicable and comparable carbon footprint (CFP) assessment method and framework has been established at the product level. A sample study is presented using the production of pure cotton shirts. The CFP conversion factors for the respective energy sources and materials were determined after the sample product was selected. The actual CFP was then determined for the life of the garment made only of cotton. A total of 8.771 kg-CO2e is calculated as the average CFP of a pure cotton shirt over its lifetime. Its indirect CFP is significantly larger at 8.423 kg-CO2e, while its direct CFP is only 0.347 kg-CO2e. The industrial production stage was found to produce the largest percentage of the CFP, with overall production (which includes both agricultural and industrial production) accounting for more than 90% of the total CFP. The energy and material use at each step is estimated to account for 96% of the total CFP over the life of a product. Transport and weaving downstream processes were directly responsible for almost all of the CFP (0.347 kg-CO2e) in the industrial production phase. Energy use, especially electricity use, has been found to be the primary cause of CFP in textiles [21]. They explored the potential environmental benefits of textile recycling techniques and created more sustainable options for textile waste management strategies. The model examined consists of 50% cotton and 50% polyester. In this model, three different recycling techniques for waste were identified, and a life cycle assessment (LCA) was conducted to evaluate their environmental performance. Identified recycling processes are defined as the reuse of textile waste of adequate quality, separating the cellulose from the polyester using N-methyl morpholine-N-oxide as the solvent and chemically recycling the polyester. These processes were compared to incineration, the traditional textile waste treatment process in Sweden, and the equivalent (CO2-equivalent) and primary energy savings were found to be 164 gigajoules (GJ). It has been stated that the integration of these recycling technologies for the optimum use of different properties in the processing of 1 ton of textile waste shows that 10 tons of CO2 equivalent and 169 GJ of primary energy can be saved [22]. These case studies use Environmental Profit and Loss (EP&L), a technique that intuitively evaluates environmental impact while converting various environmental impacts into a combined social marginal cost. The EP&L technique was used to assess the environmental impacts caused by the carbon dioxide emissions and water consumption of the textile industry in Jiaxing from 2011 to 2018 [23]. They conducted studies to understand the current status and application of sustainable innovation in the textile industry. The 41 articles that were found through a systematic search procedure matched the inclusion criteria of this review, which aimed to synthesize empirical knowledge on sustainable innovation in the textile industry. These articles were then subjected to a qualitative thematic analysis. The analysis shows that the academic interest in sustainability innovation has recently increased. Enzymatic textile processing, collaboration, business model innovation, culture and knowledge management, and environmental management systems (EMSs) and corporate policies are all examples of sustainable organizational innovation. This study discovered that, unlike social innovation, ecological innovation is more closely tied to the widespread practice of sustainable innovation in the textile industry. As the consumer demand for environmentally friendly products and stricter regulations increases, the co-development of sustainability innovation in the textile industry is important for business actors and policy makers [24]. They analyzed the need for a new textile policy that eliminates textile waste and the establishment of a textile waste management system. It was stated that the textile sector, which is the second most important sector in India, works with many chemical toxicities and consumes excessive amounts of water, and in addition to these, carbon emissions are also very high. They stated that the use of sustainable tools will reduce textile waste [25]. They examined the textile industry, where the energy and underground water resources consumed during production are used in textile dyeing factories, and this use contributes to the carbon footprint and water footprint effect on the environment. This study examined groundwater and energy use patterns in 2019 using data from 15 textile dyehouses.
In 2019, 15 textile dyehouses produced an average of 7602.88 tons of colored fabric, using energy and groundwater and releasing treated wastewater into the environment: 9611.26 million liters, 640.24 million liters, and 17,689.43 MWh, respectively. While the average energy consumption per kilogram was 2.58 kWh, the average KPI value of the wastewater released was 97.27 L/kg. Considering the methods for reducing groundwater and energy consumption by 5% annually for each facility, an estimated 355.43 million liters of water and 6540.68 MWh of electricity can be saved in 10 years (equivalent to 4167.08 tons of CO2 emissions) [26]. They examined how textile and apparel (TA) supply chains may adapt to the SDGs in light of the Sustainable Development Goals (SDGs), established by the United Nations, and the sustainability theme. They demonstrated via an analysis of its documentation and practical implementations that the TA industry’s existing sustainable practices fall well short of the objectives of economic growth that go hand in hand with social and environmental sustainability [27]. They investigated the issue of personal carbon footprint calculators online and whether these work reliably as estimators. Following recommendations from the carbon calculator literature and a thorough analysis of typical calculator features and designs, the feature index was created. The results of this index were then summarized in heat index tables and applied to 31 online carbon footprint calculators. Using the feedback and performance assessment indices, suggestions were made for enhancing the design of the carbon footprint calculator [28]. They assessed whether the main textile sectors’ adoption of cleaner production methods (CPPs) had a favorable effect on their operational, financial, and environmental performance. Data analysis based on structural equation modeling for hypothesis testing, expert analysis, survey application in more than 100 firms, and Pearson correlation analysis of variables was developed using the employed study approach. The adoption of CPPs has been observed to improve the LTI’s operational, environmental, and economic performance. With this research, they came to the conclusion that the LTI’s primary objective is to meet the sourcing needs of the global market, and that it is important to acknowledge environmental interventions in decisions through the adoption of CPPs, in addition to communicating positive results to stakeholders to promote green marketing. This brings innovation to the most recent technology, as it measures the impact of the adoption of CPPs on the operational, environmental, and economic performance of the LTI. Additionally, it was determined that LTI shareholders can inform stakeholders of performance enhancements that are made possible by the adoption of CPPs, including those in worker health and safety, water reuse, waste minimization, waste reduction, and setting up strategic planning with goals [29].
A substantial portion of the carbon footprint is made up of the Average Forest Carbon Capture (AFCS), which is based on the net capacity of forest ecosystems to sequester carbon. Numerous calculation options are constructed to capture varied carbon sequestration rates depending on the degree of human management of the three forest types under consideration (primary forests, other naturally regenerating forests, and cultivated forests). This version of the AFCS calculation includes carbon emissions from soil, forest fires, and wood products for the first time. A range of 0.73 to 0.37 t C ha−1 year−1 was defined for the AFCS values. Then, based on this range of values, the calculated ecological and carbon footprint values were evaluated. The findings demonstrate that the human demand for ecosystem services exceeds the biosphere’s ability to supply them [30]. In denim fabric production, analyses of the sustainable production potential in connection with the sustainable development goals were carried out in order to increase the contribution to the sustainable development goals and to reduce the water footprint. The life cycle assessment and Material Input per Service methods were used to determine the environmental impact factors and existing water footprint of the production center. In order to make the calculations comparative, the total production capacity of the factory was created in three different ways, taking into account a selected product and wet processes. The sustainability assessment created as a result of the analyses determined that the factory contributed approximately 12% to Sustainable Development Goal 12 in the period examined, according to both the life cycle assessment and Material Input per Service methods [31].
Other current articles on carbon footprint calculations are presented in the form of Table 1 below.

2. Materials and Methods

2.1. Wool–Polyester Blend Fabric “Tricia”

Kıvanç Textile, a woven fabric manufacturer established in the early 1950s, operates in Adana, leveraging its experience of more than half a century. Kıvanç Textile, which has completed its integration by mastering all processes in fabric production from yarn production to dyeing–finishing applications, is in Adana, Turkey’s textile city, in its facilities consisting of an open area of 267,000 m2 and a closed area of 104,010 m2. Kıvanç’s main productions are yarn and ready-to-wear fabrics, and the main input of the fabric produced is high from its own yarn production. Kıvanç Textile, which strengthens its position in local and global markets with its quality, product variety, and innovation in fabric production, can produce 18 million meters of fabric per year from 100 gr/m2 to 500 gr/m2 with its rich collection, especially for global ready-to-wear fashion brands in European and American markets. Kıvanç Textile, which is constantly growing and developing with its experience of more than half a century, its innovative approach, and corporate structure, continues to offer unique fabric designs to local and global markets with its superior quality policy, operational excellence, and environmentally friendly production. Water, electricity, and natural gas are used as energy inputs. It sources its water from its own licensed wells. It derives 45–50% of its electricity from the cogeneration system, 2–3% from solar energy panels, and the rest from the distribution company. It also uses natural gas through its distribution company. Another important aspect of fabric production is raw materials, which are sourced from environmentally friendly and internationally approved suppliers of chemicals and fibers.
In this study, a fabric named Tricia, which is a blend of wool and polyester, was chosen to make a product-based carbon footprint analysis. Since it is the most exported product of the Kıvanç Textile Factory, the fabric named Tricia was preferred. The Tricia fabric is a blend consisting of a total of 1250 kg of fiber: 562.5 kg of wool fiber and 687.5 kg of polyester fiber. After the wool fiber is dyed in fiber form, it is mixed with polyester fiber to become yarn. It is transformed into the form of fabric through the weaving process from the yarn state, and then it is ready for sale.

2.2. Product-Based Carbon Tracking and Analysis of “Tricia”

The ISO-14067 Product Based Carbon Calculation standard was used to examine the existing carbon emission processes of the factory and to ensure that the current sustainable potential is revealed by making product-based carbon calculations. As a result of the results, the analyses for the current and future sustainable initiatives and carbon emissions were conducted within the framework of these standard rules.
For the calculation of the product-based carbon footprint, the current application process of the selected special fabric was extracted, and energy measurements and analyses were carried out by following the product step by step.
Process flow charts were created for each facility involved in the life cycle of the “Tricia” fabric, and detailed tracking was conducted. In Figure 1, the process flow chart showing the step-by-step operation of the Fiber Dye facility is shown. In Figure 2, the process flow chart showing the step-by-step operation of the Spinning facility is shown. In Figure 3, the process flow chart showing the step-by-step operation of the Weaving facility is shown. In Figure 4, the process flow chart showing the step-by-step operation of the Dye Finishing facility is shown.
Kıvanç Textile Factory has 4 facilities that are integrated with each other. In fact, thanks to these facilities, each of which has the quality and size of a separate factory, Kıvanç Textile Factory carries out all the processes from fiber forming to fabric weaving within its own facilities. The fabric, which is the product output of the factory, first starts its life cycle at the Fiber Dye facility, where the dyeing process of the raw fiber takes place. Then, it continues its life cycle in the yarn facility, with the blending of dyed and undyed fibers and turning them into yarn through various processes. Then, it completes the phase during which it takes the form of raw fabric in the Weaving facility. It completes its life cycle in the Dye Finishing plant, where the raw fabric is both treated and made into its final dyed shape in line with the customer’s demand. These facilities have an enclosed area of 104,010 m2 within a total land area of 160,654 m2. Land transport is used for transitions between each facility.

Product Lifecycle

The fabric type called Tricia, whose calculations will be performed using the ISO-14067 standard, was chosen because it is the factory’s best-selling export product. With the selection of the product to be calculated, the current process of the product was created as shown in Figure 1, Figure 2, Figure 3 and Figure 4, and we started to follow this process step by step. After it was purchased as fiber, the 562.5 kg wool fiber portion of the 1250 kg fiber blend was dyed at the Fiber Dye factory. The processes carried out in the Spinning factory were followed step by step for the transformation from 1250 kg of fiber blend to 1165 kg of yarn.
After the yarn process, it became a raw fabric by being woven in the Weaving factory, where 1165 kg of yarn was transformed into 3500 m of raw fabric. The raw fabric was then moved to the Dye Finishing facility for its final treatment, after which it was ready to be shipped to the customer, totaling 3500 m. All these processes were followed step by step, and it was noted which energy was used and how. The energy types of the processes through which the production stages of the product are completed have been determined. The energy types used in the process stages are shown in Table 2.

3. Results and Discussion

The results of this study have implications for future work in the field of green agreements and sustainability, particularly for production facilities. While the findings and analyses show how much carbon was released at which point, the study sets a serious example for other business and production facilities. In this study, ISO-14067 Product Based Carbon Footprint Calculation was used as a standard. The fabric and energy data were collected by sequentially measuring each process at the Kıvanç Textile Factory.
Energy analyzers were used for electricity measurements, while electronic natural gas meters were employed for natural gas measurements. Photos of these are shown in Figure 5. Energy analyzers were used to measure energy consumption, which is the most critical stage in the calculation of carbon emissions. In Figure 6, the energy consumption measurement with the help of energy analyzers for some processes is shown. The images from the processes of the “Tricia” fabric are shown in Figure 7. Among the analyzers used for the measurements, the models used in the Fiber Dye plant and Dye Finishing plant measure the electricity consumption instantly and record them continuously with the help of SCADA.
A portable energy analyzer was used for measurements in other facilities. The study is based on the production in 2023 of the Tricia fabric, which was specially selected in the factory where the fabric was produced. The energy data of all wet and dry enterprises used in the production of this model were measured as follows. The analysis and subsequent evaluations for the Trica model are given below. The international coefficients used in the carbon emission calculations are shown in Table 3.

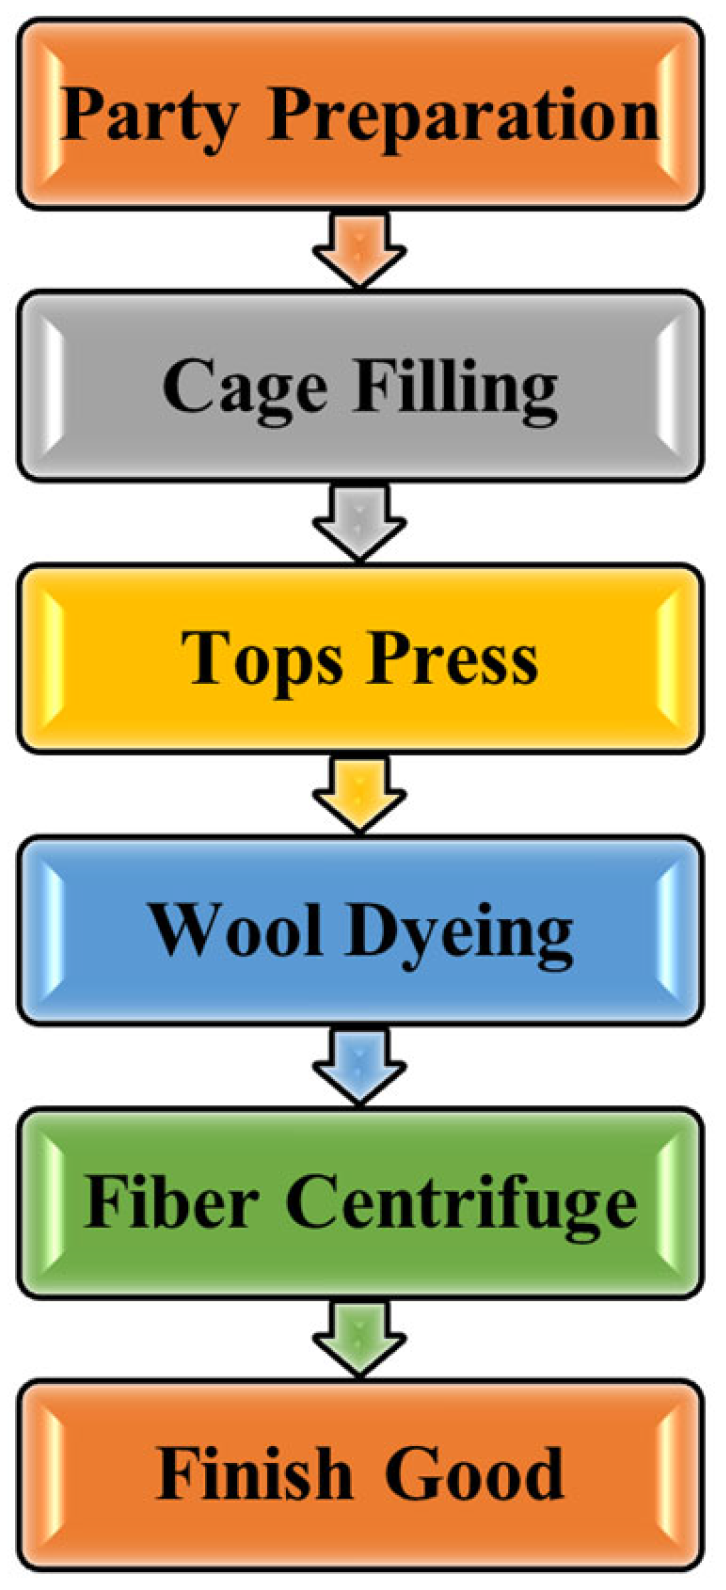
3.1. Life Cycle of Fabric: The “Fiber Dye Facility”

In the facility, the raw fiber undergoes a predetermined processing sequence. The wet process is carried out with the help of machines by using 562.5 kg wool fiber chemicals and dyes. Water, electricity, and steam energy are used extensively. Here, it is shown in Table 4 in which machine and for how long energy is used, and the table also details the energy consumption for each machine that is used in the fiber dyeing process. After this process, it is transported to the Spinning mill with a truck inside the factory. Also, the carbon emission calculation for the Fiber Dye Facility is shown in Table 5.

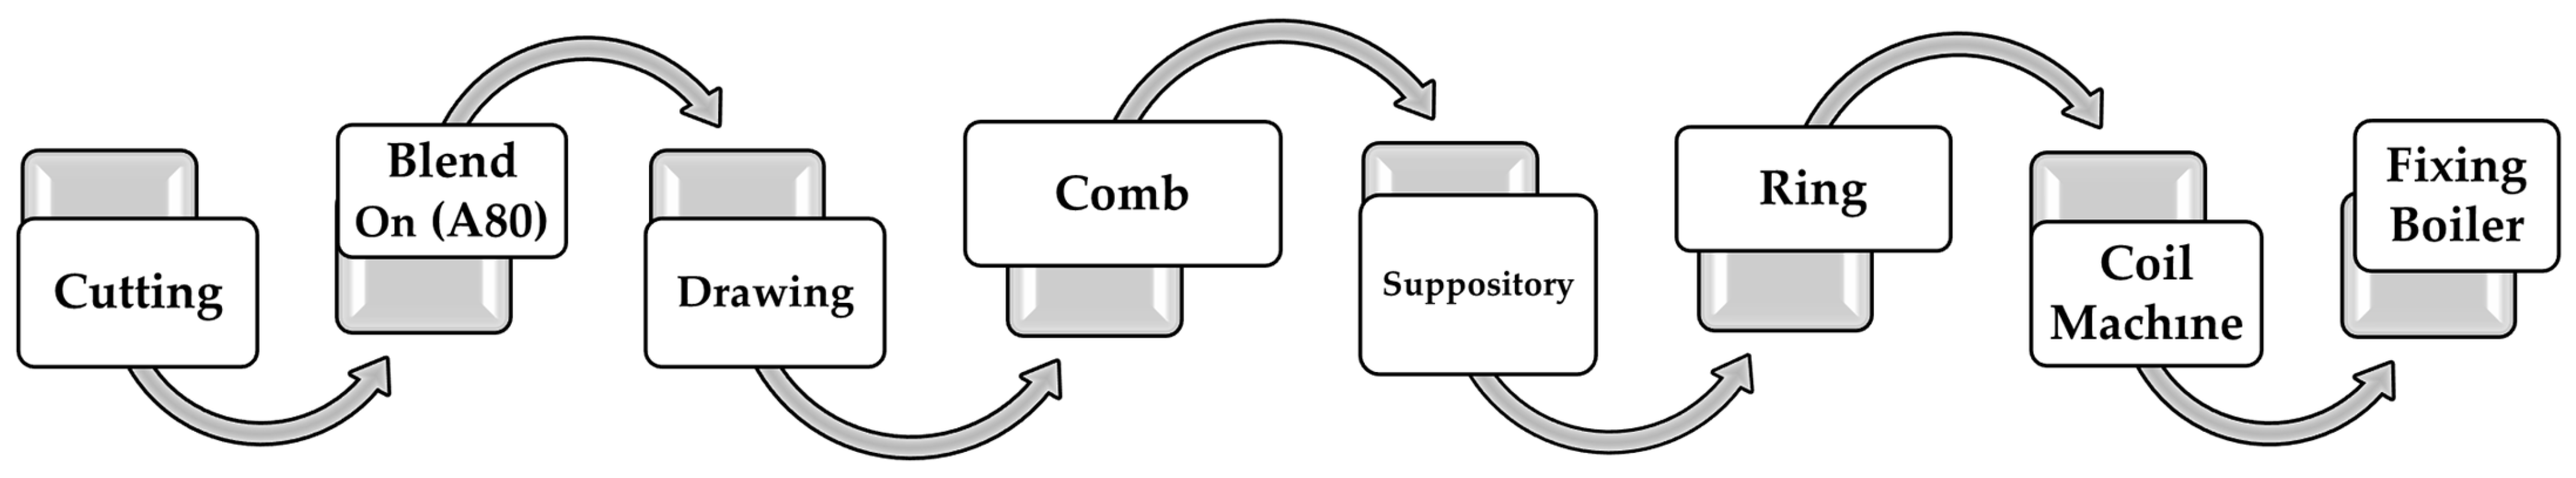
3.2. Life Cycle of Fabric: The “Yarn Facility”

The yarn adventure begins with the blending of 562.5 kg of dyed wool fiber and 562.5 kg of polyester fiber. In the 1250 kg blend yarn plant, it is turned into yarn with the use of electrical energy and the help of machines. The process carried out in the Spinning plant—the machine distribution, the machine usage time in production, and the energy consumption—are shown in Table 6. The carbon emission table resulting from the measurement of this whole process is shown in Table 7. A total of 1.78 tons of CO2e carbon emissions were calculated in the process of completing the life cycle of the fiber blend, which entered as 1250 kg in the Spinning plant, as 1165 kg of yarn.

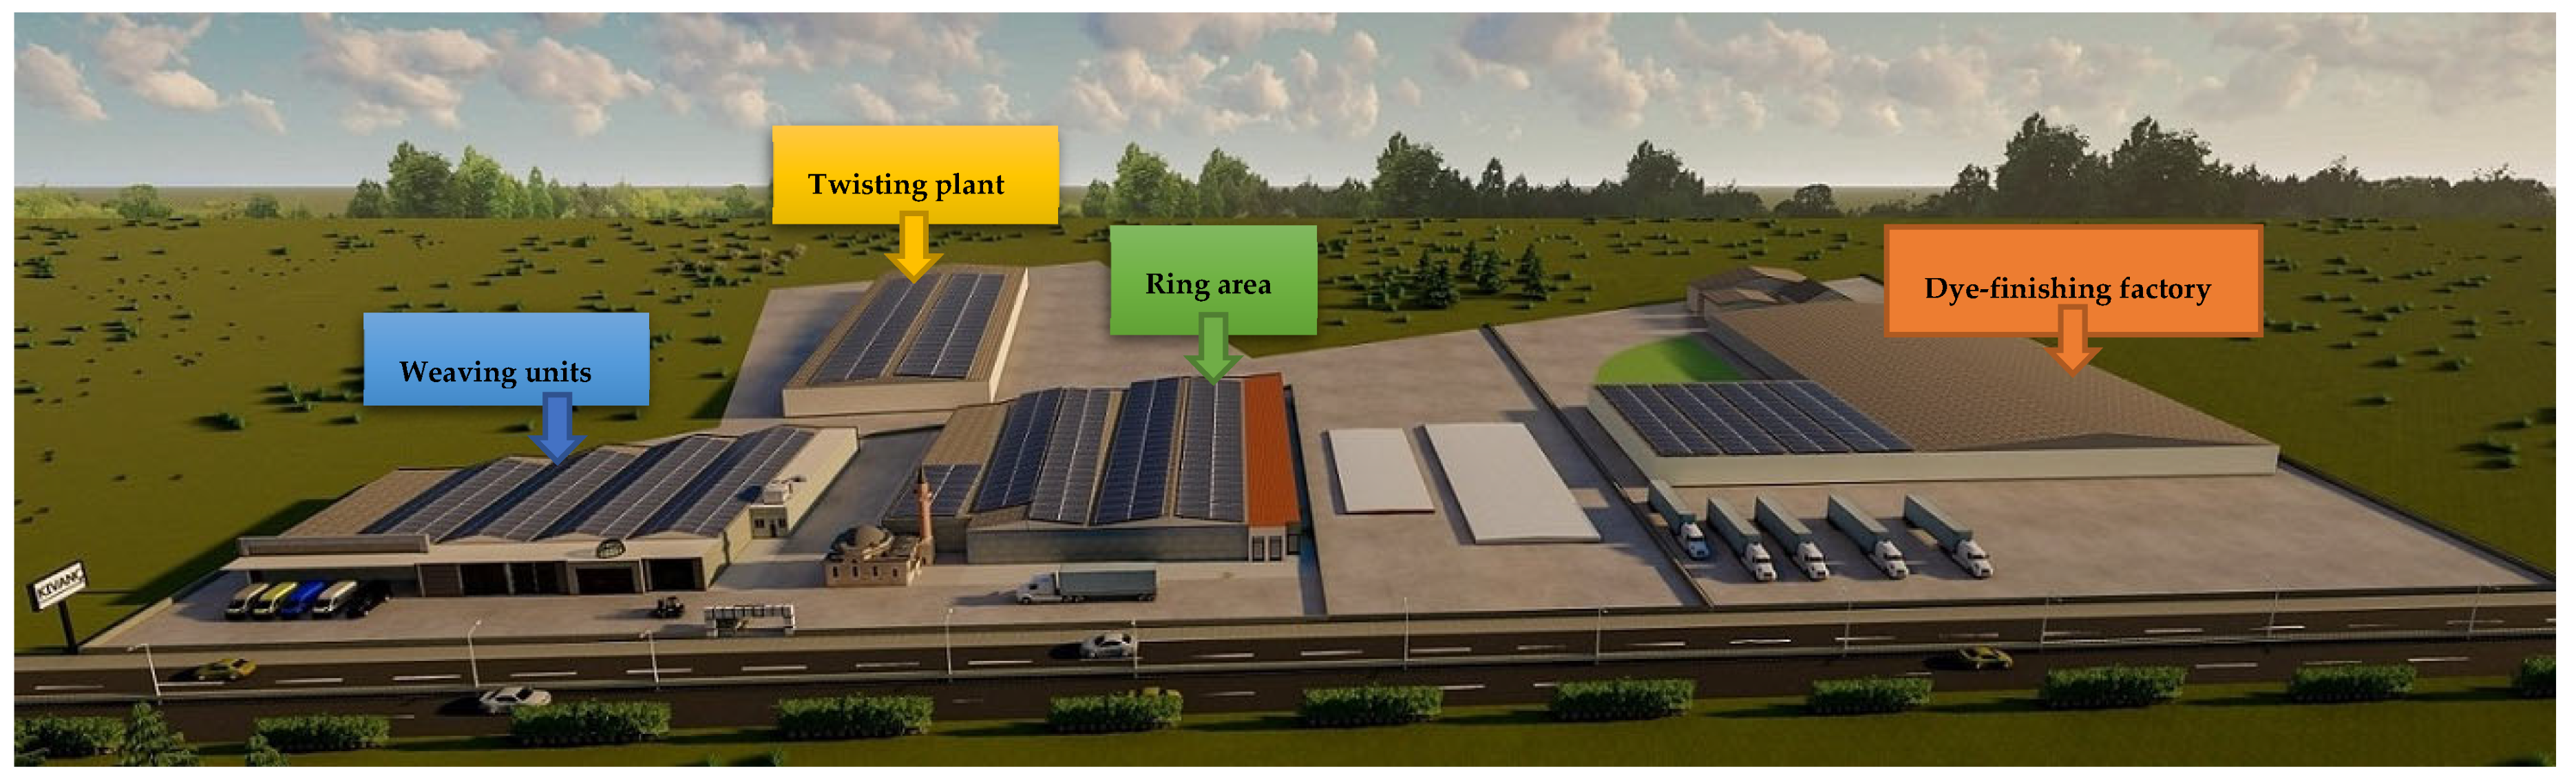
3.3. Life Cycle of Fabric: The “Weaving Facility”

Completing its yarn adventure, Tricia has become a raw fabric in the Weaving facility. The fabric, which is woven raw for 3500 m, first undergoes wet processing in the weaving as preliminary preparation and then becomes a fabric with the help of weaving looms for dry processing. Electricity and natural gas are used for wet processing. Natural gas is used for steam generation. The process in the weaving mill is shown in Figure 7. Data showing the calculations for this process are shown in Table 8. A total of 0.73 tons of CO2e carbon emissions were calculated for Trica in the Weaving facility in Table 9.

3.4. Life Cycle of Fabric: The “Dye Finishing Facility”

In the Dye Finishing facility, the fabric is sewn as per the customer specifications. Electricity, steam, natural gas, and water are used abundantly in this facility, which is defined as a wet operation. A total of 1.42 tons of CO2e carbon emissions were calculated in this facility. The process for the Tricia fabric in the Dye Finishing plant, which is defined as a wet plant, is shown in Table 10. The carbon emission calculation is shown in Table 11.

3.5. Life Cycle of Fabric: “Total Calculation”

All processes of the production of the Tricia fabric in the Kıvanç Textile Factory, from fiber to fabric, were followed, and energy consumption calculations were carried out. The processes were followed by conducting separate calculations. In addition, carbon emissions arising from transportation in the chemical, dye, and fiber supply process are calculated and shown in Table 12. A total of 9.24 tons of CO2e carbon emissions were calculated during this transportation process. In this study, it has been calculated that 0.95 tons of CO2e carbon emissions occur in the transportation of raw materials for the Tricia fabric when the calculated fabric quantity is proportioned to the raw material used. The energy resources consumed by the fabric throughout its life cycle face some uncertainties in the processes. An uncertainty table has been created to account for variables in carbon emissions. In Table 13, the calculation table for carbon emissions resulting from these uncertainties is shared. The carbon emissions of the energy used in the processes are calculated separately and shown in Table 14. As a result of all calculations, a total of 6.00 tons of CO2e carbon emissions was calculated. The carbon emission values of the facilities where the processes take place in this process are shown in Table 15. The graphical representation of these values is shown in Figure 8.
A Gaussian mixture model was used to calculate uncertainty [41]. Uncertainty calculation is important, as it determines the confidence level of the calculated GHG inventory. If the uncertainty is below 5%, the confidence level is stated as “reasonable”, and if it is above 5%, the confidence level is stated as “limited”. According to the uncertainty calculations carried out for this study, the total uncertainty was calculated as 5%. Accordingly, the calculations are at a “reasonable” level.

4. Discussion

One of the most important steps for a sustainable life and environment is to reduce GHG emissions. One of the most important sources of controlling and reducing greenhouse gases is reducing carbon emissions. In this article, a study was conducted in this field. In this context, analyses were carried out by measuring the CO2e for all processes separately throughout the life cycle of the Tricia fabric, which is the best-selling export product of the Kıvanç Textile factory. At the end of the fabric production process, which started with a fiber mixture of 1250 kg, it was calculated that the 3500 m Tricia fabric released a total of 6.00 tons of CO2e. It has been determined that 1 m of “Tricia” fabric emits 1.72 kg of CO2e carbon to nature. The processes to produce “Tricia” fabric in all factories were followed step by step, and CO2e was calculated on a product basis. It has been observed that the Fiber Dyeing plant emits 0.79 tons of CO2e, the Yarn Dyeing plant 1.79, the Weaving plant 0.73, and the Dye Finishing plant 1.43 tons of CO2e. With these measurements, it has been determined how much carbon is emitted to produce the selected fabric, at which stages, and from which energy sources, and from which energy it is consumed. By making separate measurements of the energy types used, it was determined which energy type and how much carbon were released. In this context, it has been calculated that 4.33 tons of CO2e originate from electrical energy, 0.36 tons of CO2e from natural gas energy, and 0.95 tons of CO2e from diesel fuel (used for transportation purposes). Monitoring sources of uncertainty is a necessary process throughout the process of a product GHG inventory. The emission amount due to the uncertainties in this study is 0.31 tons CO2e.
As a result of the analyses and calculations that were carried out, the main novelty of this paper is to carry out the groundwork for more focused and detailed studies to identify and reduce carbon emissions at various stages for a sustainable life and environment, and the results will increase even more. The effects of the energy types used on carbon emissions have been shown, and it has been determined that electricity and diesel consumption have a high impact on carbon emissions. Since this study is according to both life cycle assessment (LCA) and ISO-14067 Product Based Carbon Footprint calculations, the carbon emission processes of the selected fabric type were followed, and calculations were carried out.

5. Conclusions

The purpose of calculating the product-based carbon footprint is to determine, step by step, what types of energy the produced product needs at which stages, and how much carbon it emits from these types of energy. Accordingly, calculations were carried out for the selected product using both life cycle analysis and the ISO-14067 Product Based Carbon Footprint standard. As a party to international agreements, Turkey has shown that efforts to reduce carbon emissions will be carried out. In order to have a positive impact on this, this study aims to contribute to the work to be done to achieve the 2050 carbon neutral target and to have a more permanent effect by intervening in the root cause phenomenon and carbon emissions. The results are presented below:
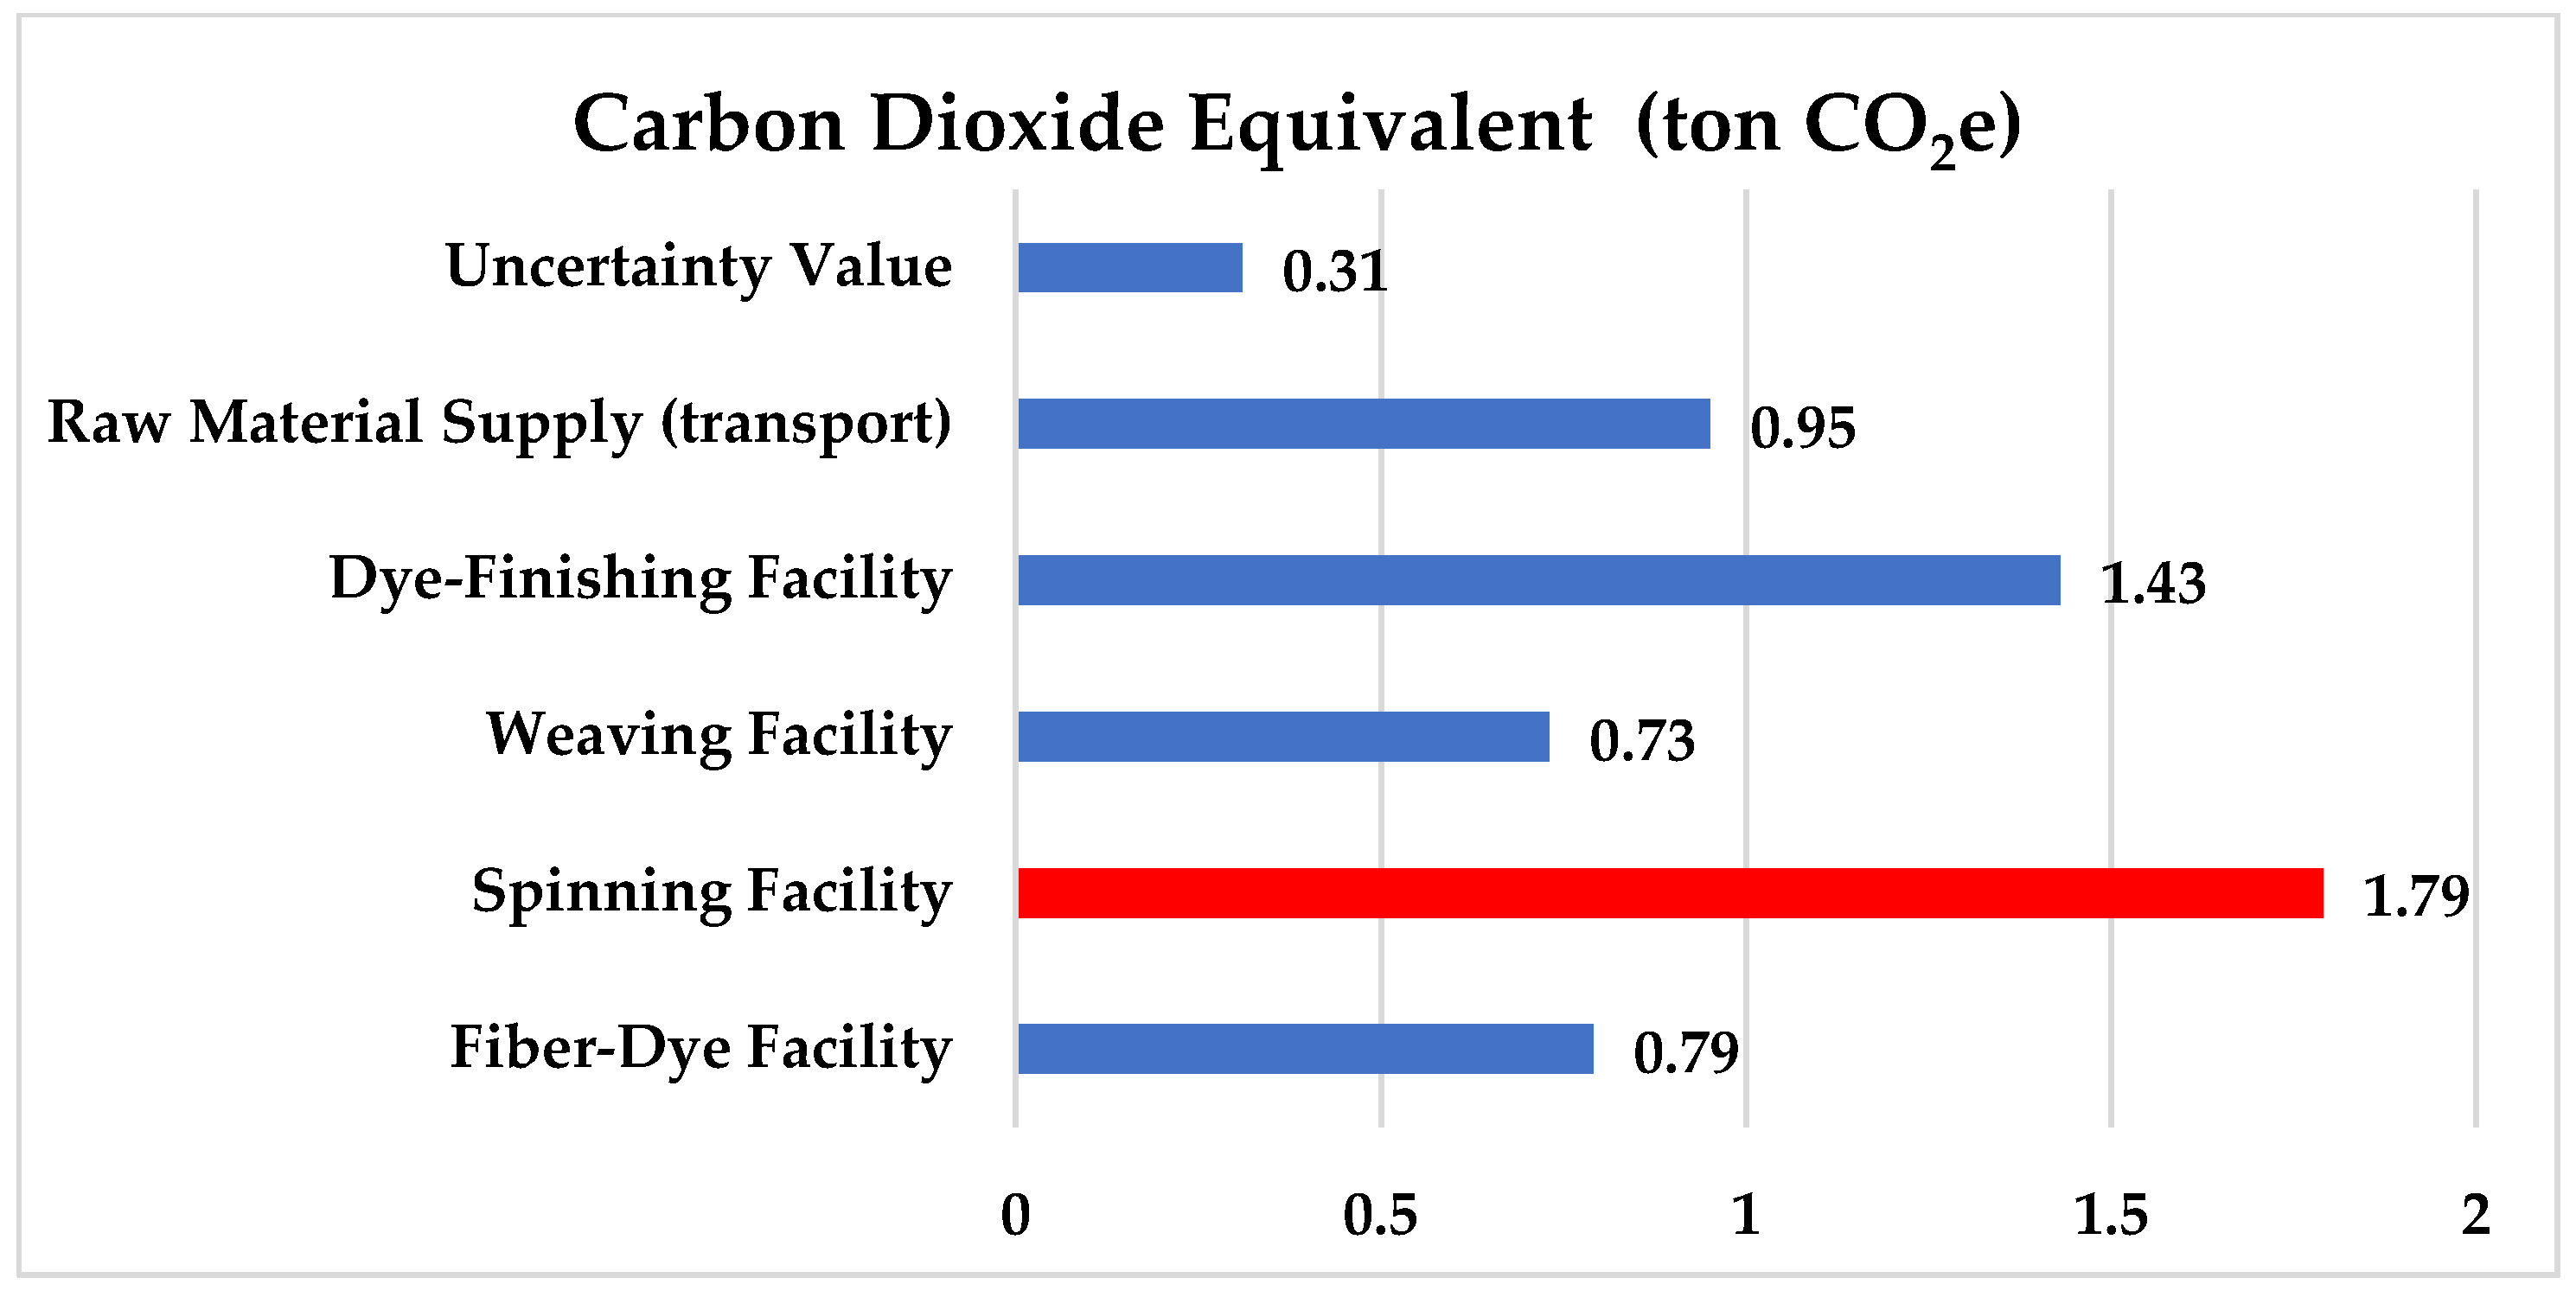
  • During the production phase of the product, the carbon emissions occurring in all enterprises were calculated separately. As a result of this, with 1.79 tCO2e emissions, the Spinning mill was the one with the highest carbon emissions.
  • The types of energy needed during the production stages were determined, and it was determined that the energy type causing the most carbon emissions was electricity, with a carbon emission of 4.57 tCO2e.
  • The carbon emissions attributed to uncertainties in the production process are calculated to be 0.31 tCO2e.
  • The carbon emission resulting from the supply processes of fibers, dyes, and chemicals used in the production of the Tricia fabric, which was preferred because it is the most exported product, was calculated as 0.95 tCO2e.
  • When all production stages of the Tricia fabric are analyzed, a carbon emission of 6.00 tCO2e is calculated for a total production of 3500 m. Accordingly, it has been determined that 1 m of Tricia fabric releases 1.72 kg CO2e to nature.
  • The study identified the processes and energy sources that contribute the most to carbon emissions. As a result of this analysis, root causes have been revealed and determined in order to intervene in carbon emissions. In particular, it has been determined that electricity consumption has the greatest effect on carbon emissions, and it has been suggested to reduce carbon emissions by using energy-efficient machines. In addition, it is emphasized that reducing the number of machines and process steps with the changes that can be applied in the processes will also reduce energy consumption and therefore help reduce carbon emissions.
Comparing the data of this study with the corporate carbon footprint calculation of the same factory is thought to have a great impact on reducing overall carbon emissions, and therefore, it is recommended to conduct a corporate footprint study in future studies.

Author Contributions

Methodology, P.T. and T.D.; Validation, P.T.; Formal analysis, H.A. and T.D.; Resources, H.A.; Data curation, H.A.; Writing—original draft, P.T., H.A. and T.D.; Supervision, T.D. All authors have read and agreed to the published version of the manuscript.

Funding

This research was supported by the Scientific Project Unit of Adana Alparslan Türkeş Science and Technology University (Project Number: 23103006).

Data Availability Statement

Data are contained within the article.

Acknowledgments

We would like to thank the Kıvanç Textile family for all the opportunities and permissions that they provided in the selection of the “Tricia” fabric, which is the main element of this study, and in all the measurements that were necessary for the carbon calculations.

Conflicts of Interest

Author Hakan Alıcı was employed by the Kıvanç Textile Industry and Commerce Incorporated Company. The remaining authors declare that the research was conducted in the absence of any commercial or financial relationships that could be construed as a potential conflict of interest.

Abbreviations

CFPCarbon footprintCFICarbon footprint density
CO2Carbon dioxideCFPComparable carbon footprint
CH4MethaneLCALife cycle assessment
N2ONitrous OxideGJGigajoule
HFCsHydrofluoride carbonsEMSEnvironmental management system
PFCsPerfluorocarbonsSDGsSustainable Development Goals
SF6Sulfurhexa fluorideTATextile and apparel
kgKilogramCPPsCleaner production practices
ISOInternational Organization for StandardizationLTIsMajor textile industries
NCHNatural corn huskAFCSAverage Forest Carbon Capture
ACFAgro-industry carbon footprintCFPComparable carbon footprint
GHGGreenhouse gasLCALife cycle assessment

References

  1. Available online: https://youth.europa.eu/get-involved/sustainable-development/how-reduce-my-carbon-footprint_en (accessed on 20 October 2023).
  2. Peng, S.-Y.; Liu, J.-Y.; Geng, Y. Assessing Strategies for Reducing the Carbon Footprint of Textile Products China under the Shared Socioeconomic Pathways Framework. Clim. Change Econ. 2022, 13, 2240004. [Google Scholar] [CrossRef]
  3. Coşkun, S.; Doğan, N.A. Tekstil Fabrikası Karbon Ayak İzi Hesabı: Kumaş Boyama, İplik Boyama, Baskı ve Konfeksiyon Bölümleri. Süleyman Demirel Üniversitesi Fen Bilim. Enstitüsü Derg. 2021, 25, 28–35. [Google Scholar] [CrossRef]
  4. Cheng, Y.; Liang, H.-E. Calculation and evaluation of industrial carbon footprint of cotton denim jacket. J. Eng. Fibers Fabr. 2021, 16, 15589250211020387. [Google Scholar] [CrossRef]
  5. Chen, B.; Qian, W.; Yang, Y.; Liu, H.; Wang, L. Carbon Footprint and Water Footprint of Cashmere Fabrics. Fibres Text. East. Eur. 2021, 29, 94–99. [Google Scholar] [CrossRef]
  6. Zheng, M.; Zhang, K.; Zhang, J.; Zhu, L.; Du, G.; Zheng, R. Cheap, high yield, and strong corn husk-based textile bio-fibers with low carbon footprint via green alkali retting-splicing-twisting strategy. Ind. Crop. Prod. 2022, 188, 115699. [Google Scholar] [CrossRef]
  7. Moazzem, S.; Crossin, E.; Daver, F.; Wang, L. Baseline Scenario of Carbon Footprint of Polyester T-Shirt. J. Fiber Bioeng. Inform. 2018, 11, 1–14. [Google Scholar] [CrossRef]
  8. Huang, B.; Zhao, J.; Geng, Y.; Tian, Y.; Jiang, P. Energy-related GHG emissions of the textile industry in China. Resour. Conserv. Recycl. 2017, 119, 69–77. [Google Scholar] [CrossRef]
  9. Lin, B.; Moubarak, M. Mitigation potential of carbon dioxide emissions in the Chinese textile industry. Appl. Energy 2014, 113, 781–787. [Google Scholar] [CrossRef]
  10. Sim, J.; Prabhu, V. The life cycle assessment of energy and carbon emissions on wool and nylon carpets in the United States. J. Clean. Prod. 2018, 170, 1231–1243. [Google Scholar] [CrossRef]
  11. Yan, Y.; Wang, C.; Ding, D.; Zhang, Y.; Wu, G.; Wang, L.; Liu, X.; Du, C.; Zhang, Y.; Zhao, C. Industrial carbon footprint of several typical Chinese textile fabrics. Acta Ecol. Sin. 2016, 36, 119–125. [Google Scholar] [CrossRef]
  12. Shi, S.; Yin, J. Global research on carbon footprint: A scientometric review. Environ. Impact Assess. Rev. 2021, 89, 106571. [Google Scholar] [CrossRef]
  13. Adhikari, P.; Mahmoud, H.N.; Ellingwood, B.R. Life-cycle cost and sustainability analysis of light-frame wood residential communities exposed to tornados. Nat. Hazards 2021, 109, 523–544. [Google Scholar] [CrossRef]
  14. Xie, L.; Xue, Q.; Yuan, Z. Composition and spatial difference of agro-industry carbon footprint in Hebei province, North China. Ecol. Indic. 2019, 97, 141–149. [Google Scholar] [CrossRef]
  15. Qian, W.; Ji, X.; Xu, P.; Wang, L. Carbon footprint and water footprint assessment of virgin and recycled polyester textiles. Text. Res. J. 2021, 91, 2468–2475. [Google Scholar] [CrossRef]
  16. Xu, W.-H.; Xie, Y.-L.; Ji, L.; Cai, Y.-P.; Yang, Z.-F.; Xia, D.-H. Spatial-temporal evolution and driving forces of provincial carbon footprints in China: An integrated EE-MRIO and WA-SDA approach. Ecol. Eng. 2022, 176, 106543. [Google Scholar] [CrossRef]
  17. Guo, X.; Lin, K.; Huang, H.; Li, Y. Carbon footprint of the photovoltaic power supply chain in China. J. Clean. Prod. 2019, 233, 626–633. [Google Scholar] [CrossRef]
  18. Liu, S.; Liu, H.; Meng, Y.; Li, Q.; Wang, L. Review of Carbon Emission and Carbon Neutrality in the Life Cycle of Silk Products. Fibres Text. East. Eur. 2022, 30, 1–7. [Google Scholar] [CrossRef]
  19. Smouh, S.; Gargab, F.Z.; Ouhammou, B.; Mana, A.A.; Saadani, R.; Jamil, A. A New Approach to Energy Transition in Morocco for Low Carbon and Sustainable Industry (Case of Textile Sector). Energies 2022, 15, 3693. [Google Scholar] [CrossRef]
  20. Kumar, A.; Mariappan, G. Effect of Laundry Parameters on Micro Fiber Loss during Washing and Its Correlation with Carbon Footprint. J. Nat. Fibers 2022, 19, 14744–14754. [Google Scholar] [CrossRef]
  21. Wang, C.; Wang, L.; Liu, X.; Du, C.; Ding, D.; Jia, J.; Yan, Y.; Wu, G. Carbon footprint of textile throughout its life cycle: A case study of Chinese cotton shirts. J. Clean. Prod. 2015, 108, 464–475. [Google Scholar] [CrossRef]
  22. Cowman, S. Commentary on Forensic and non-forensic psychiatric nursing skills and competencies for psychopathic and personality disordered patients. J. Clin. Nurs. 2012, 23, 1170–1171. [Google Scholar] [CrossRef] [PubMed]
  23. Hao, C.; Sun, L.; Wang, X.; Zhu, Z.; Dong, X.; Bao, W.; Wang, L. Environmental Profit and Loss of Industry: The Case of Textile Industry in Jiaxing. Pol. J. Environ. Stud. 2022, 31, 4137–4145. [Google Scholar] [CrossRef]
  24. Harsanto, B.; Primiana, I.; Sarasi, V.; Satyakti, Y. Sustainability Innovation in the Textile Industry: A Systematic Review. Sustainability 2023, 15, 1549. [Google Scholar] [CrossRef]
  25. Bhattacharya, S. Impact of the New Textile Policy and Textile Waste Management System in India and a Move towards Sustainable Management. Int. J. Res. Appl. Sci. Eng. Technol. 2021, 9, 1016–1021. [Google Scholar] [CrossRef]
  26. Al Mamun, A.; Bormon, K.K.; Rasu, M.N.S.; Talukder, A.; Freeman, C.; Burch, R.; Chander, H. An Assessment of Energy and Groundwater Consumption of Textile Dyeing Mills in Bangladesh and Minimization of Environmental Impacts via Long-Term Key Performance Indicators (KPI) Baseline. Textiles 2022, 2, 511–523. [Google Scholar] [CrossRef]
  27. Cai, Y.-J.; Choi, T.-M. A United Nations’ Sustainable Development Goals perspective for sustainable textile and apparel supply chain management. Transp. Res. Part E Logist. Transp. Rev. 2020, 141, 102010. [Google Scholar] [CrossRef]
  28. Mulrow, J.; Machaj, K.; Deanes, J.; Derrible, S. The state of carbon footprint calculators: An evaluation of calculator design and user interaction features. Sustain. Prod. Consum. 2019, 18, 33–40. [Google Scholar] [CrossRef]
  29. da Silva, P.C.; de Oliveira Neto, G.C.; Correia, J.M.; Tucci, H.N. Evaluation of economic, environmental and operational performance of the adoption of cleaner production: Survey in large textile industries. J. Clean. Prod. 2020, 278, 123855. [Google Scholar] [CrossRef]
  30. Mancini, M.S.; Galli, A.; Niccolucci, V.; Lin, D.; Bastianoni, S.; Wackernagel, M.; Marchettini, N. Ecological Footprint: Refining the carbon Footprint calculation. Ecol. Indic. 2016, 61, 390–403. [Google Scholar] [CrossRef]
  31. Sarı, B.; Zarifi, F.; Alhasan, M.; Güney, H.; Türkeş, S.; Sırlıbaş, S.; Yiğit, D.C.; Kılınççeker, G.; Şahin, B.; Keskinkan, O. Determining the Contributions in a Denim Fabric Production for Sustainable Development Goals: Life Cycle Assessment and Material Input Approaches. Sustainability 2023, 15, 5315. [Google Scholar] [CrossRef]
  32. Bin, H.; Shusheng, Q.; Tengyu, L. Modeling product carbon footprint for manufacturing process. J. Clean. Prod. 2023, 402, 136805. [Google Scholar] [CrossRef]
  33. Mukhtarov, S.; Aliyev, F.; Aliyev, J.; Ajayi, R. Renewable Energy Consumption and Carbon Emissions: Evidence from an Oil-Rich Economy. Sustainability 2022, 15, 134. [Google Scholar] [CrossRef]
  34. Khan, M.A.; Cárdenas-Barrón, L.E.; Treviño-Garza, G.; Céspedes-Mota, A. Optimal circular economy index policy in a production system with carbon emissions. Expert Syst. Appl. 2023, 212, 118684. [Google Scholar] [CrossRef]
  35. Shabir, I.; Dash, K.K.; Dar, A.H.; Pandey, V.K.; Fayaz, U.; Srivastava, S.; Nisha, R. Carbon footprints evaluation for sustainable food processing system development: A comprehensive review. Futur. Foods 2023, 7, 100215. [Google Scholar] [CrossRef]
  36. Polgár, A. Carbon footprint and sustainability assessment of wood utilisation in Hungary. Environ. Dev. Sustain. 2023, 1–25. [Google Scholar] [CrossRef]
  37. Rizan, C.; Lillywhite, R.; Reed, M.; Bhutta, M.F. The carbon footprint of products used in five common surgical operations: Identifying contributing products and processes. J. R. Soc. Med. 2023, 116, 199–213. [Google Scholar] [CrossRef]
  38. Tsai, W.-H. Balancing Profit and Environmental Sustainability with Carbon Emissions Management and Industry 4.0 Technologies. Energies 2023, 16, 6175. [Google Scholar] [CrossRef]
  39. Gomilšek, R.; Čuček, L.; Homšak, M.; Tan, R.R.; Kravanja, Z. Carbon Emissions Constrained Energy Planning for Aluminum Products. Energies 2020, 13, 2753. [Google Scholar] [CrossRef]
  40. Available online: https://ghgprotocol.org (accessed on 20 October 2023).
  41. Gao, G.; Jiang, H.; Vink, J.C.; Chen, C.; El Khamra, Y.; Ita, J.J. Gaussian mixture model fitting method for uncertainty quantification by conditioning to production data. Comput. Geosci. 2019, 24, 663–681. [Google Scholar] [CrossRef]
Figure 1. Product process chart of Fiber Dye facility.
Energies 17 00312 g001
Figure 2. Product process chart of Spinning facility.
Energies 17 00312 g002
Figure 3. Product process chart of Weaving facility.
Energies 17 00312 g003
Figure 4. Product process chart of Dye Finishing facility and other relevant units.
Energies 17 00312 g004
Figure 5. (a) Energy analyzer (portable system); (b) steam meter; (c) energy analyzer (fixed system); (d) natural gas meter.
Energies 17 00312 g005
Figure 6. Energy measurement from the processes of the “Tricia” fabric.
Energies 17 00312 g006
Figure 7. The images of the process of the production of “Tricia” fabric.
Energies 17 00312 g007
Figure 8. Carbon dioxide-equivalent graph for “Tricia” fabric.
Energies 17 00312 g008
Table 1. Other current articles in the literature.
ReferencesJournalYearTitleAimScope/Method
Bin H., Shusheng Q. and Tengyu L. [32]Journal of Cleaner Production2023Modeling product carbon footprint for manufacturing processTo decompose and evolve the carbon footprint of product manufacturing from the workshop layer, forming a systematic carbon emission quantitative modelThe carbon emissions model for manufacturing process of wind turbines
Mukhtarov S., Aliyev F., Aliyev J. and Ajayi R. [33]Sustainability2023Renewable Energy Consumption and Carbon Emissions:
Evidence from an Oil-Rich Economy
To examine the influence of renewable energy consumption, real GDP per capita, exports, and imports on consumption-based CO2 emissions in AzerbaijanThe Dynamic Ordinary Least Squares Method (DOLS)
Amin K., Barron L.E., Garza G. and Mota A. [34]Expert Systems with Applications2023Optimal circular economy index policy in a production
system with carbon emissions
To propose a profit-maximizing production system where all the products are produced with a variable circularity levelInvestigating how the optimal policies under all considered cases help the manufacturer increase profit and reduce carbon emissions significantly
Shabir I., Dash K.K., Dar A.H., Pandey V.K., Fayaz U., Srivastava S. and Nisha R. [35]Future Foods2023Carbon footprints evaluation for sustainable food processing
system development: A comprehensive review
To analyze the carbon footprint of food processing operations such as
food preservation (refrigeration, freezing), processing, and packaging
Discussing the utilization of sustainable energy sources and investments in energy efficient equipment, optimizing the supply chain and logistics, minimizing water consumption, and correctly managing wastes
Polgar A. [36]Environment, Development
and Sustainability
2023Carbon footprint and sustainability assessment of wood utilisation in HungaryTo determine the carbon footprint of logging during utilization based on scenario analysis in national default and theoretical assortment structures (11 additional scenarios for each forest stand) within the entire life cycle of raw wood productsA comparative environmental life cycle analysis (LCA) for intermediate and final cutting was performed
Rizan C., Lillywhite R., Reed M. and Bhutta M.F. [37]Journal of the Royal
Society of Medicine
2023The carbon footprint of products used in five common surgical operations: identifying contributing products and processesTo evaluate the carbon footprint of products used within five common operations, and to identify the biggest contributors (hotspots)A predominantly process-based carbon footprint analysis
Tsai W.H. [38]Energies2023Balancing Profit and Environmental Sustainability with
Carbon Emissions Management and Industry 4.0 Technologies
To optimize product mixes for profit, tax, carbon, and resource efficiency Employs mathematical models based on Activity-Based Costing (ABC) and the Theory of Constraints (TOC) to address carbon emissions, waste reuse, and energy recovery
Gomilsek R., Cucek L., Homsak M.,
Tan R.R. and Kravanja Z. [39]
Energies2020Carbon Emissions Constrained Energy Planning
for Aluminum Products
To focus on energy planning constrained by CO2 emissions and determine the required amount of CO2 emissions from electricity sources in order to meet specified CO2 emission benchmarkThree different approaches of energy planning are considered:
(i) an insight-based, graphical targeting approach;
(ii) an algebraic targeting approach of cascade analysis;
(iii) an optimization-based approach, using a transportation model.
Table 2. Types of energy used from process stages.
Business NameEnergy TypePurpose of Use
Fiber Dye FacilityElectricMachine Consumption
Natural gasSteam
Spinning FacilityElectricMachine Consumption
Weaving FacilityElectricMachine Consumption
Natural gasSteam
Dye Finishing FacilityElectricMachine Consumption
Natural gasSteam, Heat
Table 3. International carbon emission coefficients [40].
ActivityFuelUnitkg CO2e FuelUnitkg CO2e
Gaseous FuelsButoneTonnes342.1473Liquid FuelsDiesel (Average biofuel blend)Tonnes720.72857
Liters0.19686Liters0.60986
KWh (Net CV)0.02719KWh (Net CV)0.06109
KWh (Gross CV)0.02509KWh (Gross CV)0.0575
CNGTonnes542.1118Diesel (100% mineral diesel)Tonnes745.68125
Liters0.09487Liters0.62874
KWh (Net CV)0.04335KWh (Net CV)0.06264
KWh (Gross CV)0.03912KWh (Gross CV)0.05888
LNGTonnes882.3478Fuel OilTonnes709.08076
Liters0.39925Liters0.69723
KWh (Net CV)0.07055KWh (Net CV)0.06264
KWh (Gross CV)0.6367KWh (Gross CV)0.05888
LPGTonnes347.0093Gas OilTonnes740.69721
Liters0.18383Liters0.63253
KWh (Net CV)0.02719KWh (Net CV)0.06264
KWh (Gross CV)0.02532KWh (Gross CV)0.05888
Natural GasTonnes434.4289LubricantsTonnes824.0484
Liters0.34593Liters---
KWh (Net CV)0.03474KWh (Net CV)0.0728
KWh (Gross CV)0.03135KWh (Gross CV)0.06843
Natural Gas (100% mineral blend)Tonnes434.4289NaphthaTonnes640.80918
Liters0.34593Liters---
KWh (Net CV)0.03474KWh (Net CV)0.05076
KWh (Gross CV)0.03135KWh (Gross CV)0.04822
Other Petroleum GasTonnes304.5097Petrol (average biofuel blend)Tonnes824.1216
Liters0.11154Liters0.61328
KWh (Net CV)0.02352KWh (Net CV)0.06774
KWh (Gross CV)0.02164KWh (Gross CV)0.06774
PropaneTonnes350.4555Petrol (100% mineral petrol)Tonnes812.61052
Liters0.18046Liters0.60283
KWh (Net CV)0.02719KWh (Net CV)0.06552
KWh (Gross CV)0.02503KWh (Gross CV)0.06224
Table 4. Product process chart of Fiber Dye facility.
Business NameMachine NameHours of Operation (min)Electrical Energy Consumption (kWh)Natural Gas Energy Consumption (sm3)Steam Consumption (kg)Steam-Sourced Natural Gas Consumption (cm3)Natural Gas Total Consumption (m3)Type of Energy UsedNotes
Fiber Dye Facility1Party Preparation604.0000.00.0ElectricityThe total amount of threshing is 1250 kg. In total, 562.5 kg of wool was dyed in this blend.
2Cage Filling907.5000.00.0Electricity
3Top Press302.0000.00.0Electricity
4Wool Dyeing960576.00330045.445.4Electricity, Steam
5Fiber Centrifuge30055.00200.30.3Electricity, Steam
6RF Dryer540900.0000.00.0Electricity
Table 5. Carbon dioxide-equivalent calculation for Fiber Dye facility.
Carbon Emission of “Tricia” Fabric in Fiber Dye Facility
Cause of Carbon EmissionConsumptionEFEmissionsGWPCO2e
CO2CH4N2OCO2CH4N2O
ValueUnitValueUnitValueUnitValueUnitValueUnitValueUnitValueUnitCH4N2O
Natural gas45.70Nm30.34kg/Nm30kg/Nm30kg/Nm30.02Ton0Ton0Ton282650.02
Diesel0.01ton745.68kg/ton0kg/ton0kg/ton0.01Ton0Ton0Ton282650.01
Electricity distributed1544.5kWh493,136.7kg/Gwh6.13kg/Gwh5.72kg/Gwh0.76Ton0.00001Ton0.00001Ton282650.76
Table 6. Product process chart of Spinning facility.
Business NameMachine NameHours of Operation (min)Electrical Energy Consumption (kWh)Natural Gas Energy Consumption (sm3)Steam Consumption (kg)Steam-Sourced Natural Gas Consumption (cm3)Natural Gas Total Consumption (m3)Type of Energy UsedNotes
Spinning Facility1Cutting37547.5000.00.0ElectricityProduction data for 1250 kg blend
2Blend on (A80)37593.8000.00.0Electricity
3Blend Opening (BALE OPENER)37518.8000.00.0Electricity
4Drawing Machine1875135.9000.00.0Electricity
5Comb37550.0000.00.0Electricity
6Suppository1458243.1000.00.0Electricity
7Vater45562657.4000.00.0Electricity
8Coil Machine 1097274.3000.00.0Electricity
9Fixing Boiler 6946.3000.00.0Electricity
Table 7. Carbon dioxide-equivalent calculation for Spinning facility.
Carbon Emission of “Tricia” Fabric in Spinning Facility
Cause of Carbon EmissionConsumptionEFEmissionsGWPCO2e
CO2CH4N2OCO2CH4N2O
ValueUnitValueUnitValueUnitValueUnitValueUnitValueUnitValueUnitCH4N2O
Natural gas0.00Nm30.3459kg/Nm30kg/Nm30kg/Nm3-Ton0Ton0Ton28265-
Diesel0.02Ton745.6813kg/ton0kg/ton0kg/ton0.01Ton0Ton0Ton282650.01
Electricity (distributed)3567.00KWh493,136.7710kg/GWh6.13kg/GWh5.721kg/GWh1.76Ton0.00002Ton0.00002Ton282651.77
Total1.78
Table 8. Product process chart of Weaving facility.
Business NameMachine NameHours of Operation (min)Electrical Energy Consumption (kWh)Natural Gas Energy Consumption (sm3)Steam Consumption (kg)Steam-Sourced Natural Gas Consumption (cm3)Natural Gas Total Consumption (m3)Type of Energy UsedNotes
Weaving Facility1Tahar803.3000.00.0ElectricityWeaving data for 3500 Mt fabric
2Series Warp31021.7000.00.0Electricity
3Size14031.601586.721.821.8Electricity, Steam,
4Loom13,7401374.0000.00.0Electricity
Table 9. Carbon dioxide-equivalent calculation for Weaving facility.
Carbon Emission of “Tricia” Fabric in Weaving Facility
Cause of Carbon EmissionConsumptionEFEmissionsGWPCO2e
CO2CH4N2OCO2CH4N2O
ValueUnitValueUnitValueUnitValueUnitValueUnitValueUnitValueUnitCH4N2O
Natural gas21.80Nm30.34kg/Nm30kg/Nm30kg/Nm30.01ton0ton0ton282650.01
Diesel0.02ton745.68kg/ton0kg/ton0kg/ton0.01ton0ton0ton282650.01
Electricity (distributed)1430.60kwh493,136.7kg/Gwh6.13kg/Gwh5.721kg/Gwh0.71ton0.00001ton0.00001ton282650.71
Total0.73
Table 10. Product process chart of Dye Finishing facility.
Business NameMachine NameHours of Operation (min)Electrical Energy Consumption (kWh)Natural Gas Energy Consumption (sm3)Steam Consumption (kg)Steam-Sourced Natural Gas Consumption (cm3)Natural Gas Total Consumption (m3)Type of Energy UsedNotes
Dye Finishing Facility1Party Preparation1406.4000.00.0Electricity Dye finishing data for 3500 Mt fabric
2Braided Washing300132.5075010.310.3Electricity, Steam,
3RAM350328.4215.830.000.0215.8Electricity, Natural Gas
4Mid-control70014.0000.00.0Electricity
5Transfer1755.8000.00.0Electricity
6Futura Washing76525.5000.00.0Electricity
7Rope Opening23314.6000.00.0Electricity
8RAM350328.4215.830.00.0215.8Electricity, Natural Gas
9Mid-control70014.000.00.00.0Electricity
10Transfer1755.800.00.00.0Electricity
11Incineration706.59.330.00.09.3Electricity, Natural Gas
12Braided Washing300132.50750.010.310.3Electricity, Steam,
13RAM350328.4215.830.00.0215.8Electricity, Natural Gas
14Mid-control70014.000.00.00.0Electricity
15KD1440198.202400.033.033.0Electricity, Steam
16RAM350328.4215.830.00.0215.8Electricity, Natural Gas
17Decofast (old)350105.00291.74.04.0Electricity, Steam
18KD960132.201600.022.022.0Electricity, Steam
19Steaming58335.50875.012.012.0Electricity, Steam
20SuperFinish35011.90350.04.84.8Electricity, Steam
21Quality control4678.600.00.00.0Electricity
Table 11. Carbon dioxide-equivalent calculation for Dye Finishing facility.
Carbon Emission of “Tricia” Fabric in Dye Finishing Facility
Cause of Carbon EmissionConsumptionEFEmissionsGWPCO2e
CO2CH4N2OCO2CH4N2O
ValueUnitValueUnitValueUnitValueUnitValueUnitValueUnitValueUnitCH4N2O
Natural gas969.16Nm30.3459kg/Nm30kg/Nm30kg/Nm30.34Ton0Ton0Ton282650.34
Diesel0.01Ton745.6813kg/ton0kg/ton0kg/ton0.01Ton0Ton0Ton282650.01
Electricity
(distributed)
2176.70KWh493,136.77kg/GWh6.13kg/GWh5.721kg/GWh1.07Ton0.00001Ton0.00001Ton282651.08
Total1.42
Table 12. Carbon emission from raw material coming in to the factory.
Emission SourceFVEFEmissions
CO2CH4N2OCO2CH4N2OGWP
ValueUnitValueUnitValueUnitValueUnitValueUnitValueUnitValueUnitCH4N2OCO2e
Transport—full load1000km0.9146kg/km0.00011kg/km0.01359kg/km0.91460Ton0.00011Ton0.01359Ton282654.52
Transport—Air Freight18.500traveller·km0.07744kg CO2/yolcu·km0.00001kg CH4/yolcu·km0.00073kg N2O/yolcu·km1.43264Ton0.00019Ton0.01351Ton282655.02
Total9.54
Table 13. Uncertainty table.
Total Uncertainty
U n a t u r a l g a z   d i s r i b u t i o n   l e a k a g e 1.2271
U g e n e r a t o r d i e s e l 1.3284
U e l e c t r i c i t y   c o n s u m p t i o n 1.1134
U t r a n s p o r t a t i o n 1.4617
Total5.1306
Table 14. Energy-based carbon emissions.
Facility NameElectricity Carbon EmissionNatural Gas Carbon EmissionDiesel Carbon Emission
Fiber Dye Facility0.760.020.01
Spinning Facility1.7800.01
Weaving Facility0.710.010.01
Dye Finishing Facility1.080.340.01
Raw Material Supply (transport)000.95
Uncertainty value0.2420.0580.01
Total4.5720.4281.00
Table 15. Carbon emission values of facilities.
Facility NameCarbon Emissions (ton CO2e)
Fiber Dye Facility0.79
Spinning Facility1.79
Weaving Facility0.73
Dye Finishing Facility1.43
Raw Material Supply (transport)0.95
Uncertainty value0.31
Total6.00
Disclaimer/Publisher’s Note: The statements, opinions and data contained in all publications are solely those of the individual author(s) and contributor(s) and not of MDPI and/or the editor(s). MDPI and/or the editor(s) disclaim responsibility for any injury to people or property resulting from any ideas, methods, instructions or products referred to in the content.

