Abstract
Solar photovoltaic (PV) systems are growing rapidly as a renewable energy source. Evaluating the performance of a PV system based on local weather conditions is crucial for its adoption and deployment. However, the current IEC 61724 standard, used for assessing PV system performance, is limited to grid-connected systems. This standard may not accurately reflect the performance of off-grid PV systems. This study aims to evaluate how ambient weather conditions and energy usage patterns affect the performance of an off-grid PV system. This study uses a 3.8 kWp building-integrated photovoltaic (BIPV) system located at SolarWatt Park, University of Fort Hare, Alice, as a case study. Meteorological and electrical data from August and November are analyzed to assess the winter and summer performance of the BIPV system using the IEC 61724 standard. The BIPV system generated 376.29 kWh in winter and 366.38 kWh in summer, with a total energy consumption of 209.50 kWh in winter and 236.65 kWh in summer. Solar irradiation during winter was 130.18 kWh/m2, while it was 210.24 kWh/m2 during summer. The average daily performance ratio (PR) was 44.01% in winter and 28.94% in summer. The observed decrease in PR during the summer month was attributed to the higher levels of solar irradiance experienced during this time, which outweighs the increased AC energy output. The low-performance ratio does not indicate technical issues but rather a mismatch between the load demand and PV generation. The results of this study highlight the need for a separate method to assess the performance of off-grid PV systems.
1. Introduction
The world’s growing population and economy are driving a surge in energy demand [1]. This necessitates innovative solutions to ensure future energy sustainability. As concerns about finite conventional energy sources grow, renewable energy is gaining attention [2]. Solar energy is a sought-after form of renewable energy due to its reliability, environmental benefits, and security. The global photovoltaic capacity has expanded dramatically from 1288 MW in 2000 to 1,177,000 MW in 2022, solidifying solar energy’s position as a leading force in the green energy revolution [3].
Solar modules effectively harness the consistent radiation from the sun, making solar energy a promising option for a sustainable future [4]. The modules employ solar cells to convert sunlight into electrical energy, leveraging the photovoltaic effect to generate power. This process involves the absorption of solar radiation by the solar cells, which then excites electrons to produce a direct current (DC) electrical output [5]. The amount of energy that the PV module can generate primarily depends on the connected load. Without a load, the module’s internal resistance increases, resulting in negligible current flow. When connected to a load, the internal resistance decreases, enabling current flow and power generation. Although photo-generated current is directly proportional to solar irradiance, the PV current curve does not always match the irradiance curve due to the influence of the connected load. The load determines the amount of current released by the PV module [6]. Solar photovoltaic (PV) modules are designed to operate optimally under standard test conditions (STC): 25 °C temperature, 1000 W/m2 solar irradiance, and 1.5 air mass [7].
The performance of PV modules in actual outdoor environments frequently differs from that observed in controlled laboratory settings. This discrepancy arises because outdoor conditions involve a dynamic combination of factors—including solar radiation, temperature, humidity, wind, and operating voltage—that cannot be precisely duplicated in the predetermined sequences used during certification or qualification testing [8,9]. Evaluating PV system performance in real-world outdoor environments is essential to optimize power efficiency, maintain grid stability, and ensure power system safety [10]. Moreover, accurately predicting PV power generation is critical, particularly under adverse weather conditions, to guaranteeing the stability and reliability of the power system [11].
The International Energy Agency (IEA) Photovoltaic Power Systems Programme Task 2 has established parameters for evaluating PV performance, as defined by the International Electrotechnical Commission (IEC) 61724 [12]. These parameters include array final, reference yield, final yield, array capture losses, system losses, inverter efficiency, system efficiency, module efficiency, performance ratio (PR), and capacity utilization factor (CUF) [13]. PR is the most widely used parameter, as it represents the cumulative impact of various factors on rated output, including inverter inefficiency, cell temperature, and module performance [14,15].
Several researchers have used the IEC 61724 parameters to evaluate the efficiency of solar PV systems. For instance, Malvoni et al. [16] examined the performance and degradation of a 1 MW PV system in a tropical semi-arid climate in India using four years’ worth of monitored data. Their study found a reference yield of 4.64 h/day, a final yield of 6.23 h/day, a system efficiency of 11%, a CUF of 19.33%, and a PR of 74.73%. Similarly, the effect of solar irradiance, wind speed, and module temperature on the performance of PV systems in a hot and humid tropical environment in Ghana was examined by Abdul-Ganiyu et al. [17]. The results revealed an annual total output energy of 194.79 kWh/m2 for the PV module, a PR of 79.2%, and a CUF of 13.4%. A comprehensive study by Kumar, Chandel, and Kumar [18] investigated the performance of a 10 kWp solar PV array in the diverse climates of five Andaman and Nicobar Islands. The research assessed the array’s behavior based on available solar resources. The findings revealed a yearly average CUF ranging from 13.73% to 14.61% and a PR ranging from 64.70% to 64.93%.
Due to the lack of research on large-scale PV systems in Algeria, Dahbi, Aoun, and Sellam [19] examined the performance of a 6 MW grid-connected PV plant in southern Algeria. Their study found an annual average PR of 74.68%, a system efficiency of 11.39%, and a CUF of 21.44%. It also revealed a correlation between increasing ambient temperature or solar irradiation and a decrease in the performance ratio.
The outdoor performance of the 7.8 kWp grid-connected rooftop PV system for residential areas under the feed-in-tariff scheme was investigated by Anang et al. [20] between 2018 and 2019. Their findings demonstrated that the PV system efficiently met household electricity demands, with a satisfactory PR and annual CUF ranging from 13% to 16%. A performance analysis of a 19.2 kWp grid-connected photovoltaic power system was presented by Santos et al. [21]. The system was monitored from March to September 2021, delivering 18,197.15 kWh to the power grid. The average reference, array, and final yields were 5.45 kWh/kWp, 4.33 kWh/kW, and 4.26 kWh/kW, respectively. The PR and CUF were 81.85% and 18.05%, respectively, highlighting the good performance of PV systems in Northeast Brazil.
Due to the lack of knowledge regarding the performance and reliability of off-grid PV systems, Wassie and Ahlgren [22] evaluated a 375 kW off-grid PV mini-grid system installed in a remote town in Ethiopia using real-time monitored data. This study revealed a significant discrepancy between actual and estimated electricity generation, with the mini-grid producing 1182 kWh/day, 46.6% less than the estimated 2214 kWh/day. This shortfall was due to capture and system losses. The key performance metrics were as follows: module efficiency 9.85%, PR 42%, CUF 13%, and overall system efficiency 8.76%. However, the system struggled to meet the town’s daily energy demands, resulting in occasional power shedding due to insufficient PV energy output. A similar study was conducted by Supapo, Lozano, and Querikiol [23] on a rooftop solar PV system on an off-grid island in the Philippines. Utilizing PVSyst and HOMER Pro software, the researchers assessed the system’s performance and economic viability. Simulation results showed an annual mean PR of 57.10% and a CUF of 18.96%, demonstrating the system’s capacity to meet the entire electrical load demand of the island’s residents. This study highlights the reliability and effectiveness of solar PV systems in providing sustainable energy solutions.
Further emphasizing the potential of rooftop PV systems, Gulkowski and Krawczak [24] examined the annual energy output of a 9.6 kW rooftop PV system in Poland over three years. Their findings revealed an annual energy production exceeding 1000 kWh/kW, attributed to favorable conditions such as low temperatures, abundant sunlight, and summer rainfall, which kept the PV modules clean. Notably, the system achieved an average PR of 85% during the analyzed period, highlighting its high efficiency and reliability. These studies demonstrate the importance of assessing PV system performance under diverse environmental conditions using the IEC 61724 standard, which is based on grid-connected PV systems with relatively consistent load (baseload) and high energy consumption. The standard gives limited attention to off-grid PV systems with inconsistent and lower energy consumption. This results in a lack of knowledge about the performance, reliability, and efficiency of off-grid PV systems. Addressing this gap is crucial to optimize and advance off-grid PV systems.
To address this gap, this study investigates the impact of ambient weather conditions and energy usage patterns on the performance of an off-grid building-integrated photovoltaic (BIPV) system. BIPV systems integrate solar power into building design, replacing traditional elements and utilizing the building envelope, eliminating dedicated PV plant space [25]. A two-month on-site data collection campaign was conducted, gathering comprehensive meteorological and electrical data to evaluate the system’s performance. The primary contribution of this study is to emphasize the need for specialized performance evaluation parameters for off-grid PV systems, as they are not effectively covered in the current IEC 61724 standard.
This paper is organized into five sections: Section 2 provides a detailed description of the site and PV system under investigation. Section 3 outlines the materials and methods employed in the study. The results and a discussion of the results are then presented in Section 4, where the findings are analyzed and interpreted. Finally, Section 5 concludes the paper by summarizing the key findings, highlighting the main implications, and providing recommendations for future research directions.
2. Description of the Site and System
2.1. Site Description
A building-integrated photovoltaic system (BIPV), as shown in Figure 1, constructed at the University of Fort Hare in Alice was used as a case study. The building is located at latitude 32.8° south and longitude 26.8° east at an altitude of 540 m in the Eastern Cape of South Africa. The site is advantageous for solar energy collection, with no high-rise buildings or trees on the northern side to block sunlight. The local climate is characterized by hot summers, with an average temperature of 29 °C, and mild winters, with an average temperature of 15 °C. The wind direction in Alice varies by season, with east winds dominating during summer and west winds dominating during winter, and the average annual wind speed is 2.5 m/s. Additionally, the region receives substantial daily solar irradiance, with summer averages reaching 606.06 W/m2 and winter averages reaching 346.17 W/m2.
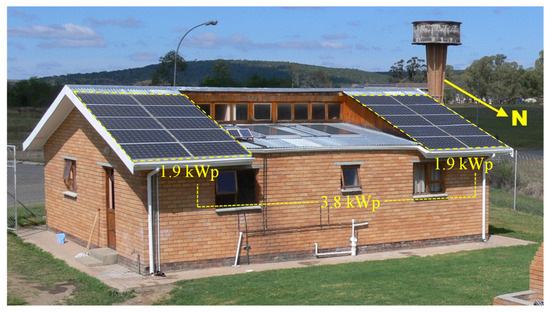
Figure 1.
Case study BIPV system.
2.2. System Description
The 3.8 kW solar system consists of 20 SANYO HIT (Hetero junction with Intrinsic Thin layer, SANYO, Osaka, Japan) modules (190 Wp each) installed on a residential building’s rooftop, covering 24 m2. The specifications and dimensions of the solar PV modules are summarized in Table 1. The modules are connected in a 10-string parallel configuration, with an inclination 13° lower than recommended. Each module has an efficiency of 16.1%, comprising 66 solar cells with an 18.5% cell efficiency.

Table 1.
Technical specifications of PV modules at STC.
The PV modules were accompanied by a FLEX Max 80 MPPT (OutBack Power, Arlington, WA, USA) charge controller, a Multiplus 48/5000 inverter (Victron Energy, Almere, The Netherlands), and eight 6 V M-Solar 3MIL 25S batteries (First National Battery, Benoni, South Africa). The charge controller has four modes—Boost, Equalize, Float, and Sleep—which optimize battery performance. The technical specifications of the Flex Max 80 MPPT charge controller are summarized in Table 2. The bidirectional inverter converts DC power from the PV array or battery into 230 V AC power for household use. It has a capacity of 5 kVA and an output of 4–4.5 kW. The technical specifications of the bidirectional inverter are summarized in Table 3.

Table 2.
Technical specifications of FLEX Max 80 MPPT charge controller.

Table 3.
Victron Multiplus 5048 bidirectional inverter specifications.
The battery bank is made up of eight series-connected sets and provides 900 Ah of power. The cell voltage remains above 1.85 V over a 100 h discharge period at room temperature. A schematic diagram of the solar PV system is shown in Figure 2, where the red lines indicate live, black lines signify neutral and earth is represented by the green lines.
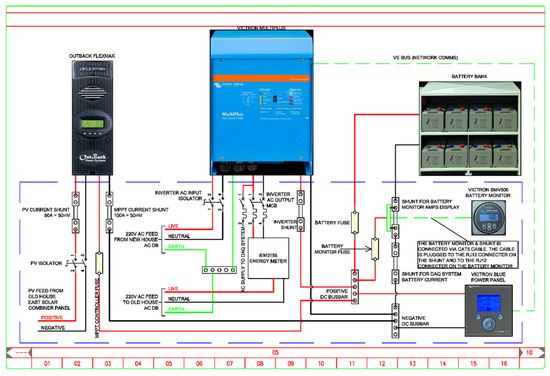
Figure 2.
Schematic diagram of the solar PV system.
3. Materials and Methods
3.1. Meteorological Parameter Measurement
A weather station was installed in SolarWatt Park to monitor meteorological parameters such as solar radiation, temperature, humidity, wind speed, and direction to assess their impact on PV system performance [26,27]. The station was elevated 1 m above the roof to ensure accurate solar radiation measurement, as shown in Figure 3a. The Kipp & Zonen CMP 11 pyranometer (Kipp & Zonen company, Delft, The Netherlands) was used to measure global horizontal irradiance (GHI). The sensitivity of the CMP 11 pyranometer used in this study is 8 µV/m−2, with a spectral range of 285 to 2800 nm and a response time of less than 1.7 s (63%) and 5 s (95%) [28]. A shielded HMP 60 temperature and relative humidity probe (Vaisala, Helsinki, Finland) was used to measure the ambient air temperature and relative humidity. The HMP60 probe uses platinum resistance temperature detectors (PRTs) and capacitive relative humidity sensors to measure air temperature and relative humidity. The HMP60 probe measures temperature from −40 to 60 °C and relative humidity from 0 to 100% RH [29]. R.M. Young Wind Sentry (R.M. Young Company, Traverse City, MI, USA, Model No. 05103 V) measured horizontal wind speed and direction. All sensors were connected to a CR1000 datalogger (Campbell Scientific, Logan, UT, USA), which continuously monitored and recorded data from each sensor at 10 min intervals. The CR1000 was powered by a 12 V DC supply backed up by a rechargeable 12 V battery to ensure continuous operation, as illustrated in Figure 3b.
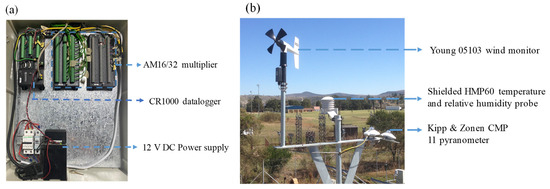
Figure 3.
(a) Weather station; (b) meteorological data acquisition system.
3.2. Electrical Parameter Measurement
The PV system’s electrical data acquisition system (DAS), as shown in Figure 4, was designed to monitor the PV, MPPT, batteries, and inverter current and voltage. The monitoring sensors we used included an 80A shunt resistor, a voltage scaling device, the Schneider IEM 3155 energy meter (Schneider Electric, Rueil-Malmaison, France), and a DT80 data taker (dataTaker, Melbourne, Australia). Electric current flowing into and out of various components was measured using shunt resistors at the outputs of the PV array and MPPT, with inputs connected to the battery bank and inverter. Then, the voltage of the corresponding components was measured by a voltage-scanning device through a potential divider. Additionally, a Schneider IEM 3155 energy meter monitored the inverter’s output current, voltage, and power. Module temperatures were measured with type-K thermocouples (Nanjing Wotian Technology, Dongguan, China). All sensor readings were automatically recorded by the DT80 data logger and stored in internal memory for regular Wi-Fi retrieval and analysis [30,31].
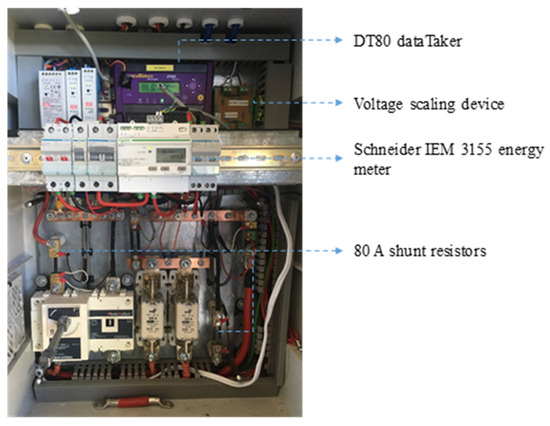
Figure 4.
Electrical data acquisition system.
4. Results and Discussion
Although the system was monitored over 12 months, only 2 months were selected for further analysis to ensure a representative sample of both winter and summer seasons. August was selected as a typical winter month, while November was considered a typical summer month, allowing for a more focused and detailed examination of the system’s performance during these contrasting seasons.
4.1. Meteorological Parameters
The meteorological data consist of values regarding GHI, outdoor ambient air temperature, outdoor ambient air relative humidity, wind speed, and direction. The parameters were continuously monitored alongside the solar PV system’s electrical parameters. The power output of photovoltaic modules is directly correlated with solar irradiance, increasing as irradiance levels rise. In contrast, VOC remains relatively constant, while ISC responds significantly to irradiance fluctuations [32]. Thus, to evaluate the impact of solar irradiance on the PV system, solar irradiance was monitored for both the winter month and the summer month, and the results are presented in Figure 5.
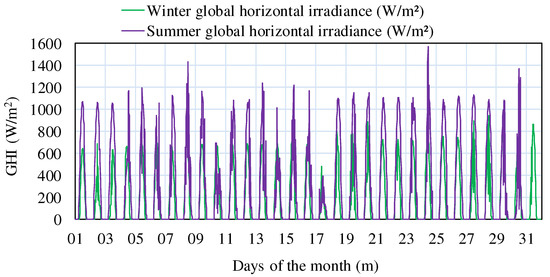
Figure 5.
Solar irradiance for a typical winter month and a typical summer month.
As shown in Figure 5, the site received an average solar radiation of 337.27 W/m2 in winter and an average of 560.65 W/m2 in summer. The obtained average GHI for the typical winter month and summer month was found to be 9.8 W/m2 and 45.41 W/m2, lower than the GHI reported in [33]. The solar irradiation obtained in the winter month was 130.18 kWh/m2, averaging 4.20 kWh/m2/day, while in the summer month, it was 210.24 kWh/m2, averaging 7.01 kWh/m2/day. The variation in solar irradiation received in winter and summer is due to the lower sun angle experienced in winter compared to in summer, as well as the difference in the daytime period between both seasons [34]. In addition to solar radiation, the outdoor ambient air temperature and relative humidity were also measured. According to [35], an increase in the outdoor ambient air temperature reduces PV array power production due to an increase in its operating module temperature. In contrast, relative humidity can act as a cooling agent of module temperature. The measured outdoor ambient air temperature and relative humidity for a typical winter and summer month are presented in Figure 6.
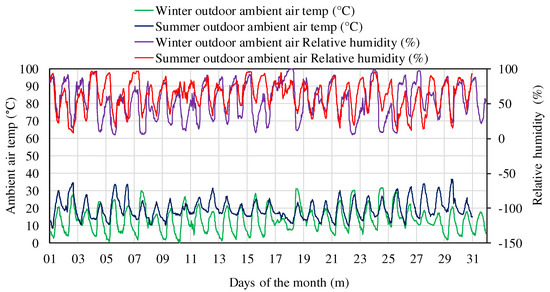
Figure 6.
Outdoor ambient air temperature and relative humidity for typical winter month and typical summer month.
As shown in Figure 6, the maximum ambient air temperatures observed in the winter month were 31.83 and −0.109 °C, respectively, with an average of 16.90 °C. The maximum and minimum ambient air temperatures observed in the summer month were 36.78 and 9.26 °C, respectively, with an average of 22.60 °C. On the other hand, the winter and summer outdoor ambient air relative humidity varied from 99.40 to 5.31% and 97.00% to 8.00%, respectively. The average relative humidity in winter was 42.22%, while in the summer month, it was 50.08%. An inverse relationship between temperature and relative humidity was observed. According to the literature, PV modules only convert approximately 20% of the incident solar irradiance. The rest is converted to heat, causing the PV modules to overheat [36]. An increase in temperatures reduces semiconductor bandgap, slightly increases light-generated current (ISC), and exponentially decreases saturation current, leading to lower open-circuit voltage (VOC) and cell fill factor values.
Consequently, PV module efficiency decreases [37]. Thus, due to its impact on PV system operation, the back of module temperature was also measured. Figure 7 shows the back of module temperature distribution in the winter and summer months.
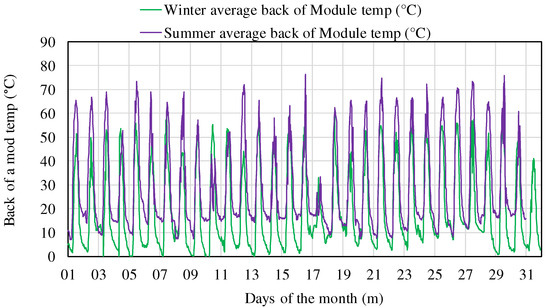
Figure 7.
Back of module temperature distribution in winter and summer.
The back of module temperature observed in the winter month ranged from 59.20 to −2.42 °C, averaging 19.59 °C. As expected, the back of module temperature was higher in the summer month, with a maximum of 76.31 °C and a minimum of 7.08 °C, with an average of 29.3 °C. Additionally, wind speed has the potential to cool down the solar PV module’s surface, which results in the enhancement of the solar PV system’s performance. A reduction in module temperature can be achieved by dissipating heat due to convection. The cooling effect is significantly influenced by the wind speed and direction [38]. Wind rose profiles for the winter and summer months were developed, as presented in Figure 8a,b, respectively.
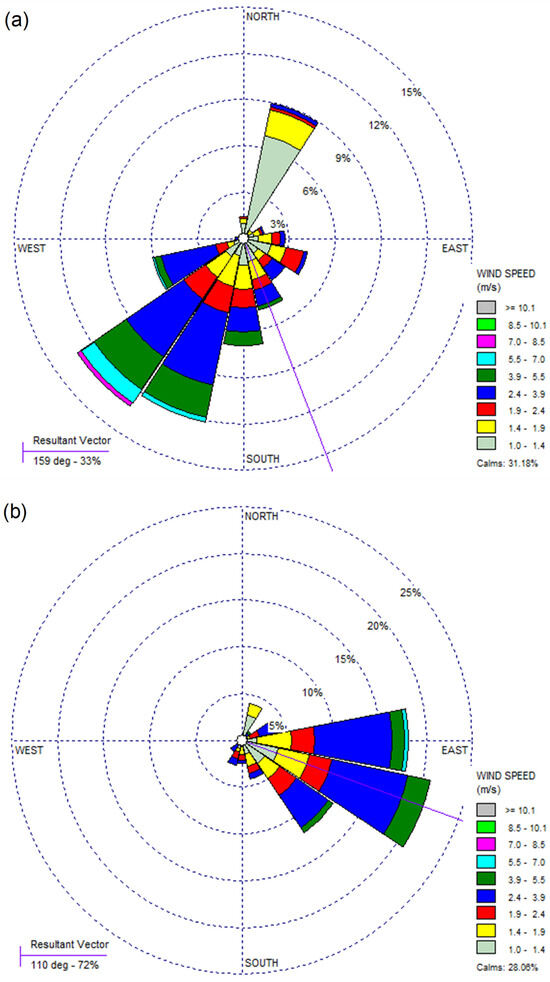
Figure 8.
Wind rose profiles for (a) a typical winter month and (b) a typical summer month.
Wind speed and direction data were aggregated into hourly intervals to create the wind rose profiles. The dominant wind direction was determined by the mean wind direction’s frequency count, represented by the resulting vector. Figure 8a shows that in the winter month, the southeast direction was the prevailing wind direction, accounting for 33% of winds with a mean direction of 159°. In the summer month, as shown in Figure 8b, 72% of the wind, with an average direction of 110 °, was observed to be blowing from the southeast, serving as the prevailing wind. An average wind speed of 1.73 m/s, with a 31.18% calm period, was obtained in the winter month, while an average wind speed of 1.83 m/s, with a 28.06% calm period, was obtained in the summer month. Notably, the wind direction in both months supports a cooling effect, as the predominant wind flow is opposite to the PV array’s direction.
4.2. Electrical Parameters
The performance of the solar PV system’s components, in terms of electrical parameters, is covered in this section. The components considered include solar PV modules, a charge controller, a battery, and an inverter. Together, these components form the off-grid BIPV used in the research. The electrical parameters considered comprise current, voltage, module operating temperature, inverter power, and energy. Current and voltage measurements were further used to deduce the power supplied and the generated and consumed resultant energy. During the monitoring period, the domestic house containing the BIPV system was inhabited by a working male and his daughter, whose daily routine involved departing from the house at 8:00 AM on weekdays to commute to work and school, respectively, and returning home at noon. The occupants’ daily energy consumption activities were monitored. It was also observed that the house was usually unoccupied on weekends, and no mechanical or electrical heating or cooling devices were used during the monitoring period. The household appliances included a 3.8 kW four-plate cooker, a 130 W refrigerator, a 70 W TV set, and a 1 kW microwave oven. The lighting fixtures throughout the house consisted of energy-efficient 11 W CFLs in the living room, kitchen, and both bedrooms, with a slightly higher wattage of 20 W CFL in the bathroom. The cumulative energy generated, stored, and discharged from the batteries and house consumption were evaluated in the winter and summer months, as shown in Figure 9 and Figure 10, respectively.
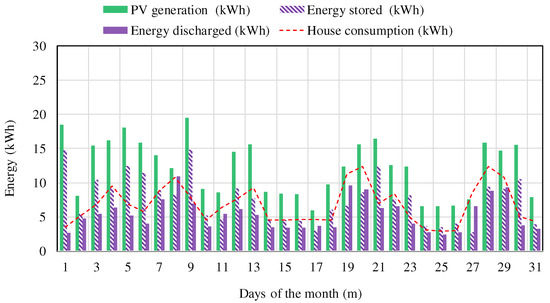
Figure 9.
Daily energy balance of the building in the winter month.
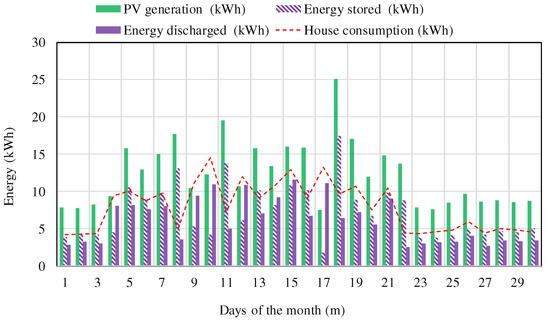
Figure 10.
Daily energy balance of the building in the summer month.
As shown in Figure 9, the PV system generated a total energy of 376.29 kWh during the winter month, averaging 12.14 kWh/day, with an average PV supply rate of 1.15 kW. The household consumed a total of 209.50 kWh of energy in the same period, equivalent to 6.76 kWh/day, with an average load demand of 0.29 kW. Despite the lower solar irradiation, as shown in Figure 5, the PV arrays generated sufficient energy to meet the household’s energy demand. The mismatch between the load consumption and the production time distribution was compensated for by charging or discharging the battery bank. This mismatch occurred because there was minimal demand in the house during the peak PV generation hours. As mentioned earlier, only the fridge consumed power during this period, as the house was unoccupied. The high-demand periods were observed to be in the morning and evening, coinciding with the reported national grid periods of high demand. The total energy stored in the battery during this period was 237.38 kWh, which is equivalent to 7.66 kWh/day. However, only 169.30 kWh, or 5.46 kWh/day, was consumed by the house load. The remaining energy was lost through battery self-depletion and DC-to-AC conversion. The gap of 1.3 kWh/day between household consumption and energy discharged suggests that some energy was drawn directly from the solar panels. The batteries had an average charge rate of 0.89 kW and an average discharge rate of 0.36 kW. As shown in Figure 9, the PV generation trend is similar to the energy stored trend, as a large amount of energy generated by the PV array was delivered to the battery.
As shown in Figure 10, the total energy generated by PV arrays in the summer month was 366.38 kWh, averaging 12.21 kWh/day. The average PV supply rate was 0.95 kW. The total energy consumed by the house load in the summer was 236.65 kWh, equivalent to 7.89 kWh/day. The average load in the same month was 0.66 kW. A similar behavior was observed in the summer month, where the mismatch between PV generation and load consumption was compensated for by battery charging and discharging. The total energy stored by the batteries in the same period was 215.88 kWh, averaging 7.20 kWh/day. However, only 182.75 kWh, which is equivalent to 6.09 kWh/day, was consumed by the household load. A gap of 1.11 kWh/day between household consumption and energy discharged was also observed in the summer month, suggesting that some energy was drawn directly from the solar panels during the day. The average charge and discharge rates in the same month were 0.73 kW and 0.43 kW, respectively. Additionally, Table 1 presents the monthly energy audit of the system, which comprises energy generated, consumed, stored, and discharged from the batteries.
As illustrated in Table 4, the energy audit reveals that the PV system generates excess energy beyond household consumption in both winter and summer months. In winter, the PV supply totals 376.29 kWh, surpassing household consumption (209.50 kWh) and energy stored (237.38 kWh), resulting in a surplus of 29.41 kWh. However, there is a deficit of 40.20 kWh between energy discharged (169.30 kWh) and household consumption. In summer, the PV supply reaches 366.38 kWh, exceeding household consumption (236.65 kWh) and energy stored (215.88 kWh), yielding a surplus of 85.85 kWh. The remaining energy is lost primarily due to battery self-discharge and system conversion inefficiencies. The energy discharged (182.75 kWh) is slightly less than house consumption (236.65 kWh), indicating a deficit of 53.90 kWh. This discrepancy is attributed to the direct extraction of energy from PV modules during the day to meet household demand. Storage efficiency is approximately 63% in winter and 59% in summer. Discharge efficiency varies seasonally, standing at 71% in winter and 85% in summer, suggesting better battery performance in summer.

Table 4.
Monthly energy audit for the winter and summer months.
4.3. Impact of Ambient Weather Conditions and Energy Usage on PV System
Based on the measured data, as depicted and analyzed in Section 4.1 and Section 4.2, selected days in the winter and summer seasons were used to further illustrate the impact of energy usage on the solar PV system performance while considering ambient weather conditions. Thus, the 14th and 15th of August and November were used to represent the winter low-demand period (LDP) and summer high-demand period (HDP), respectively, as presented in Figure 11. Similarly, winter HDP and summer LDP days were denoted with 28th and 29th August and November, respectively, as presented in Figure 12. Two-day profiles were selected in both scenarios to show the battery charge rate and solar PV power distribution in response to the previous day’s energy usage.
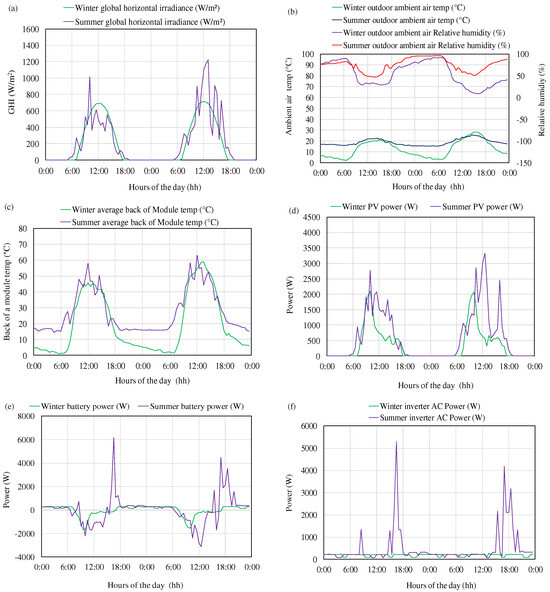
Figure 11.
Profile of two days in both the winter and summer months representing the LDP and HDP: (a) GHI, (b) outdoor ambient air temperature and relative humidity, (c) back of module temperature, (d) PV power, (e) battery power, and (f) house demand.
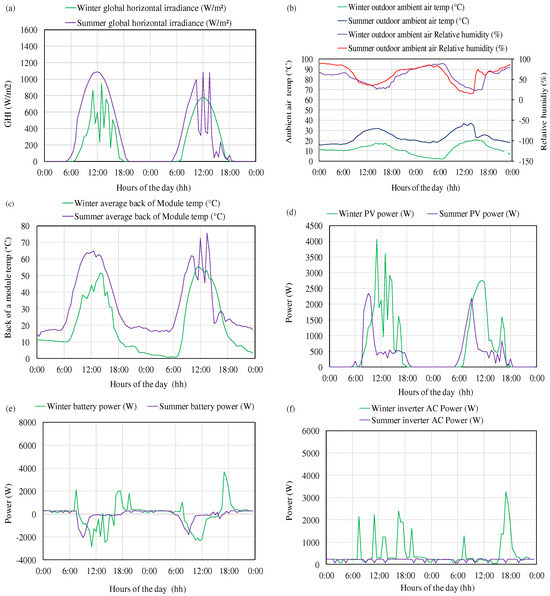
Figure 12.
Two-day profile for both winter and summer months depicting LDP and HDP: (a) GHI, (b) outdoor ambient air temperature and relative humidity, (c) back of module temperature, (d) PV power, (e) battery power, and (f) house demand.
As shown in Figure 11, a distinctive trend was observed in the ambient GHI and house demand profile, which significantly influenced the solar PV and battery power distribution in the selected days. As shown in Figure 11a, a uniform solar irradiance distribution with an average of 420.31 W/m2 and a cumulative irradiation of 9.25 kWh/m2 was observed for the winter days. The summer days were found to have an irregular solar irradiance, averaging 361.13 W/m2, and a cumulative irradiation of 10.29 kWh/m2. On the other hand, the house’s cumulative energy consumption in summer is 90% higher than the energy consumption in the winter days, having used a cumulative 23.64 kWh in summer and 8.99 kWh in winter. The solar PV and battery power and energy in response to the solar radiation and house demand are summarized in Table 5.

Table 5.
Solar PV and batter power and energy generation in response to solar radiation and energy consumption.
As shown in Table 5, the average daily energies were obtained by dividing the total energy by two, as two consecutive days were selected in each season to represent PV and battery performance in response to solar radiation and energy consumption. The generated solar PV power was 53% higher on summer days despite the solar irradiation being only 11% higher. The batteries’ stored and supplied energy, depicted by charging and discharging energy, increased considerably on summer days by 70% and over 100%, respectively. This is attributed to energy usage on summer days being 90% higher than in winter. As expected, air temperature, relative humidity, and back of module temperature followed the solar radiation distribution, with an average increase of 35% on summer days.
As shown in Figure 12, a similar trend between solar irradiance, PV power, and battery power distribution curves was observed for the selected days, all of which were influenced by the house demand profile. As depicted in Figure 12a, a uniform and irregular pattern of solar radiation was observed for the winter days, with there being an average solar irradiance of 425.47 W/m2 and a cumulative irradiation of 9.36 kWh/m2. Also, the summer days had an irregular and uniform distribution of solar irradiance, with an average of 490.84 W/m2 and cumulative irradiation of 13.99 kWh/m2. The house’s cumulative energy consumption on winter days was 81% higher than the energy consumed on summer days. Further, the solar PV and battery power and energy in response to the solar radiation and house demand are summarized in Table 6.

Table 6.
Solar PV and batter power and energy generation in response to solar radiation and energy consumption.
Presented in Table 6, the average daily energies were obtained by dividing the total energy by two, as two consecutive days were selected in each season to represent PV and battery performance in response to solar radiation and energy consumption. The power generated by solar PV modules on winter days was 55% higher than the power generated on summer days despite solar irradiance being 40% higher on summer days. The energy stored and supplied by the batteries on winter days also increased by 68% and 92%, respectively. This increase was attributed to the high energy consumption observed on winter days, which was 81% higher than the consumption observed on summer days. As expected, the air temperature and relative humidity, as well as the back of module temperature, as shown in Figure 12a,b, closely followed the solar radiation distribution pattern, with an average increase of 24% on summer days.
4.4. Performance Evaluation of the System
The performance of the system was further evaluated using the performance ratio (PR) of the IEC 61724 standard. PR is used to calculate the performance of PV systems, and it depicts the overall energy losses in solar PV systems [39]. PR also depicts the inefficient use of available solar radiation and the fraction of generated AC energy by PV systems connected to the grid. It is mathematically expressed as the ratio of final yield to reference yield [40]. The system’s PR in the winter and summer months was evaluated, as shown in Figure 13 and Figure 14, respectively.
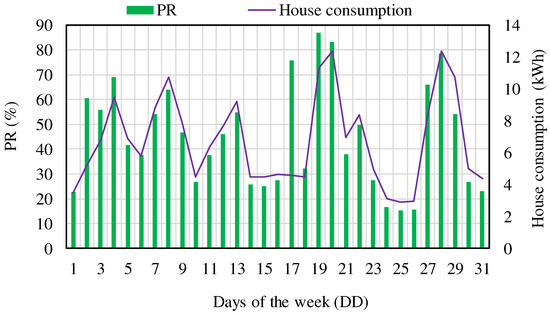
Figure 13.
Winter month system PR and house consumption.
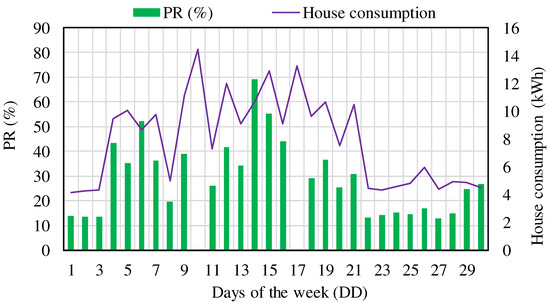
Figure 14.
Summer month system PR and house consumption.
As shown in Figure 13, the PR in the winter month varied between 15.34% on the 25th and 87.03% on the 19th, with a monthly average of 44.71%. This means that 55.29% of incident solar irradiance in the winter month was not converted into consumable AC energy. The house consumption curve closely follows the PR curve pattern, showing a direct relation between the two parameters. As highlighted before, PR is the ratio between the final yield and the reference yield. Thus, an increase in solar radiation, mathematically equivalent to the reference yield, decreases PR, while an increase in energy usage results in an increase in PR. Thus, the lower PR we obtained was attributed to low energy consumption. It can be concluded that the PR of an off-grid PV system is a function of the user’s consumption.
The PR of the BIPV system in the summer month ranges between 12.69 and 68.93% on the 27th and 14th, respectively. The monthly average daily PR obtained in the summer month was 28.94%, which means that more than 70% of incident solar irradiance was not converted into AC energy. PV modules only release power demanded by the load; no power would be generated without load, regardless of the available solar irradiance. Thus, the low PR obtained in the summer month was due to the low demand for the house load. It must be noted that gaps in the graph correspond to days where the reference yield was lower than the final yield, thus leading to an overestimation of PR, which was more than 100%. During the monitoring period, the consumption in the house was extremely low, with an HDP observed in the morning and evening, while an LDP was observed between 8h00 and 4:00 PM. The PV generation was supposed to be at its peak during the day, but it was low due to the lower demand in the house, since PV modules only generate power demanded by the load. Although the energy consumption in the summer month was 14.33% higher than that in the winter month, the lower PR obtained in the summer month was attributed to higher solar radiation and lower house consumption.
In comparison, the average PR obtained in the winter month was 35.28% higher than the average PR obtained in the summer month. These findings agree with the authors of [41], who opined that winter tends to have a higher PR than summer due to lower module temperatures. The obtained PR values in both months (28.94% in summer and 44.01% in winter) are comparable to those reported [42,43] in the literature, ranging from 20 to 65% annually. Consistent with our findings, Wassie and Ahlgren [22] reported a PR of 42%, primarily due to limited battery capacity and system losses. While the authors of [43] reported an average PR of 27%, the low PR obtained was due to low demand and high temperature.
In contrast, the low PR in the current study is attributed to low demand, emphasizing the importance of matching PV system design to load requirements. Notably, despite generating excess electricity in both months, the obtained PR values were surprisingly low. A high-performing PV system typically exceeds 70% PR [44]. A higher PR indicates optimal performance, while lower values suggest potential technical or design-related losses [45]. This discrepancy between meeting load demand and low PR values suggests that the IEC 61724 PR metric may not accurately reflect off-grid PV system performance. Therefore, our findings highlight the need for an alternative evaluation method to assess off-grid PV systems’ performance effectively. This would ensure that system design and performance are accurately evaluated, addressing potential technical or design-related losses and optimizing overall system efficiency.
5. Conclusions
This study investigated the effects of weather conditions and energy usage on a domestic off-grid photovoltaic (PV) system’s performance. Meteorological and electrical parameters were monitored over winter and summer to assess energy generation and consumption. The results showed significant seasonal solar irradiance fluctuations, averaging 337.27 W/m2 in winter and 560.65 W/m2 in summer. Despite these disparities, the PV system reliably met household demands, producing 376.29 kWh (winter) and 366.38 kWh (summer) while consuming 209.50 kWh (winter) and 236.65 kWh (summer). Mismatches between energy generation and consumption were compensated for by battery storage, with winter storage exceeding consumption by 68 kWh and summer storage by 33 kWh. The remaining energy was lost through battery self-discharge and inefficiencies in DC-to-AC conversion.
The system’s performance was further evaluated using the IEC 61724 standard, yielding average daily PRs of 44.01% in winter and 28.94% in summer. The lower summer PR does not signify poor performance but rather highlights a mismatch between PV generation and load demand. This discrepancy exposes limitations in the IEC 61724 standard’s ability to accurately assess off-grid PV performance. Consequently, this study underscores the necessity for alternative evaluation methods to ensure an accurate representation of system performance and prevent misguided perceptions that may hinder the widespread adoption of off-grid PV technology.
Author Contributions
All authors contributed significantly to this study. Conceptualization, I.M. and O.K.O.; methodology, I.M., O.K.O. and E.L.M.; software, O.K.O.; validation, I.M., O.K.O. and E.L.M.; formal analysis, I.M.; investigation, I.M. and O.K.O.; resources, O.K.O. and E.L.M.; data curation, I.M. and O.K.O.; writing—original draft preparation, I.M.; writing—review and editing, O.K.O. and E.L.M.; visualization, I.M. and O.K.O.; supervision, O.K.O. and E.L.M.; funding acquisition, E.L.M. All authors have read and agreed to the published version of the manuscript.
Funding
This research received no external funding.
Data Availability Statement
The authors confirm that the data supporting the findings presented in this study will be made available on request from the corresponding author. The data are not available publicly due to an ongoing study.
Conflicts of Interest
The authors declare no conflicts of interest.
References
- Jarboui, S.; Alofaysan, H. Global Energy Transition and the Efficiency of the Largest Oil and Gas Companies. Energies 2024, 17, 2271. [Google Scholar] [CrossRef]
- Kim, S.; Choi, Y.; Kim, S. Simulation Modeling in Supply Chain Management Research of Ethanol: A Review. Energies 2023, 16, 7429. [Google Scholar] [CrossRef]
- Khalid, W.; Jamil, M.; Khan, A.A.; Awais, Q. Open-Source Internet of Things-Based Supervisory Control and Data Acquisition System for Photovoltaic Monitoring and Control Using HTTP and TCP/IP Protocols. Energies 2024, 17, 4083. [Google Scholar] [CrossRef]
- Shahab, A.; Ullah, Z.F.; Muhammad, N. Electrical performance degradation analysis of field exposed silicon-based PV modules. J. Mech. Contin. Math. Sci. 2021, 16, 27–35. [Google Scholar]
- Nethmini Silva, T.; Arachchige, U.; Kumaragamage, C.; Perera, V. Solar Energy Technologies: A Complete review of the Solar system technologies. J. Res. Technol. Eng. 2024, 5, 84–111. Available online: https://www.researchgate.net/publication/377594872 (accessed on 14 August 2024).
- Overen, O.K.; Meyer, E.L. Solar Energy Resources and Photovoltaic Power Potential of an Underutilised Region: A Case of Alice, South Africa. Energies 2022, 15, 4646. [Google Scholar] [CrossRef]
- Walker, A.; Desai, J. Understanding Solar Photovoltaic System Performance; U.S. Department of Energy: Washington, DC, USA, 2021. [Google Scholar]
- Aboagye, B.; Gyamfi, S.; Ofosu, E.A.; Djordjevic, S. Degradation analysis of installed solar photovoltaic (PV) modules under outdoor conditions in Ghana. Energy Rep. 2021, 7, 6921–6931. [Google Scholar] [CrossRef]
- Sharma, V.; Chandel, S. Performance and degradation analysis for long term reliability of solar photovoltaic systems: A review. Renew. Sustain. Energy Rev. 2013, 27, 753–767. [Google Scholar] [CrossRef]
- Li, G.; Xie, S.; Wang, B.; Xin, J.; Li, Y.; Du, S. Photovoltaic Power Forecasting with a Hybrid Deep Learning Approach. IEEE Access 2020, 8, 175871–175880. [Google Scholar] [CrossRef]
- Fu, X.; Wang, X.; Gong, Y.; Wang, Y.; Zhang, Y. Impact of Snow Weather on PV Power Generation and Improvement of Power Forecasting. In Proceedings of the 2023 International Conference on Power Energy Systems and Applications (ICoPESA), Nanjing, China, 24–26 February 2023; pp. 448–453. [Google Scholar] [CrossRef]
- IEC 61724; Photovoltaic System Performance Monitoring—Guidelines for Measurement, Data Exchange and Analysis. IEC: Geneva, Switzerland, 1998.
- Srimathi, R.; Meenakshi, J.; Vijayabhasker, R.; Belay, S.S. Performance Evaluation and Estimation of Energy Measures of Grid-Connected PV Module. Int. J. Photoenergy 2022, 2022, 7228470. [Google Scholar] [CrossRef]
- Khalid, A.M.; Mitra, I.; Warmuth, W.; Schacht, V. Performance ratio—Crucial parameter for grid connected PV plants. Renew. Sustain. Energy Rev. 2016, 65, 1139–1158. [Google Scholar] [CrossRef]
- Drif, M.; Pérez, P.J.; Aguilera, J.; Almonacid, G.; Gomez, P.; De la Casa, J.; Aguilar, J.D. Univer Project. A grid connected photovoltaic system of 200 kWp at Jaén University. Overview and performance analysis. Sol. Energy Mater. Sol. Cells 2007, 91, 670–683. [Google Scholar] [CrossRef]
- Malvoni, M.; Kumar, N.M.; Chopra, S.S.; Hatziargyriou, N. Performance and degradation assessment of large-scale grid-connected solar photovoltaic power plant in tropical semi-arid environment of India. Sol. Energy 2020, 203, 101–113. [Google Scholar] [CrossRef]
- Abdul-Ganiyu, S.; Quansah, D.A.; Ramde, E.W.; Seidu, R.; Adaramola, M.S. Investigation of solar photovoltaic-thermal (PVT) and solar photovoltaic (PV) performance: A case study in Ghana. Energies 2020, 13, 2701. [Google Scholar] [CrossRef]
- Kumar, M.; Chandel, S.S.; Kumar, A. Performance analysis of a 10 MWp utility scale grid-connected canal-top photovoltaic power plant under Indian climatic conditions. Energy 2020, 204, 117903. [Google Scholar] [CrossRef]
- Dahbi, H.; Aoun, N.; Sellam, M. Performance analysis and investigation of a 6 MW grid-connected ground-based PV plant installed in hot desert climate conditions. Int. J. Energy Environ. Eng. 2021, 12, 577–587. [Google Scholar] [CrossRef]
- Anang, N.; Azman, S.N.A.S.N.; Muda, W.M.W.; Dagang, A.N.; Daud, M.Z. Performance analysis of a grid-connected rooftop solar PV system in Kuala Terengganu, Malaysia. Energy Build. 2021, 248, 111182. [Google Scholar] [CrossRef]
- Santos, L.S.C.D.; de Lima, L.C.; Sacramento, E.M.D.; Souto, R.S. Performance Analysis of a Photovoltaic System installed in the Northeast of Brazil. Int. J. Adv. Eng. Res. Sci 2022, 9, 37–43. [Google Scholar] [CrossRef]
- Wassie, Y.T.; Ahlgren, E.O. Performance and reliability analysis of an off-grid PV mini-grid system in rural tropical Africa: A case study in southern Ethiopia. Dev. Eng. 2023, 8, 100106. [Google Scholar] [CrossRef]
- Supapo, K.R.M.; Lozano, L.; Querikiol, E.M. Performance Evaluation of an Existing Renewable Energy System at Gilutongan Island, Cebu, Philippines. J. Eng. 2024, 2024, 3131377. [Google Scholar] [CrossRef]
- Gulkowski, S.; Krawczak, E. Long-Term Energy Yield Analysis of the Rooftop PV System in Climate Conditions of Poland. Sustainability 2024, 16, 3348. [Google Scholar] [CrossRef]
- Mangherini, G.; Diolaiti, V.; Bernardoni, P.; Andreoli, A.; Vincenzi, D. Review of Façade Photovoltaic Solutions for Less Energy-Hungry Buildings. Energies 2023, 16, 6901. [Google Scholar] [CrossRef]
- Meyer, E.L.; Overen, O.K. Blue skies and red sunsets: Reliability of performance parameters of various p-n junction photovoltaic module technologies. Cogent Eng. 2019, 6, 1691805. [Google Scholar] [CrossRef]
- Overen, O.K.; Obileke, K.C.; Meyer, E.L.; Makaka, G.; Apeh, O.O. A hybrid solar-biogas system for post-COVID-19 rural energy access. Clean Energy 2024, 8, 84–99. [Google Scholar] [CrossRef]
- Kipp & Zonen. Instruction Manual: CMP Series Pyranometer; Kipp & Zonen: Delft, The Netherlands, 2016; pp. 1–29. [Google Scholar]
- Campbell Scientific. MP100A Temperature and Relative Humidity Probe. 2012; pp. 1–26. Available online: https://s.campbellsci.com/documents/us/manuals/hygrovue5.pdf (accessed on 5 August 2024).
- Apeh, O.O.; Meyer, E.L.; Overen, O.K. Modeling and experimental analysis of battery charge controllers for comparing three off-grid photovoltaic power plants. Heliyon 2021, 7, e08331. [Google Scholar] [CrossRef]
- Overen, O.K.; Meyer, E.L. Seasonal Performance of a 3.8 kWp Rooftop PV System in Zone 2 Climate of South Africa. 2019. Available online: https://www.sasec.org.za/papers2019/79.pdf (accessed on 12 August 2024).
- Dwivedi, P.; Sudhakar, K.; Soni, A.; Solomin, E.; Kirpichnikova, I. Advanced cooling techniques of P.V. modules: A state of art. Case Stud. Therm. Eng. 2020, 21, 100674. [Google Scholar] [CrossRef]
- Kelvin, O.O.; Edson, M.L.; Golden, M. Thermal, economic and environmental analysis of a low-cost house in alice, South Africa. Sustainability 2017, 9, 425. [Google Scholar] [CrossRef]
- Meyer, E.L.; Apeh, O.O.; Overen, O.K. Electrical and meteorological data acquisition system of a commercial and domestic microgrid for monitoring pv parameters. Appl. Sci. 2020, 10, 9092. [Google Scholar] [CrossRef]
- Santhakumari, M.; Sagar, N. A review of the environmental factors degrading the performance of silicon wafer-based photovoltaic modules: Failure detection methods and essential mitigation techniques. Renew. Sustain. Energy Rev. 2019, 110, 83–100. [Google Scholar] [CrossRef]
- Kong, X.; Zhang, L.; Xu, W.; Li, H.; Kang, Y.; Wu, J.; Fan, M. Performance comparative study of a concentrating photovoltaic/thermal phase change system with different heatsinks. Appl. Therm. Eng. 2022, 208, 118–223. [Google Scholar] [CrossRef]
- van Dyk, E.E.; Meyer, E.L. Analysis of the effect of parasitic resistances on the performance of photovoltaic modules. Renew. Energy 2004, 29, 333–344. [Google Scholar] [CrossRef]
- Hasan, K.; Yousuf, S.B.; Tushar, M.S.H.K.; Das, B.K.; Das, P.; Islam, M.S. Effects of different environmental and operational factors on the PV performance: A comprehensive review. Energy Sci. Eng. 2022, 10, 656–675. [Google Scholar] [CrossRef]
- Seme, S.; Sreden, K.; Bojan, Š.; Had, M. Analysis of the performance of photovoltaic systems in Slovenia. Sol. Energy 2019, 180, 550–558. [Google Scholar] [CrossRef]
- Ayompe, L.M.; Duffy, A.; McCormack, S.J.; Conlon, M. Measured performance of a 1.72 kW rooftop grid connected photovoltaic system in Ireland. Energy Convers. Manag. 2011, 52, 816–825. [Google Scholar] [CrossRef]
- Kumar, B.S.; Sudhakar, K. Performance evaluation of 10 MW grid connected solar photovoltaic power plant in India. Energy Reports 2015, 1, 184–192. [Google Scholar] [CrossRef]
- Mayer, D.; Heidenreich, M. Task 2: Performance analysis of stand alone PV-systems from rational use of energy point of view performance analysis of stand alone PV systems. In Proceedings of the 3rd World Conference onPhotovoltaic Energy Conversion, Osaka, Japan, 11–18 May 2003; pp. 2155–2158. [Google Scholar]
- Köntges, M.; Kurtz, S.; Packard, C.; Jahn, U.; Berger, K.A.; Kato, K. Performance and Reliability of Photovoltaic Systems Subtask 3.2: Review of Failures of Photovoltaic Modules: IEA PVPS Task 13: External Final Report IEA-PVPS; International Energy Agency, Photovoltaic Power Systems Programme: Paris, France, 2014. [Google Scholar]
- Buma, C.L. Performance evaluation of an off-grid building integrated photovoltaic system in alice, eastern cape province, South Africa. Ph.D. Dissertation, University of Fort, Alice, South Africa, 2018. [Google Scholar]
- Marion, B.; Adelstein, J.; Boyle, K.E.; Hayden, H.; Hammond, B.; Fletcher, T.; Canada, B.; Narang, D.; Kimber, A.; Mitchell, L.; et al. Performance parameters for grid-connected PV systems. In Proceedings of the Conference Record of the Thirty-first IEEE Photovoltaic Specialists Conference, 2005, Lake Buena Vista, FL, USA, 3–7 January 2005; pp. 1601–1606. [Google Scholar] [CrossRef]
Disclaimer/Publisher’s Note: The statements, opinions and data contained in all publications are solely those of the individual author(s) and contributor(s) and not of MDPI and/or the editor(s). MDPI and/or the editor(s) disclaim responsibility for any injury to people or property resulting from any ideas, methods, instructions or products referred to in the content. |
© 2024 by the authors. Licensee MDPI, Basel, Switzerland. This article is an open access article distributed under the terms and conditions of the Creative Commons Attribution (CC BY) license (https://creativecommons.org/licenses/by/4.0/).