Article

A Novel Hybrid Harris Hawk Optimization–Sine Cosine Algorithm for Congestion Control in Power Transmission Network

by
Vivek Kumar
1,
R. Narendra Rao
2,
Md Fahim Ansari
3,
Vineet Shekher
4,
Kaushik Paul
5,*,
Pampa Sinha
6,
Abdulaziz Alkuhayli
7,
Usama Khaled
8 and
Mohamed Metwally Mahmoud
8,*
1
BRCM College of Engineering & Technology, Bahal 127028, Haryana, India
2
Department of Electrical and Electronics Engineering, JNTUA College of Engineering Pulivendula, Pulivendula 516390, India
3
Department of Electrical Engineering, Graphic Era Deemed to Be University, Dehradun 248002, India
4
Department of Electrical Engineering, Government Engineering College, Palamu 822118, Jharkhand, India
5
Department of Electrical Engineering, BIT Sindri, Dhanbad 828123, Jharkhand, India
6
School of Electrical Engineering, KIIT University, Bhubaneswar 751024, India
7
Department of Electrical Engineering, College of Engineering, King Saud University, Riyadh 11421, Saudi Arabia
8
Electrical Engineering Department, Faculty of Energy Engineering, Aswan University, Aswan 81528, Egypt
*
Authors to whom correspondence should be addressed.
Energies 2024, 17(19), 4985; https://doi.org/10.3390/en17194985
Submission received: 9 August 2024 / Revised: 26 September 2024 / Accepted: 28 September 2024 / Published: 5 October 2024
(This article belongs to the Special Issue Flow Control and Optimization in Power Systems)

Abstract

:
In a deregulated power system, managing congestion is crucial for effective operation and control. The goal of congestion management is to alleviate transmission line congestion while adhering to system constraints at minimal cost. This research proposes a hybrid Harris Hawk Optimization–Sine Cosine Algorithm (hHHO-SCA) for an efficient generation rescheduling approach to achieve the lowest possible congestion cost. The hybridization has been performed by introducing the features of SCA in the HHO to boost the exploration and exploitation steps of HHO, providing an efficient global solution and effectively optimizing rescheduled power output. The effectiveness of this methodology is evaluated using IEEE 30 and IEEE 118-bus test systems, taking into account system parameters. The potency of the proposed method is analyzed by comparing the results of the hHHO-SCA with those from other recent optimization techniques. The findings show that the hHHO-SCA outperforms other methods by avoiding local optima and demonstrating promising convergence characteristics.

1. Introduction

The transmission of electrical power plays a vital role in meeting the power demands in the power system. The reliability of the power transmission depends on the efficient maintenance of system constraints that involve the thermal limit, voltage limit, and stability limit. The competition among the market players to maximize their profit margins may result in the operation of the transmission channels beyond their rated transfer limits. Such competitive scenarios may lead to the violation of the system constraints associated with the power transmission resulting in transmission line congestion. This congestion can have a major impact on power distribution, ultimately affecting the system’s overall efficiency. Controlling the issue of congestion in power systems is a vital responsibility of Independent System Operators (ISOs) and grid operators [1]. These entities are essential in coordinating and supervising the power market’s operations, ensuring a reliable power transaction within the system without breaching any of the system constraints. Considering the abrupt rise in consumer power demand, in association with the limited expansion of the transmission network, the occurrence of power flow congestion has been denoted as a serious complication in power systems globally [2].
Multiple factors contribute to power system congestion, including a surge in power demand surpassing the capacity of existing infrastructure, unplanned outages of generation units, unexpected power flows, tripping of transmission lines, and equipment malfunctions. This congestion can diminish reliability, increase energy costs, and potentially disrupt the power supply to consumers [3]. A significant responsibility relies on the system operator to monitor the issue of congestion and take necessary actions to avoid it. This has made it necessary to implement efficient Congestion Management (CM) strategies. Most conventional CM strategies include the Generator Rescheduling (GR) approach, assisting the system with the incorporation of reactive power support, managing the demand on the consumer power consumption, demand response programs, and establishing a new transmission framework, etc. [4]. Implementing these CM approaches with the minimum operation cost is a significant challenge for power system researchers and provides significant scope to enhance these CM approaches with the application of applied mathematical techniques.

1.1. Literature Survey

There has been significant development in the CM by power system researchers by implementing various strategies to prevent and alleviate congestion, which can occur when the demand for electricity transmission exceeds the capacity of the network. Zaidan and Toos developed a CM method utilizing a static synchronous series compensator (SSSC) to address congestion during emergencies, demonstrating the device’s effectiveness in enhancing power transfer capabilities [5]. Wang et al. focused on the CM that involves the monitoring of the system frequency with the application of distributed energy resources into the network to provide ancillary services [6]. Hobbie et al. analyzed the effect of model parameterization on CM, comparing different models used in electricity networks [7]. Zakaryaseraji and Ghasemi-Marzbali evaluated CM strategies incorporating demand response programs and distributed generation as flexible resources [8]. Shaikh et al. performed CM by determining the optimal values for the parameters for the transmission line parameters to facilitate effective power transactions [9]. Roustaei et al. developed voltage stability-based CM to improve the control of the power flow in the transmission system while maintaining voltage security [10]. Mishra et al. used AI-based methods for alleviating congestion in restructured power systems, highlighting neural networks, fuzzy logic, and evolutionary algorithms [11]. Paul formulated an enhanced grey wolf optimization algorithm to control congestion considering renewable sources, particularly solar photovoltaic systems [12]. Dehnavi et al. introduced an innovative CM approach by partitioning the power system and employing a decentralized control strategy [4]. Sarwar et al. used optimal distributed generation capacity and hybrid swarm optimization, focusing on positioning the DG units at specific locations to mitigate congestion [13].
In congestion management (CM), Generator Rescheduling (GR) is essential for optimizing generation dispatch to reduce congestion. It efficiently uses existing transmission infrastructure, minimizing the demand for expensive and rapid grid expansions. GR involves efficient management of the power deliveries by the generators while meeting the system constraints. The use of GR has been efficiently implemented by the power system researchers to manage the power system operations. Subramaniyan and Gomathi explored CM with the implementation of the genetic algorithm with a fuzzy-based system to alleviate congestion [14]. Agrawal et al. studied the behaviors of consumer participation in the electricity market with the application fuzzy-based approach to mitigate congestion with GR by modulating their consumption patterns [15]. In a similar research, Chakravarthi et al. tried to mitigate congestion by considering the implementation of an efficient controller that involved the real-time parameters associated with the GR and the electricity market [16]. Srivastava and Yadav optimized the generation patterns involved in the GR with the hybrid-based metaheuristic approach to alleviate congestion [17]. Ogunwole and Krishnamurthy considered the influence of the active and reactive power optimization in the GR to control the congestion [18]. Prajapati et al. studied the uncertainties related to the integration of renewable sources and their influence on the power generation patterns to reduce transmission line congestion [19]. Thiruvel et al. in their research combined the GR and optimal DG capacity to address the issues of congestion [20]. Balaraman and Kamaraj applied GR methodology in a deregulated electricity market using Particle Swarm Optimization (PSO) to solve the issues related to the congestion in the transmission network [21]. Saravanan and Anbalagan combined Genetic Algorithms (GAs) and PSO for optimal GR in deregulated power markets [22]. In another research, an amalgamation of GSA and PSO has been carried out by Sharma and Walde to minimize the effect of congestion with GR [23]. Haq et al. in their research considered the application of PHEV with GR to relieve congestion from the grid with the game theory approach [24]. Verma and Mukherjee also performed the optimal adjustments of the power delivered in the GR with the application Ant Lion optimizer [25]. Paul et al. developed a CM strategy to reduce rescheduling costs and efficiently alleviate line overloads, prioritizing generators based on sensitivity values and employing GSA to minimize rescheduling costs and total active power output [26].
The growth of aggressive profit maximization with minimum operating cost in the power market has spurred the requirements of efficient applied algorithms that can effectively optimize the cost involved in power transactions. Although traditional optimization techniques have been commonly employed and successful in some situations, they have constraints that often render metaheuristic optimization methods more advantageous [27]. Metaheuristic algorithms achieve a balance between exploring the search space broadly (diversification) and focusing on specific promising areas (intensification). By navigating various regions and homing in on potential solutions, they avoid getting stuck in local optima, thereby increasing their capability to discover better solutions. Approaches like Grey Wolf Optimization (GWO) [28], Firefly Algorithm (FFA) [29], Flower Pollination Algorithm (FPA), and an enhanced version of the Crow Search Algorithm (CSA) [30] have been employed to ensure the efficient operation of power systems. The selection and adjustment of control parameters for these metaheuristic techniques significantly impact the quality of the solutions achieved. This has led to the creation of an effective CM strategy utilizing evolutionary algorithms to achieve optimal solutions for the optimization problem.
This aims towards the utilization of two efficient algorithms for congestion management that have been used in the engineering application. The Harris Hawk Optimization is one of the established algorithms developed based on the hunting strategies of Harris’s hawks, known as the surprise pounce. Its application can be found in several optimization problems related to the engineering domain with significant success including areas like support vector machines [31], optimal power flow [32], MMPT control [33], and feature selection [34]; similarly, the SCA algorithm, which is based on the framework of the sine cosine function. SCA has also delivered promising results in engineering fields such as text categorization [35], photonic crystal waveguides [36], and power flow [37].
In this study, a hybridization approach has been adopted to develop an effective optimization algorithm with the combination of HHO and SCA resulting in the formation of hHHO-SCA. This hybridization aimed to combine the HHO framework’s strong exploitation capabilities with SCA’s efficient exploration abilities, thereby leveraging the strengths of both algorithms. The HHO algorithm, which faces challenges such as limited long-distance traversal and long waiting times, has been enhanced with SCA’s superior exploration features to improve the overall convergence and exploration of the algorithm. Incorporating SCA into the exploitation phases enhanced the accuracy in tracking the prey’s position, reduced the distance between the hawks and the prey, and increased the pouncing speed. This enhances the exploration and exploitation of the HHO.
The innovation in this research lies in the minimization of congestion costs and rescheduling expenses, which opens the door for the implementation of new, efficient optimization approaches that outperform earlier implemented approaches. The primary innovation of this research lies in the formulation of a mathematical framework designed to minimize congestion costs, integrating the newly developed HHO-SCA.

1.2. Research Contribution

  • A CM strategy has been developed to optimally manage rescheduled real power deliveries from the system generators.
  • An enhanced hybrid Harris Hawk Optimization–Sine Cosine Algorithm (hHHO-SCA) is proposed as an efficient optimization technique aimed at minimizing congestion costs by optimal adjustments in the real power deliveries of the generators.
  • Conventional benchmark functions have been employed to evaluate the performance of HHO-SCA and its application has been implemented on the IEEE 30-bus system and 118-bus system, demonstrating congestion mitigation with minimum rescheduling cost.
  • Comparisons have been established to highlight the effectiveness of HHO-SCA with other recent optimization algorithms based on congestion cost, voltage profile, and system loss.

2. Problem Formulation

The primary aim of Congestion Management (CM) is to minimize the costs associated with a power rescheduling approach adapted for alleviating the congestion while abiding by the necessary network constraints. The representation of the congestion cost involves the amount of the optimized generator power output along with its associated cost:
min C C = n = 1 N g ( C i n c Δ P g + C d e c Δ P g ) $ / h
Here, in Equation (1), C C is the cost of power rescheduled in ($/h), and C i n c and C d e c are the incremental and decremental price bids that are submitted by the generators. The ramping up/ramping down of the power output of the generators Δ P g are multiplied by the C i n c incremental and C d e c decremental prices corresponding to the respective generators to obtain the total congestion cost C C that is required for congestion alleviation. Ng represents the number of generators, and n represents the generator number (n = 1, 2, 3…. Ng). The objective function is subjected to the following system constraints:

2.1. Inequality Constraints

P G n min P G n P G n max ; n N g
Q G n min Q G n Q G n max ; n N g
( P G n P G n min ) = Δ P G n min Δ P G n Δ P G n max = ( P G n max P G n ) ; n N g
V n min V n V n max
P i j P i j max
Here, in Equations (2) and (3), P G n represents the real power generation and Q G n the reactive power generation by the respective generators (n = 1, 2, 3…, Ng) maintaining the range between their minimum and maximum power generation limits. Equation (4) shows the change in the real power generation as Δ P G n , which lies within the upper limit of Δ P G n max that is computed as ( P G n max P G n ) and Δ P G n min as the lower limit, which is determined as P G n P G n min from the power flow data. Equations (5) and (6) represent the voltage limits in the buses and transmission lines’ power flow limit.

2.2. Equality Constraints

Q G n Q D n = j V j V k Y k j sin ( δ k δ j θ k j ) ;   j = 1 , 2 , 3 , , N b
P G n P D n = j V j V k Y k j cos ( δ k δ j θ k j ) ;   j = 1 , 2 , 3 , , N b
P G n = P G n C + Δ P G n + Δ P G n ;   n = 1 , 2 , 3 , N g
P D j = P D j C ;   j = 1 , 2 , 3 , , N d
In Equations (7) and (8), PGk, PDk, QGk, and PDk are the real and the reactive power generated and demand in the system, and k and j are the two buses connected with the transmission line. In these equations, Vj and Vk are the bus voltages with δk and δj as the corresponding angles associated with the voltages. θkj denotes admittance angle. Ng, Nb, and Nd, are the count of the generators, generator buses, and load buses, respectively. System power balances are shown in Equations (7) and (8), whereas Equations (9) and (10) represent the power at market clearing prices.

3. Hybrid Harris Hawk Optimization–Sine Cosine Algorithm (hHHO-SCA)

3.1. Sine Cosine Algorithm (SCA)

The formulation of the SCA has been performed by Mirjalili from the concept of periodic property highlighted combinedly by the sine cosine functions. The SCA utilizes the framework of the sine cosine functions to generate random solutions that direct the candidate solutions to converge toward the optimal solutions. The exploration and exploitation scenarios can be represented as follows:
Z i t + 1 = Z i t + R a n d 1 × sin ( R a n d 2 ) × R a n d 3 . P o s i t Z i t
Z i t + 1 = Z i t + R a n d 1 × cos ( R a n d 2 ) × R a n d 3 . P o s i t Z i t
In Equations (11) and (12), Z i t represents the position for the latest generated candidate solution in the ith dimension, and t is the iteration number. Random numbers, Rand1, Rand2, and Rand3, are within the range [0, 1]. For the exploration and exploitation phases, 0.5 ≤ Rand4 < 0.5 is considered. These equations can be combined and represented as follows:
Z i t + 1 = Z i t + R a n d 1 × sin ( R a n d 2 ) × R a n d 3 . P o s i t Z i t , R a n d 4 < 0.5 Z i t + R a n d 1 × cos ( R a n d 2 ) × R a n d 3 . P o s i t Z i t , R a n d 0.5
The variations in the sine cosine functions’ ranges in Equations (11)–(13) portray the exploration and exploitation of the algorithm, which is evaluated considering the following equation:
R a n d 1 = B c t c B t max
In Equation (14), Bc is a constant term, and tc and tmax are the current and the maximum iteration, respectively.

3.2. Harris Hawk Optimization (HHO)

The Harris Hawk Optimization (HHO) algorithm has been developed considering the unique cooperative behaviors of Harris hawks involved in hunting their prey [38]. These hawks exhibit effective teamwork, which involves close observation, tracking, and attacking the rabbit (prey). This attacking approach is often termed as a surprise pounce. In general, the hawks reverse the complete region to trace the prey, which mainly denotes the exploration phase and then they perform the surprise ponce, which is considered as the exploitation phase. The execution of the complete HHO framework has been highlighted as follows:

3.2.1. Exploration Phase

The exploration phase of the HHO algorithm involves two methods for updating the hawks’ positions, with the probability of selecting either method depending on P. If P < 0.5, the hawks’ positions are influenced by the locations of other team members to ensure that they are close enough to the prey during the attack, as described by Equation (16). Conversely, if P > 0.5, the hawks traverse from one top of the tree to another tree, and the updated position is represented by Equation (15).
Z t + 1 = Z r a n d ( t ) r a n d 1 × Z r a n d ( t ) 2 × r a n d 2 Z r ( t ) , P 0.5
Z t + 1 = ( Z r a b b i t ( t ) Z m ( t ) r a n d 3 ( S r c u p r a n d 4 ( S r c u p S r c l b ) ) , P < 0.5
Z m ( t ) = 1 N i = 1 N Z i ( t )
The position vector related to the hawk is denoted by Z t + 1 ; in Equations (16) and (17), Z r a b b i t ( t ) resembles the position of the prey and Z r a n d ( t ) is the position of a randomly selected hawk, and S r c u p (upper limit) and S r c l b (lower limit) resemble the boundaries of the search region. The average location of the hawk is given by Z m ( t ) , and the population is denoted by N.

3.2.2. Exploitation Phase

In the complete process of the chase, the prey uses most of the energy to save itself from the attack of the hawk. This phenomenon leads to the reduction in the fleeing energy of the prey, which can be represented as follows:
F = 2 F 0 ( 1 t / T )
In this context, F 0 resembles the current energy level associated with the prey and this varies within the range of [−1, 1], and F denotes the escape energy related to the prey. The maximum and the current iterations are given by T and t, respectively. In this case if the value of F > 0 , the HHO is conducting its exploration phase, and if F < 0 it is in the exploitation phase.
The exploitation phase involves four distinct models related to the hawk’s attacking behavior and the tendency of the prey to save itself from the attack. The hawks generally attack the prey softly or forcefully. This mainly depends on the current condition of the prey based on the amount of energy remaining in it. As time progresses, the fleeing prey gradually loses energy, prompting the hawks to intensify their siege tactics to capture the weakened prey more effectively. The hawk’s attacking behavior has been represented in the following form.

3.2.3. Soft Besiege

The hawk adapts this approach when it finds that the prey has failed to escape the attack (r ≥ 0.5) but still has a sufficient amount of internal energy with which it can try to attempt a minor escape from the hawk (F ≥ 0.5). In such cases, the hawks cautiously encircle the prey to wear it down and make themselves ready to perform the surprise pounce. This attacking behavior can be highlighted by the following mathematical equations:
Z t + 1 = ( Z r a b b i t ( t ) X ( t ) ) F 2 ( 1 r a n d 5 ) . Z r a b b i t ( t ) Z ( t )
2 ( 1 R a n d 5 ) resembles the escaping strength of the prey and rand5 ε [0, 1].

3.2.4. Hard Besiege

In this case when the hawk finds that the prey has exhausted most of its energy, then the hawk barely tries to encircle the prey before pouncing on it. In this scenario, the current position is updated using Equation (20):
Z t + 1 = Z r a b b i t ( t ) F Z r a b b i t ( t ) Z ( t )

3.2.5. Soft Besiege with Gradual Brisk Dives

In the scenario when the energy of the prey is at a high level, the hawk’s movement is governed by the levy flight based on the random running pattern of the prey (F ≥ 0.5) and (r < 0.5). Therefore, the hawks determine their next move using the following Equations (21) and (22):
Z 1 = Z r a b b i t ( t ) F 2 ( 1 r a n d 5 ) . Z r a b b i t ( t ) Z ( t )
The hawks assess the potential success of each dive before committing to it. As they observe the prey making deceptive movements, they begin to execute sudden and rapid dives, aiming to intercept the rabbit’s trajectory. These dives follow Levy flight-based patterns, characterized as follows:
Z 2 = Z r a b b i t ( t ) F 2 ( 1 r a n d 5 ) . Z r a b b i t ( t ) Z ( t ) + ( S r × L F ( D s ) )
In Equation (22), D s represents the dimension, S r is a vector of size 1 × D s , and the Levy flight is calculated according to Equation (23):
L e v y F l i g h t ( Z ) = 0.01 × κ × ν μ 1 / β , ν = Γ ( 1 + β ) × sin ( π β / 2 ) Γ ( 1 + β 2 ) × β × 2 ( β 1 2 ) 1 / β
In Equation (23), κ and μ range within [0, 1], and β = 1.5.
During the soft besiege phase, the positions of the hawk can determine with the following equation:
Z t + 1 = Z 1   i f   F ( Z 1 ) < ( F ( Z ( t ) ) Z 2   i f   F ( Z 1 ) < ( F ( Z ( t ) )

3.2.6. Hard Besiege with Progressive Rapid Dives

In this scenario, the prey significantly lacks the energy to flee from the hawk, when F < 0.5 and r < 0.5 . In this case, an attempt is made by the hawk to perform a hard besiege. This attacking strategy is performed just before conducting the surprise pounce. The mathematical model for a hard besiege is represented as follows:
Z t + 1 = Z 1   i f   F ( Z 1 ) < ( F ( Z ( t ) ) Z 2   i f   F ( Z 1 ) < ( F ( Z ( t ) )
Here, Z 1 and Z 2 in Equation (25) are decided from Equations (27) and (28) and the value of Z m ( t ) is determined from Equation (17).
Z 1 = Z r a b b i t ( t ) F 2 ( 1 R a n d 5 ) . Z r a b b i t ( t ) Z m ( t )
Z 2 = Z r a b b i t ( t ) F 2 ( 1 R a n d 5 ) . Z r a b b i t ( t ) Z m ( t ) + ( S r × L F ( D s ) )

4. Formulation of hHHO-SCA

The HHO also struggles to consistently identify the optimal solution for an optimization problem. To mitigate these weaknesses and improve its execution, a combination of HHO and SCA is implemented, creating hHHO-SCA. From Equation (15), it can be observed that at the exploration stages, the hawks perch on random trees within the environment of the search space to prepare themselves for the hunting situation. However, due to the extended distance and waiting time, incorporating SCA formulations into Equation (15) improves both convergence and exploration efficiency. The combination of hHHO-SCA can be represented as follows:
Z t + 1 = Z r ( t ) R a n d 1 F cos ( r 2 ) . r 3 . Z r ( t ) 2 r a n d 2 Z ( t ) , r 4 < 0.5 Z r ( t ) R a n d 1 F sin ( r 2 ) . r 3 . Z r ( t ) 2 r a n d 2 Z ( t ) , r 4 0.5
The integration of SCA in the exploitation stages (Equations (19)–(22), (27) and (28)) enhances the accuracy of locating the prey’s position. This reduces the attacking range and enhances the swooping action. The exploitation approach is given below:
  • Soft-Besiege [( r 0.5  and ( F 0.5 )]
    Z t + 1 = Z r a b b i t ( t ) sin ( r 2 ) . F 2 ( 1 R a n d 5 ) . r 3 Z r a b b i t ( t ) Z ( t ) , r 4 < 0.5 Z r a b b i t ( t ) cos ( r 2 ) . F 2 ( 1 R a n d 5 ) . r 3 Z r a b b i t ( t ) Z ( t ) , r 4 0.5
  • Hard-Besiege [( r 0.5  and ( F < 0.5 )]
    Z t + 1 = Z r a b b i t ( t ) sin ( r 2 ) . F r 3 Z r a b b i t ( t ) Z ( t ) , r 4 < 0.5 Z r a b b i t ( t ) cos ( r 2 ) . F r 3 Z r a b b i t ( t ) Z ( t ) , r 4 0.5
  • Soft-Besiege with rapid drive [( r 0.5  and ( F 0.5 )]
    Z 1 = Z r a b b i t ( t ) sin ( r 2 ) . F 2 ( 1 R a n d 5 ) . r 3 Z r a b b i t ( t ) Z ( t ) , r 4 < 0.5 Z r a b b i t ( t ) cos ( r 2 ) . F 2 ( 1 R a n d 5 ) . r 3 Z r a b b i t ( t ) Z ( t ) , r 4 0.5
    Z 2 = Z r a b b i t ( t ) sin ( r 2 ) . F 2 ( 1 R a n d 5 ) . r 3 Z r a b b i t ( t ) Z ( t ) + ( S r × L e v y   F l i g h t ( D s ) ) , r 4 < 0.5 Z r a b b i t ( t ) cos ( r 2 ) . F 2 ( 1 R a n d 5 ) . r 3 Z r a b b i t ( t ) Z ( t ) + ( S r × L e v y   F l i g h t ( D s ) ) , r 4 0.5
    Z ( t + 1 ) = Z 1   i f   F ( Z 1 ) < ( F ( Z ( t ) ) Z 2   i f   F ( Z 2 ) < ( F ( Z ( t ) )
  • Hard Besiege with progressive rapid dive [( r < 0.5  and ( F < 0.5 )]
    Z 1 = Z r a b b i t ( t ) sin ( r 2 ) . F 2 ( 1 R a n d 5 ) . r 3 Z r a b b i t ( t ) Z m ( t ) , r 4 < 0.5 Z r a b b i t ( t ) cos ( r 2 ) . F 2 ( 1 R a n d 5 ) . r 3 Z r a b b i t ( t ) Z m ( t ) , r 4 0.5
    Z 2 = Z r a b b i t ( t ) sin ( r 2 ) . F 2 ( 1 R a n d 5 ) . r 3 Z r a b b i t ( t ) Z m ( t ) + ( S r × L e v y   F l i g h t ( D s ) ) , r 4 < 0.5 Z r a b b i t ( t ) cos ( r 2 ) . F 2 ( 1 R a n d 5 ) . r 3 Z r a b b i t ( t ) Z m ( t ) + ( S r × L e v y   F l i g h t ( D s ) ) , r 4 0.5
    Z ( t + 1 ) = Z 1   i f   F ( Z 1 ) < ( F ( Z ( t ) ) Z 2   i f   F ( Z 2 ) < ( F ( Z ( t ) )

Performance Analysis of hHHO-SCA

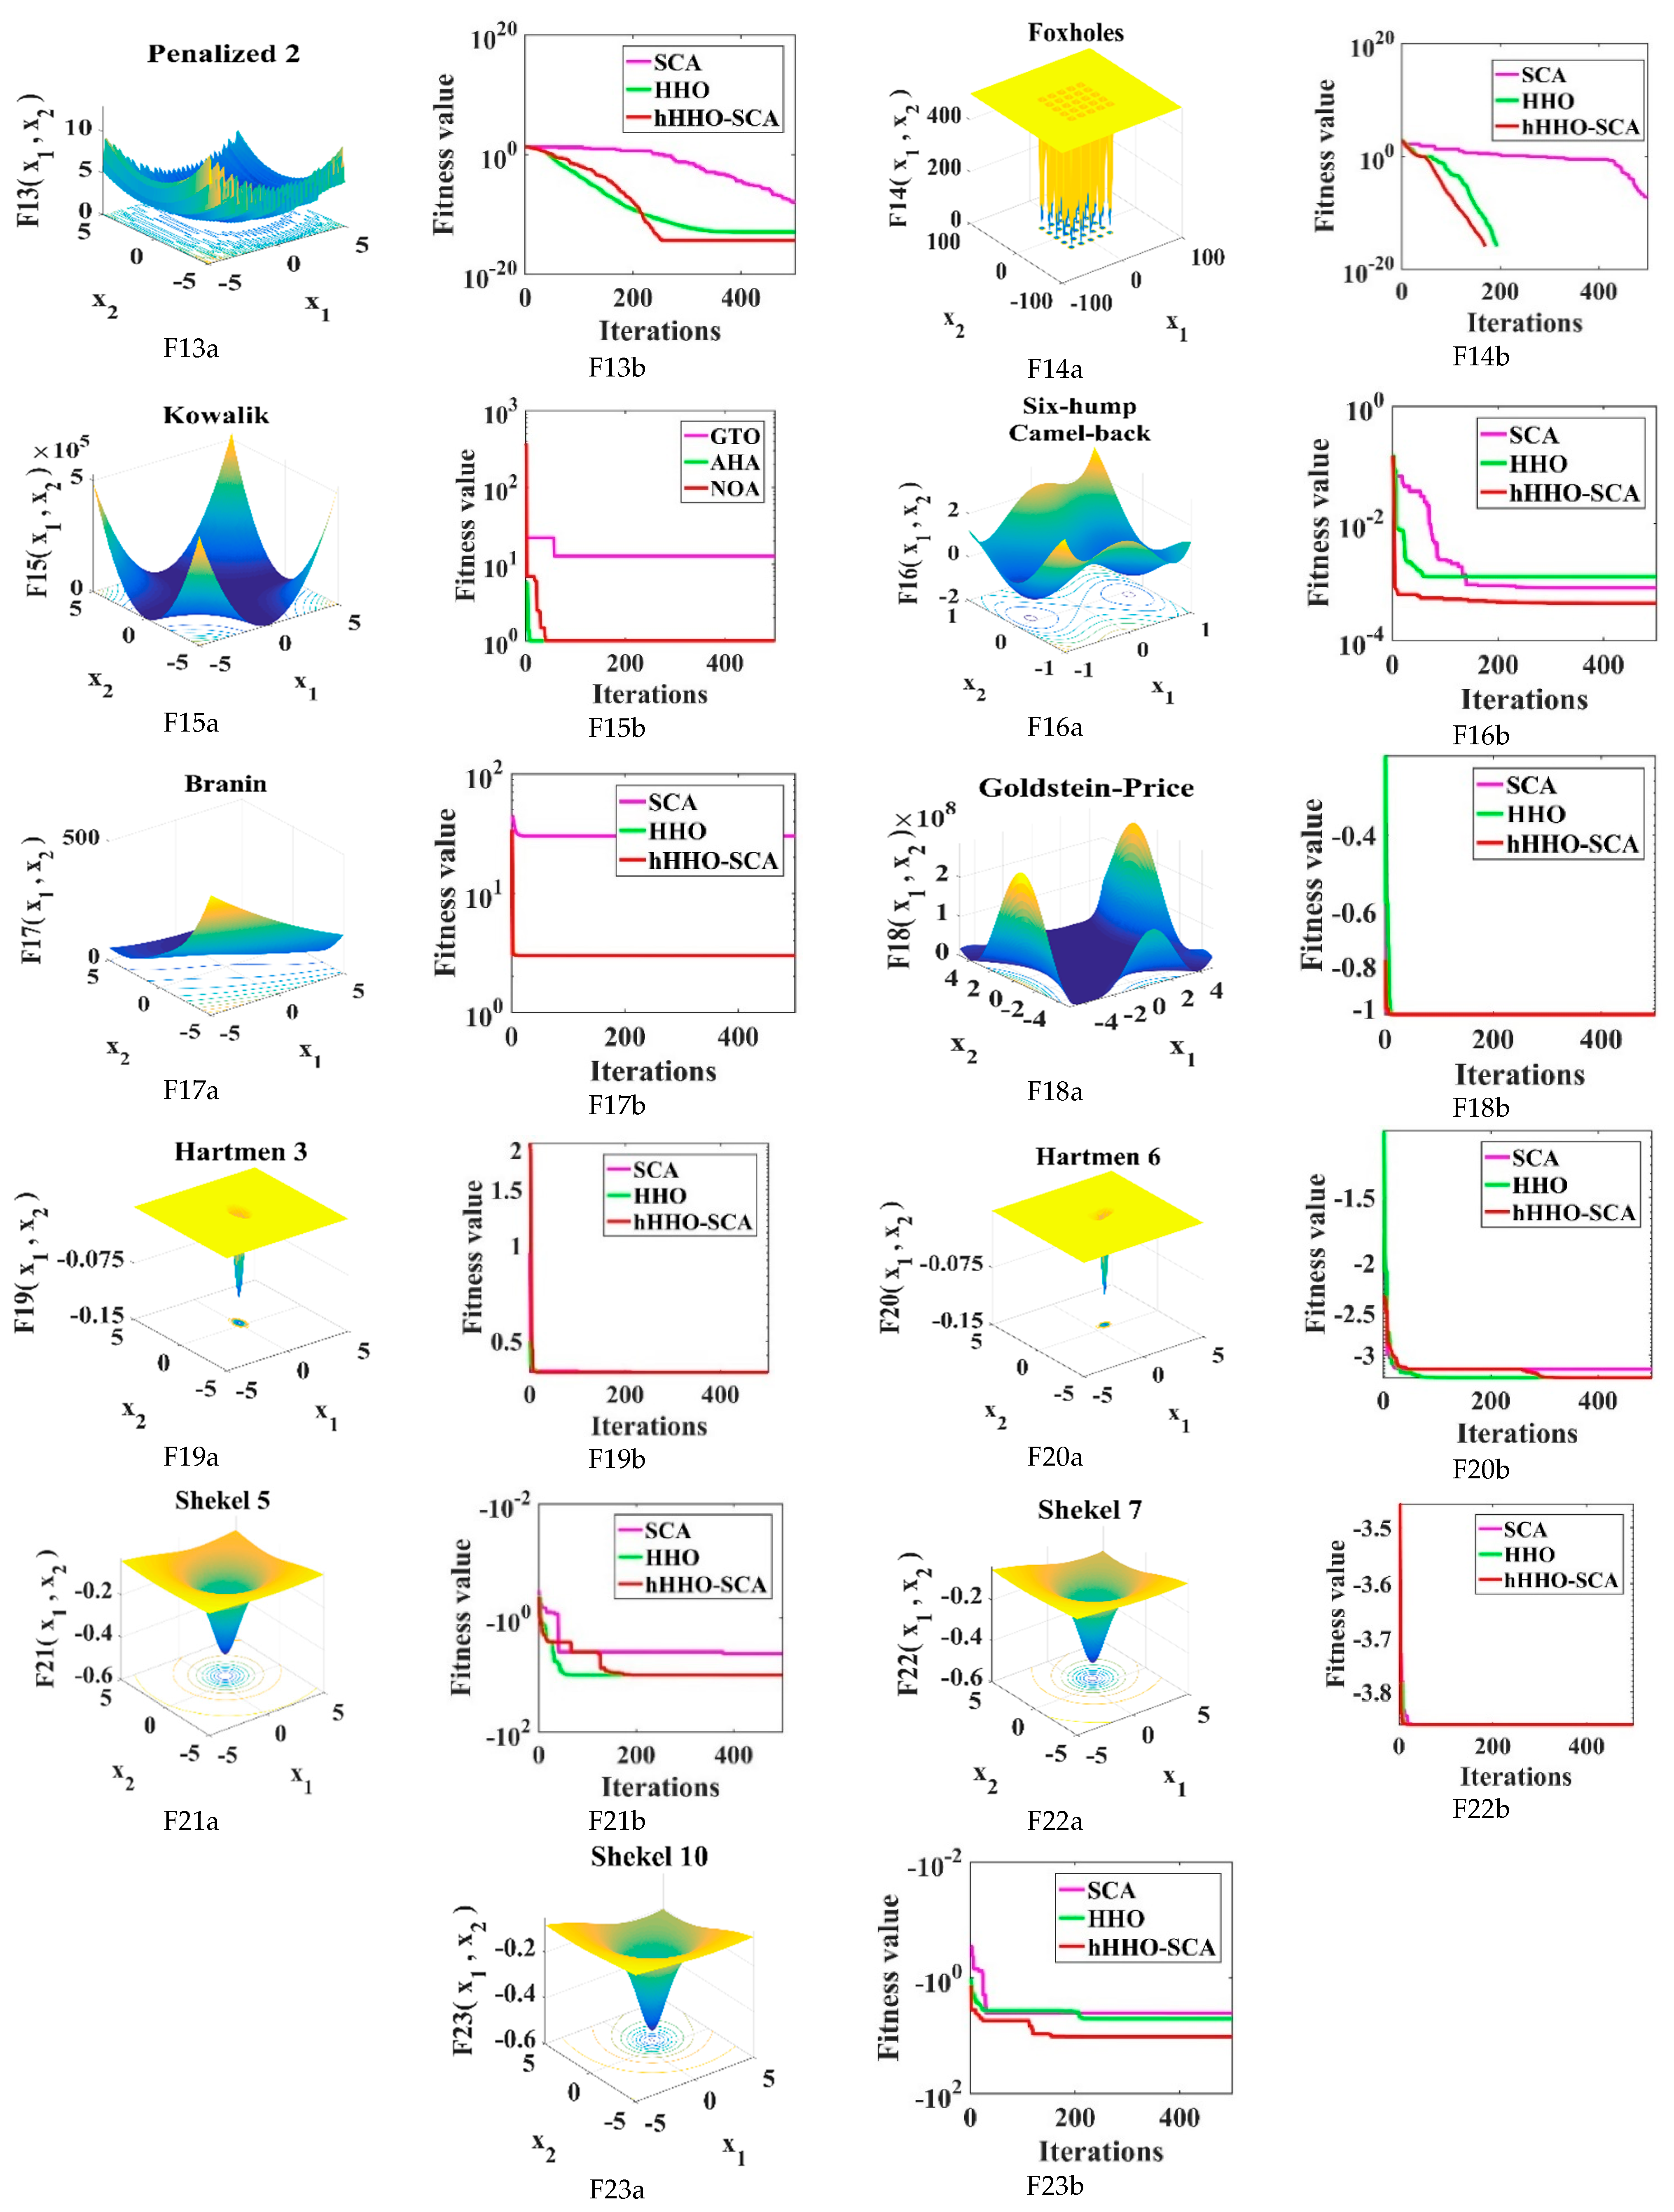
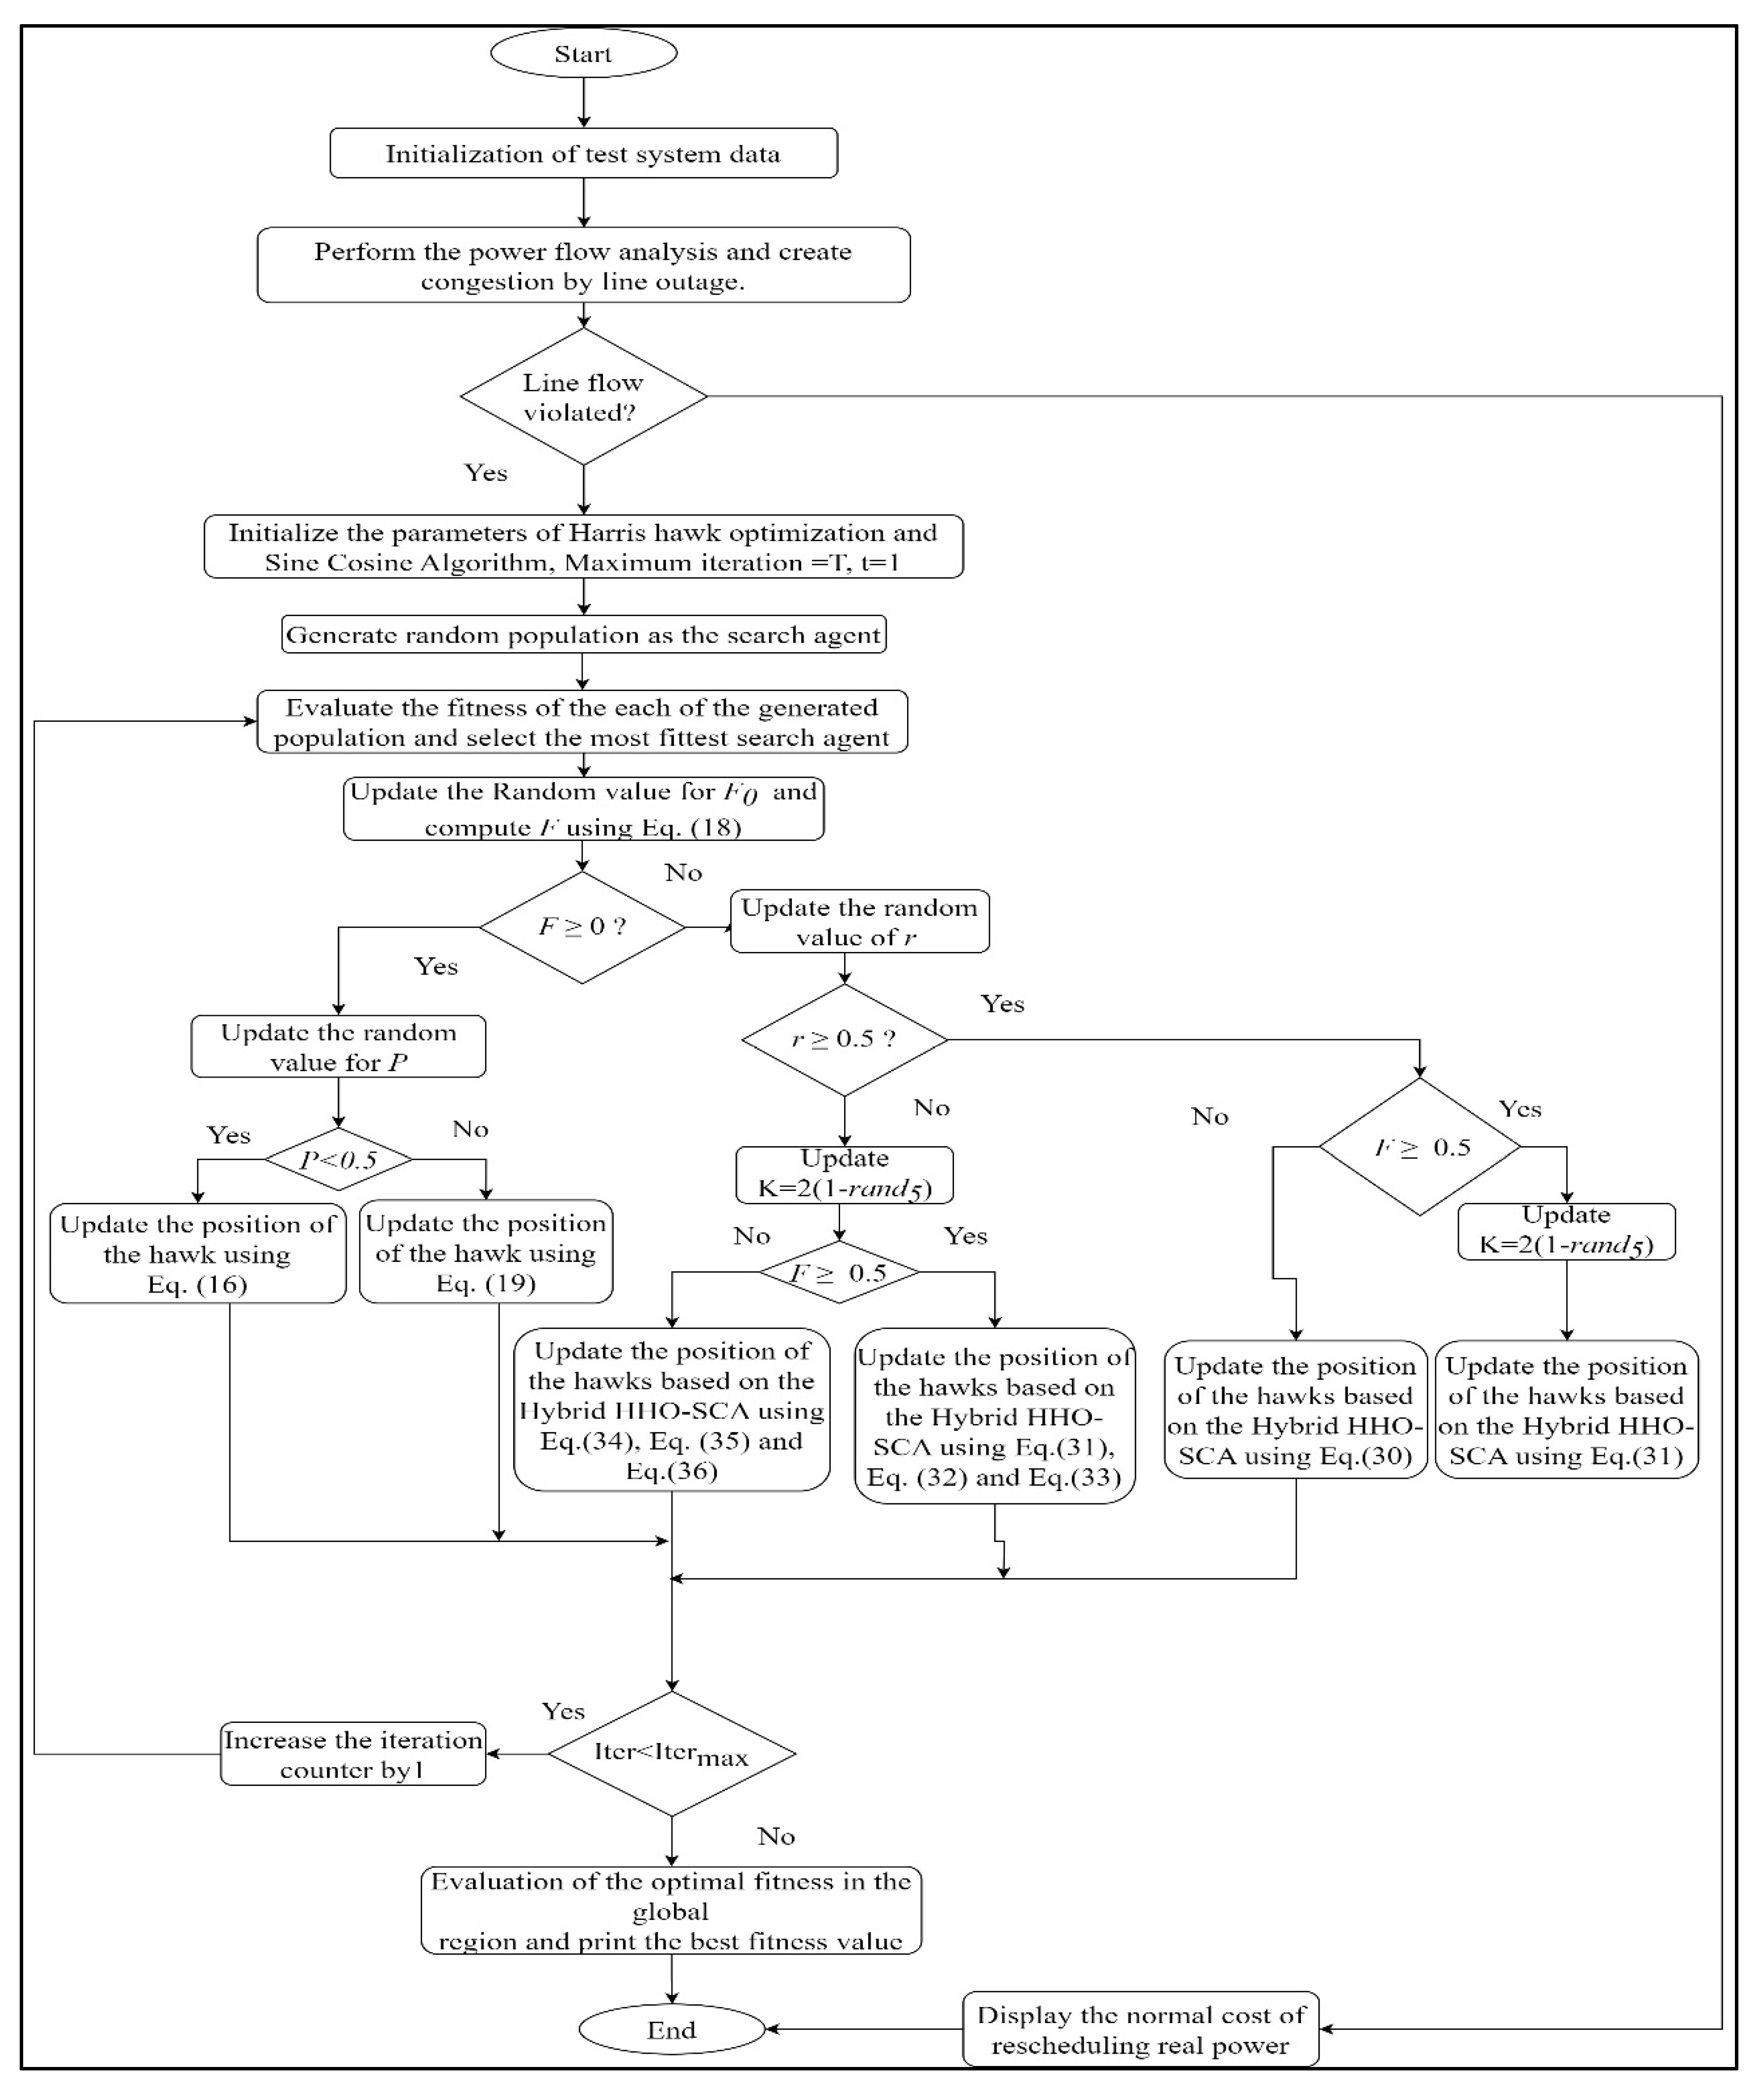
The potential of hHHO-SCA has been evaluated by its application on the 23 conventional benchmark functions, which include 7 unimodal and 13 multimodal functions with their details specified in [32]. hHHO-SCA’s results are compared with those from other well-known metaheuristic methods, with the original HHO and SCA. In this study, each run used 30 search agents and a maximum of 500 iterations, with results reported over 30 separate runs. The comparative analysis shows that hHHO-SCA performs well in both the exploration and exploitation phases. Table 1 presents the standard deviation (SD), average (Avg), median (Med), and worst (Worst) values for hHHO-SCA, SCA, and HHO in the final run. Figure 1 illustrates the convergence profiles for hHHO-SCA, HHO, and SCA Figure 2 depicts the hHHO-SCA flowchart for the proposed CM problem.

5. Results and Discussions

The proposed HHHO-SCA has been evaluated on different power systems: the modified IEEE 30-bus system [39] and the IEEE 118-bus test system [40]. To solve the CM problem, hHHO-SCA’s performance has been compared with other recent optimization techniques, PSO [21], RSM [21], SA [21], FPA [25], ALO [25], TLBO [41], and newer algorithms such as SCA and HHO. The hHHO-SCA, SCA, and HHO, under identical conditions, ensure a fair comparison. The study was conducted using MATLAB 2016a on a system equipped with an Intel Core i7 processor running at 2.4 GHz and 8 GB of RAM. Detailed information about the simulated cases is provided in Table 2. In the research, line overloads have been induced in two scenarios: by line outage and increasing power demand. Multiple trial runs have been conducted to determine the optimal parameter values. The population size has been taken as 40 with 300 iterations.

5.1. IEEE 30-Bus System

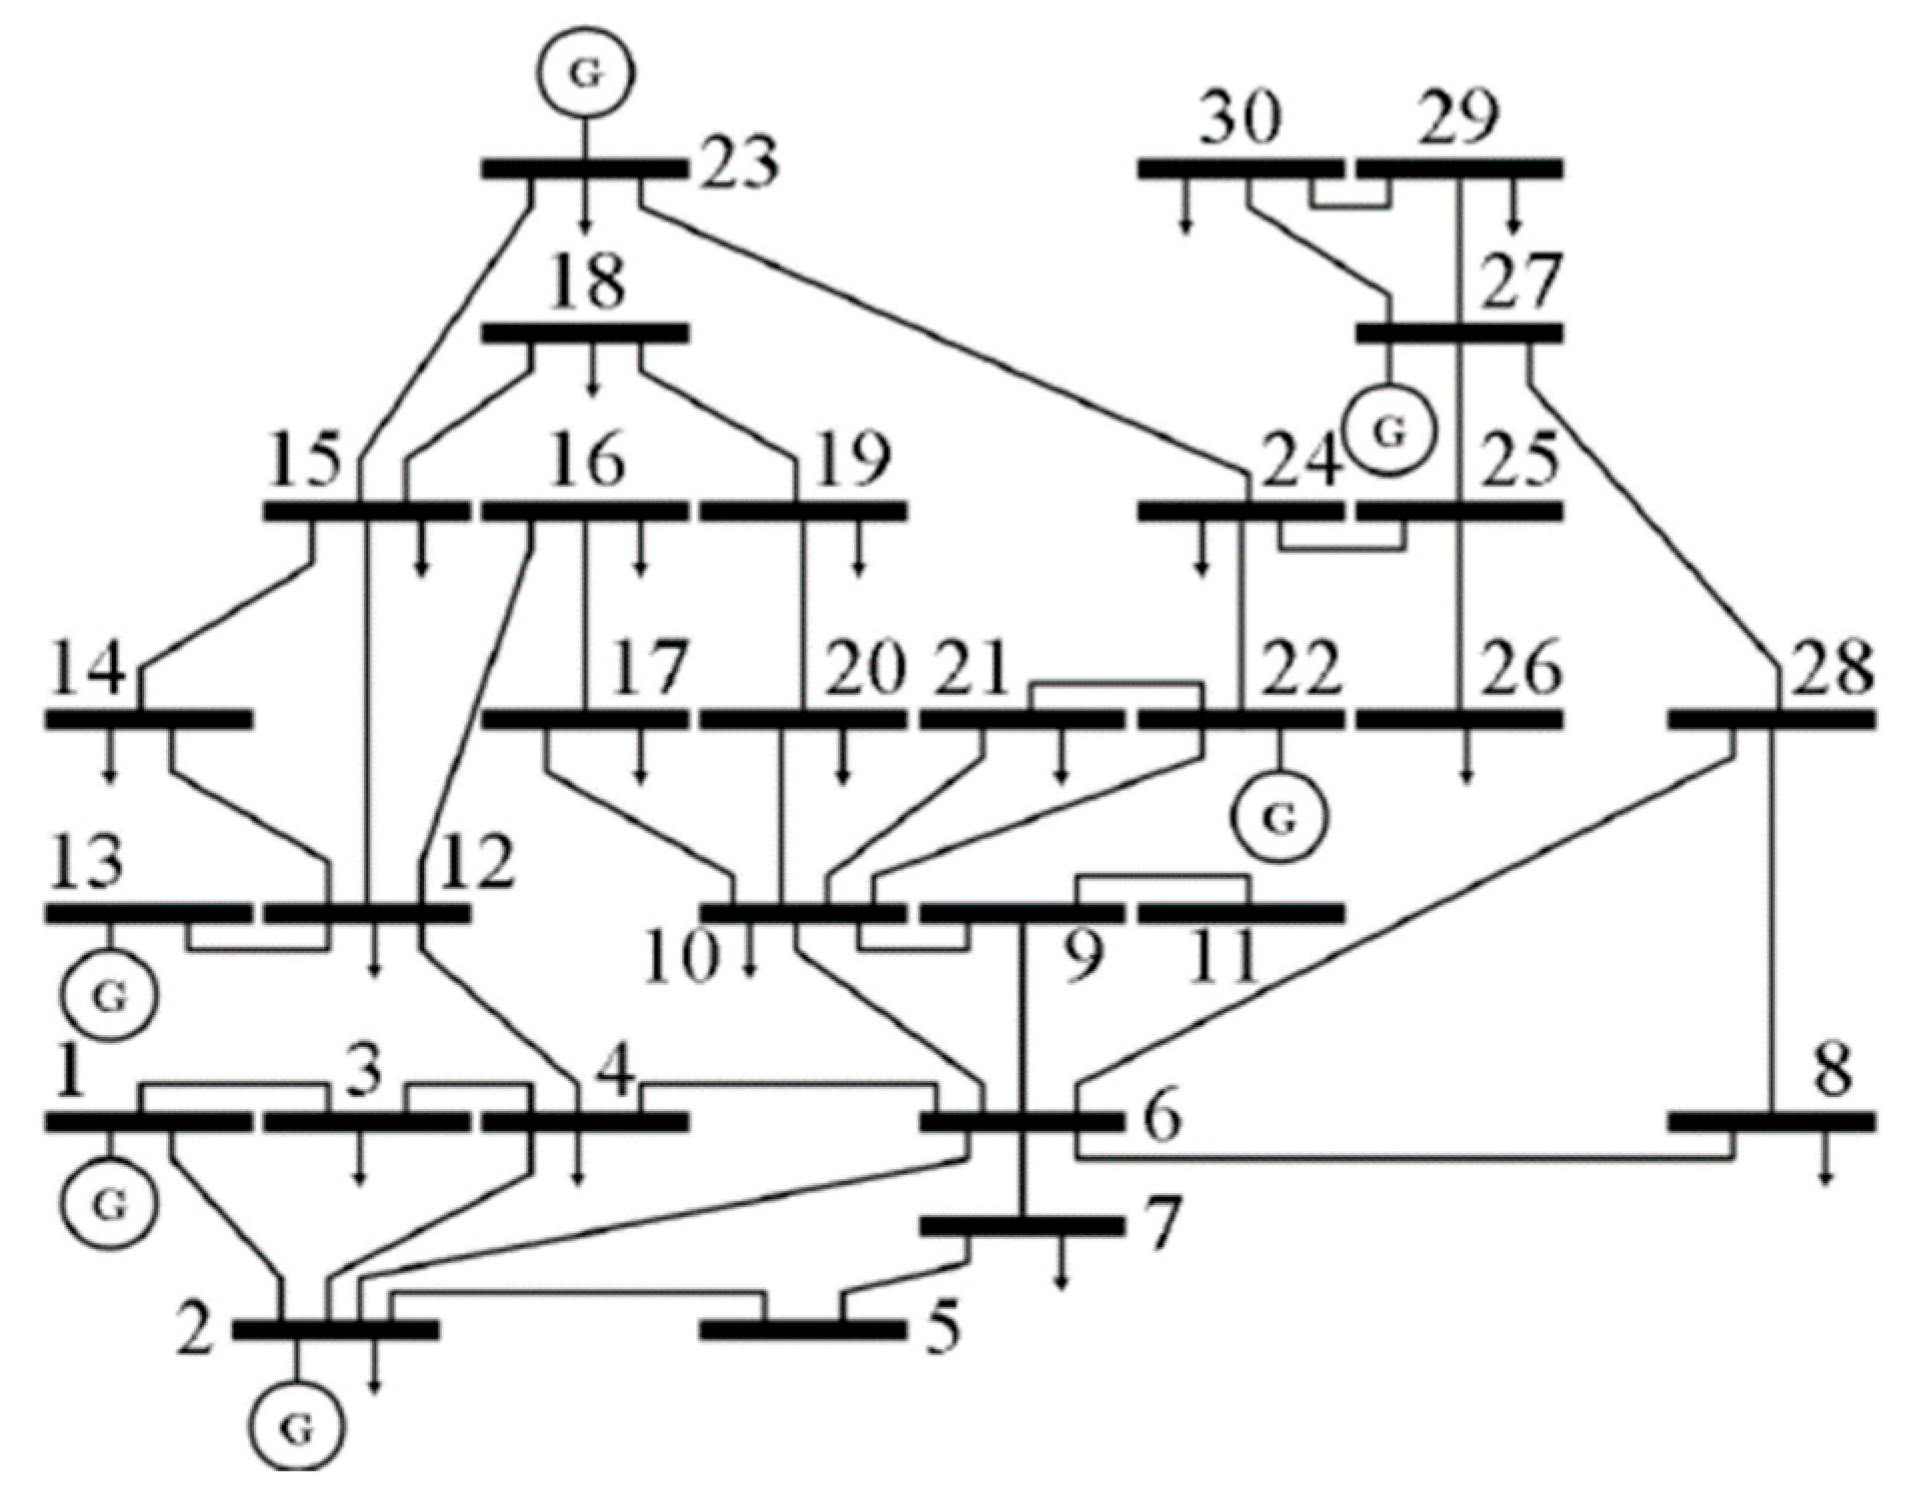
The evaluation of the CM problem has been conducted using the modified IEEE 30-bus test system, which includes 41 transmission lines, 6 generator buses, and 24 load buses. The representation of the IEEE 30-bus system is shown in Figure 3, and its overloading scenarios are given in Table 2, while Table 3 provides information on the congested power flow scenario.
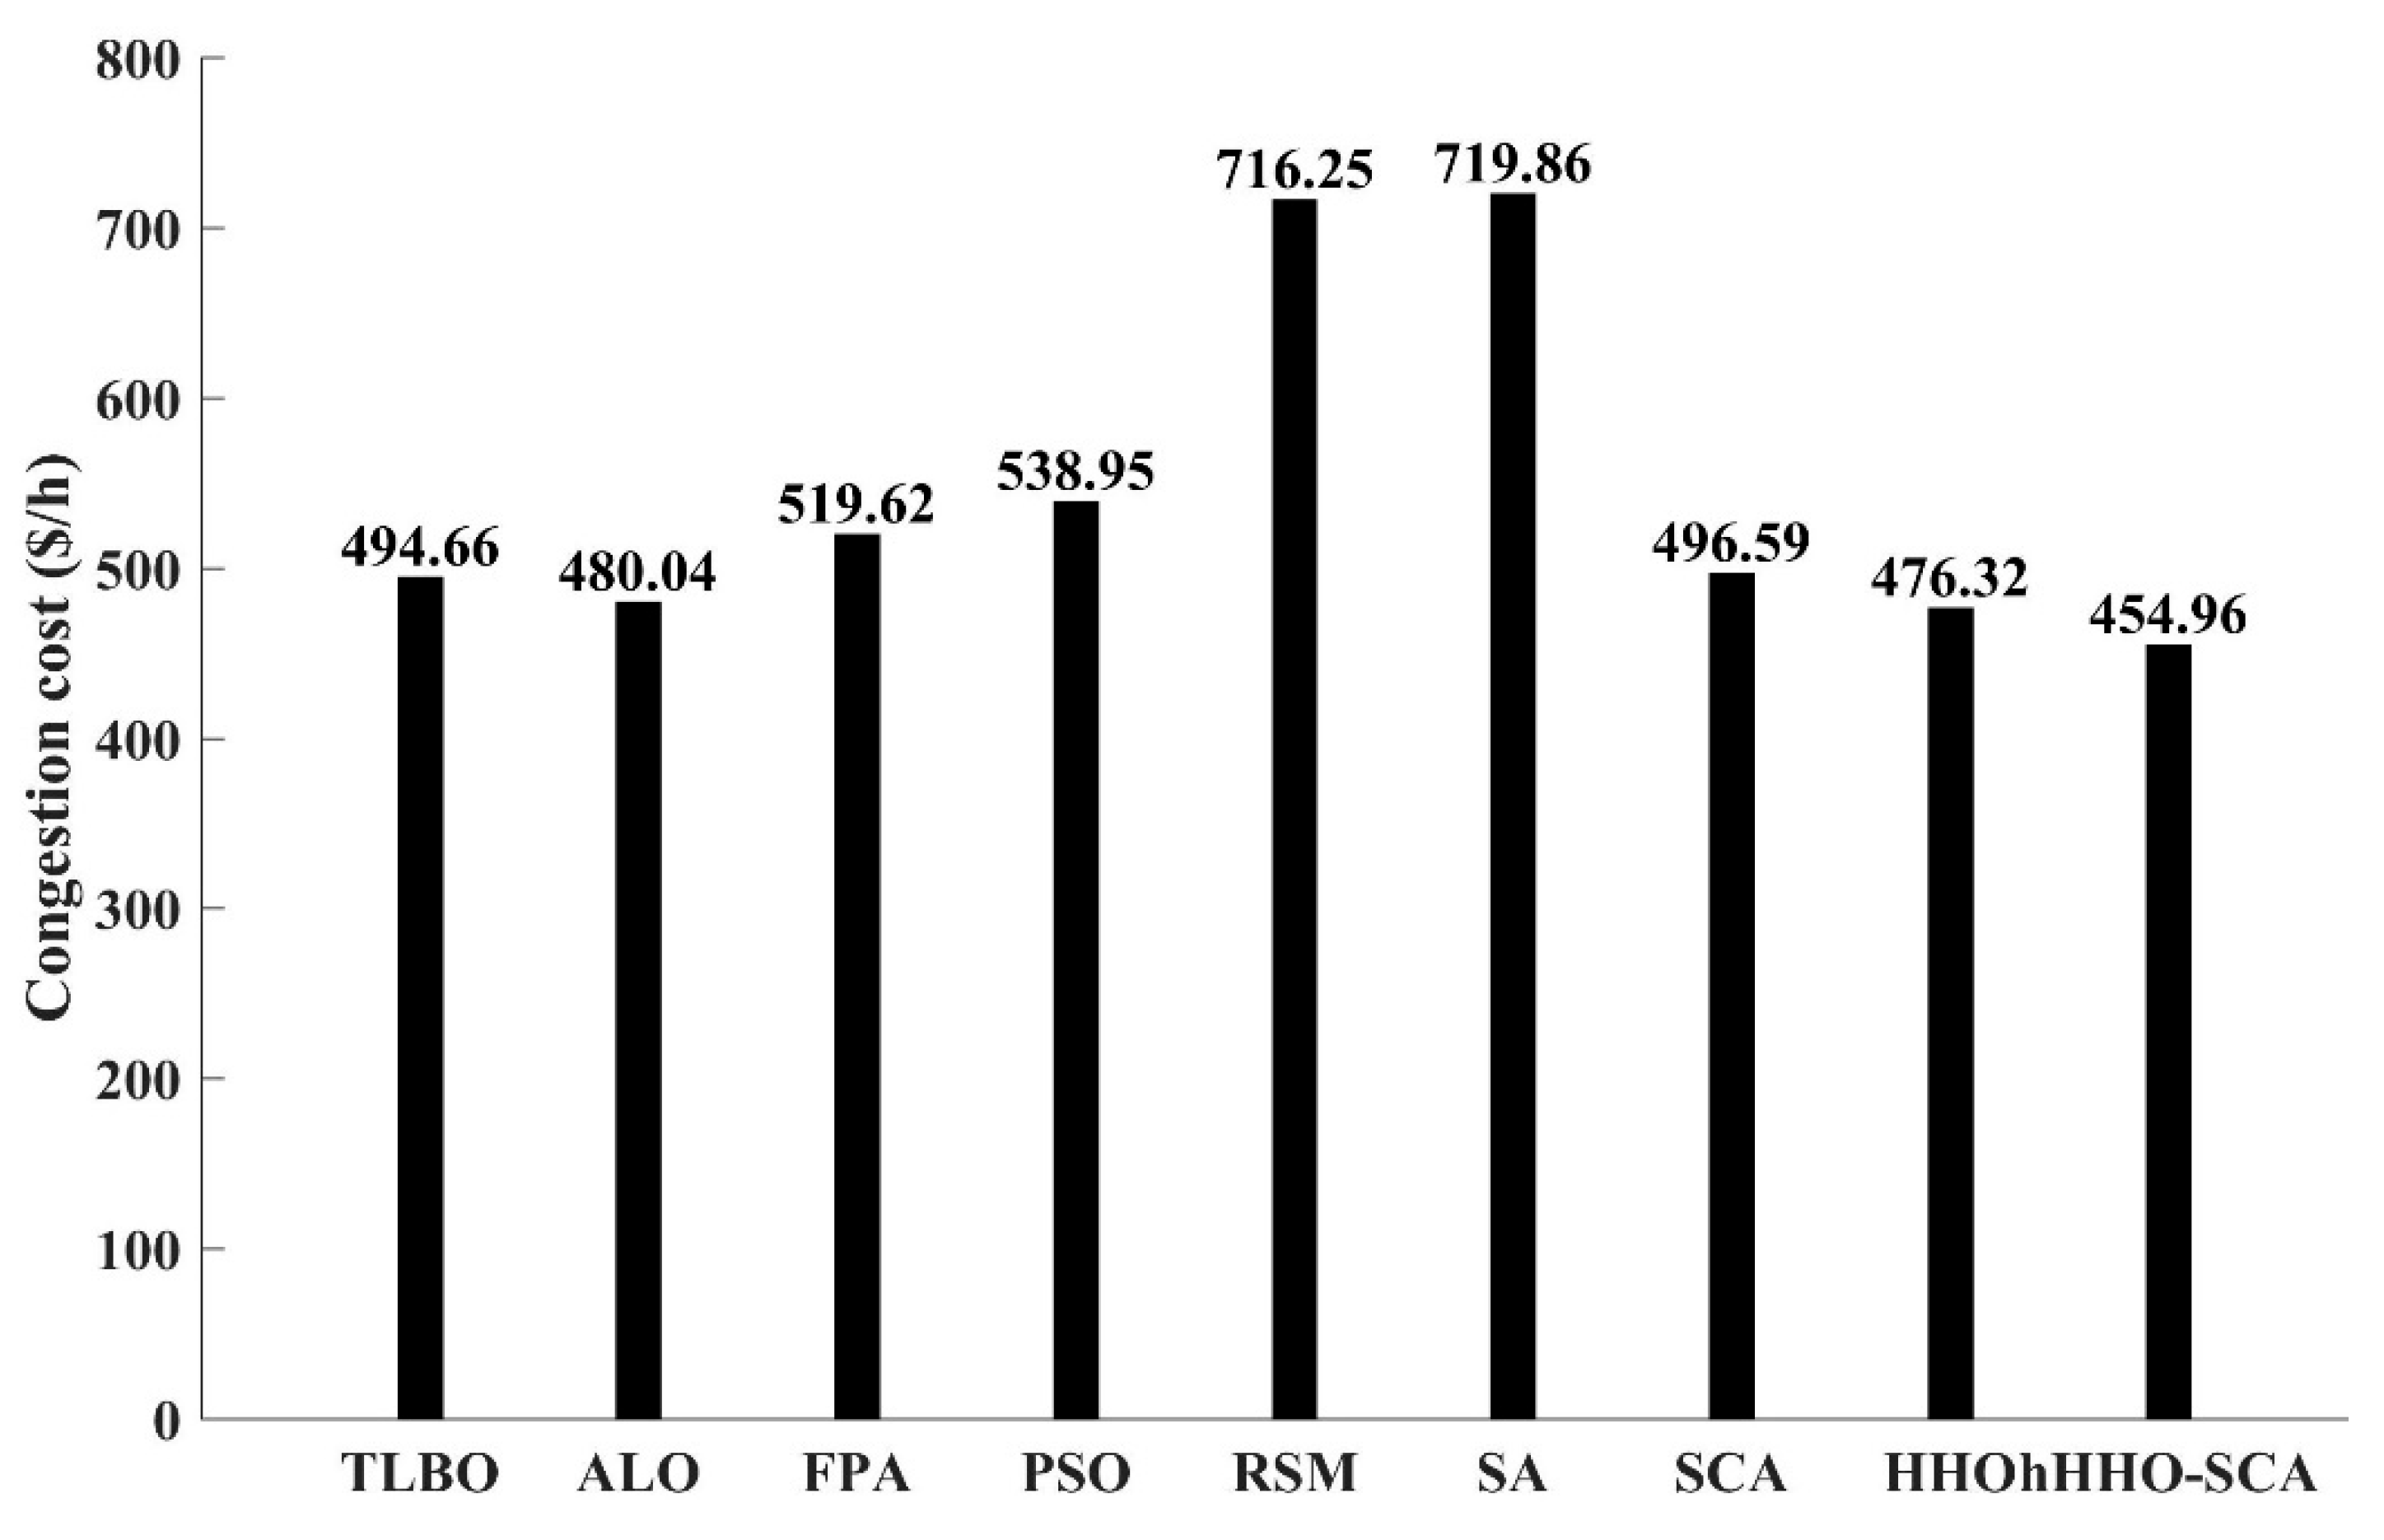
In this case, the congestion resulted from the tripping of Line 1 connecting buses 1 and 2. This disruption has caused overloading on Line 2 (linking Bus 1 and Bus 3) and Line 4 (linking Bus 6 and Bus 8), as shown in Table 3. To maintain a secure operation, it is essential to implement counteractive measures to alleviate these overloaded lines. The hHHO-SCA has been utilized to reduce congestion costs by optimizing generator output. It can be observed from Table 4 that the line flows have been controlled under the limit, and the congestion has been mitigated with the use of hHHO-SCA. The congestion costs determined using hHHO-SCA are also displayed in Table 4. These outcomes are contrasted with the solutions highlighted in PSO [21], RSM [21], SA [21], FPA [25], ALO [25], TLBO [41], and newer algorithms such as SCA and HHO. The HHHO-SCA-based method yielded an optimal total congestion cost of 454.96 $/h which is the minimum among the compared algorithms.
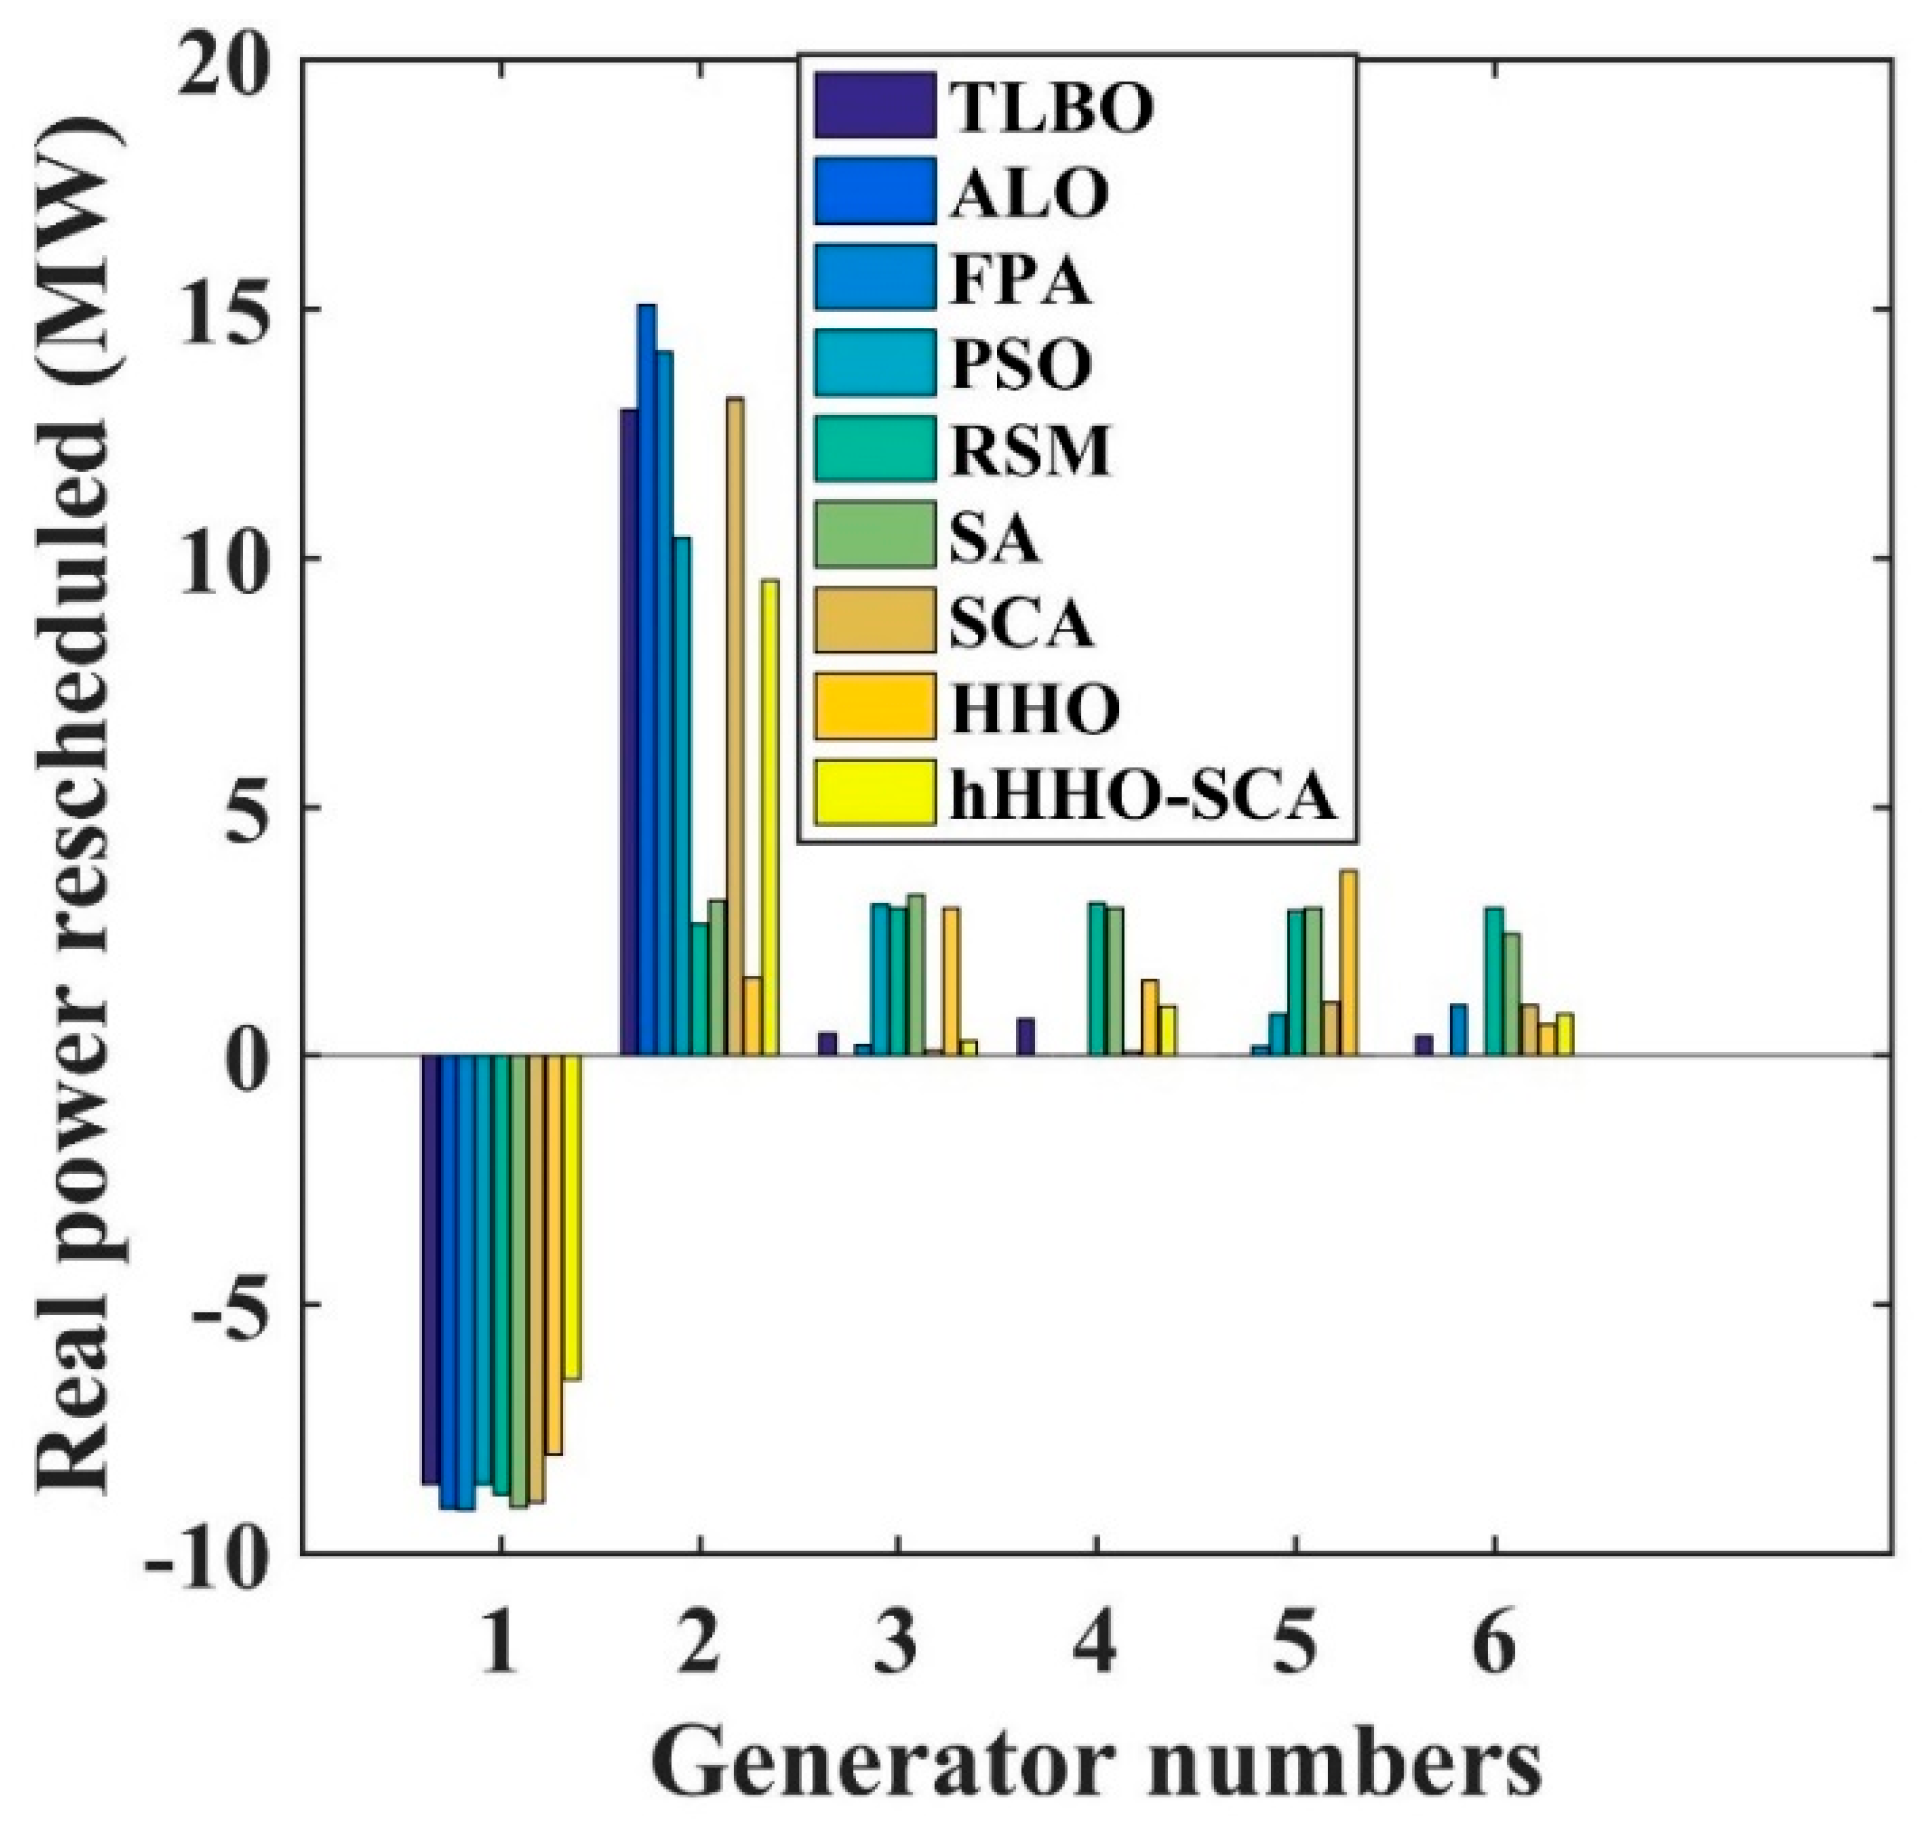
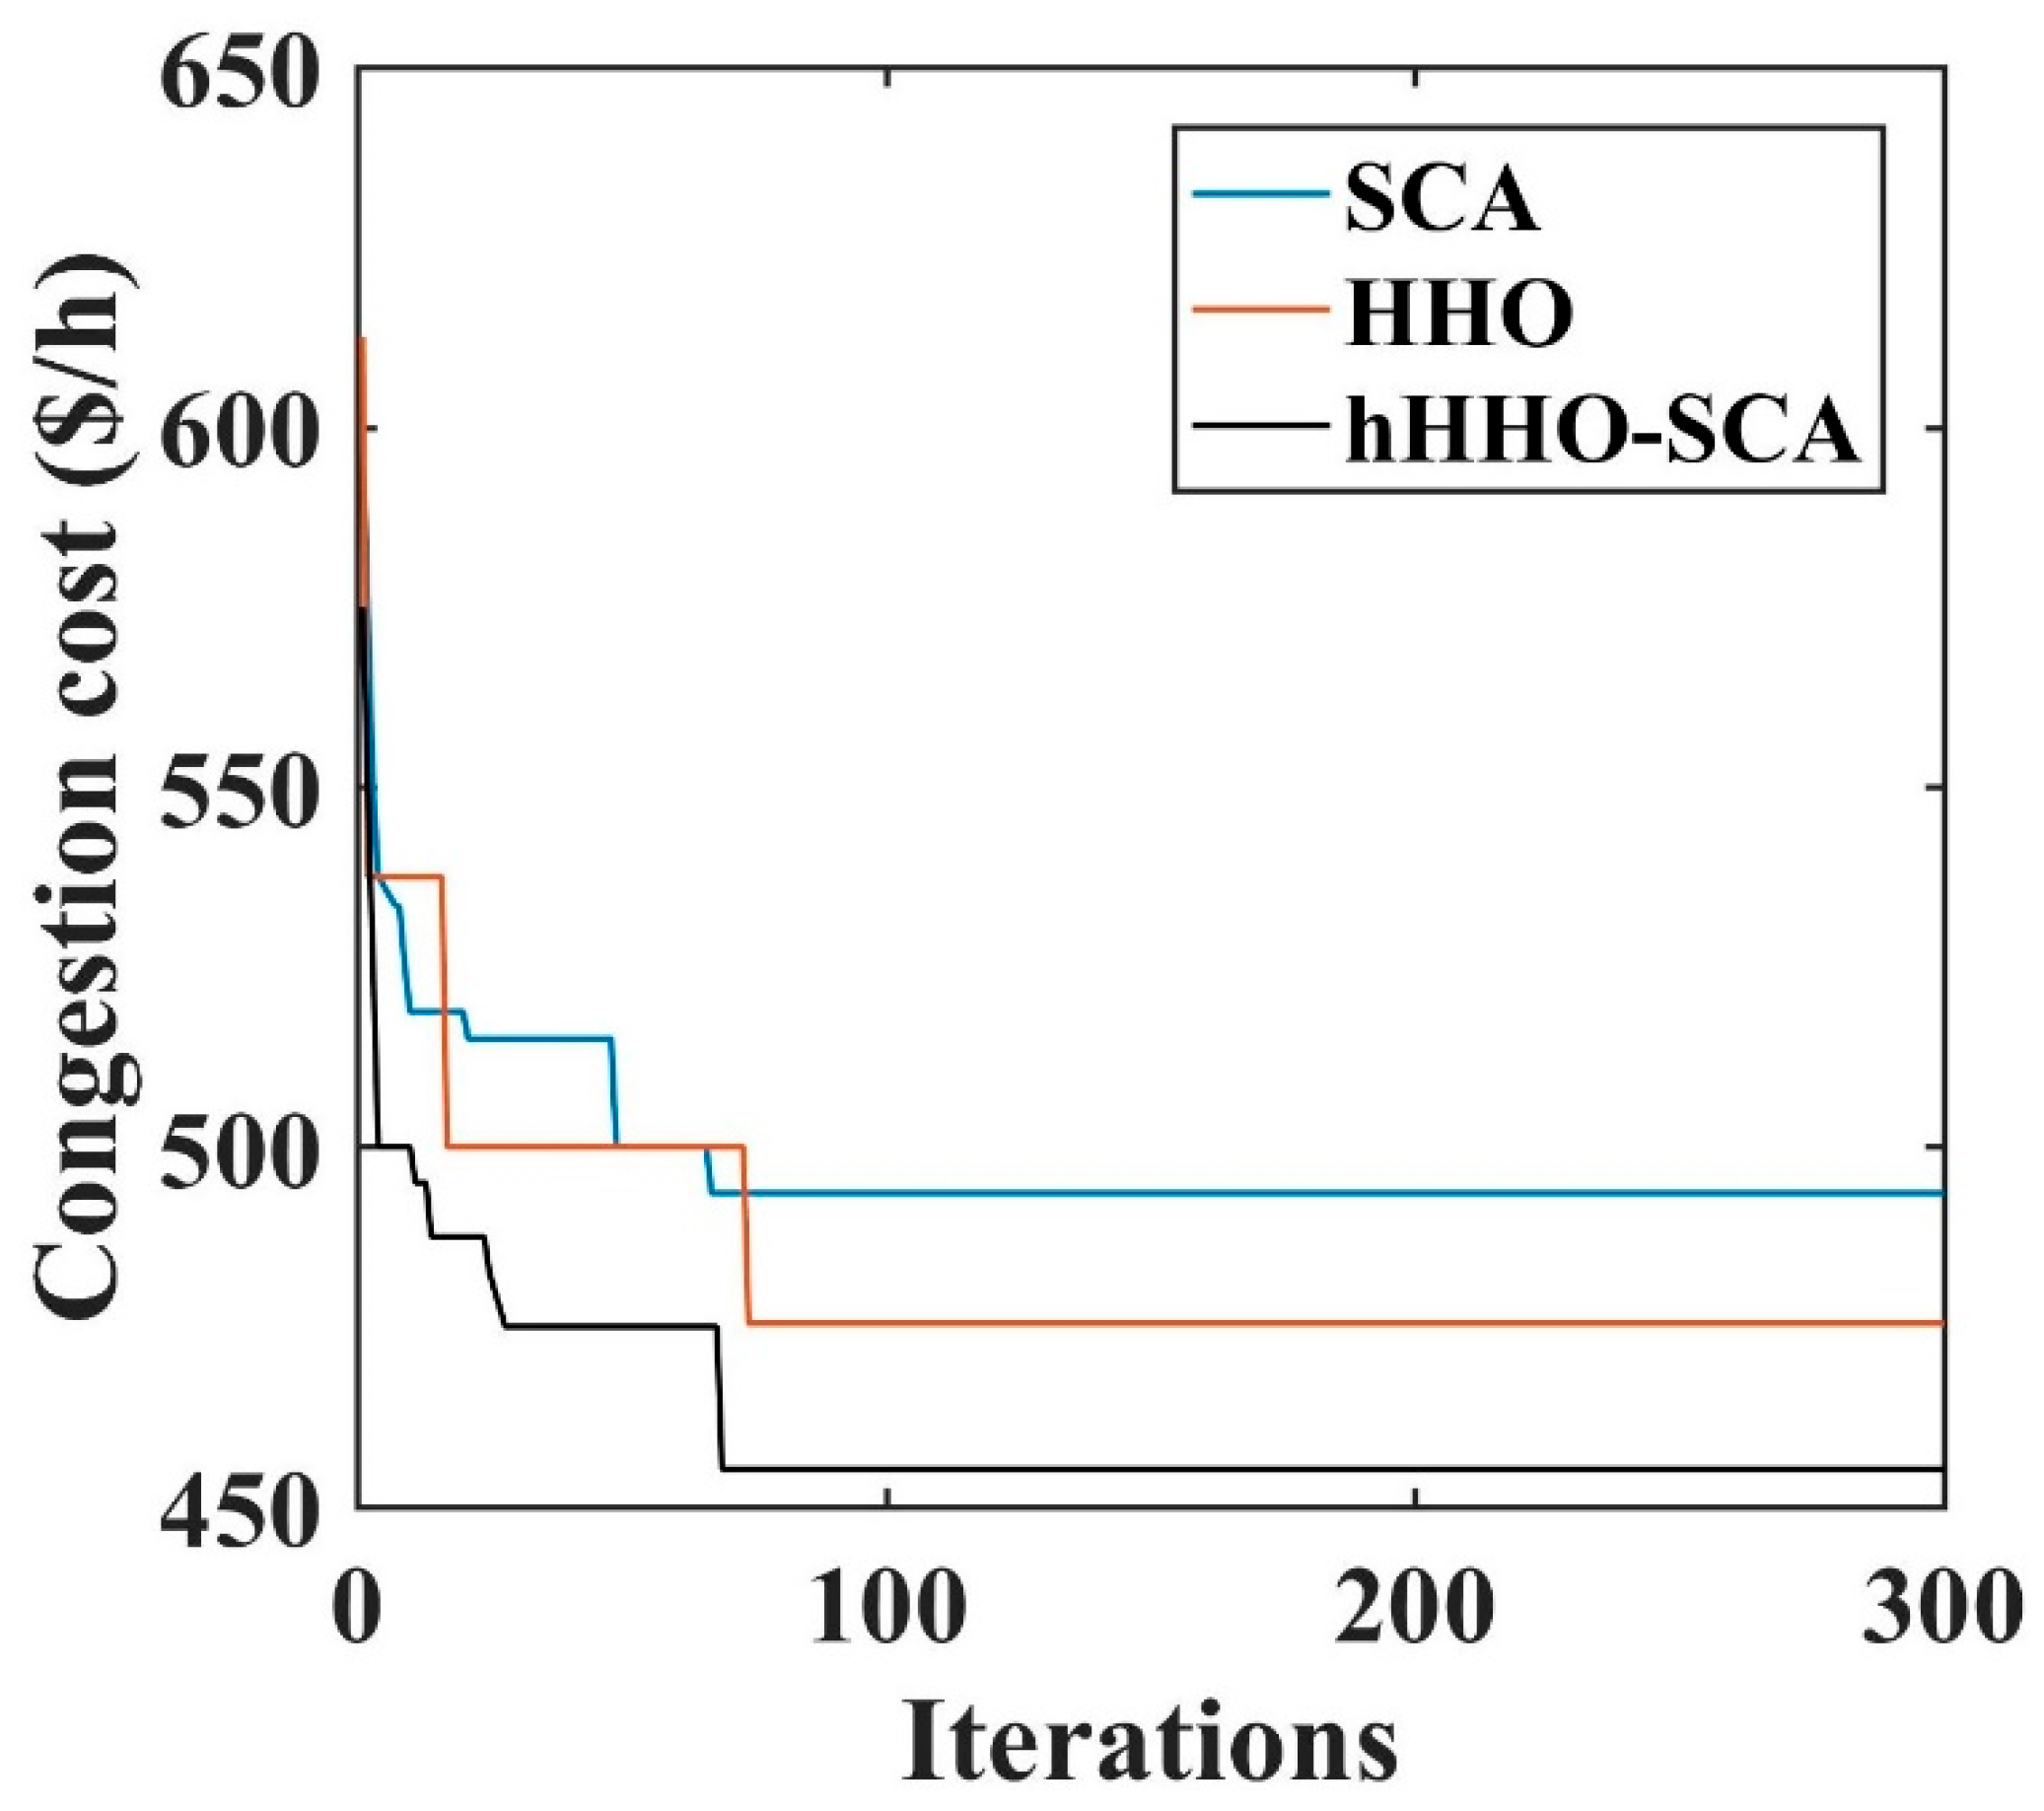
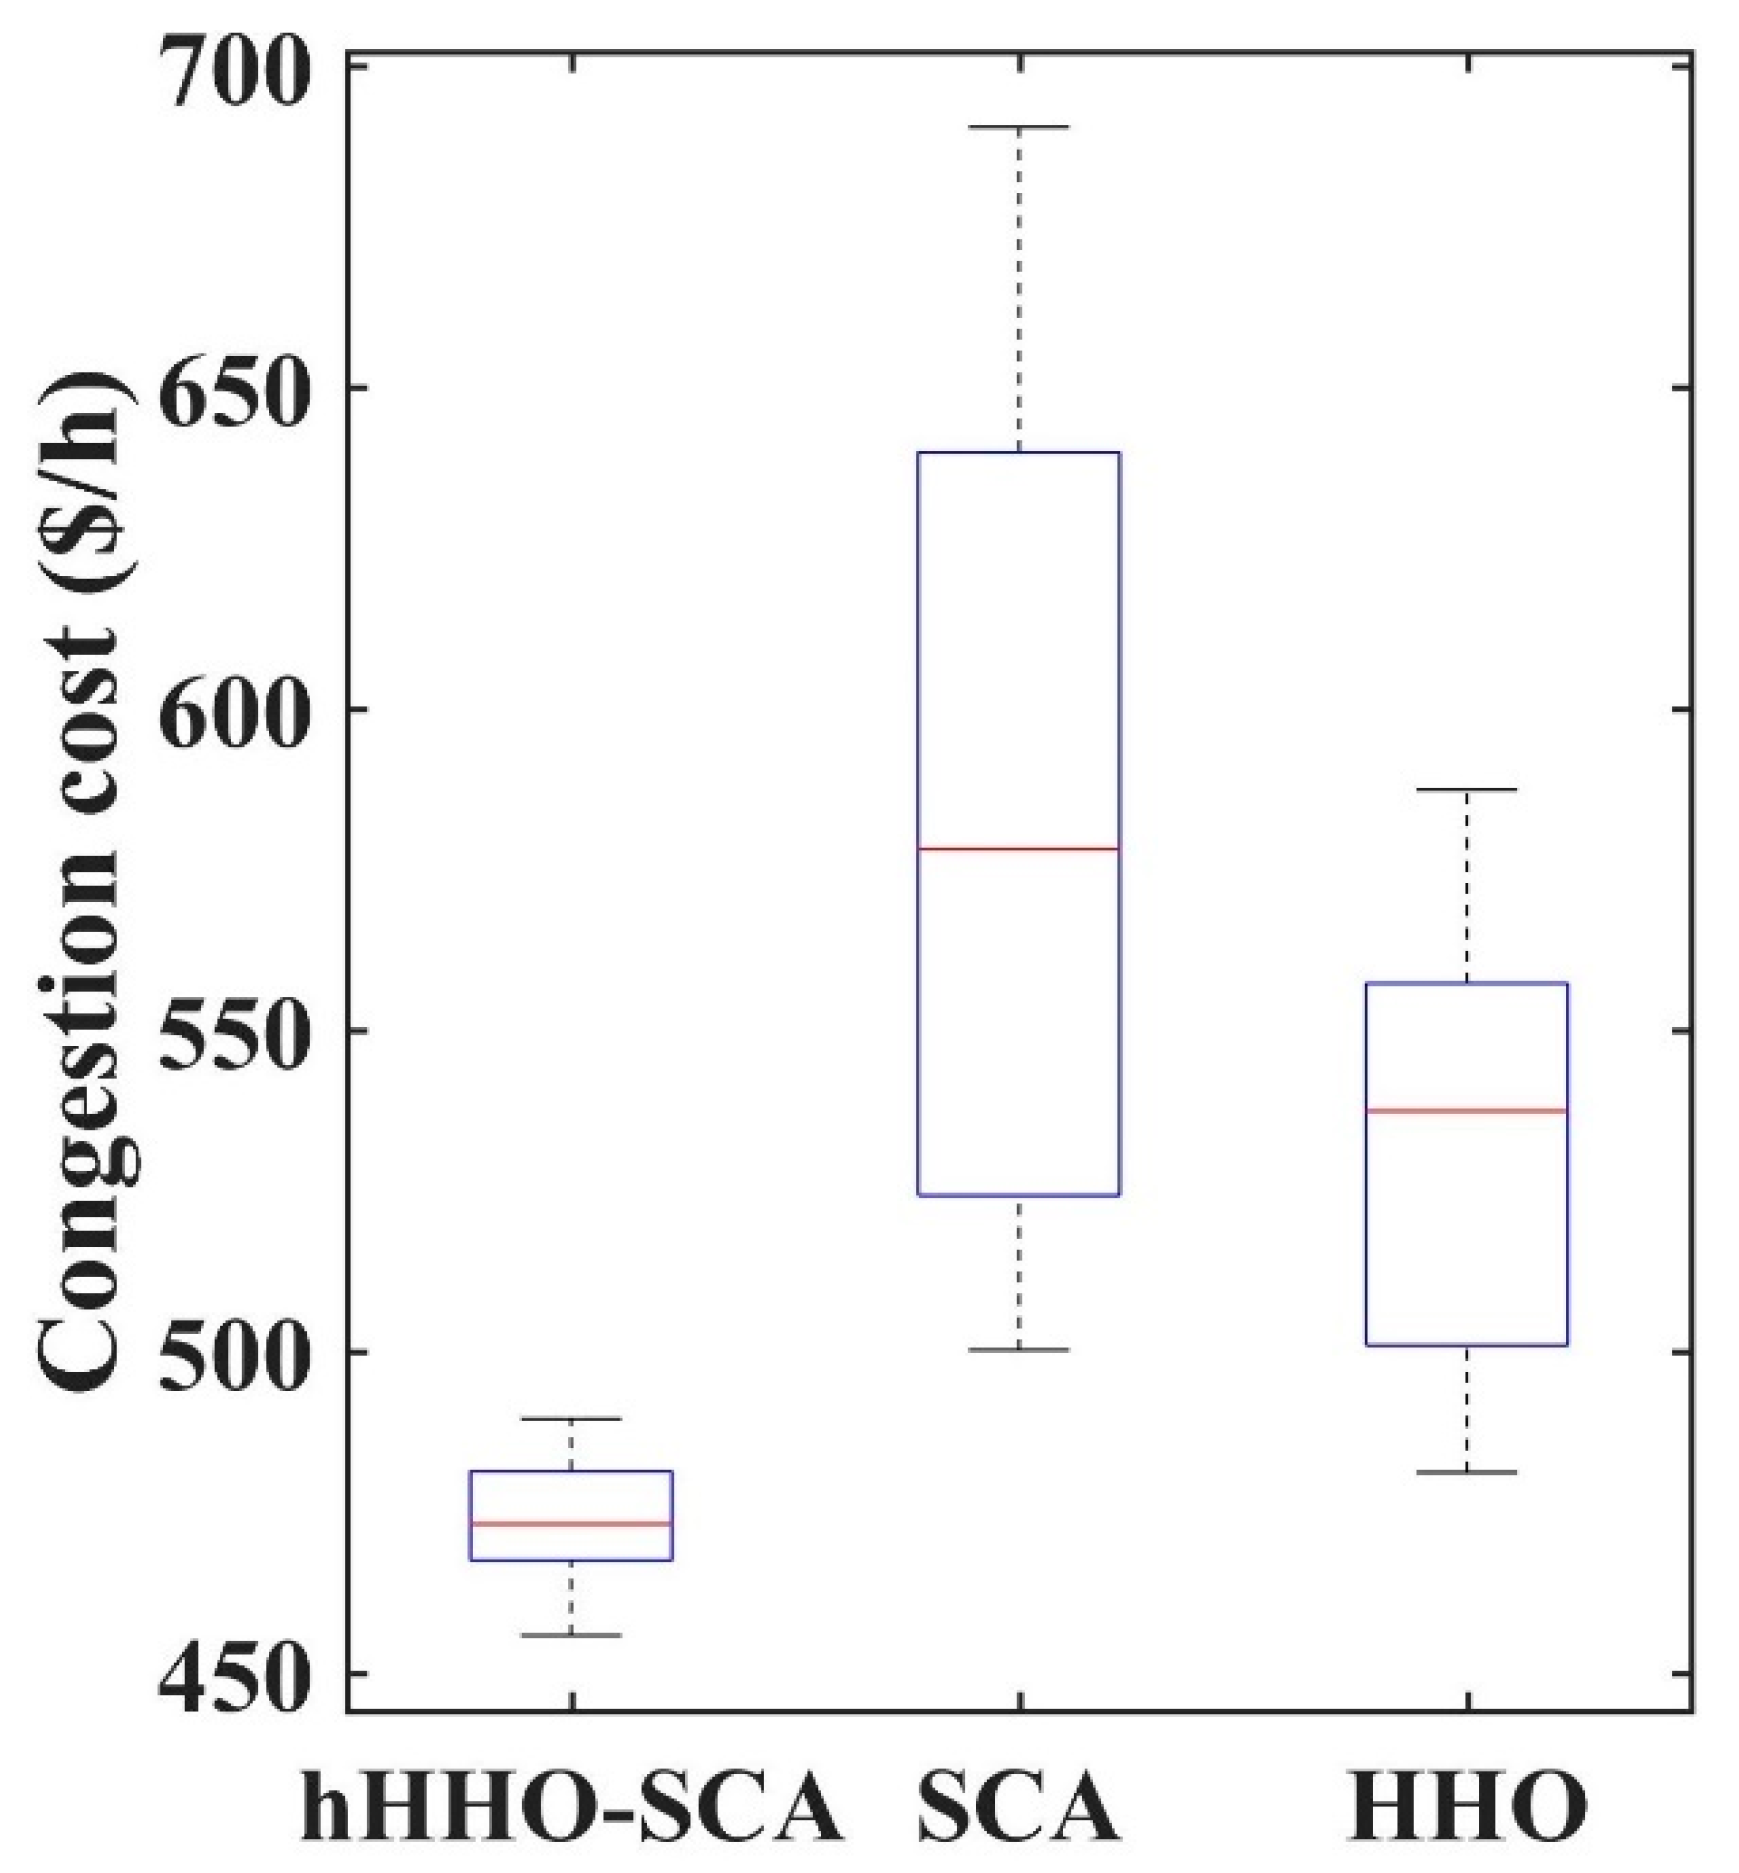
Figure 4 shows a comparison of the congestion costs, while Figure 5 displays the amount of the adjusted real power with applied optimization algorithms for the system generators. The convergence characteristics for SCA, HHO, and hHHO-SCA are illustrated in Figure 6. It can be observed that hHHO-SCA has delivered optimal results with iterations. Figure 7 presents the box plot with generated output values for 30 runs with 300 iterations, which signifies that the performance of hHHO-SCA is comparatively better than the other optimization algorithms.
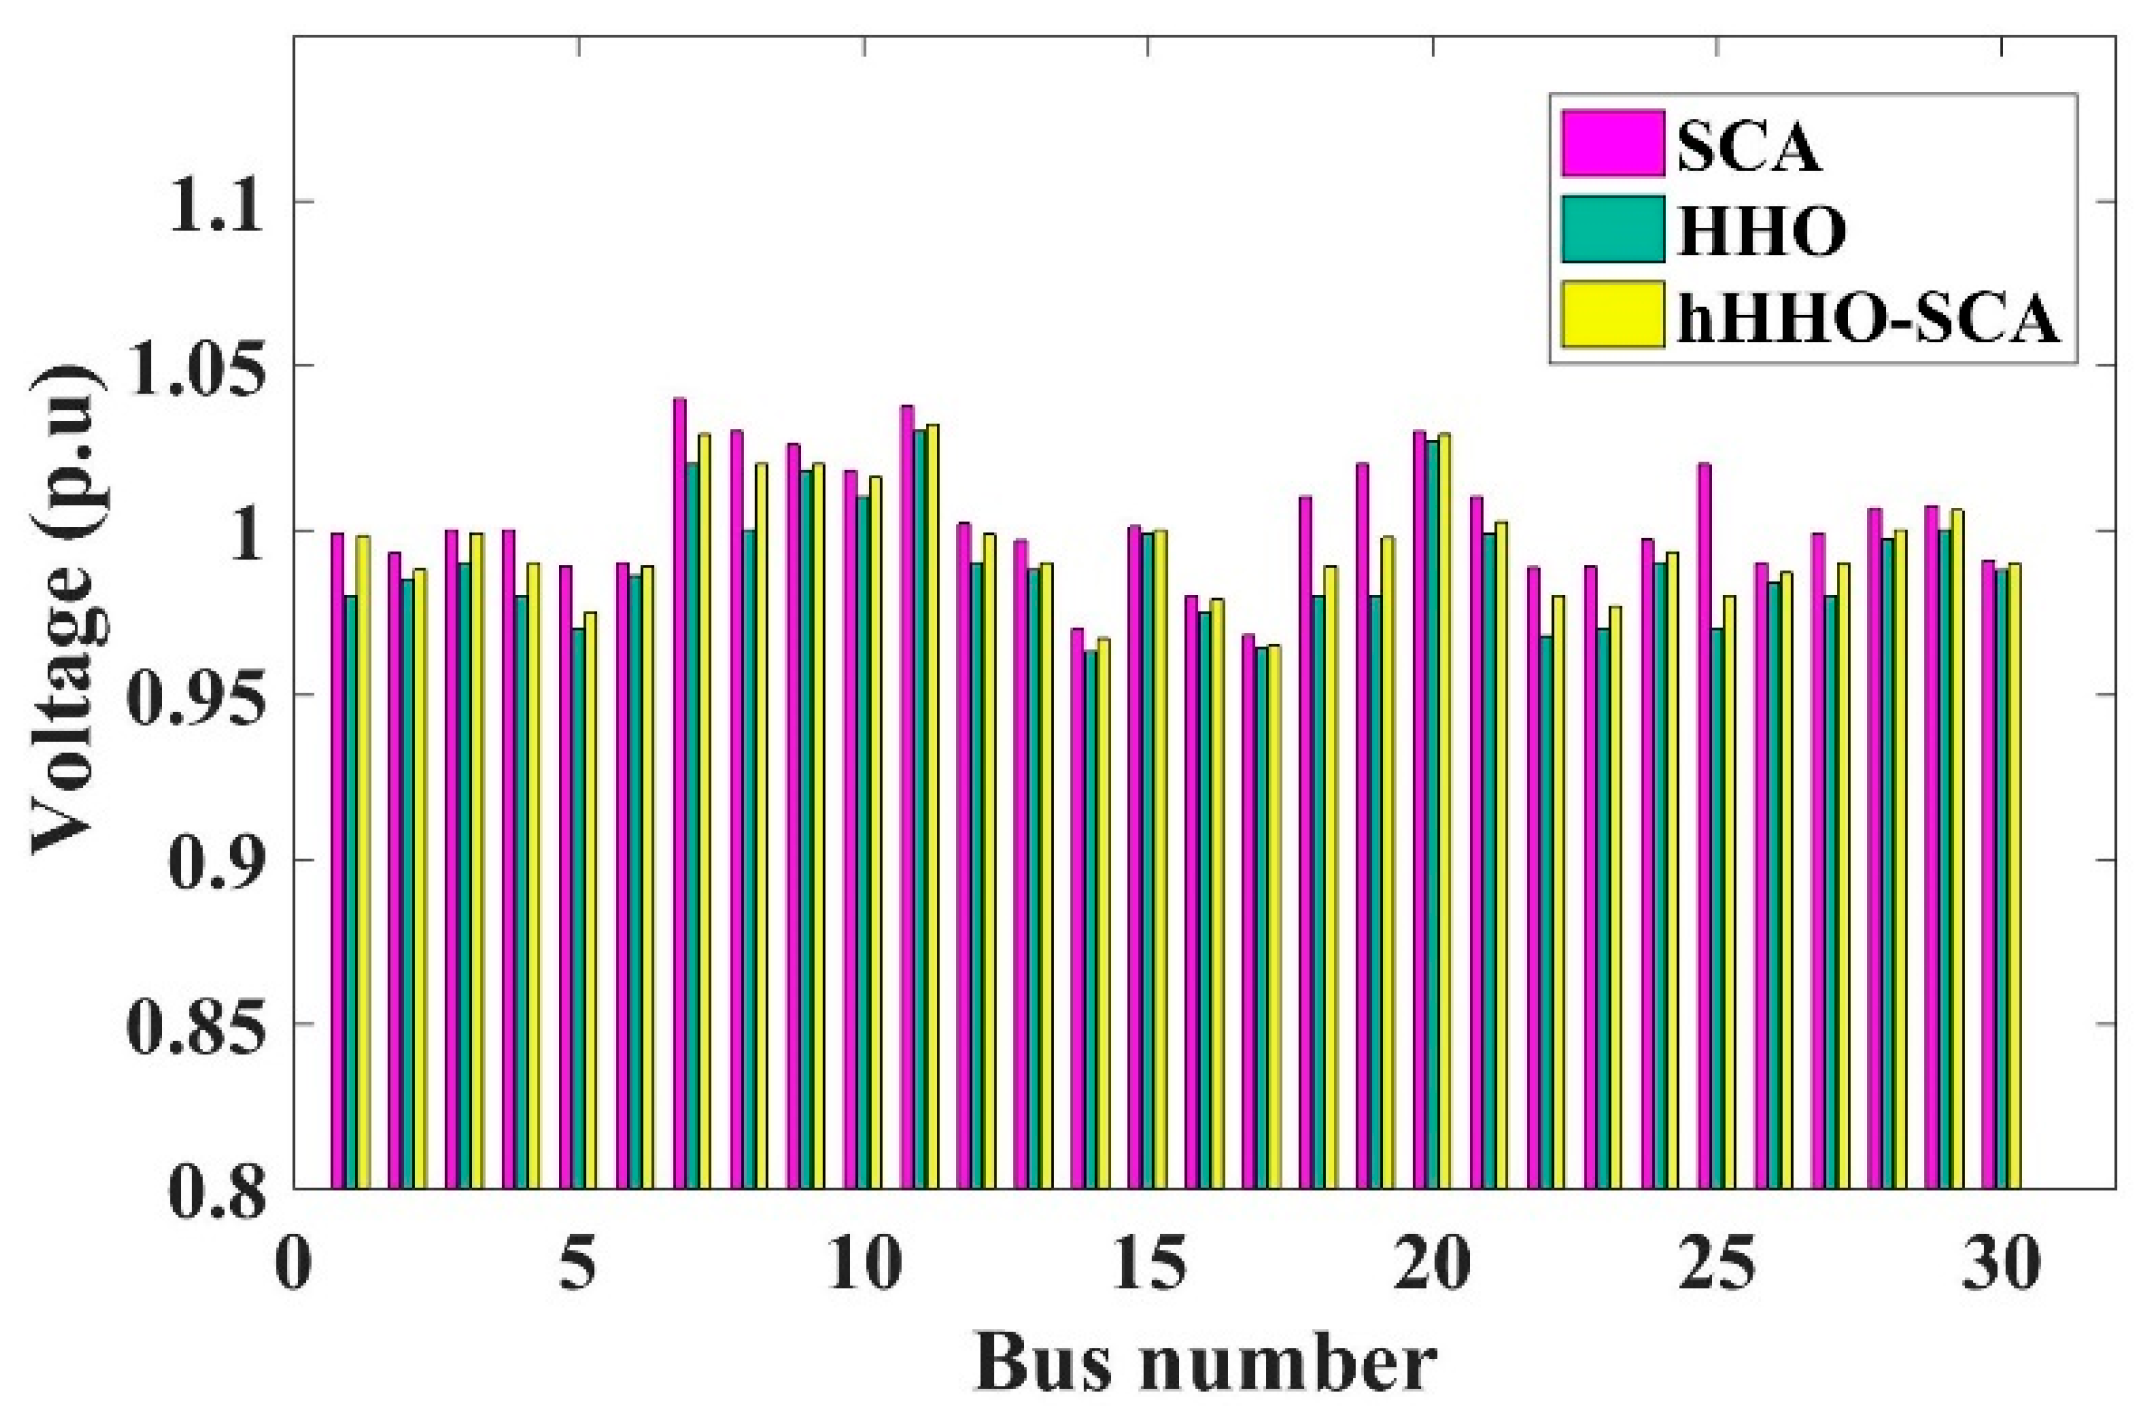
Implementing hHHO-SCA for CM, the overall system loss decreases to 12.86 MW, down from the initial 16.023 MW. Figure 8 illustrates the bus voltages following CM using hHHO-SCA, clearly indicating that all bus voltages stay within the acceptable range.

5.2. IEEE 118-Bus System

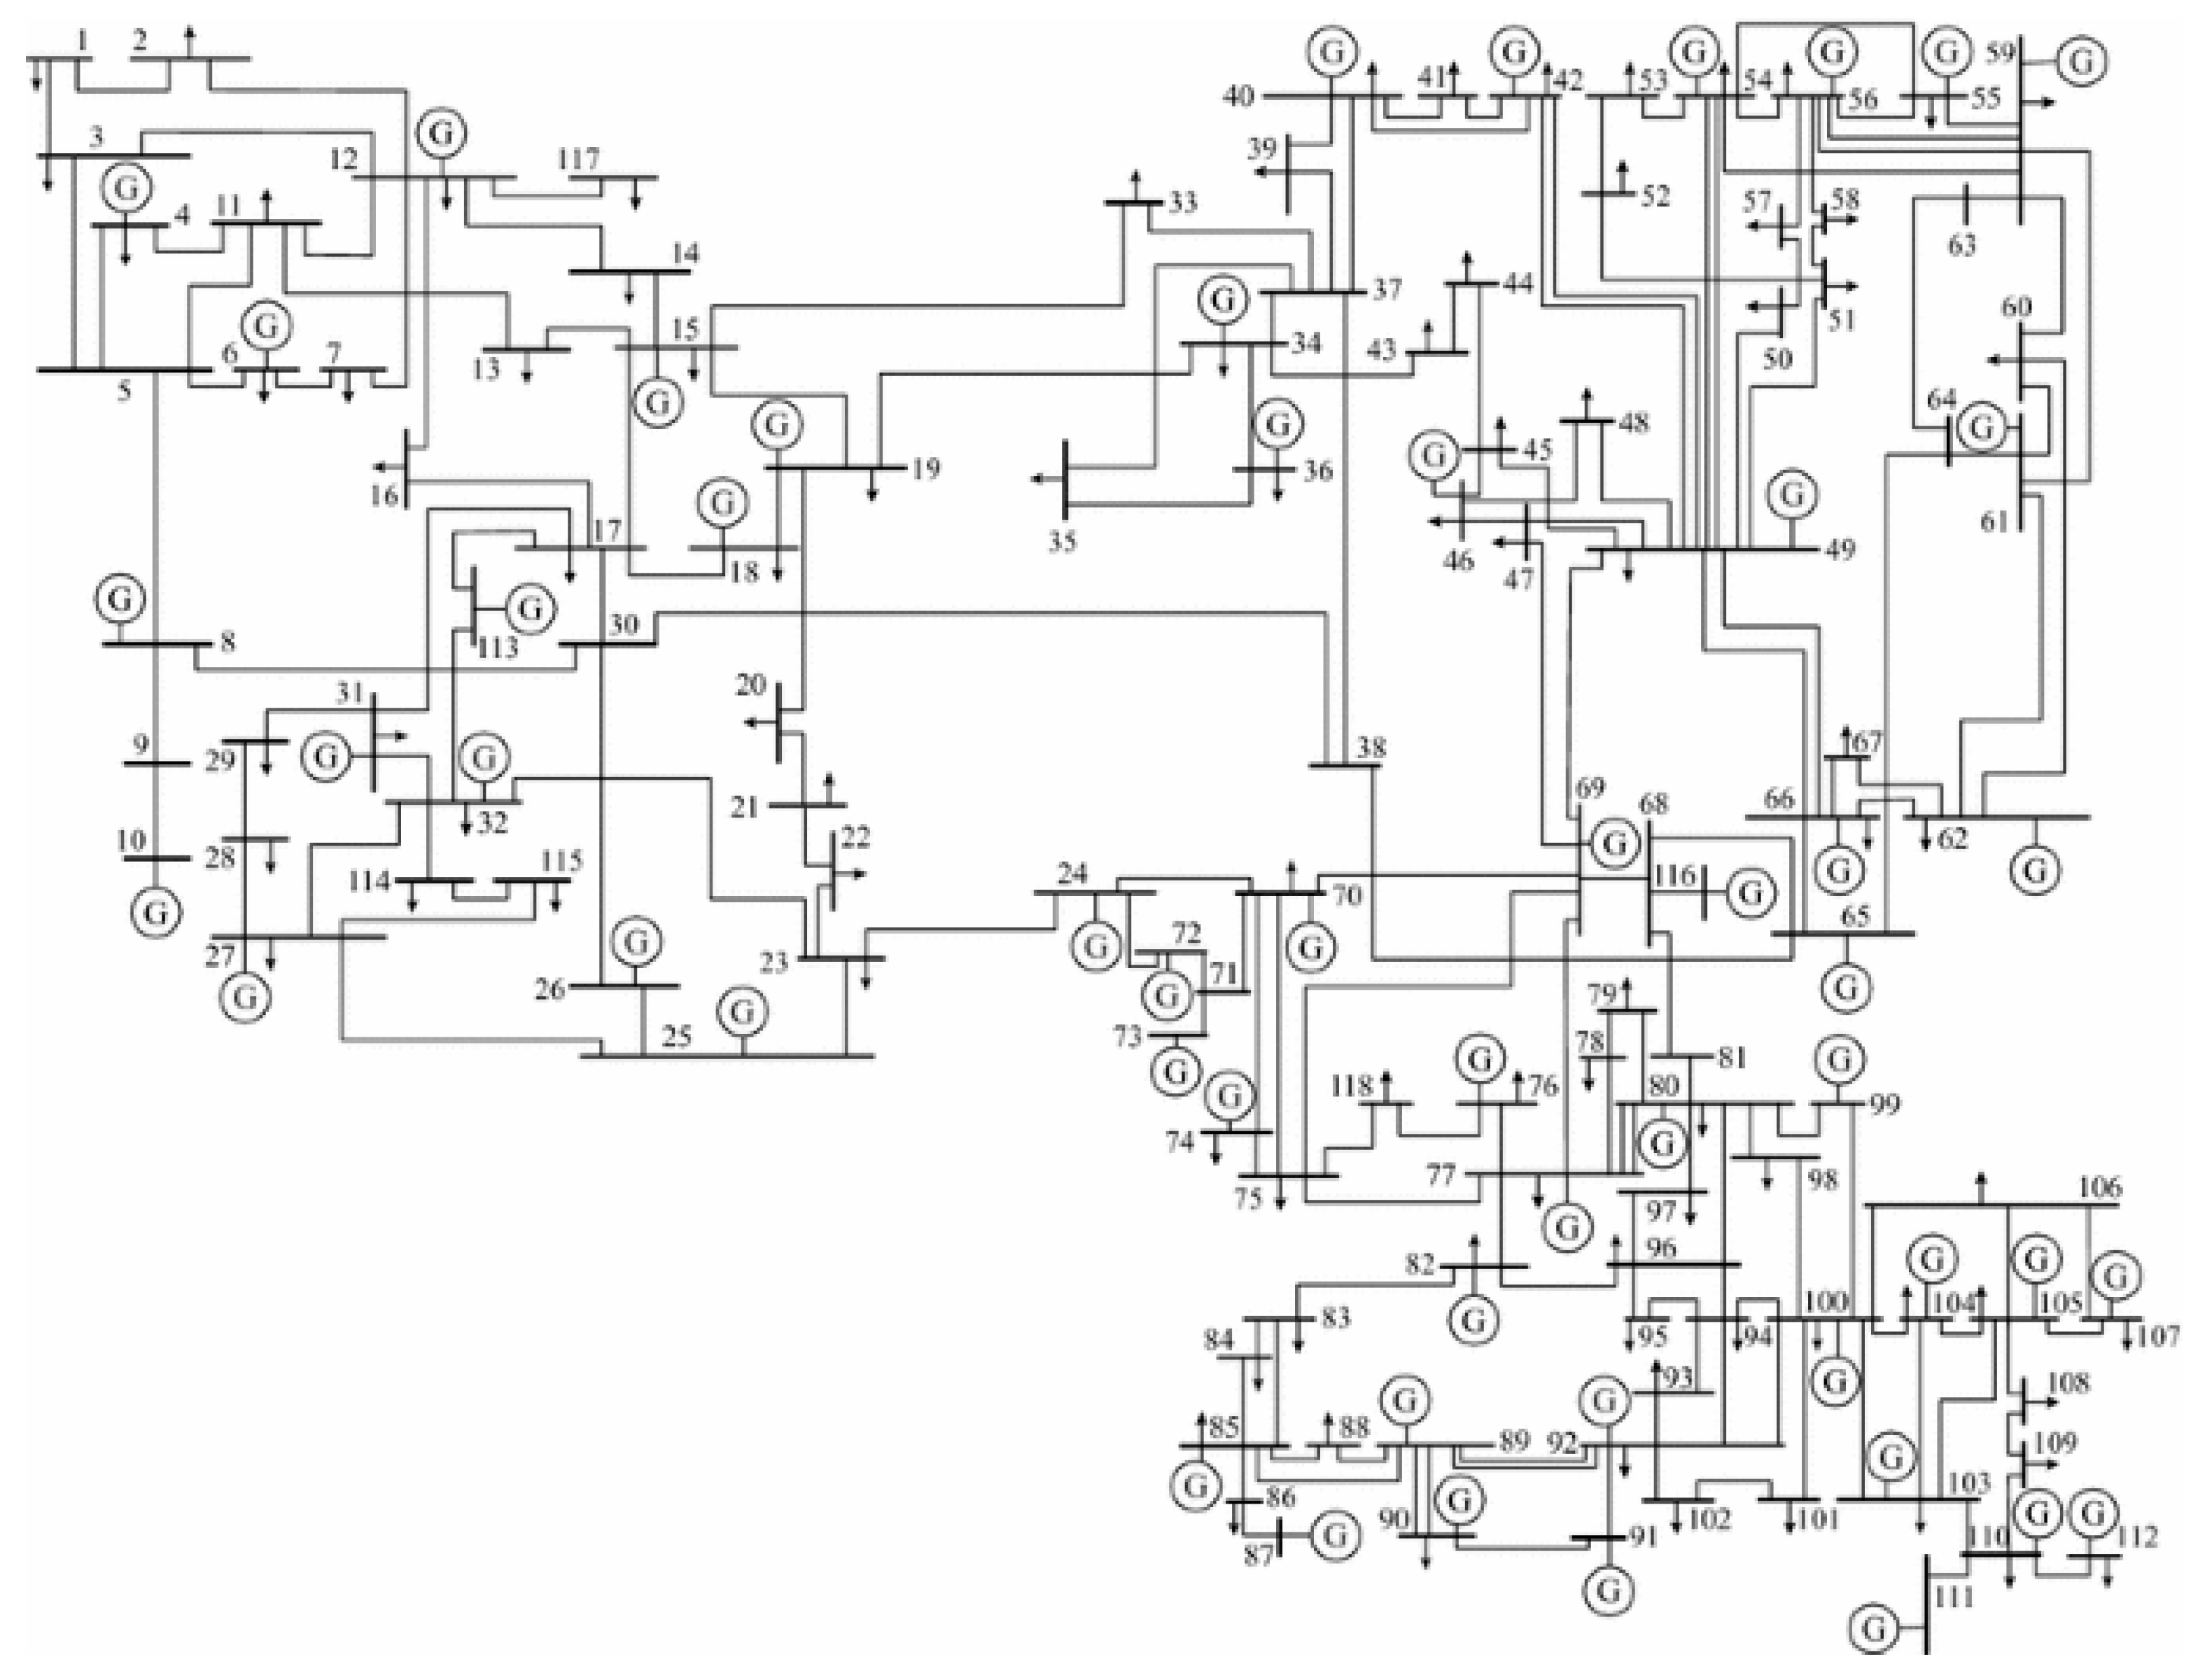
This test framework includes 54 buses that are generator buses and 64 buses that are load buses. The network representation is shown in Figure 9 [40]. The overloading scenario is created by tripping lines 8–5 with 1.57 times increase in the load demand. This has led to the overburdening of the lines L16-L17, L13-L17, and L8-L30. Details of the congested lines are provided in Table 5.
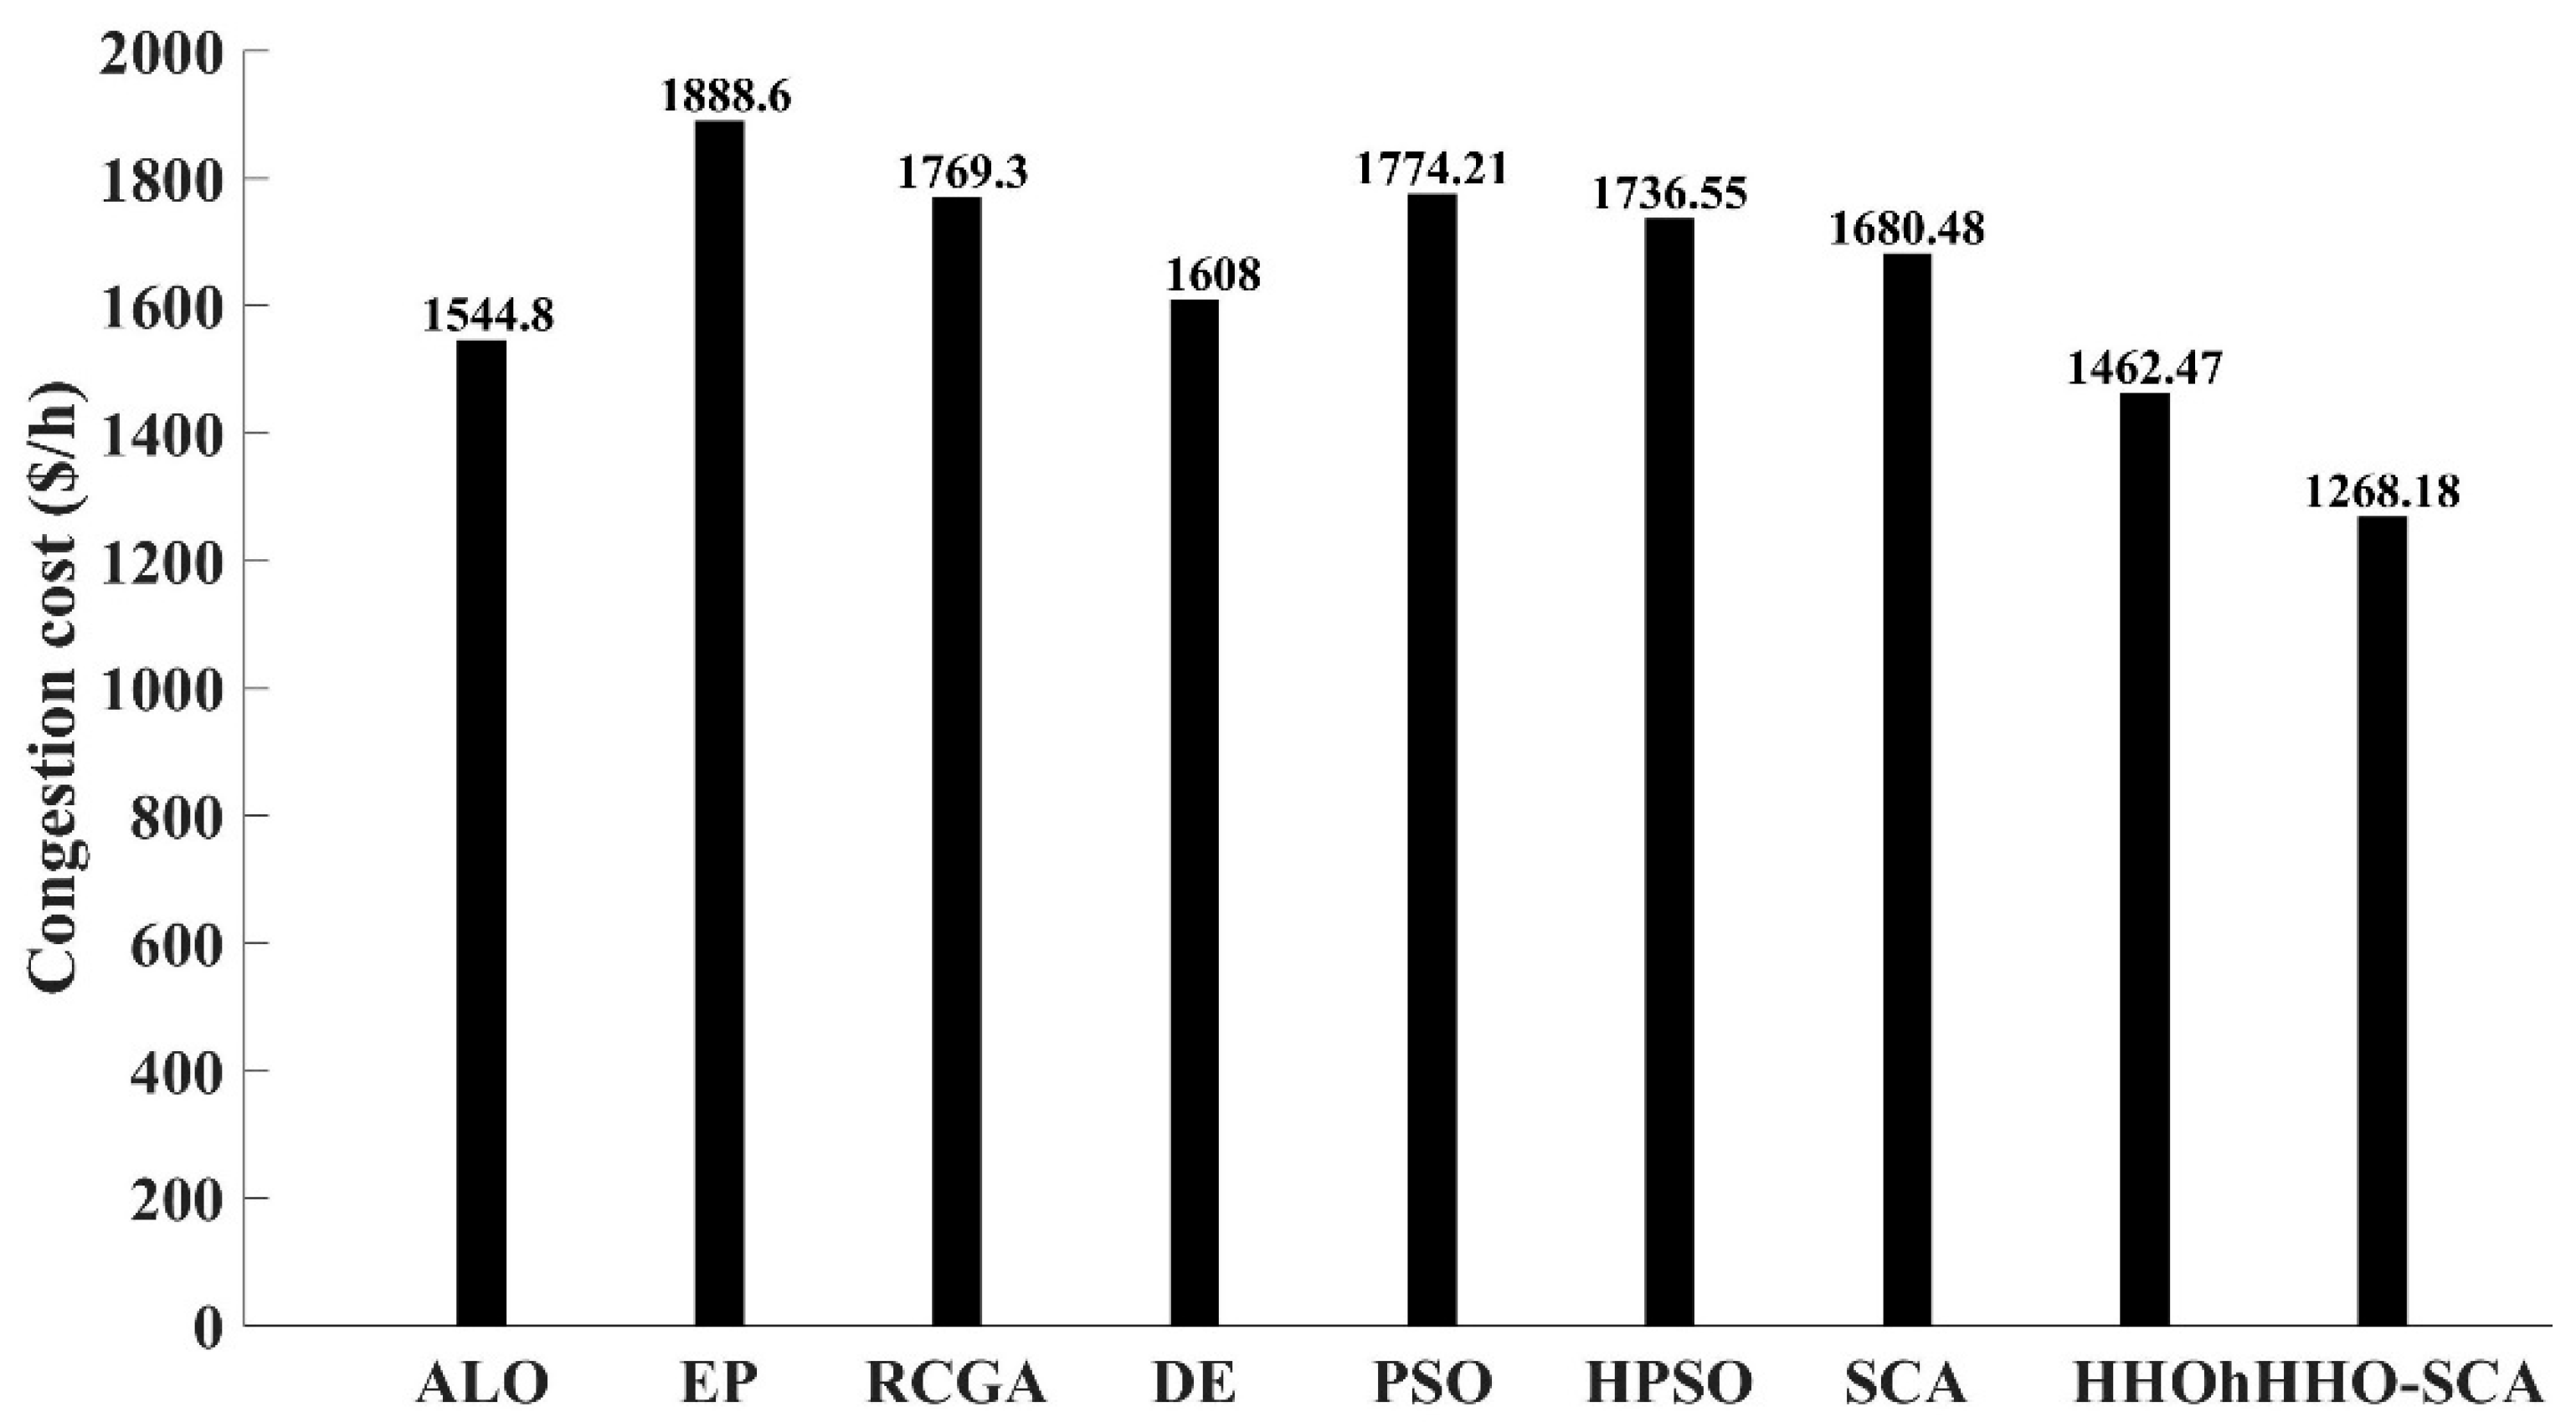
The hHHO-SCA has been used to address the CM problem and find a solution. The solutions obtained with the hHHO-SCA are detailed in Table 6. It is evident that line flows have been eased under their extreme limits using hHHO-SCA and other optimization algorithms. Table 6 also summarizes the congestion costs and adjusted real power achieved with hHHO-SCA and other optimization algorithms. The results indicate that the hHHO-SCA application in the GR approach has effectively mitigated the congested scenarios in the system by delivering a congestion cost of 1268.18 $/h, which is the minimum among the other applied algorithms.
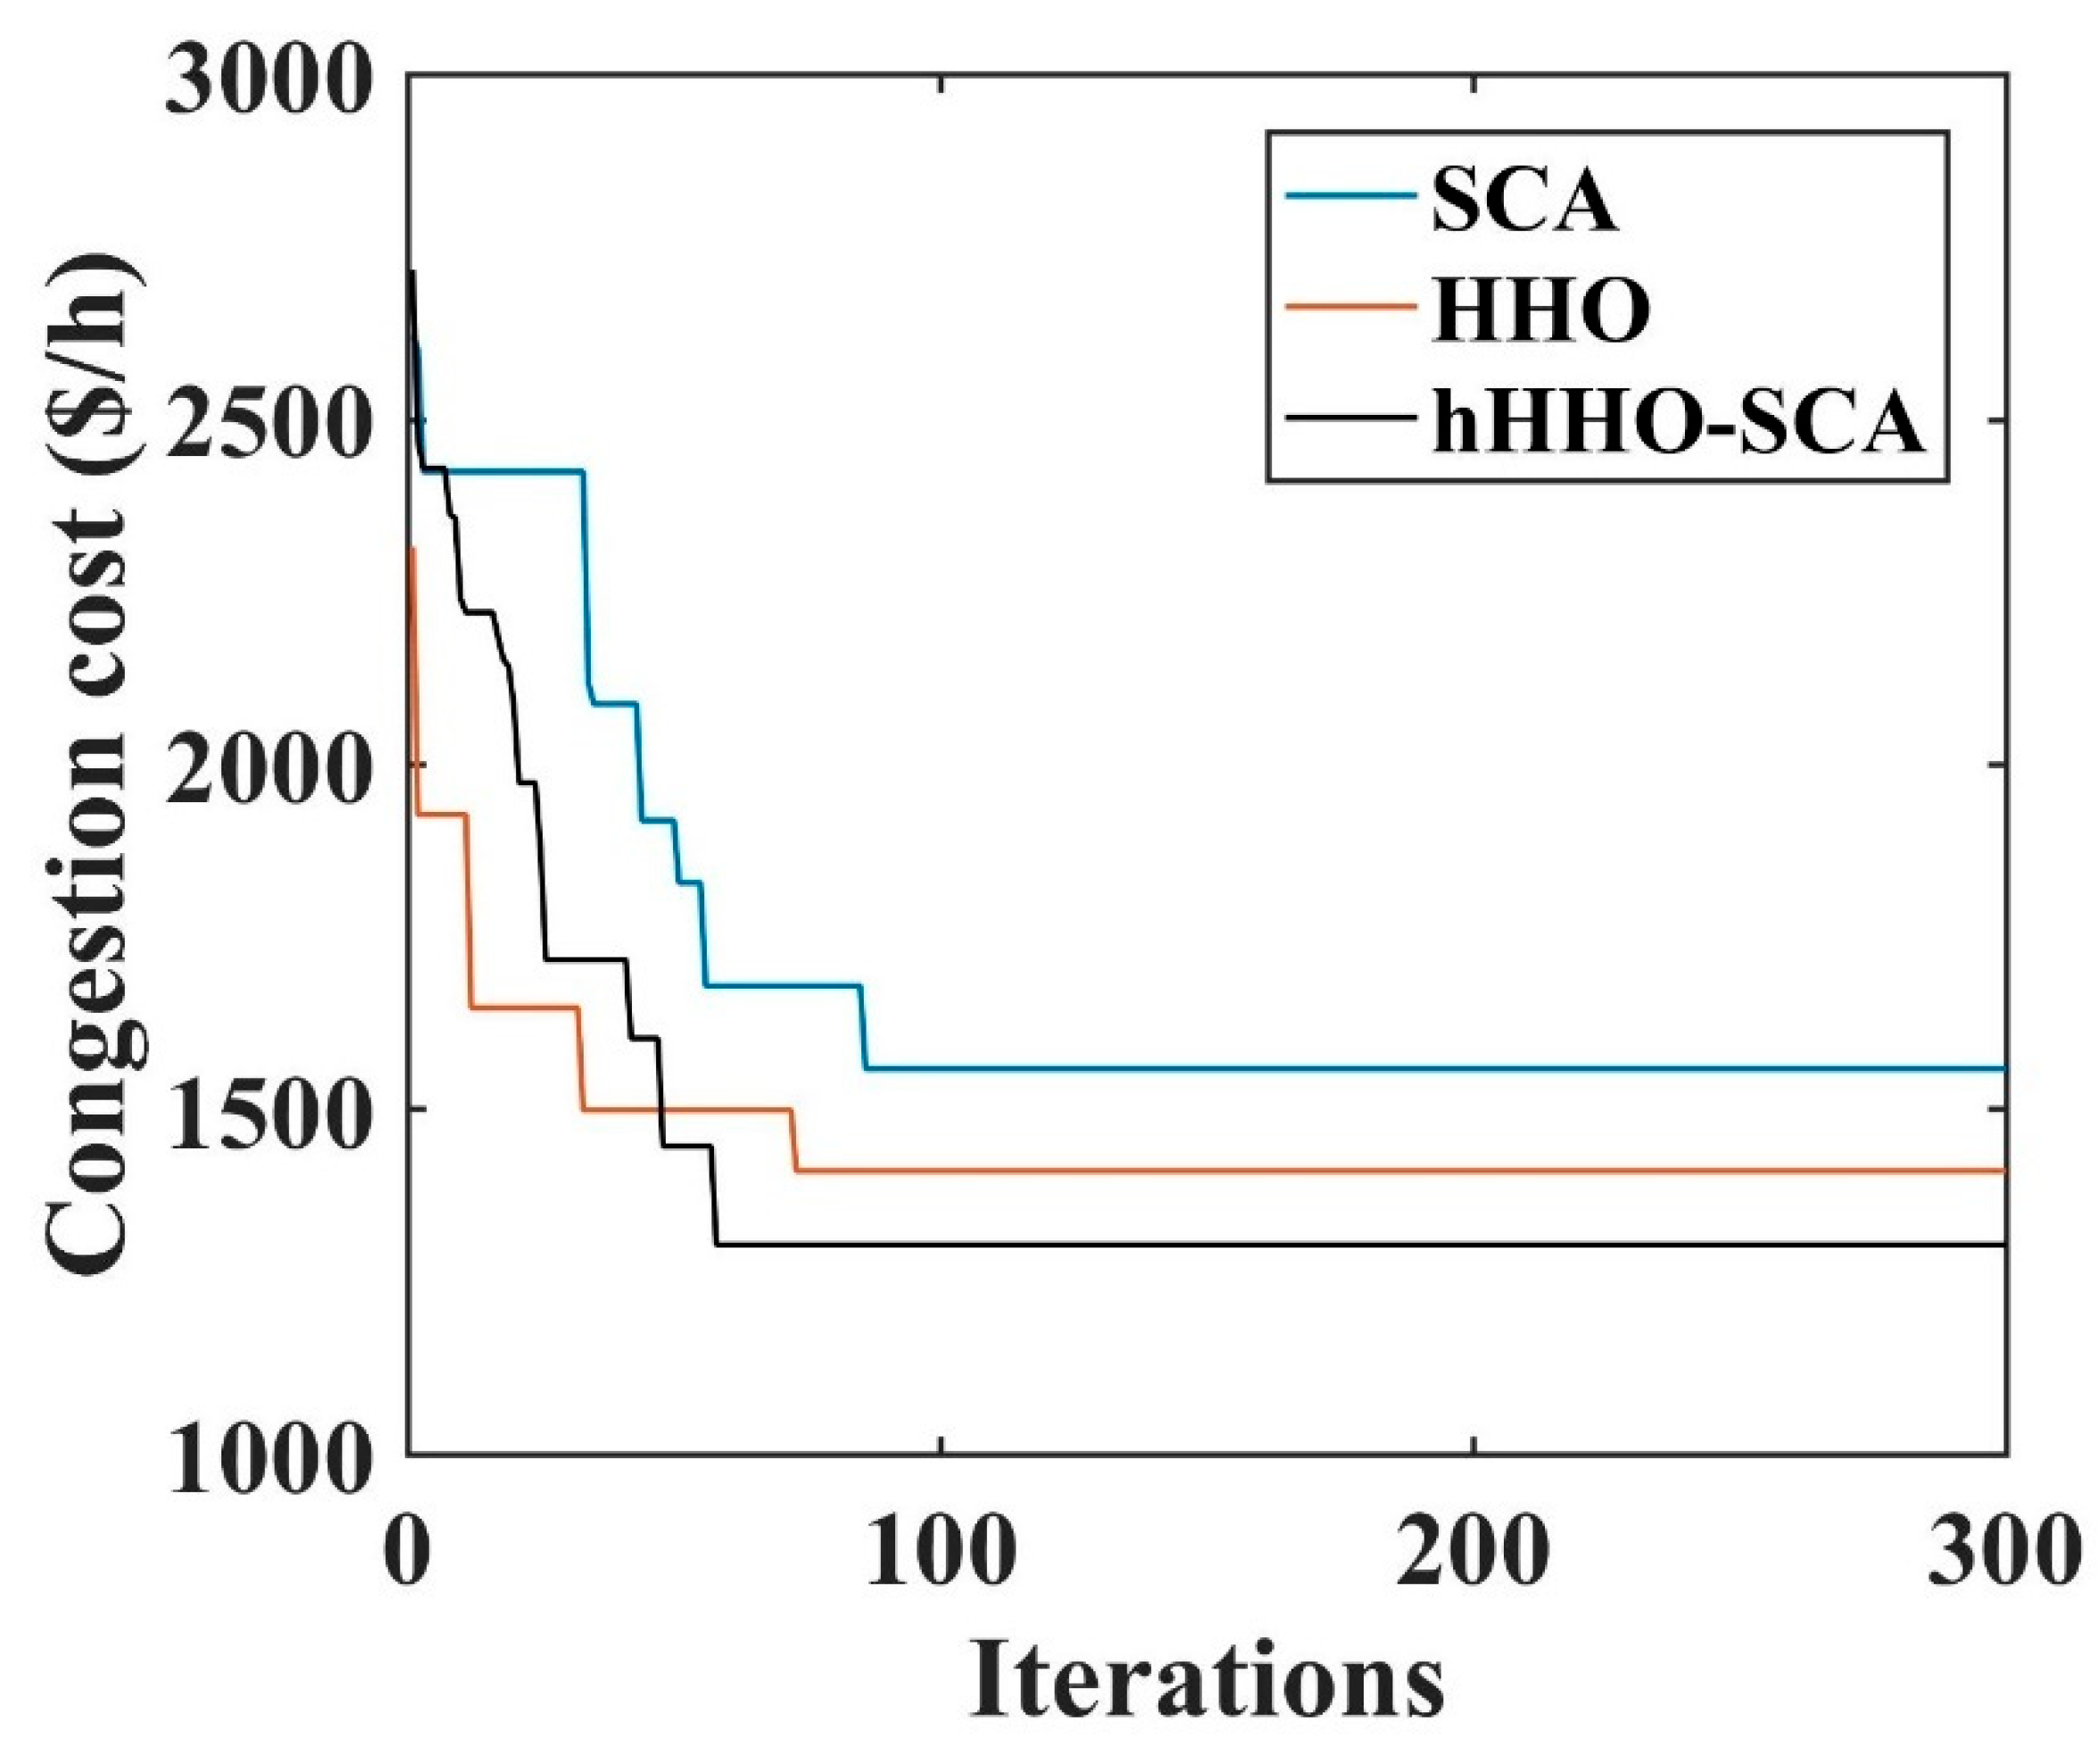
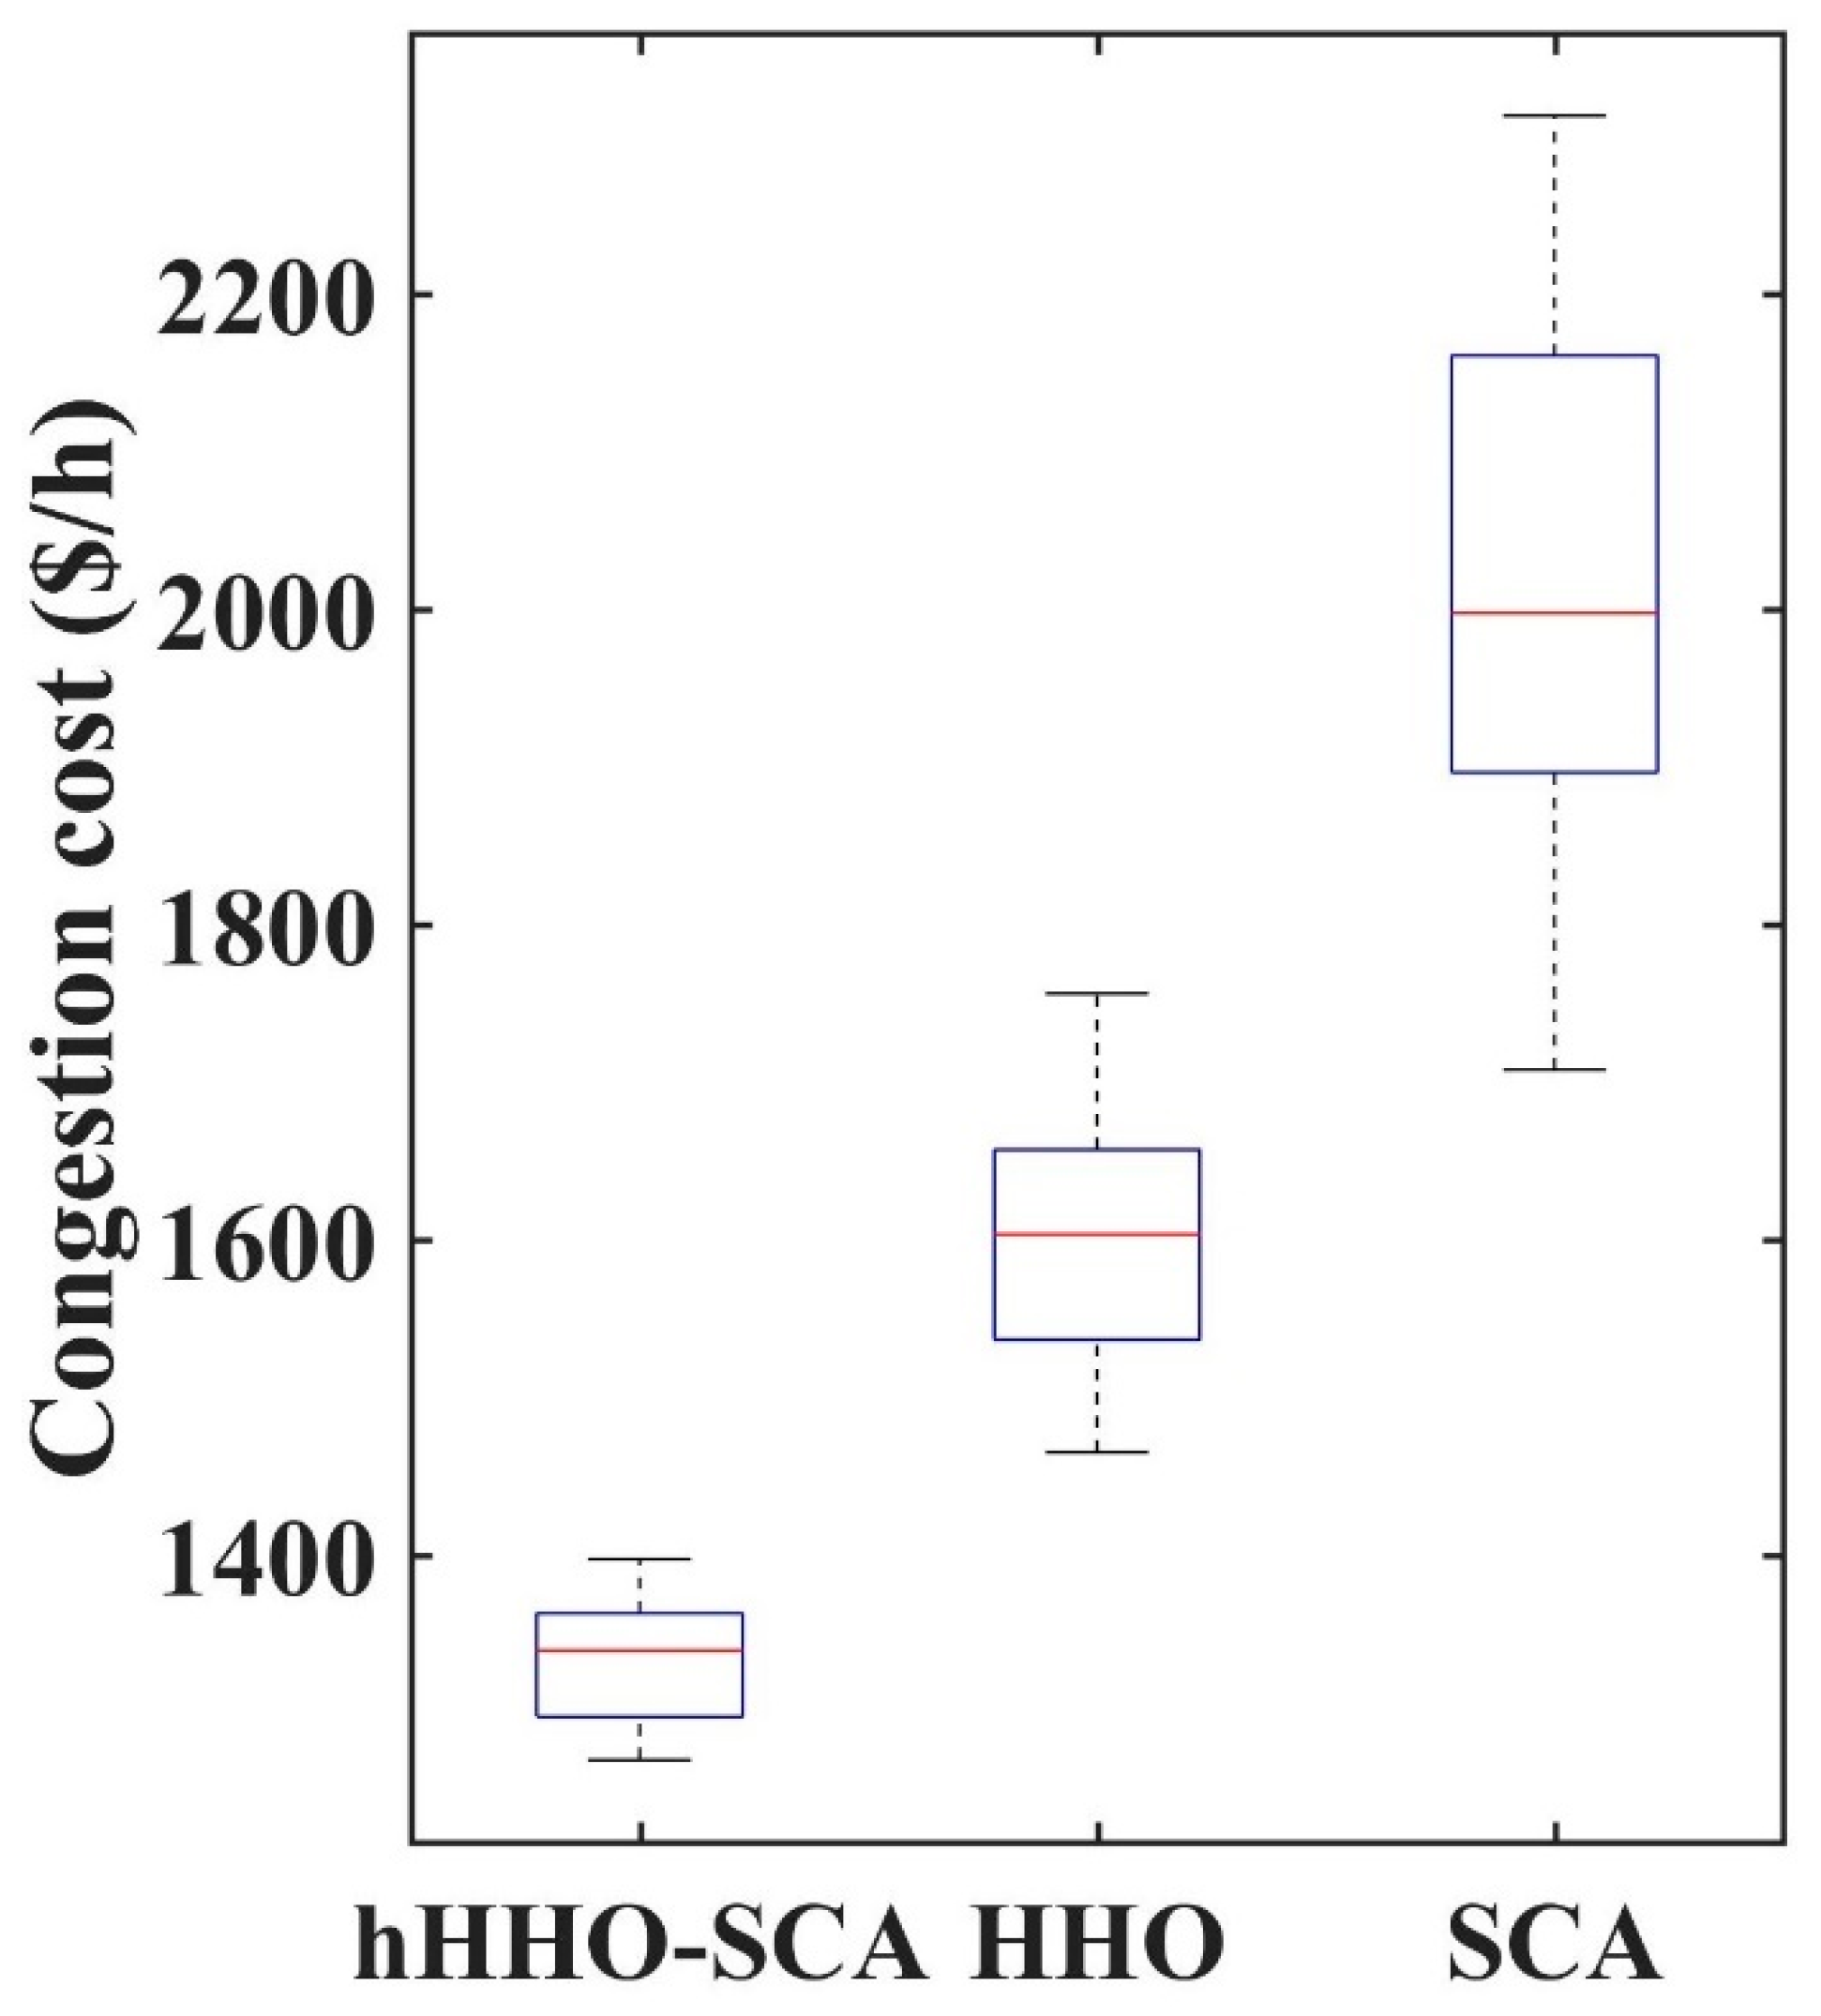
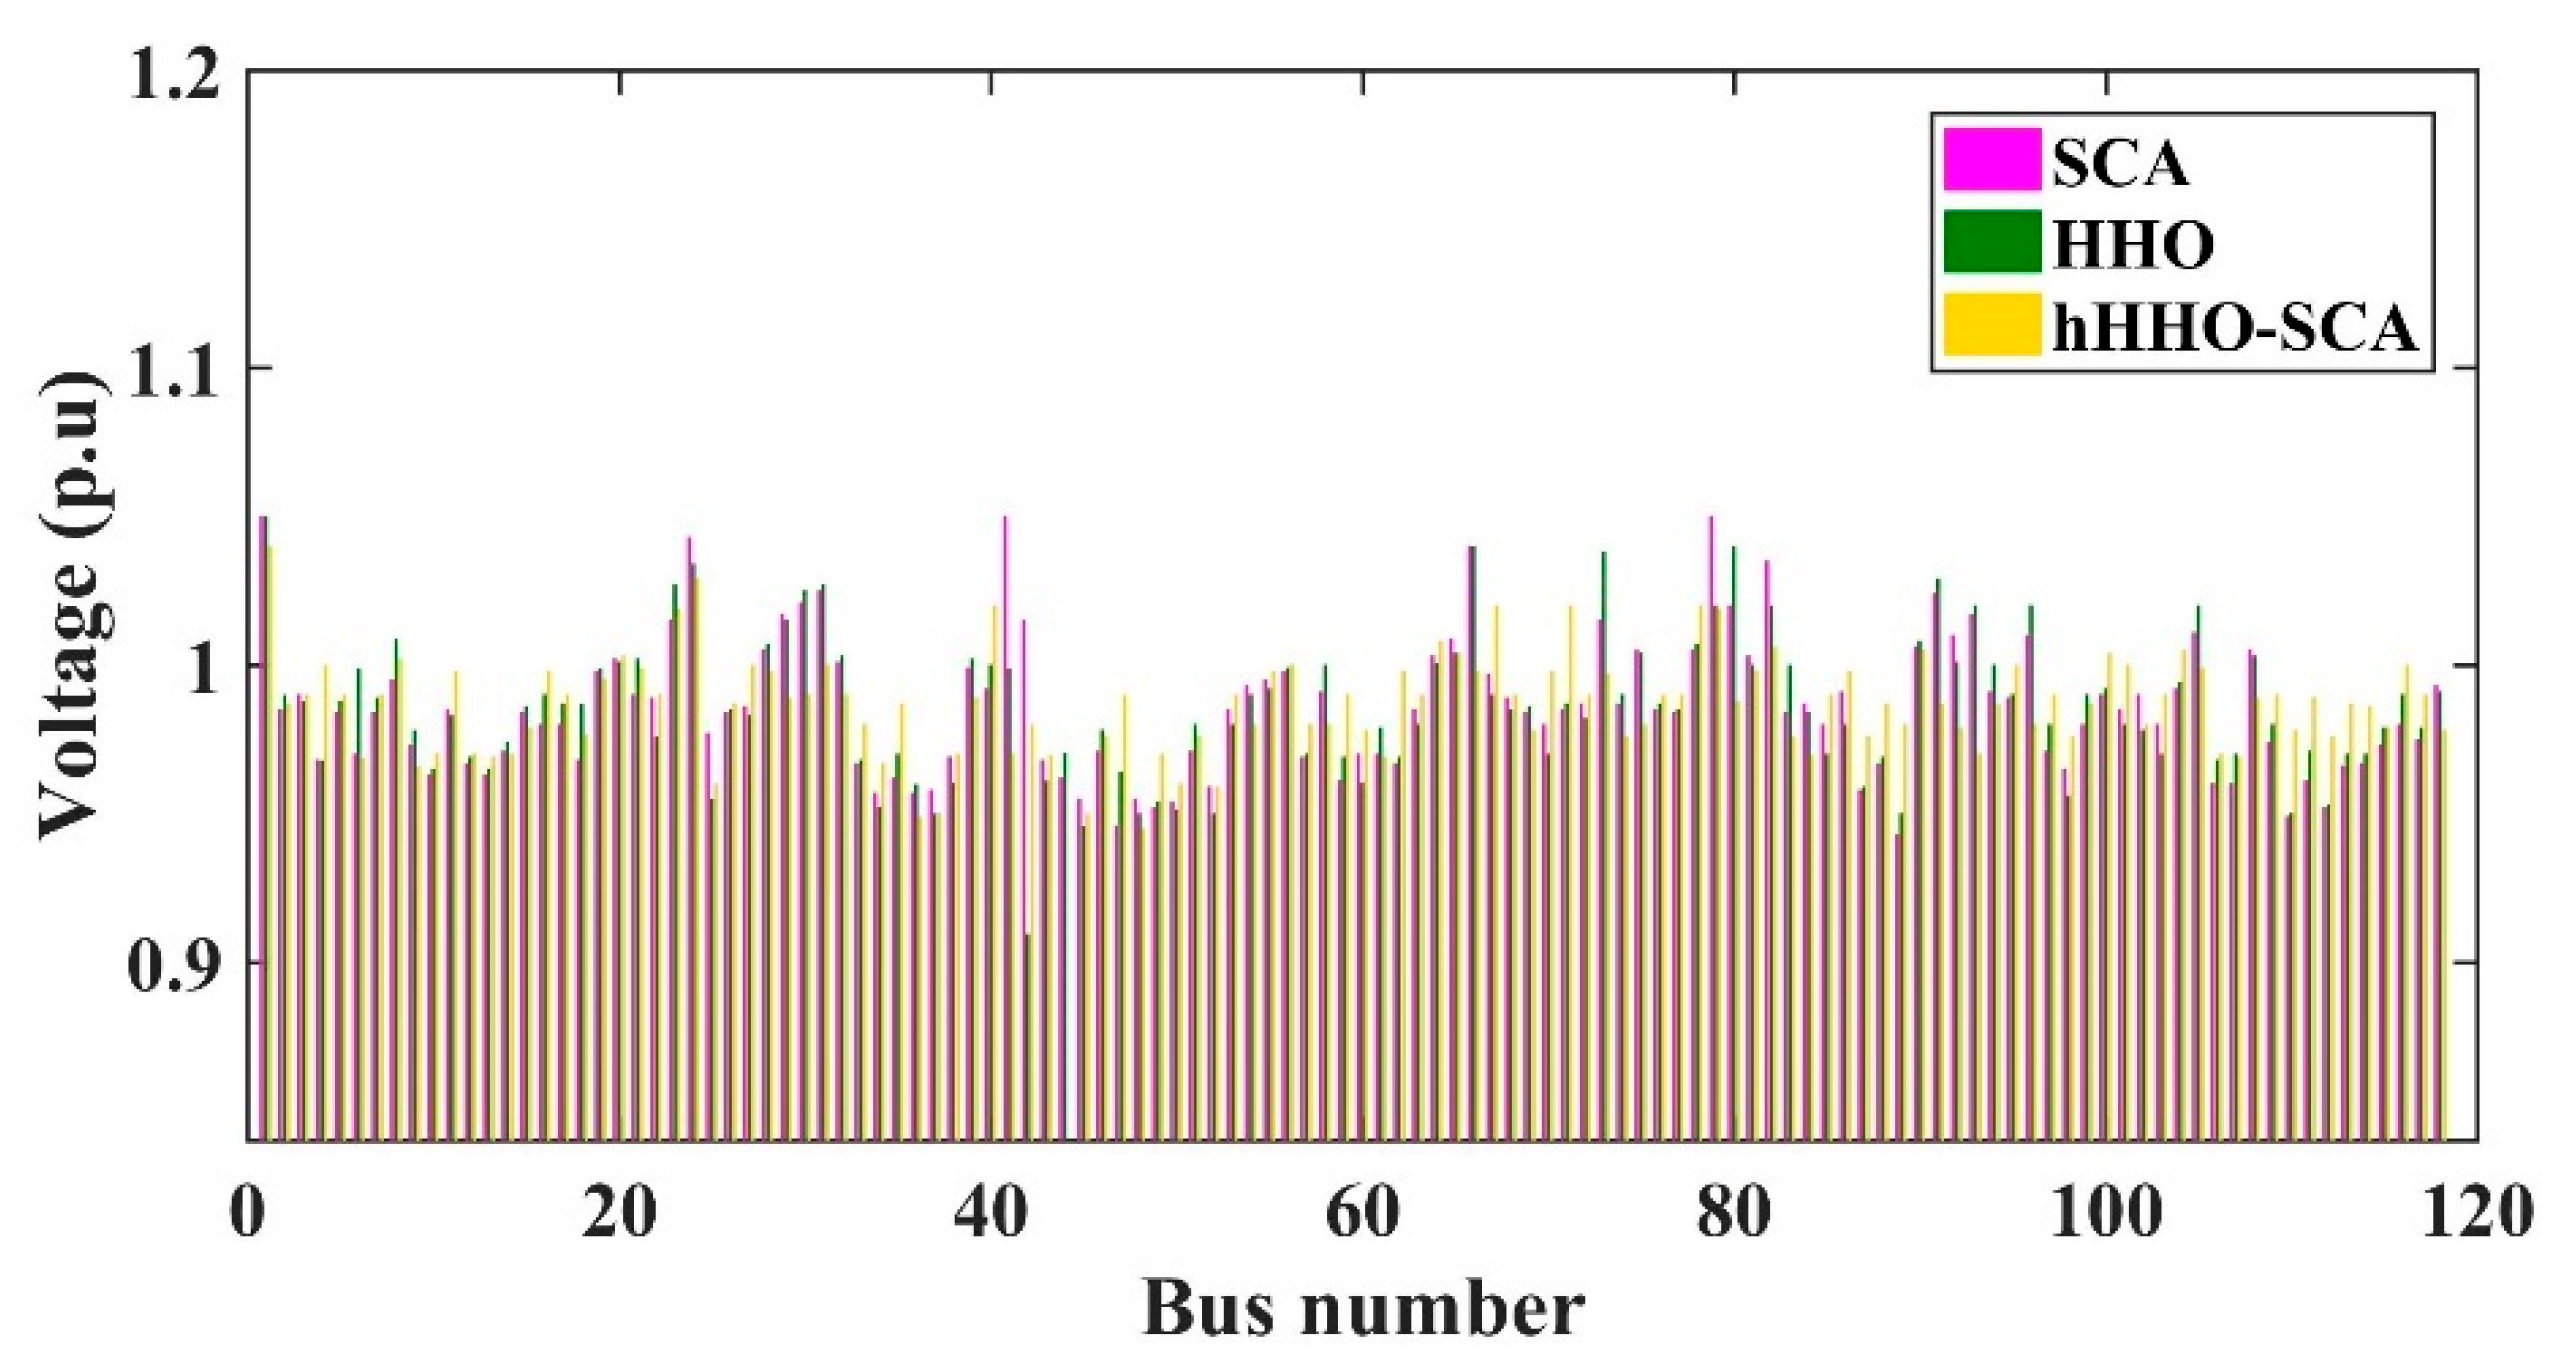
Figure 10 illustrates the congestion cost. The convergence profile for the congestion cost with hHHO-SCA is shown in Figure 11. The system loss was 247.968 MW during congestion, which has been reduced to 171.92 MW post-CM with hHHO-SCA. Additionally, the application of hHHO-SCA on the 118 buses has demonstrated that hHHO-SCA consistently yields appreciable outputs for large systems. Figure 12 presents the box plot with generated output values for 30 runs with 300 iterations, which signifies that the performance of hHH0-SCA is comparatively better than the other optimization. Post-CM bus voltages are depicted in Figure 13, showing that the voltages remain within the specified normal limits.

6. Conclusions

This research presents a CM approach in the power market using the GR method. The GR model has been optimized with the formulation of a hybrid optimization algorithm hHHO-SCA with the aim to reduce the congestion cost. The model’s effectiveness is tested on IEEE 30-bus and IEEE 118-bus systems. This CM method incorporates the hHHO-SCA algorithm and considers contingencies such as line outages and sudden load changes, aiming to alleviate congestion by adjusting power generation schedules while minimizing costs. A comparative performance analysis assesses the reduction in congestion costs, improvements in bus voltage profiles, and system loss reduction, demonstrating that the proposed CM model with hHHO-SCA outperforms contemporary optimization techniques The results, compared with various established algorithms from recent literature, indicate that hHHO-SCA achieves lower congestion costs. Additionally, the CM application reduces overall system loss.
Considering future work, hHHO-SCA could be expanded to optimize several aspects of the power system operations that include load management, power consumption patterns, economic power dispatch, and operation cost/electricity costs. hHHO-SCA can also be implemented in the sectors of renewable energy integration related to the optimal positioning and power deliveries.

Author Contributions

Conceptualization, V.K. and K.P.; methodology, R.N.R. and K.P.; software, M.F.A. and V.S.; formal analysis, P.S. and M.M.M.; investigation, A.A. and U.K.; resources, M.M.M.; data curation, P.S.; writing—original draft preparation, K.P. and M.M.M.; writing—review and editing, K.P.; visualization, U.K.; supervision, K.P. All authors have read and agreed to the published version of the manuscript.

Funding

This work was supported by the Researchers Supporting Project number (RSP2024R258), King Saud University, Riyadh, Saudi Arabia.

Institutional Review Board Statement

Not applicable.

Informed Consent Statement

Not applicable.

Data Availability Statement

Data are available on request from the authors.

Acknowledgments

The authors are grateful for the support by the Researchers Supporting Project (number RSP2024R258), King Saud University, Riyadh, Saudi Arabia.

Conflicts of Interest

The authors declare no conflicts of interest.

References

  1. Bouhouras, A.S.; Kelepouris, N.S.; Koltsaklis, N.; Oureilidis, K.; Christoforidis, G.C. Congestion Management in coupled TSO and DSO networks. Electr. Power Syst. Res. 2024, 229, 110145. [Google Scholar] [CrossRef]
  2. Alavijeh, N.M.; Steen, D.; Le, A.T.; Nyström, S. Capacity limitation based local flexibility market for congestion management in distribution networks: Design and challenges. Int. J. Electr. Power Energy Syst. 2024, 156, 109742. [Google Scholar] [CrossRef]
  3. Zhou, H.; Lu, L.; Wei, M.; Shen, L.; Liu, Y. Robust Scheduling of a Hybrid Hydro/photovoltaic/Pumped-Storage System for Multiple Grids Peak-Shaving and Congestion Management. IEEE Access 2023, 12, 22230–22242. [Google Scholar] [CrossRef]
  4. Dehnavi, E.; Akmal, A.A.S.; Moeini-Aghtaie, M. Developing a novel zonal congestion management based on demand response programs considering dynamic transmission ratings. Int. J. Electr. Power Energy Syst. 2023, 146, 108779. [Google Scholar] [CrossRef]
  5. Majeed Rashid Zaidan, S.I.T. Emergency congestion management of power systems by static synchronous series compensator. Indones. J. Electr. Eng. Comput. Sci. 2022, 25, 1258–1265. [Google Scholar] [CrossRef]
  6. Wang, X.; Zhao, T.; Parisio, A. Frequency regulation and congestion management by Virtual Storage Plants. Sustain. Energy Grids Netw. 2022, 29, 100586. [Google Scholar] [CrossRef]
  7. Hobbie, H.; Mehlem, J.; Wolff, C.; Weber, L.; Flachsbarth, F.; Möst, D.; Moser, A. Impact of model parametrization and formulation on the explorative power of electricity network congestion management models-Insights from a grid model comparison experiment. Renew. Sustain. Energy Rev. 2022, 159, 112163. [Google Scholar] [CrossRef]
  8. Zakaryaseraji, M.; Ghasemi-Marzbali, A. Evaluating congestion management of power system considering the demand response program and distributed generation. Int. Trans. Electr. Energy Syst. 2022, 2022, 5818757. [Google Scholar] [CrossRef]
  9. Shaikh, M.S.; Raj, S.; Babu, R.; Kumar, S.; Sagrolikar, K. A hybrid moth–flame algorithm with particle swarm optimization with application in power transmission and distribution. Decis. Anal. J. 2023, 6, 100182. [Google Scholar] [CrossRef]
  10. Roustaei, M.; Letafat, A.; Sheikh, M.; Sadoughi, R.; Ardeshiri, M. A cost-effective voltage security constrained congestion management approach for transmission system operation improvement. Electr. Power Syst. Res. 2022, 203, 107674. [Google Scholar] [CrossRef]
  11. Mishra, S.; Samal, S.K. Impact of electrical power congestion and diverse transmission congestion issues in the electricity sector. Energy Syst. 2023, 15, 767–779. [Google Scholar] [CrossRef]
  12. Paul, K. Modified grey wolf optimization approach for power system transmission line congestion management based on the influence of solar photovoltaic system. Int. J. Energy Environ. Eng. 2022, 13, 751–767. [Google Scholar] [CrossRef]
  13. Sarwar, M.; Siddiqui, A.S.; Ghoneim, S.S.; Mahmoud, K.; Darwish, M.M. Effective transmission congestion management via optimal DG capacity using hybrid swarm optimization for contemporary power system operations. IEEE Access 2022, 10, 71091–71106. [Google Scholar] [CrossRef]
  14. Subramaniyan, V.; Gomathi, V. A Soft Computing-Based Analysis of Congestion Management in Transmission Systems. Teh. Vjesn. 2023, 30, 274–281. [Google Scholar] [CrossRef]
  15. Agrawal, A.; Pandey, S.N.; Srivastava, L.; Walde, P.; Singh, S.; Khan, B.; Saket, R. Hybrid Deep Neural Network-Based Generation Rescheduling for Congestion Mitigation in Spot Power Market. IEEE Access 2022, 10, 29267–29276. [Google Scholar] [CrossRef]
  16. Chakravarthi, K.; Bhui, P.; Sharma, N.K.; Pal, B.C. Real Time Congestion Management Using Generation Re-dispatch: Modeling and Controller Design. IEEE Trans. Power Syst. 2022, 38, 2189–2203. [Google Scholar] [CrossRef]
  17. Srivastava, J.; Yadav, N.K. Rescheduling-based congestion management by metaheuristic algorithm: Hybridizing lion and moth search models. Int. J. Numer. Model. Electron. Netw. Devices Fields 2021, 35, e2952. [Google Scholar] [CrossRef]
  18. Ogunwole, E.I.; Krishnamurthy, S. Transmission Congestion Management Using Generator Sensitivity Factors for Active and Reactive Power Rescheduling Using Particle Swarm Optimization Algorithm. IEEE Access 2022, 10, 122882–122900. [Google Scholar] [CrossRef]
  19. Prajapati, V.K.; Mahajan, V. Demand response based congestion management of power system with uncertain renewable resources. Int. J. Ambient Energy 2022, 43, 103–116. [Google Scholar] [CrossRef]
  20. Thiruvel, A.; Thiruppathi, S.; Chidambararaj, N.; Aravindhan, K. In Modern Power System Operations in Effective Transmission Congestion Management via Optimal DG Capacity Using Firefly Algorithms. In Proceedings of the 2023 9th International Conference on Electrical Energy Systems (ICEES), Chennai, India, 23–25 March 2023; IEEE: Piscataway, NJ, USA, 2023; pp. 360–365. [Google Scholar] [CrossRef]
  21. Kamaraj, N. Transmission congestion management using particle swarm optimization. J. Electr. Syst. 2011, 7, 54–70. [Google Scholar] [CrossRef]
  22. Saravanan, C.; Anbalagan, P. An intelligent hybrid technique for optimal generator rescheduling for congestion management in a deregulated power market. J. Intell. Fuzzy Syst. 2022, 43, 1331–1345. [Google Scholar] [CrossRef]
  23. Sharma, V.; Walde, P. A novel optimisation technique based on swarm intelligence for congestion management in transmission lines. Int. J. Power Energy Convers. 2022, 13, 1–23. [Google Scholar] [CrossRef]
  24. Haq, F.U.; Bhui, P.; Chakravarthi, K. Real time congestion management using plug in electric vehicles (PEV’s): A game theoretic approach. IEEE Access 2022, 10, 42029–42043. [Google Scholar] [CrossRef]
  25. Verma, S.; Mukherjee, V. Optimal real power rescheduling of generators for congestion management using a novel ant lion optimiser. IET Gener. Transm. Distrib. 2016, 10, 2548–2561. [Google Scholar] [CrossRef]
  26. Paul, K.; Kumar, N.; Agrawal, S.; Paul, K. Optimal rescheduling of real power to mitigate congestion using gravitational search algorithm. Turk. J. Electr. Eng. Comput. Sci. 2019, 27, 2213–2225. [Google Scholar] [CrossRef]
  27. Qu, K.; Zheng, X.; Li, X.; Lv, C.; Yu, T. Stochastic Robust Real-Time Power Dispatch with Wind Uncertainty using Difference-of-Convexity Optimization. IEEE Trans. Power Syst. 2022, 37, 4497–4511. [Google Scholar] [CrossRef]
  28. Paul, K.; Dalapati, P.; Kumar, N. Optimal Rescheduling of Generators to Alleviate Congestion in Transmission System: A Novel Modified Whale Optimization Approach. Arab. J. Sci. Eng. 2021, 47, 3255–3279. [Google Scholar] [CrossRef]
  29. Verma, S.; Mukherjee, V. Firefly algorithm for congestion management in deregulated environment. Eng. Sci. Technol. Int. J. 2016, 19, 1254–1265. [Google Scholar] [CrossRef]
  30. Meddeb, A.; Amor, N.; Abbes, M.; Chebbi, S. A novel approach based on crow search algorithm for solving reactive power dispatch problem. Energies 2018, 11, 3321. [Google Scholar] [CrossRef]
  31. Fan, X.; Liu, Y.; Gu, Z.; Yao, Q. A double-loop adaptive relevant vector machine combined with Harris Hawks optimization-based importance sampling. Eng. Comput. 2024. [Google Scholar] [CrossRef]
  32. Dey, P.; Marungsri, B. Modified Harris Hawk algorithm-based optimal photovoltaics for Voltage Stability and Load Flow Analysis. Int. J. Green Energy 2024, 21, 2378–2392. [Google Scholar] [CrossRef]
  33. Almousa, M.T.; Gomaa, M.R.; Ghasemi, M.; Louzazni, M. Single-Sensor Global MPPT for PV System Interconnected with DC Link Using Recent Red-Tailed Hawk Algorithm. Energies 2024, 17, 3391. [Google Scholar] [CrossRef]
  34. Peng, L.; Li, X.; Yu, L.; Heidari, A.A.; Chen, H.; Liang, G. Q-learning guided mutational Harris hawk optimizer for high-dimensional gene data feature selection. Appl. Soft Comput. 2024, 161, 111734. [Google Scholar] [CrossRef]
  35. Belazzoug, M.; Touahria, M.; Nouioua, F.; Brahimi, M. An improved sine cosine algorithm to select features for text categorization. J. King Saud Univ. Comput. Inf. Sci. 2020, 32, 454–464. [Google Scholar] [CrossRef]
  36. Mirjalili, S.M.; Mirjalili, S.Z.; Saremi, S.; Mirjalili, S. Sine cosine algorithm: Theory, literature review, and application in designing bend photonic crystal waveguides. In Nature-Inspired Optimizers: Theories, Literature Reviews and Applications; Springer: Cham, Switzerland, 2020; pp. 201–217. [Google Scholar] [CrossRef]
  37. Mittal, U.; Nangia, U.; Jain, N.K.; Gupta, S. Optimal power flow solution using a learning-based sine–cosine algorithm. J. Supercomput. 2024, 80, 15974–16012. [Google Scholar] [CrossRef]
  38. Heidari, A.A.; Mirjalili, S.; Faris, H.; Aljarah, I.; Mafarja, M.; Chen, H. Harris hawks optimization: Algorithm and applications. Future Gener. Comput. Syst. 2019, 97, 849–872. [Google Scholar] [CrossRef]
  39. Sharma, P.; Batish, N.; Khan, S.; Arya, S. Power flow analysis for IEEE 30 bus distribution system. WSEAS Trans. Power Syst. 2018, 13, 48–59. [Google Scholar]
  40. Dash, S.; Mohanty, S. In Multi-objective economic emission load dispatch with nonlinear fuel cost and noninferior emission level functions for IEEE-118 bus system. In Proceedings of the 2015 2nd International Conference on Electronics and Communication Systems (ICECS), Coimbatore, India, 26–27 February 2015; IEEE: Piscataway, NJ, USA, 2015; pp. 1371–1376. [Google Scholar] [CrossRef]
  41. Verma, S.; Saha, S.; Mukherjee, V. Optimal rescheduling of real power generation for congestion management using teaching-learning-based optimization algorithm. J. Electr. Syst. Inf. Technol. 2018, 5, 889–907. [Google Scholar] [CrossRef]
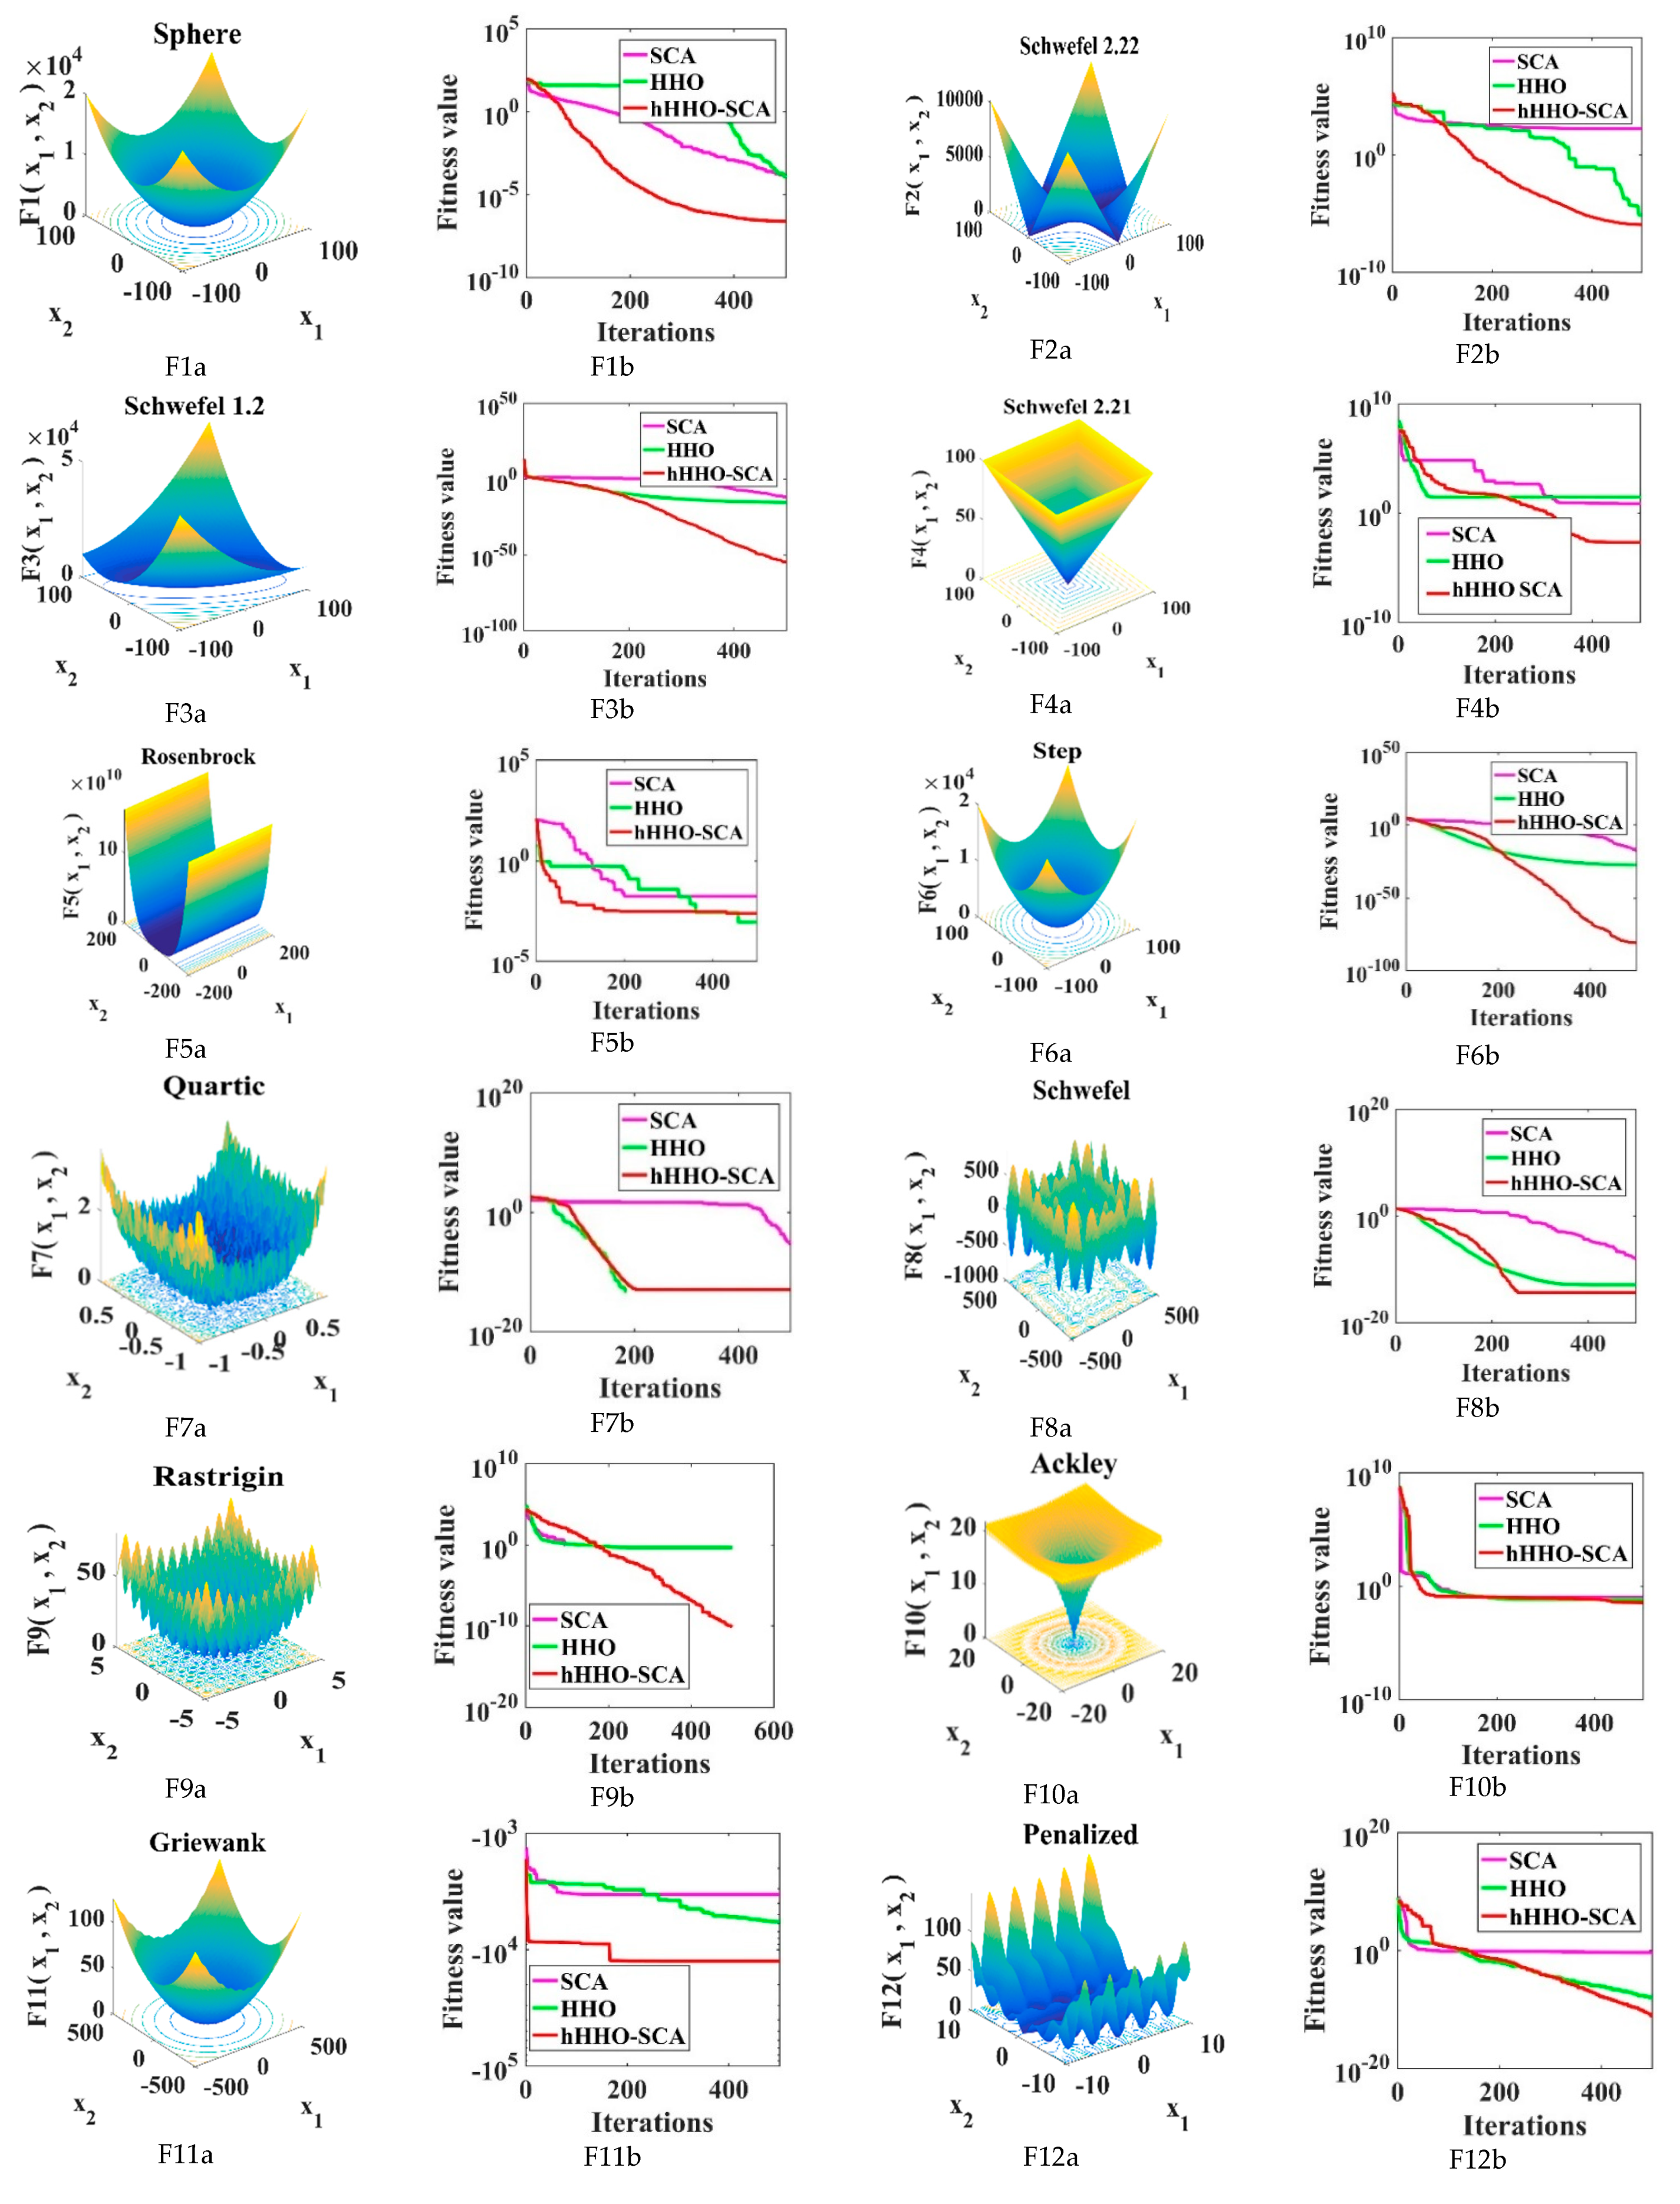
Figure 1. (F1aF23b) Performance of hHHO−SCA, HHO, and SCA on benchmark functions.
Energies 17 04985 g001aEnergies 17 04985 g001b
Figure 2. Flowchart for CM with hHHO−SCA.
Energies 17 04985 g002
Figure 3. Single line representation of IEEE 30-bus system [39].
Energies 17 04985 g003
Figure 4. Congestion cost representation with hHHO−SCA and other algorithms.
Energies 17 04985 g004
Figure 5. Real power rescheduled representation with hHHO−SCA and other algorithms.
Energies 17 04985 g005
Figure 6. Characteristics of hHHO-SCA, HHO, and SCA.
Energies 17 04985 g006
Figure 7. Box plot for hHHO-SCA, SCA, and HHO (IEEE 30 bus).
Energies 17 04985 g007
Figure 8. Comparative bus voltage with hHHO-SCA and other optimization techniques.
Energies 17 04985 g008
Figure 9. Single line diagram of 118-bus system [40].
Energies 17 04985 g009
Figure 10. Comparative cost with hHHO-SCA and other algorithms.
Energies 17 04985 g010
Figure 11. Representation of convergence characteristics of hHHO-SCA, HO, and SCA.
Energies 17 04985 g011
Figure 12. Box plot for hHHO-SCA, SCA, and HHO (118 bus).
Energies 17 04985 g012
Figure 13. Comparative bus voltage with hHHO-SCA, SCA, and HHO.
Energies 17 04985 g013
Table 1. Performance of hHHO-SCA, HHO, and SCA on 23 benchmark functions.
Functions HHOSCAhHHO-SCA
F1AVG2.77 × 10−271.62 × 10−420.00 × 100
SD8.68 × 10−271.8 × 10−420.00 × 100
Med2.27 × 10−291.32 × 10−440.00 × 100
Worst4.59 × 10−268.9 × 10−440.00 × 100
F2AVG1.27 × 10−198.61 × 10−270.00 × 100
SD3.05 × 10−206.12 × 10−270.00 × 100
Med7.67 × 10−237.19 × 10−270.00 × 100
Worst7.94 × 10−203.72 × 10−270.00 × 100
F3AVG4.58 × 10−80.2860.00 × 100
SD0.0000001280.2130.00 × 100
Med3.95 × 10−120.2410.00 × 100
Worst0.0000004070.2210.00 × 100
F4AVG2.54 × 10−90.0000003120.00 × 100
SD5.46 × 10−98.48 × 10−100.00 × 100
Med4.81 × 10−110.000000280.00 × 100
Worst0.0000001680.0000002290.00 × 100
F5AVG7.1184.3821.1151
SD0.250183.33296.2251
Med8.62813.76225.2106
Worst8.36627.588810.2357
F6AVG0.44170.00 × 1000.00 × 100
SD0.33360.00 × 1000.00 × 100
Med0.38830.00 × 1000.00 × 100
Worst0.573890.00 × 1000.00 × 100
F7AVG0.00082880.00280.0000157
SD0.00068010.001030.0000141
Med0.00054450.00260.000012
Worst0.00408910.004780.0000531
F8AVG−3323.231−4170−3365.415
SD348.350550333.7271
Med−3187.4255−4190−3534.859
Worst−3137.601−4070−3300.079
F9AVG2.49670.00 × 1000.00 × 100
SD6.14940.00 × 1000.00 × 100
Med7.55 × 10−110.00 × 1000.00 × 100
Worst14.56790.00 × 1000.00 × 100
F10AVG2.52−165.55 × 10−167..99 × 10−18
SD3.25 × 10−160.00 × 1000.00 × 100
Med7.0707 × 10−165.55 × 10−159.89 × 10⁻¹⁵
Worst3 × 10−145.55 × 10−158.99 × 10⁻¹⁵
F11AVG0.0807910.000740.00 × 100
SD0.298720.002340.00 × 100
Med0.000000870.00 × 1000.00 × 100
Worst0.526240.00740.00 × 100
F12AVG0.0808384.71 × 10−320.32412
SD0.030702.26 × 10−480.5869
Med0.0767735.81 × 10−330.0000939
Worst0.0072285.81 × 10−333.248
F13AVG0.324121.35 × 10−320.020908
SD0.073363.90 × 10−490.037983
Med0.455252.46 × 10−330.008320
Worst0.521252.46 × 10−330.071273
F14AVG1.69350.9980.896
SD0.848220.00 × 1000.00 × 100
Med0.94560.7720.699
Worst1.83210.7720.699
F15AVG0.0009880.0003820.0002927
SD0.0002230.0002020.000348
Med0.0008850.0008290.0006074
Worst0.0024350.001220.0050304
F16AVG−1.0123−1.03−2.04151
SD0.0000170.00 × 1000.00 × 100
Med−1.6554−1.03−3.23271
Worst−1.9987−1.03−3.24271
F17AVG0.42310.3980.30991
SD0.0022340.00 × 1000.00 × 100
Med0.67890.5020.40870
Worst0.54380.4020.50990
F18AVG333
SD0.00004572.96 × 10−160.00 × 100
Med333
Worst3.000133
F19AVG−4.7891−4.97−5.1735
SD0.00086519.47 × 10−170.00 × 100
Med−6.8761−5.63−5.5718
Worst−6.8612−5.13−5.0719
F20AVG−2.9654−4.56−4.2862
SD0.23674.68 × 10−160.037421
Med−3.1365−3.32−4.123
Worst−1.8767−3.32−4.1031
F21AVG−4.0077−10.1−11.0432
SD3.10120.0780.00 × 100
Med−4.1738−10.2−11.0431
Worst−0.5881−9.91−11.1231
F22AVG−5.2501−10.4−11.2028
SD2.31072.43 × 10−163.39 × 10⁻¹⁵
Med−3.708−10.4−11.3028
Worst−0.80836−10.4−11.3021
F23AVG−5.5371−8.45−11.3362
SD0.887473.432.58 × 10−16
Med−4.5678−10.5−11.6362
Worst−1.9867−1.86−11.6265
Table 2. Scenarios for overloading conditions.
ScenariosStandard Power System NetworkOverloading Conditions
1IEEE 30-bus system [39]Tripping of lines 1–2
2IEEE 118-bus system [40]Increment in load of 57% at buses 11 and 20, outage of lines 8–5
Table 3. Power flow details for IEEE 30 bus.
Congested/Overload LinesPower Flow (MW)Excess Power Flow (MW)Power Flow Limit (MW)Overload (%)
Outage of lines 1–21–3147.4617.4613013.43
6–8136.296.291304.84
Table 4. Comparison of results achieved with hHHO-SCA (IEEE 30 bus).
TLBO
[41]
ALO
[25]
FPA
[25]
PSO
[21]
RSM
[21]
SA
[21]
SCA
[Solved]
HHO
[Solved]
hHHO-SCA
[Proposed]
Congestion cost ($/h)494.66480.04519.62538.95716.25719.86496.59476.32454.96
Best congestion cost ($/h)* NR* NR* NR* NR* NR* NR496.59476.32454.96
Worst congestion cost ($/h)* NR* NR* NR* NR* NR* NR801.58596.12490.24
Line (1–3) power flow (post-CM) 130.00129.5129.60129.97129.78129.51129.69129.98129.65
Line (6–8) power flow (post-CM)120.78120.79120.58120.62120.60120.35120.38120.65120.03
∆P1 (MW)−8.5876−9.0880−9.127−8.61−8.808−9.076−8.97−8.004−6.491
∆P2 (MW)12.985515.066814.1410.402.6473.13313.201.5689.5519
∆P3 (MW)0.45980.01980.2063.032.9533.2340.1092.960.2854
∆P4 (MW)0.72890.00010.01880.023.0632.9680.0741.5190.9962
∆P5 (MW)0.00930.00020.1890.852.9132.9541.0653.7190.0034
∆P6 (MW)0.39880.00011.0130.012.9522.4431.007.6280.8476
Total amount (MW)23.16924.155224.70322.9323.3323.8023.61920.11119.4734
* NR: not reported.
Table 5. Power flow details (118 bus).
Congested/Overload Lines
(MW)
Power Flow
(MW)
Excess Power Flow
(MW)
Line Limit
(MW)
% Overload
Tripping of lines 8–5 with increase in load at buses 11–20 by 57%16–17209.1434.1417512.83
30–17568.7313.1650037.6
8–30380.59205.5917554.01
Table 6. Outcomes for hHHO-SCA and other optimization algorithms (IEEE 118 bus).
ALO
[41]
EP
[21]
RCGA
[21]
DE
[21]
PSO
[25]
HPSO
[25]
SCA
[Solved]
HHO
[Solved]
hHHO-SCA
[Proposed]
Congestion cost ($/h)1544.81888.601769.31608.017,74217,3651680.481462.471268.18
Best congestion cost ($/h)* NR* NR* NR* NR* NR* NR1680.481462.471268.18
Worst congestion cost ($/h)* NR* NR* NR* NR* NR* NR2318.671762.781398.56
Line (16–17)
power flow
(post-CM)
174.20173.89174.26174.37174.15174.62174.23174.87173.18
Line (30–17)
power flow
(post-CM)
497.94498.14499.09496.88496.09495.42496.36497.30495.42
Line (8–30)
power flow
(post-CM)
174.76174.54174.68174.20174.82174.59174.48174.00174.02
∆PG10.017738.1126.2746.470524.50211.5900.04260.125
∆PG20.0362000000.01770.00013.0727
∆PG317.26663.0631.42212.2951.02596.568−0.23120.0140
∆PG4−0.0031−7.4811.349−0.0561.3148−0.0467.4155−0.00040
∆PG5−207.83−200.6−219.3−208.1−21.82−207.70.06550.00021.7508
∆PG6105.3248.58101.42105.32105.3280.1260.15040.02370
∆PG70.0020000089.6690.004104.93
∆PG84.683949.170.00291.994616.8156.005900.00360.0731
∆PG92.59764.0568.05821.288423.665−0.2393.00920.005111.165
∆PG100.004200000−0.1250.002315.742
∆PG110.0915121.51114.6949.697121.51121.5198.035417.7450
∆PG1228.18625.918116.31113.29116.31108.0628.1860.0006113.4
∆PG13−0.002485.3707.41550.81253.009210.7520.4916−0.00051.6977
∆PG140.067832.857−0.00192.18360.0177−0.53622.780.0223−10.03
∆PG1589.76531.61628.09589.6698.866511.254−0.0024−0.01411.665
∆PG160.002539.0711.75080.78197.14750.073149.178.16649.6558
∆PG170.00437.5520.0004−0.0410.4916−0.394−0.0141−0.0273−0.092
∆PG180.04260000064.0560.01774.9421
∆PG190.00360000025.114116.12−0.5718
∆PG200.150489.0011.7478−0.0896.07924.30960.00360.22610.0087
∆PG2125.11496.07518.528102.8519.35977.6611.50982.37770
∆PG228.674993.82833.4267.378636.79872.9010.00250.29740.7567
∆PG23−0.0141000001.28840.003518.528
∆PG240.0059000000.78198.8665−0.536
∆PG2517.7450000075.1407116.318.3874
∆PG268.166400000113.290.0276−207.3
∆PG27−0.00240000048.589.17580
∆PG2833.28000007.14758.67491.53
∆PG299.1758000000.008733.2810.752
∆PG300.6717−450.904.90410.7020.652549.6970.90680.8256
∆PG310.017300000−0.421846.17380.3837
∆PG320.00320000028.0954.896328.095
∆PG330.021800000−0.0019−0.00240.0023
∆PG340.00240000013.3170.005271.938
∆PG350.1945000008.866516.815−0.394
∆PG360.0013000002.18360.00010
∆PG3739.6670000032.857121.510.0004
∆PG380.0372000005.7770.16540.0023
∆PG392.7964000000.75670.00590.9656
∆PG400.003100000121.510.07481.7478
∆PG410.0033000008.67490.2949101.12
∆PG420.015100000116.3102.1221
∆PG430.4569000000.04260.15044.409
∆PG440.00730000085.3769.11511.254
∆PG450.196000003.7627205.1140
∆PG463.22181574.9719.8998707.3281717.7839720.481600.001913.317
∆PG47−0.0015000001.47163.009222.78
∆PG48−0.0013000003.072723.66572.901
∆PG490.00390000012.64120.00014.3096
∆PG500.0012000000.812542.19833.426
∆PG51100.4330000025.9180.000411.934
∆PG52−0.0045000002.59030.4916−0.0018
∆PG537.3507000000.43680.04520
∆PG540.0009000000.0047.147577.661
Total amount (MW)713.36772149.6541439.69131414.54921242.53731440.8597988.32971.18913.828
* NR: not reported.
Disclaimer/Publisher’s Note: The statements, opinions and data contained in all publications are solely those of the individual author(s) and contributor(s) and not of MDPI and/or the editor(s). MDPI and/or the editor(s) disclaim responsibility for any injury to people or property resulting from any ideas, methods, instructions or products referred to in the content.