Abstract
Recent advancements in cryogenic etching, characterized by high aspect ratios and etching rates, address the growing demand for enhanced performance and reduced power consumption in electronics. To precisely maintain the temperature under high loads, the cascade mixed-refrigerant cycle (CMRC) is predominantly used. However, most refrigerants currently used in semiconductor cryogenic etching have high global warming potential (GWP). This study introduces a −100 °C chiller using a mixed refrigerant (MR) with a GWP of 150 or less, aiming to comply with stricter environmental standards and contribute to environmental preservation. The optimal configuration for the CMRC was determined based on a previously established methodology for selecting the best MR configuration. Comprehensive analyses—energy, exergy, environmental, and exergoeconomic—were conducted on the data obtained using Matlab simulations to evaluate the feasibility of replacing conventional refrigerants. The results reveal that using eco-friendly MRs increases the coefficient of performance by 52%, enabling a reduction in compressor size due to significantly decreased discharge volumes. The exergy analysis indicated a 16.41% improvement in efficiency and a substantial decrease in exergy destruction. The environmental analysis demonstrated that eco-friendly MRs could reduce carbon emissions by 60%. Economically, the evaporator and condenser accounted for over 70% of the total exergy costs in all cases, with a 52.44% reduction in exergy costs when using eco-friendly MRs. This study highlights the potential for eco-friendly refrigerants to be integrated into semiconductor cryogenic etching processes, responding effectively to environmental regulations in the cryogenic sector.
1. Introduction
The etching process in semiconductor manufacturing is critical for defining circuit patterns on wafers. It involves removing unnecessary material, leaving behind the desired structure. This process is categorized into two main types: dry and wet etching. Wet etching, owing to its isotropic characteristics, is less capable of achieving fine patterns compared to dry etching. Dry etching, which employs reactive gasses and ions, is favored for its high productivity and precision. Among dry etching techniques, reactive ion etching (RIE) is predominantly used owing to its anisotropic etching capabilities and rapid processing speed [1,2]. RIE transforms etching gas into plasma, combining the selectivity of chemical etching with the anisotropy of physical etching to achieve a high etching rate.
However, the increasing complexity and miniaturization of semiconductor designs demand even finer patterning, which the Bosch process—used for deep silicon wafer etching—often fails to achieve efficiently because of inadequate discharge of etching byproducts [3], leading to reduced etching rates. To address this, cryogenic etching has been introduced [4]. Conducted at temperatures below −70 °C, cryogenic etching minimizes chemical reactivity, thereby reducing byproduct formation and enhancing etching rates [5,6]. This technique not only preserves the yield by eliminating the need for separate cleaning processes owing to its non-deposition characteristics, but also improves anisotropy when performed at temperatures around −100 °C. Furthermore, maintaining a stable −100 °C environment has been the focus of recent studies, as it is considered to increase the proportion of etching gas, thus potentially enhancing the overall etching rate [6].
To achieve temperatures of −100 °C or lower, three primary refrigeration cycles are commonly utilized: the auto-cascade refrigeration cycle (ACRC), the two-stage refrigeration cycle (TSRC), and the Linde–Hampson cycle (LHC). The auto-cascade refrigeration system employs a single compressor and uses a mixed refrigerant (MR) as the working fluid, offering the advantages of a low pressure ratio and high volumetric efficiency. The two-stage refrigeration system, which utilizes two compressors within a single cycle, has gained widespread commercial application. Both systems often incorporate ejectors to enhance performance, which adds complexity to their configurations [7,8,9,10,11,12]. In contrast, the LHC is favored for reaching −100 °C with a simpler setup. This cycle, which is an enhancement of the Joule–Thomson (J–T) refrigeration cycle, integrates a heat exchanger and typically uses MR owing to the low exergy efficiency observed with single refrigerants. When MR is employed, the cycle operates at a lower pressure. Additionally, as the refrigerant generally remains within the two-phase region, the heat exchange coefficient within the heat exchanger is increased, facilitating a reduction in the heat exchanger’s size [13].
The advantageous properties of MRs have resulted in numerous studies aimed at achieving low temperatures in refrigeration cycles. Liu et al. investigated the performance characteristics of a vaccine storage refrigerator that maintained −70 °C using R601a/R1150 and R601a/R290/R1150 mixtures in a J–T refrigerator [14]. They found that R1150, having the lowest normal boiling point (NBP) among the three components, significantly influenced system pressure and operating power. Notably, power consumption was 7.06% lower at 8.42 kWh/d with the R601a/R290/R1150 mixture at mass fractions of 0.70/0.10/0.20. Rozhentsev analyzed a −75 °C J–T refrigerator utilizing a hydrocarbon (HC)-based mixture, reporting a cooling capacity of 90 W [15]. Zhang et al. assessed the cooling performance of a single-stage Linde–Hampson refrigeration system across high- and low-temperature chambers, proposing an optimization strategy for MR concentration and suction pressure conversion [16]. Their findings indicated that the fastest cooling to –80 °C occurred with HC-based MRs of R50/R1150/R290/R600a at molar fractions of 0.3/0.4/0.05/0.25. Lee et al. tested non-flammable MRs containing N2/Ar/R14/R218 in a 100 K J–T refrigerator, demonstrating a maximum cooling capacity of 15 J/g at 103 K and the ability to reach 98.5 K without refrigerant freezing [17]. Walimbe et al. compared the performance of non-flammable and flammable MRs in a J–T refrigerator, finding that non-flammable MRs achieved a lower minimum temperature, although with reduced cooling capacity compared to flammable MRs; the study identified that flammable MRs enhanced refrigeration effects [18]. Lee et al. further investigated the application of a non-flammable N2/Ar/R14 mixture in a J–T refrigerator designed to cool the liquid nitrogen coolant of high-temperature superconducting cables [19]. Their study focused on compressor operating pressure and working fluid mass flow rate as design parameters, revealing that the maximum coefficient of performance (COP) and exergy efficiency of the MR J–T refrigerator were 0.216 and 0.4 at 105 K, respectively. Boiarski et al. examined the application of a non-flammable MR in a cryogenic refrigerator and its comparison with conventional flammable MRs, noting that the non-flammable MR could reach a minimum temperature of 120 K [20]. They emphasized the importance of selecting appropriate capillary tubes for expansion, considering the MR and temperature range.
Despite the use of MRs in LHC, challenges persist owing to limited cooling capacity or high power consumption by the compressor when targeting temperatures below −100 °C [21,22]. Therefore, a single LHC may not be suitable for cryogenic etching chillers that demand precise temperature control under high operational loads. In such instances, the cascade mixed-refrigerant cycle (CMRC), which incorporates an MR into the cascade refrigeration system (CRS), is more commonly employed. The CRS operates two J–T cycles, the high-temperature cycle (HTC) and the low-temperature cycle (LTC), with LHC often utilized to enhance the efficiency of the LTC.
Extensive research has been conducted on applying MRs to the CMRC to achieve cryogenic temperatures. Massuchetto et al. compared the thermodynamic performance of various MR mixtures, including R744/R1270, R744/R717, and R744/RE170 within CRS [23]. They aimed to determine the optimal composition ratio that maximizes the COP under a consistent cooling load of 100 kW in the evaporator, finding an increase in COP from 0.18 to 0.32 in comparison to single-refrigerant systems. Nasruddin et al. focused on system optimization within CRS by applying C3H8 to the HTC and a C2H6/CO2 mixture to the LTC, considering both economic feasibility and thermodynamics [24]. They found that at the optimal configuration, total exergy destruction was 39 kW and the CO2 fraction was 0.68. Nicola et al. utilized a mixture of CO2 and HCs (R170, R290, R1150, R1270) as the LTC working fluid and R717 as the HTC working fluid [25]. Their performance analysis of CRS, conducted using software based on the Carnahan–Starling–DeSantis state equation, indicated that although the COP could exceed certain thresholds, mixing R744 with HC-based refrigerants and dimethyl ether consistently degraded cycle performance. Babiloni et al. examined three-component MRs with diverse properties for ultra-low-temperature refrigeration in CRS, reporting that the mixture exhibiting the lowest global warming potential (GWP) and the highest COP at −80 °C was highly flammable [26]. Sobieraj applied a mixture of R744- (with a GWP of 1), HC-based, and hydrofluorocarbon (HFC)-based refrigerants to CRS, achieving a temperature of −72 °C using a 67% CO2 mixture with R-290 and R-32 [27].
Previous studies have predominantly utilized HC-based refrigerants in MRs due to their significant isothermal enthalpy differences, facilitating large cooling capacities across various temperatures [14,15,16,18,23,24,25,26,27]. However, the application of HC-based MRs is limited in several industries, such as semiconductor manufacturing, where only non-flammable or very-low-flammability refrigerants are permitted for safety reasons. Research on achieving cryogenic temperatures with non-flammable refrigerants has been limited, often employing high-GWP refrigerants such as R14 and R23 [18,19,20]. In response to escalating climate change concerns, international agreements such as the Montreal Protocol and Kyoto Protocol have resulted in efforts to curtail the use of refrigerants with high ozone depletion potential (ODP) and GWP [28,29,30]. Moreover, under the Kigali Amendment and F-gas regulations, the phased restrictions and eventual replacement of high-GWP halogen refrigerants with environmentally friendly alternatives are underway. Notably, ultra-low-temperature refrigerants such as R14, while not currently regulated, are recognized as candidates for replacement owing to their environmental impact.
To date, no studies have explored the application of eco-friendly low-flammability MRs in cryogenic refrigeration systems operating below −100 °C. Most studies in this field have focused on HCs and high-GWP refrigerants. With the advent of cryogenic etching in the semiconductor industry, there is a growing need for research into −100 °C refrigeration systems that utilize environmentally friendly refrigerants. This study builds on prior work that developed a methodology for optimizing the performance of the CMRC when applied to LTC [31]. It aims to identify optimal MR combinations with a GWP of 150 or less by integrating conventional MRs with eco-friendly refrigerants and performing comprehensive energy, exergy, environmental, and exergoeconomic analyses. Additionally, this study seeks to determine commercially viable MRs for use in semiconductor cryogenic etching processes, among other applications. The goal is to assess whether these eco-friendly MRs can replace conventional refrigerants across various dimensions, particularly in contexts such as the semiconductor industry where high-GWP refrigerants are prevalent, and to evaluate their potential to meet stringent environmental regulations in the cryogenic sector.
2. System Description
Figure 1 shows a schematic of the CMRC, and Figure 2 shows a p-h diagram of the CMRC. The HTC includes a compressor, a condenser, an expansion valve, and a cascade heat exchanger (CHX). The LTC comprises a compressor, CHX connected to the HTC, an intermediate heat exchanger (IHX), an expansion valve, and an evaporator.
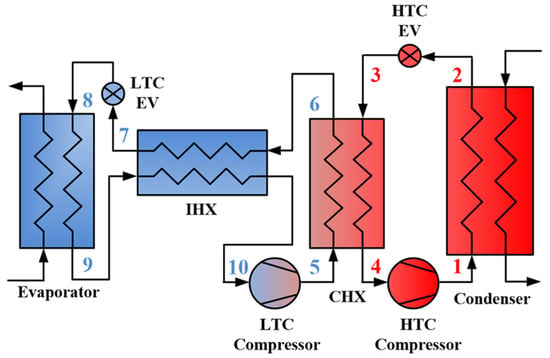
Figure 1.
Schematic of the CMRC.
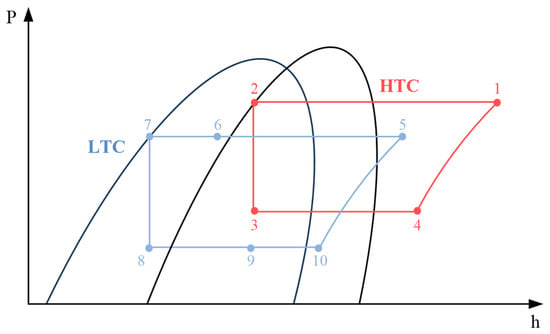
Figure 2.
p-h diagram of the CMRC.
The CMRC operates as follows: The superheated steam discharged from the HTC compressor (state 1) releases heat to the cooling water, which is consistently maintained at 20 °C, in the condenser and fully condenses (state 2). This saturated liquid then undergoes expansion (state 3) and fully evaporates after heat exchange with the MR from the LTC at the CHX (state 4). The now superheated steam flows back into the compressor.
From the LTC, MRs discharged from the compressor partially condenses at the CHX (state 6). The portion of the refrigerant that does not fully condense turns into saturated liquid after passing through the IHX (state 7). This saturated liquid then expands (state 8) and evaporates while absorbing heat in the evaporator (state 9). After undergoing heat exchange at the IHX, it achieves a degree of superheat and flows into the compressor (state 10).
Incorporating the IHX within the LTC enhances the refrigeration effect at the evaporator by facilitating additional condensation after the condenser and prevents liquid compression at the compressor by ensuring the refrigerant achieves a degree of superheat. Therefore, integrating the LHC within the LTC can enhance performance relative to conventional CRS.
3. Selection of Working Fluids
3.1. Conventional Refrigerants
In a previous study [31], the following refrigerants were identified as suitable for use in the semiconductor industry: R134a, R125, R116, R23, and R14. These are compared with the eco-friendly MRs proposed in this study. Table 1 shows the physical and environmental data for these selected conventional refrigerants.

Table 1.
List of selected conventional refrigerants.
As in the previous study, R404A (NBP: −46.6 °C), with a flammability class of A1, is applied to the HTC.
3.2. Eco-Friendly Refrigerants
The objective of this study is to maintain brine at temperatures below −100 °C using eco-friendly refrigerants (in this paper, an eco-friendly refrigerant is one that has a low GWP and thus minimizes the global warming effect caused by its use). An MR system comprising refrigerants with varied boiling points is employed to enhance system efficiency at cryogenic temperatures. With the gradual restriction of conventional high-GWP refrigerants by the Kigali Amendment and F-gas regulations, it is imperative to identify alternatives that ensure environmental protection. Additionally, the application of flammable refrigerants in the semiconductor industry is constrained by safety requirements. Based on these criteria, the selection conditions for eco-friendly refrigerants that constitute the MR of the LTC can be summarized as follows:
- To facilitate effective etching, refrigerants of various boiling points with a GWP of less than 1000 are selected. These refrigerants must produce a cooling capacity of 5 kW while stably maintaining the brine temperature at −100 °C or lower.
- Currently, only A1 class non-flammable refrigerants are permitted in the semiconductor industry. Owing to the high GWP of most existing A1 class refrigerants, finding suitable eco-friendly alternatives is challenging. Therefore, refrigerants up to the A2L flammability class are considered.
- To ensure that the evaporation pressure does not fall below atmospheric pressure, it is desirable that the refrigerant with the lowest boiling point has an NBP approximately 40 °C lower than the target evaporation temperature of −110 °C [21].
Table 2 shows the physical and environmental data for refrigerants that meet condition 1.

Table 2.
Candidate eco-friendly refrigerants list according to the selection process.
Excluding refrigerants that do not meet condition 2 from Table 2, R784, R744A, R744, R32, and R1234yf remain. Notably, the NBP of R784, the refrigerant with the lowest boiling point, is −153.22 °C, which satisfies condition 3. Therefore, the refrigerants selected are R1234yf, R32, R744 (carbon dioxide), R744A (nitrous oxide), and R784 (krypton).
Among these, R744A (nitrous oxide) poses a minimal threat to the ozone layer, given its ODP of 0.017. Predominantly, anthropogenic N2O emissions are attributed to agricultural activities, suggesting minimal impact on the ozone layer when used in limited cryogenic applications [32]. Furthermore, R744A is not currently regulated under the Montreal Protocol, facilitating its use as a refrigerant. Its NBP of −88.48 °C is comparable to that of R23 (−82.1 °C), which is extensively utilized for low-temperature applications. Prior research indicates that R744A’s performance measures and efficiency are similar to those of R23, making it a potential replacement for this widely used refrigerant. Although studies have explored substitutes for R23, most alternatives were considered unsuitable for this study owing to their flammability [22,33]. Despite its high GWP of 677, R32 was chosen as a component of MR because the combined GWP of the MR can be maintained below 150, aligning with F-gas regulations that restrict refrigerants with GWPs exceeding 150.
R404A continues to be used in the HTC as per conventional MR practices. It is commonly used in the HTC of CRS, and despite its high GWP of 3922, it facilitates comparative analysis under uniform conditions.
4. Thermodynamic Model
The thermodynamic analysis for all scenarios was conducted under uniform assumptions as follows.
4.1. Assumptions and Simulation Conditions
The cycles are modeled according to the first and second laws of thermodynamics, with simulations performed under the following conditions:
- All components operate under normal conditions and undergo a normal flow process.
- No heat losses or pressure drops occur in any pipes or components.
- Changes in kinetic and potential energies are neglected.
- The compressors are insulated, and their isentropic efficiencies are dependent on the compression ratio.
- The degree of superheat for the compressor suction steam in both the HTC and LTC (states 4 and 10) is maintained at 10 °C.
- Throttling processes at the expansion valves are assumed to be isenthalpic.
- The flow within heat exchangers follows a counterflow configuration.
- Scroll compressors are employed in both the HTC and LTC, owing to their compactness.
Table 3 shows the simulation conditions. The HTC’s condensation temperature is set at 30 °C, based on the cooling water consistently supplied at 20 °C in the semiconductor process. Additionally, the condenser outlet quality is set to zero to ensure that the working fluid in the HTC is fully condensed. The evaporation temperature in the HTC ranges from −40 °C to −20 °C, adjusted in intervals of 5 °C during the simulation to stabilize the LTC evaporation temperature at −110 °C.

Table 3.
Simulation conditions of the CMRC.
For the LTC, the condensation pressure is established at 2 MPa, with the condensation temperature varying from −30 °C to −10 °C. Following precedents from previous studies [31], the expansion valve inlet quality is also set to zero, indicating that the refrigerant is fully condensed at the IHX. This configuration maximizes the refrigeration effect in the evaporator. Furthermore, an increase in evaporation pressure at the same evaporation temperature can reduce compressor power consumption by increasing the density of the suction gas and reducing the compressor discharge volume.
4.2. Energy Model
The mass equilibrium expression for a normal flow system is as follows:
Based on the mass equilibrium shown in Equation (1), the energy equilibrium can be expressed as
Given that changes in kinetic and potential energies are neglected, as mentioned in condition (3) of Section 4.1, Equation (2) simplifies to
Table 4 details the energy balance calculation equation for each component, derived from the energy equilibrium expression in Equation (3).

Table 4.
Energy and exergy calculation equations of the CMRC.
Isentropic efficiency, a function of the compression ratio γ, is calculated as follows [34]:
Volumetric efficiency, related to the clearance ratio c, is given by Equation (5) [35]. As scroll compressors are utilized for both the HTC and LTC, and it was noted in Section 4.1 that ≅ 0 holds, the volumetric efficiency is assumed. Thus, volumetric efficiency is not considered in the calculations.
The COP can be derived by dividing the evaporator heat capacity by the compressor power consumption for both HTC and LTC:
4.3. Exergy Model
Exergy is defined as a measure to determine the maximum useful work obtainable from an energy source in a specified state, bounded by the laws of thermodynamics. An exergy model, based on the second law of thermodynamics, can identify cycle irreversibilities and components with high potential for efficiency improvements.
Exergy can be quantified as follows:
where represents the physical exergy and the subscript “0” indicates the standard state. For this model, commonly used values for the standard state were selected: = 25 °C and = 101.325 kPa.
The exergy balance equation is expressed as
Table 4 outlines the exergy destruction calculations for each component of the CMRC alongside the energy model.
In the exergy destruction formula for the evaporator, ΔT represents the difference between the evaporation temperature and the brine temperature, which is 10 °C.
Total exergy destruction is calculated as the sum of the individual components’ exergy destruction:
The exergy efficiency of the CMRC is determined as follows:
4.4. Environmental Analysis Model
Environmental analysis is essential for assessing the benefits of selected eco-friendly MRs over conventional MRs. Typically, the environmental impact of a refrigerant is assessed using its GWP. However, GWP does not account for carbon emissions resulting from energy use during system operation. Therefore, methodologies such as total equivalent warming impact (TEWI) and life cycle climate performance (LCCP) have been developed and are widely applied in research [36,37,38,39,40,41]. TEWI quantifies the greenhouse gas emissions of a system from its initial operation to its decommissioning, providing a measure of its global climate impact. LCCP evaluates the broader environmental impact of a heating, ventilation, air conditioning, and refrigeration system throughout its operational life. Being more inclusive and precise, LCCP is considered to be a stricter indicator than TEWI as it encompasses specific emissions beyond the direct and indirect emissions accounted for by TEWI. For this reason, LCCP was chosen for the environmental impact analysis in this study [42].
The total LCCP is calculated as
Direct emissions are formulated as
where C represents the refrigerant charge (kg), L is the average lifetime of equipment (years), ALR is the annual leakage rate (% of refrigerant charge), EOL is the end-of-life emissions (% of refrigerant charge), and GWP is the global warming potential (kg CO2/kg).
Indirect emissions are expressed as
where AEC is the annual energy consumption (kWh), EM is CO2 produced per kWh, m is the mass of the unit (kg), MM is CO2e produced per material (kg CO2/kg), mr is the mass of recycled material (kg), RM is CO2e produced per recycled material (kg CO2/kg), RFM is the refrigerant manufacturing emissions (kg CO2/kg), and RFD is the refrigerant disposal emissions (kg CO2/kg).
Table 5 shows the values used for the LCCP calculation.

Table 5.
Values of parameters related to LCCP calculation.
4.5. Exergoeconomic Analysis Model
Exergoeconomic analysis combines exergy and economic assessments to determine the cost effectiveness of using eco-friendly refrigerants in cryogenic etching chillers. This approach enables the determination of the unit exit cost of the CMRC and facilitates an economic comparison with systems using conventional refrigerants.
The cost balance equation for the kth component is expressed as follows [43]:
where , , , , and represent the exergy cost rate of the import flow, the power transfer cost rate, the total cost rate, the export flow cost rate, and the heat transfer cost rate for component j, respectively.
The exergy cost rate () is calculated by multiplying the cost per unit of exergy (c) with the exergy rate ():
Total cost rates for each component are expressed as
where is the sum of the component costs is the system operation cost, and is the CO2 emission penalty.
Here, is calculated as follows:
is expressed as follows:
is expressed as follows:
In Equations (18) and (19), the system operation time () is 8760 h, the electricity cost () is 0.09 USD/kWh, the emission coefficient () is 0.9 kg/kWh, and the CO2 penalty coefficient () is 0.09 USD/kg [44].
Table 6 shows the exergoeconomic balance equations for each component, and Table 7 presents the associated cost rates [45,46,47].

Table 6.
Exergoeconomic balance for each component.

Table 7.
Capital and maintenance cost rate for each component [44].
For the equations in Table 7, Ø is the maintenance factor (1.06) and CRF is the capital recovery factor, which is obtained using Equation (20):
where is the interest rate (14%) and is the service life of the system (15 years).
In addition, A is the surface area of the heat exchanger, which can be obtained using the log mean temperature difference method:
where is the heat transfer rate, is the overall heat transfer coefficient, and is the log mean temperature difference. The values of the evaporator, condenser, IHX, and CHX are 0.03, 0.04, 1.0, and 1.0 kW/(m2 K), respectively [43].
5. Optimization Method
The optimization method employed in this study replicates the approach used in a previous study [31]. This involves simulating cycles to identify the optimal refrigerant for the LTC of the CMRC. For the simulations, refrigerant physical data from REFPROP ver. 9.1 were utilized and exported to Matlab. The selected refrigerants from Section 3.1 and Section 3.2 were categorized based on their NBPs as high, mid, and low. For conventional MRs, R134a was categorized as a high-boiling-point refrigerant, R125, R116, and R23 as mid-boiling-point refrigerants, and R14 as a low-boiling-point refrigerant. For eco-friendly MRs, R1234yf was categorized as a high-boiling-point refrigerant, R32, R744, and R744A as mid-boiling-point refrigerants, and R784 as a low-boiling-point refrigerant. As shown in Table 1 and Table 2, the NBPs of R14 and R784, the lowest boiling point refrigerants, are −127.8 and −153.22 °C, respectively, which facilitate maintaining evaporation pressures above atmospheric pressure and achieving low evaporation temperatures. R134a and R1234yf, as high-boiling-point refrigerants, enhance the refrigeration effect of MRs and provide high critical and dew points. Each mid-boiling-point refrigerant in the MRs improves the performance of the refrigeration cycle.
Table 8 summarizes the cases subjected to cycle simulation. The simulation modifies the mass fraction of each refrigerant by 5%. For instance, a simulated case referred to as R1234yf/R744A/R784 = 0.05/0.05/0.85 is included in Case 5. Initially, refrigerants with a GWP of 150 or less were selected. The formula for calculating GWP is as follows [48]:
where n represents the mass fraction of each refrigerant. Subsequently, data are reduced to ensure that thermodynamic laws are not violated in the heat exchangers and that each component can be realistically utilized. Among the refined data, the composition ratios yielding the highest COP are selected for each evaporation temperature, considering electricity consumption to reduce carbon emissions. Table 9 shows the GWP of the optimal combinations selected through the simulation.
GWP = n1 × GWP1 + n2 × GWP2 + n3 × GWP3 + n4 × GWP4 + n5 × GWP5,

Table 8.
Simulated cases.

Table 9.
GWP of selected cases.
6. Results and Discussion
After applying the MRs from each case listed in Table 8 to the CMRC, the composition ratio yielding the highest COP was identified as the optimal composition. For these optimal ratios, both energy and exergy analyses were conducted. Furthermore, the optimal composition ratios for both eco-friendly MRs and conventional MRs underwent LCCP and exergoeconomic analyses to evaluate the feasibility of substituting high-GWP refrigerants with eco-friendly alternatives.
6.1. Energy Analysis
Figure 3 shows the maximum COP achieved for each case. The highest COP for conventional MRs was recorded in Case 4 (0.27) at an HTC evaporation temperature of −35 °C (Case 4-1, which is the best combination of conventional MR). For eco-friendly MRs, the maximum COP was observed in Case 7 (0.41) at an HTC evaporation temperature of −25 °C (Case 7-1, which is the best combination of eco-friendly MRs). Across all cases, eco-friendly MRs demonstrated superior performance, with a notable difference of 0.14 in maximum COP. The lowest COP for conventional MRs was found in Case 5 (0.13) at an HTC evaporation temperature of −30 °C, while the lowest COP for eco-friendly MR was in Case 3 (0.19) at the same evaporation temperature.
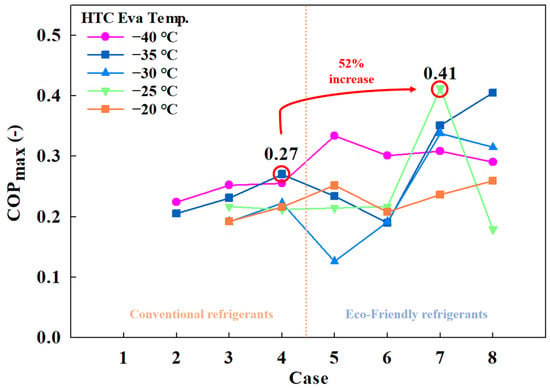
Figure 3.
Maximum COP of the CMRC.
The cooling capacity and compressor power consumption determine COP. Because the cooling capacity was fixed at 5 kW for this study, trends in COP were primarily influenced by variations in compressor power consumption. Figure 4 shows the total compressor power consumption across different cases, revealing an inverse relationship with COP. At points of maximum COP, the compressor power consumption was at its lowest—18.48 kW in Case 4-1 and 12.12 kW in Case 7-1—indicating that the use of eco-friendly MRs can reduce power consumption by over 52%.
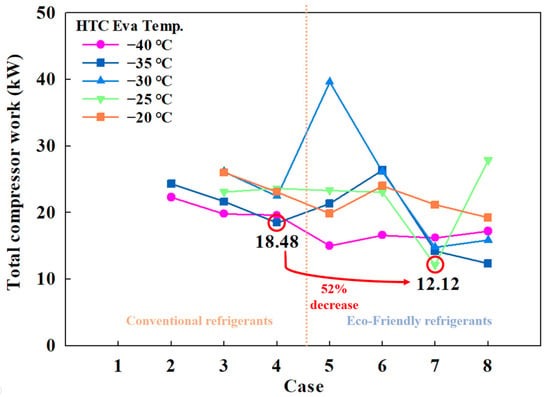
Figure 4.
Total compressor work of the CMRC.
Figure 5 shows the HTC compressor power consumption by case, and Figure 6 shows the LTC compressor power consumption by case. For conventional MRs, HTC compressor power ranged from 6.01 to 9.41 kW, and for eco-friendly MRs, it ranged from 4.48 to 12.67 kW. LTC compressor power consumption varied from 11.09 to 19.4 kW for conventional MRs and from 6.62 to 19.4 kW for eco-friendly MRs.
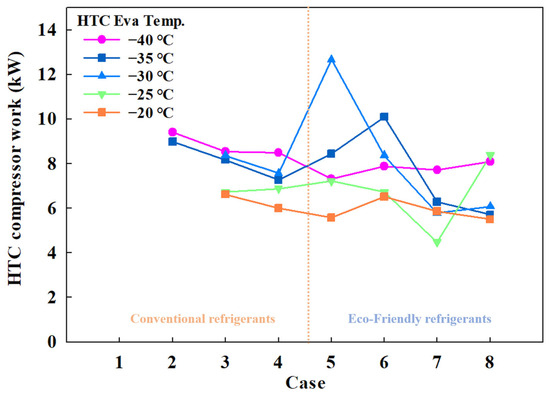
Figure 5.
HTC compressor work of the CMRC.
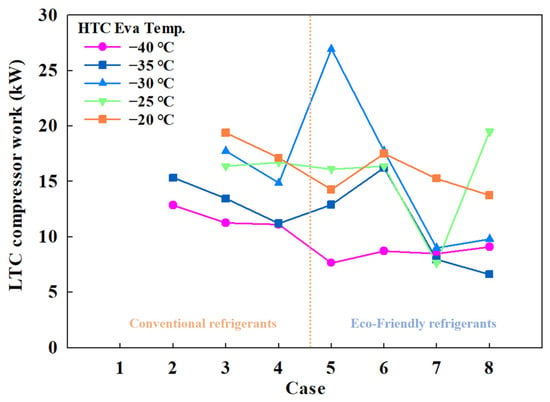
Figure 6.
LTC compressor work of the CMRC.
The power consumption of a compressor is influenced by various variables. In this study, the use of scroll compressors implies that the compressor discharge amount significantly impacts power consumption. Figure 7 shows the discharge amount for the HTC compressor across different MRs, revealing that it reaches 52.24 m3/h in Case 4-1 and drops to 28.37 m3/h in Case 7-1. Figure 8 shows the discharge amount for the LTC compressor, indicating 54.25 m3/h in Case 4-1 and 26.98 m3/h in Case 7-1.
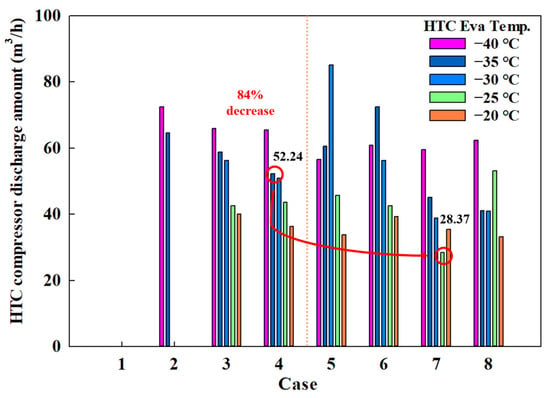
Figure 7.
HTC compressor discharge amount of the CMRC.
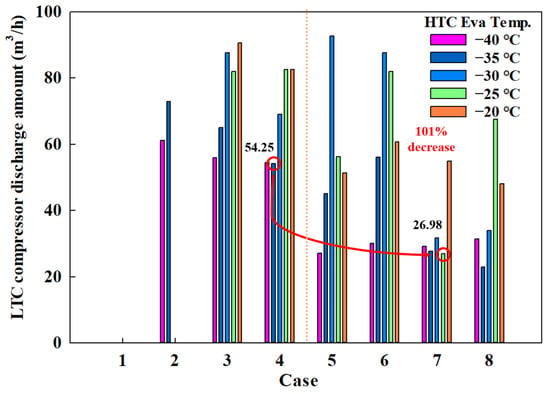
Figure 8.
LTC compressor discharge amount of the CMRC.
These results indicate that the use of eco-friendly MRs significantly reduces the discharge amounts for both HTC and LTC compressors by approximately 50%. This reduction suggests potential decreases in compressor size and power consumption.
Therefore, when evaluating COP, compressor power consumption, and compressor discharge amounts, the combination of R1234yf, R744, R744A, and R784 emerges as the most effective from a thermodynamic perspective among the eco-friendly MR options.
6.2. Exergy Analysis
Figure 9 shows the exergy destruction by case when the HTC evaporation temperature ranged from −40 to −20 °C. The lowest exergy destruction occurred in Case 7-1 (7.42 kW) at −35 °C, while the highest was observed in Case 5 (31.52 kW) at −30 °C. Notably, both the maximum and minimum values were recorded using eco-friendly MRs. This finding reveals that applying eco-friendly MRs, such as in Case 7-1, to the CMRC not only increases the COP, but also reduces exergy destruction.
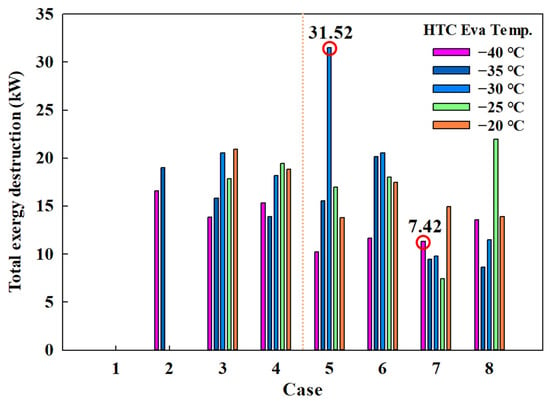
Figure 9.
Total exergy destruction by case.
Figure 10 shows the exergy efficiency by case. The highest exergy efficiency for conventional MRs was 0.30, while the efficiency in Case 4-1 was 0.25. In contrast, the highest exergy efficiency for eco-friendly MRs was achieved in Case 7-1 (0.39), which represents a 57.11% increase compared to that of Case 4-1. These results demonstrate that eco-friendly MRs outperform conventional MRs in terms of both energy and exergy efficiencies.
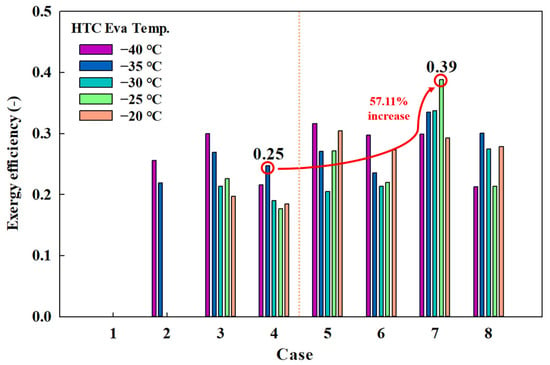
Figure 10.
Exergy efficiency by case.
To further analyze the exergy destruction of each component within the CMRC, the exergy destruction rates at the optimal composition ratio for both conventional and eco-friendly MRs were examined. Figure 11 shows these results. For conventional MRs, the LTC expansion valve showed the highest exergy destruction rate at 21%, followed by the LTC IHX and the LTC compressor. For eco-friendly MRs, the LTC IHX exhibited the highest exergy destruction rate at 27%, followed by the LTC compressor and expansion valve. The exergy destruction rate for IHX was approximately 20%. Notably, significant exergy destruction occurs during the refrigerant condensation and overheating processes in the IHX, the non-isentropic compression process in the compressor, and the expansion process in the expansion valve, necessitating careful selection of these components. Contrary to the findings of a previous study [31], where the exergy destruction rate of the CHX was high, the CHX exergy destruction rates in this study were relatively low, at 2% and 8%, indicating that they did not contribute significantly to the total exergy destruction.
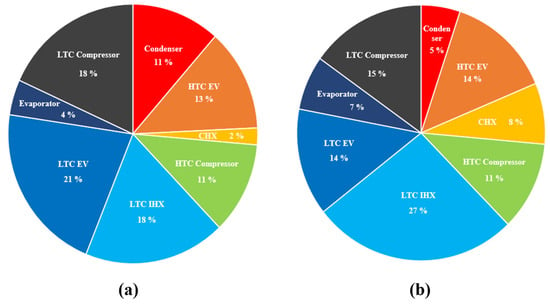
Figure 11.
Exergy destruction rate of each component: (a) conventional MRs and (b) eco-friendly MRs.
6.3. LCCP Analysis
The optimal composition ratios that achieved the highest COP for each MR—Case 4-1 and Case 7-1—were subjected to LCCP analysis. Figure 12 shows the LCCP results for each MR. Carbon emissions amounted to 1193.46 ton CO2e for Case 4-1 and 754.64 ton CO2e for Case 7-1, demonstrating that carbon emissions are 58% higher when Case 4-1 is applied to the CMRC. In both scenarios, indirect emissions significantly outweighed direct emissions.
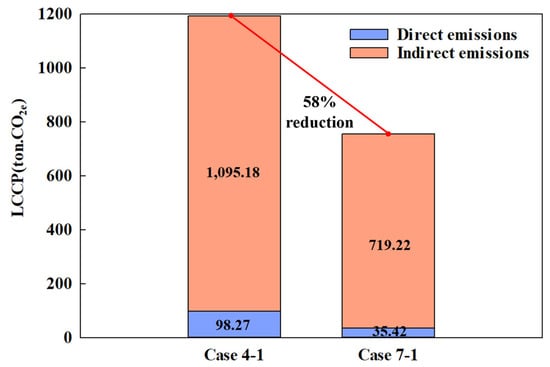
Figure 12.
Carbon emissions of the CMRC with different MRs.
For direct emissions, all variables except the GWP of the working fluids were identical. The GWP values for the working fluids used in the LTC were 6997 for Case 4-1 and 14.1 for Case 7-1, revealing a considerable difference exceeding 496 times. However, when calculated, direct emissions only differed by approximately threefold. Focusing solely on the refrigerant type, the use of eco-friendly MR can reduce carbon emissions by more than three times.
Indirect emissions comprised 92% and 95% of the total emissions in Case 4-1 and Case 7-1, respectively, rendering direct emissions comparatively negligible. This predominance of indirect emissions is attributed to energy consumption, which is invariably high as the semiconductor process equipment operates continuously throughout the year. However, as discussed in Section 6.1, the use of eco-friendly MRs can reduce compressor power consumption relatively, thereby also reducing carbon emissions.
In conclusion, applying eco-friendly MRs to the CMRC offers significant environmental benefits, potentially reducing carbon emissions by approximately 60%.
6.4. Exergoeconomic Analysis
The optimal composition ratios that achieved the highest COP for each MR—Case 4-1 and Case 7-1—were subjected to LCCP analysis. Figure 13 shows the exergy cost rate for each component when conventional MRs and eco-friendly MRs are applied to the CMRC. In both scenarios, the combined exergy cost of the evaporator and condenser was approximately 60% of the total. The evaporator incurs the highest exergy cost owing to the decreased refrigeration effect at lower temperatures, necessitating a larger surface area for the heat exchanger to facilitate the required heat transfer. Following this, the condenser accounts for the second highest cost. The HTC and LTC compressors each contribute approximately 20% to the total cost, attributed to their high power consumption—a cost that can be mitigated by reducing compressor power usage.
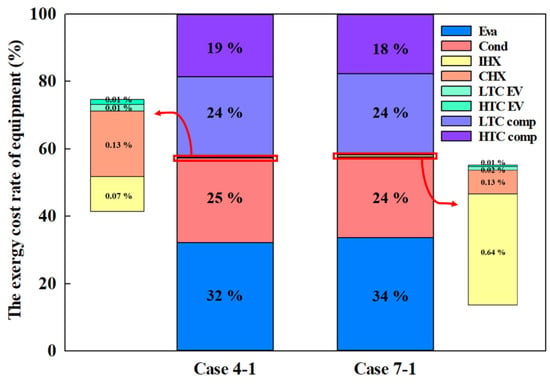
Figure 13.
Exergy cost of equipment.
In contrast to the evaporator and condenser, which have high exergy costs, the exergy costs for the IHX and CHX are less than 1%. The heat exchange area significantly influences the exergy cost of these components, with a lower exergy cost indicating higher efficiency.
Figure 14 shows the exergy cost analysis for each type of MR. For conventional MRs, the total annual exergy cost () was USD 36,858, composed of USD 22,272 from component costs (), USD 14,571 from operation costs (), and USD 1.5 from CO2 emission penalties (). In contrast, for eco-friendly MRs, the total annual exergy cost was significantly lower at USD 28,260, with USD 18,692 from component costs, USD 9558 from operation costs, and USD 1 from CO2 emission penalties. This represents an approximately 20% reduction in component costs and over 50% reduction in operation costs compared to conventional MRs. The substantial decrease in operation costs is primarily attributed to the reduced compressor power consumption achievable with eco-friendly MRs, which can lower consumption by more than 50%. While both MRs incurred minimal emission costs, the cost was 52.44% higher for conventional MRs compared to eco-friendly MRs.
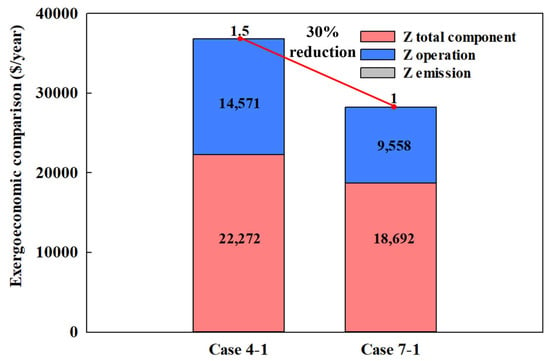
Figure 14.
Exergoeconomic comparison of different MRs in the CMRC.
7. Conclusions
In this study, the optimal configurations of both conventional MRs and eco-friendly MRs were thermodynamically identified for use in the CMRC using simulations where the HTC evaporation temperature ranged from −40 °C to −20 °C. This analysis was based on the methodology of a previous study, incorporating both energy and exergy analyses. Furthermore, configurations exhibiting the highest COP for conventional and eco-friendly MRs were also subjected to environmental (LCCP) and exergoeconomic analyses to evaluate the feasibility of replacing conventional refrigerants, typically used at cryogenic temperatures, with eco-friendly alternatives. The main conclusions are as follows:
- The highest COP observed (0.41) was from eco-friendly MR at a HTC evaporation temperature of −25 °C (Case 7-1).
- Case 7-1 not only showed the highest COP, but also demonstrated the lowest compressor power consumption (12.12 kW) and high exergy efficiency (0.39).
- Exergy destruction in the LTC components, including the compressor, expansion valve, and IHX, accounted for approximately 60% of the total, indicating significant potential for improvement.
- The LCCP analysis revealed that using eco-friendly MRs in Case 7-1 reduced carbon emissions by 58% compared to the conventional MR in Case 4-1, owing to energy savings.
- The evaporator had the highest exergy cost rate among the components, with eco-friendly MRs reducing exergy costs by 30% compared to conventional MRs.
- We propose MRs mixed with mass fractions of 0.2/0.05/0.05/0.7 of R1234yf, R744, R744A, and R784, which are judged to be the best through 4E analysis, and satisfy the requirement for −100 °C and 5 kW of cooling heat capacity for the working fluid of cryogenic chillers for semiconductor etching processes.
Based on these findings, eco-friendly MRs are considered superior in all aspects—energy, exergy, environmental impact, and exergoeconomics. With the goal of achieving −100 °C using eco-friendly MRs in the CMRC, this study suggests that eco-friendly MRs can effectively replace conventional MRs due to their environmental and economic benefits. Additionally, the excellent performance of MRs including R784 (krypton) and R744A (nitrous oxide) highlights their potential applicability not only in the cryogenic etching process of the semiconductor industry, but also in other industries. Future research will apply and experimentally verify the configurations proposed in this study based on the simulation results.
Author Contributions
Writing—Original draft, Validation, Resources, Data curation, Visualization, H.-I.J.; Data curation, Formal analysis, Validation, C.-H.S.; Conceptualization, Resources, Methodology, Supervision, J.-H.L. All authors have read and agreed to the published version of the manuscript.
Funding
This research received no external funding.
Data Availability Statement
Data are contained within the article.
Acknowledgments
This work was partly supported by the Korea Institute of Energy Technology Evaluation and Planning (KETEP) grant funded by the Korea government (MOTIE) (RS-2024-00418835, Development of High-Efficiency Ultra-Low Temperature Refrigeration Equipment for −100 °C Using Natural Refrigerants).
Conflicts of Interest
The author declares no conflicts of interest.
Nomenclature
| Abbreviations | ||
| ACRC | auto-cascade refrigeration cycle | |
| CHX | cascade heat exchanger | |
| CMRC | cascade mixed-refrigerant cycle | |
| COP | coefficient of performance | |
| CRF | capital recovery factor | |
| CRS | cascade refrigeration system | |
| EV | expansion valve | |
| GWP | global warming potential | |
| HC | hydrocarbon | |
| HCC | hydrochlorocarbon | |
| HFC | hydrofluorocarbon | |
| HFO | hydrofluoroolefin | |
| HO | olefin (Alkene) | |
| HTC | high-temperature cycle | |
| IHX | intermediate heat exchanger | |
| J–T | Joule–Thomson | |
| LCCP | life cycle climate performance | |
| LHC | Linde–Hampson cycle | |
| LTC | low-temperature cycle | |
| MR | mixed refrigerant | |
| NBP | normal boiling point | |
| ODP | ozone depletion potential | |
| PFC | perfluorocarbon | |
| RIE | reactive ion etching | |
| Temp. | temperature | |
| TEWI | total equivalent warming impact | |
| TSRC | two-stage refrigeration cycle | |
| SYMBOLS | ||
| A | heat exchange area | m2 |
| AEC | annual energy consumption | kWh |
| ALR | annual leakage rate | % of refrigerant charge |
| c | cost per unit of exergy | $/kWh |
| cr | clearance volume ratio | - |
| C | refrigerant charge | kg |
| exergy cost rate | $/h | |
| D | compressor suction density | kg/m3 |
| EOL | end-of-life emissions | % of refrigerant charge |
| g | gravitational acceleration | m/s2 |
| h | specific enthalpy | kJ/kg |
| k | polytropic index | - |
| L | average lifetime of equipment | years |
| mass flow rate | kg/s | |
| P | pressure | MPa |
| cooling capacity | kW | |
| RFD | refrigerant disposal emissions | kgCO2/kg |
| RFM | refrigerant manufacturing emissions | kgCO2/kg |
| s | specific entropy | kJ/kg·K |
| T | temperature | °C |
| U | heat transfer coefficient | kW/m2·k |
| v | velocity | m/s |
| V | discharge from the compressor | m3/h |
| compressor work | kW | |
| z | height | m |
| capital cost rate | $/h | |
| Z | cost rate | $ |
| Greek symbols | ||
| α | recovery factor | |
| exergy rate | kW | |
| η | efficiency | |
| γ | compression ratio | |
| physical exergy | kW | |
| ϕ | maintenance factor | |
| Δ | difference | |
| Subscripts | ||
| 1–10 | state point of refrigeration system | |
| 0 | standard state | |
| avg | average | |
| comp | compressor | |
| cond | condenser | |
| eva | evaporator | |
| ex | exergy | |
| direct | direct emissions | |
| indirect | indirect emissions | |
| el | electrical | |
| k | kth component | |
| in | inlet | |
| v | volumetric |
References
- Al-Mashaal, A.K.E.; Cheung, R. Reactive ion etching of tantalum in silicon tetrachloride. Microelectron. Eng. 2022, 259, 111780. [Google Scholar] [CrossRef]
- Yang, G.; Weng, B. Reactive ion etching of PbSe thin films in CH4/H2/Ar plasma atmosphere. Mater. Sci. Semicond. Process. 2021, 124, 105596. [Google Scholar] [CrossRef]
- Dussart, R.; Tillocher, T.; Lefaucheux, P.; Boufnichel, M. Plasma cryogenic etching of silicon: From the early days to today’s advanced technologies. J. Phys. D: Appl. Phys. 2014, 47, 123001. [Google Scholar] [CrossRef]
- Cemin, F.; Girard, A.; Cardinaud, C. On the low temperature limits for cryogenic etching: A quasi in situ XPS study. Appl. Surf. Sci. 2023, 637, 157941. [Google Scholar] [CrossRef]
- De Boer, M.; Gardeniers, J.; Jansen, H.; Smulders, E.; Gilde, M.-J.; Roelofs, G.; Sasserath, J.; Elwenspoek, M. Guidelines for etching silicon MEMS structures using fluorine high-density plasmas at cryogenic temperatures. J. Microelectromechanical Syst. 2002, 11, 385–401. [Google Scholar] [CrossRef]
- Tillocher, T.; Dussart, R.; Mellhaoui, X.; Lefaucheux, P.; Boufnichel, M.; Ranson, P. Silicon cryo-etching of deep holes. Microelectron. Eng. 2007, 84, 1120–1123. [Google Scholar] [CrossRef]
- Yang, D.; Zhu, J.; Wang, N.; Xie, J. Experimental study on the performance of trans-critical CO2 two-stage compression refrigeration system with and without an ejector at low temperatures. Int. J. Refrig. 2023, 154, 231–242. [Google Scholar] [CrossRef]
- Liang, Y.; Ye, K.; Zhu, Y.; Lu, J. Thermodynamic analysis of two-stage and dual-temperature ejector refrigeration cycles driven by the waste heat of exhaust gas. Energy 2023, 278, 127862. [Google Scholar] [CrossRef]
- Liu, Y.; Liu, J.; Yu, J. Theoretical analysis on a novel two-stage compression transcritical CO2 dual-evaporator refrigeration cycle with an ejector. Int. J. Refrig. 2020, 119, 268–275. [Google Scholar] [CrossRef]
- Shi, R.; Bai, T.; Wan, J. Performance analysis of a dual-ejector enhanced two-stage auto-cascade refrigeration cycle for ultra-low temperature refrigeration. Appl. Therm. Eng. 2024, 240, 122152. [Google Scholar] [CrossRef]
- Yu, J.; Zhao, H.; Li, Y. Application of an ejector in autocascade refrigeration cycle for the performance improvement. Int. J. Refrig. 2008, 31, 279–286. [Google Scholar] [CrossRef]
- Llopis, R.; Martínez-Ángeles, M.; García-Valero, M. A novel method to measure the energy efficiency and performance of an auto-cascade refrigeration cycle. Appl. Therm. Eng. 2023, 233, 121146. [Google Scholar] [CrossRef]
- Venkatarathnam, G. Cryogenic Mixed Refrigerant Processes; Springer: Berlin/Heidelberg, Germany, 2008. [Google Scholar]
- Liu, J.; Yu, J.; Yan, G. Experimental study on performance characteristics of a −70 °C ultra-low temperature medical freezer with mixed hydrocarbon refrigerant. Energy 2024, 307, 132596. [Google Scholar] [CrossRef]
- Rozhentsev, A. Refrigerating machine operating characteristics under various mixed refrigerant mass charges. Int. J. Refrig. 2008, 31, 1145–1155. [Google Scholar] [CrossRef]
- Zhang, J.; Bao, K.; Chen, Q.; Zhang, W.; Dong, L.; Zheng, Z.; Wang, Q. Optimization researches on the cooling-down process of the linde-hampson refrigeration system for a high-low temperature test chamber. Case Stud. Therm. Eng. 2023, 50, 103470. [Google Scholar] [CrossRef]
- Lee, C.; Kim, S.; Jeong, S. Experimental investigation on a non-flammable mixed refrigerant Joule-Thomson refrigerator for a 100 K cooling temperature. Appl. Therm. Eng. 2024, 246, 122822. [Google Scholar] [CrossRef]
- Walimbe, N.; Narayankhedkar, K. Atrey Experimental investigation on mixed refrigerant Joule–Thomson cryocooler with flammable and non-flammable refrigerant mixtures. Cryogenics 2010, 50, 653–659. [Google Scholar] [CrossRef]
- Lee, C.; Jin, L.; Park, C.; Jeong, S. Design of non-flammable mixed refrigerant Joule-Thomson refrigerator for precooling stage of high temperature superconducting power cable. Cryogenics 2017, 81, 14–23. [Google Scholar] [CrossRef]
- Boiarski, M.; Podtcherniaev, O.; Flynn, K. Comparative performance of throttle cycle Cryotiger coolers operating with different mixed refrigerants. Cryocoolers 2005, 13, 481–488. [Google Scholar] [CrossRef]
- Qin, Y.; Li, N.; Zhang, H.; Liu, B. A thermodynamic analysis of the Linde-Hampson cycle using low-GWP R1234yf-blends. Case Stud. Therm. Eng. 2023, 49, 103358. [Google Scholar] [CrossRef]
- Qin, Y.; Li, N.; Zhang, H.; Liu, B. Energy and exergy analysis of a Linde-Hampson refrigeration system using R170, R41 and R1132a as low-GWP refrigerant blend components to replace R23. Energy 2021, 229, 120645. [Google Scholar] [CrossRef]
- Massuchetto, L.H.P.; Nascimento, R.B.C.D.; de Carvalho, S.M.R.; de Araújo, H.V.; D’Angelo, J.V.H. Thermodynamic performance evaluation of a cascade refrigeration system with mixed refrigerants: R744/R1270, R744/R717 and R744/RE170. Int. J. Refrig. 2019, 106, 201–212. [Google Scholar] [CrossRef]
- Nasruddin; Sholahudin, S.; Giannetti, N. Arnas Optimization of a cascade refrigeration system using refrigerant C3H8 in high temperature circuits (HTC) and a mixture of C2H6/CO2 in low temperature circuits (LTC). Appl. Therm. Eng. 2016, 104, 96–103. [Google Scholar] [CrossRef]
- Di Nicola, G.; Polonara, F.; Stryjek, R.; Arteconi, A. Performance of cascade cycles working with blends of CO2 + natural refrigerants. Int. J. Refrig. 2011, 34, 1436–1445. [Google Scholar] [CrossRef]
- Mota-Babiloni, A.; Fernández-Moreno, A.; Giménez-Prades, P.; Udroiu, C.-M.; Navarro-Esbrí, J. Ternary refrigerant blends for ultra-low temperature refrigeration. Int. J. Refrig. 2023, 148, 108–116. [Google Scholar] [CrossRef]
- Sobieraj, M. Development of novel wet sublimation cascade refrigeration system with binary mixtures of R744/R32 and R744/R290. Appl. Therm. Eng. 2021, 196, 117336. [Google Scholar] [CrossRef]
- Zou, L.; Liu, Y.; Yu, M.; Yu, J. A modified dual-ejector enhanced dual-evaporator transcritical CO2 refrigeration cycle: 4E (Energy, Exergy, economic and Environmental) assessment. Energy Convers. Manag. 2024, 303, 118181. [Google Scholar] [CrossRef]
- Gong, L.; Zhang, Z.; Chen, M.; Taylor, S.; Wang, X. Study on the carbon footprint of cold storage units using low-GWP alternative refrigerants. J. Clean. Prod. 2023, 430, 139589. [Google Scholar] [CrossRef]
- Goto, T.; Usui, T.; Yoshimura, T.; Yamada, Y. Study of decomposition of R-1132(E) as ultra-low GWP refrigerants. Int. J. Refrig. 2024, 163, 71–77. [Google Scholar] [CrossRef]
- Jung, H.-I.; Son, C.-H.; Lee, J.-H. Optimizing the refrigerants in ultra-low temperature Semiconductor processing chiller with mixed Refrigerant. Case Stud. Therm. Eng. 2024, 61, 104864. [Google Scholar] [CrossRef]
- Kauffeld, M.; Maurath, T.; Germanus, J.; Askar, E. N2O/CO2-Mixtures as Refrigerants for Temperatures below −50 °C. Int. J. Refrig. 2020, 117, 316–327. [Google Scholar] [CrossRef]
- Chen, M.; Yang, Q.; Shi, B.; Chen, X.; Chi, W.; Liu, G.; Zhao, Y.; Li, L. Performance comparison of ultra-low temperature cascade refrigeration cycles using R717/R170, R717/R41 and R717/R1150 to replace R404A/R23. Therm. Sci. Eng. Prog. 2023, 44, 102048. [Google Scholar] [CrossRef]
- Brunin, O.; Feidt, M.; Hivet, B. Comparison of the working domains of some compression heat pumps and a compression-absorption heat pump. Int. J. Refrig. 1997, 20, 308–318. [Google Scholar] [CrossRef]
- Mcgovern, J.A. Utilization of volumetric displacement in reciprocating compressors. Int. Compress. Eng. Conf. 1990, 713, 254. [Google Scholar]
- Makhnatch, P.; Khodabandeh, R. The Role of Environmental Metrics (GWP, TEWI, LCCP) in the Selection of Low GWP Refrigerant. Energy Procedia 2014, 61, 2460–2463. [Google Scholar] [CrossRef]
- Staubach, D.; Michel, B.; Revellin, R. Refrigerant selection from an economic and TEWI analysis of cascade refrigeration systems in Europe based on annual weather data. Appl. Therm. Eng. 2023, 230, 120747. [Google Scholar] [CrossRef]
- Zhang, C.; Liu, C.; Xu, X.; Li, Q.; Wang, S. Energetic, exergetic, economic and environmental (4E) analysis and multi-factor evaluation method of low GWP fluids in trans-critical organic Rankine cycles. Energy 2019, 168, 332–345. [Google Scholar] [CrossRef]
- Dubey, S.; Guruchethan, A.; Reddy, Y.S.K.; Maiya, M. Energy, environmental and economic analysis of low GWP refrigerant heat pumps for simultaneous heating and cooling applications. Therm. Sci. Eng. Prog. 2024, 51, 102605. [Google Scholar] [CrossRef]
- Wan, H.; Cao, T.; Hwang, Y.; Radermacher, R.; Andersen, S.O.; Chin, S. A comprehensive review of life cycle climate performance (LCCP) for air conditioning systems. Int. J. Refrig. 2021, 130, 187–198. [Google Scholar] [CrossRef]
- Butt, S.S.; A Perera, U.; Miyazaki, T.; Thu, K.; Higashi, Y. Energy, exergy and environmental (3E) analysis of low GWP refrigerants in cascade refrigeration system for low temperature applications. Int. J. Refrig. 2024, 160, 373–389. [Google Scholar] [CrossRef]
- Hwang, Y. Guideline for life cycle climate performance. Int. Inst. Refrig. 2015, 1–26. Available online: http://ref.org.ua/upload/iblock/bc0/IIR-Guideline-for-Life-Cycle-Climate-Performance-2015-English.pdf (accessed on 4 September 2024).
- Ji, S.; Ji, S.; Liu, Z.; Liu, Z.; Pan, H.; Pan, H.; Li, X.; Li, X. Energy, exergy, environmental and exergoeconomic (4E) analysis of an ultra-low temperature cascade refrigeration system with environmental-friendly refrigerants. Appl. Therm. Eng. 2024, 248, 123210. [Google Scholar] [CrossRef]
- Deymi-Dashtebayaz, M.; Sulin, A.; Ryabova, T.; Sankina, I.; Farahnak, M.; Nazeri, R. Energy, exergoeconomic and environmental optimization of a cascade refrigeration system using different low GWP refrigerants. J. Environ. Chem. Eng. 2021, 9, 106473. [Google Scholar] [CrossRef]
- Eini, S.; Shahhosseini, H.; Delgarm, N.; Lee, M.; Bahadori, A. Multi-objective optimization of a cascade refrigeration system: Exergetic, economic, environmental, and inherent safety analysis. Appl. Therm. Eng. 2016, 107, 804–817. [Google Scholar] [CrossRef]
- Wang, Y.; Ye, Z.; Yin, X.; Song, Y.; Cao, F. Energy, exergy and exergoeconomic evaluation of the air source transcritical CO2 heat pump with internal heat exchanger for space heating. Int. J. Refrig. 2021, 130, 14–26. [Google Scholar] [CrossRef]
- Singh, K.K.; Kumar, R.; Gupta, A. Comparative energy, exergy and economic analysis of a cascade refrigeration system incorporated with flash tank (HTC) and a flash intercooler with indirect subcooler (LTC) using natural refrigerant couples. Sustain. Energy Technol. Assessments 2020, 39, 100716. [Google Scholar] [CrossRef]
- Refrigerant blends: Calculating global warming potentials, UN Environment Programme OzonAction. Available online: https://www.unep.org/ozonaction/resources/factsheet/refrigerant-blends-calculating-global-warming-potentials (accessed on 4 September 2024).
Disclaimer/Publisher’s Note: The statements, opinions and data contained in all publications are solely those of the individual author(s) and contributor(s) and not of MDPI and/or the editor(s). MDPI and/or the editor(s) disclaim responsibility for any injury to people or property resulting from any ideas, methods, instructions or products referred to in the content. |
© 2024 by the authors. Licensee MDPI, Basel, Switzerland. This article is an open access article distributed under the terms and conditions of the Creative Commons Attribution (CC BY) license (https://creativecommons.org/licenses/by/4.0/).