Article

Investigating Changes in Natural Gas Demand across Great Britain for Domestic Heating Using Daily Data: 2018 to 2024

Energy Systems and Data Group, Birmingham Energy Institute, University of Birmingham, Birmingham B15 2TT, UK
*
Author to whom correspondence should be addressed.
Energies 2024, 17(19), 4884; https://doi.org/10.3390/en17194884
Submission received: 21 August 2024 / Revised: 19 September 2024 / Accepted: 20 September 2024 / Published: 29 September 2024
(This article belongs to the Section G: Energy and Buildings)

Abstract

:
This study analyses data from natural gas combination boilers across a 6-year timeframe, exploring how demand for space heating and hot water have both changed over time, and highlights the impact of factors such as external temperature and the UK energy price cap. The results show that there has been a significant decrease in annual space heating and hot water demand since 2021. Space heating typically contributes 88% of the total annual gas demand of the boilers, with hot water contributing the other 12%. For the same mean temperature across the fourth quarter (8.5 °C), 2018 had a daily mean energy demand of 50.4 kWh, whereas the 2022 value was 41.4 kWh. This 9.0 kWh (18%) difference of the daily mean for Q4 suggests a shift in consumer demand influenced by other factors such as the energy price cap. This analysis provides additional understanding of how consumer energy demand for heating continues to evolve and invites further studies to be completed on future trends of energy demand for both space heating and hot water. Here, we also highlight the benefit of considering space heating and hot water as separate demands, as this provides additional insights and is something the paper helps to advocate for.

1. Introduction

In 2022, 20% of greenhouse gas emissions in the UK were attributed to domestic use (excluding transport) [1], with a heavy reliance on natural gas, which provided approximately two thirds of the energy used in the domestic sector [2]. In 2022, nearly a third (32%) of overall gas consumption in the UK was from domestic demand, with the other major fractions being from electricity generation (33%) and industry (13%) [2]. Domestic gas consumption is split into two parts—heat demand (space heating (75.5%) and hot water (22.1%)) and appliance use (e.g., cooking (2.4%)) [2]. Decarbonising heating is one of Great Britain’s greatest net zero challenges due to the seasonality of demand, which is much greater in the winter than it is in the summer [3].
Between 2021 and 2022, Great Britain’s domestic gas and electricity consumption dropped by around 13% and 8%, respectively [4]. This was a record year-on-year fall, with 98% of local authorities across Great Britain (GB) having domestic gas reductions of over 10%, whilst the non-domestic consumption figures are more in-line with previous years.
This paper analyses how the pattern of gas demand has changed for both hot water and space heating over the 2018–2024 timeframe and how any change in natural gas demand seen across GB (It should be noted that the data used in this paper are from households across Great Britain (GB), but there will be references to other statistics relating to the United Kingdom (UK) throughout the paper) has been spread between these different fractions of heating. Key factors impacting the changes in natural gas demand are also explored.
Domestic space heating (DSH) is the energy demand used to keep the air temperature in the building within a certain comfort range and is the largest fraction of domestic heat demand annually, at 75% [4]—however, our analysis finds this value to be much higher at 88% for gas boiler consumption. DSH varies across the year, dependent on the outside temperature and weather conditions and has a much greater demand in the winter months when heat-loss from buildings is greater. Domestic hot water (DHW) demand is the energy used to heat the water for showers, baths, sinks, washing machines, etc. DHW demand has one key difference from space heating demand—hot water demand remains largely constant throughout the year, irrespective of the weather [5].
This paper analyses the variation in gas demand for space heating and hot water from a sample of more than 144,000 unique gas boilers in Great Britain between May 2018 and March 2024, considering the influence of factors such as external temperature and energy price caps on these changes. The data are available at a daily level, and the sample size is large in comparison to other heat demand studies, as displayed in Table 1.
A survey of dwellings in Scotland that use natural gas-fired combi-boilers (Shortened version of combination boiler—a dual-functional system that provides both central heating and hot water from one single boiler unit)found that the domestic consumer use of heating is dependent on the outdoor temperature, with an increased radiator usage period in colder weather [10]. It was found, in a 2009 Danish survey, that the price of the heating had little impact on the decision to use heating [11]. In a study by [12], relating to households across the Netherlands, it was found that there was a variation of 4.2% in energy use due to different occupancy behaviour, whilst it was suggested that 42% of the variation in domestic energy use is related to the characteristics of the building, with the use of insulation decreasing energy use. However, the presence and use of thermostats to set temperatures increased energy demand in dwellings [12].
Demand for both space heating and hot water varies between domestic households on a daily and seasonal basis [9]. Variables such as the number of occupants were found to have a significant impact on both space heating and hot water demand, with the total energy demand rising with respect to the number of occupants [12]. Space heating demand is dependent on several factors, including consumer behaviour and building fabric. The type and age of a dwelling and the thermal efficiency of the dwelling contribute to the amount of heat required to heat the house [13]. It must be noted that different households, due to factors such as energy costs, desire space heating at different temperature thresholds throughout the year and have different targeted temperatures for differently sized and managed dwellings. This is impacted by the comfort factor of the consumer, which can be influenced by several factors, including the building efficiency, building floor space and the income of the household [14].
Since 2019, there have been significant increases in the cost of wholesale gas across the UK. In January 2022, the price of wholesale gas was almost four times greater than the price in January 2021, with the 7-day average price of gas reaching 12.8 p per kWh in December 2021. This represents an 850% increase on the December 2020 price (1.5 p per kWh) [15]. The price cap per unit of energy (for a typical household), which is set to protect consumers from rising prices by capping profits for suppliers at 1.9% [15], rose from £1277 in October 2021 [16] to £4279 in January 2023 [17] and back down to £1928 (7p per kWh of gas) in January 2024 [18]—with plans to further reduce this cap throughout 2024. However, due to the energy price guarantee in place to protect customers, the effective cap between October 2022 and April 2023 was set at £2500 [17]. From the ‘Opinions and Lifestyle Survey’ in January 2022 by the Office for National Statistics, it was found that nearly a third of households had cut back on their use of gas or electricity and that the houses with the poorest fuel efficiency were impacted the most by these price rises [19].

2. Materials and Methods

2.1. Materials

The anonymised data used for this analysis have been provided by a manufacturer supplying gas boilers to the UK market and consist of daily data for 144,270 unique boilers over a period of nearly six years from May 2018 to March 2024. Although the raw data are collected on a sub-daily basis, the data are provided on an aggregated daily basis from the manufacturer. Owners pay a monthly service fee to have the boiler monitored and serviced/repaired, and the data collection forms part of this service.
The data spans from boilers that have near complete data across the entire 6-year timescale to boilers that have data only for a few days in total. Across the dataset, there are 2083 days where at least one boiler failed to record data successfully, and at any point during the dataset, 110,885 boilers have had data dropouts. Nevertheless, the data are generally of high quality.
To account for any anomalous or non-recorded data within the dataset, Table 2 explains the reasons for any removed data and the counts of data removed.
Figure 1 is a histogram of the count of the number of boilers against the percentage of total number of days of boiler data—with 1000 bins for the 144,270 boilers (0.1% per bin). Indicated by the vertical dotted lines, which show the years along the x-axis, there are a reasonably constant number of boilers that provide 0 through to 3 years (52%) of data. At the 3-year (52%) mark, there is a gradual increase in the number of boilers that have that timescale of data, culminating at a peak at nearly 5 years (87%) of daily data. At this point, the number of boilers providing more than 5-years’ worth of daily data has a significant drop—potentially relating to the ending of 5-year contract—with the start of a rise back up again as the data begin to reach their 6-year span (May 2024).
As shown by Figure 2, on the first day of the recorded data, on 7 May 2018, there were 46,634 unique boilers. At its peak, there were 107,189 unique boilers providing data on 5 May 2021. On the most recent day of data for this analysis, on 13 March 2024, there were just over 60,000 unique boilers providing data. As observed by these statistics and the shape of Figure 2, there was an early uptake from the consumers to the monitoring service that collected these data, from May 2018 to early 2020. At this point, the number of unique boilers subscribing to the service begins to flatten out for a period of around 2 years before it begins a slow reduction in 2022—potentially due to rising living costs. It is assumed that when consumers stop their subscription to the service collecting the data, then their respective boiler data are no longer collected and thus they will no longer be part of the dataset. As this service has a monthly financial cost, the typical consumer base is felt to have greater disposable income than the average across Great Britain.
Two key days in Figure 2 are the days where there is a significant reduction in recorded data—down to 78,311 boilers on 20 October 2020 and to 41,554 on 21 May 2022. These two days have anomalous dropouts in data; however, as there is still a significant number of boilers that have data for those specific days, it is worthwhile keeping these days in the dataset.
Although the sample size and timescale of the dataset are both advantageous, the dataset is without metadata, which means that it is not possible to link the data to other geographical statistics such as the boiler location, the number of occupants, or the building archetype. As changes in household composition or occupancy are unknown through-out the 5-year period of analysis, it has been assumed that any changes in demand are due to non-household change-based variables.
In addition, due to the lack of metadata for the boilers, it is not possible to identify specific boilers for domestic use or non-domestic use. It is specified that the consumption threshold for a domestic boiler is 73,200 kWh of gas demand across a gas year (A gas year is a one-year period between 1 October of one year to 1 October of the following calendar year) [4]. Across the whole dataset (post-parsing), there are the equivalent of 485,869 years of daily data (sum of the total days of data across all boilers, divided by the days in a single year). The number of years of data that exceed the non-domestic limit for gas demand is 19—made up of 11 individual boilers. As the number of boilers that would be labelled as non-domestic make up only 0.004% of the total dataset, it is deemed that these do not affect the quality of the analysis when taking the mean. Therefore, it is assumed that all boilers providing data for this dataset are domestic boilers.
The average domestic gas consumption across GB in 2022 was 11,237 kWh—with a median value of 96,77 kWh [4]. Compared to the 2021 figures—where the mean domestic gas consumption was 12,960 kWh and the median value was 11,345 kWh—there has been a significant drop in both the mean (1723 kWh (13%) decrease) and median (1668 kWh (15%) decrease) consumption figures. [20]. The mean annual gas consumption across this dataset can be seen in Table 3, which looks at how the consumption has changed from 2019 through to 2023. The dataset includes energy demand values for both 2018 and 2024, but as they do not have full years of data they are not included in the analysis for full years.
Included in Table 3 as well is a subset of data labelled ‘Data Subset’. This was created as part of the analysis in this paper, where the subset of boilers had data from 1 January 2019 until 31 December 2023—a full 5-year span—and reduced the number of boilers from 144,270 to 11,276. This was a significant drop in data points, with a decrease of over 90%. This quantity of boiler data, spanning over 5 years and over 11 k of boilers, resulted in over 20 million rows of daily aggregated data—offering a comprehensive dataset for analysis. The mean annual consumption values for this dataset can be seen in the third column of Table 3. This dataset is referred to in the rest of the paper as the ‘Data Subset’.
The fourth column contains annual energy demand data obtained from DESNZ annual reports, and this figure for annual gas demand has been weather corrected. Therefore, it is a record of the gas demand with a correction (a change in values) for the condition of the weather, and comparing data has some uncertainty as the detailed dataset has no weather correction.
Table 3 and Figure 3 show how the mean annual demand for the original dataset increased from 2019 to 2021, followed by a significant drop in the 2022 and 2023 values. This drop in annual gas consumption, seen for all three data sources, is analysed in future sections of this report—but the hypothesis is that the gas consumption has been affected by either a change in outdoor temperature, the rising energy prices and/or the increasing energy efficiency of buildings, alongside other factors. Each of these factors would show an inverse trend in gas demand—with a rising mean outdoor temperature, mean energy price or rising building energy efficiency, the demand for gas would decrease. However, it must be noted that of these factors, the temperature is independent from any other factors, the price per unit of energy is dependent on both suppliers and events across the world, and building efficiency is related to both government policies (on a wider scale) and independent households (on a case-by-case basis).
Despite the DESNZ values being weather corrected, it is still insightful to compare the two datasets. Comparing the original dataset values to the GB annual values from DESNZ, it is only 2022 that has an annual demand difference of more than 250 kWh (the original dataset has a value 1241 kWh higher)—2019, 2020 and 2021 have an average difference of 138 kWh from the DESNZ values. This indicates that the available original dataset covers a range of boilers across Great Britain that are, therefore, felt to reflect typical use.
The mean values calculated using the data subset are, on average, 640 kWh higher than the mean values of the original dataset. A factor here, indicated by customers paying a subscription fee over 5 years to have these data monitored and provided, is that these customers may have a higher than average disposable income. Therefore, it was decided that the data within the data subset (boilers ever-present 2019 through to 2023) may have a greater inherent bias as a subsample of the overall dataset, and therefore, it was decided to use the full original dataset for further analysis.
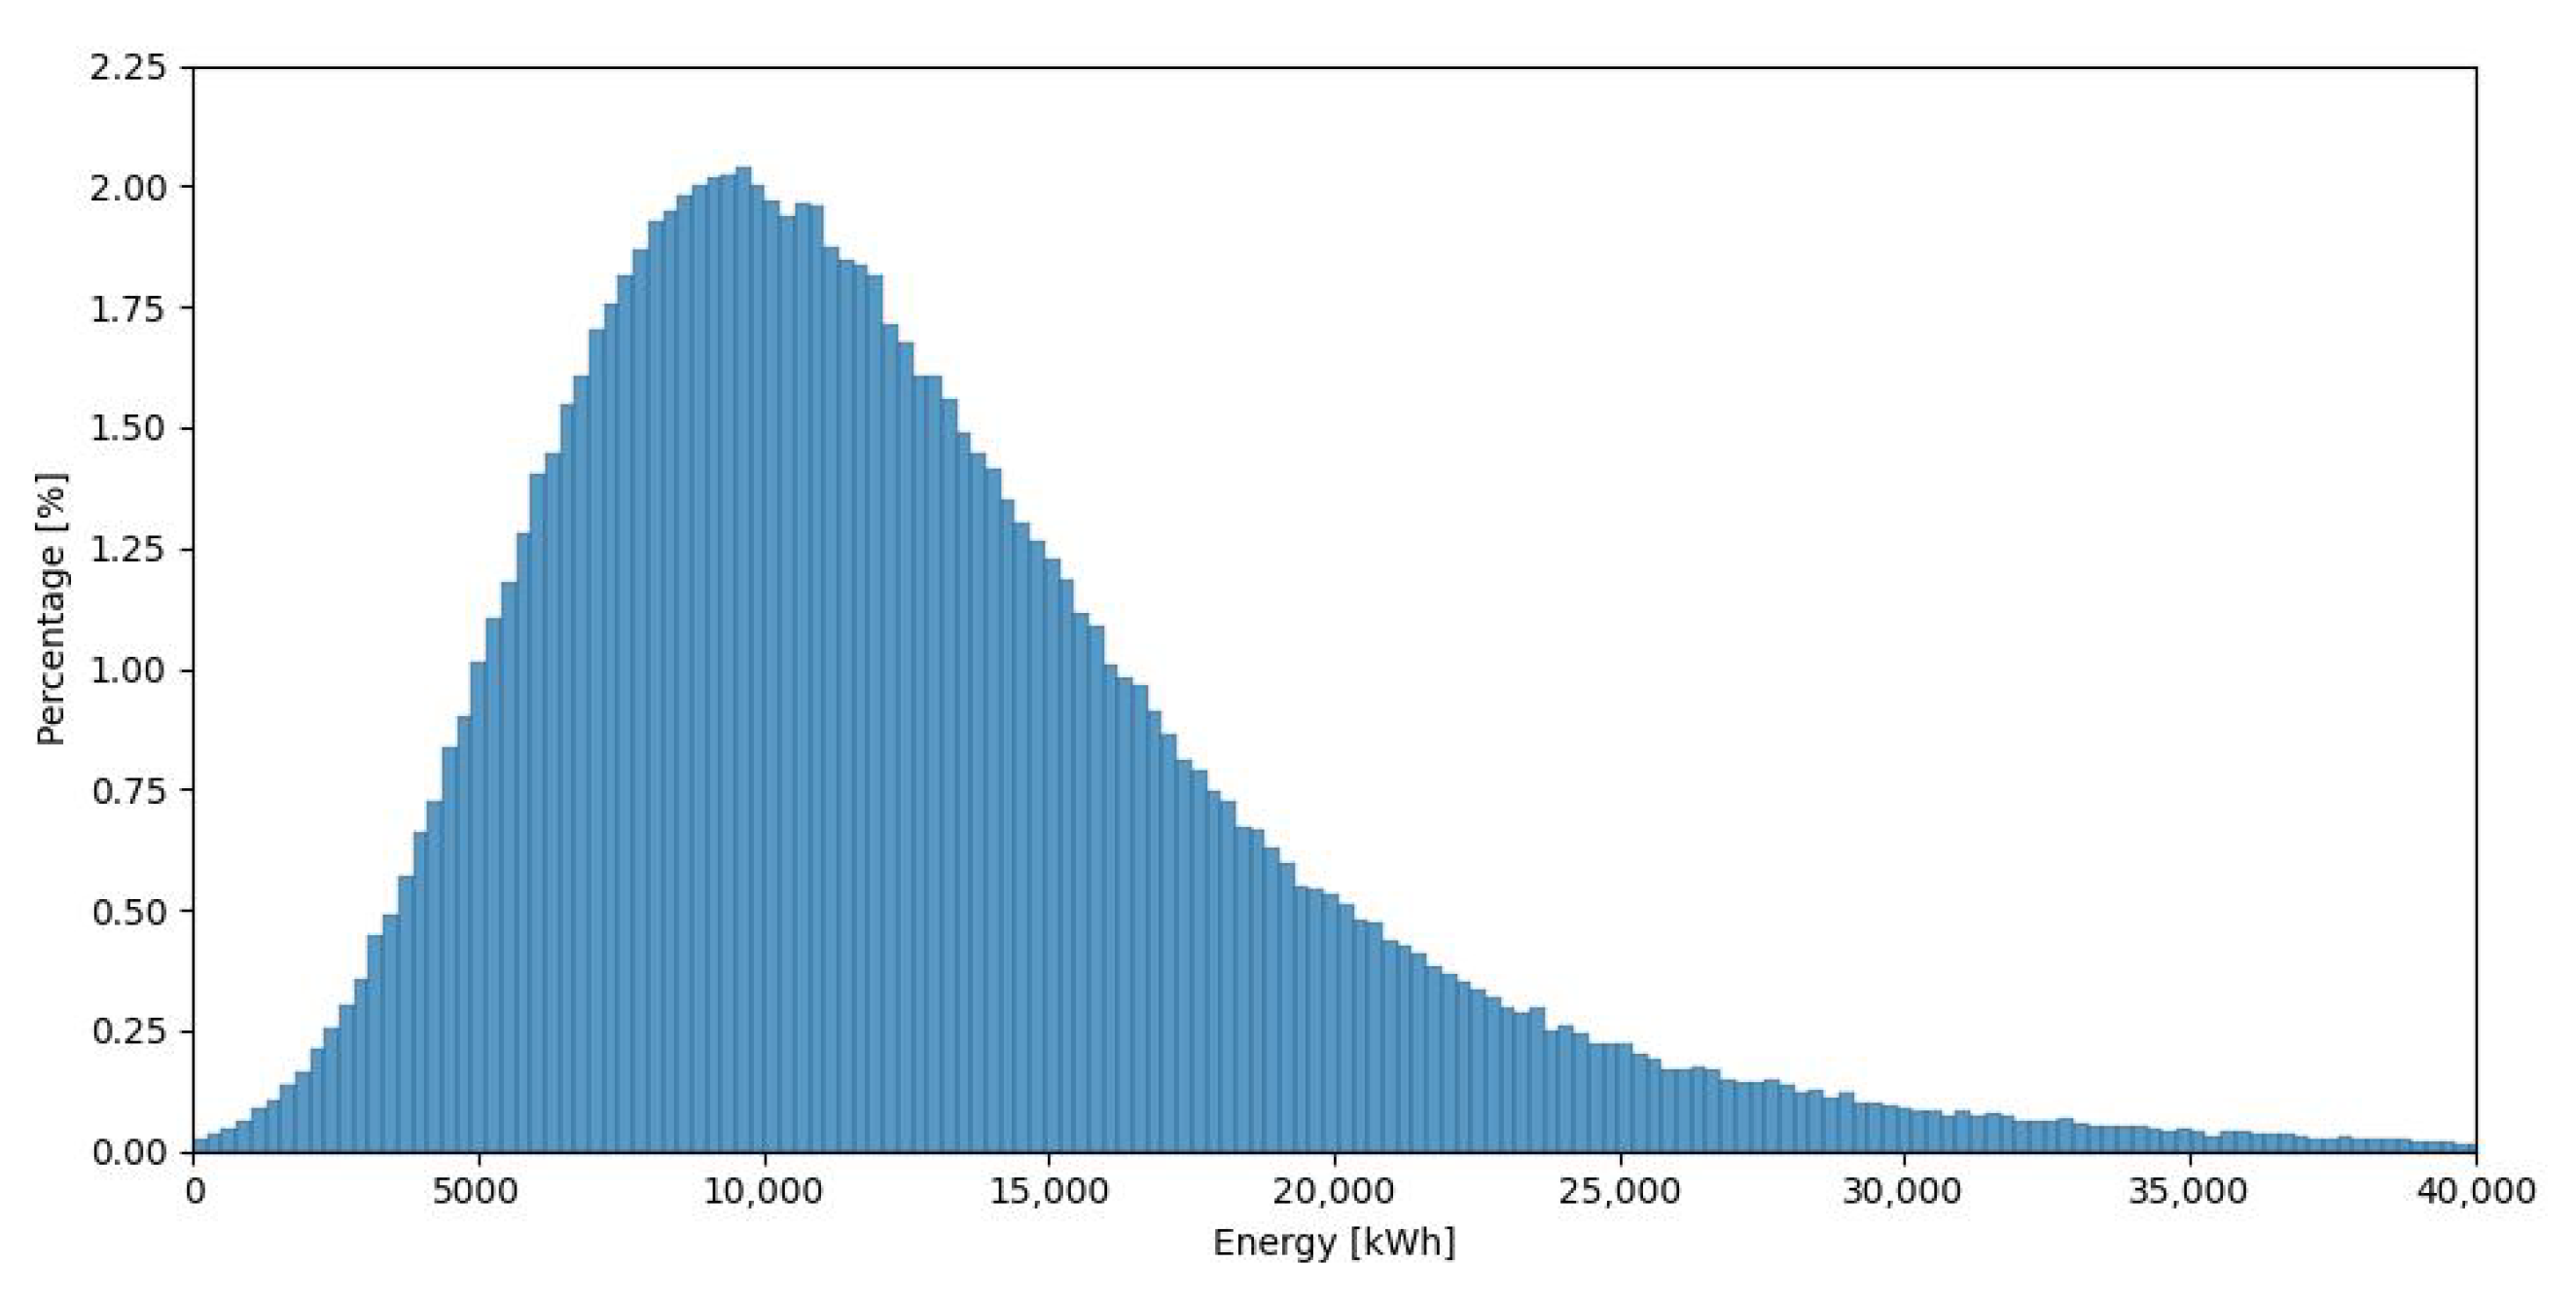
Figure 4 shows a histogram of the percentage of boilers, from 2019 to 2023, with differing annual energy demand, with each bin a width of 100 kWh (giving 400 bins). This chart includes boilers that have more than 300 days of data in each respective year, which leaves 120,429 boilers providing data, for a total of nearly 400 k years (datapoints) of daily data. Over the period of 2019–2023, with boilers providing a minimum of 300 days of data per year, the median annual energy demand was 11,361 kWh.
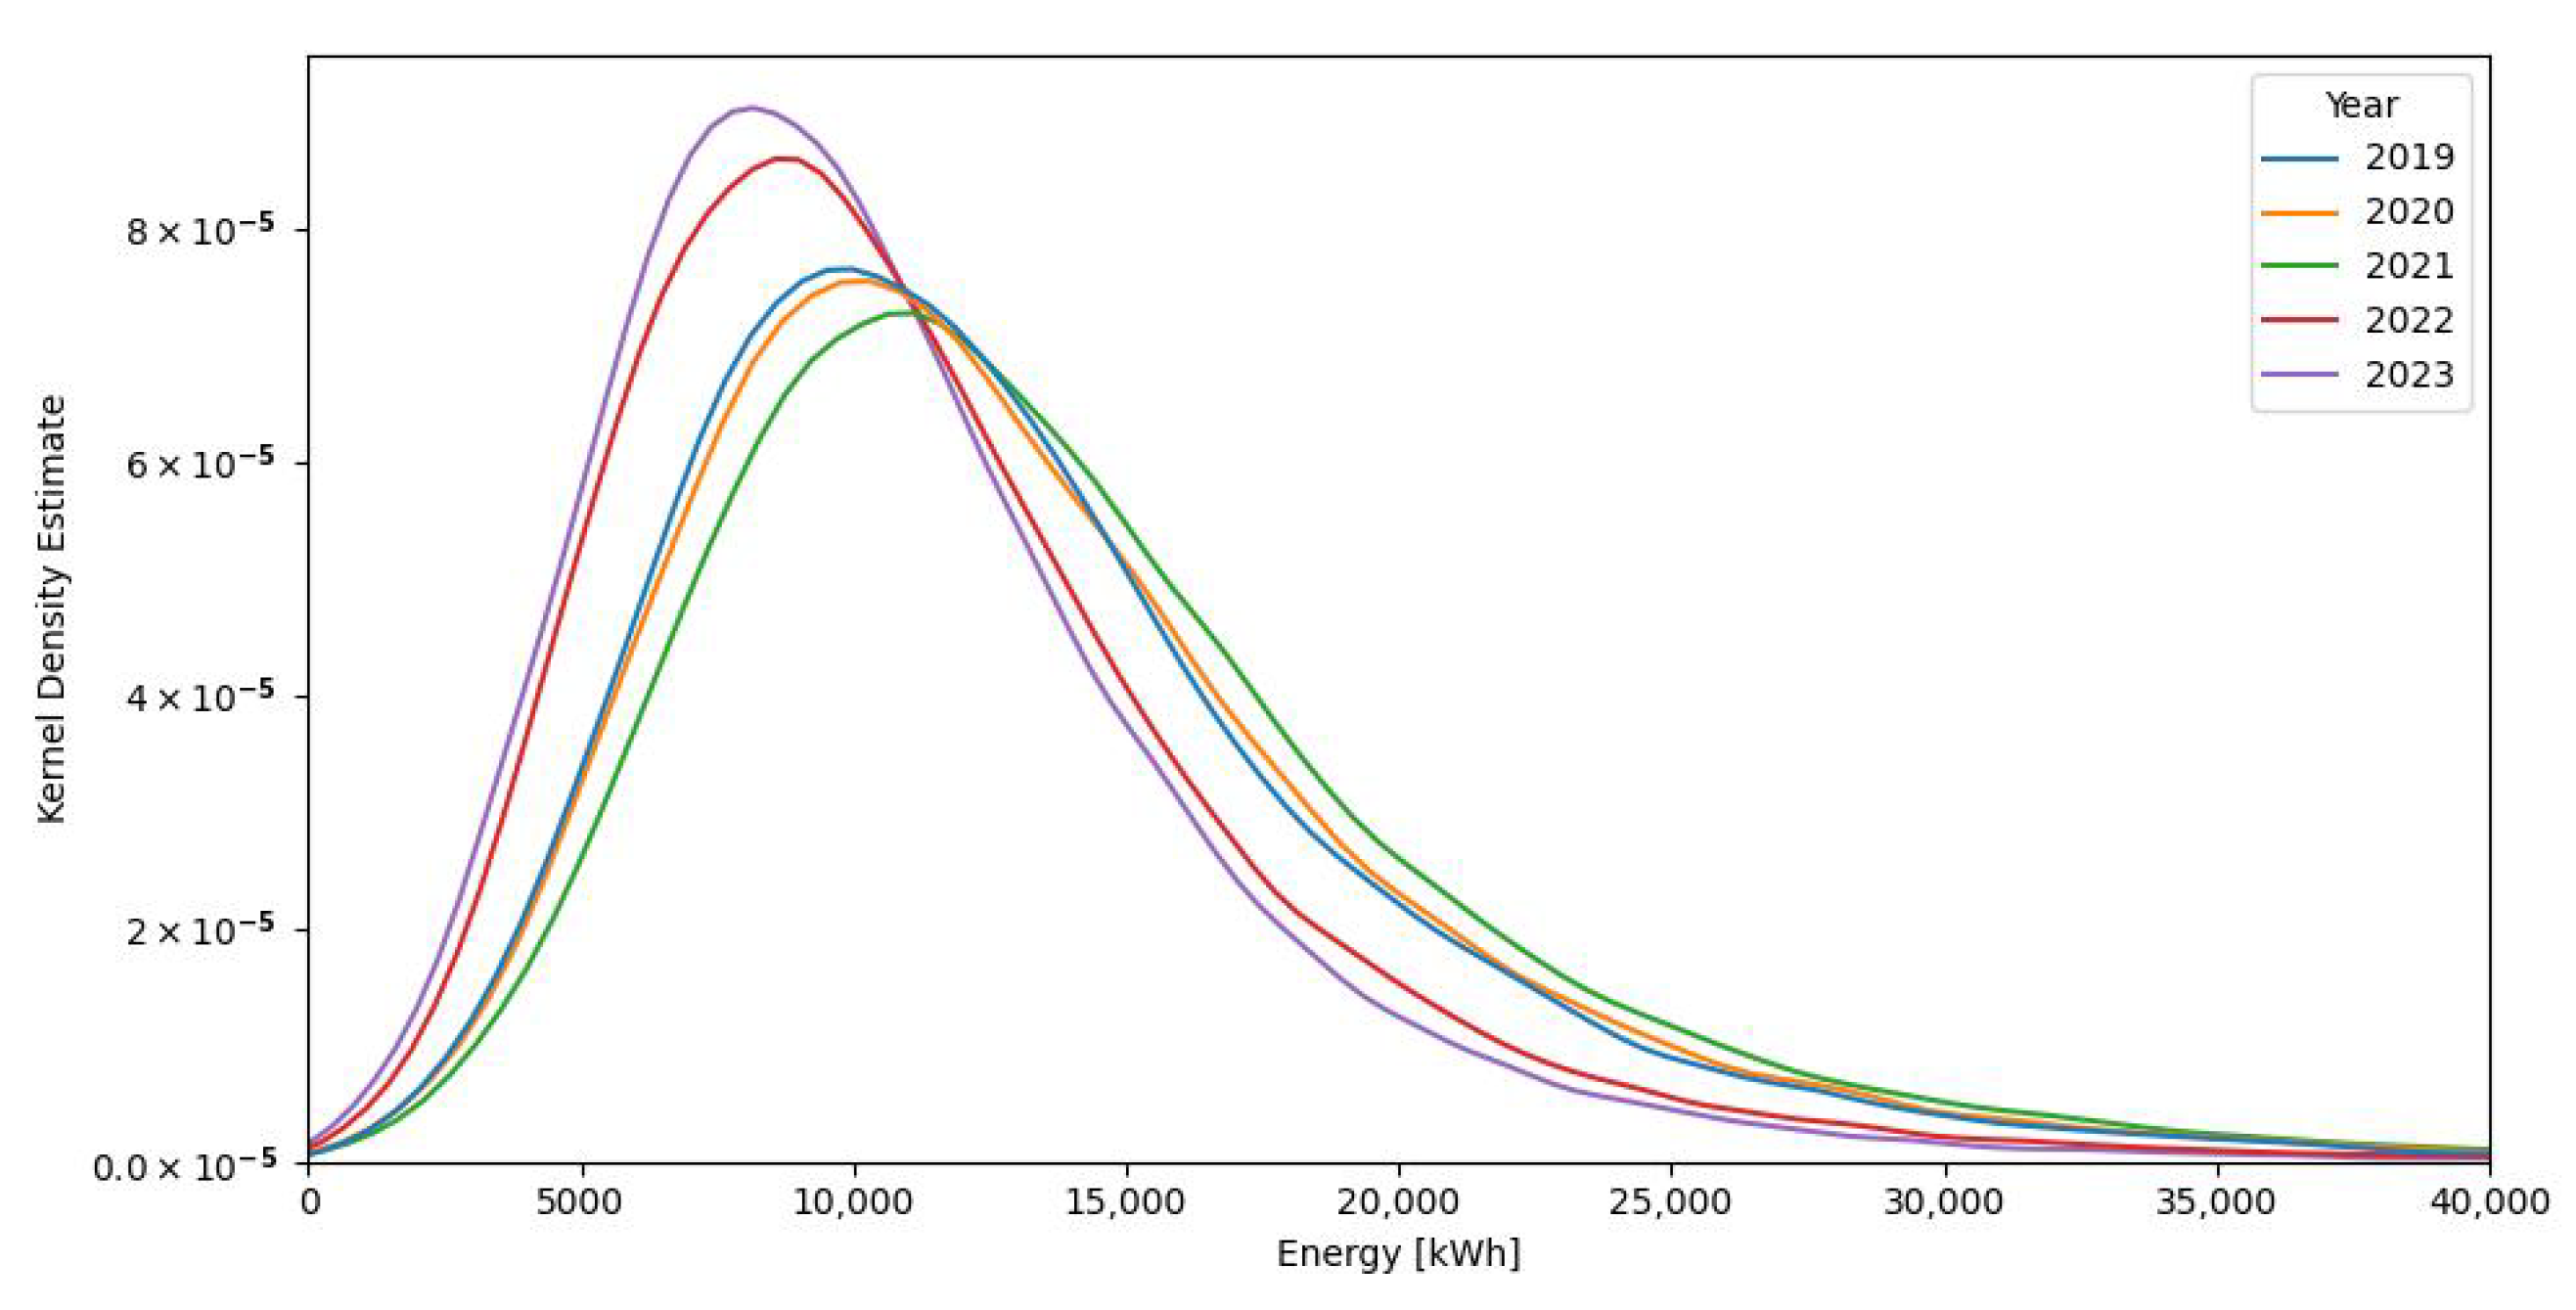
Figure 5 shows a kernel density estimation plot of the annual energy demand for each year 2019 to 2023 where the data are harmonised to account for different boiler counts in each of the years. Again, this chart uses data from boilers that have provided a minimum of 300 days of data in each respective year. The median energy demand values for each year can be seen in Table 4. Of the 120 k boilers used for Figure 4 and Figure 5, only 1797 (0.5%) of these years have annual gas demand greater than 40,000 kWh (beyond the x-axis cut-off). This fits inline with the report from DESNZ that showed that only 3% of domestic boilers had an annual gas consumption of over 30,000 kWh in 2022 [4].
Table 4 highlights that the peak kernel density estimate values of 2022 and 2023 are shifted to the left of previous years, indicating a shift to the lower median values. From 2019 through to 2023, the median annual energy demand increased slightly from 2019 to 2021—to a peak of 12,673 kWh, but from that point it decreased through 2022 and 2023, with median values of 10,165 kWh and 9682 kWh, respectively. This highlights how the annual demand from the consumers in the dataset has shifted since 2021. Not only are the median demand values shifting much lower than in previous years, but the KDE peak is higher, displaying that there is a significant number of consumers making this shift.
The original dataset from the manufacturer has 123 columns of data. However, most of these were not useful for this analysis and were dropped, leaving the five columns of data described in Table 5. These columns were important for several reasons, such as providing a unique boiler id value and the date of data that values were recorded for.
The column ‘CET’ (Central England temperature) in the analysis dataset is sourced from a Met Office dataset [23] and is linked to the boiler dataset based on the date of the data. The CET relates to the mean Central England temperature—daily averaged weather data that are calculated from three stations across England [24]. As the boiler dataset has no metadata attached to it (due to privacy), it is not possible to geolocate the boilers. A drawback of the CET dataset is it provides a single temperature value for the whole of England, which, although it is an indicator, it is likely to be a poor representative of localised temperatures. This has an inferred impact on the energy use, as the mean energy use across the dataset may not be representative of the external temperatures on a weighted temperature basis; therefore, the use of the CET dataset must be interpreted with some degree of caution.
Table 5 describes the columns used from the dataset for analysis, and Table 6 highlights the units used and some features of the data.

2.2. Method

The analysis has been split into different steps, each of which are dependent on the previous. The first is to analyse the change in annual energy demand across the five years from 2019–2023 to determine whether there has been a gradual decline or increase or if it has broadly remained the same.
The second stage is to recognise whether there is any similarity in the changes in energy demand between hot water demand and space heating demand or whether a change in demand has been more pronounced in one or the other.
Thirdly, the analysis is centred around exploring whether the changes in natural gas demand, both for hot water and space heating, are related to the independent variables of external temperature and changes in the price cap in the UK.

3. Results and Discussion

3.1. Comparing Annual Energy Demand

Table 7 displays the mean annual hot water and space heating demand, alongside the total annual demand and the respective percentage breakdown of the two demand fractions. The final two columns contain the number of positive heating degree days (HDDs) per year and the annual mean HDD values, calculated from the CET values. A heating degree day figure is the value given for the number of degrees the daily temperature is below 15.5 °C [25]—with a temperature of greater than 15.5 °C returning a value of 0, as no heating is required. For example, a value of 12 °C and 17 °C give HDDs of +3.5 and 0 respectively. The number of HDDs across a year, combined with the average HDD value, is a general indicator of the number of days that space heating will be used—with a higher HDD count or higher mean HDD value leading to higher usage. Counterintuitively, a higher mean HDD value signifies that it has been colder throughout the year, whereas conversely, a higher total of positive HDD values dictates that there have been a greater number of cold (less than 15.5 °C daily mean) days in the year.
Table 7 demonstrates that 2021 had the greatest mean total demand and greatest mean space heating demand across this period—this was likely due to a combination of the joint highest mean HDD value of 5.6 whilst having the second lowest HDD count of 278. This indicates that space heating was likely used on fewer days, but due to the lower temperatures, the demand on these colder days was considerably higher, leading to the mean demand for space heating to be greater across 2021. The year 2020 had the greatest mean hot water demand, which was likely due to the highest HDD count of 292 and also potentially further rising due to COVID-19 and increased working from home across 2020. Table 7 also shows that there was an increase in domestic gas demand from 2019 through to 2021, followed by a large drop in the 2022 and 2023 demand values. When looking at the percentage split between hot water and space heating demand, the split between the two has remained broadly similar, with the 2023 domestic hot water demand contributing 11% of the total demand for gas from the boilers, 2% lower than the DHW contribution in 2019 (13%).

3.2. Comparing Hot Water and Space Heating Demand

Initially, by looking at Table 7, conclusions can be drawn on trends in gas demand for both space heating and hot water demand.
For domestic hot water demand, the peak demand year was 2020 (1747 kWh)—with demand decreasing ever since. The greatest drop in year-on-year demand came between 2021 and 2022, with a 223 kWh (13%) decrease from the previous year’s gas demand for DHW. The 2023 value for DHW demand is 459 kWh less than the value seen in 2019 (27% decrease). Despite a rise in demand in 2020, there has still been a significant overall decrease in DHW demand since 2019.
For domestic space heating mean demand, the peak year was in 2021 (12,534 kWh)—with values rising until 2021 and decreasing from this point on. The greatest drop in year-on-year demand came between 2021 and 2022, with a 2526 kWh (20% decrease). The 2023 value for DSH demand is 2267 kWh less than the value seen in 2019 (19% decrease)—showing that despite a rise in demand over 2020 and 2021, there has still been an overall decrease in DSH demand since 2019.
When comparing the difference in the values of hot water and space heating demand from 2019 to 2023, it is evident that there has been a bigger absolute drop in space heating demand (2267 kWh) than hot water demand (459 kWh).
However, it is also important to consider the percentage that each demand fraction has contributed to the overall sum of gas demand. In 2019, DHW contributed 13% (DSH 87%), and this value has fluctuated around this value, ending on 11% in 2023 (DSH 89%). This illustrates that despite there being a greater decrease in energy values of the space heating demand of the overall gas demand, space heating demand is contributing more to the total energy demand—and therefore, hot water demand is starting to contribute less to the total energy demand.
Table 8 highlights the mean daily energy demand for both demand vectors and the shift observed between the years of 2019 and 2021 and 2022 to 2023. This table again emphasises this shift in demand and how the percentage change in hot water demand is greater than that seen for space heating demand.
This difference in daily demand—seen for both DSH and DHW—highlights how there has been a behavioural shift due to the rising energy prices. If the percentage difference was much greater for DSH than DHW, it would be likely that the shift was seen due to temperature; however, this is not the case—hence, the proposition that the shift is due to behavioural changes based on the energy crisis and enhanced building efficiency.

3.2.1. Mean Demand per Month

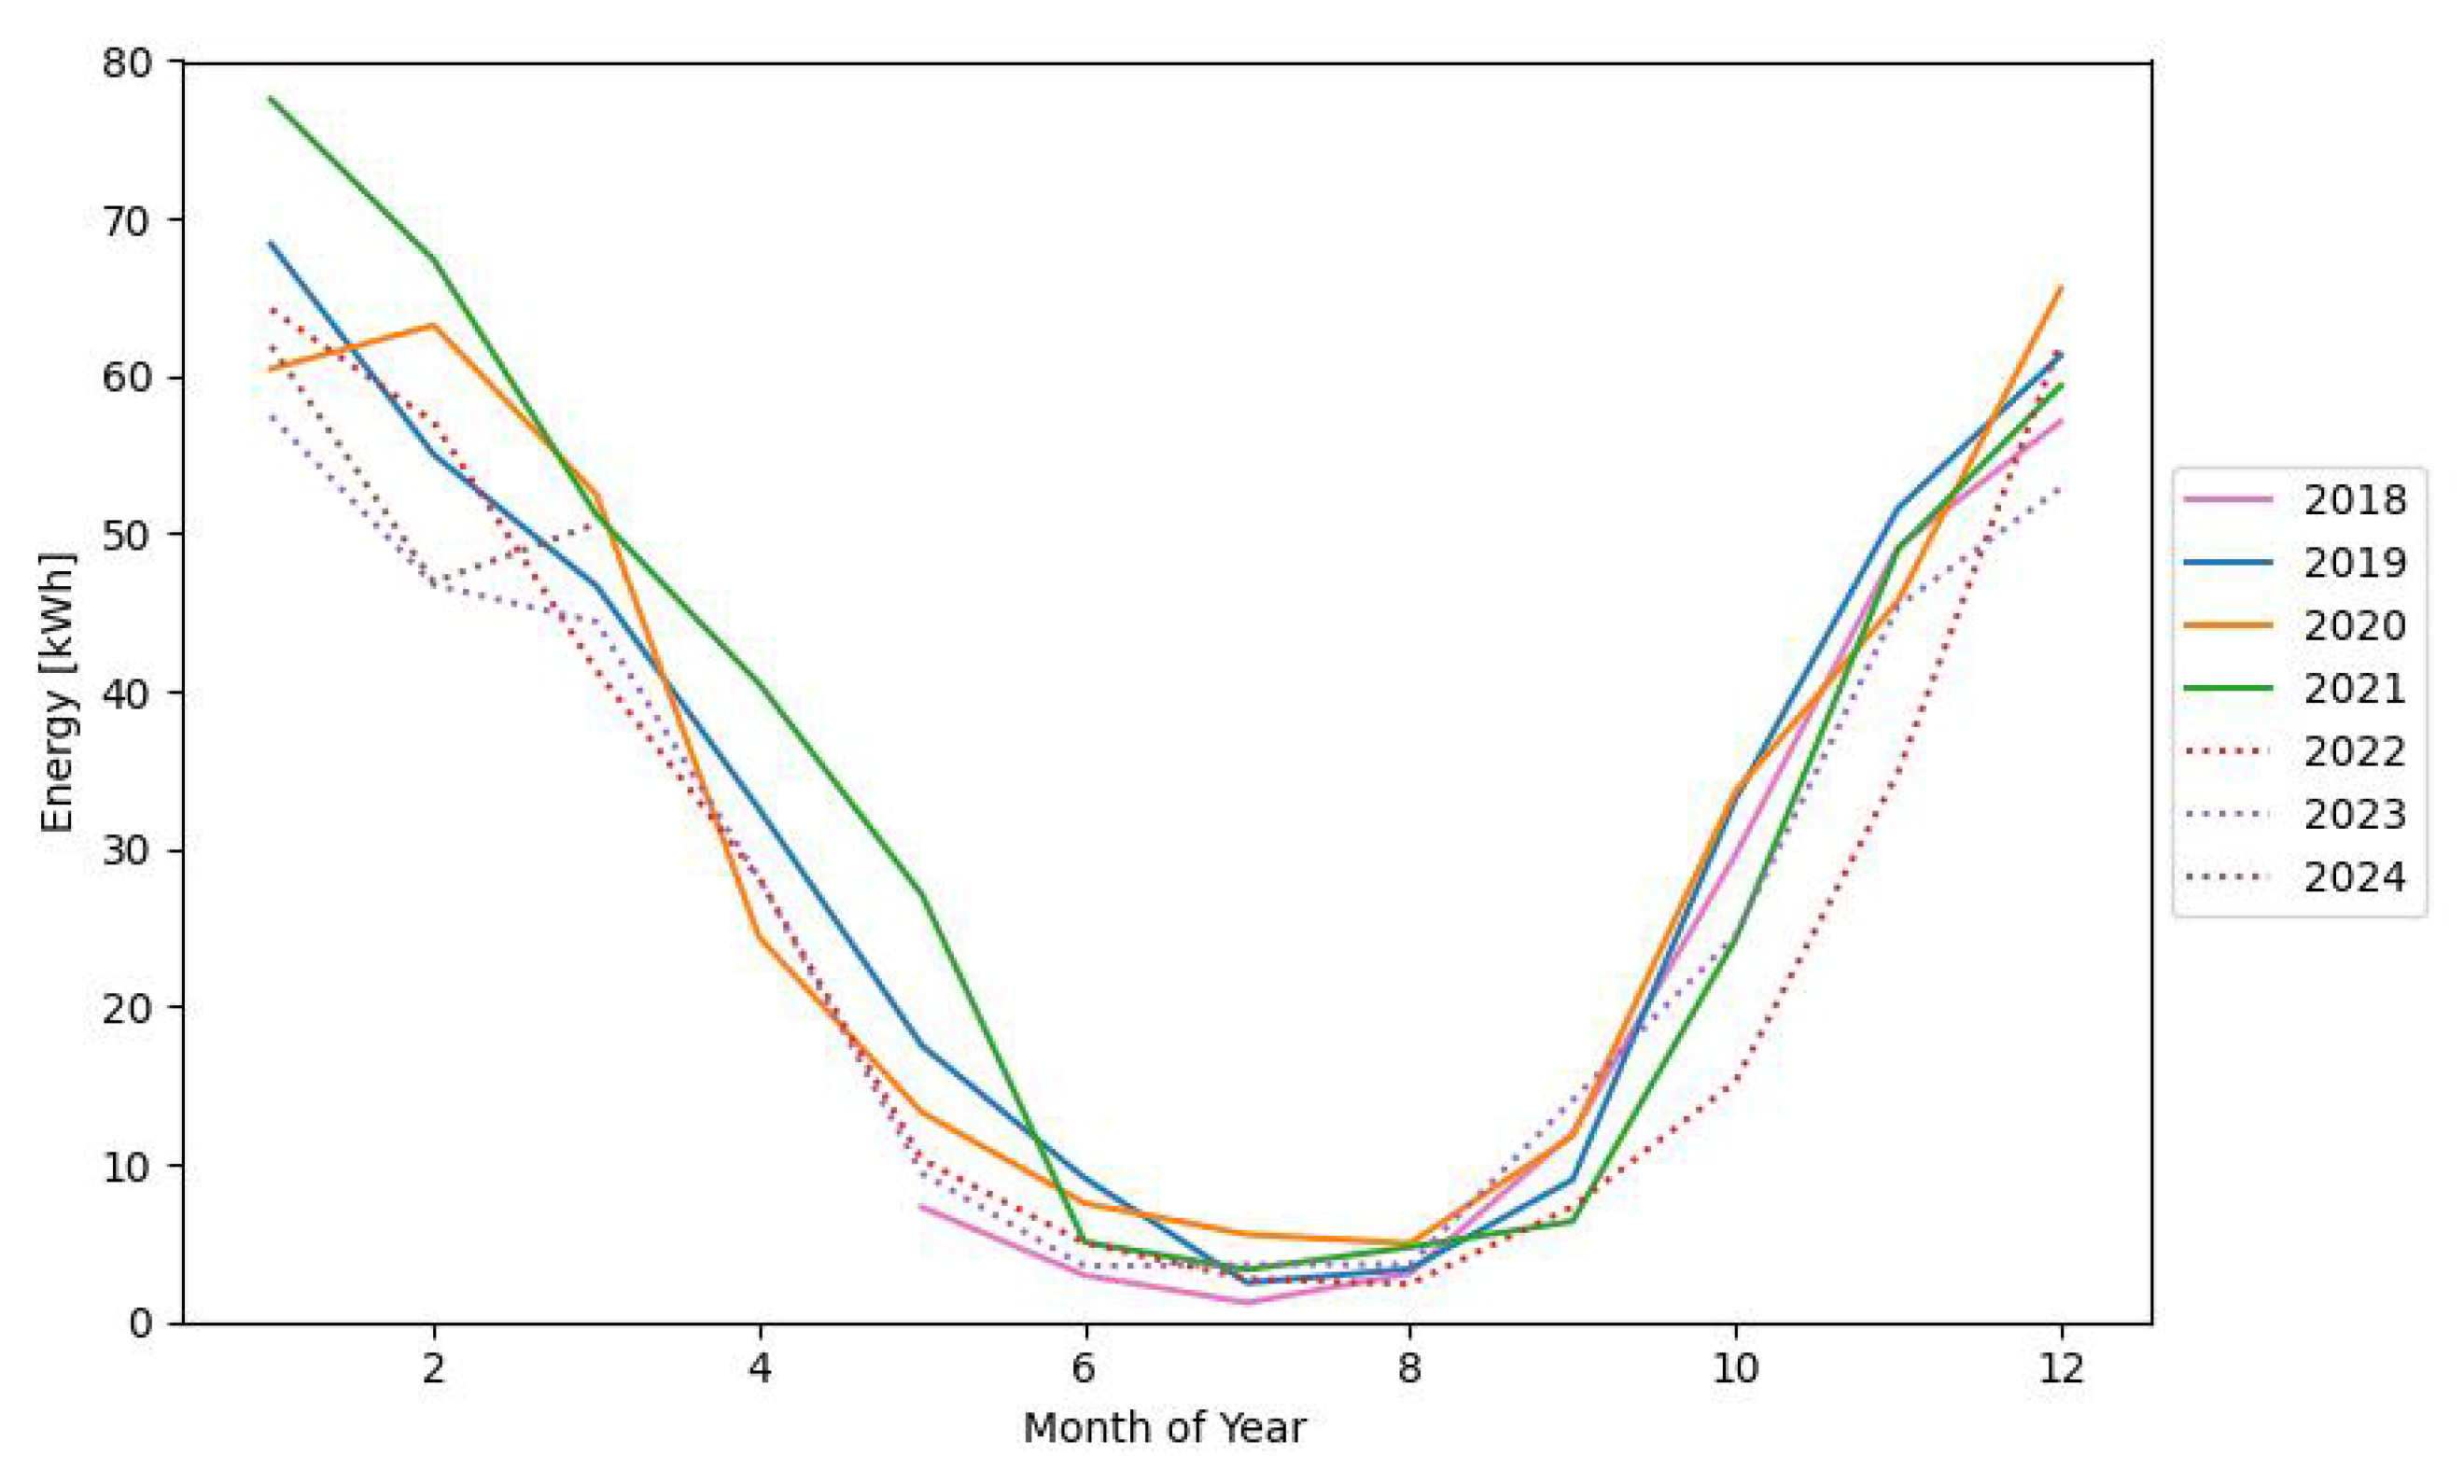
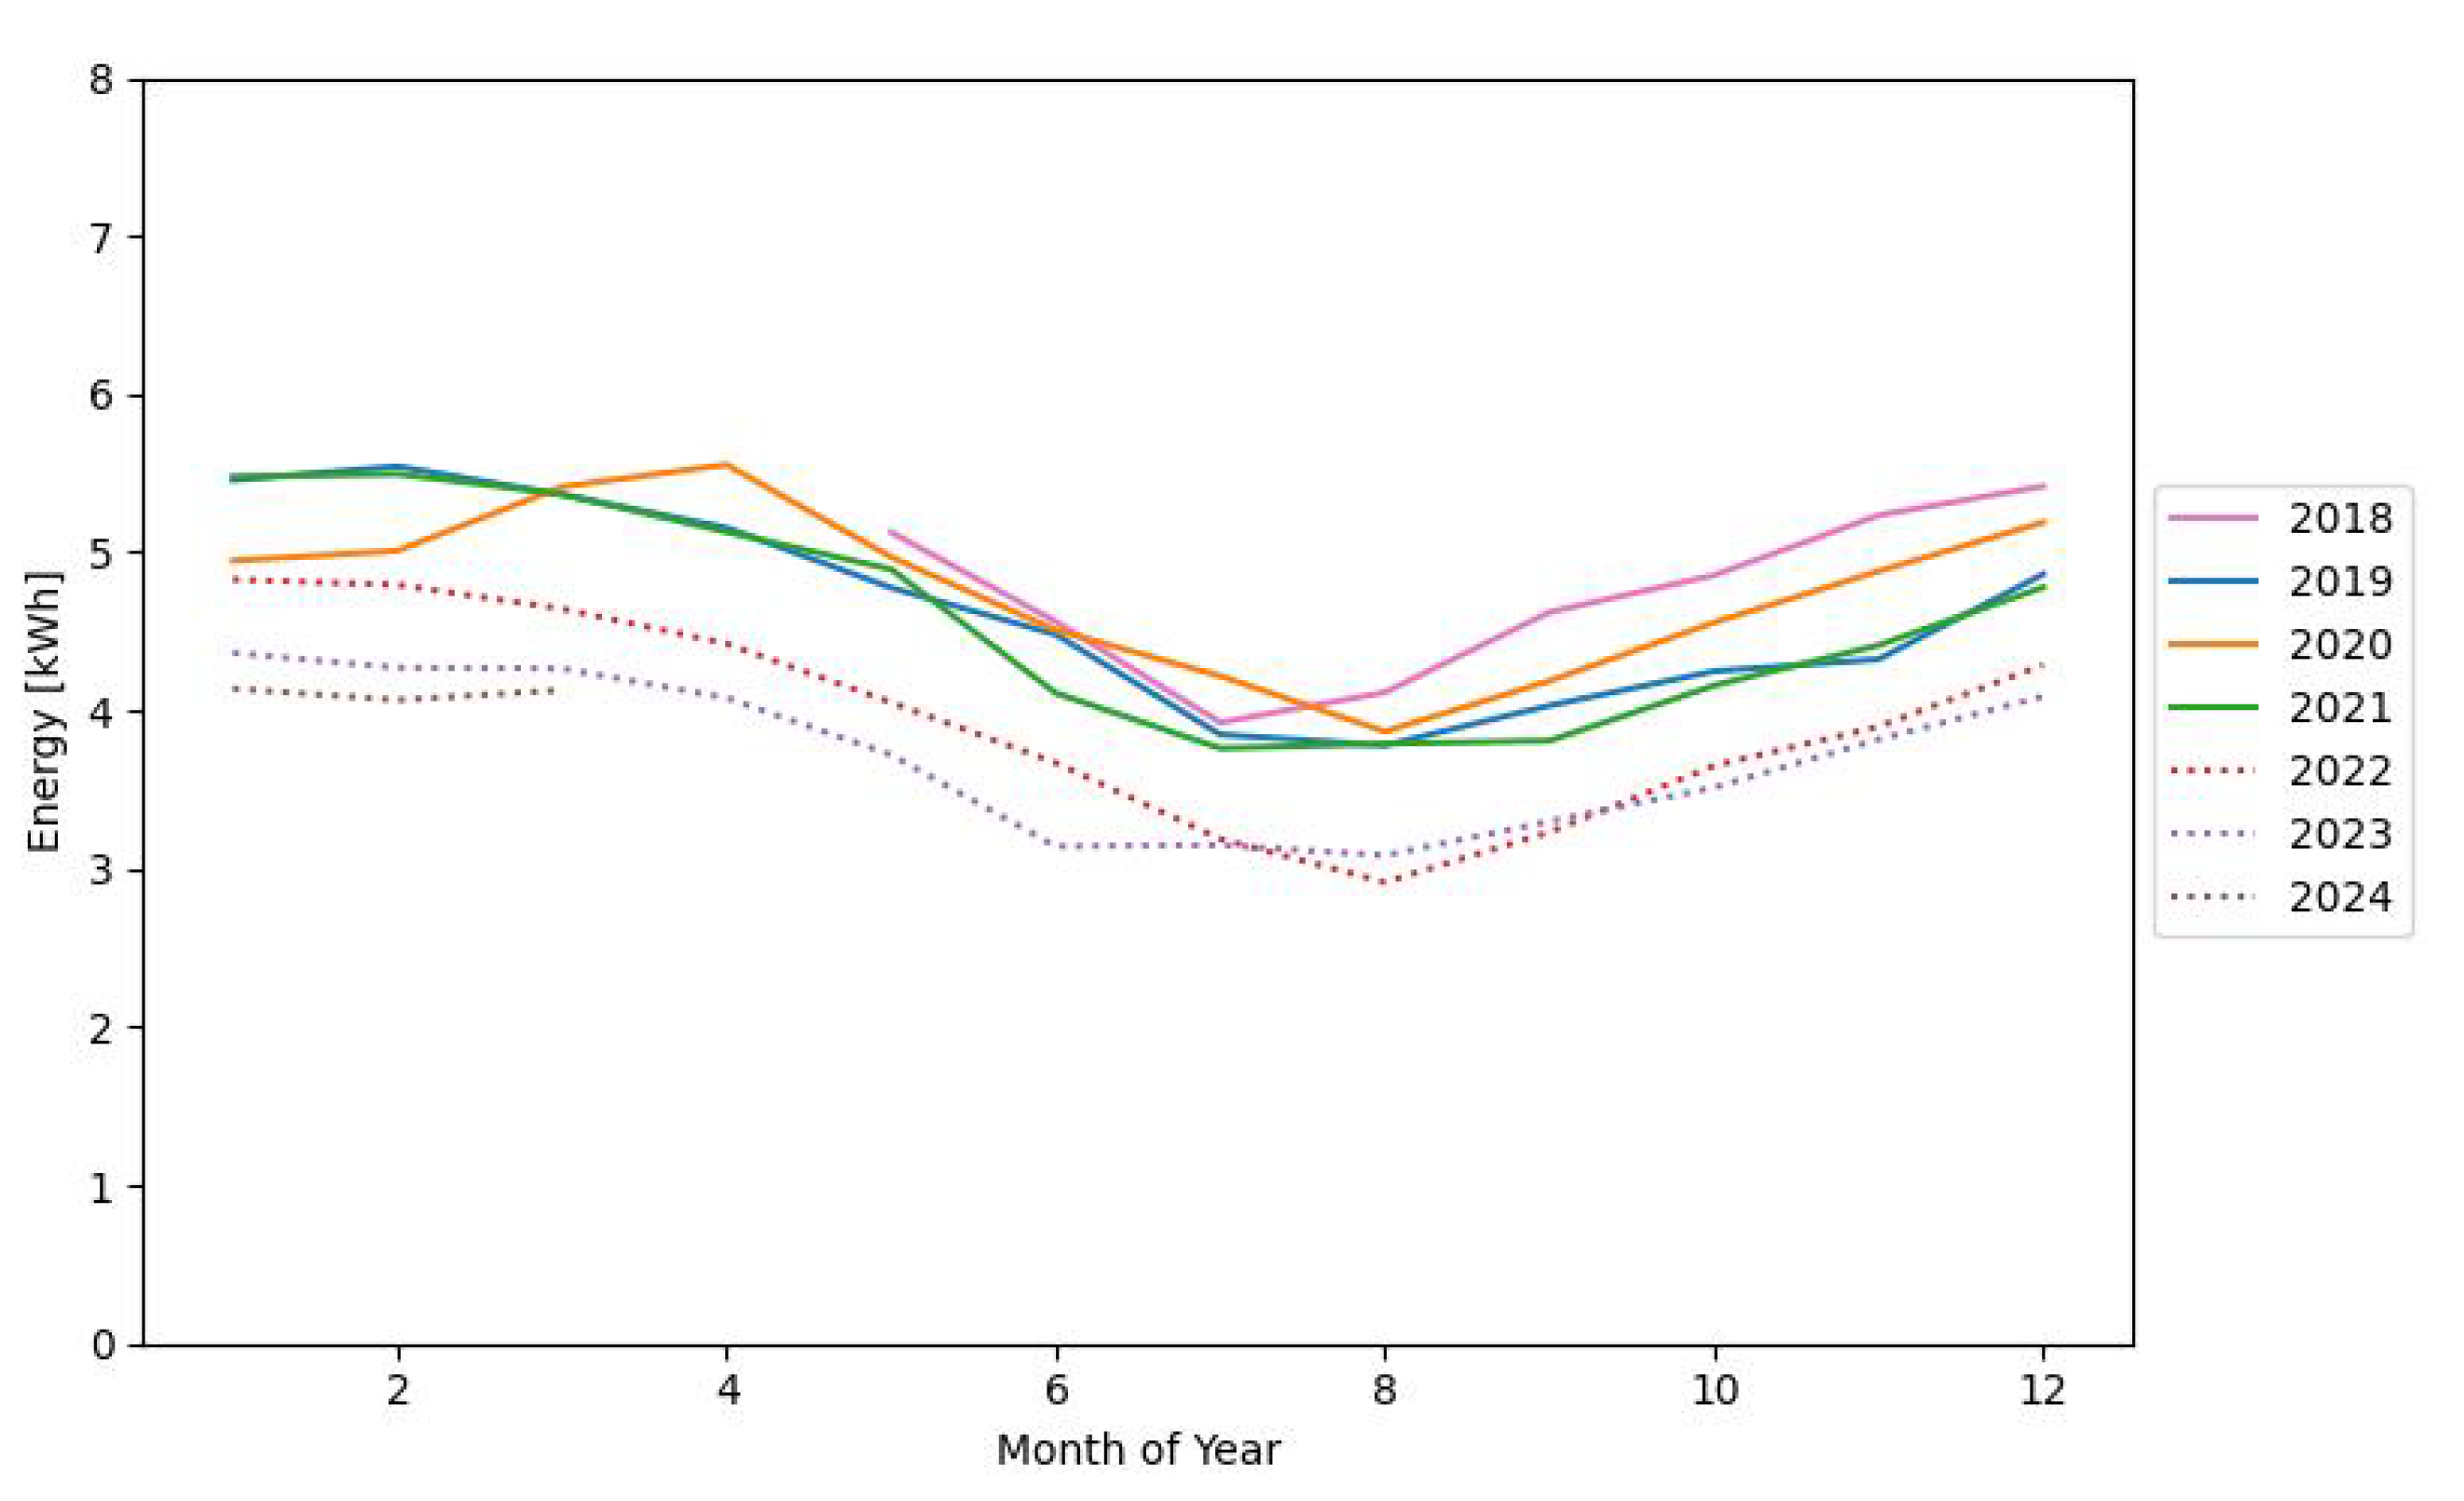
Figure 6 plots the mean daily energy demand for space heating for each month of the year from 2018 through to 2024, whilst Figure 7 plots the mean daily energy demand for hot water for each month of the year from 2018 through to 2024.
Figure 6 shows that the mean monthly space heating demand fell across 2022 (red), 2023 (purple) and 2024 (brown). It is clearer to see that the mean monthly hot water gas demand from 2022 to 2024 is lower than all the previous years. The 2020 (orange) line has several outliers from March through to May. This is likely due to the COVID-19 lockdowns across the UK during this period, with consumers using more hot water than usual for hand washing in particular. By grouping the years 2019, 2020 and 2021 together and 2022 and 2023 together, Table 8 shows how there has been a shift in the demand profile, highlighted by Figure 6 and Figure 7. Table 8 shows that despite the distance between the 2019–2021 and 2022–2023 lines appearing much larger in Figure 7 (due to the steadiness of DHW demand compared to the seasonality of DSH demand), the percentage change between these two groups is similar across the two demand types—15% for DSH, and 17% for DHW. This is despite the absolute difference in mean daily demand across 2019–2021 and 2022–2023 being larger for DSH (4.8 kWh) compared to that of the absolute difference in DHW (0.8 kWh). This further explains how the percentage makeup of DSH and DHW for the total annual demand has remained consistent throughout (Table 8—11–13% for DHW, 87–89% for DSH).

3.2.2. Mean Demand per Weekday

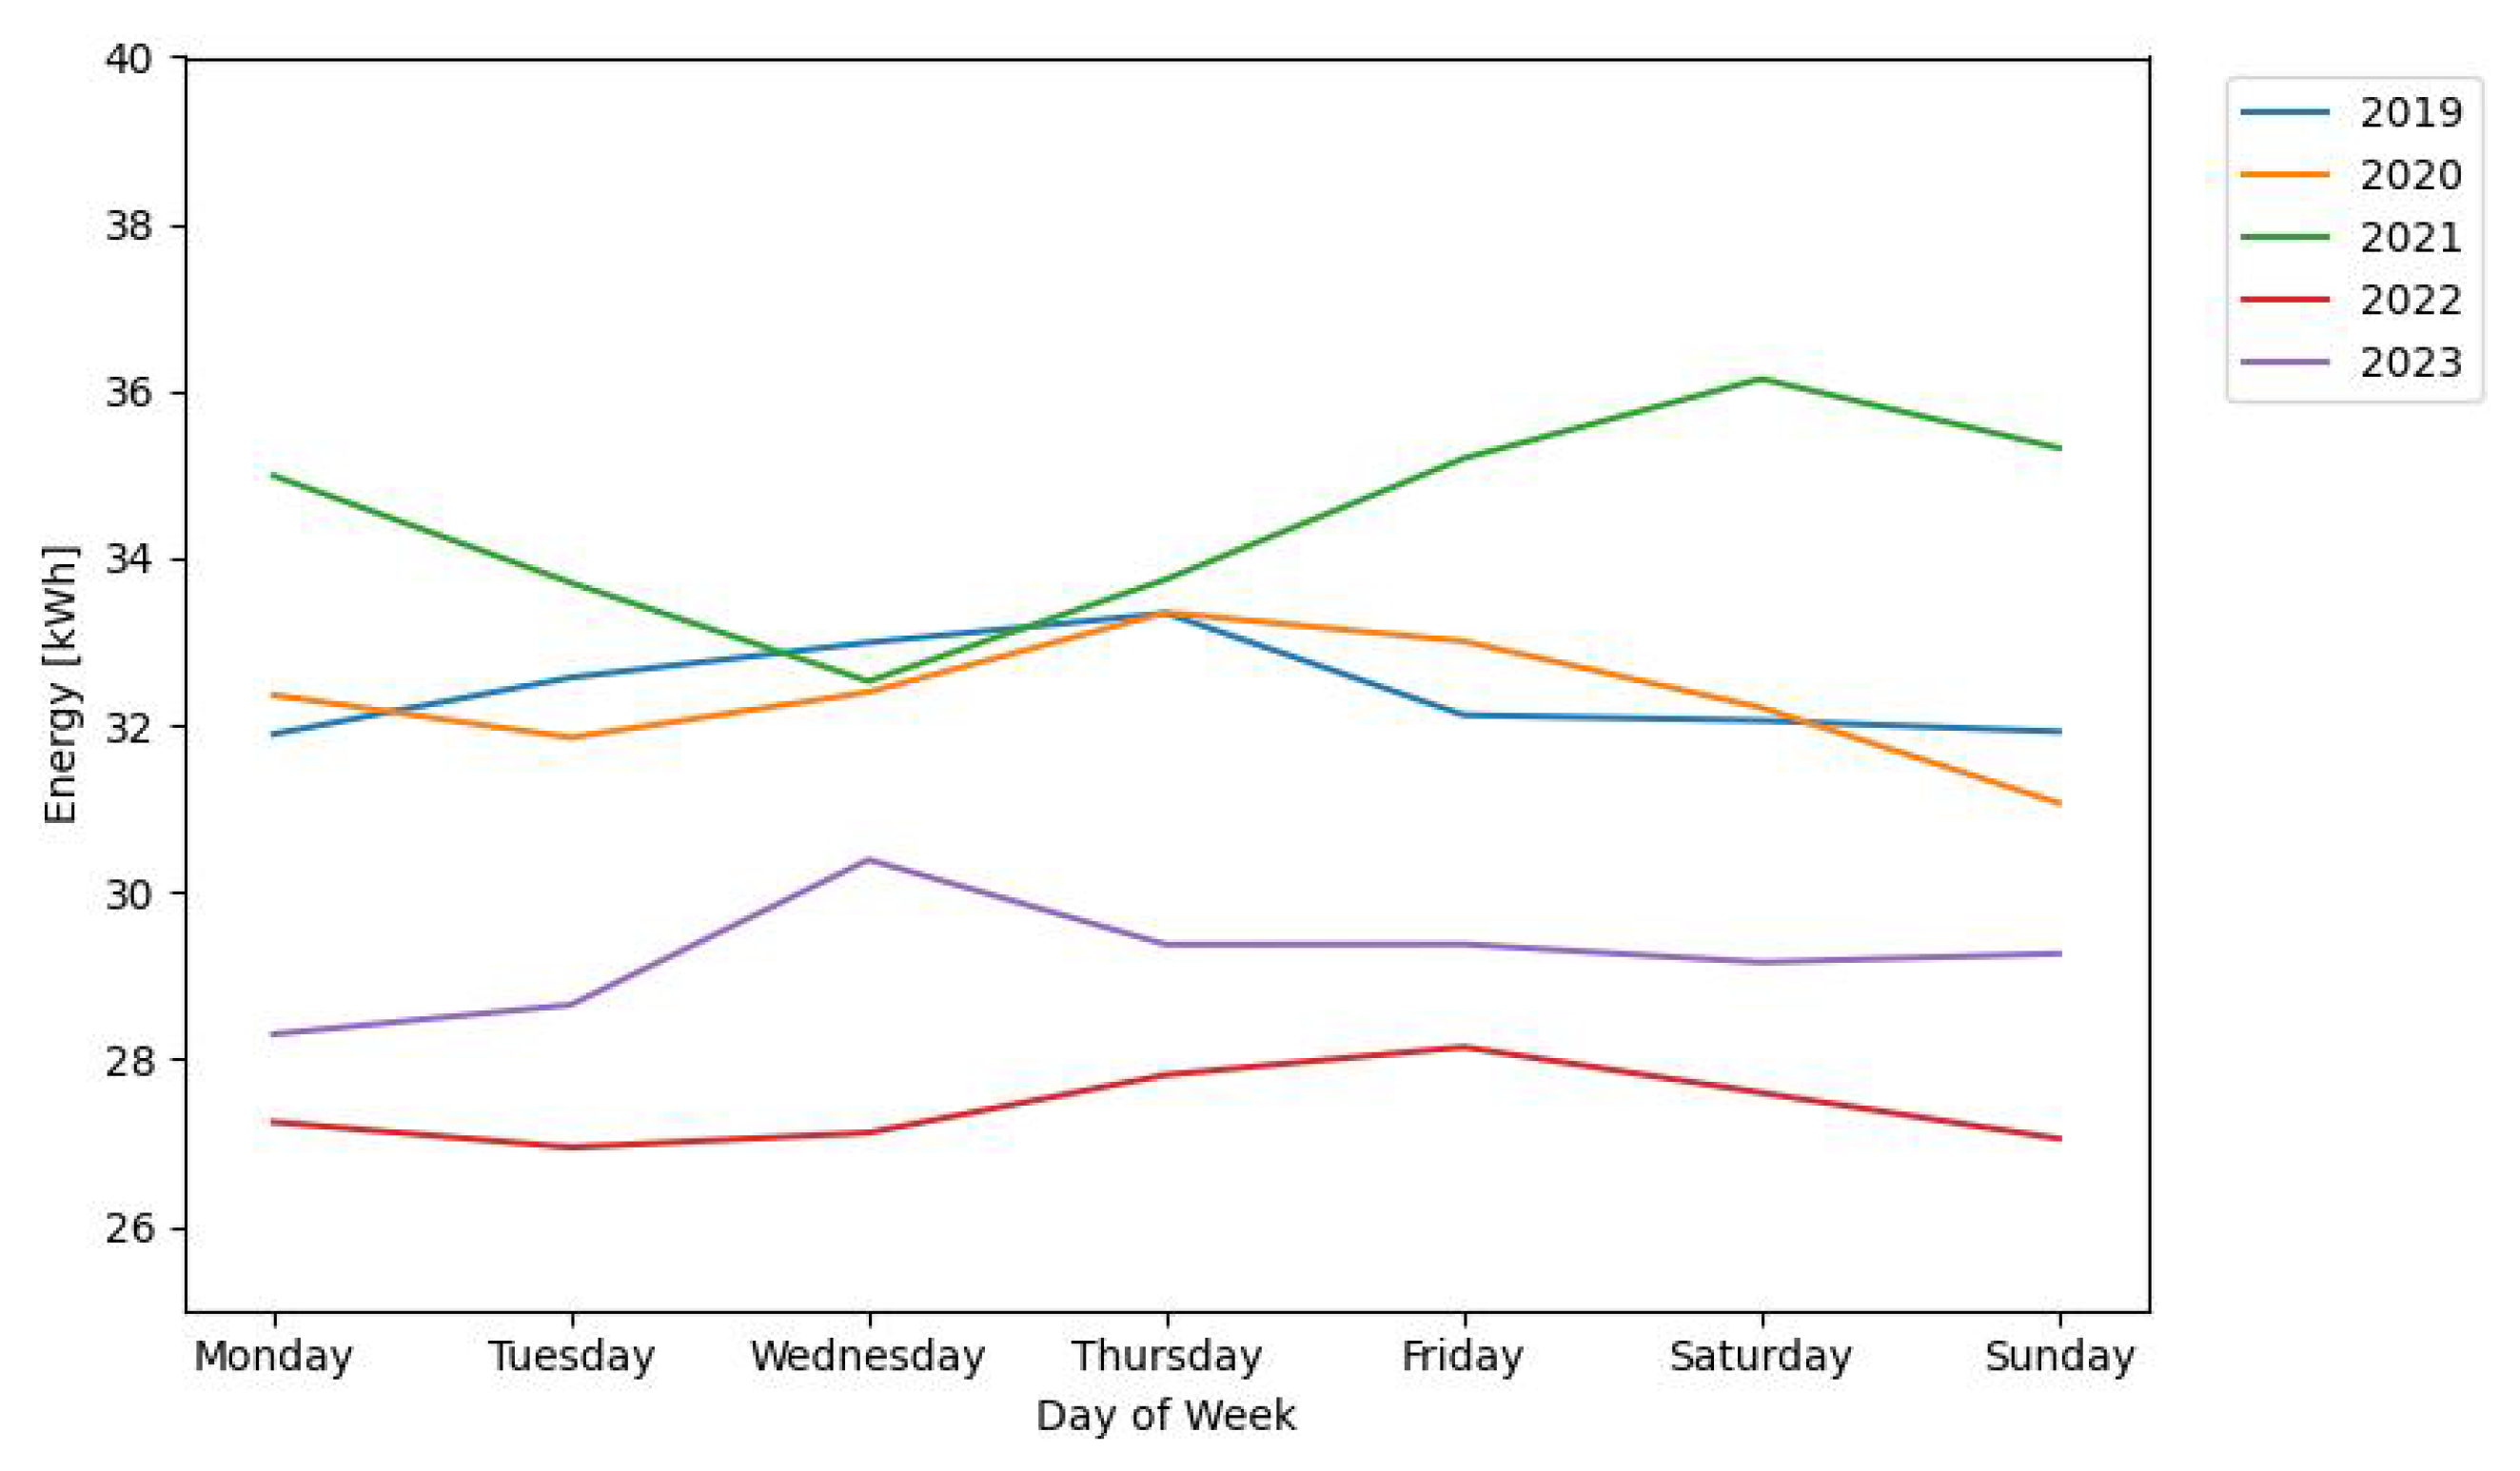
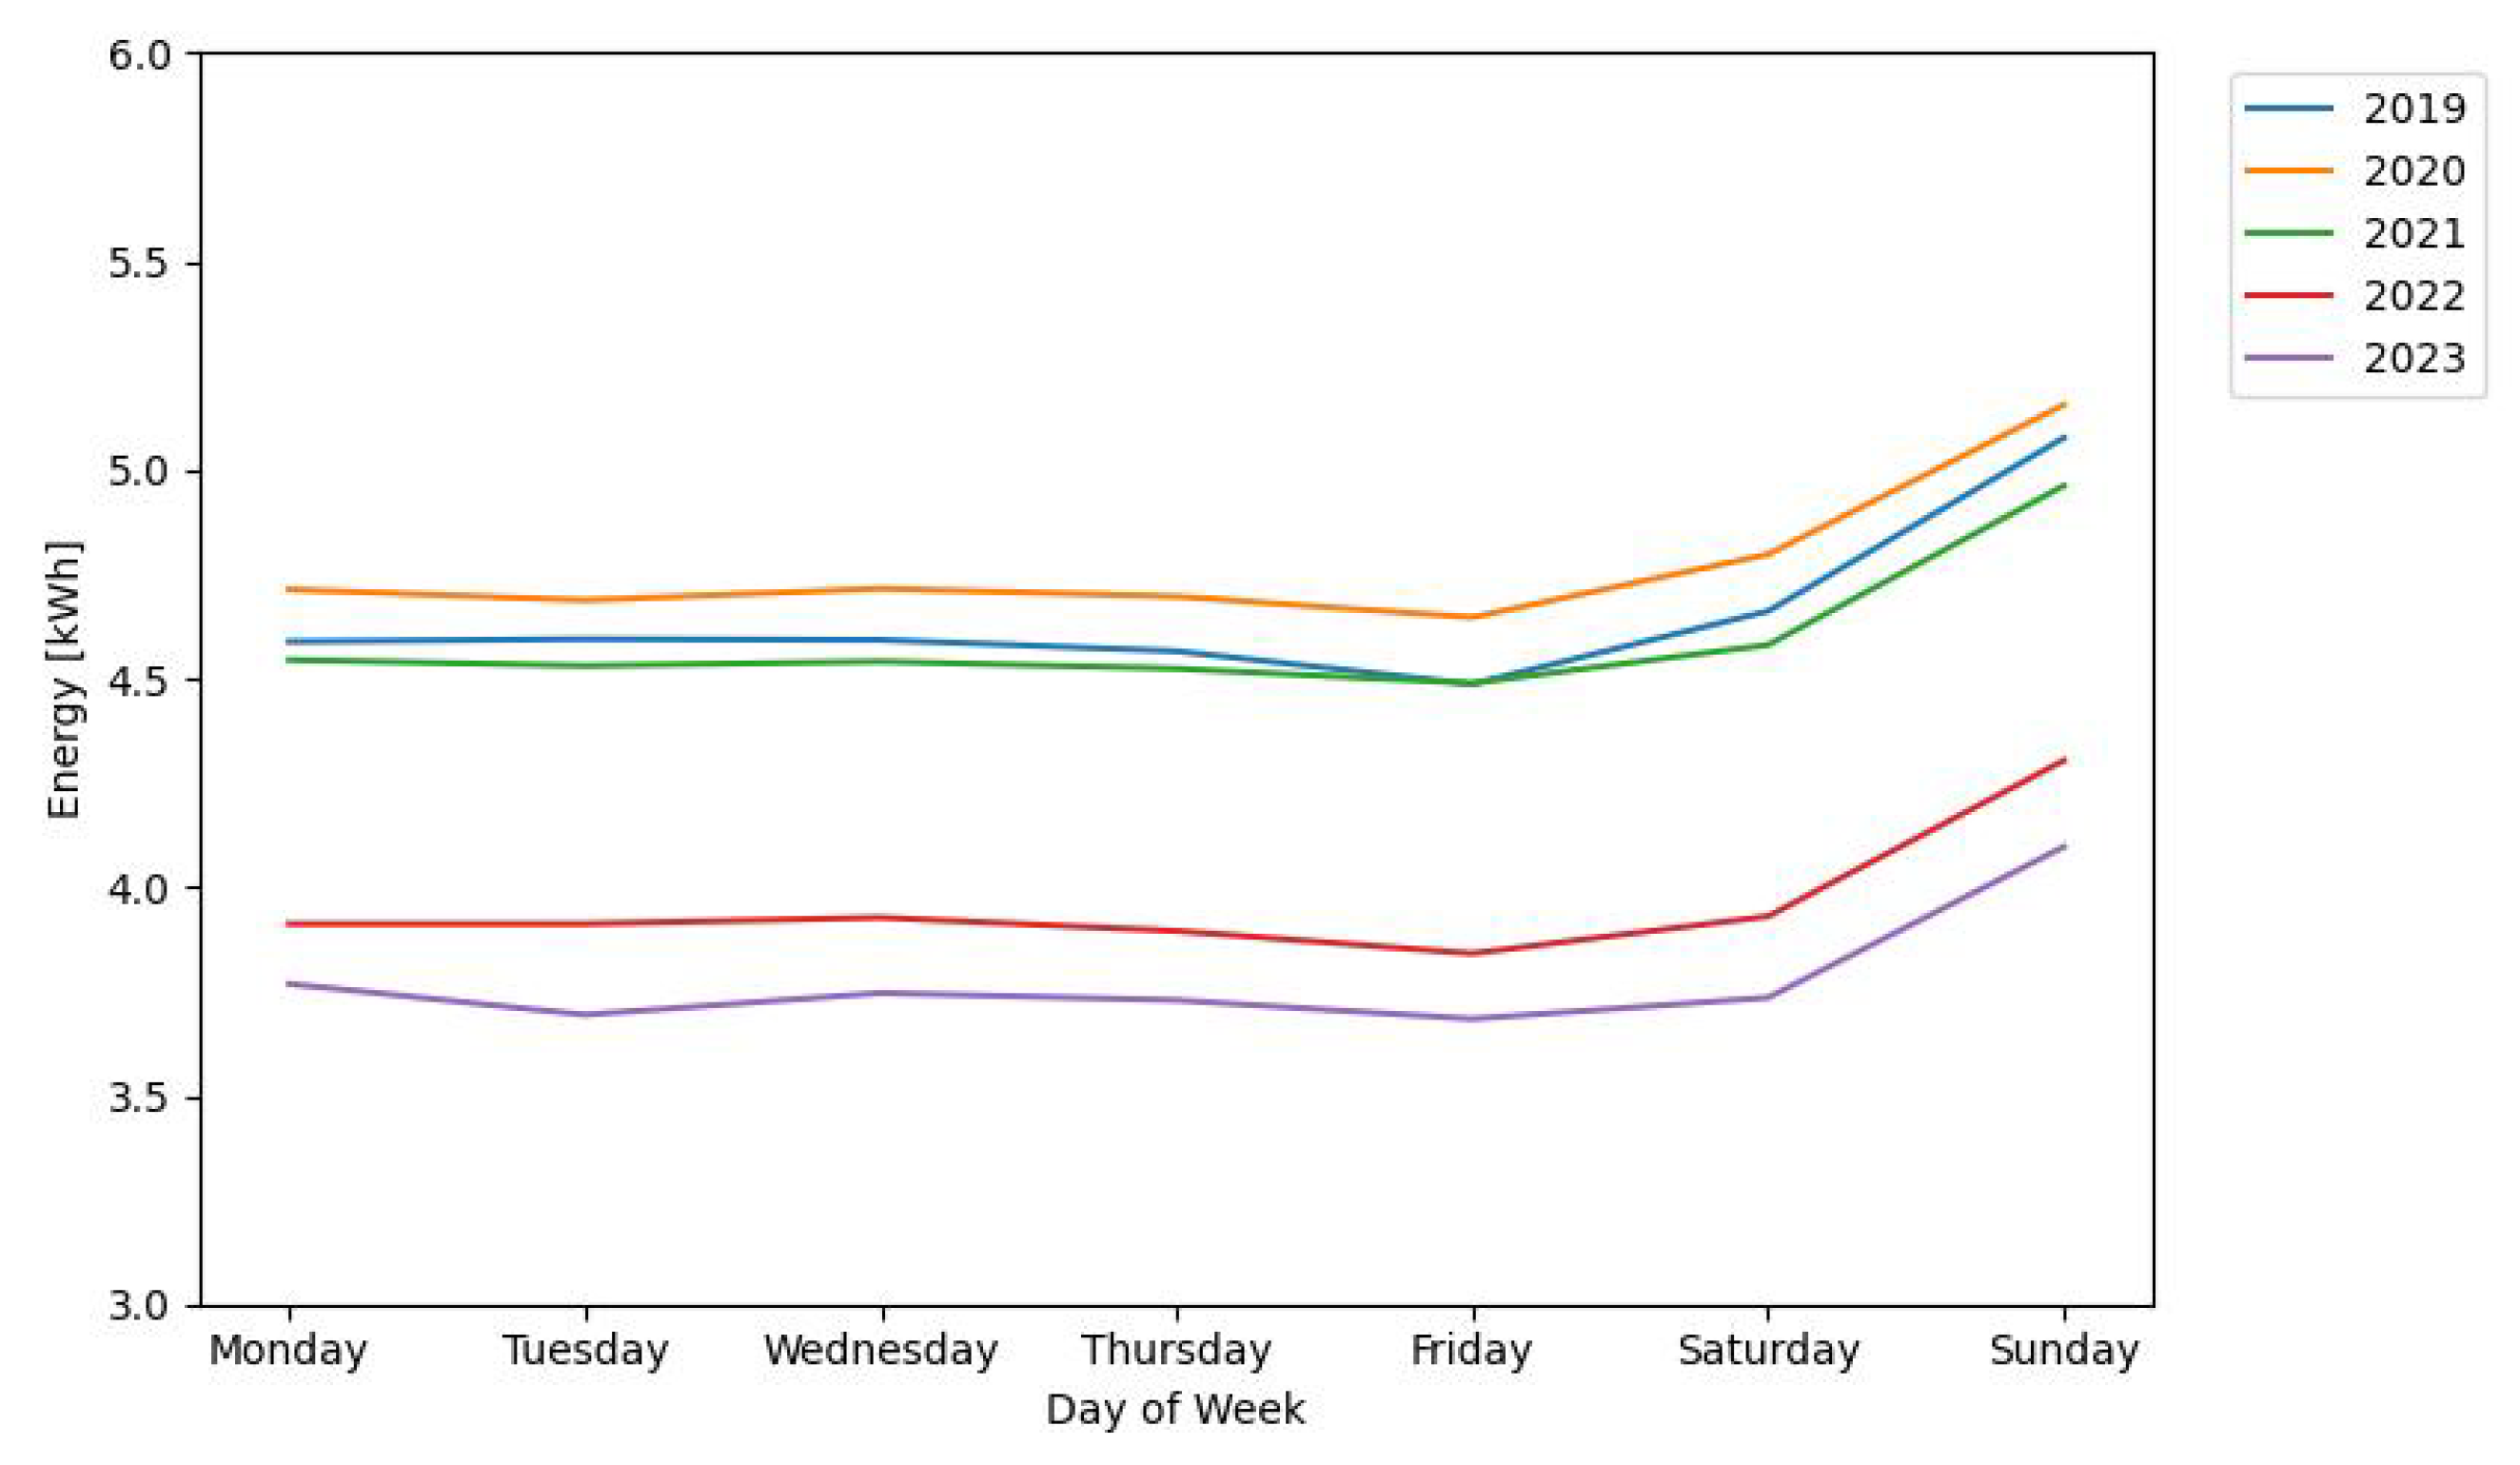
The trend of decreasing gas demand is also displayed in Figure 8 and Figure 9. These charts, which show the mean heating demand per weekday from 2019 to 2023, highlight how the demand in 2022 and 2023 has consistently been below that of 2019–2021, confirming the data seen in Table 8.
From Figure 8, there appears to be no clear weekday trend for DSH, nor any trend on any given day of the week—only a clear drop in demand since 2021.
Figure 9 shows the mean DHW demand per weekday from 2019 to 2023. This reiterates the trend of a step change in demand lower after 2021, which can be seen clearly and consistently. For domestic hot water demand, there is a visible trend across each of the years that demand is consistent for each of the weekdays, followed by an increase in demand for Saturday and a further increase again for Sunday. This has been seen across each of the years from 2019 through to 2023, with a clear decrease across all days in demand levels after 2021, providing additional insights to the data from Table 8.

3.3. Impact of Central England Temperature on Demand

The variation in boiler heating demand is highly influenced by the external temperature—and therefore, the amount of energy required to keep an internal temperature of the dwelling within a particular comfort range (depending on a particular set of conditions between household preferences and building characteristics). This change in external temperature has less effect on the demand for hot water but a significant impact on the demand for space heating demand.
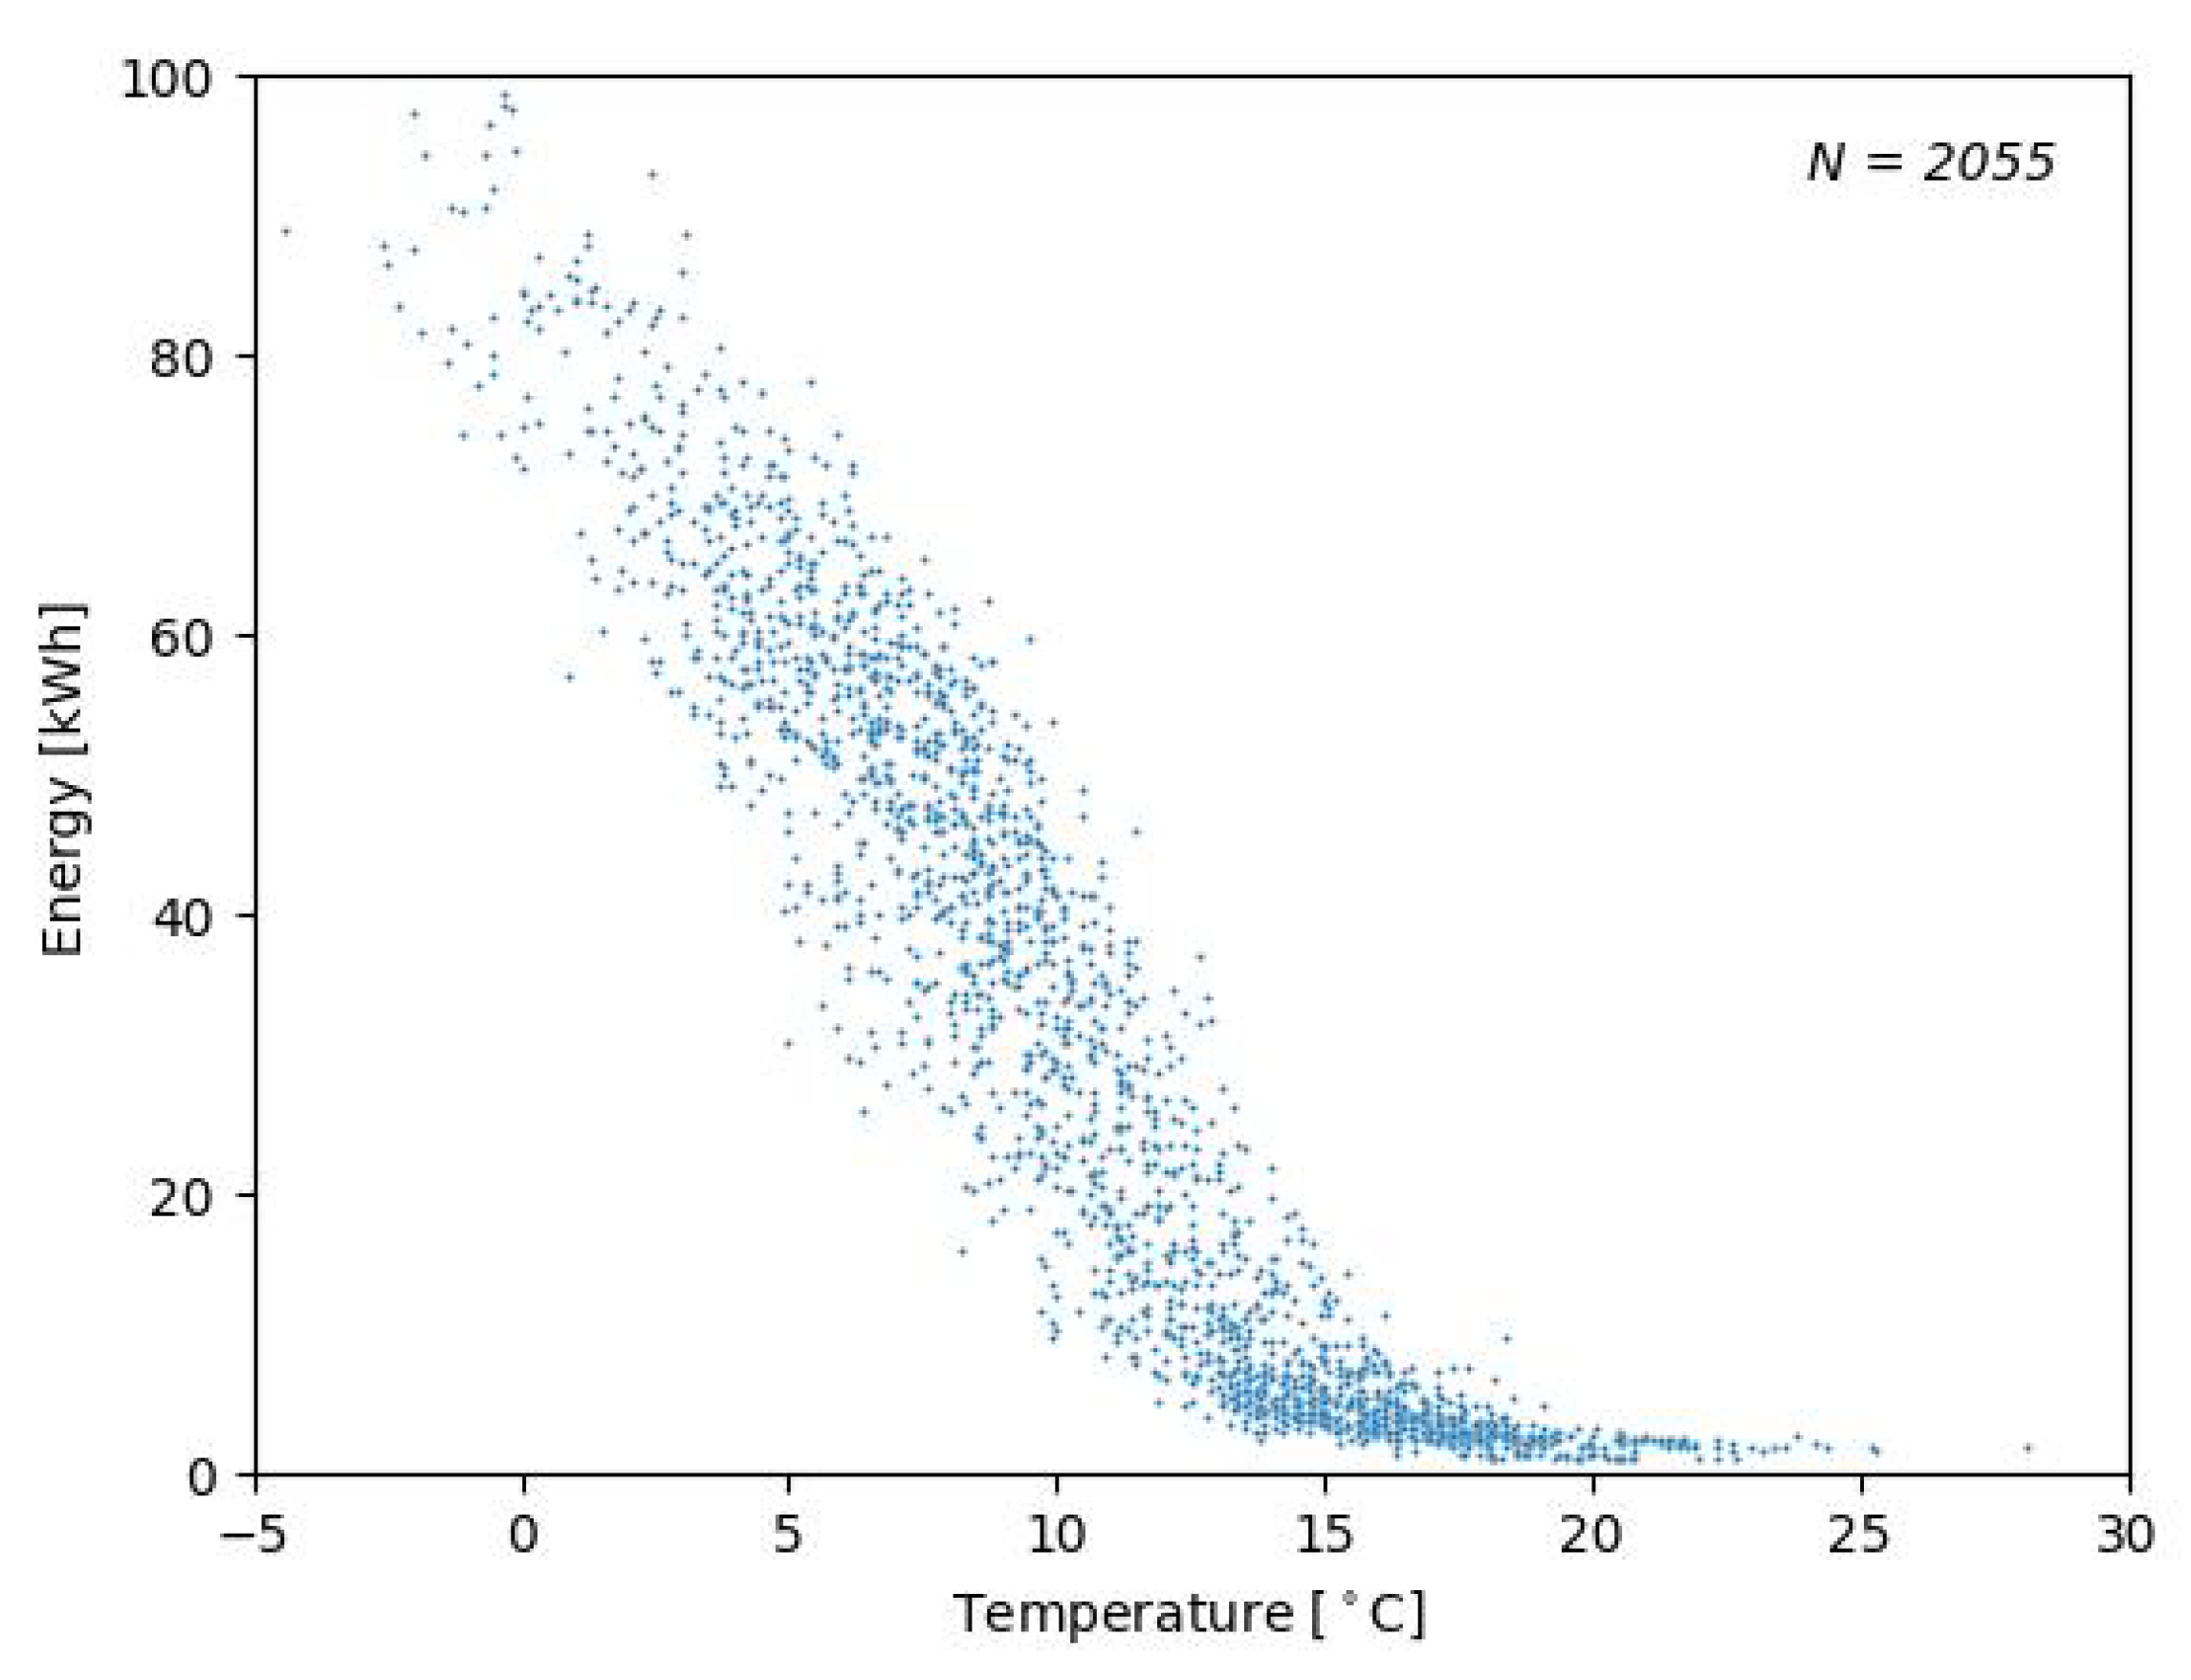
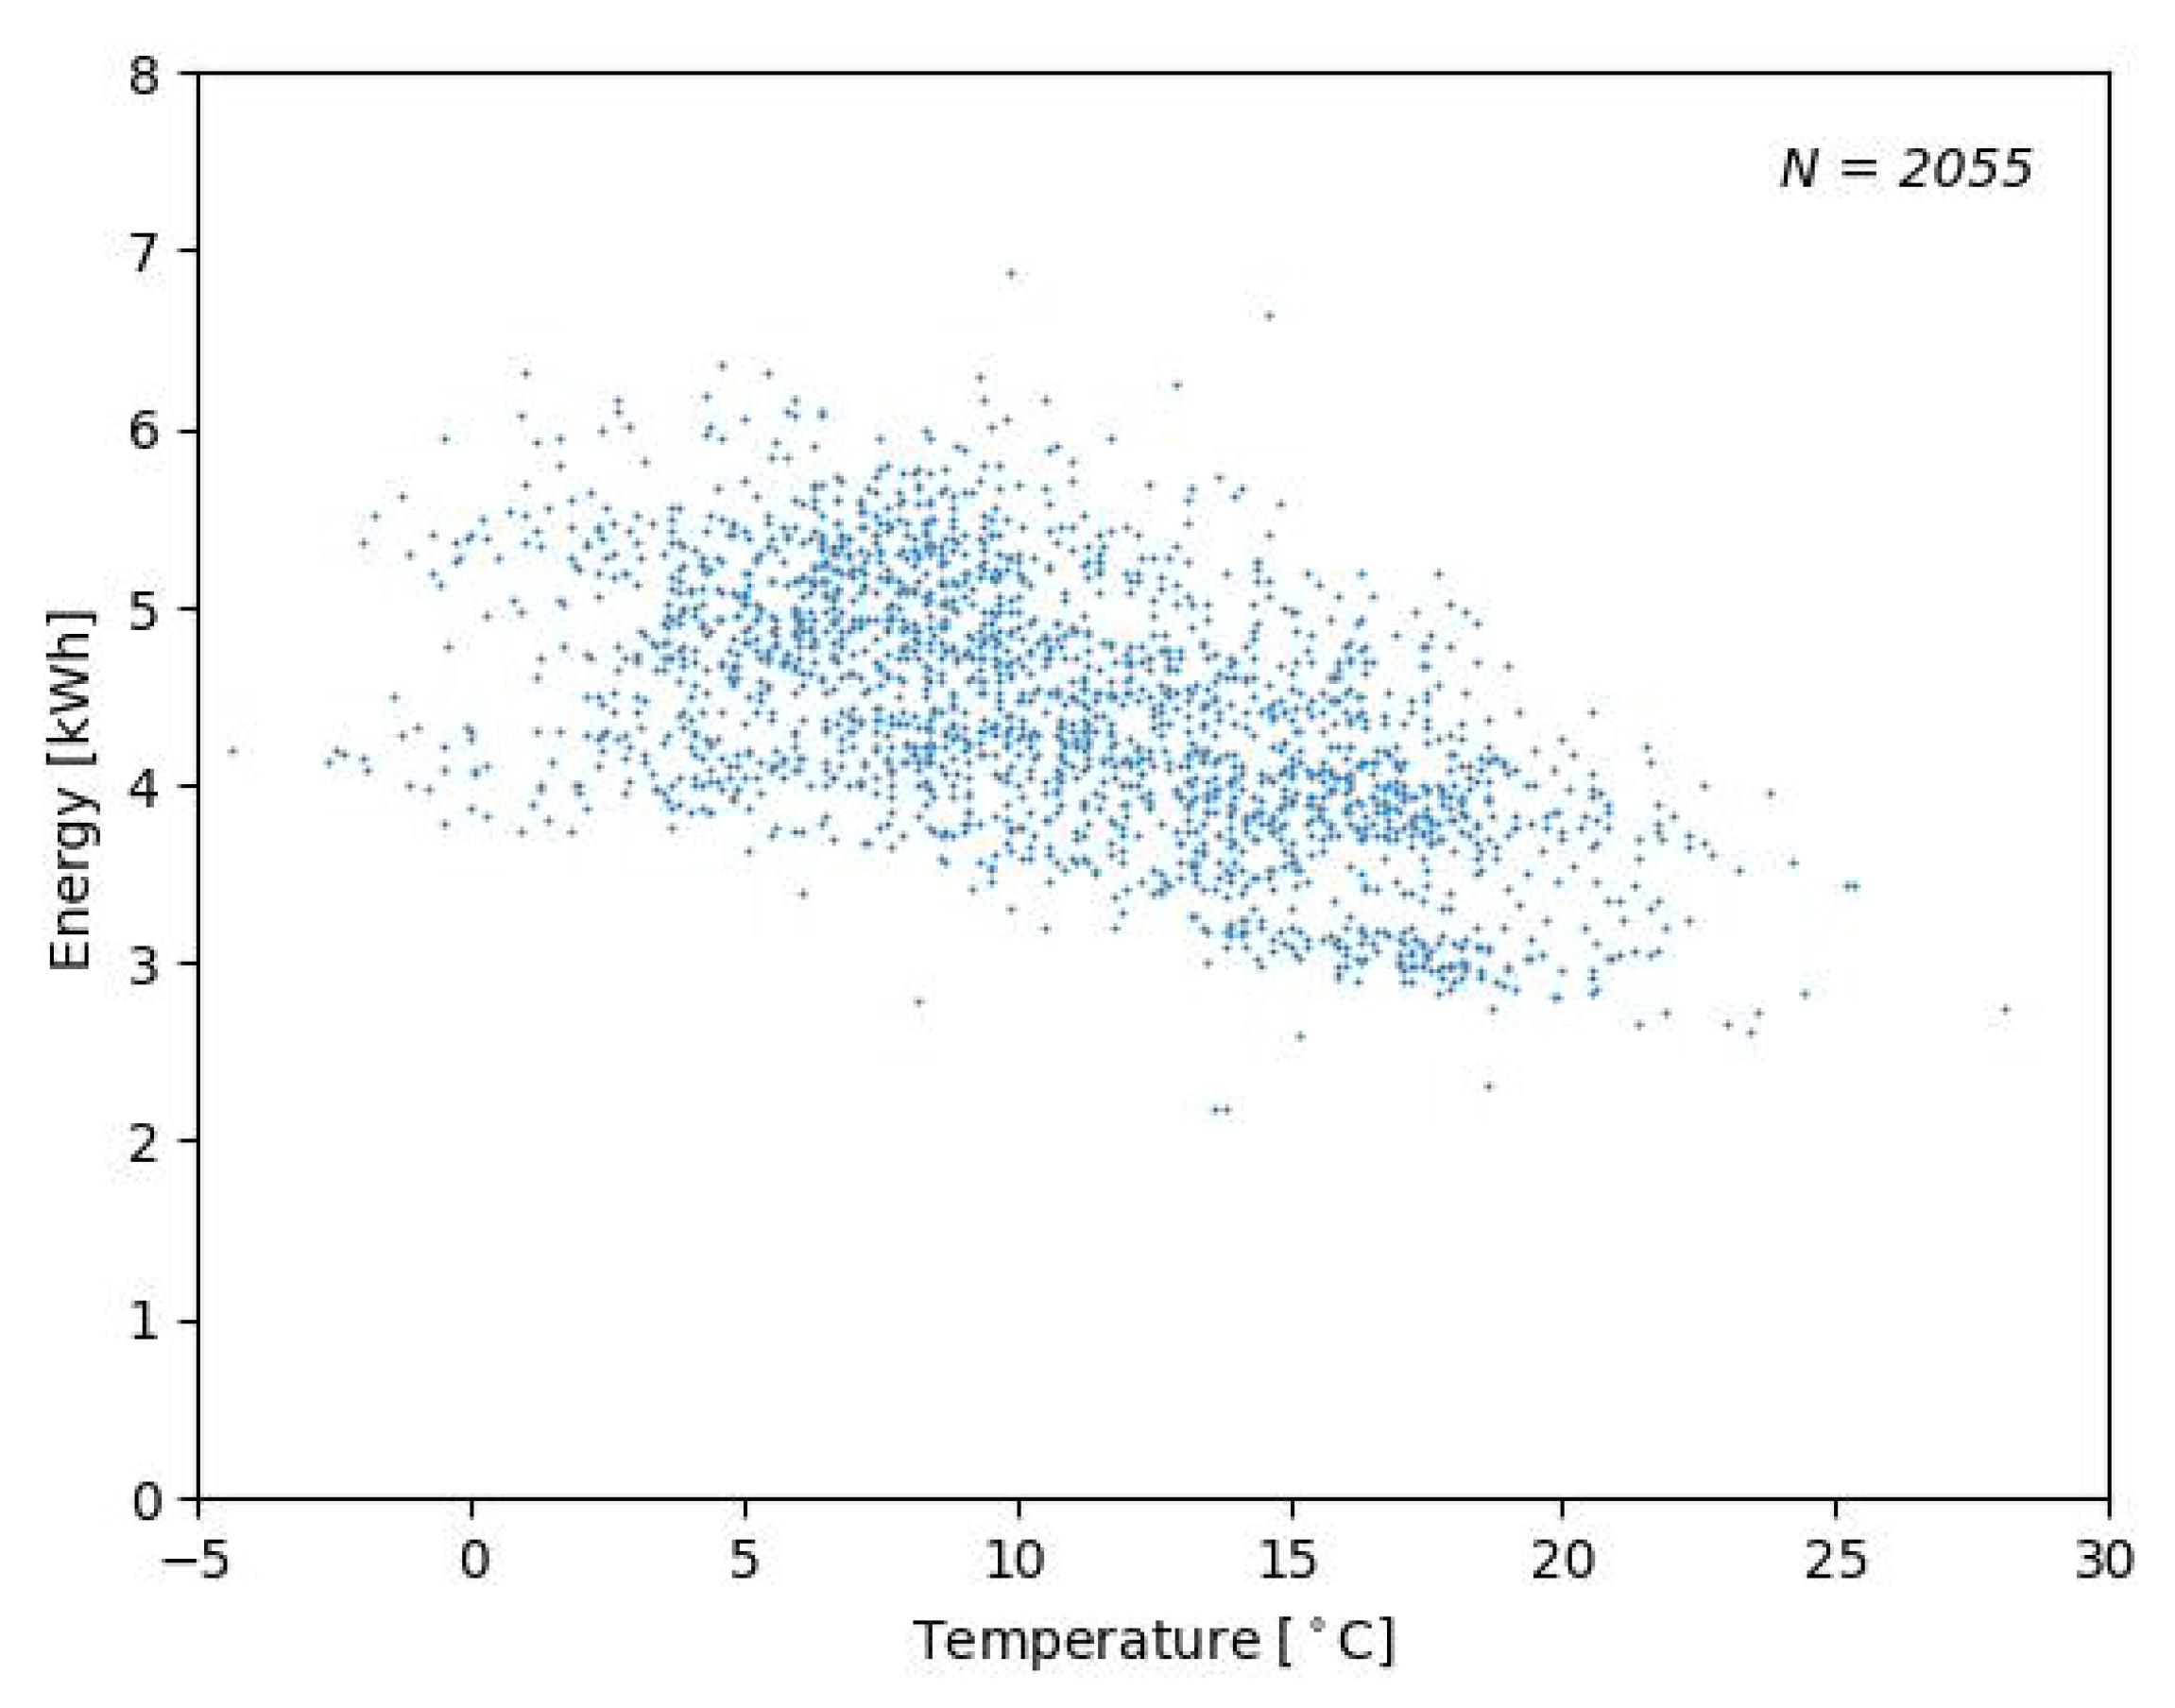
Figure 10 and Figure 11 plot 2055 points of mean daily gas use against the daily CET temperature. DSH and DHW evidently display how the external temperature has much more of an effect on the DSH demand (shown on a 0–120 kWh y-axis) than the demand for DHW (shown on a 0–10 kWh y-axis). Figure 10 shows segmented regression, where there is a steady decrease in energy used for space heating until around the 15 °C value, where it then starts to plateau. This point of around 15 °C appears to be a common cut-off point for space heating in gas boilers, as a value of 15.5 °C is used as the indicator for calculating heating degree days [25].
Conversely, Figure 11 shows that the amount of energy used for domestic hot water does not seem to vary considerably (in absolute values) from outside temperature due to consumer behaviour—it remains almost consistently between 3 kWh and 6 kWh. However, there is a slight decrease in the energy used for DHW, again towards the 15 °C mark, but this is felt to be due to the lower energy required to heat the water to a desired temperature when the input water temperature itself is higher.
This would also impact the energy for space heating across different temperatures, but this is seen as a less important factor in the relationship between temperature and DSH demand.
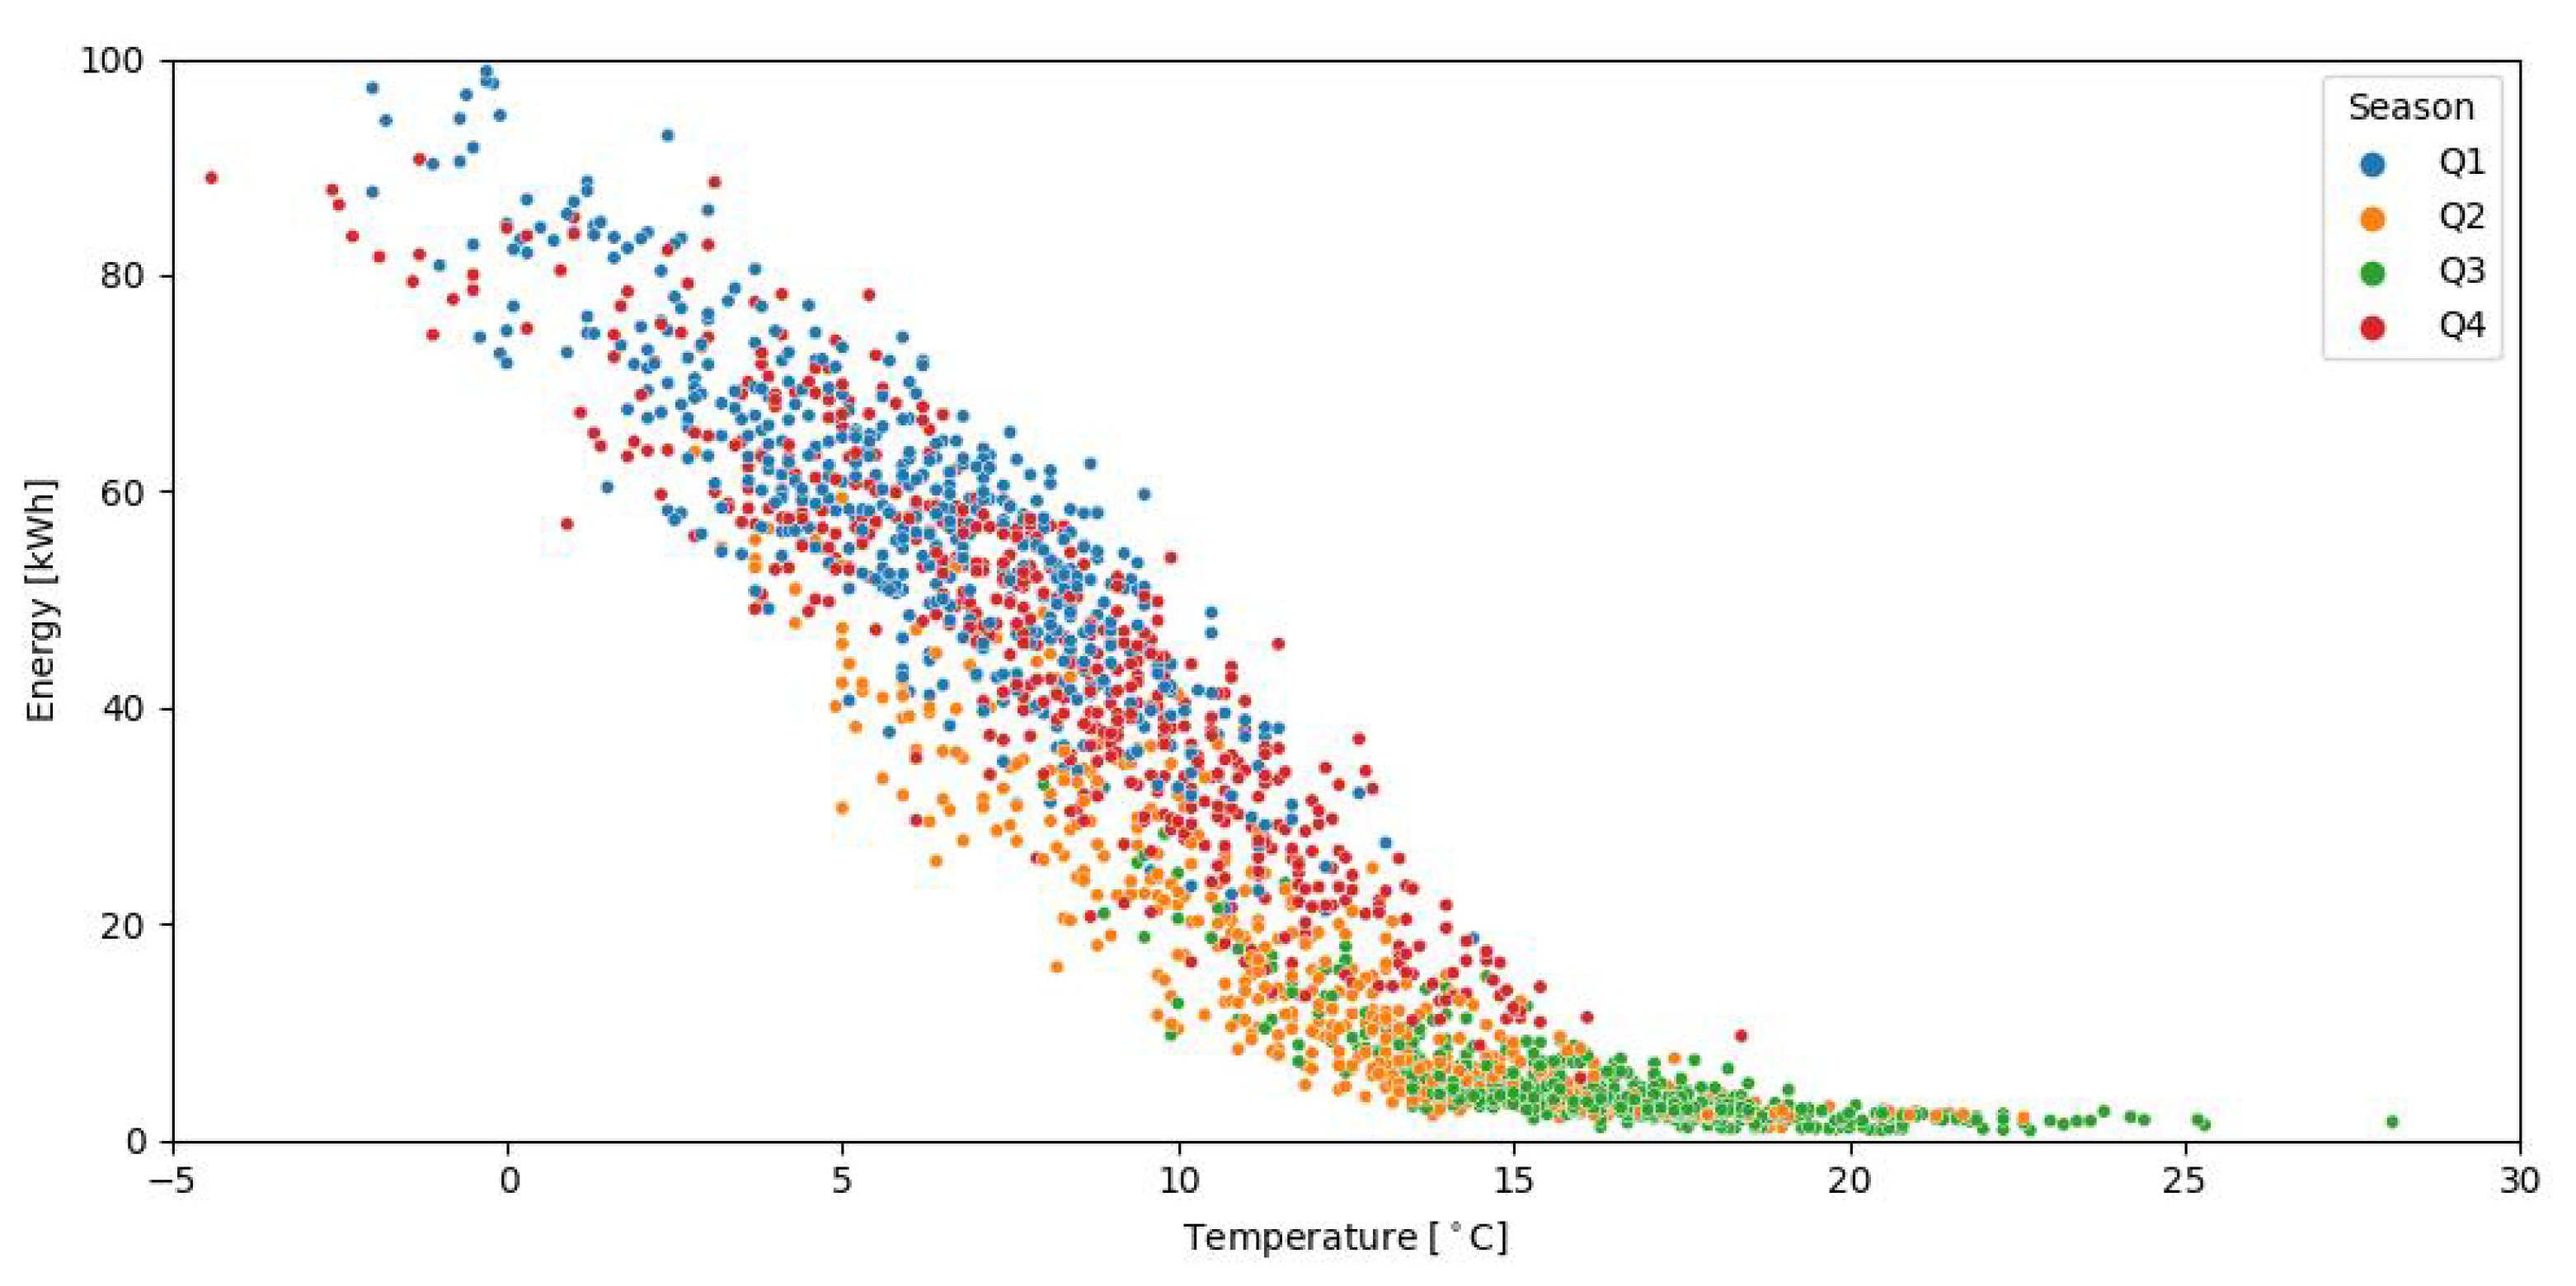
Figure 12 shows the different mean gas use for a given temperature across the four quarters of the year (Q1—January–March, Q2—April–June, Q3—July–September, and Q4—October–December).
One noticeable characteristic of consumer demand for space heating, seen in Figure 12, is that households are more likely to use space heating to warm their homes at similar external temperatures in the exit from the winter months (Q1) than they are in the months in the build-up to colder winter temperatures (Q4). This is shown in Figure 12, where the energy use in Q1 (January, February, and March in blue) is typically higher than it is for the same temperature in Q4 (October, November, and December in red).
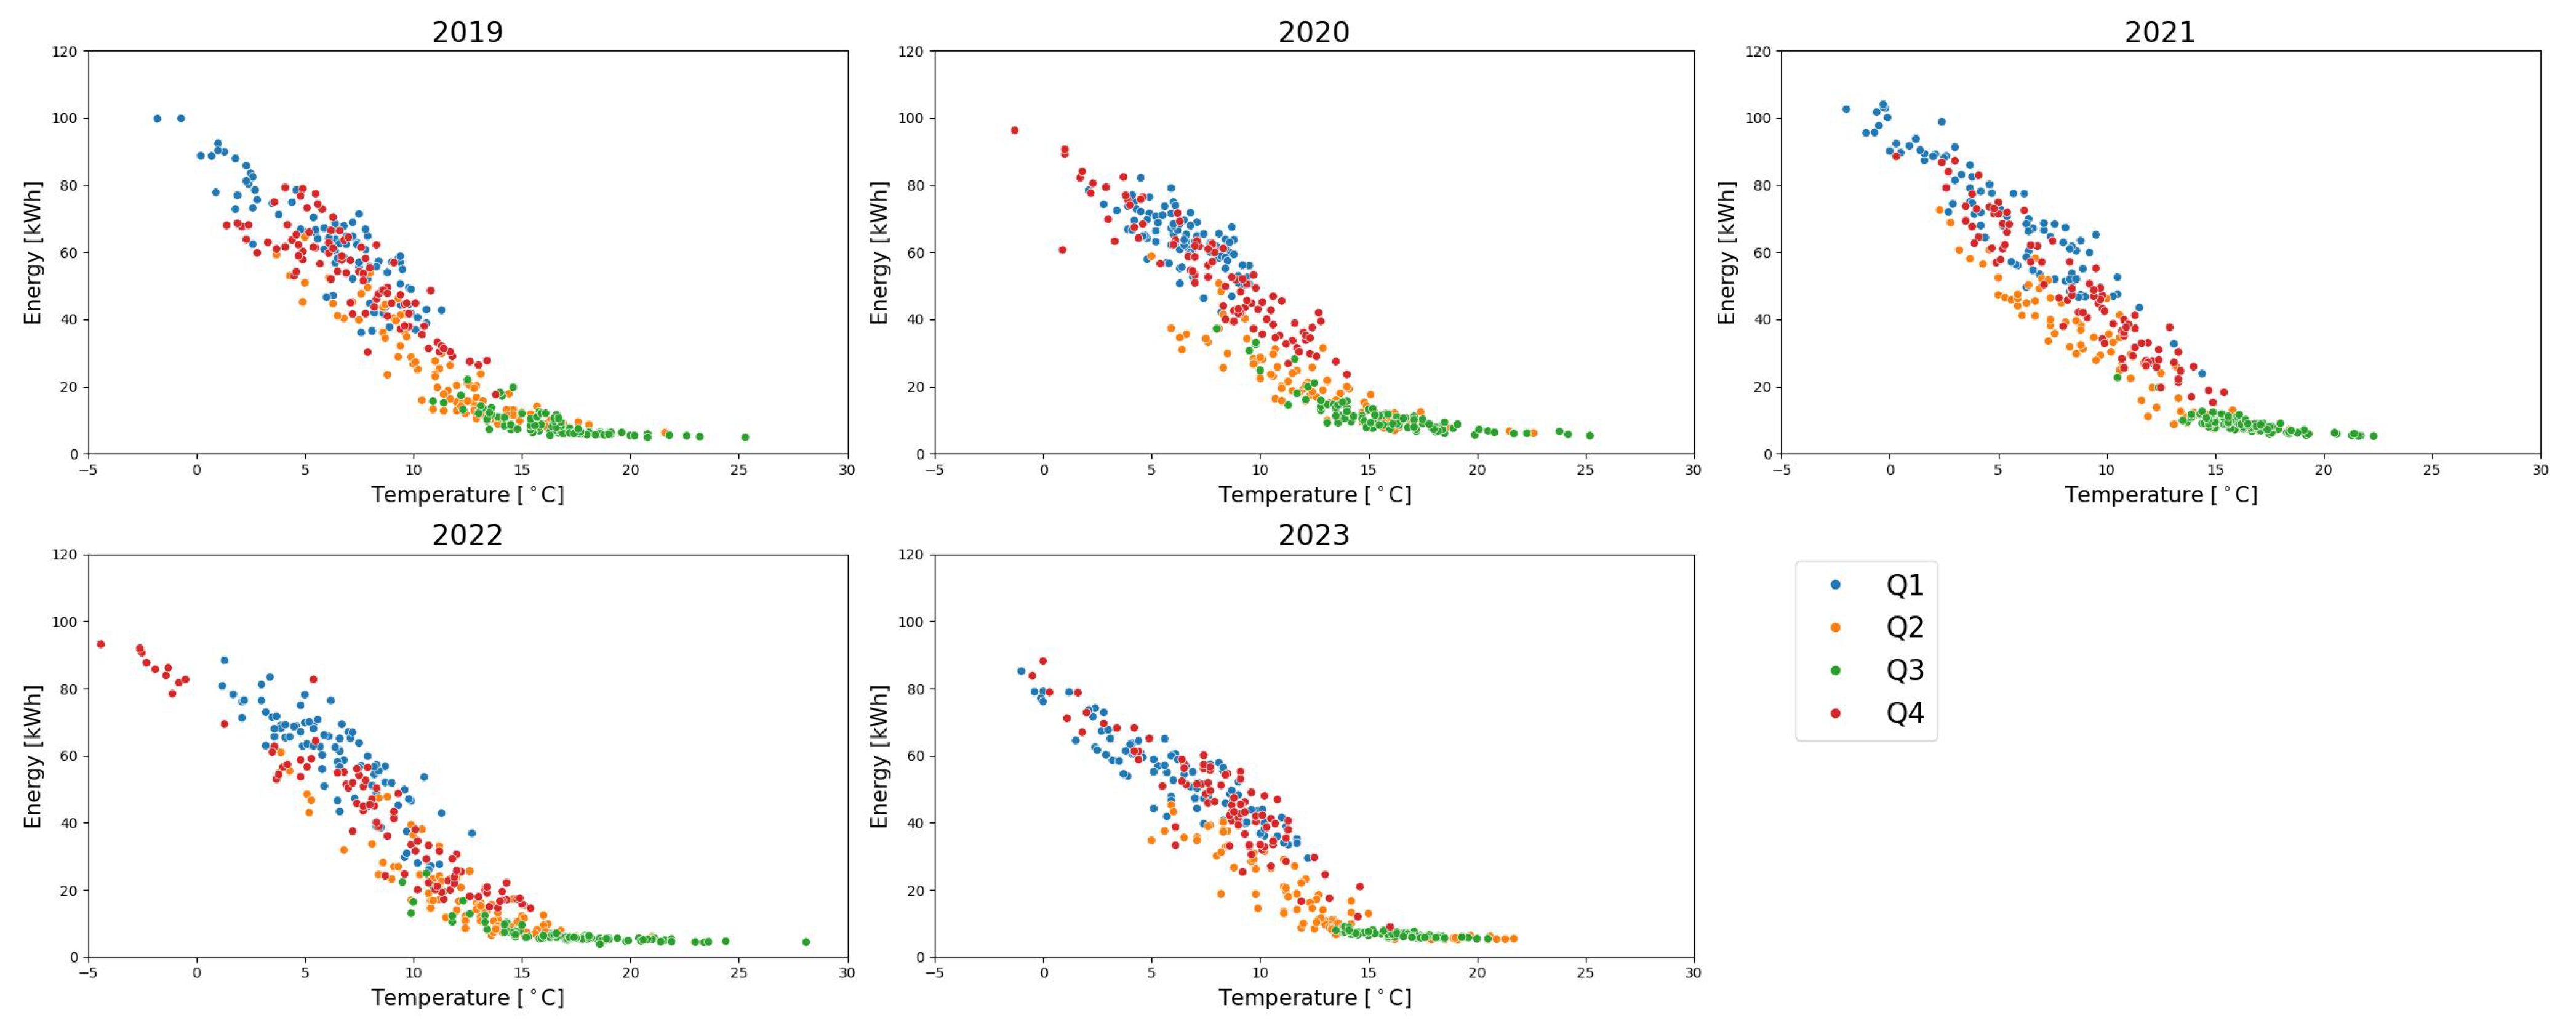
Figure 13 highlights this by splitting Figure 12 into the five full data years (2019 through to 2023).
This observed trend in Figure 13 suggests the willingness of consumers to use more energy (to keep systems on for longer) for domestic space heating during Spring months when the outside temperature is warming up, rather than a willingness to use space heating when the temperature is dropping when entering the colder months from Autumn to Winter, i.e., there could be a lag or memory effect in terms of behaviour or other weather effects having an influence.
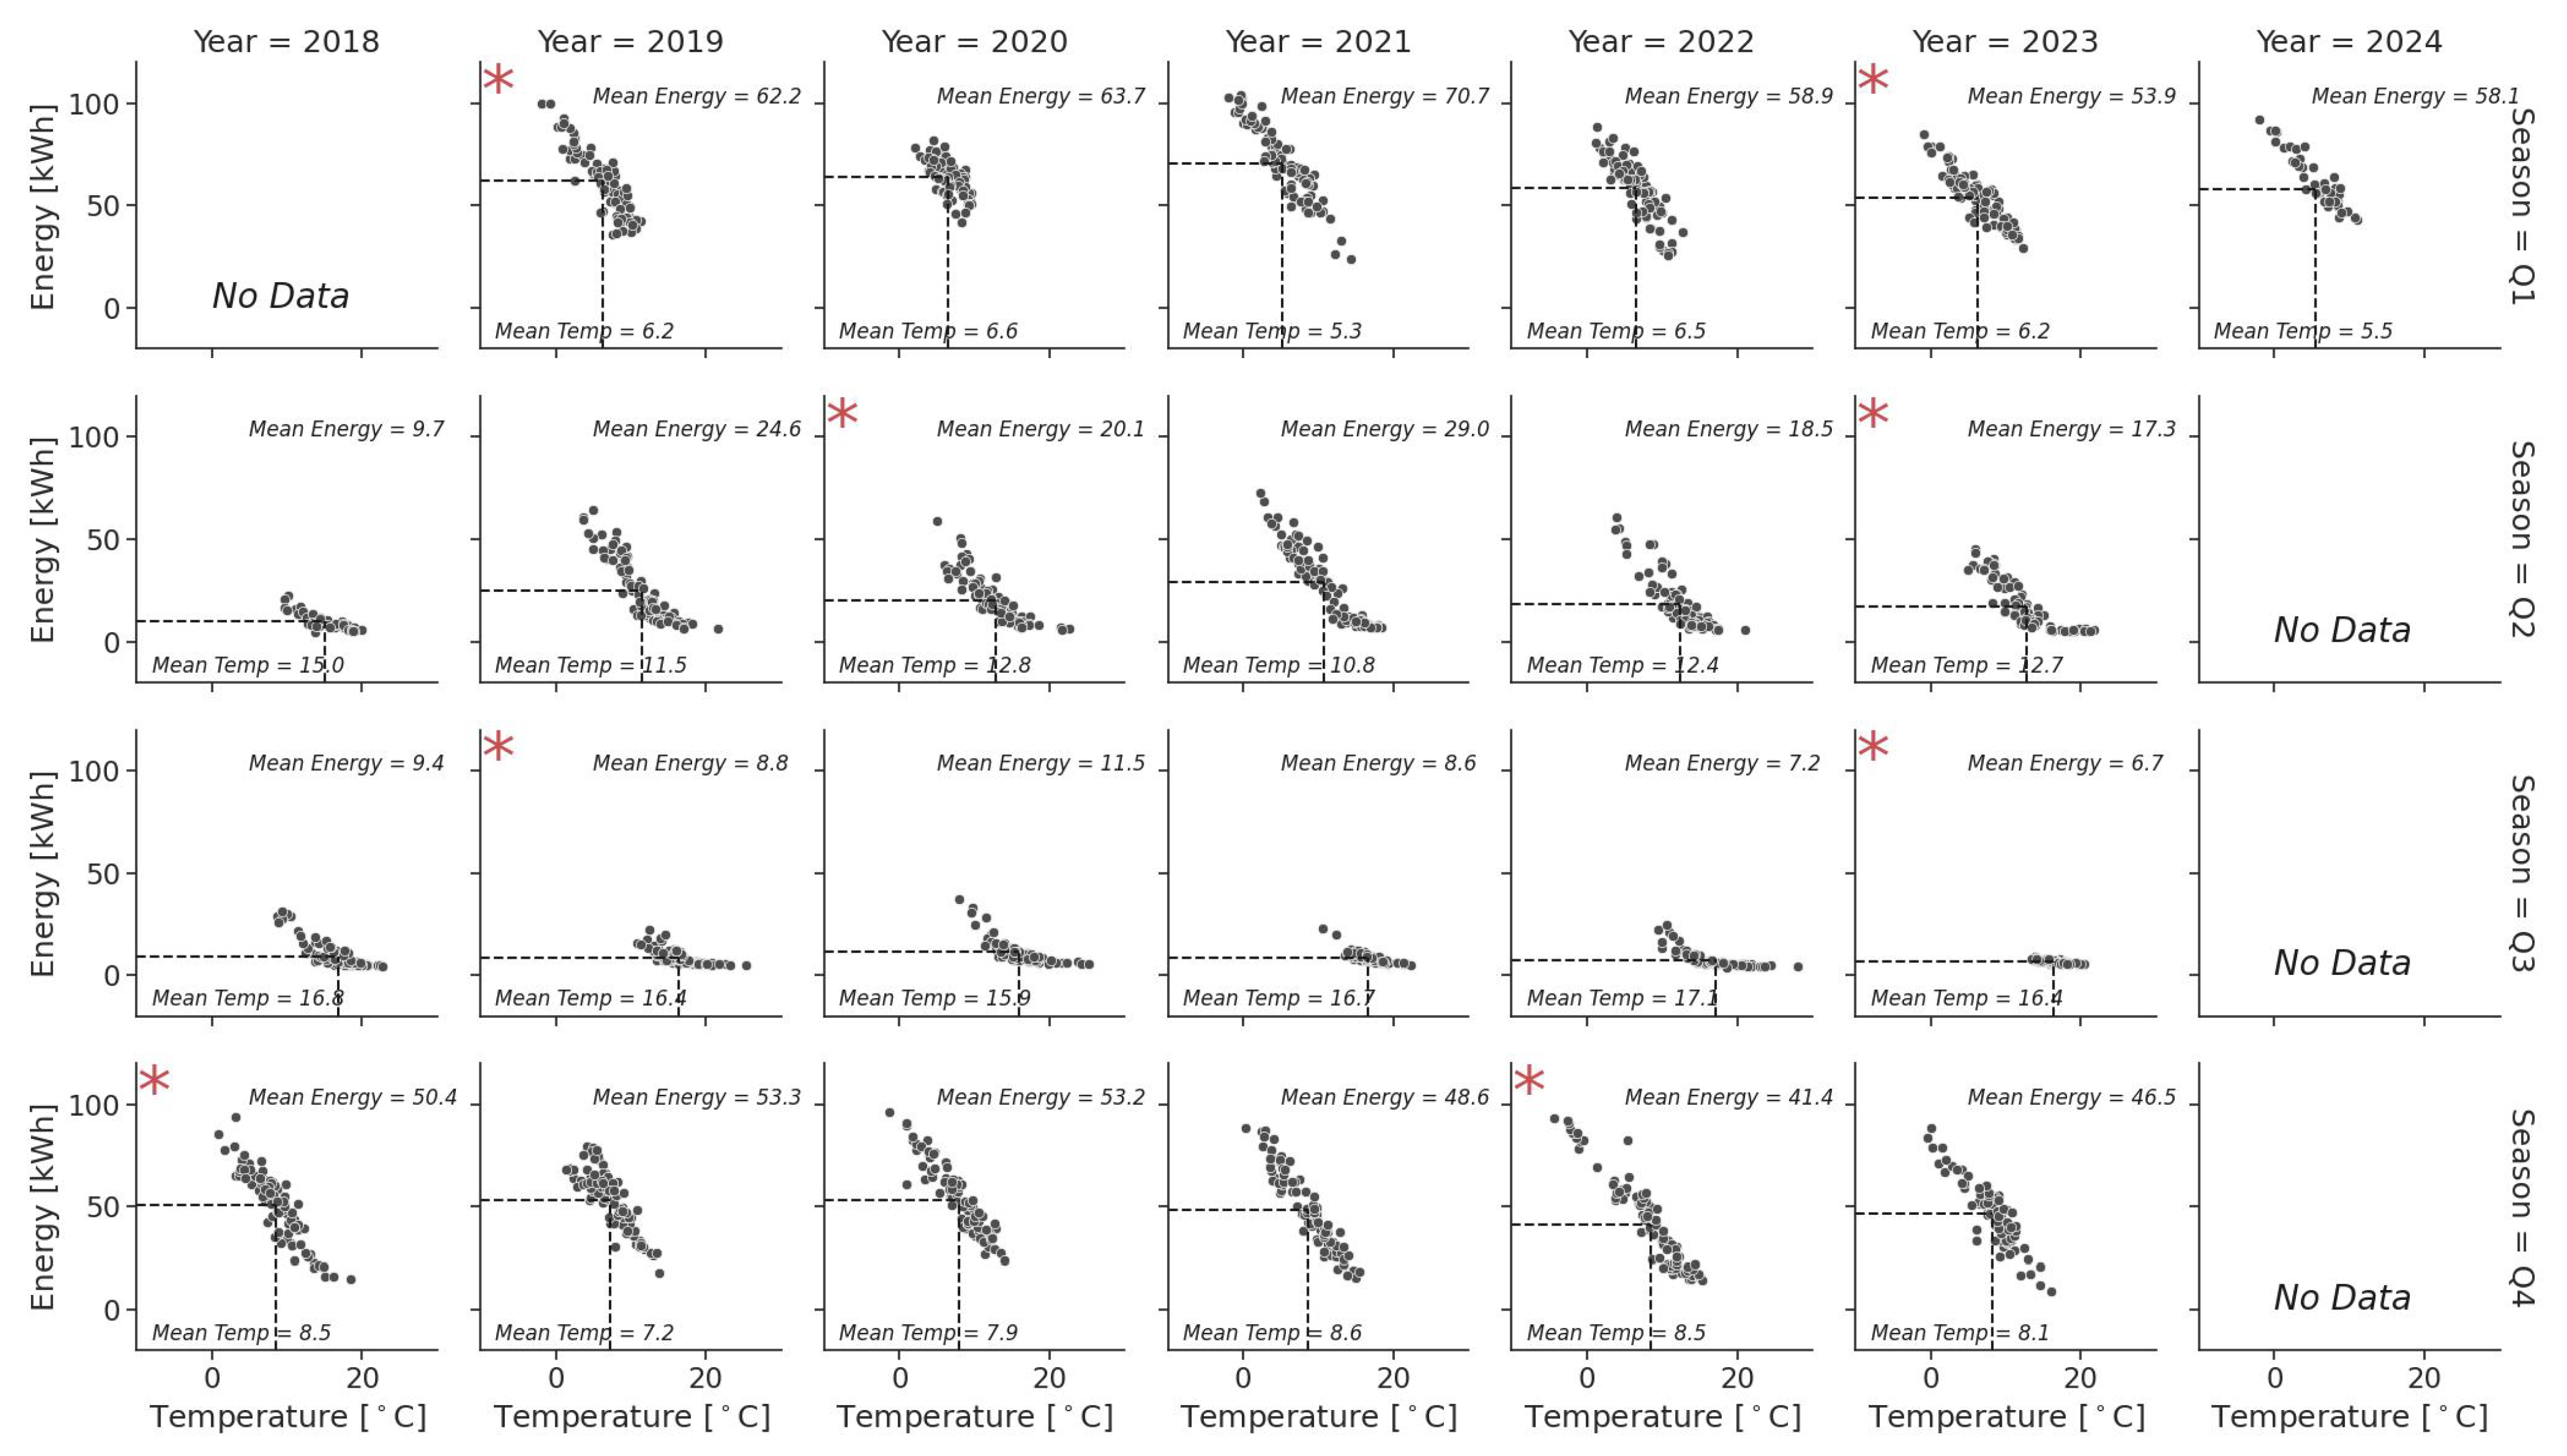
Figure 14 plots the four quarters (seasons) in rows against the years in columns. The data plotted are the mean energy use for each day plotted against the CET value on that day. One way to help visualise the change in demand from 2018 through to 2024 is to look at how the demand has changed by season and how the energy demand has changed across this period, relative to the temperature. Q2 2018 and Q1 2024 do not have full datasets for these quarters, whilst for Q1 2018 and Q2 through to Q4 2024, there are no data. In eight of the charts in Figure 14, there is a red asterisk seen in the top left hand corner—this is to help identify the years and seasons that are compared in the following analysis.
The first quarter of the year to analyse in Figure 14 is Q1, where the temperatures are the coldest across the year, and therefore, the highest energy demand is seen. The mean quarterly temperatures range from 5.3 °C in 2021 up to 6.6 °C in 2020. The greatest mean daily energy demand across Q1 from 2019 to 2023 was 70.7 kWh in 2021, and despite having a mean CET value 0.9 °C higher than 2021 at 6.2 °C, 2023 had the lowest mean energy demand of each of the years, with a mean daily demand of 53.9 kWh.
The mean energy demand in 2023 forms the basis of the Q1 comparison, as both 2019 and 2023 had a shared mean CET value of 6.2 °C. In 2019, across the coldest quarter of the year, the mean daily energy demand was 62.2 kWh. In 2023, however, it was much lower at 53.9 kWh—a drop of 8.3 kWh (13% decrease). This displays that in the coldest quarter of the year, from 2019 and 2023, there has been a significant change in consumer gas demand for heating for an equivalent temperature season.
The second trend to highlight is seen in Q2. This quarter, across the years, shows how much of an impact temperature has on the demand for space heating. The mean temperatures seen in the second quarters of each year range from 12.8 °C in 2020 to 10.8 °C in 2021 (2018 Q2 had a mean temperature of 15 °C; however, this is only recorded from May 2018, not the whole of the quarter). With this wide range of temperatures, this leads to an equally wide gap in the mean demand seen across the years. In 2020, where the mean temperature was greater (12.8 °C), the mean energy was 20.1 kWh, whereas in 2021, where the temperature was much cooler (10.8 °C), the mean energy demand was 29.0 kWh.
Despite the wide range in temperatures in Q2 across the years, there are two years (2020 and 2023) that have similar mean CET values (12.8 °C and 12.7 °C, respectively). In 2020, the mean energy demand was 20.1 kWh, whereas the mean energy demand was 17.3 kWh in 2023. This is a drop of 2.8 kWh (14% decrease) for an equivalent mean temperature over the same season. This emphasises that there has been a decrease in gas demand for heating between 2018 and 2023.
From Figure 14, it is evident that Q3 (July, August, and September) has the lowest demand of all quarters and that the shape of the datapoints seen in Q3 started to become shallower from 2018 to 2023. In Q3, where the temperature is the greatest across the year (15.9 °C–17.1 °C), there is typically very little energy demand for space heating. Therefore, the charts for Q3 show how the demand for hot water across the warmer months has differed from 2018 to 2023. It is important to remember that a change in consumer demand will have had some impact on this, but a higher average weather temperature across a quarter would lead to a flatter line (based on the same usage).
An interesting comparison to be made in Q3 is between 2019 and 2023, where both of the quarters in these years had the same mean monthly CET value of 16.4 °C. In 2019 Q3, there was a mean energy use of 8.8 kWh, whereas 2023 Q3 had a mean energy use of 6.7 kWh—a significant drop of 2.1 kWh (24% decrease). This highlights how there has been a shift in consumer energy demand through the warmer months for the same temperature over the season.
Finally, the focus turns to Q4, where the mean temperature ranges from 7.2 °C in 2019 up to 8.6 °C in 2021. The year 2019 has the highest Q4 mean energy demand with 53.3 kWh. It would be expected that the year with the highest quarterly mean CET value would therefore have the lowest mean energy demand. However, this is not the case, as 2021 has the third lowest energy demand, with a mean daily energy use of 48.6 kWh.
The year with the lowest energy demand for the fourth quarter of the year is 2022, and it forms part of the comparative analysis between the years. Both 2018 and 2022 have a similar mean fourth quarter CET value of 8.5 °C—however, their energy demand differs significantly. In 2018, the mean daily energy demand was 50.4 kWh, compared to a mean value of 41.4 kWh in 2022. This is a significant drop of 9 kWh (18% decrease) per day across a colder part of the year where the majority of the gas demand comes from space heating.
This comparative analysis over the four quarters on how mean energy demand has changed for the same mean temperature strongly suggests that consumers have a smaller energy demand for the same temperature in 2023 than they did in 2019.
Table 9 is a summary table compiling these findings (The values in the temperature column for Q2 differ—unlike other years—due to there not being any directly comparable temperatures in Q2 between 2018 and 2023). It is important to draw attention to Q1 and Q3—which have the highest and lowest mean energy demand, respectively. For both of these quarters, the compared years are the same—2019 and 2023. There is a significant percentage drop across the two (13% and 24% decreases), and most importantly, as these are the hottest and coolest months, it shows that there has been a change in consumer demand across each of the seasons, not just the colder months where space heating demand is more prominent.
The key independent variable in this analysis is the CET value, whilst the value of the UK energy price cap is an independent variable whose effect on the data is considered. Firstly, the external temperature has an inverse relationship with the demand for energy—the higher the temperature the smaller the energy demand—which can be seen across the four quarters (highest energy demand in winter, lowest energy demand in summer). When comparing the energy demand within the same season from 2019 to 2023, it is evident that temperature does have an impact on the energy demand, but it is important to note how the energy demand does differ for the same temperature between years. This highlights that temperature has a large impact on the energy demand across a year—however, there are other factors that affect consumer energy demand.
It is, therefore, important to consider the implications that the increase in the price cap had on consumer behaviour and willingness to use similar amounts of gas as seen in other years. The changing of the price cap is an independent variable that contributes to gas demand, as higher prices of gas per kWh reduce consumer demand. With the price cap rising significantly at the end of 2021—£1277 in October 2021 [16], to £4279 in January 2023 [17], a 335% increase—this is felt to have driven a reduction in demand due to these higher prices, which have contributed to the cost-of-living crisis in the UK. Ref. [26] found the aggregate long-run price elasticity of gas to be −1.25—meaning that an increase in the price of gas sees a significant reduction in demand, which is supported by the findings in this work.
As the price cap is expected to decrease in a number of quarters after this analysis (beyond 2023), it will be interesting to see what pattern energy demand takes—whether it will begin to increase again with the lower costs, remain consistent as consumers are content with their current energy use profiles, or if energy demand will continue to decline as we have seen from 2019 to 2023.
There may be other factors that may have contributed to the decrease in demand that are not able to be considered given the lack of metadata for the boilers. These are influences such as the awareness of the households of their energy usage, perhaps via in-home displays in properties with smart meters, or increased dwelling energy efficiency due to improvements in the building fabric to limit the amount of heat loss.

4. Conclusions

Understanding the trends in consumer energy demand for heating is key when forecasting energy use. It is helpful to have a grasp of how a subset of the public across Great Britain (~144,000 dwellings) have changed their consumption between the years of 2018 and 2024. This may be through gas demand for domestic space heating, which varies with temperature, or for domestic hot water, which is more consistent across the year.
Our analysis found that when using a dataset of boilers in Great Britain between 2018 and 2024, there was a distinct change in their demand for natural gas. The demand seen from 2019 to 2021 rose gradually, with a sharp decrease in demand seen after 2021. It was found that the percentage composition of the two demand fractions (space heating and hot water) at an annual level was broadly consistent from 2019 to 2023 with ~88% of the demand coming from space heating and 12% contributed by hot water demand.
The peak annual demand for space heating came in 2021, before the beginning of the decrease in energy demand for heating. However, the peak annual demand for hot water was in 2020, felt to be due to the COVID-19 pandemic and because consumers were under lockdown conditions and thus at home more frequently, with an increased focus on washing to reduce the spread of infection.
Interestingly, across this period, a trend was spotted across days of the week for domestic hot water demand but not for domestic space heating demand. When looking at demand on each day of the week, it is clear that hot water demand from Monday to Friday (typical workdays for Great Britain) is consistent, with a small increase on Saturdays, followed by a further increase on Sundays.
The seasonality of energy demand for space heating is based on the relationship between temperature and energy demand with a higher outside temperature leading to a lower energy demand. Therefore, it was expected that Q3 (July, August and September) would have the lowest mean energy demand, followed by Q4 (October, November and December), Q2 (April, May and June), with Q1 (January, February and March) having the greatest mean demand. Interestingly, it was established that consumers are more likely to use energy for space heating at similar temperatures when exiting the winter months in spring than when approaching the winter months in autumn. This is likely due to consumers being more reluctant to start using space heating systems, causing a slower uptake. Towards the end of winter, consumers are more resistant to shutting off their heating systems until they are content with their baseline dwelling temperature.
Although temperature has a crucial impact on the energy demand across GB, there were other factors that led to changes in consumer behaviour. During Q1 and Q3 in 2019, energy demand was much higher than it was in 2023, despite the mean quarterly Central England temperature in these quarters being similar. As this is unexpected for a similar temperature, it is important to highlight other variables that may have affected this change in demand. A leading influence is felt to be the energy price cap that increased 335% between October 2021 (£1277) and January 2023 (£4279), with a slow decrease to pre-COVID prices being seen in January 2024 (£1928). As the price per kWh for a unit of gas increased between 2021 and 2023, the demand will likely have decreased as consumers tried to limit costs to help with the cost-of-living crisis in the UK. It is worth noting that this may not be the only factor for the reduction in energy demand between 2018 and 2024. Other factors such as an increase in the energy efficiency of buildings could also lead to decreased demand and also the understanding of consumers to their energy usage seen via the uptake of smart meters with in-home displays.
The decrease in annual energy demand, both for space heating and hot water, since 2021 has had an impact on both the production industry and the environment. These two are intertwined, as due to the decrease in domestic natural gas demand, there is a lesser need to produce natural gas, which, in turn, leads to a benefit for the environment due to fewer carbon emissions.
This investigation into how annual natural gas demand has decreased across Great Britain since 2021 would not necessarily apply to other countries across the world, but it would form an interesting piece of research to establish this. This is proposed as it was found that the decreased gas demand is likely due to the increased energy prices over the past years across Great Britain. Therefore, as the outside temperature was determined to not have a significant impact on the demand, each countries trend annual gas demand would become dependent on other factors, such as the price of energy and energy efficiency of buildings.
This analysis provides additional insights to understand how Great Britain’s demand for gas for domestic space heating and domestic hot water has changed across the 2019 to 2023 timeframe. A significant finding from the dataset is that the annual space heating demand contributes 88% of the total boiler demand for gas, whilst the other 12% of gas demand is for hot water demand. These values are significantly different than the reported values from DESNZ, where it is reported that 75.5% of domestic gas demand was from space heating (22.1% from hot water demand and 2.4% from cooking) [4]—rather than the 88% figure that was found in this analysis, although our boiler dataset does not consider demand from cooking.

Author Contributions

Conceptualization, G.P. and G.W.; methodology, G.P. and G.W.; validation, G.P. and G.W.; formal analysis, G.P.; investigation, G.P.; resources, G.P. and G.W.; data curation, G.P. and G.W.; writing—original draft preparation, G.P.; writing—review and editing, G.P. and G.W.; visualization, G.P. and G.W.; supervision, G.W.; project administration, G.P. All authors have read and agreed to the published version of the manuscript.

Funding

This research received no external funding.

Data Availability Statement

Restrictions apply to the availability of these data. Data were obtained from the Boiler Company and are available from the authors with the permission of the Boiler Company.

Acknowledgments

Many thanks to the Boiler Company for making the data available, without which this analysis would not have been possible. Thank you to Joe Day, Jake Verma and Katarina Pegg for their thorough proofreading and constructive internal review of this paper.

Conflicts of Interest

The authors declare no conflicts of interest.

Abbreviations

The following abbreviations are used in this manuscript:
BEISDepartment for Business, Energy and Industrial Strategy
CETCentral England temperature
DHWDomestic hot water
DESNZDepartment for Energy Security and Net Zero
DSHDomestic space heating
HDDHeating degree day

References

  1. DESNZ. 2022 UK Greenhouse Gas Emissions, Final Figures; Department for Energy Security and Net Zero: London, UK, 2024. Available online: https://assets.publishing.service.gov.uk/media/65c0d15863a23d0013c821e9/2022-final-greenhouse-gas-emissions-statistical-release.pdf (accessed on 15 August 2024).
  2. DESNZ. Digest of UK Energy Statistics (DUKES): Weather; Department for Energy Security and Net Zero: London, UK, 2023. Available online: https://www.gov.uk/government/statistics/weather-digest-of-united-kingdom-energy-statistics-dukes (accessed on 7 February 2024).
  3. Wilson, I.A.G.; Rennie, A.J.R.; Ding, Y.; Eames, P.C.; Hall, P.J.; Kelly, N.J. Historical daily gas and electrical energy flows through Great Britain’s transmission networks and the decarbonisation of domestic heat. Energy Policy 2013, 61, 301–305. [Google Scholar] [CrossRef]
  4. DESNZ. Subnational Electricity and Gas Consumption Statistics; Technical Report; Department for Energy Security and Net Zero: London, UK, 2024. Available online: https://assets.publishing.service.gov.uk/media/65b12dfff2718c000dfb1c9b/subnational-electricity-and-gas-consumption-summary-report-2022.pdf (accessed on 15 August 2024).
  5. Watson, S.D.; Lomas, K.J.; Buswell, R.A. Decarbonising domestic heating: What is the peak GB demand? Energy Policy 2019, 126, 533–544. [Google Scholar] [CrossRef]
  6. Meha, D.; Thakur, J.; Novosel, T.; Pukšec, T.; Duić, N. A novel spatial-temporal space heating and hot water demand method for expansion analysis of district heating systems. Energy Convers. Manag. 2021, 234, 113986. [Google Scholar] [CrossRef]
  7. Burzynski, R.; Crane, M.; Yao, R.; Becerra, V.M. Space heating and hot water demand analysis of dwellings connected to district heating scheme in UK. J. Cent. South Univ. 2012, 19, 1629–1638. [Google Scholar] [CrossRef]
  8. Lee, J.Y.; Yim, T. Energy and flow demand analysis of domestic hot water in an apartment complex using a smart meter. Energy 2021, 229, 120678. [Google Scholar] [CrossRef]
  9. Wang, Z.; Crawley, J.; Li, F.G.N.; Lowe, R. Sizing of district heating systems based on smart meter data: Quantifying the aggregated domestic energy demand and demand diversity in the UK. Energy 2020, 193, 116780. [Google Scholar] [CrossRef]
  10. Pullinger, M.; Berliner, N.; Goddard, N.; Shipworth, D. Domestic heating behaviour and room temperatures: Empirical evidence from Scottish homes. Energy Build. 2022, 254, 111509. [Google Scholar] [CrossRef]
  11. Andersen, R.V.; Toftum, J.; Andersen, K.K.; Olesen, B.W. Survey of occupant behaviour and control of indoor environment in Danish dwellings. Energy Build. 2009, 41, 11–16. [Google Scholar] [CrossRef]
  12. Guerra Santin, O.; Itard, L.; Visscher, H. The effect of occupancy and building characteristics on energy use for space and water heating in Dutch residential stock. Energy Build. 2009, 41, 1223–1232. [Google Scholar] [CrossRef]
  13. Wei, C.; Huang, Y.; Löschel, A. Recent advances in energy demand for residential space heating. Energy Build. 2022, 261, 111965. [Google Scholar] [CrossRef]
  14. Huo, T.; Cai, W.; Zhang, W.; Wang, J.; Zhao, Y.; Zhu, X. How does income level impact residential-building heating energy consumption? Micro-level evidence from household surveys. Environ. Impact Assess. Rev. 2021, 91, 106659. [Google Scholar] [CrossRef]
  15. Ofgem. Ofgem Confirms Changes to the Price Cap Methodology and Frequency ahead of New Rate to be Announced Later this Month|Ofgem. 2022. Available online: https://www.ofgem.gov.uk/press-release/ofgem-confirms-changes-price-cap-methodology-and-frequency-ahead-new-rate-be-announced-later-month (accessed on 25 March 2024).
  16. Ofgem. Record Gas Prices Drive up Price Cap by £139—Customers Encouraged to Contact Supplier for Support and Switch to Better Deal if Possible|Ofgem. 2021. Available online: https://www.ofgem.gov.uk/press-release/record-gas-prices-drive-price-cap-ps139-customers-encouraged-contact-supplier-support-and-switch-better-deal-if-possible (accessed on 25 March 2024).
  17. Ofgem. Latest Energy Price Cap Announced by Ofgem|Ofgem. 2022. Available online: https://www.ofgem.gov.uk/press-release/latest-energy-price-cap-announced-ofgem (accessed on 25 March 2024).
  18. Ofgem. Changes to Energy Price Cap from 1 January 2024|Ofgem. 2023. Available online: https://www.ofgem.gov.uk/news/changes-energy-price-cap-1-january-2024#:~:text=From%201%20January%202024%20the,to%20%C2%A31%2C928%20per%20year. (accessed on 25 March 2024).
  19. Office for National Statistics. Coronavirus and the Social Impacts on Great Britain; Office for National Statistics: London, UK, 2022. Available online: https://www.ons.gov.uk/peoplepopulationandcommunity/healthandsocialcare/healthandwellbeing/bulletins/coronavirusandthesocialimpactsongreatbritain/21january2022 (accessed on 15 March 2024).
  20. DESNZ. Subnational Electricity and Gas Consumption Statistics; Technical Report; Department for Energy Security and Net Zero: London, UK, 2021. Available online: https://assets.publishing.service.gov.uk/media/63a31383e90e075875eae2e7/subnational_electricity_and_gas_consumption_summary_report_2021.pdf (accessed on 15 March 2024).
  21. DESNZ. Subnational Electricity and Gas Consumption Statistics; Technical Report; Department for Energy Security and Net Zero: London, UK, 2019. Available online: https://assets.publishing.service.gov.uk/media/5fe0cb1bd3bf7f3a3a9632cd/sub-national-electricity-and-gas-consumption-summary-report-2019.pdf (accessed on 15 March 2024).
  22. DESNZ. Subnational Electricity and Gas Consumption Statistics; Technical Report; Department for Energy Security and Net Zero: London, UK, 2020. Available online: https://assets.publishing.service.gov.uk/media/628faad8d3bf7f0375568d5e/subnational_electricity_and_gas_consumption_summary_report_2020.pdf (accessed on 15 March 2024).
  23. Met Office. Met Office Hadley Centre Central England Temperature Data Download. 2024. Available online: https://www.metoffice.gov.uk/hadobs/hadcet/data/download.html (accessed on 12 March 2024).
  24. Met Office. The Central England Temperature Series. 2024. Available online: https://www.metoffice.gov.uk/research/climate/maps-and-data/cet-series (accessed on 7 March 2024).
  25. Met Office. Annual Heating Degree Days—Projections (12 km). 2023. Available online: https://climatedataportal.metoffice.gov.uk/datasets/TheMetOffice::annual-heating-degree-days-projections-12km/about (accessed on 22 March 2024).
  26. Burke, P.J.; Yang, H. The price and income elasticities of natural gas demand: International evidence. Energy Econ. 2016, 59, 466–474. [Google Scholar] [CrossRef]
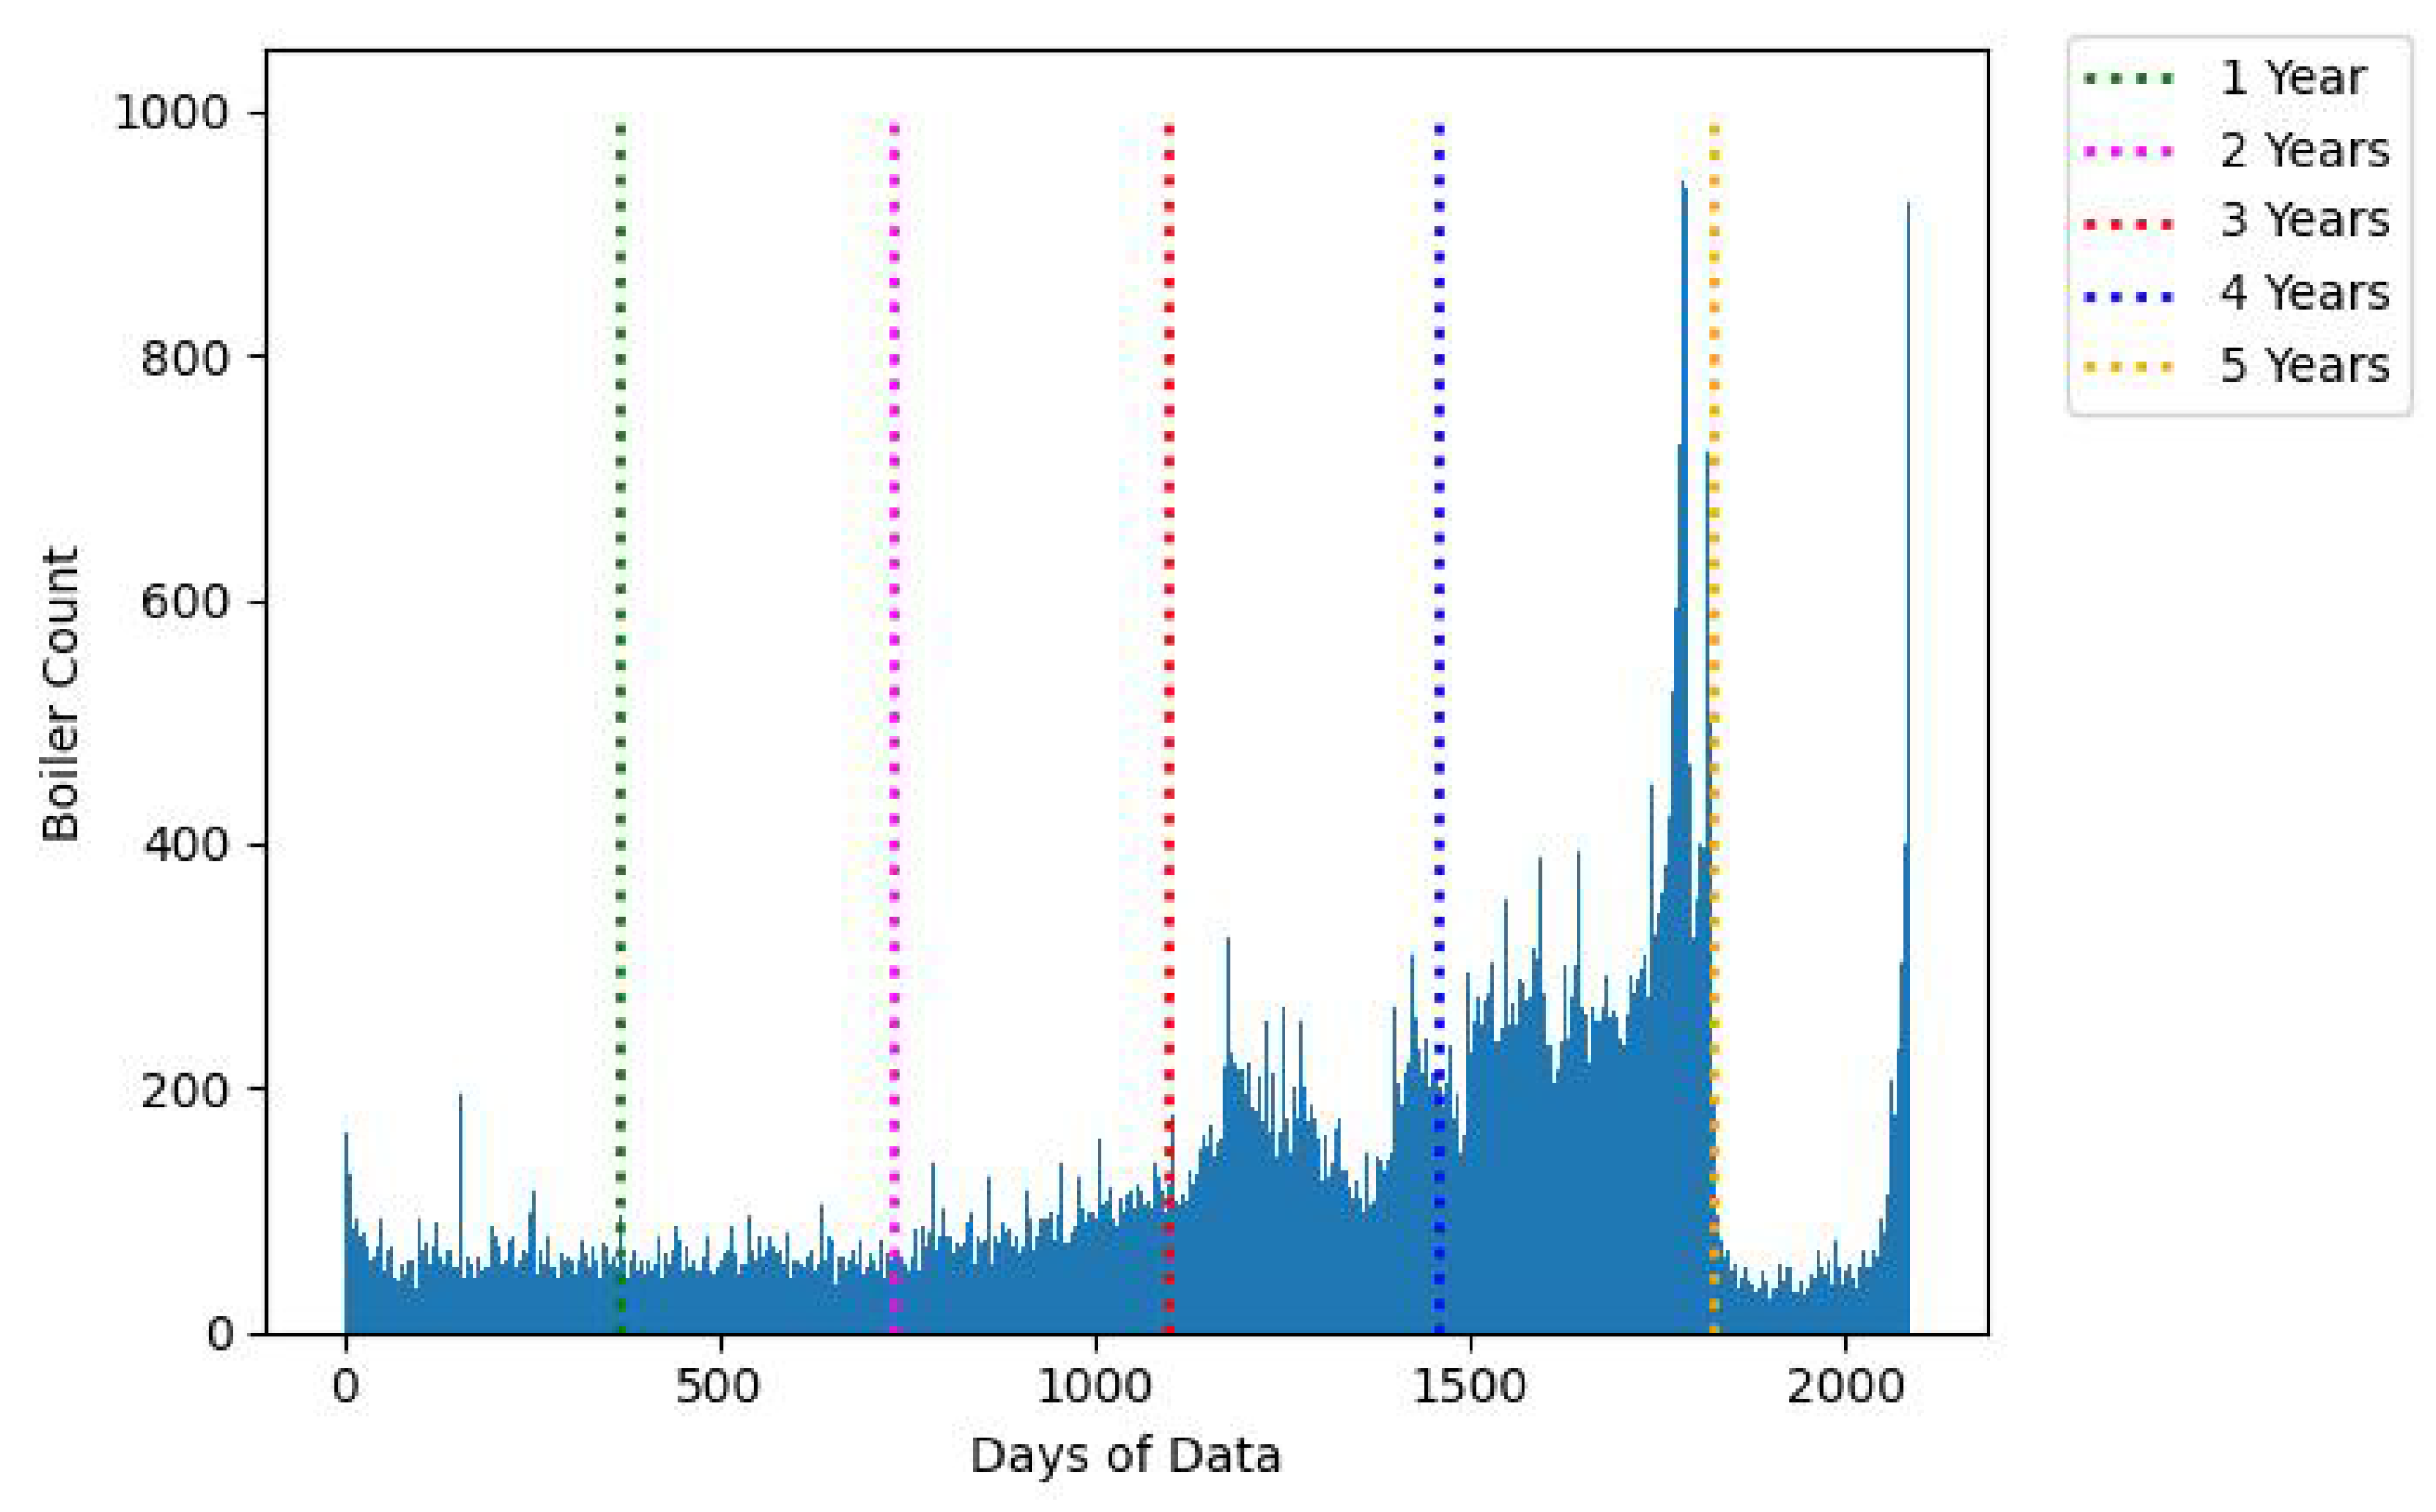
Figure 1. Percentage of days of data provided by each unique boiler.
Energies 17 04884 g001
Figure 2. Number of unique boilers in the dataset on a daily basis.
Energies 17 04884 g002
Figure 3. Bar plot of mean annual gas consumption by year.
Energies 17 04884 g003
Figure 4. Annual gas demand by boilers: 2019–2023.
Energies 17 04884 g004
Figure 5. Kernel density estimate plot of annual gas demand: 2019–2023.
Energies 17 04884 g005
Figure 6. Mean domestic space heating energy demand per month: 2018–2024 (Note: The y- axis scale is different in Figure 6 and Figure 7).
Energies 17 04884 g006
Figure 7. Mean domestic hot water energy demand per month: 2018–2024 (Note: The y- axis scale is different in Figure 6 and Figure 7).
Energies 17 04884 g007
Figure 8. Mean domestic space heating energy use per weekday: 2019–2023.
Energies 17 04884 g008
Figure 9. Mean domestic hot water energy use per weekday: 2019–2023.
Energies 17 04884 g009
Figure 10. Mean domestic space heating energy use versus temperature: 2018–2024.
Energies 17 04884 g010
Figure 11. Mean domestic hot water energy use versus temperature: 2018–2024.
Energies 17 04884 g011
Figure 12. Mean domestic space heating energy use versus temperature—Seasonal difference: 2018–2024.
Energies 17 04884 g012
Figure 13. Mean domestic space heating energy use versus temperature—Annual seasonal difference: 2019–2023.
Energies 17 04884 g013
Figure 14. Mean domestic space heating energy use versus temperature—Annual and Quarterly difference: 2018–2024.
Energies 17 04884 g014
Table 1. Comparison to Previous Research.
Author and Publication YearTimespanData GranularityBoiler CountLocationFocus
Current analysisMay 2018–March 2024Daily data144,270GBDomestic Heat Demand
Analysis
[6]Hourly data23,384Pristina, KosovoDomestic
Heating Model
[7]April 2010–April 2011Weekly metered data450London, UKDomestic Space Heating and Hot Water Analysis
[8]1-Min data918Seongnam,
Republic of Korea
Hot Water
Demand
Analysis
[9]June 2009–May 2010Half-hourly data18,370UKGas and
Electricity Consumption Analysis
GB: It should be noted that the data used in this paper are from households across Great Britain (GB), but there will be references to other statistics relating to the United Kingdom (UK) throughout the paper.
Table 2. Explanation and Count of Removal of Anomalies.
Data FilterFilter ReasonData Count (Absolute)Data Count (%)
Daily energy demand equals 0 kWh, whilst other columns indicate energy usageMissing energy demand data29,8920.016
Daily energy demand greater than 500 kWhExcessive boiler use—likely error14500.001
Error message (‘NaN’)Incomplete data entry4,440,9552.44
Daily energy demand between 0 and 500 kWhData suitable for analysis177,342,50797.54
Table 3. Mean annual gas consumption by year (note: DESNZ data is weather corrected).
YearGB Mean Annual Energy Consumption (kWh) per Data Source
Original Dataset Data Subset DESNZ Annual Reports
201913,41813,92813,495 [21]
202013,57714,24713,698 [22]
202114,20114,90712,960 [20]
202211,45312,11411,237 [4]
202310,69011,340-
Table 4. Annual Boiler Median Energy Demand and Count: 2019–2023.
YearBoiler CountMedian Value (kWh)
201963,41111,776
202096,57311,974
202194,17312,673
202282,70110,165
202356,1029682
Table 5. Column Explainer for Key Columns.
Column NameDescription
DateDate of datapoints
Boiler nameBoiler ID name (this has been pseudo anonymised by the
boiler manufacturer)
Daily energy for space heatingTotal amount of energy used by the boiler, for space heating, aggregated over a day
Daily energy for hot waterTotal amount of energy used by the boiler, for hot water,
aggregated over a day
Daily total energy for space heating and hot waterTotal amount of energy used by the boiler, for any purpose, aggregated over a day
CETMean daily Central England temperature
Table 6. Data Features of Key Columns.
Column NameUnitsMinimum ValueMaximum ValueMedian ValueMean Value
Daily energy for space heatingkWh0500.021.431.5
Daily energy for hot waterkWh0500.02.94.4
Daily total energy for space heating and hot waterkWh0500.025.935.9
CET°C−4.428.110.210.7
Table 7. Annual Mean Hot Water, Space Heating and Total Gas Demand: 2019–2023.
YearMean Hot Water DemandMean Space Heating DemandMean Total Demand (kWh)Annual Mean Heating Degree Day ValueNumber of Positive Heating Degree Days
(kWh) (% of Total) (kWh) (% of Total)
201916841311,7348713,4185.6290
202017471311,8318713,5775.2292
202116681212,5348814,2015.6278
202214451310,0088711,4535.0287
202312251194678910,6905.5263
Table 8. Mean Daily Energy Demand for Space Heating and Hot Water: 2019–2021 and 2022–2023.
Demand TypeMean Daily Demand: 2019–2021 (kWh)Mean Daily Demand: 2022–2023 (kWh)Difference (kWh)Percentage Difference (%)
Space Heating33.128.34.8−15
Hot Water4.73.90.8−17
Table 9. Comparison of Quarterly Energy Demand.
SeasonTemperature (°C)Base YearBase Mean Energy
Demand (kWh)
Comparative YearComparative Mean Energy Demand (kWh)Difference (kWh)/(%)
Q16.2201962.2202353.9−8.3−13
Q212.8/12.7202020.1202317.3−2.8−14
Q316.420198.820236.7−2.1−24
Q48.5201850.4202241.4−9.0−18
Disclaimer/Publisher’s Note: The statements, opinions and data contained in all publications are solely those of the individual author(s) and contributor(s) and not of MDPI and/or the editor(s). MDPI and/or the editor(s) disclaim responsibility for any injury to people or property resulting from any ideas, methods, instructions or products referred to in the content.