Abstract
Graphene nanoplatelets with high thermal diffusivity are being researched for their ability to improve the thermal characteristics of adsorbents. Similarly, ionic liquids with hydrophilic properties have shown promising sorption and thermal attributes. In this study, novel composite adsorbents are developed, comprising few-layered graphene nanoplatelets and specific ionic liquids (ethyl-methylimidazolium methanesulfonate (EMIMCH3SO3) and ethyl-methylimidazolium chloride (EMIMCl)), along with polyvinyl alcohol binder. The composites, known as GP-CL-30-CP and GP-CH3SO3-30-CP, each contain 30% ionic liquid content. The aim is to capitalise on the superior thermal properties of graphene nanoplatelets and the stability and solvation characteristics of ionic liquids to enhance water and cooling production in adsorption-based cooling and desalination processes, addressing challenges in the water–energy nexus. The findings revealed an improvement in the thermal diffusivity of the composites by 167%, which is 76 times higher than the baseline silica gel. There was an increase in water uptake from 0.3534 kg/kg for silica gel to 0.9648 kg/kg for the composites, representing a 174% enhancement in water sorption, and hence more freshwater water production.
1. Introduction
Water scarcity is expected to worsen with increasing population and clean water demand, which is expected to increase by 40% by 2050 [1,2]. It was reported that 25% of the world population will be affected by water scarcity and millions will be forced for migration searching for freshwater by 2030 [3]. Adsorption desalination-cum-cooling technology has been regarded to utilise renewable thermal energy, the low-temperature waste heat of 50–85 °C and an environmentally friendly working fluid (water) to produce freshwater-cum-cooling. It is the most feasible in polygeneration systems used for cooling-cum-freshwater production [4], which has emerged as the most feasible technology to solve freshwater scarcity and simultaneously provides cooling in areas experiencing high temperatures or for combined heat and power systems [2,5,6]. Adsorption cooling and desalination systems typically involve the adsorption/desorption of water vapour utilising adsorbent material with porous properties such as silica gel, MOFs and zeolite [2]. Adsorption systems can produce energy-efficient cooling and freshwater, yet they offer a relatively low specific cooling power of 10–1000 W/kg and a COP of 0.15–0.6. The reported literature for prototypes utilising silica gel, which can be considered as a baseline material in this study, shows low specific daily water production (SDWP) in the range of 4.5 to 7.4 m3/tonne/day [7]. Therefore, there is a pressing need to enhance the thermal and adsorption capacity of adsorbents to enable the wide spreading of their energy efficiency and commercialisation.
Many researchers have worked on improving the performance of adsorbents by developing several composites by impregnating hygroscopic salts into host matrices or blending porous adsorbents such as silica gel, zeolites and activated carbon with heat transfer-enhancing material [8,9]. It was widely reported that porous adsorbents like silica gel may not be the most efficient since they attain low water uptake when operating at low-pressure adsorption and high-pressure desorption, resulting in low COP [8]. The porous matrix in the developed composites usually disperses the salt particles, which enhances the sorption and heat and mass transfer properties compared to the salts alone [9]. Restuccia et al. [10] investigated a composite of silica gel and CaCl2 called selective water sorbent and reported an adsorption capacity of 0.7 g/g, a COP of 0.6 and an SCP of 20 W/kg. Chan et al. [6] developed a composite that comprises zeolite-13X and CaCl2, which showed an uptake of 0.48 kg/kg. This resulted in an overall enhancement in the uptake, where COP and SCP increased by 320% and 180%, respectively, compared to zeolite 13X. While the zeolite 13X/CaCl2 composite showed an improved performance, there was an ion exchange that occurred between the Na+ in zeolite and Ca2+ causing changes in the composite adsorbent properties, reducing its performance in cooling applications [8], in addition to its poor heat transfer properties [11,12].
Enhancing the heat and mass transfer is a crucial challenge in adsorption cooling and desalination [3]. Therefore, there has been an increasing interest in enhancing the thermal and adsorption properties of adsorbents by developing consolidated composites using various additives such as expanded graphite (EG), expanded natural graphite (ENG) and expanded graphite treated with sulphuric acid (ENG-TSA) utilising binders such as polyvinyl alcohol (PVA), polytetrafluoroethylene (PTFE), polymerised ionic liquid (PIL), polyvinylpyrrolidone (PVP), gelatin and hydroxyethyl cellulose (HEC) [13,14,15,16,17,18,19,20]. PVP and PVA were the most suitable binders for composite synthesis for adsorption cooling application because of their low negative effect on the porous properties of the host material [20].
El-sharkawy et al. [16] investigated a composite comprising 50% Maxsorb III, 20% expanded graphite and 10% PVA binder. Their findings showed a thermal conductivity that was 11 times higher, and further tests alluded to an adsorption uptake improved by 51% [21]. Wang et al. [22] investigated a consolidated composite made from activated carbon (AC) and expanded natural graphite with an ENG-TSA. Their results showed an improved thermal conductivity of 34.2 W m−1 K−1, which was 150 times higher compared to granular activated carbon. Pal et al. [13] developed composites from activated carbon and PIL. The results showed an 85% increase in thermal conductivity and a 22% enhancement in the uptake.
It can be concluded from the literature that consolidated composites have improved thermal and adsorption properties compared to ordinary adsorbents, such as silica gel, zeolite and activated carbon. However, there is a need for higher thermal enhancement in composites that further intensifies their adsorption capacity. Graphene and graphene nanoplatelets (GNPs) have emerged as suitable thermal enhancers because of their high thermal conductivity of 3000 W m−1 K−1 and 6 W m−1 K−1 parallel and perpendicular to the surface, respectively [19,23,24]. Graphene nanoplatelets have a planar shape and comprise short stacks of graphene sheets made from a few layers of graphite with a thickness of 0.1–100 nm [25]. GNPs are preferred as a composite enhancer material to graphene because of their low cost that supports their large-scale production [26,27]. Pal et al. developed composites from activated carbon, graphene nanoplatelets and PVA binder, which resulted in a thermal conductivity of 1.55 W m−1 K−1, i.e., 23.5 times higher than activated carbon powder [19].
Ionic liquids (ILs) are tuneable non-molecular compounds made of ions with a melting point less than 100 °C and possess appealing physicochemical properties, which include very low vapour pressure at room temperature, advanced chemical and thermal stability with high ionic conductivity, and high interactions with water at room temperature [28,29,30]. The existence of cations and anions in ILs is a major contributor to their thermal stability. ILs have an ability to interact with solutes in specific ways that can be achieved by changing the combination of ions and cations and introducing functional groups to make task-specific ionic liquids (TSILs) for a wide range of applications [31]. PILs are identified as excellent adsorbents with suitable macromolecular structures [32]. PILs have been mostly employed for carbon dioxide capture/separation applications, where Imidazolium-based ionic liquid has been reported to have high CO2 solubility [33,34]. Tang et al. [35] investigated PILs and reported a substantially improved CO2 sorption capacity and a fast sorption/desorption.
Previous research has shown that hydroscopic ILs have excellent physicochemical properties that could make them excellent sorbents or utilised to develop highly efficient adsorption composites to enhance composites’ thermal properties. In addition, there are notable improvements in the thermal properties of consolidated composites involving GNPs. However, there is an important gap in developing consolidated composites with both improved thermal properties and adsorption capacity, specifically IL/GNP consolidated composites. Such composites are crucial to address the water–energy and cooling–energy nexus for the cooling and desalination features of adsorption systems. Therefore, this work is the first to study the hypothesis that IL-based consolidated composites employing ILs, GNPs and PVA binder would enhance the adsorption and heat transfer performance for a desalination-cum-cooling application to address the abovementioned challenges. Therefore, the objectives of this study are to (1) develop a GP/IL consolidated composite employing a PVA binder; (2) experimentally investigate the thermal and adsorption characteristics of the developed consolidated composite; (3) investigate the impact of the PVA binder and compressional force used in the development of the composites on the thermal and adsorption properties of the developed composites; and (4) study the heat transfer and water uptake of the consolidated composite at both the component level (adsorbent bed) and system level using computational dynamics modelling and benchmark it against a baseline widely employed adsorbent silica gel. The novelty of this work lies in developing the enhanced IL/GP consolidated composites and investigating their performance at the material-to-system level. The impact of this work is to address the challenges about utilising cooling and desalination systems that can be potentially renewable-powered and promote the energy efficiency of such systems as reported by Alsaman et al. [36].
2. Materials and Method
Graphene nanoplatelets (i.e., graphene-derivative at the nanoscale), ILs and PVA were employed to develop the composites. Two ILs, Ethyl-methylimidazolium chloride (EMIM Cl) and Ethyl-methylimidazolium methane sulfonate (EMIM CH3SO3), were sourced from Sigma Aldrich (UK). The host matrix for the IL comprised few-layered pristine graphene platelets of 1–5 layers and commercially known graphene nanoplatelets sourced from Graphitene Ltd. (UK). The pristine GP was selected because of its superior thermal diffusivity of 22.3 mm2/s and high BET surface area of 56.8978 m2/g compared to other graphene derivatives [37]. The PVA was sourced from ThermoFisher Scientific (UK). The developed composites were benchmarked against Fuji Silica gel (SG) of 0.18–1 mm particle size, representing a widely used adsorbent in several applications.
While the ionic liquids (EMIM CH3SO3) and (EMIM Cl) have advanced properties that can enhance adsorption performance, they are expensive, specifically, because they were initially developed for other purposes (e.g., solvents, electrolysis, separation, heat transfer fluid), which can increase the overall cost of water desalination and cooling. However, this can be addressed by large-scale production of the ionic liquid, which will enhance value for money in the case of large-scale adoption.
Figure 1 shows a two-bed adsorption desalination and cooling system that was used to computationally study the performance of the developed composites at the system level. The basic structure of the adsorption desalination and cooling system comprises a packed finned adsorbent bed as the main component, an evaporator and a condenser. In the adsorption system, the driving potential is adsorption and desorption reactions that occur between the adsorbent material and water vapour. Saline or brackish water is supplied to the evaporator. Valve 1 opens to allow water vapour into adsorbent bed 1 because of the pressure difference between the heat exchangers. During the adsorption process, cooling water is supplied to reduce the heat generated by the exothermic adsorption process. Once the adsorption is completed, valve 1 is closed and hot water is supplied to the adsorbent bed to regenerate adsorbent material (i.e., the desorption process) in the saturated adsorbent bed, which brings the adsorbent bed pressure to condenser pressure. Valve 2 opens during desorption to allow desorbed water vapour to enter the condenser, where it is condensed by the cooling water flows in the condenser. When most of the water on the adsorbent is driven off, cold water is circulated in the bed to reduce the pressure back to the evaporator pressure. The cooling effect is obtained at the evaporation process as a by-product of water desalination. For continuous operation, vapour from the evaporator enters adsorbent bed 2 through valve 3 when valve 1 is closed.

Figure 1.
Schematic diagram of a two-bed adsorption cooling and water desalination system [38].
Composite Preparation
There are two processes for developing composite adsorbents, namely physical mixing or impregnation and the chemical process [39]. The impregnation process was employed to prepare the consolidated composite tablets because of its simplicity and the ability to provide high bulk/interfacial deposit onto the host matrix [37]. The synthesis process involved several steps as shown in Figure 2. First, 1 g of the host material GNP was heated in an oven at 150 °C for 12 h to remove the moisture content and impurities. Second, the ILs were mixed with purified water to form aqueous solutions at 30 wt% concentration. The host matrix from the oven was then immersed into the IL aqueous solution and stirred for 1 h until a homogeneous mix was achieved. The binder solution was prepared by mixing PVA with pure water to utilise various binder concentrations of 2, 5 and 10%. The binder solution was added to the GNP/IL mixture, and the composite were compressed in a shaping mould using predefined weights to provide the required compression. Three different compression pressures of 1, 1.5 and 2 MPa were used to investigate the effect of varying the compression pressure on the composite. The application of these compression pressures was crucial in giving the desired tablet form and ensured that the constituents of the composites (IL and PVA) were not completely driven out during the compression. Finally, the compressed composite samples were dried in an oven at 150 °C for 12 h. The dry sample masses ranged from 0.2 to 0.3 g. The samples’ diameter was 12.7 mm with a thickness of 2.5 mm. It is noteworthy that the 30 wt% IL concentration was regarded as the optimal concentration from previous research that investigated concentrations of 10–40 wt% of powdery GP/IL composites [37].
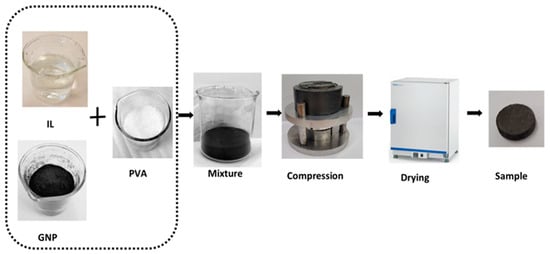
Figure 2.
Composite preparation steps using wet impregnation method.
3. Composite Experimental Analysis
3.1. Heat Transfer Properties
An experimental investigation of the thermal diffusivity was performed to determine the dynamic thermal response of the consolidated composites. The NETZSCH LFA 467 Hyper Flash Laser flash analyser (LFA) was used. A tablet form composite of a 12.7 mm diameter and 2.5 mm thickness was inserted into the LFA machine for the thermal test. The experiments were performed three times with five laser shots at each trial to determine repeatability. A standard deviation of 0.01 was achieved for the repeated measurements and the mean values of three tests for each composite were used as the thermal diffusivity values. The thermal properties experimentation protocol is reported in previous studies about the powdery graphene-based composites and graphene oxide adsorbents and is also available in the Supplementary Material [37,38]. Table 1 shows the range of developed composites, thermal diffusivities, PVA concentration and compression force per unit area used for composite consolidation. Figure 3 shows the comparison of the developed composites’ thermal diffusivities and their material-level physical significance compared to silica gel as a baseline material.

Table 1.
Thermal diffusivities, PVA composition and compression pressure of developed composites.
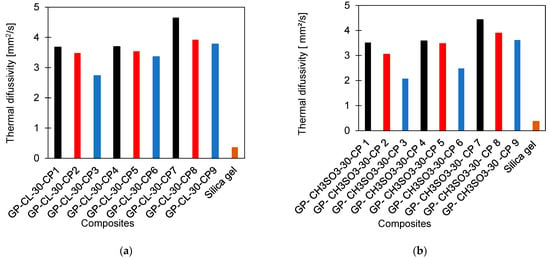
Figure 3.
Comparison of developed consolidated composite thermal diffusivities with SG (a) GP-CL-30-CP1-9 and (b) GP-CH3SO3-30-CP1-9.
The thermal diffusivities of all the developed consolidated composites were substantially higher than the SG baseline adsorbent. The higher the compression applied during preparation of the composites, the higher the thermal diffusivities. The highest compression was 2 MPa for GP-CL-30-CP7 and GP-CH3SO3-30-CP7, where GP-CL-30-CP7 showed the highest thermal diffusivity, 12.7 times higher than the SG. The increase in thermal diffusivity of consolidated composite tablets with the increase in the compression is attributed to reducing the interlayer voids by compression and enhancing the contact between the graphene layers and ILs for better heat transfer. This agrees with the findings by Wu et al. [41] in their study of composite bricks made from silica gel and copper nano powder and PVA binder, showing that compression closed intra-particle space and improved contact area, increasing the heat transfer. Another noteworthy effect of increasing the compression is increasing the overall density of the developed composite, resulting in the contradicting effect of decreasing the thermal diffusivity.
The PVA concentration also influenced the overall thermal diffusivity of the developed composites. The composites GP-CL-30-CP7 and GP-CH3SO3-30-CP 7 showed the highest thermal diffusivities where the lowest PVA concentration of 2% was used, followed by composites with 5% and 10% PVA concentrations. This is attributed to the relatively low heat transfer properties of PVA with a thermal conductivity of 0.31 W m−1 K−1 [42]. This agrees with the findings reported by Younes et al. [20] in their investigation of silica gel composites with polymer binders.
3.2. Composite Adsorption Properties
The materials’ adsorption properties were determined using the dynamic vapour sorption (DVS) gravimetric analyser DVS Resolution™. The gravimetric technique was used following the method reported in previous studies and is also in the Supplementary Material [37,38]. The adsorption property measurement requires a small weight sample size, and therefore samples of 5 mm diameter were utilised in the adsorption characteristics to fit in the sample holder and meet the DVS test sample mass requirements. The adsorption isotherms were given as the water uptake corresponding to vapour pressure values obtained by measuring the adsorbent mass at that condition, where the adsorbent mass does not change at a specific temperature and water vapour pressure ratio. The detailed information on the adsorption determination and equipment are given in the Supplementary Material. Figure 4 shows the adsorption isotherms of the consolidated composites benchmarked against silica gel.
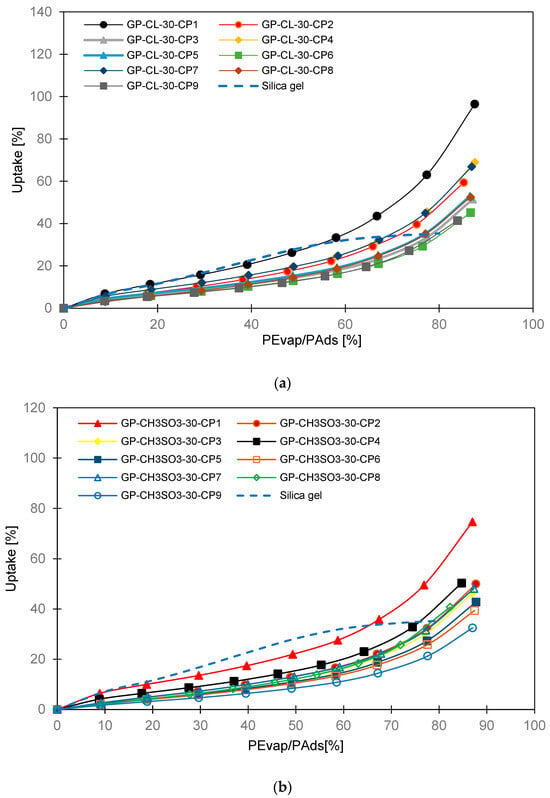
Figure 4.
The equilibrium adsorption isotherms for the consolidated composites benchmarked against silica gel baseline adsorbent; (a) GP-CL-30-CPx composites and (b) GP-CH3SO3-30-CPx composites.
3.2.1. Adsorption Isotherms
Adsorption isotherms were developed by measuring the adsorbent mass at the condition of no change in mass at a defined water vapour pressure ratio and 25 °C adsorption temperature.
Isotherm modelling is imperative to further analyse the adsorption at component and system levels. There are three predictive modelling approaches, including empirical modelling, machine learning and molecular modelling [43]. Empirical modelling is applicable when fitting adsorption isotherms and developing empirical correlations [44]. Therefore, empirical modelling was preferred in this study since it is simple and reliable to implement.
Empirical isotherm models like Langmuir, Freundlich, Sips, Dubinin-Astakhov (D-A), Tóth, Temkin and Hill–de Boer are widely used to determine the isotherm characteristics based on the heat of adsorption, solid saturation loading, adsorption equilibrium constant and temperature-dependent saturation [45,46,47,48,49]. The developed consolidated composites exhibited a type-II isotherm, where the D-A model stated in Equation (1) was the most appropriate for emulating the experimental data.
where q (kg/kg) denotes adsorption uptake at a temperature and the corresponding pressure ratio; is the equilibrium uptake (kg/kg); E is the characteristic energy of adsorption (KJmol−1); Ps (kPa) is the saturation pressure at the corresponding temperature; and the index n is the heterogeneity coefficient.
Non-linear isotherm models give a high correlation value (R2) and describe equilibrium data with a high accuracy compared to linearised models [50]. To ensure that the adsorption isotherms had a good correlation with the experimental values, a non-linear optimisation method was used to determine the D-A model parameters. Table 2 and Table 3 show the parameters for the D-A model utilised in isotherm experimental data empirical modelling for the developed composites with a root-mean-square deviation (RMSD) of less than 5% and regression parameter R2 of 0.98. The experimental adsorption isotherms and the isotherm model had a 0.05 mean deviation, showing a good agreement, as shown in Figure 5.

Table 2.
GP-CL-30 composite model fitting parameters.

Table 3.
GP-CH3SO3-30 D-A model fitting parameters.
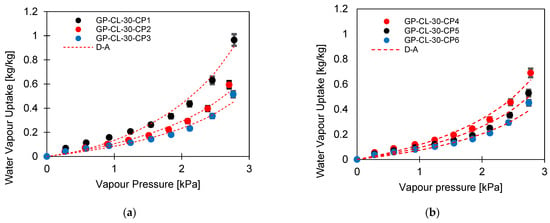
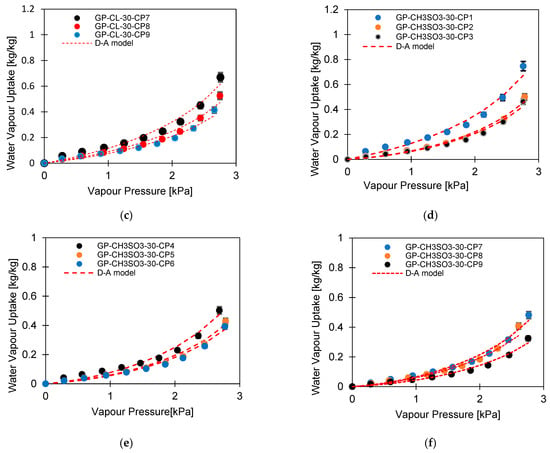
Figure 5.
Experimental isotherm of the consolidated composite modelled with the D-A model; (a–c) GP-CL-30-CPx composites and (d–f) GP-CH3SO3-30-CPx composites.
The experimental isotherm data showed that the IL had a substantial influence on the water uptake of the composites. All composites had higher water uptake compared to the baseline SG. When ILs were the only sorption material, GP-CL-30-CP1 was the most outperforming composite at 64% compared with SG. Such a composite experienced the least compression of 1MPa and lowest PVA concentration of 2%. However, the water uptake for the consolidated composites was less than that of the previously studied powdery composite of the same GP/IL composites, without PVA [37]. The low water uptake for the consolidated composites compared to powder form is attributed primarily to the leakage of ILs during the composite compression, hence reducing the IL contents. In addition, the PVA binder reduces the sorbate molecular mobility, hence reducing adsorption capacity, as reported by Rocky et al. [39]. The presented results agree with the analogous study conducted by Pal et al. [13] about comparing Maxsorb III activated carbon utilising PVA- and IL-based binders.
3.2.2. Adsorption Kinetics
Linear driving force (LDF) was used to determine the adsorption and desorption rate. It is a simplified model and overlooks the inter-particle mass transfer resistance, yet it is accurate and widely utilised to represent the sorption kinetics [51]. The LDF model utilising the Arrhenius equation to calculate the diffusion time constant is shown in Equation (2).
Equation (4) can be rearranged, as shown in Equation (5).
where is the diffusion time constant. The equilibrium uptake (kg/kg) is determined from the D-A and modified Freundlich models for GP/IL and SG, respectively; is the uptake at a time; (m2 s−1) is the pre-exponential coefficient; (kJ/kg) is the activation energy; (kJ.kmol−1K−1) is the universal gas constant; (m2 s−1) is the surface diffusivity; is the particle radius (m); and T (K) is the adsorbent temperature. The constant 15 was used, since SG particles are spherical, as reported by Zhang et al. [52], and as it also seems suitable for the developed composites. The values of and were determined by the Arrhenius plot in which is plotted against (1/T). The slope of the plot represents and the intercept gives the constant based on Equation (4) [21]. The LDF model’s coefficients are given in Table 4.

Table 4.
The empirical constants for the LDF model.
3.2.3. Isosteric Heat of Sorption
The isosteric heat of sorption is defined as the heat released when vapour is adsorbed onto a solid surface at constant temperature and it represents the quantity of heat exchanged between adsorption and desorption, which is crucial to determine the energy involved in the adsorption system [53]. The Clausius–Clapeyron equation is used to calculate the heat of adsorption. However, it does not capture the full extent of the heat of adsorption and is mostly valid at low pressures, making it inapplicable for high pressures. Chakraborty et al. [54] proposed an equation for calculating isosteric heat of adsorption (Qst), called the Chakraborty–Saha–Koyama (C-S-K) which captures the full extent of the heat of adsorption and applicable at high pressure [54]. The C-S-K was developed based on the principle of equilibrium chemical potential between the adsorbed and the gaseous phase, the equations of state and the Maxwell relations [53]. The Qst for the investigated composite adsorbents was calculated as a function of the sorption potential gradients of pressure and temperature concerning entropy and specific volume. Equation (6) defines the C-S-K equation to calculate the isosteric heat or adsorption enthalpy. The calculated isosteric heat for the developed consolidated composites is presented in Table 5.
where R (J g−1 K−1) denotes the gas constant; g (m3 kg−1) is the specific volume of the adsorbate; q is the uptake kg/kg; and T (K) is the adsorption temperature at the corresponding pressure P (kPa).

Table 5.
Isosteric heat of sorption of the developed composites.
The isosteric heat of sorption for both the GP-CL-30-CP1-9 and GP-CH3SO3-30-CP1-9 consolidated composites decreases as the uptake increases, as shown in Figure 6. The higher isosteric heat of sorption is realised at the initial stages where the adsorbate molecules are adsorbed on to higher energy sorption sites, distributing higher heat energy and hence higher adsorption enthalpy [37]. However, as the water uptake increases, the high energy sites became saturated, resulting in the water molecules being adsorbed on to those available sites possessing lower energy, resulting in the gradual decrease in adsorption energy.
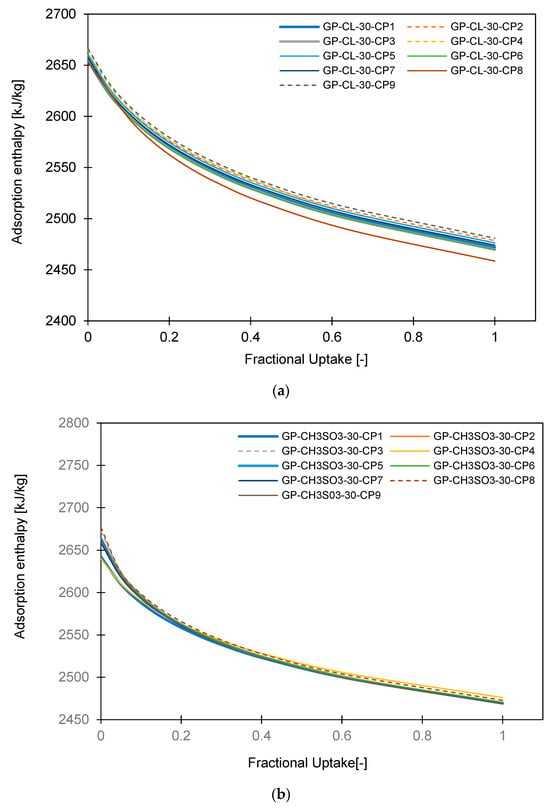
Figure 6.
Isosteric heat of adsorption of the developed consolidated composites (a) GP-CL-30-CP1-9 and (b) GP CH3SO3-30-CP1-9.
4. Composite Cyclic Performance
This section investigates the material-level cyclic performance of the developed composites and the impact of the developed composites on the component- and system-level performance utilising 2D multi-physics modelling. The emphasis is on two evaporation temperatures of 12 °C and 30 °C. The high evaporation temperature of 30 °C was effective in situations where desalination was prioritised over cooling to avoid the inferior sorption properties at low vapour pressures.
4.1. Material-Level Cyclic Performance
The water uptake potential of the developed composites was determined by performing a material-level cyclic analysis of the experimentally developed isotherms compared to the baseline adsorbent silica gel. Figure 7a,b show the adsorption cooling and desalination cycle (1-2-3-4-1). Two evaporation temperatures at 12 °C and 30 °C, a 35 °C condensation temperature and a 85 °C regeneration temperature were utilised for the assessment. The highest-performing composites with low compressional pressure applied and low PVA concentration, i.e., GP-CL-30-CP1 and GP-CH3SO3-30-CP1, were investigated. At the low evaporator temperature of 12 °C, corresponding to a vapour pressure of 1.4 kPa, the silica gel water uptake performance potential was higher than that of GP-CL-30-CP1 and GP-CH3SO3-30-CP1, in contrast to the performance when the evaporator temperature was 30 °C corresponding to (Pv = 4.2 kPa). At the 12 °C evaporator temperature, the net cyclic water uptake was 0.169 kgw/kgads for SG, 0.157 kgw/kgads for GP-CL-30-CP1 and 0.132 kgw/kgads for GP-CH3SO3-30-CP1. At 3.2 kPa, the GP-CL-30-CP1 isotherm intersects SG while the CH3SO3-30-CP1 isotherm intersects the SG isotherm at 3.8 kPa. As the vapour pressure increases, the net cyclic equilibrium uptake for GP-CL-30-CP1 and CH3SO3-30-CP1 increases by 63% and 51% respectively, as shown in Figure 7b. This showed that higher vapour pressures and evaporation temperatures produce more freshwater at the expense of lowering the cooling temperature.
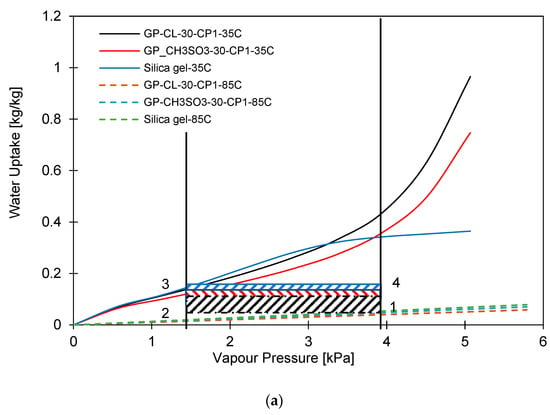

Figure 7.
Comparison of GP-CL-30-CP1, GP-CH3SO3-30 CP1 and SG at 35 °C, condensation and 85 °C, regeneration temperatures for (a) 12 °C and (b) 30 °C evaporation temperatures.
4.2. Component-Level Cyclic Performance
The water uptake potential of the consolidated composites was further investigated to understand the combined impact of their thermal and adsorption characteristics at the component level compared to the baseline adsorbent SG. A 2D multi-physics model reported in a previous study by Banda et al. [38] was employed for this analysis. Computational dynamic modelling is crucial for component- and system-level investigation [56]. The simulation was performed for 400 s and 800 s cycle times, including a switching time of 30 s. The same simulation process used is reported in the previous publication by Banda et al. [38].
The ANSYS workbench Fluent 2019 R2 was used to simulate the flow in porous media to envisage the heat and mass transfer. The geometry for the simulation was a circular finned tube heat exchanger, where the consolidated adsorbent blocks are assumed to fill the gaps between the fins. The simulated finned tube adsorbent bed, the axisymmetric computational domain and the mesh replicating the simulated geometry are shown in Figure 8. The axisymmetric computational domain was half the space between two fins. The geometry parameters and operating conditions used for the modelling are shown in Table 6 and Table 7.
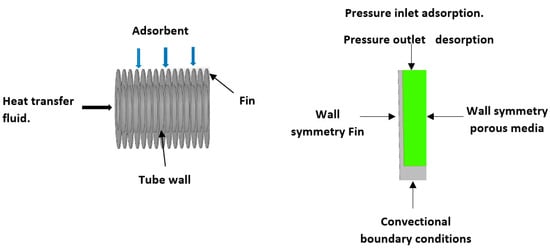
Figure 8.
Schematic finned tube and axisymmetric geometry of the simulated adsorbent bed, where the consolidated adsorbent fills the spaces between the fins.

Table 6.
Simulation geometry dimensions.

Table 7.
Operating conditions and parameters for the simulation.
The governing equations used in the computational modelling, including the adsorbate diffusion, mass conservation, adsorbate mass balance continuity, momentum conservation and energy, are detailed in the Supplementary Material. The boundary conditions for the vapour to the adsorbent upper surfaces during adsorption were considered as a pressure inlet and pressure outlet for the desorption process. A better convergence was achieved by using known pressure boundary conditions. Convection heat transfer occurred between the heating/cooling water (heat transfer fluid) and the inner tube walls. Between the finned tube walls and the adsorbent, the no-slip boundary condition was employed. The calculated heating/cooling water flow rate to maintain adsorption and desorption temperature was 0.036 kg/s. The water temperature in the tube was input as a polynomial function and introduced onto Fluent as the free stream temperature using UDFs. The heat transfer coefficient for the convection heat transfer was determined using the Dittus and Boelter correlation.
The results show the physical significance of the developed composites at the component level compared to utilising the baseline silica gel. Although the isotherm cyclic performance analysis showed that SG outperformed the composites at low evaporator temperatures and low vapour pressure, the dynamic simulation showed that the consolidated composites outperformed SG in terms of the heat thermal response, hence promoting the adsorption performance. The improved adsorption performance of the consolidated composite was attributed to the enhanced heat transfer properties. The temperature dynamic profiles in Figure 9 shows changes occurring in the adsorbent bed at 12 °C and 30 °C evaporator temperatures. The outcome of the simulation shows the high performance of all consolidated composites compared to SG over the entire cycle. At the evaporator temperature of 12 °C, the net cyclic water uptake was 70% and 68% higher than SG for GP-CL-30-CP1 and CH3SO3-30-CP1. Figure 10 shows that the 30 °C evaporation temperature resulted in a significant improvement in the thermal and adsorption capacity of the composite, leading to high water production between 60 and 75% over the entire cycle compared to SG. These findings agree with the previously developed GP/IL composites by Banda et al. [38]. The different colour maps show the adsorbent segments’ temperature and uptake for a full cycle, which includes the adsorption/desorption process. The time allocated for each colour map is for the full adsorption and desorption cycle, rather than the half cycle time.
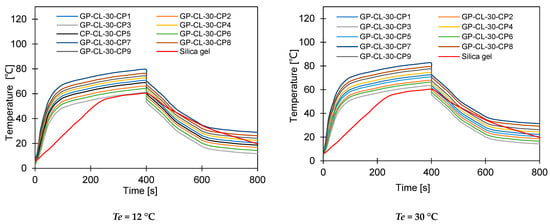
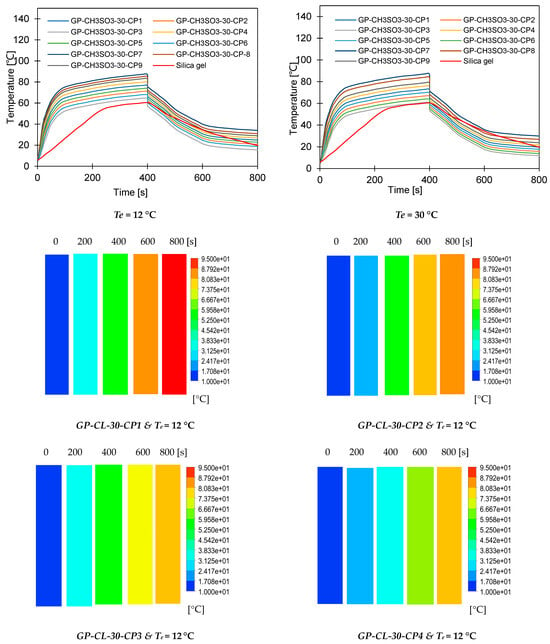
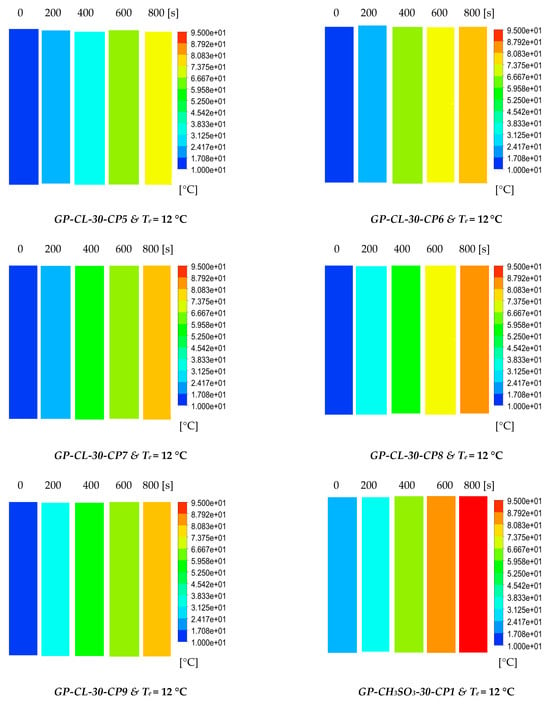
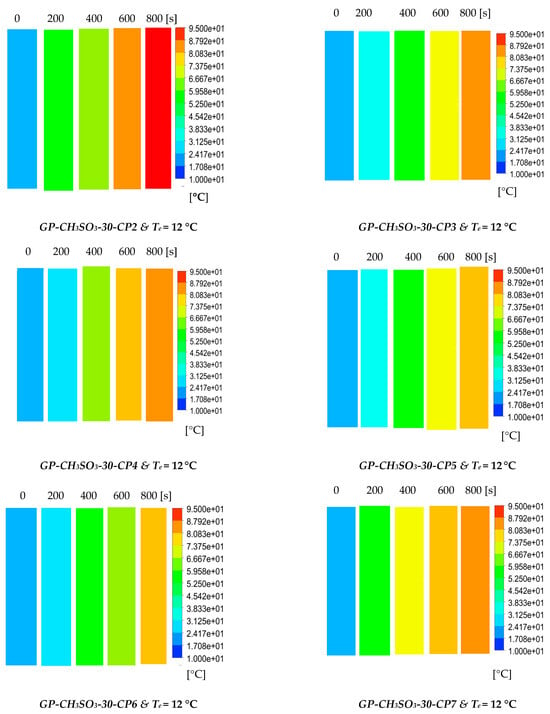
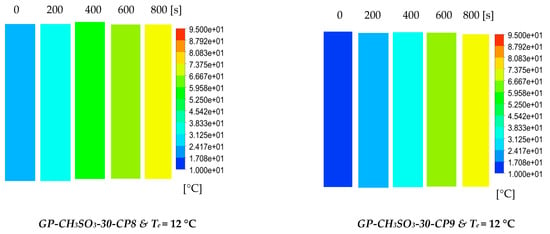
Figure 9.
Dynamic temperature profiles and contour colour maps at different flow times for GP-CL-30-CP1-9 and GP-CH3SO3-30-CP1-9.
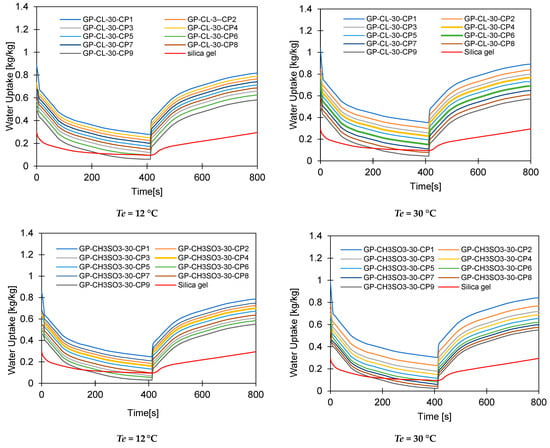
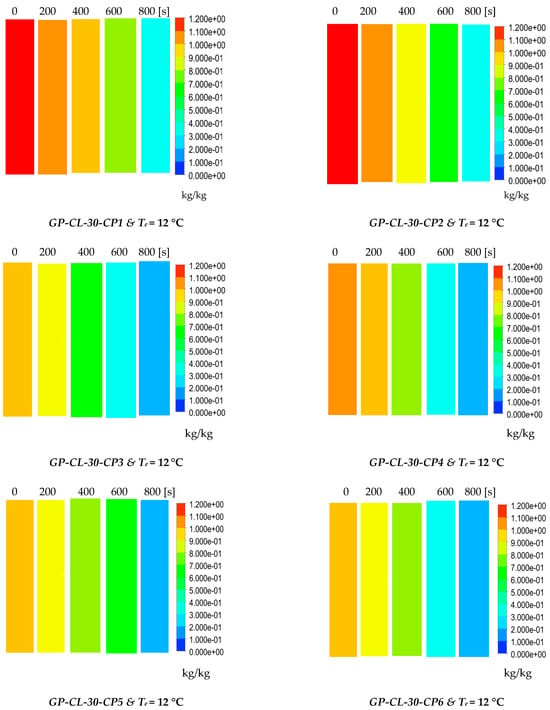
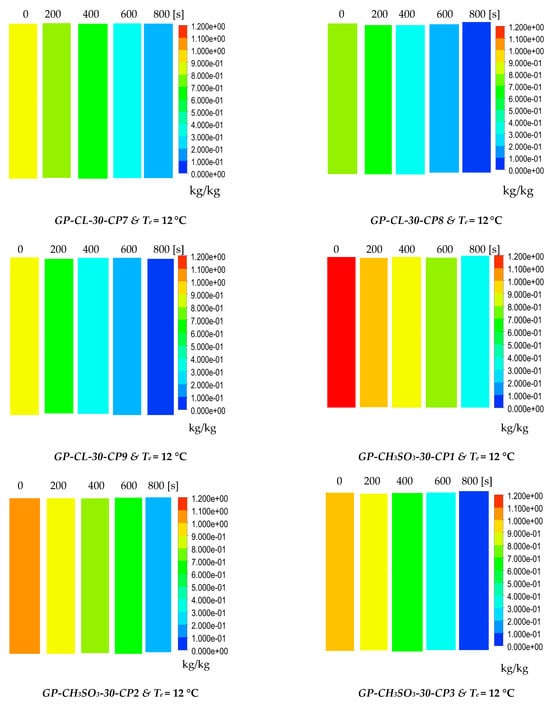

Figure 10.
Dynamic uptake profiles and contour colour maps at different flow times for GP-CL-30-CP1-9 and GP-CH3SO3-30-CP1-9.
4.3. Exergy Destruction
An exergy analysis was undertaken for the adsorption cooling and desalination system utilising the GP-CL-30-CP1-9 and GP-CH3SO3-30-CP1-9 consolidated composites as the adsorbents compared to silica gel. The exergy destruction of each component and process are stated in Table 8 and Table 9. The exergy destruction showed that the desorption process utilised most of the energy and the adsorbent bed, the main component involved with the adsorption/desorption process, showed the highest exergy destruction. Of the two processes in the adsorbent bed, the desorption showed the highest exergy destruction because of its higher temperature heat of desorption, i.e., regeneration. The higher heat transfer rate in the case of GP-CL-30-CP1-9 and GP-CH3SO3-30-CP1-9 composites resulted in higher exergy destruction than SG. The 16.6% lower exergy efficiency in SG shows that less energy is used for useful energy in water and cooling production compared to 42.2% of the highest performing composite GP-CL-30-CP1. These agree with a previous study by Banda et al. [37] and confirm the outperforming thermal properties of the developed composites.

Table 8.
Exergy destruction of GP-CH3S 3-30-CP1-9 and silica gel.

Table 9.
Exergy destruction of GP-CL-30-CP1-9 composites and silica gel.
4.4. The Effect of Cycle Time
The effect of cycle time on the adsorbent bed performance was computationally investigated utilising two cycle times of 400 s and 800 s, with a switching time of 30 s each. Evaporation temperatures of 12 °C and 30 °C were considered, as shown in Figure 11, Figure 12, Figure 13 and Figure 14. The cooling water inlet temperature for adsorption and condensation was 35 °C and the desorption temperature was 85 °C. This section also shows the physical significance of the developed composites at the system level, in terms of cooling and clean water production, thermal response, and energy conversion efficiency.
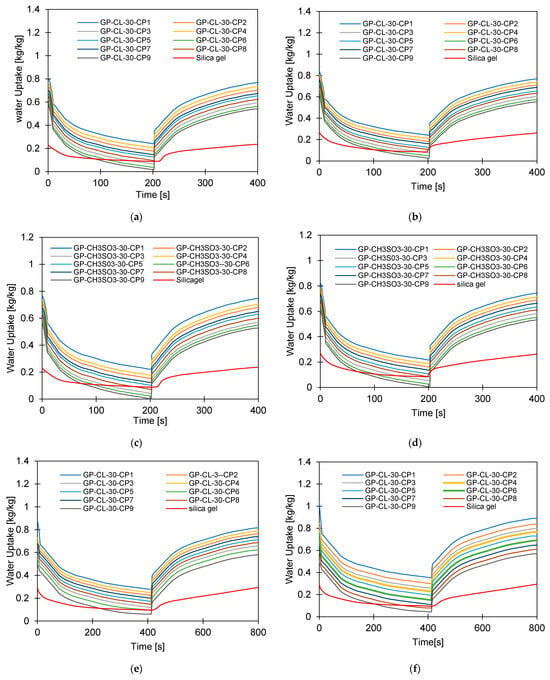
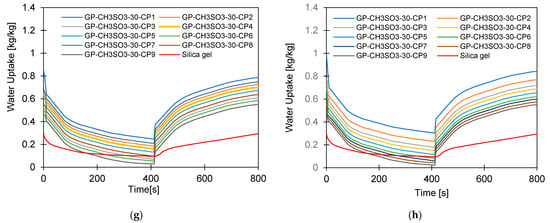
Figure 11.
Dynamic water uptake profiles for GP-CL-30 CP1 to CP9 and-CH3SO3-30 CP1 to CP9 at (a) Tev = 12 °C temperature tcycle = 400 s; (b) Tev = 30 °C temperature tcycle = 400 s; (c) Tev = 12 °C temperature tcycle = 400 s (d) Tev = 30 °C temperature tcycle = 400 s; (e) Tev = 12 °C temperature tcycle = 800 s, (f) Tev = 30 °C temperature tcycle = 800 s; (g) Tev = 12 °C temperature tcycle = 800 s; and (h) Tev = 30 °C temperature tcycle = 800 s.
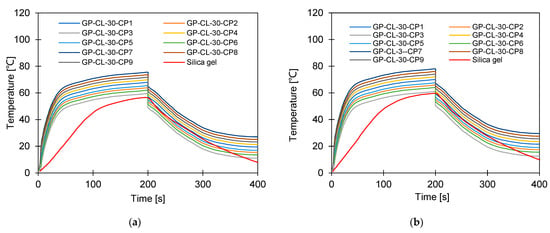
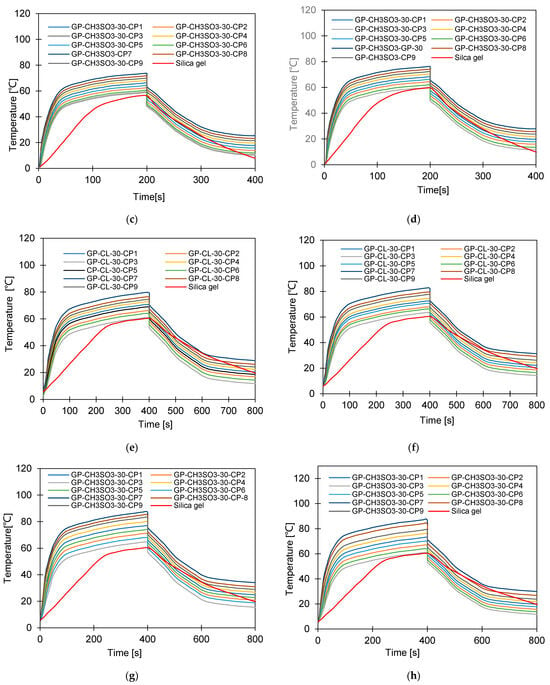
Figure 12.
Dynamic temperature profiles for GP-CL-30 CP1to CP9 at (a) Tev = 12 °C temperature tcycle = 400 s; (b) Tev = 30 °C temperature tcycle = 400 s; (c) Tev = 12 °C temperature tcycle = 400 s; (d) Tev = 30 °C temperature tcycle = 400 s. (e) Tev = 12 °C temperature tcycle = 800 s; (f) Tev = 30 °C temperature tcycle = 800 s. and (g) Tev = 12 °C temperature tcycle = 800 s; (h) Tev = 30 °C temperature tcycle = 800 s.
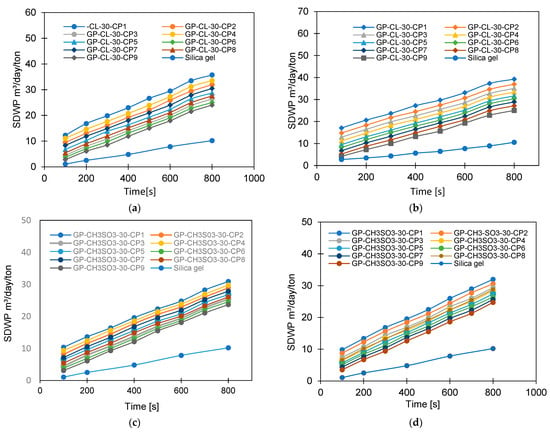
Figure 13.
The effect of changing cycle time on SDWP for GP-CL-30–CP1-9, at (a) Tev = 12 °C and (b) Tev = 30 °C and for GP-CH3SO3-30-CP1-9 and SG at (c) Tev = 12 °C and (d) Tev = 30 °C.
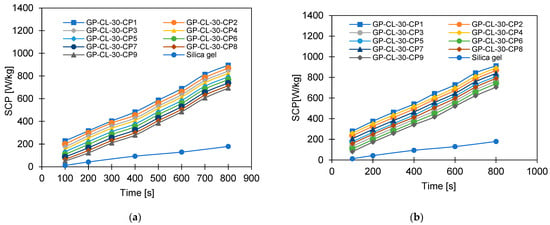
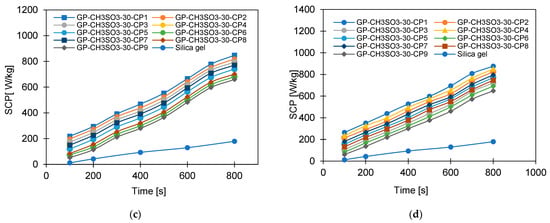
Figure 14.
The effect of changing cycle time on SCP for GP-CL-30 CP1-CP9 at (a) Tev = 12°C and (b) Tev = 30 °C and GP-CH3SO3-30 CP1-CP9 and SG time at (c) Tev = 12 °C and (d) Tev = 30 °C.
The observed results showed that the net cyclic water uptake for the 400 s cycle operating at a 30 °C evaporator temperature was higher for all composites compared to that of SG. The system utilising the GP-CL-30-CP1 composite showed the highest net cyclic uptake of 0.95 kgw/kgads, while that for SG was 0.2 kgw/kgads. The same trend was observed for the 800 s cycle. System utilises GP-CL-30-CP1 showed the highest net cyclic uptake of 0.74 kgw/kgads compared to 0.24 kgw/kgads for SG. The results show that the cyclic uptake is influenced by the adsorbent’s thermal properties, where GP-CL-30-CP1 led to a faster thermal response than SG, and hence a quick temperature change within the adsorbent bed of the GP-CL-30-CP1 led to more adsorption uptake during the cycle.
It can be observed that the highest net cyclic temperature rise was 65% for the GP-CL-30-CP1-based system compared to 51% for SG. The same trend was observed for the 800 s cycle, as utilising GP-CL-30-CP1 led to a net cyclic temperature rise of 75% compared to 58% for SG. The dynamic temperature profile of the system utilising the consolidated composites showed a steep temperature rise during the first 100 s for both the 400 s and 800 s, showing their ability to reach the desired temperature faster, hence improving cyclic performance.
The same trend was observed when the system operated at a 12 °C evaporation temperature, where the net cyclic water uptake for the system utilising GP-CL-30-CP1 showed the highest performance of 0.42 kgw/kgads and 0.10 kgw/kgads when utilising SG. The similar trend was observed on the 800 s cycle time systems, where the net cyclic uptake was high in all the composites, with the GP-CL-30-CP1 showing 0.4942 kgw/kgads. The system utilising SG showed 0.12 kgw/kgads.
The net cyclic temperature rises were 76 °C and 62 °C for GP-CL-30-CP1 and SG when operating at a 400 s cycle time and 12 °C evaporation temperature. The trend of the dynamic temperature profile for both the 400 s and 800 s times showed a steep rise primarily in the first 100 s, showing a rapid heat transfer to the adsorbent bed, followed by a moderate change in temperature in all composites. Such a moderate change reflects the slower heat transfer as the adsorbent bed is closer to the thermal equilibrium than the initial 100 s. SG exhibited a gradual cyclic temperature change with steeper change in the temperature near the end of the adsorption compared to the desorption. Such a steeper change is attributed to more stored heat in the silica gel slowing the thermal equilibrium compared to the developed composites, since the developed composites have better thermal diffusivity. The net cyclic uptake and net cyclic temperature rise was higher in the longer cycle time for the 12 °C and 30 °C evaporation temperatures. These findings agree with the findings by Li et al. [57].
More investigation was performed on the influence of varying the cycle time on the system performance, as shown in Figure 13, Figure 14, Figure 15 and Figure 16. Increasing the cycle time increased the SDWP, SCP, COP and the exergy efficiency by utilising all investigated materials because of the increased time for water adsorption. The increased water uptake results in a gradual increase in specific cooling power, specific water production, COP and exergy efficiency within the investigation range. The developed composite outperformed SG when operated at a 12 °C evaporation temperature. The highest-performing composite was GP-CL-30-CP1, showing higher SDWP, SCP, COP and exergy efficiency than SG by orders of 53%, 29%, 18% and 21.5%. Operating at the 30 °C evaporation temperature increased SDWP, SCP, COP, and exergy efficiency for the GP-CL-30-CP1 by 57%, 32%, 20% and 24% compared with SG, respectively.
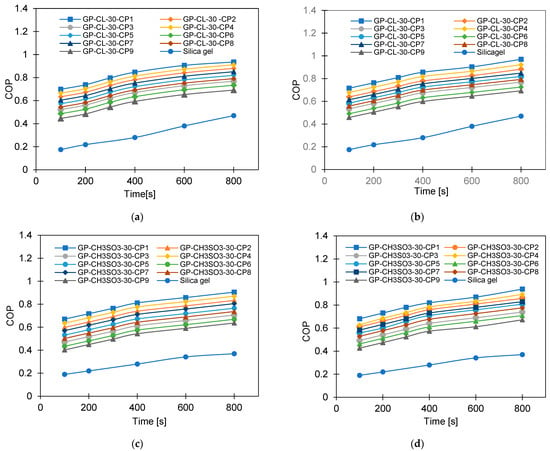
Figure 15.
The effect of changing cycle time on COP for GP-CL-30 CP1-CP9 and SG at (a) Tev = 12 °C and (b) Tev = 30 °C and GP-CH3SO3-30 CP1-CP9 and SG time at (c) Tev = 12 °C and (d) Tev = 30 °C.
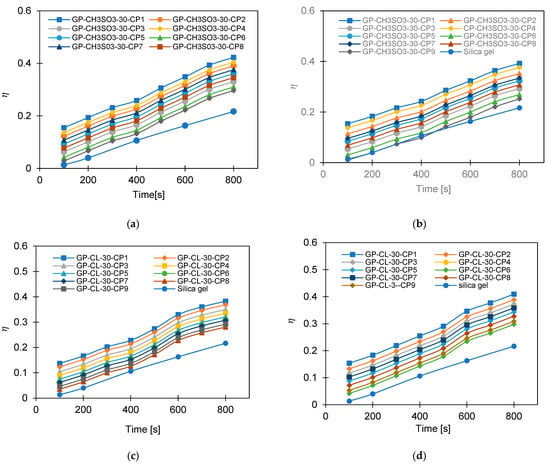
Figure 16.
The effect of changing cycle time on exergy efficiency for GP-CH3SO3-30 CP1-CP9 and GP-CL-30 CP1-CP9 (a) Tev = 12 °C and (b) Tev = 30 °C and SG time at (c) Tev = 12 °C and (d) Tev = 30 °C.
The improved overall system performance reflects the enhanced thermal properties by utilising the developed composites that prompted the adsorption properties. The enhanced exergy efficiency reflects the enhanced energy utilisation of the developed composites. The results agree with previous work by Cao and Chung [58], which studied the influence of cycle time on performing the silica gel/water adsorption cooling system. The changes in the system performance by varying the cycle time from 400 s to 800 s and across the investigated range (100–800 s) are quantified and outlined in Table 9.
4.5. The Effect of Heat Source Temperature
The impact of varying the heat source temperature from 60 °C to 85 °C was investigated, while the evaporation temperatures of 12 °C and 30°C and the cooling water temperature of 35°C were used for adsorption and condensation, and the cycle time was 800 s. The effect of increasing heating water temperature on the SDWP is shown in Figure 17. Utilising a 12 °C evaporation temperature, the increase in heat source temperature from 60 °C to 85 °C increased the SDWP and the highest-performing composite was GP-CL-30-CP1, showing a 60% increase in SDWP (from 9 to 33 m3/day/ton) compared to 53% (from 3.1 to 6.6 m/day/ton) for the SG-based system.
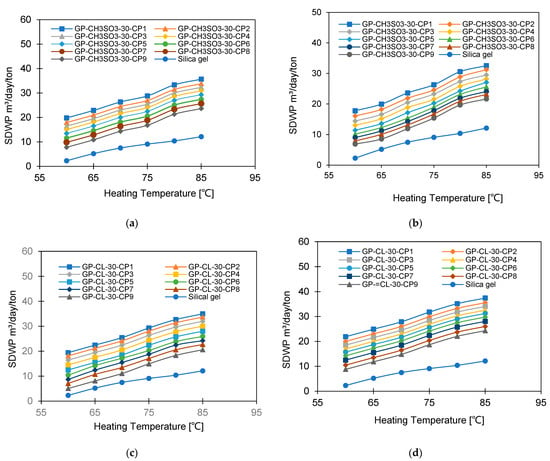
Figure 17.
SDWP at different heating water temperatures for GP-CH3SO3-30 CP1-CP9 (a) Tev = 12 °C and (b) Tev = 30 °C and GP-CL-30 CP1-CP9 (c) Tev = 12 °C and (d) Tev = 30 °C.
The SDWP for all composites and SG increased by increasing the heating water temperature from 60 °C to 85 °C, while the evaporation temperature was kept at 30 °C. Utilising GP-CL-30-CP1 showed an increase of 77% (from 10 to 34.6 m3/day/ton) in SDWP, while SG showed a 73% increase (from 5.2 to 19.5 m3/day/ton), meaning GP-CL-30-CP1 outperformed SG by 42%.
Figure 18 shows the effect of increasing the heating water temperature from 60 °C to 85 °C on the SCP. The highest-performing composite was GP-CL-30-CP1, which outperformed SG by 32% when operated at a 12 °C evaporation temperature and by 40% when operated at a 30 °C evaporation temperature. The improved performance of GP-CL-30-CP1 confirmed the enhanced thermal properties of the developed composites, leading to promoting the adsorption potential, and hence the SDWP performance. Increasing the heating water temperature from 60 °C to 85 °C enhanced the SCP for GP-CL-30-CP1 by 305% (from 260 to 912.2 W/kg) compared to 200.8% (from 9.2 to 75.47 W/kg) for SG when operated at a 12 °C evaporation temperature. The observed results in which system performance increased in terms of SDWP and SCP with increases in heat source temperature agree with the previous findings by Youssef et al. [59].
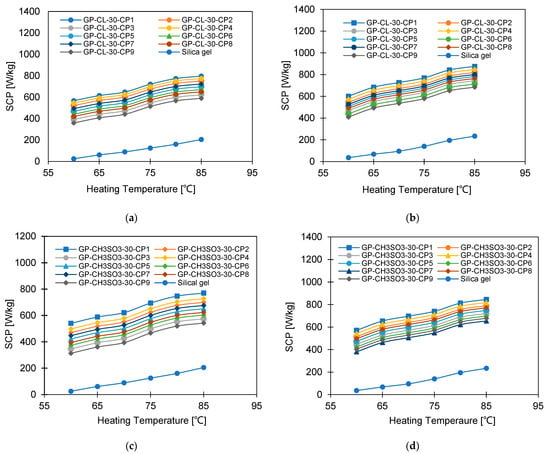
Figure 18.
SCP at different heating temperatures for GP-CL-30 CP1-CP9 at (a) Tev = 12 °C and (b) Tev = 30 °C and GP-CH3SO3-30 CP1-CP9 and SG at (c) Tev = 12 °C and (d) Tev = 30 °C.
Figure 19 and Figure 20 show the impact of heating water temperature on the system-level COP and exergy efficiency. It can be observed that increasing the heating water temperature (heat source) enhanced the COP but showed an inferior impact on the exergy efficiency. Enhancing the COP is attributed to increasing the cooling capacity regarding a lower increase in the heat utilised for regeneration. As for the exergy efficiency, the higher the heating source temperature, the higher the exergy destruction in the adsorbent bed, which reduced the system’s overall exergy efficiency.
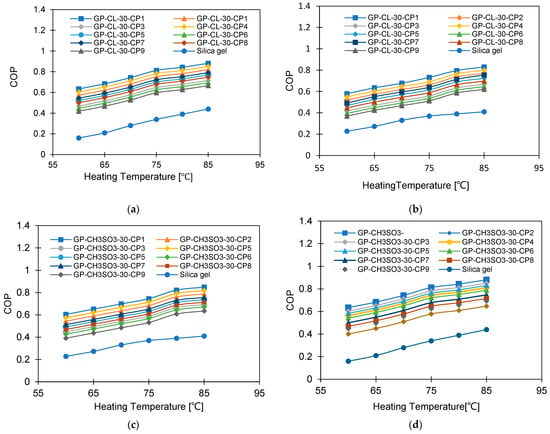
Figure 19.
COP at different heating temperatures for GP-CL-30 CP1-CP9: (a) Tev = 12 °C and (b) Tev = 30 °C and GP-CH3SO3-30 CP1-CP9 and SG at (c) Tev = 12 °C and (d) Tev = 30 °C.
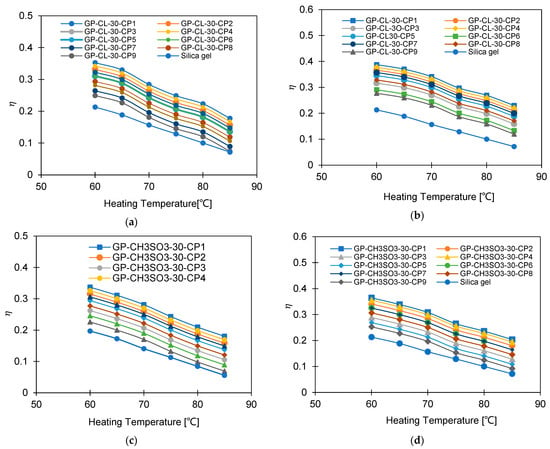
Figure 20.
Exergy efficiency at different heating temperatures for GP-CL-30 CP1-CP9 at (a) Tev = 12 °C and (b) Tev = 30 °C and GP-CH3SO3-30 CP1-CP9 and SG at (c) Tev = 12 °C and (d) Tev = 30 °C.
The COP of GP-CL-30-CP1 increased by 102% (from 0.40 to 0.85) and by 40.8% for SG (from 0.154 to 0.40) at the 12 °C evaporation temperature, whilst at the 30 °C evaporation temperature an improvement of 79.4% (from 0.478 to 0.75) was seen for GP-CL-30-CP1 and 72.5% (from 0.261 to 0.65) was seen for SG when the heat source temperature increased from 60 °C to 85 °C. The decrease in exergy efficiency for the GP-CL-30-CP1 was 42% (from 0.405 to 0.32) and 44.5% (from 0.218 to 0.121) for SG operating at the 12 °C evaporation temperature, while at 30 °C the decrease was 29.6% (from 0.248 to 0.126) for GP-CL-30-CP1 and 74.3% (from 0.248 to 0.101) for SG when the heat source temperature increased from 60 °C to 85 °C. The average COP for GP-CL-30-CP1 was 76% and 70% higher than the SG-based system operating at 12 °C and 30 °C evaporation temperatures. The GP-CL-30-CP1 has a higher exergy efficiency because of its high adsorption capacity and rapid thermal response, resulting in a high energy conversion rate to produce more cooling and water. SG showed lower exergy efficiency, caused by its inefficiencies in heat transfer and low adsorption capacity, resulting in less cooling and water production than GP-CL-30-CP1 utilising the same heat source temperature. These findings agree with the parametric study undertaken by Cao and Chung [58].
5. Conclusions
This study aimed to develop and investigate consolidated adsorption composites comprising a GP host matrix and ILs: EMIM CH3SO3 and EMIMCl separately. The composites with 30 wt% ILs and PVA binder at various concentrations (2, 5 and 10% compressed under three different pressures (1, 1.5 and 2 MPa) were investigated for cooling and desalination applications. The determined thermal and adsorption characteristics of the developed composites were compared with broadly utilised SG as a baseline adsorbent. A 2D multi-physics dynamic computational model was employed to analyse the impact of the developed composites’ heat and mass transfer properties on the adsorbent bed and system levels. The following can be concluded and summarise the novel findings.
- The developed composites showed significantly improved thermal diffusivity compared to SG, with the GP-CL-30-CP7 composite showing the highest thermal diffusivity of 4.65 mm2/s, a 12.7-fold increase over SG.
- The composite GP-CL-30-CP1 showed the highest water uptake of 0.9648 kg, a 174% enhancement compared to SG.
- Increasing the cycle time resulted in significantly higher exergy efficiency for GP-CL-30-CP1 compared to SG, attributed to the composites’ high thermal and solvation properties and IL.
- Increasing the heat source temperature improved SDWP, SCP and COP while reducing exergy efficiency. However, the exergy efficiency of the composites, including GP-CL-30-CP1, was higher than SG over the entire range of investigated temperatures by 80.7% and 70% on average at 12 °C.
Overall, the consolidated form of the ionic liquid graphene sorbent composites showed a significant improvement in heat transfer properties. However, the utilisation of the PVA binder was challenging because of its inferior thermal properties that affected the performance of the developed composites. This work also fosters the importance of the material-level thermal properties in adsorption systems, which enable the unleashing the sorption potential of the adsorbent at the system level.
Supplementary Materials
The following supporting information can be downloaded at: https://www.mdpi.com/article/10.3390/en17194856/s1, Figure S1: Laser Flash analyser (a) schematic diagram (b) pictorial view; Figure S2: Dynamic vapour sorption analyser (a) schematic diagram and (b) pictorial view; Figure S3: Simulation procedure; Figure S4: Simulation domain boundary conditions. References [60,61,62,63,64,65] are cited in the Supplementary Materials.
Author Contributions
Conceptualization, A.R.; Methodology, A.R.; Validation, H.B.; Formal analysis, H.B.; Investigation, H.B.; Writing—original draft, H.B.; Writing—review & editing, A.R.; Supervision, A.R. All authors have read and agreed to the published version of the manuscript.
Funding
This research was funded by The Royal Society grant number IES\R3\203128.
Data Availability Statement
The original contributions presented in the study are included in the article/Supplementary Material, further inquiries can be directed to the corresponding author.
Conflicts of Interest
The authors declare no conflict of interest.
Nomenclature
| Cp | Specific heat capacity | [kJ kg−1 K−1] |
| d | Tube diameter | [mm] |
| D_s | Surface diffusivity | [m2 s−1] |
| D_so | Pre-exponential coefficient | [m2 s−1] |
| Ea | Activation energy | [kJ mol−1] |
| h | Enthalpy | [kJ kg−1] |
| h | Height | [mm] |
| l | Tube length | [mm] |
| K | Thermal conductivity | [W m−1 K−1] |
| Ko | Adsorption constant | [KPa−1] |
| ks αν | Diffusion time constant | [-] |
| M | Mass | [kg] |
| ṁ | Mass flowrate | [kg s−1] |
| P | Pressure | [Pa] |
| p | Fin pitch | [mm] |
| Q | Heat transmitted | [J] |
| Qst | Heat of adsorption | [kJ kg−1] |
| R | Gas law constant | [kJ kmol−1 K−1] |
| t | Time | [s] |
| T | Temperature | [K] [°C] |
| q | Uptake | [kg kg−1] |
| q(o) | Equilibrium uptake | [kg kg−1] |
| R_p | Particle radius | [m] |
| Greek | ||
| µ | Dynamic viscosity | [Pa s] |
| ρ | Density | [kg m−3] |
| α | Thermal diffusivity | [mm2 s−1] |
| δ | Fin thickness | [mm] |
| νg | Specific volume | [m3 kg−1] |
| Subscripts | ||
| ad | adsorbent | |
| ads | adsorption | |
| cw | cooling water | |
| chw | chilled water | |
| cond | condenser | |
| des | desorption | |
| evap | evaporator | |
| f | fin | |
| hex | heat exchanger | |
| hw | heating water | |
| i | inner | |
| in | inlet | |
| o | outer | |
| out | outlet | |
| sat | saturation | |
| SG | silica gel | |
References
- Dhakal, N.; Salinas-Rodriguez, S.G.; Hamdani, J.; Abushaban, A.; Sawalha, H.; Schippers, J.C.; Kennedy, M.D. Is desalination a solution to freshwater scarcity in developing countries? Membranes 2022, 12, 381. [Google Scholar] [CrossRef] [PubMed]
- Hua, W.S.; Xu, H.J.; Xie, W.H. Review on adsorption materials and system configurations of the adsorption desalination applications. Appl. Therm. Eng. 2022, 204, 117958. [Google Scholar] [CrossRef]
- Grabowska, K.; Krzywanski, J.; Zylka, A.; Kulakowska, A.; Skrobek, D.; Sosnowski, M.; Ščurek, R.; Nowak, W.; Czakiert, T. Implementation of Fluidized Bed Concept to Improve Heat Transfer in Ecological Adsorption Cooling and Desalination Systems. Energies 2024, 17, 379. [Google Scholar] [CrossRef]
- Figaj, R.; Żołądek, M.; Homa, M.; Pałac, A. A Novel Hybrid Polygeneration System Based on Biomass, Wind and Solar Energy for Micro-Scale Isolated Communities. Energies 2022, 15, 6331. [Google Scholar] [CrossRef]
- Rezk, A.; Ilis, G.G.; Demir, H. Experimental study on silica gel/ethanol adsorption characteristics for low-grade thermal driven adsorption refrigeration systems. Therm. Sci. Eng. Prog. 2022, 34, 101429. [Google Scholar] [CrossRef]
- Saha, B.B.; El-Sharkawy, I.I.; Shahzad, M.W.; Thu, K.; Ang, L.; Ng, K.C. Fundamental and application aspects of adsorption cooling and desalination. Appl. Therm. Eng. 2016, 97, 68–76. [Google Scholar] [CrossRef]
- Zhang, Y.; Palamara, D.; Palomba, V.; Calabrese, L.; Frazzica, A. Performance analysis of a lab-scale adsorption desalination system using silica gel/LiCl composite. Desalination 2023, 548, 116278. [Google Scholar] [CrossRef]
- Chan, K.C.; Chao, C.Y.H.; Sze-To, G.N.; Hui, K.S. Performance predictions for a new zeolite 13X/CaCl2 composite adsorbent for adsorption cooling systems. Int. J. Heat Mass Transf. 2012, 55, 3214–3224. [Google Scholar] [CrossRef]
- Gordeeva, L.G.; Aristov, Y.I. Composites ‘salt inside porous matrix’ for adsorption heat transformation: A current state-of-the-art and new trends. Int. J. Low Carbon Technol. 2012, 7, 288–302. [Google Scholar] [CrossRef]
- Restucciaa, G.; Freni, A.; Vasta, S.; Aristov, Y. Selective water sorbent for solid sorption chiller: Experimental results and modelling. Int. J. Refrig. 2004, 27, 284–293. [Google Scholar] [CrossRef]
- Hanif, S.; Sultan, M.; Miyazaki, T. Effect of relative humidity on thermal conductivity of zeolite-based adsorbents: Theory and experiments. Appl. Therm. Eng. 2019, 150, 11–18. [Google Scholar] [CrossRef]
- Rouhani, M.; Huttema, W.; Bahrami, M. Thermal conductivity of AQSOA FAM-Z02 packed bed adsorbers in open and closed adsorption thermal energy storage systems. Int. J. Refrig. 2019, 105, 158–168. [Google Scholar] [CrossRef]
- Pal, A.; Shahrom, M.S.R.; Moniruzzaman, M.; Wilfred, C.D.; Mitra, S.; Thu, K.; Saha, B.B. Ionic liquid as a new binder for activated carbon based consolidated composite adsorbents. Chem. Eng. J. 2017, 326, 980–986. [Google Scholar] [CrossRef]
- Oliveira, R.G.; Wang, R.Z. A consolidated calcium chloride-expanded graphite compound for use in sorption refrigeration systems. Carbon 2007, 45, 390–396. [Google Scholar] [CrossRef]
- Cacciola, G.; Restuccia, G.; Mercadante, L. Composites of activated carbon for refrigeration adsorption machines. Carbon 1995, 33, 1205–1210. [Google Scholar] [CrossRef]
- El-Sharkawy, I.I.; Pal, A.; Miyazaki, T.; Saha, B.B.; Koyama, S. A study on consolidated composite adsorbents for cooling application. Appl. Therm. Eng. 2016, 98, 1214–1220. [Google Scholar] [CrossRef]
- Xu, S.Z.; Lemington, Q.; Wang, R.Z.; Wang, L.W.; Zhu, J. A zeolite 13X/magnesium sulfate–water sorption thermal energy storage device for domestic heating. Energy Convers. Manag. 2018, 171, 98–109. [Google Scholar] [CrossRef]
- Li, S.L.; Wu, J.Y.; Xia, Z.Z.; Wang, R.Z. Study on the adsorption isosteres of the composite adsorbent CaCl2 and expanded graphite. Energy Convers. Manag. 2011, 52, 1501–1506. [Google Scholar] [CrossRef]
- Pal, A.; Uddin, K.; Thu, K.; Saha, B.B. Activated carbon and graphene nanoplatelets based novel composite for performance enhancement of adsorption cooling cycle. Energy Convers. Manag. 2019, 180, 134–148. [Google Scholar] [CrossRef]
- Younes, M.M.; El-sharkawy, I.I.; Kabeel, A.E.; Uddin, K.; Pal, A.; Mitra, S.; Thu, K.; Saha, B.B. Synthesis and characterization of silica gel composite with polymer binders for adsorption cooling applications. Int. J. Refrig. 2019, 98, 161–170. [Google Scholar] [CrossRef]
- El-Sharkawy, I.I.; Uddin, K.; Miyazaki, T.; Saha, B.B.; Koyama, S.; Miyawaki, J.; Yoon, S.-H. Adsorption of ethanol onto parent and surface treated activated carbon powders. Int. J. Heat Mass Transf. 2014, 73, 445–455. [Google Scholar] [CrossRef]
- Wang, L.W.; Metcalf, S.J.; Critoph, R.E.; Thorpe, R.; Tamainot-Telto, Z. Development of thermal conductive consolidated activated carbon for adsorption refrigeration. Carbon 2012, 50, 977–986. [Google Scholar] [CrossRef]
- Balandin, A.A.; Ghosh, S.; Bao, W.; Calizo, I.; Teweldebrhan, D.; Miao, F.; Lau, C.N. Superior Thermal Conductivity of Single-Layer Graphene. Nano Lett. 2008, 8, 902. [Google Scholar] [CrossRef]
- Noorunnisa Khanam, P.; AlMaadeed, M.A.; Ouederni, M.; Mayoral, B.; Hamilton, A.; Sun, D. Effect of two types of graphene nanoplatelets on the physico-mechanical properties of linear low–density polyethylene composites. Adv. Manuf. Polym. Compos. Sci. 2016, 2, 67–73. [Google Scholar] [CrossRef]
- Jiménez-Suárez, A.; Prolongo, S. Graphene nanoplatelets. Appl. Sci. 2020, 10, 1753. [Google Scholar] [CrossRef]
- Truong, Q.T.; Pokharel, P.; Song, G.S.; Lee, D.S. Preparation and characterization of graphene nanoplatelets from natural graphite via intercalation and exfoliation with tetraalkylammoniumbromide. Nanosci. Nanotechnol. 2012, 12, 4305–4308. [Google Scholar] [CrossRef] [PubMed]
- Geng, Y.; Wang, S.J.; Kim, J.-K. Preparation of graphite nanoplatelets and graphene sheets. Colloid Interface Sci. 2009, 336, 592–598. [Google Scholar] [CrossRef] [PubMed]
- Rogers, R.D.; Seddon, K.R. Ionic liquids—Solvents of the future? Science 2003, 302, 792–793. [Google Scholar] [CrossRef] [PubMed]
- Joshi, M.D.; Anderson, J.L. Recent advances of ionic liquids in separation science and mass spectrometry. RSC Adv. 2012, 2, 5470–5484. [Google Scholar] [CrossRef]
- Askalany, A.A.; Freni, A.; Santori, G. Supported ionic liquid water sorbent for high throughput desalination and drying. Desalination 2019, 452, 258–264. [Google Scholar] [CrossRef]
- Zhao, Q.; Anderson, J.L.; Liquids, I. 2.11-Ionic Liquids, in Comprehensive Sampling and Sample Preparation; Pawliszyn, J., Ed.; Academic Press: Oxford, UK, 2012; pp. 213–242. [Google Scholar]
- Yuan, J.; Fan, M.; Zhang, F.; Xu, Y.; Tang, H.; Huang, C.; Zhang, H. Amine-functionalized poly(ionic liquid) brushes for carbon dioxide adsorption. Chem. Eng. J. 2017, 316, 903–910. [Google Scholar] [CrossRef]
- Hasib-ur-Rahman, M.; Siaj, M.; Larachi, F. Ionic liquids for CO2 capture—Development and progress. Chem. Eng. Process. Process Intensif. 2010, 49, 313–322. [Google Scholar] [CrossRef]
- Finotello, A.; Bara, J.E.; Camper, D.; Noble, R.D. Room-Temperature Ionic Liquids: Temperature Dependence of Gas Solubility Selectivity. Ind. Eng. Chem. Res. 2008, 47, 3453–3459. [Google Scholar] [CrossRef]
- Tang, J.; Tang, H.; Sun, W.; Radosz, M.; Shen, Y. Poly(ionic liquid)s as new materials for CO2 absorption. J. Polym. Sci. Part A Polym. Chem. 2005, 43, 5477–5489. [Google Scholar] [CrossRef]
- Alsaman, A.S.; Hassan, A.A.; Ali, E.S.; Mohammed, R.H.; Zohir, A.E.; Farid, A.M.; Eraqi, A.M.Z.; El-Ghetany, H.H.; Askalany, A.A. Hybrid Solar-Driven Desalination/Cooling Systems: Current Situation and Future Trend. Energies 2022, 15, 8099. [Google Scholar] [CrossRef]
- Banda, H.; Rupam, T.H.; Rezk, A.; Visak, Z.; Hammerton, J.; Yuan, Q.; Saha, B.B. Preparation and assessment of ionic liquid and few-layered graphene composites to enhance heat and mass transfer in adsorption cooling and desalination systems. Int. J. Heat Mass Transf. 2024, 221, 125095. [Google Scholar] [CrossRef]
- Banda, H.; Rezk, A.; Elsayed, E.; Askalany, A. Experimental and computational study on utilising graphene oxide for adsorption cooling and water desalination. Appl. Therm. Eng. 2023, 229, 120631. [Google Scholar] [CrossRef]
- Rocky, K.A.; Pal, A.; Rupam, T.H.; Palash, M.L.; Saha, B.B. Recent advances of composite adsorbents for heat transformation applications. Therm. Sci. Eng. Prog. 2021, 23, 100900. [Google Scholar] [CrossRef]
- Chua, H.T.; Ng, K.C.; Chakraborty, A.; Oo, N.M.; Othman, M.A. Adsorption characteristics of silica gel+ water systems. Chem. Eng. Data 2002, 47, 1177–1181. [Google Scholar] [CrossRef]
- Wu, C.H.; Hsu, S.H.; Chu, R.Q.; Chen, M.T.; Chung, T.W. Enhancing the thermal conductivity of the heat exchanger in a noncompressive system as a means of energy efficiency improvement of the system. Int. J. Green Energy 2009, 6, 490–507. [Google Scholar] [CrossRef]
- Xie, X.; Li, D.; Tsai, T.-H.; Liu, J.; Braun, P.V.; Cahill, D.G. Thermal Conductivity, Heat Capacity, and Elastic Constants of Water-Soluble Polymers and Polymer Blends. Macromolecules 2016, 49, 972–978. [Google Scholar] [CrossRef]
- Syah, R.; Piri, F.; Elveny, M.; Khan, A. Artificial Intelligence simulation of water treatment using nanostructure composite ordered materials. J. Mol. Liq. 2022, 345, 117046. [Google Scholar] [CrossRef]
- Albadarin, A.B.; Collins, M.N.; Naushad, M.; Shirazian, S.; Walker, G.; Mangwandi, C. Activated lignin-chitosan extruded blends for efficient adsorption of methylene blue. Chem. Eng. J. 2017, 307, 264–272. [Google Scholar] [CrossRef]
- Lin, C.-I.; Wang, L.-H. Rate equations and isotherms for two adsorption models. J. Chin. Inst. Chem. Eng. 2008, 39, 579–585. [Google Scholar] [CrossRef]
- Llano-Restrepo, M.; Mosquera, M.A. Accurate correlation; thermochemistry, and structural interpretation of equilibrium adsorption isotherms of water vapor in zeolite 3A by means of a generalized statistical thermodynamic adsorption model. Fluid Phase Equilibria 2009, 283, 73–88. [Google Scholar] [CrossRef]
- Stoeckli, F.; Jakubov, T.; Lavanchy, A. Water adsorption in active carbons described by the Dubinin–Astakhov equation. J. Chem. Soc. Faraday Trans. 1994, 90, 783–786. [Google Scholar] [CrossRef]
- Malek, A.; Farooq, S. Comparison of isotherm models for hydrocarbon adsorption on activated carbon. AIChE J. 1996, 42, 3191–3201. [Google Scholar] [CrossRef]
- Foo, K.Y.; Hameed, B.H. Insights into the modeling of adsorption isotherm systems. Chem. Eng. J. 2010, 156, 2–10. [Google Scholar] [CrossRef]
- Subramanyam, B.; Das, A. Linearised and non-linearised isotherm models optimization analysis by error functions and statistical means. J. Environ. Health Sci. Eng. 2014, 12, 92. [Google Scholar] [CrossRef] [PubMed]
- Khanam, M.; Jribi, S.; Miyazaki, T.; Saha, B.B.; Koyama, S. Numerical investigation of small-scale adsorption cooling system performance employing activated carbon-ethanol pair. Energies 2018, 11, 1499. [Google Scholar] [CrossRef]
- Zhang, Y.; Palomba, V.; Frazzica, A. Understanding the effect of materials, design criteria and operational parameters on the adsorption desalination performance—A review. Energy Convers. Manag. 2022, 269, 116072. [Google Scholar] [CrossRef]
- Jahan, I.; Rupam, T.H.; Palash, M.L.; Rocky, K.A.; Saha, B.B. Energy efficient green synthesized MOF-801 for adsorption cooling applications. J. Mol. Liq. 2022, 345, 117760. [Google Scholar] [CrossRef]
- Chakraborty, A.; Saha, B.B.; Koyama, S.; Ng, K.C. On the thermodynamic modeling of the isosteric heat of adsorption and comparison with experiments. Appl. Phys. Lett. 2006, 89, 171901. [Google Scholar] [CrossRef]
- Mitra, S.; Thu, K.; Saha, B.B.; Srinivasan, K.; Dutta, P. Modeling study of two-stage, multi-bed air cooled silica gel+water adsorption cooling cum desalination system. Appl. Therm. Eng. 2017, 114, 704–712. [Google Scholar] [CrossRef]
- Sosnowski, M.; Krzywanski, J.; Skoczylas, N. Adsorption Desalination and Cooling Systems: Advances in Design, Modeling and Performance. Energies 2022, 15, 4036. [Google Scholar] [CrossRef]
- Li, M.; Zhao, Y.; Long, R.; Liu, Z.; Liu, W. Computational fluid dynamic study on adsorption-based desalination and cooling systems with stepwise porosity distribution. Desalination 2021, 508, 115048. [Google Scholar] [CrossRef]
- Cao, N.V.; Chung, J.D. Exergy analysis of adsorption cooling systems based on numerical simulation. Energy Technol. 2019, 7, 153–166. [Google Scholar] [CrossRef]
- Youssef, P.G.; Mahmoud, S.M.; Al-Dadah, R.K. Effect of evaporator temperature on the performance of water desalination/refrigeration adsorption system using AQSOA-ZO2. Int. J. Environ. Chem. Ecol. Geol. Eng. 2015, 9, 679–683. [Google Scholar]
- Jin, Y.; Kuznetsov, A.V. Turbulence modeling for flows in wall bounded porous media: An analysis based on direct numerical simulations. Phys. Fluids 2017, 29, 045102. [Google Scholar] [CrossRef]
- Nimvari, M.E.; Maerefat, M.; Jouybari, N.F.; El-hossaini, M.K. Numerical simulation of turbulent reacting flow in porous media using two macroscopic turbulence models. Comput. Fluids 2013, 88, 232–240. [Google Scholar] [CrossRef]
- Jiao, S.; Xu, Z. Selective gas diffusion in graphene oxides membranes: A molecular dynamics simulations study. ACS Appl. Mater. Interfaces 2015, 7, 9052–9059. [Google Scholar] [CrossRef]
- Xia, B.; Sun, D.W. Applications of computational fluid dynamics (CFD) in the food industry: A review. Comput. Electron. Agric. 2002, 34, 5–24. [Google Scholar] [CrossRef]
- Ji, X.; Li, M.; Fan, J.; Zhang, P.; Luo, B.; Wang, L. Structure optimization and performance experiments of a solar-powered finned-tube adsorption refrigeration system. Appl. Energy 2014, 113, 1293–1300. [Google Scholar] [CrossRef]
- Gong, L.X.; Wang, R.Z.; Xia, Z.Z.; Lu, Z.S. Experimental study on an adsorption chiller employing lithium chloride in silica gel and methanol. Int. J. Refrig. 2012, 35, 1950–1957. [Google Scholar] [CrossRef]
Disclaimer/Publisher’s Note: The statements, opinions and data contained in all publications are solely those of the individual author(s) and contributor(s) and not of MDPI and/or the editor(s). MDPI and/or the editor(s) disclaim responsibility for any injury to people or property resulting from any ideas, methods, instructions or products referred to in the content. |
© 2024 by the authors. Licensee MDPI, Basel, Switzerland. This article is an open access article distributed under the terms and conditions of the Creative Commons Attribution (CC BY) license (https://creativecommons.org/licenses/by/4.0/).