Abstract
The fast charging of electric vehicles (EVs) has stood out prominently as an alternative for long-distance travel. These charging events typically occur at public fast charging stations (FCSs) within brief timeframes, which requires a substantial demand for power and energy in a short period. To adequately prepare the system for the widespread adoption of EVs, it is imperative to comprehend and establish standards for user behavior. This study employs agglomerative clustering, kernel density estimation, beta distribution, and data mining techniques to model and identify patterns in these charging events. They utilize telemetry data from charging events on highways, which are public and cost-free. Critical parameters such as stage of charge (SoC), energy, power, time, and location are examined to understand user dynamics during charging events. The findings of this research provide a clear insight into user behavior by separating charging events into five groups, which significantly clarifies user behavior and allows for mathematical modeling. Also, the results show that the FCSs have varying patterns according to the location. They serve as a basis for future research, including topics for further investigations, such as integrating charging events with renewable energy sources, establishing load management policies, and generating accurate load forecasting models.
1. Introduction
Analyzing driver behavior and electric vehicle (EV) charging are essential to the electric sector. An accurate analysis can generate strategies for planning the recharging of EVs. By comprehensively understanding vehicle behavior through real-world data and meticulously analyzing charging and mobility patterns, we can structure valuable information sources and foster knowledge that is pivotal for advancing smart grids [1]. The stochastic nature and varying timing of charging events often lead to waiting queues or underutilized charging infrastructure. For this reason, it is important to understand charging patterns [2]. Precisely defining the load profile of EVs significantly improves various characteristics of the power grid, such as the impact on transformers, distribution lines, overload, power quality issues, electrical efficiency, system stability, and overall reliability [3].
This paper proposes a novel approach to clarify user behavior. It employs data analysis and a well-known clustering method to divide the fast charging data into five clusters. The results expose a new way to understand user behavior and enhance knowledge of the stochastic nature of EV charging behavior. Additionally, real-world data on EV charging are still underexplored and should be further investigated to enable proper modeling of the various charging patterns, making the models close to reality. To achieve this, this paper employs real-world fast charging data.
The continuous increase in EVs on the road presents challenges for the electric sector, introducing new loads and uncertainties. To ensure energy supply, it is necessary to anticipate and predict behaviors. However, the individual activity of each vehicle is highly unpredictable. To address this issue, cluster analysis should be utilized to analyze and predict the behaviors of groups of EV charging sessions and similar charging sessions [4].
It is important to emphasize that EV charging behavior embraces a significant degree of stochasticity. The analysis of EV charging patterns depends on numerous factors that are difficult to predict. A deterministic model may not capture the necessary randomness for accurate modeling [5] in such a scenario. Due to this, multiple studies establish the use of probabilistic models [5,6,7,8]. Furthermore, using real charging data in EV charging models to achieve a satisfactory result aligned with reality is imperative.
Another important aspect when trying to understand the behavior of EVs during fast charging events is the energy delivery to the battery. As shown in Figure 1, which represents a typical charging curve from the present study’s database, the power delivery to the battery is high when the state of charge (SoC) is between 10% and 80%, increasing the charging event efficiency. This information is crucial, as drivers often interrupt the charging session by nearly 80%, knowing that charging time within this range is more efficient. This is because from around 80% to 100%, the same amount of energy takes longer to charge.
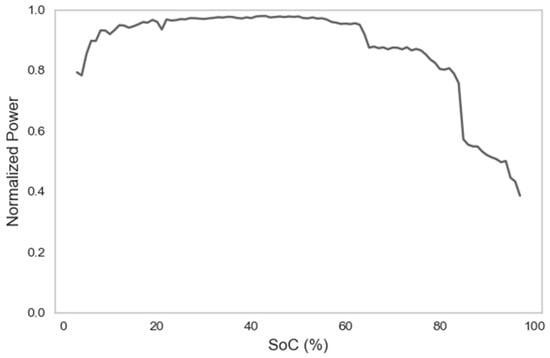
Figure 1.
Normalized power profile for charging from fast charging stations (FCSs).
EV charging behaviors can vary based on driving behavior, battery size, seasonality, availability of time, and access to a charging station. Cluster analysis can help assess the effects and impacts of integrating electric vehicle charging infrastructures into distribution systems. Smart mobility is essential for smart cities, improving traffic flow. The use of data analysis can enhance traffic management in cities [9]. In [2], attributes and methods were used to predict the behavior of EVs, including initial SoC, travel time, travel distance, travel speed, day of the week, wind, temperature, and weather. The study demonstrated that as the initial SoC decreases, the probability of fast charging increases significantly. This behavior also happens as the duration of the trip increases. Furthermore, users who habitually use fast charging are more likely to do so again the following day [2].
Additionally, it is essential to highlight the classification of charging locations, such as the regional division of residential, industrial, commercial, and highway areas, as well as the spatial and seasonal charging event distributions of weekdays, weekends, holidays, and seasons of the year [10]. The charging behaviors of EVs can vary based on the specific behavior of each driver, the driving cycle during trips, and the capacity of the electric battery [11]. Moreover, each parameter of EVs should be analyzed, considering factors including maximum speed, model, energy consumption, and price [12]. Furthermore, as fast charging is typically performed during trips, user convenience and anxiety must be considered [13].
Driver anxiety is defined as the driver’s fear of running out of battery charge during a trip. Several factors can influence this concern, such as inadequate charging infrastructure and even the reliability of the SoC readings [14]. An adequate understanding of driver behavior requires assessing the extent of this anxiety. The anxiety intensity can be modeled as a function of the SoC, but each driver has their level of anxiety, making it challenging to predict individually. Anxiety levels typically increase as the SoC decreases, with SoC levels between 5% and 30% representing a higher probability of recharging due to anxiety [15].
Analyzing EV charging habits and behaviors can guide drivers to consume energy more efficiently, improve user experience, and optimize energy use [16]. However, researchers rarely apply data-driven methodologies utilizing real traffic data. Therefore, cluster analysis based on data analysis can evaluate the impact and establish guidelines and strategies for implementing EV charging in distribution systems and operating the electrical system [11].
Therefore, this work proposes using data mining and clustering techniques to identify patterns in the charging events. By employing suitable strategies, we are able to present these behaviors comprehensively in EV fast charging events, especially to separate groups and profiles of similar charging events to understand their behavioral patterns. This approach ensures more accurate mathematical modeling and, especially, the acquisition of the stochastic nature of real-world EV charging data. The different clusters encountered by the model provide a more precise understanding of the behavior of EVs in fast charging on highways, thus offering insight into different charging profiles and charging station occupancy. Additionally, this work provides insight into how investments in charging infrastructure and related incentives can be devised to provide adequate charging capacity with minimal disruption to the power grid.
The paper has the following sequence: Section 2 of this work presents a review about data analysis for applications in EV fast charging and potential applications in energy systems. Section 3 introduces the proposed methodology, followed by the results and discussions in Section 4. Finally, the conclusions are presented in Section 5.
2. Clustering and Data Analysis Strategies for EVs and Energy Systems
Clustering is a term used to refer to a wide range of multivariate data analysis techniques focused on identifying sets of similar data [17]. Clustering techniques and cluster analysis can identify and associate patterns in electric vehicle charging behaviors [4,11,18,19]. Additionally, clustering can also be employed in predicting the EV charging load, benefiting from data analysis techniques and the use of machine learning, such as decision tree models, artificial neural networks, and support vector machines [20], as well as models for predicting the occupancy of EV charging stations [21]. However, the use of clustering must be integrated with expert knowledge. This is particularly relevant in the context of fast charging clustering. Understanding the operational aspects of fast charging stations (FCSs), including the electrical quantities involved, the values of power and energy, time, charging speed, and location, is essential to obtain meaningful clusters that can aid in the operation of the energy system.
Data cleaning, reduction, and variable selection are important to the analysis. As analyzed in [22], the data processing stage for load profiles before primary clustering aims to reduce the input data size or define more significant features for the subsequent clustering stage. This involves incorporating feature extraction techniques based on expert knowledge and data compression methods [22].
Additionally, it is essential to consider that clustering loads have their shortcomings. Distinguishing the influence of correlations between energy characteristics in the results and the high dimensionality of the data can lead to clustering outcomes that lack practical significance [22]. Thus, energy and power systems expertise are crucial for the selection of variables and clustering methods.
Also, it is relevant to identify driver patterns for the data analysis. In the work of [16], various aspects related to the use of EVs are examined, including the payment method used by the driver, mobile device employed for communication, seasonal analysis of the number of charges, duration of charging events, energy transferred, times of peak recharging frequency, and geographic segmentation [16].
Data clustering techniques are also used to assess loads with the aim of demand response [22]. In [23], an analysis was performed for different air conditioning uses, examining whether it is commonly used all day or at specific times, focusing on the correlation between customers. The author employs the k-means clustering algorithm due to its simplicity of implementation and repeats it five times with different centroid initialization values to refine the results [23]. Cluster analysis can be employed to loads in energy systems, [24] performing a cluster analysis to evaluate a set of residential loads, aiming to identify loads with high potential return in response to demand and energy efficiency programs. The authors also note that social factors highly influence loads [24], similar to EV charging.
Various clustering methods can be found in the literature, each with its specific advantages and disadvantages for application to EV charging databases. These methods can be categorized into hierarchical and partitional clustering algorithms [4]. Therefore, finding and evaluating clustering models that reliably represent charging behaviors and can predict and mitigate the effects of fast charging on power systems is essential. The hierarchical clustering method is quite flexible and has been used in various studies on clustering loads in electrical systems [22].
In [8], the stochastic nature of EVs was analyzed through historical data and data mining using clustering and kernel density estimation. The paper captures charging behavior regarding timing, frequency, and demand across different drivers. It was concluded that it is important to group different drivers, as there is a significant variance in behavior. Also, the authors point out the need for network reinforcement and the adoption of smart charging technologies to prevent future system overload due to the increase in charging sessions for specific types of drivers [8].
In [25], the authors employed a data-driven approach using unsupervised methods. The model identifies charging patterns and then using a probabilistic framework generates charging demands. The initial division of the agglomerative clustering resulted in 5 clusters, and by end of the tree, 16 clusters of drivers were identified. The model is primarily based on historical charging data, including timing, energy, rate and location of each charging sessions [25].
In [19], recurring patterns were identified using cluster analysis with the k-means algorithm; this is an unsupervised classification method, primarily analyzing charging start times and dividing the charges into five clusters for analysis [19].
A data-driven approach for user categories and charging sessions is presented in [26]. The authors propose a dual strategy: first, a clustering proposal based on identifying portfolios and patterns, and then a geographic method, considering geographical data, the maturity and density of charging points, and vehicle properties. A Gaussian mixture model revealed 13 types of charging sessions based on connection time, duration, time between sessions, and distance between sessions [26].
In [4], a comprehensive review of data clustering methods and their applications in various fields related to EVs was conducted. Also, the authors point out that agglomerative clustering can be employed for long-term planning of EV loads and is suitable for capturing uncertainties and heterogeneous charging behaviors, including charging cycles and sessions [4,25].
Additionally, optimization methods are also employed. For instance, in [27], the authors considered traffic data and charger utilization rates, proposing a multi-objective planning method for charging EVs. It is mentioned that the planning method can effectively enhance the utilization of new chargers in the planned area and improve the EV user experience, thus optimizing energy use [27]. In [28], a new optimal planning algorithm was developed that accounts for the stochastic nature of EV flow and charging demands. The proposed structure determines an ideal set of additional energy to be extracted from the grid and the optimal number of chargers, considering waiting time and the size of the charging infrastructure [28]. In [29], the authors examine the impact of charging on distribution systems using the CPLEX tool, exploring different scenarios. The authors aim to smooth out the load demand by proposing a demand peak indicator incorporating the original system peak, the peak with EVs, and the peak after the proposed optimization. They concluded that the impact can be minimized, although introducing renewable energy changes the portfolio of the charging infrastructure [29].
Finally, estimating the ideal number of clusters must be addressed to make it simple to understand the differences between the groups of charging events. Fewer clusters can simplify the visualization and interpretation of the data. Several methods for determining the optimal number of clusters can be found in the literature [30]; the elbow method is commonly used to estimate the ideal number of clusters in an analysis. This method effectively identifies the appropriate clusters by calculating the sum of squared errors within the clusters. In [31], the elbow method was employed to evaluate the ideal number of clusters. The authors highlight that the technique is easy to compute but can produce inconsistent results [31]. This underscores the importance of assessing results with specialized knowledge.
It can be concluded that clustering models for charging sessions can efficiently identify distinct EV charging profiles. This can reduce pressure on energy generation while improving voltage levels and network stability [32]. Finally, improvements in energy planning models are important for the analysis and enhancement of environmental aspects as EVs are being incorporated into the energy system [33].
2.1. Electric Vehicles
The most common vehicles in the industry today are internal combustion engine vehicles (ICEVs), which use a combustion engine; hybrid electric vehicles (HEVs), where both an electric motor and a combustion engine are used to power the vehicle; and all-electric vehicles (AEVs), also known as battery electric vehicles (BEVs), which are powered exclusively by batteries. Additionally, plug-in hybrid electric vehicles (PHEVs) are similar to HEVs but can also be charged via the electric grid [34]. In this study, BEVs and PHEVs are the focus and are referred to as EVs.
EV charging is categorized into Category 1, which corresponds to alternating current (AC), and Category 2 referring to direct current (DC). Category 1 is further divided into slow charging (<7.4 kW), medium-speed charging (7.4 kW ≤ X ≤ 22 kW), and AC fast charging (>22 kW). Category 2 is divided into DC slow charging (<50 kW), DC fast charging (50 kW ≤ X < 150 kW), ultra-fast Level 1 charging (150 kW ≤ X < 350 kW), and ultra-fast Level 2 charging (≥350 kW) [35]. This study specifically focuses on public fast chargers, categorized as DC charging with a maximum power of 60 kW.
2.2. EV Charging Patterns Applied on Energy System Studies
EVs are considered one of the largest sources of growth in electricity demand and are also seen as a highly flexible resource from the demand side. The introduction of EVs is sometimes discussed as a solution for distribution networks with inadequate infrastructure. However, without anticipating load behavior, EVs are far from being stabilizing agents and tend to lead networks toward instability. Instead of supporting the networks, it is common for charger controls to disconnect from the grid and halt charging in networks with poor infrastructure or other conditions, such as low voltage or phase loss. The destabilizing effect of battery-centered technology with constant power behavior is well-known among EV chargers and can be critical when chargers reach significant load levels on the grid.
Introducing more chargers increases the presence of electronic components in the network, reducing the system’s total inertia [36]. Voltage instability and frequency deviation are adverse effects of uncontrolled EV charging stations on the grid. According to [37], studies and research on the interaction of EVs with networks with inadequate infrastructure should be conducted based on optimization, forecasting, and intelligent control.
Flexibility in electricity consumption refers to the ability to adjust usage over time to mitigate load and demand peaks and reduce fluctuations in generation and load. The electricity flexibility is also important to significantly increases the penetration of renewable energy sources [38]. Using the flexibility of EV charging and knowledge of charging behavior, efficient charging scheduling and distributed renewable generation can improve the energy system’s performance [39].
Power systems were not initially designed for this type of new load, and the impact caused by the new load from EVs must be addressed [40]. Therefore, it is necessary to implement load management measures to mitigate consumption peaks [41], as well as load forecasting modeling.
In [42], a load forecasting methodology is introduced that leverages a deep understanding of electric vehicle driving and charging patterns to improve the accuracy of forecasting models. In our previous study, we developed an adaptive charging simulation model to obtain the charging load profiles of many EVs [43], aiming to support several research areas related to EVs.
Given the increase in EVs on highways, it is easy to recognize that high-power and uncoordinated EV charging can be critical for the power grid [41]. Strengthening the power grid, which maintains the balance between supply and demand, is fundamental to ensuring the energy system’s stable operation [13].
Models of demand response are used to shift consumption to different times, as empowered consumers can move their usage to other periods. Depending on logistics and other requirements, the load can be utilized at a different time [44]. In the case of shifting loads for fast EV charging, the challenge lies in the planning and timing of the charge and the driver’s anxiety about charging. Another challenge in highway charging lies in the user’s interest in minimizing the charging time, so stop-and-go charging.
Load shifting is evaluated in [45]. The authors aim to guide consumers in properly using FCSs. This study analyzes the load shape by normalizing the energy system’s load profile and the FCSs. Additionally, it assesses how price signals effectively shift load to other periods [45].
In [46], two methods for evaluating charging modes were compared to examine the impact on energy of EV charging. The charging modes are described as user-driven or cost-driven, controlling the power delivered based on the SoC. It was concluded that a slight relaxation in the fully user-driven mode results in smoother charging curves. The system’s peak load can be substantially reduced if vehicle drivers agree to charge only a fraction of the battery capacity as soon as they connect to the grid rather than charging it fully as quickly as possible [46]. In [47], a diffusion model for EVs was developed to shift the timing of charges. The study concludes that shifting is feasible for both home and workplace charging. Furthermore, 25–30% of renewable generation can be integrated with load shifting. The authors highlight that the topic of public fast charging could be a field for future research. [47].
In addition to defining load profiles for demand control, predicting EV load is crucial. A deep understanding of driver behavior regarding charging is essential. Spatiotemporal, statistical models and data mining are typically employed to predict distributions [42]. However, accurate load forecasting for electric vehicles is challenging due to the high degree of uncertainty in driver behavior [48]. In [48], a rough artificial neural network approach was applied to predict the travel behavior of EVs and their load profiles for various forecasting methods in the distribution network [48].
Understanding the load behavior caused by EVs is essential. Additionally, as the number of charging sessions increases over time, an approach to schedule charging events becomes crucial. This ensures the efficient allocation of resources, minimizes potential conflicts, and optimizes the overall charging process. Strategic planning allows us to accommodate the growing demand and maintain a smooth and effective operation. Consequently, the work proposed in this article provides a valuable tool for identifying patterns in EV charging behavior, an area of research that still presents many challenges for system planners.
3. Methodological Approach
The methodology was developed using the Python programming language, version 3.12.4 through the ANACONDA package in the Spyder Integrated Development Environment IDE 5.5.1 and Pandas, NumPy, Matplotlib, Scikit-learn, and Yellowbrick libraries. It was executed on a workstation with an Intel(R) Core i7-13650HX CPU, 16 GB of RAM, and a Microsoft Windows 11 operating system.
Thus, the composite methodology used statistical and probabilistic real data analysis. The work followed the flowchart in Figure 2, which consists of data extraction, validation, clustering, and results. These data were obtained from 10 highway FCSs and collected through open charge point protocol (OCPP) telemetry from the FCSs with capture intervals of approximately 2 min. Afterward, important attributes are processed and extracted from the telemetry data. A multivariate analysis of the data is conducted using clustering techniques. Subsequently, a univariate analysis of the obtained results is performed. Finally, an analysis of the load profiles and the found scenarios is conducted, as well as an analysis of the geolocations of the FCSs.
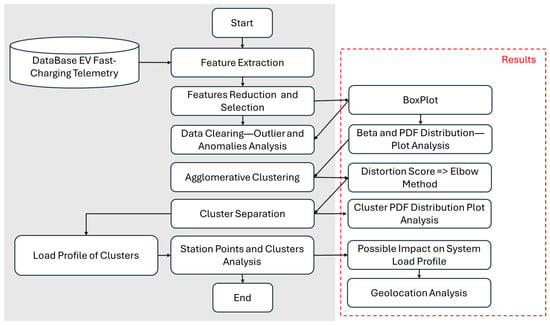
Figure 2.
Methodology flowchart.
First, a detailed preliminary analysis of the charging events was conducted to identify and extract the essential characteristics to understand charging behavior accurately. Using telemetry data from the FCSs, various significant attributes were collected and recorded, including the initial SoC of the battery at the start of the charging event, the SoC at the end of the process, the average power supplied to the battery during the charging event, the total amount of energy consumed by the vehicle during the charging process, and the total duration and the day of the charging event. Additionally, time-related attributes were captured and recorded, such as when the charging event occurred and the day of the week it was performed.
Next, records considered erroneous or indicative of charging event failures. BoxPlot visualizations were employed to assess data dispersion and identify outliers. Based on these visualizations, filters were applied to remove such records, ensuring the data quality used in subsequent analysis.
Subsequently, a general data analysis was conducted using kernel density estimation to visualize the distribution of variables before proceeding to multivariate analysis alongside beta distribution for future models. This step allowed us to have a broader understanding of the data and identify possible patterns or trends that may influence cluster formation. Following this, a multivariate data analysis was employed for clustering. The elbow method was used, which analyzes the variation in inertia (sum of the squared distances of samples to their nearest cluster center) in the number of clusters, identifying where the increase in cluster numbers does not result in a significant reduction in inertia. Considering these metrics, we arrived at a suitable set of clusters that best represent the underlying data structure, allowing for more precise results.
Then, focusing on cluster analysis, the distortion metric was selected to assign the optimized number of clusters, which calculates the sum of the squared distances of each point to its center. We let be a set of points and be the set of cluster centers. Equation (1) expresses the relation. The elbow point, which indicates the optimal number of clusters, was at 5.
The internal analysis of the clusters is important for understanding the underlying patterns of the charging events. The inputs, average power, energy consumed, SoC variation, final SoC, initial SoC, day of the month, and total recharge time of the cluster model are demonstrated in Figure 3. After the computed model, the kernel density estimation method examined the distribution of charging events within each profile. This allowed for a visualization of how the charging events are distributed and identified possible patterns.
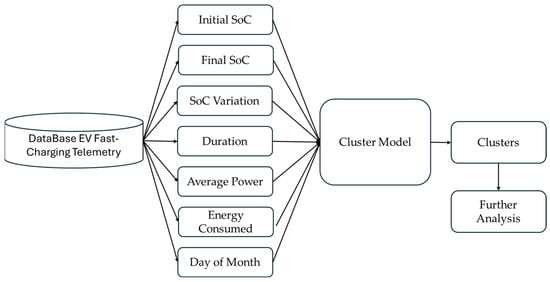
Figure 3.
Cluster model.
Following the calculation of the densities of each cluster, a graphical analysis is performed to compare the distributions of the internal variables within clusters. This can reveal insights into the differences or similarities between the charging patterns in each group. Differences between initial and final SoC, power or energy delivered, and whether there are charging peaks at specific times of the day or significant seasonal variations are observed.
Finally, the impact of each cluster on the power system load is evaluated. The methodology covered temporal aspects of charging demand, which are applied to drivers from specified clusters. It determines the clusters’ charging sessions and aggregates the charging load profile to examine and analyze how the load profile of each charging cluster affects the power profile. By better understanding the charging patterns within each cluster and their impact on the power system, more effective strategies to manage demand growth can be developed, promoting the system’s energy resilience.
4. Results and Discussion
In the analysis conducted in this work, 5918 fast charging events were extracted, spread across 10 FCSs with a maximum power of 60 kW, during the period from 28 August 2023 to 14 June 2024. The FCSs are located on highways, as shown in Figure 4, in the state of Rio Grande do Sul, Brazil, with FCS C and FCS F situated near major urban centers. Initially, calculations were performed to determine the characteristics of average power, energy consumed, variation in SoC, final SoC, initial SoC, day of the month, and total charging time based on the charging curves from the telemetry data of the FCSs.
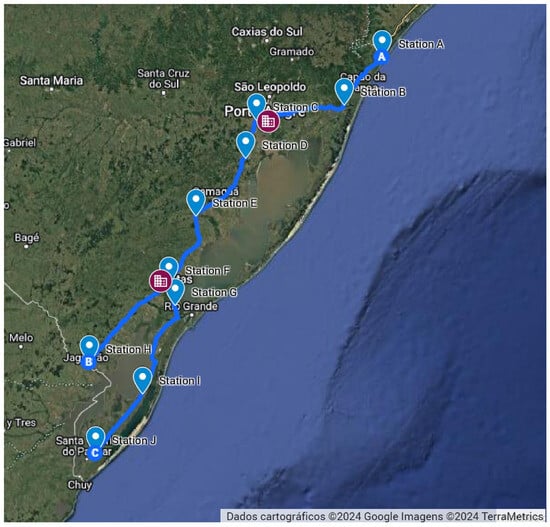
Figure 4.
Case study map representation (ten FCSs).
The initial cleaning was based on the charging time series, where values with the recorded current as zero were removed, as they represent erroneous records. Although these records were logged, the information on the SoC and other parameters was not recorded correctly. From the BoxPlot in Figure 5, by observing meager power, time, and energy consumption, false or anomalous data were removed based on established rules. Additionally, in Figure 5 the circles represent the outliers, and the box represents the quartiles and the median. Rules were established for charging events with a low probability of being valid, and the three rules for removal are defined in Equation (2).
(i) Average Power < 1 kW
(ii) Energy Consumption < 1 kWh
(iii) Total Time < 5 min
(iv) Total Time > 120 min
(ii) Energy Consumption < 1 kWh
(iii) Total Time < 5 min
(iv) Total Time > 120 min
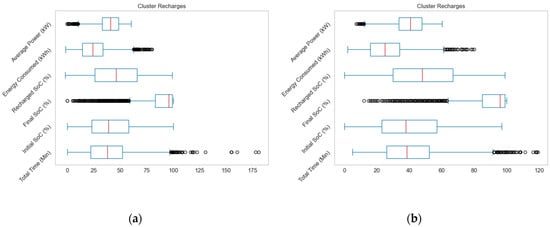
Figure 5.
Outlier and anomaly of parameters using BoxPlot. (a) Before applying the filters in Equation (2); (b) after applying the filters in Equation (2).
Figure 6 shows important driver behavior characteristics, such as the highest probabilities for a charging event on Thursday, Friday, Sunday, and Saturday and the most common times between 3 PM and 5 PM. The final SoC has a distribution that is heavily skewed toward 95%, and the initial SoC is highly asymmetrical toward a low initial SoC. It is also worth mentioning that energy, time, and power resemble a normal distribution. Moreover, the days of the week with the highest number of charging events are Thursday, Friday, Sunday, and Saturday, which are nearly equally distributed, as shown in Figure 6; the other days have fewer charging events.
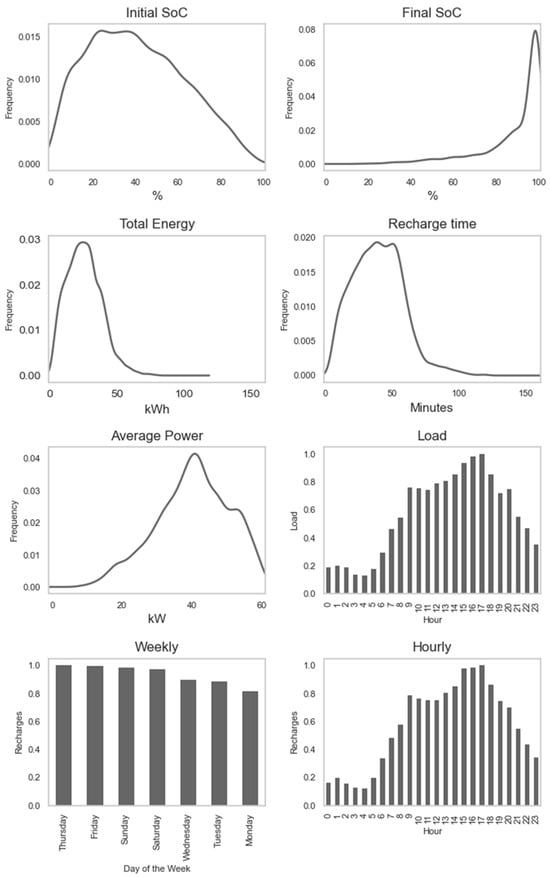
Figure 6.
Analysis of charging session parameters and probability distribution function (PDF).
This study also proposes using the beta distribution for parameters and variables such as charging time, total energy, initial SoC, final SoC, and average power, as exposed in Table 1, and it can model the charging behavior of electric vehicles. The beta distribution’s flexibility in modeling random variables is advantageous, though it is limited to a finite interval.

Table 1.
Beta distribution approximation of the parameters.
The defined number of clusters was separated using the agglomerative clustering algorithm, with the Euclidean distance metric applied, the number of clusters was selected according to Figure 7. Kernel density estimation was applied to the variables to establish the pattern of each cluster, as show in Figure 8. Typically, studies use a higher number of clusters [25,49]. By selecting fewer clusters (five), we can enhance the understanding of the clusters without significantly losing details.
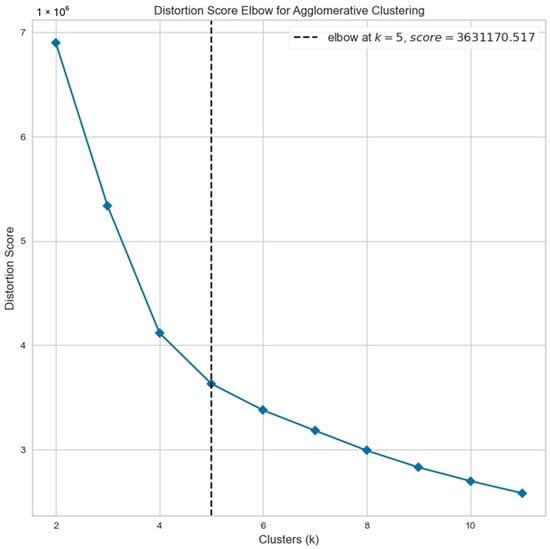
Figure 7.
The elbow method indicates five clusters representing the optimal separation.
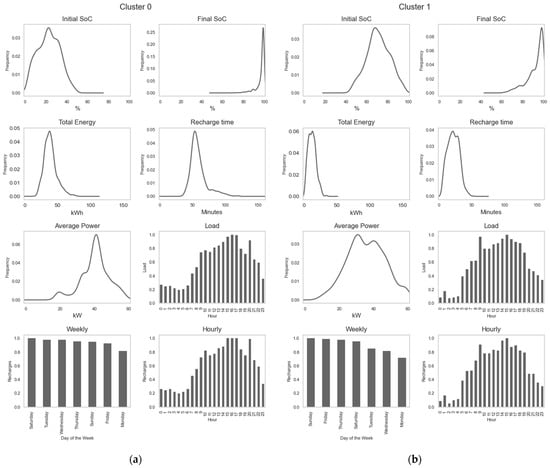
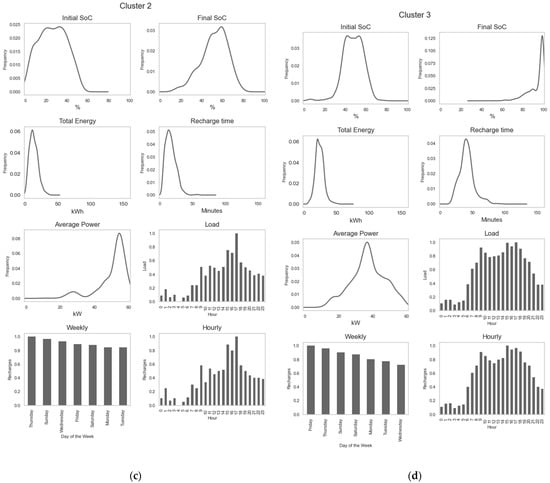
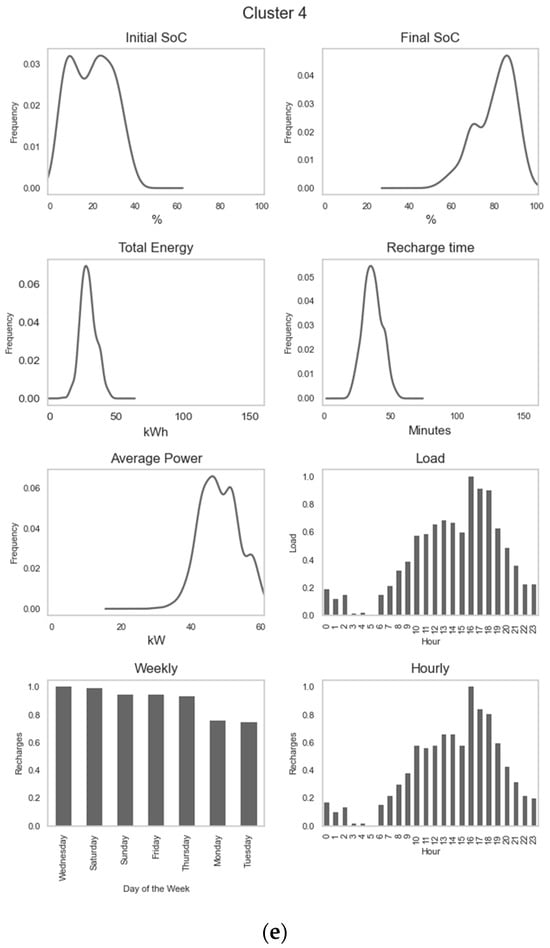
Figure 8.
Clusters session parameters and PDF. (a) Cluster 0; (b) Cluster 1; (c) Cluster 2; (d) Cluster 3; (e) Cluster 4.
Regarding the load profiles, as shown in Figure 9, Clusters 2 and 4 exhibit a significantly low normalized load estimated until 15:00, after which they align with the profile pattern of other clusters. It is important to highlight peaks at 20:00, related to Clusters 1 and 3 and Cluster 0 at 18:00. Thus, the loading peak between 15:00 and 17:00 aligns with results in other works [15,45] that shows a peak from 15:00 to 21:00. Yet the 06:30 peak for residential EV charging in [6] underscores the necessity of an adaptive loading management [6,15,45].
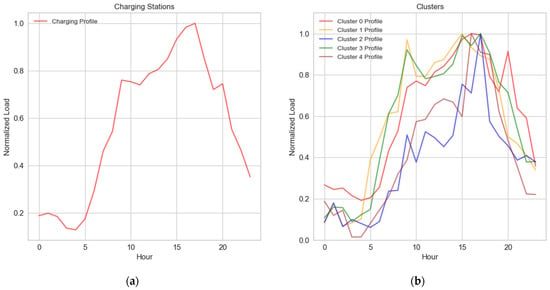
Figure 9.
Load profiles. (a) Load profile from FCSs; (b) load profile from clusters of FCSs.
Considering that power fast charging is high, clusters that have less impact on system load during off-peak system hours could receive incentives to continue charging during these times. On the other hand, clusters with more charging events and a load that coincides with the peak of the system load, which could lead to over-loads, could receive incentives to charge at other times, potentially resulting in higher tariffs to reduce demand.
Also, in Figure 10, it is highlighted that the most recurrent cluster across all FCSs is Cluster 0, followed by Cluster 3 and Cluster 1. These clusters represent situations where the charging is carried out until the state of charge is close to 100%. In other words, users complete the charging until the battery reaches maximum energy. This behavior suggests that, in these clusters, users likely need to ensure maximum range for their vehicles.
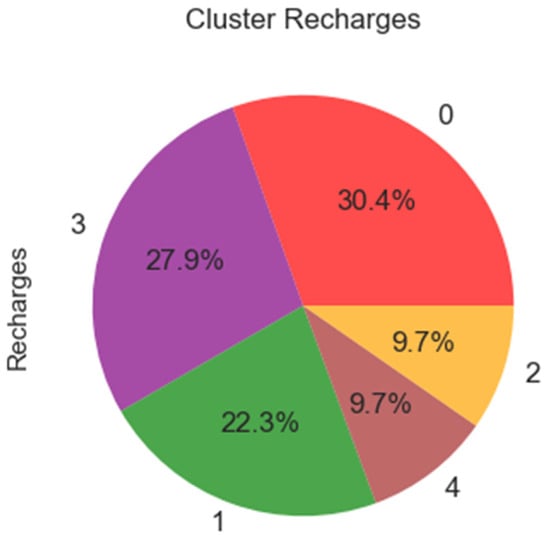
Figure 10.
Charging event divisions by clusters.
The less frequent clusters are Cluster 4 and Cluster 2, where users do not charge the battery 100%. This may indicate situations where users perform partial charging events, possibly due to time constraints, immediate mobility needs, or lack of necessity for a full charge. This variation in charging behavior may be related to different vehicle usage patterns, such as short versus long trips or the availability of charging infrastructure along routes.
Table 2 summarizes the five identified most important and distinctive characteristics of the clusters. Notably, FCSs B, E, J, and I are installed in areas far from major urban centers. These FCSs, among others, are positioned where charging patterns during longer trips are more likely to be established. In contrast, FCSs near urban centers exhibit distinct patterns.

Table 2.
Distinctive features of clusters.
FCSs A, C, D, F, and J form a group where the most common charging patterns follow the order of Clusters 0, 3, and 1, as indicated by the data from this work. This is combined and analyzed with the order of the clusters in the pie plots in Figure 11, indicating that the driver leaves the FCS with a 100% SoC. The work of [50] shows that one predicted factor for fast charging choice is the remaining distance to the next FCS, without deviation from the original route, even though most FCSs are near big cities, where others FCSs are found to be more easily [50].
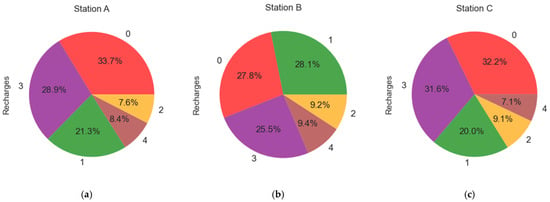
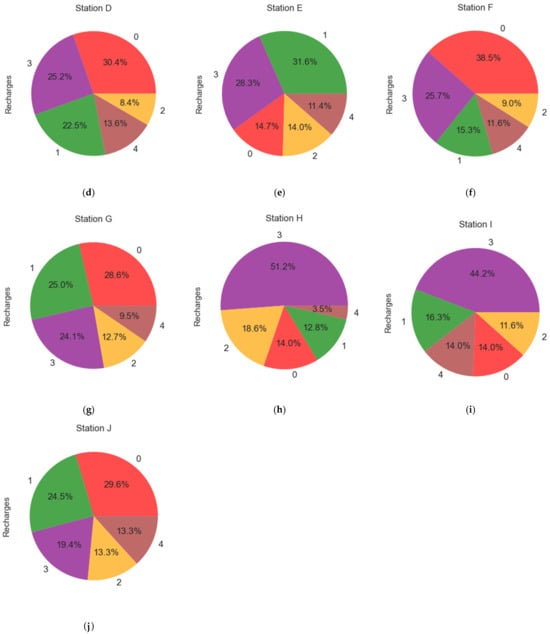
Figure 11.
Division by clusters and FCSs. (a) FCS A; (b) FCS B; (c) FCS C; (d) FCS D; (e) FCS E; (f) FCS F; (g) FCS G; (h) FCS H; (i) FCS I; (j) FCS J.
In [51], the authors report that most fast-charging events reach approximately 80% of the final SoC [51]. However, the present study differs as it considers users on long trips who currently prefer to charge full charge due to concerns about the reliability of nearby chargers. As infrastructure improves and the number of FCSs increases, this behavior may shift, allowing users to spread out charging sessions over shorter intervals and more stops. Moreover, in this study, the availability of free FCSs is a significant point. Typically, users can access cheaper charging options at home [52]. However, the free FCSs encourage users to leave with a 100% SoC.
At FCSs B and E, it is observed that most charging events belong to Cluster 1, which may also indicate charging events performed by users concerned about running out of charge due to long trips. This assumption is based on the distance of these FCSs from major urban centers and charging facilities, leading users to initiate a charging event even when their SoC is around 70%.
Additionally, FCSs H and I show Cluster 3 as the most frequent, where users, even with a 50% SoC, perform charging up to 100%. Also, in FCSs B and E, the most frequent user starts charging with an approximate 80% SoC. In these last two cases, it can be inferred that most charging events are motivated by anxiety and precaution to ensure the necessary range for their trips.
5. Conclusions
The behavior of users in the EV fast charging environment presents a multifaceted challenge. Predicting and understating user behavior remains difficult for different reasons, including individual preferences, varying charging needs, situational factors, and location availability. The data analysis of FCSs on highways and the clustering analysis conducted in this study highlight the diversity in user behavior, try to understand the influencing factors, and emphasize the necessity for adaptive groups of users to arrange typical user behavior.
Given this, our study presents a valuable analysis, emphasizing the need to develop user-centric solutions in the evolution of charging infrastructure. As the adoption of electric vehicles continues to rise, further research and more sophisticated models will be essential to better understand and accommodate the diverse needs of EV users. The observations made in this work are essential for clarifying user behavior. They can guide the optimization of the charging infrastructure, ensuring that the needs of different user group profiles are efficiently met.
In future work, the beta distribution and kernel estimation distribution will be used for parameters such as charging time, total energy, initial SoC, final SoC, and average power, as it can model the charging behavior of electric vehicles. By leveraging those distributions, researchers can more accurately represent the uncertainty associated with these variables. Ultimately, other studies can also address the challenges of demand response and load forecasting.
Author Contributions
Conceptualization, M.B.C. and A.d.R.A.; methodology, M.B.C.; software, M.B.C.; validation, B.K.H., L.N.F.d.S. and A.d.R.A.; formal analysis, B.K.H., L.N.F.d.S. and A.d.R.A.; writing—review and editing, B.K.H., L.N.F.d.S., N.K.N., J.P.S., C.H.B. and A.d.R.A.; funding acquisition, A.d.R.A. All authors have read and agreed to the published version of the manuscript.
Funding
The authors acknowledge the technical and financial support of Electrical Energy State Company (CEEE-D) and the Equatorial Energy Group (R&D project ANEEL-CEEE/EQUATORIAL/UFSM no. 5000004061), the National Institute of Science and Technology on Distributed Generation Power Systems (INCT-GD), the National Council for Scientific and Technological Development (CNPq—no. 405054/2022-0), Coordination for the Improvement of Higher Education Personnel—Brasil (CAPES—no. 23038.000776/2017-54; CAPES/PROEX – Financial Code 001), the Foundation for Research of the State of Rio Grande do Sul (FAPERGS—no. 17/2551-0000517-1; no. 23/2551-0000156-0), and the Federal University of Santa Maria (UFSM), Brazilian Institutes.
Data Availability Statement
The data presented in this study might be available on request from the corresponding author. However, they are not publicly available due to a confidentiality agreement with Equatorial Energy Group.
Acknowledgments
We gratefully acknowledge the technical and financial support from the Electrical Energy State Company (CEEE-D) and the Equatorial Energy Group, as well as the contributions of the National Institute of Science and Technology on Distributed Generation Power Systems (INCT-GD), the National Council for Scientific and Technological Development (CNPq), the Coordination for the Improvement of Higher Education Personnel (CAPES), and the Foundation for Research of the State of Rio Grande do Sul (FAPERGS). We also thank the Federal University of Santa Maria (UFSM) and the Brazilian Institutes for their invaluable support.
Conflicts of Interest
The authors declare no conflicts of interest.
References
- Kang, C.; Zhang, T. Realistic Traffic Data Based Mobility Modeling and Simulation of Smart EV. In Proceedings of the 2018 IEEE 3rd International Conference on Data Science in Cyberspace, DSC 2018, Guangzhou, China, 18–21 June 2018; pp. 854–857. [Google Scholar]
- Yang, Y.; Tan, Z.; Ren, Y. Research on Factors That Influence the Fast Charging Behavior of Private Battery Electric Vehicles. Sustainability 2020, 12, 3439. [Google Scholar] [CrossRef]
- İnci, M.; Çelik, Ö.; Lashab, A.; Bayındır, K.Ç.; Vasquez, J.C.; Guerrero, J.M. Power System Integration of Electric Vehicles: A Review on Impacts and Contributions to the Smart Grid. Appl. Sci. 2024, 14, 2246. [Google Scholar] [CrossRef]
- Nazari, M.; Hussain, A.; Musilek, P. Applications of Clustering Methods for Different Aspects of Electric Vehicles. Electronics 2023, 12, 790. [Google Scholar] [CrossRef]
- Betancur, D.; Duarte, L.F.; Revollo, J.; Restrepo, C.; Díez, A.E.; Isaac, I.A.; López, G.J.; González, J.W. Methodology to Evaluate the Impact of Electric Vehicles on Electrical Networks Using Monte Carlo. Energies 2021, 14, 1300. [Google Scholar] [CrossRef]
- Jamali Jahromi, A.; Mohammadi, M.; Afrasiabi, S.; Afrasiabi, M.; Aghaei, J. Probability Density Function Forecasting of Residential Electric Vehicles Charging Profile. Appl. Energy 2022, 323, 119616. [Google Scholar] [CrossRef]
- Chen, L.; Huang, X.; Zhang, H. Modeling the Charging Behaviors for Electric Vehicles Based on Ternary Symmetric Kernel Density Estimation. Energies 2020, 13, 1551. [Google Scholar] [CrossRef]
- Van Kriekinge, G.; De Cauwer, C.; Sapountzoglou, N.; Coosemans, T.; Messagie, M. Electric Vehicle Charging Sessions Generator Based on Clustered Driver Behaviors. World Electr. Veh. J. 2023, 14, 37. [Google Scholar] [CrossRef]
- Zenkert, J.; Dornhofer, M.; Weber, C.; Ngoukam, C.; Fathi, M. Big Data Analytics in Smart Mobility: Modeling and Analysis of the Aarhus Smart City Dataset. In Proceedings of the 2018 IEEE Industrial Cyber-Physical Systems (ICPS), Saint Petersburg, Russia, 15–18 May 2018; pp. 363–368. [Google Scholar]
- Xing, Q.; Chen, Z.; Zhang, Z.; Huang, X.; Leng, Z.; Sun, K.; Chen, Y.; Wang, H. Charging Demand Forecasting Model for Electric Vehicles Based on Online Ride-Hailing Trip Data. IEEE Access 2019, 7, 137390–137409. [Google Scholar] [CrossRef]
- Nespoli, A.; Ogliari, E.; Leva, S. User Behavior Clustering Based Method for EV Charging Forecast. IEEE Access 2023, 11, 6273–6283. [Google Scholar] [CrossRef]
- Mądziel, M.; Campisi, T. Energy Consumption of Electric Vehicles: Analysis of Selected Parameters Based on Created Database. Energies 2023, 16, 1437. [Google Scholar] [CrossRef]
- Yanagawa, G.; Aki, H. Grid Flexibility Provision by Optimization of Fast-Charging Demand of Battery Electric Vehicles. IEEE Trans. Smart Grid. 2023, 14, 2202–2213. [Google Scholar] [CrossRef]
- Yuan, Q.; Hao, W.; Su, H.; Bing, G.; Gui, X.; Safikhani, A. Investigation on Range Anxiety and Safety Buffer of Battery Electric Vehicle Drivers. J. Adv. Transp. 2018, 2018, 8301209. [Google Scholar] [CrossRef]
- da Silva, L.N.F.; Capeletti, M.B.; Abaide, A.d.R.; Pfitscher, L.L. A Stochastic Methodology for EV Fast-Charging Load Curve Estimation Considering the Highway Traffic and User Behavior. Energies 2024, 17, 1764. [Google Scholar] [CrossRef]
- Liu, J.; Zou, D.; Chen, Y.; Chu, Z. Analysis of Electric Vehicle Charging Facilities Operation Data. In Proceedings of the 2020 IEEE 5th International Conference on Intelligent Transportation Engineering (ICITE), Beijing, China, 11–13 September 2020; pp. 422–426. [Google Scholar]
- Castro, D.G.F.L.N.D. Introdução à Mineração de Dados: Conceitos Básicos, Algoritmos e Aplicações. Available online: https://integrada.minhabiblioteca.com.br/#/books/978-85-472-0100-5/ (accessed on 20 June 2021).
- Rajagopalan, P.; Ranganathan, P. Electric Vehicle Charging Behavior Prediction Using Machine Learning Models. In Proceedings of the 2022 IEEE Electrical Power and Energy Conference (EPEC), Virtual, 5–7 December 2022; pp. 123–128. [Google Scholar]
- Wang, Y.; Cai, S.; Shen, Y.; Shao, D.; Gong, X.; Zhou, C.; Chu, D. The Analysis of Electrical Vehicles Charging Behavior Based on Charging Big Data. In Proceedings of the 2019 IEEE 4th International Conference on Cloud Computing and Big Data Analysis (ICCCBDA), Chengdu, China, 12–15 April 2019; pp. 63–67. [Google Scholar]
- Xydas, E.S.; Marmaras, C.E.; Cipcigan, L.M.; Hassan, A.S.; Jenkins, N. Electric Vehicle Load Forecasting Using Data Mining Methods. In Proceedings of the IET Hybrid and Electric Vehicles Conference 2013 (HEVC 2013), London, UK, 6–7 November 2013; pp. 1–6. [Google Scholar]
- Soldan, F.; Bionda, E.; Mauri, G.; Celaschi, S. Short-Term Forecast of EV Charging Stations Occupancy Probability Big Data Streaming Analysis. arXiv 2021, arXiv:2104.12503. [Google Scholar]
- Si, C.; Xu, S.; Wan, C.; Chen, D.; Cui, W.; Zhao, J. Electric Load Clustering in Smart Grid: Methodologies, Applications, and Future Trends. J. Mod. Power Syst. Clean Energy 2021, 9, 237–252. [Google Scholar] [CrossRef]
- Malik, A.; Haghdadi, N.; MacGill, I.; Ravishankar, J. Appliance Level Data Analysis of Summer Demand Reduction Potential from Residential Air Conditioner Control. Appl. Energy 2019, 235, 776–785. [Google Scholar] [CrossRef]
- Smith, B.A.; Wong, J.; Rajagopal, R. A Simple Way to Use Interval Data to Segment Residential Customers for Energy Efficiency and Demand Response Program Targeting. Available online: https://www.aceee.org/files/proceedings/2012/data/papers/0193-000182.pdf (accessed on 4 April 2024).
- Powell, S.; Cezar, G.V.; Rajagopal, R. Scalable Probabilistic Estimates of Electric Vehicle Charging given Observed Driver Behavior. Appl. Energy 2022, 309, 118382. [Google Scholar] [CrossRef]
- Helmus, J.R.; Lees, M.H.; van den Hoed, R. A Data Driven Typology of Electric Vehicle User Types and Charging Sessions. Transp. Res. Part C Emerg. Technol. 2020, 115, 102637. [Google Scholar] [CrossRef]
- Zou, D.; Liu, J.; Chen, Y.; Chu, Z.; Lu, L. Research on Electric Vehicle Charging Stations Planning Based on Traffic Destination Heat Data and Charger Usage Data. In Proceedings of the 2020 IEEE 5th International Conference on Intelligent Transportation Engineering (ICITE), Beijing, China, 11–13 September 2020; pp. 407–410. [Google Scholar]
- Ismail, M.; Bayram, I.S.; Abdallah, M.; Serpedin, E.; Qaraqe, K. Optimal Planning of Fast PEV Charging Facilities. In Proceedings of the 2015 1st Workshop on Smart Grid and Renewable Energy, SGRE 2015, Doha, Qatar, 22–23 March 2015. [Google Scholar]
- Almutairi, A.; Alrumayh, O. Optimal Charging Infrastructure Portfolio for Minimizing Grid Impact of Plug-In Electric Vehicles. IEEE Trans. Industr. Inform. 2022, 18, 5712–5721. [Google Scholar] [CrossRef]
- Jollyta, D.; Efendi, S.; Zarlis, M.; Mawengkang, H. Analysis of an Optimal Cluster Approach: A Review Paper. J. Phys. Conf. Ser. 2023, 2421, 12015. [Google Scholar] [CrossRef]
- Aksan, F.; Jasiński, M.; Sikorski, T.; Kaczorowska, D.; Rezmer, J.; Suresh, V.; Leonowicz, Z.; Kostyła, P.; Szymańda, J.; Janik, P. Clustering Methods for Power Quality Measurements in Virtual Power Plant. Energies 2021, 14, 5902. [Google Scholar] [CrossRef]
- Liu, Z.; Wang, Z.; Li, P.; Dai, J.; Chen, J.; Xu, Z.; Tao, Y. Research on the Optimal Scheduling of Electric Vehicles in Distribute Network Based on Cluster Thought. In Proceedings of the 2023 IEEE International Conference on Power Science and Technology (ICPST), Kunming, China, 5–7 May 2023; pp. 676–681. [Google Scholar]
- Fontaínhas, J.; Cunha, J.; Ferreira, P. Is Investing in an Electric Car Worthwhile from a Consumers’ Perspective? Energy 2016, 115, 1459–1477. [Google Scholar] [CrossRef]
- Tie, S.F.; Tan, C.W. A Review of Energy Sources and Energy Management System in Electric Vehicles. Renew. Sustain. Energy Rev. 2013, 20, 82–102. [Google Scholar] [CrossRef]
- Official Journal of the European Union Regulation (EU) 2023/1804 of the European Parliament and of the Council of 13 September 2023 on the Deployment of Alternative Fuels Infrastructure, and Repealing Directive 2014/94/EU. Available online: https://eur-lex.europa.eu/eli/reg/2023/1804/oj (accessed on 27 October 2023).
- Rivera, S.; Goetz, S.M.; Kouro, S.; Lehn, P.W.; Pathmanathan, M.; Bauer, P.; Mastromauro, R.A. Charging Infrastructure and Grid Integration for Electromobility. Proc. IEEE 2023, 111, 371–396. [Google Scholar] [CrossRef]
- Rabie, A.; Ghanem, A.; Kaddah, S.S.; El-Saadawi, M.M. Electric Vehicles Based Electric Power Grid Support: A Review. Int. J. Power Electron. Drive Syst. (IJPEDS) 2023, 14, 589. [Google Scholar] [CrossRef]
- Pelekis, S.; Pipergias, A.; Karakolis, E.; Mouzakitis, S.; Santori, F.; Ghoreishi, M.; Askounis, D. Targeted Demand Response for Flexible Energy Communities Using Clustering Techniques. Sustain. Energy Grids Netw. 2023, 36, 101134. [Google Scholar] [CrossRef]
- Dharavat, N.; Golla, N.K.; Sudabattula, S.K.; Velamuri, S.; Kantipudi, M.V.V.P.; Kotb, H.; AboRas, K.M. Impact of Plug-in Electric Vehicles on Grid Integration with Distributed Energy Resources: A Review. Front. Energy Res. 2023, 10, 9890. [Google Scholar] [CrossRef]
- Mahadik, S.; Guchhait, P.K. Efficient Integration of Renewable Energy for Electric Vehicle Charging: A Hybrid System Approach. Int. J. Sci. Res. Sci. Technol. 2023, 10, 859–865. [Google Scholar] [CrossRef]
- Lin, J.; Sun, J.; Feng, Y.; Zheng, M.; Yu, Z. Aggregate Demand Response Strategies for Smart Communities with Battery-Charging/Switching Electric Vehicles. J. Energy Storage 2023, 58, 106413. [Google Scholar] [CrossRef]
- Yang, T.; Xu, X.; Guo, Q.; Zhang, L.; Sun, H. EV Charging Behaviour Analysis and Modelling Based on Mobile Crowdsensing Data. IET Gener. Transm. Distrib. 2017, 11, 1683–1691. [Google Scholar] [CrossRef]
- Hammerschmitt, B.K.; Unsihuay-Vila, C.; Sausen, J.P.; Capeletti, M.B.; Aoki, A.R.; Teixeira, M.D.; Barriquello, C.H.; Abaide, A.d.R. Adaptive Charging Simulation Model for Different Electric Vehicles and Mobility Patterns. Energies 2024, 17, 4032. [Google Scholar] [CrossRef]
- Palensky, P.; Dietrich, D. Demand Side Management: Demand Response, Intelligent Energy Systems, and Smart Loads. IEEE Trans. Industr. Inform. 2011, 7, 381–388. [Google Scholar] [CrossRef]
- Hathaway, Z.; Polis, H.; Loomis, J.; Boroski, J.; Milano, A.; Ouyang, J. A Utility Roadmap for Expanding Customer Adoption of Electric Vehicles. World Electr. Veh. J. 2021, 12, 81. [Google Scholar] [CrossRef]
- Schill, W.-P.; Gerbaulet, C. Power System Impacts of Electric Vehicles in Germany: Charging with Coal or Renewables? Appl. Energy 2015, 156, 185–196. [Google Scholar] [CrossRef]
- Gnann, T.; Klingler, A.-L.; Kühnbach, M. The Load Shift Potential of Plug-in Electric Vehicles with Different Amounts of Charging Infrastructure. J. Power Sources 2018, 390, 20–29. [Google Scholar] [CrossRef]
- Jahangir, H.; Tayarani, H.; Ahmadian, A.; Golkar, M.A.; Miret, J.; Tayarani, M.; Gao, H.O. Charging Demand of Plug-in Electric Vehicles: Forecasting Travel Behavior Based on a Novel Rough Artificial Neural Network Approach. J. Clean Prod. 2019, 229, 1029–1044. [Google Scholar] [CrossRef]
- Yao, W.; Yu, Z.; Gao, S. Research on Data-Driven Cluster Analysis of Electric Vehicle Charging Sessions. In Proceedings of the 2023 IEEE Sustainable Power and Energy Conference (iSPEC), Chongqing, China, 28–30 November 2023; pp. 1–6. [Google Scholar]
- Ge, Y.; MacKenzie, D. Charging Behavior Modeling of Battery Electric Vehicle Drivers on Long-Distance Trips. Transp. Res. D Transp. Environ. 2022, 113, 103490. [Google Scholar] [CrossRef]
- Jonas, T.; Daniels, N.; Macht, G. Electric Vehicle User Behavior: An Analysis of Charging Station Utilization in Canada. Energies 2023, 16, 1592. [Google Scholar] [CrossRef]
- Kavianipour, M.; Verbas, O.; Rostami, A.; Soltanpour, A.; Gurumurthy, K.M.; Ghamami, M.; Zockaie, A. Deploying Fast Charging Infrastructure for Electric Vehicles in Urban Networks: An Activity-Based Approach. Transp. Res. Rec. 2024, 2678, 416–435. [Google Scholar] [CrossRef]
Disclaimer/Publisher’s Note: The statements, opinions and data contained in all publications are solely those of the individual author(s) and contributor(s) and not of MDPI and/or the editor(s). MDPI and/or the editor(s) disclaim responsibility for any injury to people or property resulting from any ideas, methods, instructions or products referred to in the content. |
© 2024 by the authors. Licensee MDPI, Basel, Switzerland. This article is an open access article distributed under the terms and conditions of the Creative Commons Attribution (CC BY) license (https://creativecommons.org/licenses/by/4.0/).