Abstract
Integration of heat pumps combined with thermal energy storage provides a key pathway to decarbonizing the energy supply in the industry when the processes are not operated continuously. Yet, this integration of such novel systems introduces control challenges due to added dependencies between different process streams. This work investigates the control problem of heat pumps coupled to stratified thermal energy storage that is integrated into non-continuous industrial processes. A two-layer control strategy is proposed, where, in the higher level, a model predictive controller is developed for energy management using a linear model of the non-linear process. The resulting optimization problem is a mixed integer quadratic program. The low-level control layer is defined with standard industry controllers. The overall system is tested using a dynamic simulation model for the entire process, demonstrating its performance in three different cases. The control strategy optimizes heat recovery while ensuring system operability. The study demonstrates successful disturbance rejection and cold starts, wherein 100% of the targeted heat recovery can be confirmed under nominal conditions. Further evaluation in laboratory or field trials is recommended, and alternative, yet-to-be-defined, control concepts may be compared to the proposed approach.
1. Introduction
Like all sectors, industry must reduce greenhouse gas emissions to enable the achievement of current climate goals. Key pathways to reduce emissions are increasing energy efficiency and electrifying the energy supply when using low-emission electricity. Heat pumps (HPs) are a key technology to reach both targets as they enable re-utilization of low-temperature heat surplus and electrification of heating and cooling supply [1].
The integration of HPs in industrial processes using pinch analysis was first described by Townsend and Linnhof [2]. Hindmarsh et al. [3] showed the influence of the operating temperatures of refrigeration cycles on their power consumption when integrating HP across the pinch. Wallin et al. [4] developed a method for determining the optimal temperature level, HP size, and type using composite curves. This work was extended using the grand composite curve [5]. The graphical approach using the grand composite curve for HP integration has been applied to several case studies, such as a whiskey production process [6], a cheese factory [7], a biomass gasification process [8], and a confectionery production plant [9]. Schlosser et al. [10] developed the heat pump bridge analysis for the efficient retrofit integration of HPs using the modified energy transfer diagram. However, a significant proportion of the industrial sector is not operated continuously, given the particular requirements of the products being manufactured. These requirements include flexibility and traceability of the production process (e.g., for quality control in the pharmaceutical sector), time factors related to product quality, regular cleaning requirements, etc. Stampfli et al. [11] proposed a hybrid approach utilizing insight-based and nonlinear programming techniques to integrate HPs in non-continuously operated industrial processes. Agner et al. [12] developed a graphical method for a combined HP and thermal energy storage (TES) integration, also including indirect heat recovery (HR). These approaches include TES to enable the use of an HP despite the non-continuous nature of the integrated process streams (PSs). Both of the latter works identified the need to investigate the control of the resulting system as additional dependencies are being created when achieving a higher level of integration. Walden et al. [13] developed a dynamic pinch analysis targeting approach enabling HP integration in non-continuous processes, concluding that HP-integrated storage systems should also be included in the methodology. Elsidio et al. [14] developed a multiperiod synthesis methodology, including the possibility of integrating HP and TES. These recent works emphasize the feasibility and need for HP-TES system integration in the industry. The control thereof is, however, not discussed in any of the mentioned studies. Regarding control of HP, there are several investigations of model predictive control (MPC) to address energy management, but they are limited to either domestic HP or district heating networks. Clauß et al. [15] investigated different rule-based control strategies for a building with a ground-source HP, including domestic hot water, concluding that MPC should be investigated in a further step. Lee et al. [16] developed an MPC that included constraints on the HP operating envelope, leading to an integer optimization problem. Hoving et al. [17], as well as Van Randenborgh and Darup [18], investigated the application of MPC for supervisory control of an HP-integrated aquifier TES system used for building heating and cooling on a district level. Liu et al. [19,20,21] studied HP control with simultaneous heating and cooling demands of buildings. Zhao et al. [22] investigated an MPC application for a HP-assisted solar water heating system, underlining the relevance of MPC for energy management tasks. Tang et al. [23] investigated the application of MPC control of HP-TES systems in domestic applications, which shows the appropriateness of MPC for such tasks, but the use case and system setup differ substantially from the one in this work. Dyrska et al. [24] investigated the application of MPC to heat exchanger (HEX) controls, underlining the relevance of MPC control in the industry. The control of indirect HR using heat recovery loops is discussed by Walmsley et al. [25], but they did not investigate the energy management task of the storage system. All in all, there are no studies available in the field of industrial process control regarding the control of HP in non-continuous processes, thus a research gap exists.
1.1. The HP-TES System
This work investigates the control of resulting HP-TES systems for non-continuous processes, as derived in [11,12]. The HP-TES system provides cooling needed for PSs with low-temperature heat surpluses, upgrades the heat to a higher temperature level through the HP, and provides heating to PSs with heat deficits on a higher temperature level. All PSs are connected to an individual intermediate loop (IL) with a corresponding HEX. TESs are implemented on the cold and hot end of the HP to decouple its operation from the fluctuations of the PSs. External hot and cold utilities are included in parallel to the HP to balance eventual heat surpluses and deficits. A schematic of the system under consideration is introduced in Section 2. HP-TES systems are operated through repeating operating periods [12]. Therefore, there is knowledge about the upcoming nominal heating and cooling demands to be covered by the system, which may be included in the control of the system.
1.2. Problem Statement and Aims
The integration of HP-TES systems into non-continuous processes allows for efficiency increases and electrification of the heating and cooling demand. From a control perspective, however, this implementation also implies challenges. If the heating and cooling demands of a process are supplied solely by external hot utility (HU) and cold utility (CU) (e.g., gas burners and chiller systems), they can be controlled independently, as there is no coupling between the hot and cold streams. The introduced coupling between the integrated streams of the HP-TES system reduces the degrees of freedom available for control. Any fluctuation of a hot or cold stream affects the HP-TES system and, thereby, may affect the heating or cooling of the other streams. Thus, there is not just a real-time control problem of the HP-TES but also an energy management task to be solved. To enable the adoption of efficiency-increasing measures, reliable operation through appropriate control of the resulting system must be guaranteed. The aim of this work is to address the challenges faced when controlling such novel HP-TES systems by proposing a suitable control strategy.
There is a gap between the previously established control concepts for HPs, where they are used for the provision of heating or cooling exclusively or when they are integrated on district heating grids, and HP-TES systems integrated into non-continuous processes, where they must cover both heating and cooling simultaneously and rigorously. This gap is bridged by the introduction of the following novelties in this work:
- A two-level control concept for HP-TES system;
- The development of a simplified process model suitable for the real-time execution of an MPC controller;
- Inclusion of production plans into the MPC controller to minimize unnecessary utility usage.
2. Proposed Control Strategy
The objective of the control strategy for the HP-TES system is to enable and maintain its operation when it is subjected to typical real-world disturbances. Furthermore, the HP-TES system should be operated such that the provision of energy by the HP, rather than by the utilities, is maximized. Depending on the individual case, this aim generally leads to a minimization of energy costs and greenhouse gas emissions. If the HP-TES system cannot be operated steadily, the cooling and heating demand of the system has to be covered by the utilities, which is generally more cost- and emission-intensive.
In order to operate the HP-TES system continuously, many individual components need to be controlled so that they do not interfere negatively with each other. Although the control of each individual component needs to be in consideration of its position in the HP-TES system, the system may be subdivided into two main regions, as illustrated in Figure 1:
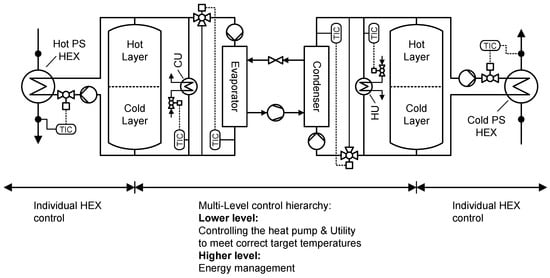
Figure 1.
Illustration of the proposed control concept of the HP-TES system with a two-level control hierarchy.
- Intermediate loops with process HEX;
- Heat pump with hot utility and cold utility.
The TESs play a crucial role in the system, not only separating the temporal dependency of the HP operation from the PSs but also allowing for a separation of the control problems when HP, HEXs, and utilities are controlled appropriately.
It is, therefore, proposed that the HEXs be controlled individually from the HP since the storage acts as a buffer between them. Although it is not guaranteed that the disturbed outlet temperature of any individual component does not impact other components, these disturbances should not affect the control quality of the system as a whole.
When focusing on the inner region with the HP and the utilities, it can be observed that both the HP and the utilities require control in multiple timescales. The respective outlet temperatures of each unit need continuous control, i.e., in the range of seconds, as disturbances can occur at any time. On the other hand, the loading and unloading of the TESs, which is controlled through the proper use of the HP and utilities, occurs in the time-frame of hours. This necessitates a separation of these two control problems, leading to the division of the entire control task into two levels, as depicted in Figure 2.
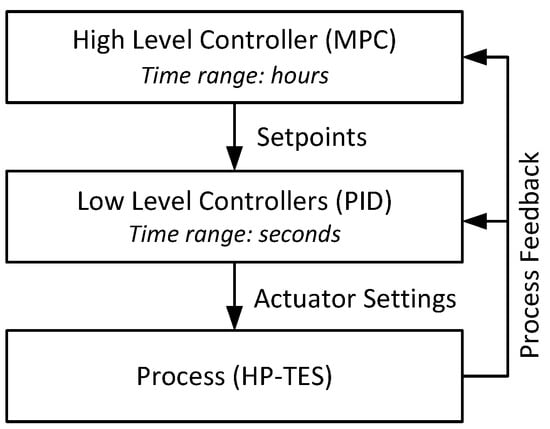
Figure 2.
Hierarchy of control structure.
- The high-level control problem addresses the energy management of the overall system by controlling the TESs charging states;
- The low-level control problem addresses real-time disturbances and controls individual components to their setpoints.
Due to the two entirely different timescales, the control problems do not interfere with each other. The high-level controller considers the low-level system controlled in a steady state. The following sections describe the high- and low-level control problems.
2.1. High-Level Controller
As aforementioned, the task of the high-level controller is to keep the HP-TES system in balance by managing the use of the utilities and HP. This will be achieved by managing the charging levels of the TESs such that there is always sufficient heating or cooling capacity available to fulfill the heating and cooling demands of the upcoming PSs. To achieve this goal, the respective layers of the hot and cold TES must be sufficiently large. The storage levels and of the cold and hot TES are the controlled variables in the high-level control problem, which will be controlled towards their setpoint (SP). Figure 3 shows the signal flow schematic of the high-level control problem. The HP charges the cold and hot storage simultaneously ( and , respectively) while the HU () and CU () can be used to charge each storage independently from the other. The heating demand of the cold PS and cooling demands of the hot PS are known disturbances to the high-level control problem. Thus, the manipulated variables are the prescribed heat load of the utilities ( and ) and the HP control (). Since the storages enable the discontinuous operation of the HP, constant-speed HPs are considered in this work; thus, is an integer variable. The control problem has three inputs, of which one is an integer variable and two outputs in the charging levels of the storages.
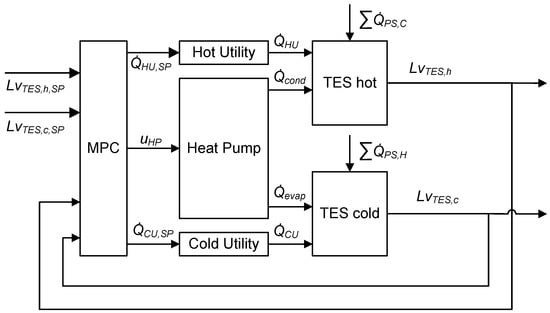
Figure 3.
Signal flow of the high-level control problem.
The task of managing the TESs according to the current state of the system and the repeating operating period requires a control method that can compensate for expected and unexpected disturbances by setting the actuators of the multiple input multiple output (MIMO) system appropriately. Furthermore, it should use the least amount of utilities as possible to minimize the operating cost of the processes by maximizing HR through the HP-TES system. Unnecessary utility spikes shall be avoided to enable the smooth operation of the utility systems. Additionally, the system is constrained regarding the available HP and utility capacity and storage levels. The control method for energy management has to be able to plan the optimal use of the three manipulated variables of the system while ensuring the fulfillment of the constraints applicable to the manipulated variables and the system states. Common control methods such as PID or LQR controllers or rule-based methods address only part of these tasks by design and thus appear inappropriate. The use of MPC for the energy management task is favorable since it employs multivariable control, prediction of the system behavior in the future, and, especially, constraints on the states and manipulated variables by design. In the following, the state-space model required for the development of the MPC is derived, and the MPC formulation is explained.
2.1.1. State-Space Model of the HP-TES Energy Management Task
The following describes the continuous-time state-space model used for the energy management of the HP-TES system. This model is subsequently discretized and employed in the MPC.
Based on the first law of thermodynamics, one can express the change of energy E of a closed system, where no work is applicable, according to Equation (1).
where are the in- and outgoing heat flows of the system.
For the TESs of the HP-TES system, this can be applied, as the ILs are closed loops. The relevant heat flows for the hot storage are the heat flow of the condenser , the HU , and of the sum of all cold PSs . For the cold storages, likewise, they are the heat flow of the evaporator , the CU , and the sum of all hot PSs . Hence, one can express the energy balance of the hot and cold layers of the TESs according to Equations (2) and (3), respectively.
where and are the mass inventories of the cold and hot layer of the respective TES, the specific heat capacity of the storage medium water, and and the design temperature difference of the cold and hot TES, respectively.
The entire energy content of the system is not of interest, but only the one hot or cold layer of the hot and cold TES, respectively. With appropriate control of the individual components on the lower-level control problem, the temperatures can be assumed constant according to the design and thus the model remains linear, allowing for an expression of the change of the energy of the hot and cold layer of the respective TES according to Equations (2) and (3).
Introducing the storage level and as the share of the mass of the cold and hot layer of the respective TES as in Equations (4) and (5) normalizes the charging state of the TESs. For the eventual implementation, the temperature sensors in the storage tanks are utilized to measure the current storage level. For this work, it is assumed to have 11 sensors installed in the TESs. The details of the calculation of the storage level can be found in the Appendix A.2.
where and are the total mass inventories of water stored in the cold and hot TES, respectively. The ordinary differential equation for the dimensionless charging state of the TES then reads as
using
leads to the final form of the energy balance:
Generally speaking, such a linear dynamic system as the one described with Equations (1)–(11) can be described in the state-space as follows:
where x is the state vector, A the system matrix, B the input matrix, u the input vector, D the disturbance matrix, d the disturbance vector, y the output vector, C the output matrix, and D the feed-through matrix.
The states of the system are . Thereby, it can be observed, that the states do not depend on themselves or a derivative of them. Thus, the dynamics of the system can be described as pure integrators. The continuous-time state-space representation of the system matrix is defined by:
The important part of the model is the definition of the inputs and disturbances. The input vector is defined as , with defined as the input of the HP; and are the setpoints of the heat flows of the HU and CU, respectively, which are all constrained variables and are passed to the low-level controllers.
The input matrix of the model is therefore defined as the heat flow of each input divided by the storage capacity:
Following the same approach, the disturbance vector can be defined as as the sum of the heat load of the cold and hot PSs, respectively, as this is the amount of heat extracted from the corresponding layer of the TES by the process. It shall be noted that, while some of the disturbances may be known, others usually remain unknown. The disturbance input matrix can subsequently be defined as
Since the states directly represent the controlled outputs of the high-level control problem, the output matrix C of the model is the identity.
The system’s feed-through matrix is a square matrix of zeros as there is no direct feed-through from the inputs to the TES levels. The feed-through term will thus be removed in the further course of this paper.
This model describes the dynamic system of the TES’ loading state regarding the inputs and disturbances. It is the basis for the MPC controller to manage the loading of the TES.
2.1.2. Model Predictive Control Formulation
MPC turns the control task of the dynamic system into an optimization problem that is repeatedly solved. The model described in the previous section can now be discretized utilizing a suitable sampling period to be able to formulate the MPC problem. The discrete-time state-space system describes the process analogously to the continuous-time state-space in the form of Equation (18). The future state of the system is described by the current state , inputs , and disturbances . The discrete-time state, input, disturbance, and output matrix are hereinafter identified with index d. The discretization can be performed with the exact discretization using matrix exponentials as it is explained in [26]. For this work, the discretization was conducted in MATLAB ® R2020a.
The discrete-time state-space system can then be used in the MPC. The following Equations (19a)–(19d) describes the generic form of the MPC formulation. A reference for the derivation of MPC can be found in Borelli et al. [27].
where is the optimal cost, N the prediction, and M the control horizon; and are the lower and upper constraints of the states, and the lower and upper constraints of the inputs of the system, Q and are the weights of the inputs and the states, and is the reference of the states. The system dynamics are incorporated as an equality constraint in Equation (19b), where only the known part of the disturbances may be incorporated in the MPC model; is described as
where are the unknown disturbances.
This system does not, however, always yield a feasible solution. An example for this problem could be that the storages are almost empty, and the expected disturbances are larger than the feasible inputs. Under the given constraints of the states and the inputs, the optimizer would, in this case, not provide any solution instead of at least trying to keep the system operational as far as possible.
For these circumstances, the constraints on the states have to be softened. So-called soft constraints allow a violation of the constraints at an extremely large cost added to the cost function. This results in a maximal use of all inputs if the constraints are expected to be violated leading to the “best feasible solution”. In order to implement the soft constraints, a so-called slack variable is introduced into the state constraints equation (see Equation (21c)), which is penalized as an additional term in the cost function (Equation (21a)), where is the slack variable for the corresponding sample i and is the cost matrix to penalize the constraint violation. In practice, has to be chosen several orders of magnitude higher than the cost of the states and inputs.
Applied to the HP-TES’ energy management task, the constraints have to be adjusted accordingly. The two states are constrained as , i.e., empty charging, and , i.e., fully charged. The input constraints are to be adapted to the effectively implemented system. The first input is a binary variable since the HP in this work can only be switched on or off. The other two inputs are limited by , as the utilities cannot be used in the reversed direction. The upper constraint is given due to the installed utility HEX, piping, and pump capacity. The constraints are summarized below:
The MPC was implemented in MATLAB® R2020a using the YALMIP toolbox [28]. Since the optimization problem contains an integer variable (), the optimization problem is a mixed integer quadratic problem, which requires the use of an appropriate solver. For this work, the commercial solver Gurobi 9.0.0 [29] was used.
2.2. Low-Level Control Problem
Whereas the high-level control problem determines the setpoints of a number of the actuators, the low-level control problem contains all real-time control tasks with dynamic responses in the range of seconds (compared to hours in the high-level control problem). Subsequently, the applied individual control concepts for each component are described briefly.
2.2.1. Heat Pump Control
The HP is proposed to be controlled by the determination of the operating state (on/off) by the high-level control method and controlling the condenser and evaporator outlet temperatures by the low-level controller. It is proposed to incorporate a mixing valve at the evaporator/condenser inlet (with a recycle pipe from the respective outlet) in order to be able to control the outlet temperatures. The HP with the marked components is shown in Figure 4. The outlet temperatures of the evaporator and the condenser may be controlled with two independent single input single output (SISO) PID controllers. The mixing valves are used to vary the evaporator () and condenser () inlet temperatures by mixing the inlet temperatures ( and ) with the corresponding outlet temperature of the evaporator or condenser, respectively. Such a control setup ensures a constant mass flow rate in the evaporator and condenser ( and ) while varying the respective storage mass flow rates (, and ). For startup of the HP, the recycle loops may be fully closed to avoid inappropriate storage inlet temperatures.
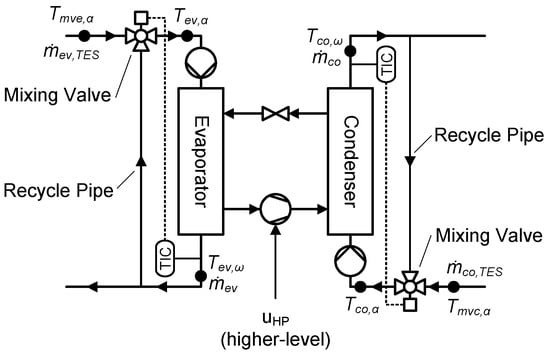
Figure 4.
Detailed view of the HP with marked components.
2.2.2. Process Heat Exchanger Control
The HEXs between the IL and the PS (shown in Figure 5) need to be controlled in such a way that the PS outlet temperature is controlled to its setpoint while ensuring stratification within the TESs of the HP-TES system. They are proposed to be equipped with a PID-controlled throttle valve and a differential pressure-controlled pump to control the mass flow rate of the IL. In this way, the PS is heated from its inlet temperature to . The IL medium is being cooled from its inlet temperature to its outlet temperature . In such a setup, does not remain constant, but this variation is accepted, as the HP is used to recondition this medium to the right temperature. In the case of a hot PS, the same setup in the opposite heat flow direction is valid.
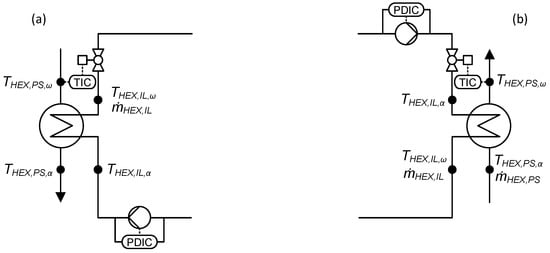
Figure 5.
Detailed view of the IL and HEX controlled according to the proposed control strategy for hot (a) and cold (b) PS.
2.2.3. Utility Control
The control of the utility HEXs is neither addressed nor modeled in detail in this work, as a standard industry controller may be used for this part. It is assumed that the respective controller is able to provide the desired utility load.
3. Case Study
3.1. Process Description
To test the proposed control strategy, a low-complexity test case was defined to allow for a clear understanding of cause and effects in the results. The case consists of two PSs, which are chosen such that they do not allow direct HR (through a HEX) and, therefore, HR can only be achieved with an HP. Furthermore, the streams coexist only for 15 min of the cycle duration of 1.5 h. The cold PS (C1) and the hot PS (H1) are to be heated and cooled according to Table 1. Figure 6 shows the corresponding Gantt.

Table 1.
Stream table of the test case.
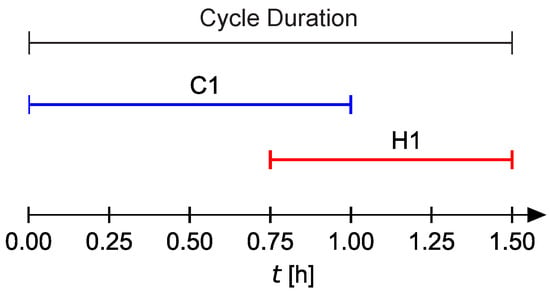
Figure 6.
Gantt chart of the test case with marked cycle duration.
3.2. System Model
The proposed control strategy was tested in a simulation study utilizing a dynamic simulation model of the process. The details of the simulation model may be found in Appendix A of this paper.
3.3. Simulation Study Parametrization
An HP-TES system for the test case was designed using the methodology of Stampfli et al. [11]. The result can be seen in Figure 7. Table 2 shows the design parameters of the HP-TES system of the test case.

Figure 7.
Optimized HP-TES system for the test case study.

Table 2.
Design parameters for the HP-TES system of the test case.
A compressor from the manufacturer Bitzer (mode 6JE-25Y-40P) was chosen to simulate the case with realistic data. The compressor has a nominal cooling load and heating load of at the design temperatures of the test case [30]. The storages and the HEX areas were parameterized with a 20% safety margin (over-dimensioned compared to Table 2).
The sampling period of the MPC was chosen at in order to be able to keep the prediction and control horizon reasonably small at . The weights of the MPC are chosen as follows:
where specifies the diagonal matrix with the given elements. This leads to a free usage of the HP and penalization of the utility usage. The MPC parameters are summarized in Table 3.

Table 3.
MPC parameters of the simulation study.
3.4. Simulated Cases
For the evaluation of the overall performance of the control strategy, the test case was simulated in the following setup for two subsequent cycles of the given cycle duration (1.5 h, see Table 1):
- Case 1:
- Test case with nominal PSs (nominal operation as defined in Section 3.1);
- Case 2:
- Test case with both storages in fully discharged condition (according to the conceptual design) at a temperature of 11.5 for the cold TES and 37.1 in the hot TES at the beginning;
- Case 3:
- Test case with unknown additional cooling load on the cold TES to disturb the energy balance of the system. The additional heat load is prescribed with the same temperatures as stream H1 but with a mass flow rate of 1 kg/s and occurs from time to .
4. Results
In the following sections, the results of these simulations are presented. Each case is presented with the temperature development in the TESs and the relevant control signals.
4.1. Case 1: Nominal Operation
Figure 8 shows the temperatures in the TESs. Figure 9 shows the relevant signals of the high-level controller. The hot TES in Figure 8a is initially at 43 , i.e., fully charged according to the conceptual design. The TES is then steadily discharged as the heating demand of the PS C1 is larger () than the supplied heat by the HP (). This can, on the one hand, be seen through the falling temperatures at the respective heights, and, on the other hand, in Figure 9g, where the calculated storage level is shown. At , the discharge phase of the hot TES ends as the PS C1 no longer exists ( kg/s). The storage is then being rapidly charged until the end of the cycle at . At , the storage is almost fully charged again. The temperature at 0.0 m is starting to increase at , which indicates that the entire storage is charged and the thermocline of the storage is being pushed towards the bottom of the storage. In the second cycle, the same events occur.
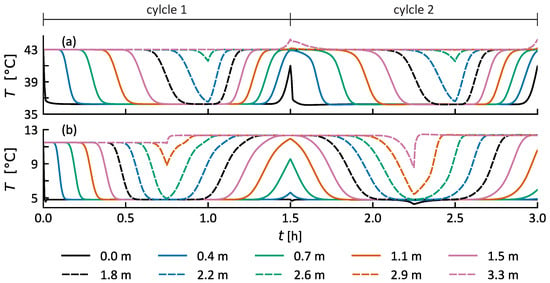
Figure 8.
Temperatures in the hot TES (a) and cold TES (b) in Case 1. Temperatures at 10 heights of the TESs are shown.
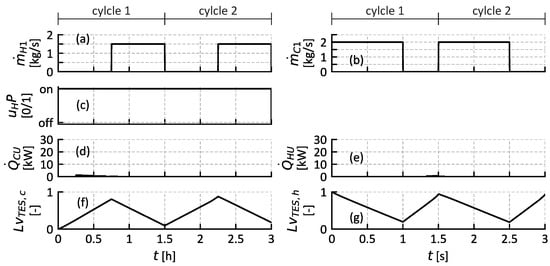
Figure 9.
PS mass flow rates (a,b), control signals (c–e), and controlled variables (f,g) of MPC controller for Case 1.
The cold TES is first exclusively cooled, i.e., charged with cold water at 4.8 , as there is no cooling requirement present, which can be seen in Figure 8b. At , the hot stream H1 begins to heat the TES again as it starts to exist. This change can also be seen in Figure 9f. The hot layer of the cold TES is now at approximately . The MPC outputs can be seen in Figure 9c–e. The HP is run continuously and almost no utilities are used. The hot layer of the cold TES is above the specification of the conceptual design, which is caused by the throttle valve control of the 20% overdimensioned HEX. The MPC ensures sufficient cooling throughout the operation, leading to a confirmation of the entire HR potential.
4.2. Case 2: Cold Start
By initializing both the cold and hot TES in their empty state, i.e., entire storage at 11.5 and 37.1 , respectively (see Figure 10), the utilities are needed from the beginning of Case 2. In Figure 11c–e, it can be seen that the MPC switches the HP on and requests HU from the beginning. At approximately , the HU is turned off, as the MPC projects that the available heat input of the HP is sufficient for the next cycle when considering the known disturbances (i.e., the upcoming heating and cooling requirements). Here, the MPC was able to use the amount of utilities needed in order to ensure the lower constraint of the TES level at . The second cycle is then operated mostly as in Case 1 with only using the HP and marginal utilities.
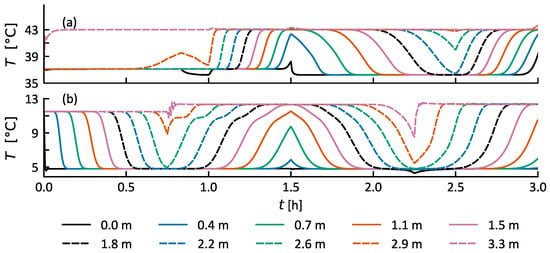
Figure 10.
Temperatures in the hot TES (a) and cold TES (b) in Case 2. Temperatures at 10 heights of the TESs are shown.
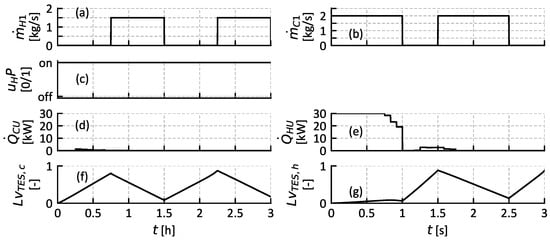
Figure 11.
PS mass flow rates (a,b), control signals (c–e), and controlled variables (f,g) of MPC controller for Case 2.
4.3. Case 3: Unknown Disturbance
Case 3 poses a test of the energy management system in another way: by introducing unknown disturbances during the operation. From to , the unknown disturbance is occurring as specified in Section 3.4. Figure 12b shows that the cold TES is almost neither charged nor discharged as the heat load of the disturbance with is in the range of the evaporator heat load of . Additionally, the IL outlet temperature is rather high, due to the part load operation of the HEX, which is dimensioned for H1. This circumstance can be seen in Figure 12b: the temperature at the top of the storage tank (3.3 m) rises to approximately . The level of the cold TES, shown in Figure 13f, declines accordingly slightly during the occurrence of the unknown disturbance. After the first occurrence of the unknown disturbance, the MPC starts using CU to provide sufficient cold water in the cold TES and maintain the TES level within the specified constraints. Due to the prediction of the expected load after the unknown disturbance, the CU is kept at the minimal required amount to maintain the system as operational. It can be observed that the minimal CU is employed as the level of the cold TES at is almost exactly at 0, and no unnecessary charging of the cold TES is occurring. After the first cycle with the disturbance, the system operates in the second cycle according to the default specifications.
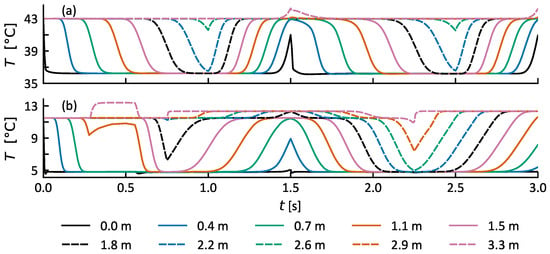
Figure 12.
Temperatures in the hot TES (a) and cold TES (b) in Case 3. Temperatures at 10 heights of the TESs are shown.
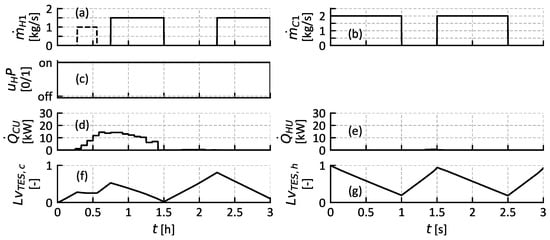
Figure 13.
PS mass flow rates (a,b), control signals (c–e), and controlled variables (f,g) of MPC controller for Case 3. The unknown disturbance occurs from to .
To further detail the behavior of the plant in this case, Figure 14 shows the mass flow rates of the TESs. A positive mass flow rate occurs when the respective TES is being charged, a negative one when it is being discharged. It can be observed that the hot TES (Figure 14b) is unaffected by the disturbance on the cold TES. The mass flow rate remains mostly constant during the charging and discharging phases in each cycle. At the end of each cycle, the mass flow rate increases as the thermocline exits the TES, and, thus, the temperature difference is reduced, leading to a need for an increased mass flow rate to maintain the condenser outlet temperature at its setpoint, given the constant condenser heat flow. In Figure 14a, the impact of the disturbance can be observed, as during the occurrence of the disturbance, the storage mass flow rate is almost at zero and changes continuously but slightly as the TES employs the CU at slightly different rates.

Figure 14.
Mass flow rates of the cold (a) and hot (b) TES in Case 3.
5. Discussion
5.1. Low-Level Control Strategy
The low-level controllers were, in all cases, able to maintain the system operation and reach the desired setpoints. The process HEX control fulfills the control task. The return temperatures of the HEXs are, in all cases, above the design temperature of the hot layer of the cold TES and below the design temperature of the cold layer of the hot TES. This effect is achieved by the employment of a throttle valve controller. As this layer of storage is uncritical to ensure the cooling and heating of upcoming PSs, it is favorable to have such an extension of the temperature difference across the TESs since this results in an increase in the storage capacity of the installed tanks.
In the situation of an almost fully loaded TES (e.g., at in Case 1 for the hot TES, or at in Case 1 for the cold TES), the thermocline is being pushed out of the TES and thus a variable HP inlet temperature results, leading to an increase/decrease of the mixing valve inlet temperatures /, respectively. This circumstance leads to the point until the mixing valve is fully open and the outlet temperatures cannot be maintained at the corresponding setpoint. In the mentioned situation, it can be observed that the storages are being “overcharged”, i.e., store medium at a higher/lower temperature than needed. This reduces the efficiency of the HP as the temperature lift increases. The operation of the HEXs is not expected to cause problems, as they can be regulated to almost zero mass flow through the throttle valves, and it can be observed that no further problems are occurring afterward. For applications with the small temperature differences, like the test case in this work, this circumstance is not expected to cause problems, as the added temperature generally should increase the pressure ratio in the HP cycle to a problematic level which would cause emergency shutdowns. The MPC controller of the high-level strategy could adopt to this by adjusting the upper state-constraints (and setpoint), leading to an earlier switching off of the HP. For TESs with large temperature differences, this could be a higher risk, as the pressure ratio in the HP would rise drastically, potentially resulting in a safety shut-off of the HP itself. In such cases, a adoption of the limits should be investigated.
5.2. High-Level Control Strategy
The high-level controller is able to maintain the system in balance for all studied cases. The knowledge of the schedule and heat load of the PSs and the available measurements at 11 points in the tank provided sufficient knowledge to the controller to ensure the planning of the utilities and HP usage. In Case 2, the MPC provided sufficient HU to bring the system in balance again after an off-balance start, but did not employ more HU than needed, thus minimizing the cost. The availability of the exact schedule of the process demands leads to low usage of utility. Such exactness of the schedule can, however, not be assumed to be at this level of perfection in real applications. Thus, further analysis appears necessary to investigate the robustness and cost-effectiveness of the control strategy when uncertainty on the input data rises. Case 2 and Case 3 provide first insights that the proposed control strategy is able to reject unknown disturbances within one cycle duration when sufficient information is available. For larger systems where production schedules may not be known or where it would be infeasible to collect such information, load prediction based on historical data might be an interesting direction of investigation as an MPC strategy can leverage such information, as demonstrated in this work.
The incorporation of the switchable HP into the MPC turns the optimization problem into a mixed integer one. This type of problem requires specific, potentially cost-intensive optimization solvers. Given the length of the control horizon, 15 consecutive on/off decisions for the HP operation are to be made. The optimization problem with these 15 binary variables is not considered large, and open-source solvers may be able to solve it in adequate computation time, as the sampling period of the high-level controller is in the range of minutes. In the simulation studies it can, however, be seen that the HP is always on until one of the two storages is fully charged. It could therefore be evaluated if a reduction of the energy management system to the utilities alone is sufficient while enabling or disabling the HP based on a set of rules governed by the fact that the HP should always try to maintain the TESs fully charged.
MPC is a suitable control approach for load-shifting tasks. Depending on the cycle duration of the processes where an HP-TES system is to be implemented, it could be interesting to investigate the cost sensitivity of installing additional storage and potentially HP capacity in order to exploit electricity price reductions during nighttime or other low price periods. This could also be interesting if the processes, as often seen in industry, are not run 24/7 but only during a fraction of the day. Due to the increasing share of fluctuating (renewable) electrical energy sources, the electricity market is currently being flexibilized, allowing for a potential economic benefit of such systems. The introduced MPC model would be a suitable basis for such an extension.
6. Conclusions
The operation and control of an HP-TES system was investigated in this work. A two-level control strategy was proposed and evaluated with a test case in three different variations. These simulations confirm that the proposed control strategy and especially its separation into two levels can successfully control the system undergoing disturbances. The entire HR share could be confirmed in the simulations when undergoing nominal conditions.
The low-level control strategy performed with the test case according to the specifications. It is advantageous to incorporate the throttle valve control with the HEXs, as it could be shown in the case studies that the temperature difference in the TESs and, thereby, the storage capacity, can be increased, resulting in a larger safety margin for unexpected disturbances. Furthermore, the proposed arrangement with a differential pressure controlled pump and the throttle valve allows for a scalable solution with only one central pumping station. The modeling chosen for the high-level control task allows for the formulation of a linear model of the nonlinear stratified TES system. The subsequently developed MPC is able to control the system under the given constraints of available storage capacity and the inputs. With the simulation study of the entire system, it could be shown that the MPC controller is able to minimize utility usage by incorporating knowledge about the upcoming process requirements. This can be especially advantageous when limited utility capacity is available, as MPC incorporates such constraints by design. Overall, the MPC control concept with its strongly simplified and linear process model is well suited for the task under investigation.
Further work should be aimed at evaluating the proposed control strategy with additional case studies, preferably with industry data. Since this work presents a unique control concept for a novel system, comparison against alternative, yet-to-be formulated control concepts should be made in the future to provide the best-performing yet simplest control concepts for practical applications of future HP-TES systems.
Author Contributions
Conceptualization, R.A.; methodology, R.A., P.G. and B.W.; software, R.A.; validation, R.A., P.G. and B.W.; formal analysis, R.A.; investigation, R.A.; resources, B.W.; data curation, R.A.; writing—original draft preparation, R.A.; writing—review and editing, R.A., P.G. and B.W.; visualization, R.A.; supervision, B.W.; project administration, B.W. and R.A.; funding acquisition, B.W. and R.A. All authors have read and agreed to the published version of the manuscript.
Funding
This research was funded by the Swiss Federal Office of Energy SFOE, contract number SI/501822-01. The APC was funded by the Lucerne University of Applied Sciences and Arts.
Data Availability Statement
The data presented in this study are available in the article.
Conflicts of Interest
The authors declare no conflicts of interest.
Abbreviations
The following abbreviations are used in this manuscript:
| CU | Cold Utility |
| HEX | Heat Exchanger |
| HP | Heat Pump |
| HR | Heat Recovery |
| HU | Hot Utility |
| IL | Intermediate Loop |
| MPC | Model Predictive Control |
| PID | Proportional Integral Derivative (Controller) |
| PS | Process Stream |
| SP | Setpoint |
| TES | Thermal Energy Storage |
Appendix A. Simulation Model
The simulation of the HP-TES system is described subsequently and contains the following main components. The overall topology of the model can be seen in Figure A1.
- Heat pump;
- Two stratified storage tanks;
- Heat exchangers for the process streams;
- Hot and cold utility.
Appendix A.1. Heat Pump Model
The main requirement regarding the HP model in this work is the physically correct representation of the HP in varying operating points and thus needs little detail with respect to the refrigerant cycle itself. The main focus lies on the dynamics of the water cycles. The HP model is described with eight dynamic states: the evaporation and condensation pressure (, ) and the temperatures of the three mixed water cells each for the evaporator () and condenser (); and are equivalent to the water outlet temperatures of the evaporator and condenser, respectively. The inlet temperatures of the evaporator and condenser are prescribed by the mixing valves of each side; their effect and purpose are explained in Section 2.

Figure A1.
Structure of the simulation model with indicated possible flow directions of the different pipe segments. States of the system are named accordingly.
The mass balance of the corresponding gas volumes of the condenser and evaporator must be solved to determine the evaporation and condensation pressure. Assuming an ideal pressure distribution in the gas volume of the condenser and evaporator and the ideal gas law, this can be expressed with the ordinary differential Equations (A1) and (A2). Hence, the pressure depends on the refrigerant mass flow rate transported by the compressor and the evaporated and condensed refrigerant (, ). This implies that the volume reduction through the condensation leads to a negligible liquid volume of the refrigerant.
where is the specific gas constant of the refrigerant, and are the design evaporation and condensation temperature, respectively, and are the relevant gas volumes of the evaporator and condenser, respectively, and are assumed to be for a shell and tube HEX. These parameters determine the dynamics of the HP’s gas system. The three gas system parameters are set with average values for the expected operating range.
The evaporated and condensed mass flow rates are calculated based on the heat flows and the specific enthalpy changes of the refrigerant in the condenser and evaporator, according to Equations (A3) and (A4), respectively. The enthalpies of the refrigerant in the refrigeration cycle are defined as illustrated in Figure A2: at the suction port of the compressor, after the compressor, at the boiling line at condenser pressure, and implying the isenthalpic expansion from the condenser to the evaporator. The compressor outlet enthalpy is calculated with constant isentropic efficiency . For the later introduced compressor of the test case, this value was identified at .
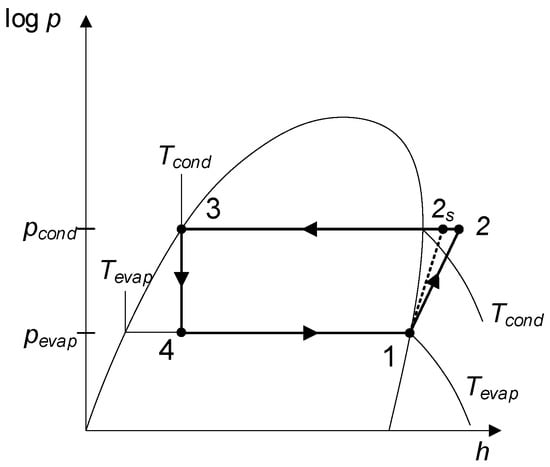
Figure A2.
Definition of the states of the HP cycle calculated in the dynamic simulation model.
The condenser and evaporator HEX model is adapted from Agner et al. [31]. The six water cells of the HEX models are assumed to be ideally mixed (lumped cells), and the heat flow is calculated using the logarithmic mean temperature difference for each cell. Equation (A5) describes the temperature of the evaporator cells i; Equation (A6) describes the one of the condenser. As the water flow through the condenser and evaporator remains approximately constant (due to the mixing valve arrangement), a variation of the heat transfer coefficient U is not implemented. For calculating the logarithmic mean temperature difference, the de-superheating of the gas is neglected, as it represents only a small share of the total condensation enthalpy for the used refrigerant R1234ZE, and the proposed control setup leads to a small temperature difference on the water side. If refrigerants with large shares of the total condensation enthalpy in the superheated gas region (e.g., R410A) were used, separating the two zones could be appropriate. The sum of the three heat flows at the condenser and evaporator are then used in Equations (A3) and (A4), respectively. The evaporation and condensation temperature are thereby calculated based on the pressure in the condenser and evaporator using CoolProp [32]. This temperature calculation represents the link between the water and gas systems.
For the simulation, a PI controller was implemented to control the outlet temperature of the condenser and evaporator via the mixing valves, as suggested above. The mixing valve is modeled with a linear mixing law and has a certain slope limitation due to the actuator speed. For this work, the duration needed to change the state of the valve from fully closed to fully open is 60 s, which lies in the range of usual values for valve actuators [31]. The temperature sensors at the condenser and evaporator outlet were modeled as PT1 elements according to the transfer function in Equation (A7), with a time constant .
The compressor is in this work is assumed to be a positive displacement compressor. The characteristic is thereby modeled statically. Assuming an isentropic compression leads to the following relationship between mass flow rate of the compressor and the given pressures in the evaporator and condenser [33]:
where is the theoretical displacement volume of the compressor (per rotation of the motor), N is the compressor speed, and is the specific volume of the refrigerant at the suction port; is the volumetric efficiency of the compressor, which is described as
where is the isentropic expansion coefficient of the refrigerant (for simplicity, calculated at the suction conditions), and is the ratio of the compressor’s clearance volume to its displacement volume as follows:
The clearance ratio is compressor-specific and must be set according to each case. The remaining applied parameters of the HP model are described in Table A1.

Table A1.
HP model parameters.
Table A1.
HP model parameters.
| Parameter | Value |
|---|---|
| 0.089 | |
| N | 24.17 Hz |
| 20 kg | |
| 20 kg | |
| 12.1 kW/K | |
| 10.1 kW/K |
Appendix A.2. Thermal Energy Storage Model
To model the TESs, a vertical discretization of the tank in several volumes is conducted, and the mass and energy balances are solved for each cell. The simulation model of Vallasmil et al. is used in this work, and further details may be found in the respective report [34].
Ambient heat losses are neglected in this work, as the cycle periods of typical applications in non-continuous processes are within the range of hours, and a well-insulated tank can be assumed.
To be able to operate the process HEXs flawlessly, their IL-sided inlet temperature needs to be at least at the temperature used for the dimensioning of the HEX or, in the case of the condenser side, slightly above, and on the evaporator side, slightly below, this value. This implies that only the part of the storage medium that is at the respective setpoint or above/below can be regarded as available heat for the HEXs. Everything below/above is also a certain charge of heat available to the HEXs, but it cannot be guaranteed that the PSs can be heated to their setpoint if the HEXs are designed according to their specification from the conceptual design. From a software implementation point of view, this circumstance can, however, cause problems. If the measurement in the TESs shows, e.g., 39.9 instead of 40.0 , the storage should not be assumed empty, as (i) measurement errors always occur, and (ii) the design of the HEXs will, in reality, most likely not be that strict. It is therefore assumed that a certain tolerance would still remain in the operational system. For the test case in this work, it is assumed that a is permissible. This might still be a rather tight tolerance, but the temperature differences in the HP-TES systems are often rather small. In the test case, the temperature differences in the TESs are in the range of . Further analysis of the robustness of the HP-TES methodology is potentially necessary. In a concrete implementation, this rule may be softened by a certain tolerance if the experience shows sufficient HEX performance. Figure A3 illustrates the charging state of the TESs. Note: only one of the two levels is relevant for the hot and cold TES of the HP-TES system.
The determination of the TES level is as illustrated in Figure 3 based on the measured temperatures in the TES. The problem with the level is that a continuous variable can only be measured with several discrete measurement points inside the TES. The number of temperature measurements will need to be justified from an economic point of view. If there were only few sensors installed in the tanks, the level can only be determined with quantization of the number of sensors. If, for example, as shown in Figure A3, six sensors were installed, a resolution of 20% steps of the TES level can be determined, whereas the resolution can be improved when using appropriate interpolation methods. In this work, a piecewise cubic hermite interpolating polynomial with a grid of 100 segments is used [35].
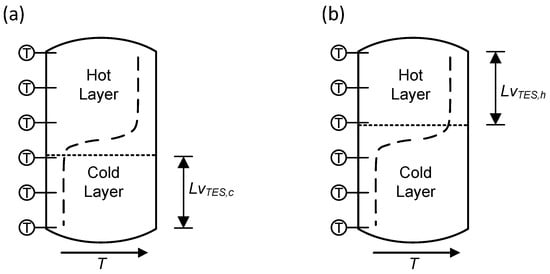
Figure A3.
Stratified storage tank with schematic temperature profile (dashed line) and marked levels for the case of a cold (a) and hot (b) storage of the HP-TES system.
Appendix A.3. Heat Exchanger Model
The model used for the HEX between the storage tanks and the PSs was developed and experimentally validated in Agner et al. [31]. The model is based on a mixed-cell (lumped-parameters) approach with 3 mixed cells on each side. Contrary to the HP model, the overall heat transfer coefficient k in this case, however, is not constant, as the flow through the HEXs may vary by a great amount. This variation is incorporated with an approximated calculation of the film heat transfer coefficient depending on the mass flow rate through the respective side of the HEX.
This results in a calculation of the overall heat transfer coefficient U as follows:
Figure A4 illustrates one pair of hot and cold cells of the model between the IL i and cell j and the PS i and cell j. Since the cell is assumed to be ideally mixed, the outlet temperature of the medium is equal to the cell temperature. Equations (A13) and (A14) describe the dynamics of this pair of cells. This pattern is applied to the HEX on the hot and cold IL (and may be extended to further units).
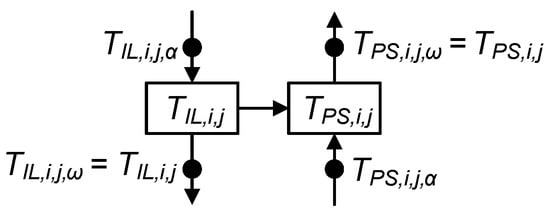
Figure A4.
One cell-pair of the HEX model. Heat transfer occurs from the hotter IL cell to the colder PS cell.
The proposed control strategy for the HEX is implemented as a PI controller for the adjustment of the IL mass flow rate. The throttle valve is modeled with a linear characteristic. The slope limitation due to the actuator speed was implemented as for the mixing valves of the HP. For this work, the duration needed to change the state of the valve from fully closed to fully open is 60 s, which lies in the range of usual values for valve actuators [31]. The temperature sensors at the HEX outlets were modeled identically as with the HP-controller as PT1 elements according to Equation (A7), with a time constant . The remaining applied parameters of the HP model are described in Table A2.

Table A2.
HEX model parameters.
Table A2.
HEX model parameters.
| Parameter | Value |
|---|---|
| 1.5 mm | |
| 5 kg | |
| 5 kg |
Appendix A.4. Utilities
The control of utility heat exchangers is a well-studied task and implemented in industry in thousands, if not millions, of units. It is therefore assumed, in this work, that the utility heat exchangers can be operated without relevant control error, allowing for an idealized model of the utility where they are modeled such that they provide the requested mass flow rate into the return pipe of the condenser/evaporator to the TES.
Appendix A.5. Implementation of the Simulation Model
The TES model is an existing program implemented in C++, and the controller development was conducted in MATLAB/Simulink ® R2020a. Therefore, an interface between the two solutions was implemented. The C++ program is the master program that starts and controls the simulation. In a defined cycle duration , the two simulations are synchronized by exchanging data via the MATLAB ® Engine API for C++ (R2020a). The dynamic model is then calculated in Simulink™ for the defined simulation duration (e.g., 2 s). The data are, therefore, every being synchronized as illustrated in Figure A5.
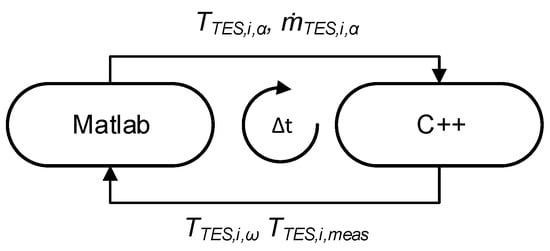
Figure A5.
Synchronization schematics of the simulation model.
References
- International Energy Agency. Energy Efficiency 2018; Technical report; International Energy Agency: Paris, France, 2018. [Google Scholar]
- Townsend, D.W.; Linhoff, B. Heat and Power Networks in Process design: Part 1: Criteria for Placement of Heat Engines and Heat Pumps in Process Networks. AIChE J. 1983, 29, 742–748. [Google Scholar] [CrossRef]
- Hindmarsh, E.; Boland, D.; Townsend, D. Heat Integrate Heat Engines in Process Plants. In Proceedings of the Eight Annual Industrial Energy Technology Conference, Houston, TX, USA, 21–23 April 1986; pp. 477–489. [Google Scholar]
- Wallin, E.; Franck, P.; Berntsson, T. Heat pumps in industrial processes—An optimization methodology. Heat Recovery Syst. CHP 1990, 10, 437–446. [Google Scholar] [CrossRef]
- Wallin, E.; Berntsson, T. Integration of Heat Pumps in Industrial Processes. Heat Recovery Syst. CHP 1994, 14, 287–296. [Google Scholar] [CrossRef]
- Benstead, R.; Sharman, F. Heat Pumps and Pinch Technology. Heat Recovery Syst. CHP 1990, 10, 437–446. [Google Scholar] [CrossRef]
- Kapustenko, P.O.; Ulyev, L.M.; Boldyryev, S.A.; Garev, A.O. Integration of a heat pump into the heat supply system of a cheese production plant. Energy 2008, 33, 882–889. [Google Scholar] [CrossRef]
- Pavlas, M.; Stehlík, P.; Oral, J.; Klemeš, J.; Kim, J.K.; Firth, B. Heat integrated heat pumping for biomass gasification processing. Appl. Therm. Eng. 2010, 30, 30–35. [Google Scholar] [CrossRef]
- Olsen, D.; Abdelouadoud, Y.; Liem, P.; Hoffmann, S.; Wellig, B. Integration of Heat Pumps in Industrial Processes with Pinch Analysis. In Proceedings of the 12th IEA Heat Pump Conference, Rotterdam, The Netherlands, 15–18 May 2017. [Google Scholar]
- Schlosser, F.; Wiebe, H.; Walmsley, T.G.; Atkins, M.J.; Walmsley, M.R.W.; Hesselbach, J. Heat Pump Bridge Analysis Using the Modified Energy Transfer Diagram. Energies 2020, 14, 137. [Google Scholar] [CrossRef]
- Stampfli, J.A.; Atkins, M.J.; Olsen, D.G.; Walmsley, M.R.; Wellig, B. Practical heat pump and storage integration into non-continuous processes: A hybrid approach utilizing insight based and nonlinear programming techniques. Energy 2019, 182, 236–253. [Google Scholar] [CrossRef]
- Agner, R.; Ong, B.H.Y.; Stampfli, J.A.; Krummenacher, P.; Wellig, B. A Graphical Method for Combined Heat Pump and Indirect Heat Recovery Integration. Energies 2022, 15, 2829. [Google Scholar] [CrossRef]
- Walden, J.V.M.; Wellig, B.; Stathopoulos, P. Heat pump integration in non-continuous industrial processes by Dynamic Pinch Analysis Targeting. Appl. Energy 2023, 352, 121933. [Google Scholar] [CrossRef]
- Elsido, C.; Martelli, E.; Grossmann, I.E. Multiperiod optimization of heat exchanger networks with integrated thermodynamic cycles and thermal storages. Comput. Chem. Eng. 2021, 149, 107293. [Google Scholar] [CrossRef]
- Clauß, J.; Sartori, I.; Alonso, M.J.; Thalfeldt, M.; Georges, L. Investigations of different control strategies for heat pump systems in a residential nZEB in the nordic climate. In Proceedings of the 12th IEA Heat Pump Conference, Rotterdam, The Netherlands, 15–18 May 2017. [Google Scholar]
- Lee, Z.; Gupta, K.; Kircher, K.J.; Zhang, K.M. Mixed-integer model predictive control of variable-speed heat pumps. Energy Build. 2019, 198, 75–83. [Google Scholar] [CrossRef]
- Hoving, J.; Boxem, G.; Zeiler, W. Model predictive control to Maintain ATES balance using heat pump. In Proceedings of the 12th IEA Heat Pump Conference, Rotterdam, The Netherlands, 15–18 May 2017. [Google Scholar]
- Randenborgh, J.V.; Darup, M.S. MPC using mixed-integer programming for aquifer thermal energy storages. arXiv 2024, arXiv:2404.09786. [Google Scholar] [CrossRef]
- Liu, F.; Zhu, W.; Cai, Y.; Groll, E.A.; Ren, J.; Lei, Y. Experimental performance study on a dual-mode CO2 heat pump system with thermal storage. Appl. Therm. Eng. 2017, 115, 393–405. [Google Scholar] [CrossRef]
- Liu, F.; Zhu, W.; Zhao, J.; Ren, J.; Groll, E.A.; Cai, Y. A new method for optimal control of a dual-mode CO2 heat pump with thermal storage. Appl. Therm. Eng. 2017, 125, 1123–1132. [Google Scholar] [CrossRef]
- Liu, F.; Zhu, W.; Zhao, J. Model-based dynamic optimal control of a CO2 heat pump coupled with hot and cold thermal storages. Appl. Therm. Eng. 2018, 128, 1116–1125. [Google Scholar] [CrossRef]
- Zhao, Z.; Wang, C.; Wang, B. Adaptive model predictive control of a heat pump-assisted solar water heating system. Energy Build. 2023, 300, 113682. [Google Scholar] [CrossRef]
- Tang, W.; Li, Y.; Walker, S.; Keviczky, T. Model Predictive Control Design for Unlocking the Energy Flexibility of Heat Pump and Thermal Energy Storage Systems. arXiv 2024, arXiv:2402.12488. [Google Scholar]
- Dyrska, R.; Horváthová, M.; Bakaráč, P.; Mönnigmann, M.; Oravec, J. Heat exchanger control using model predictive control with constraint removal. Appl. Therm. Eng. 2023, 227, 120366. [Google Scholar] [CrossRef]
- Walmsley, M.R.; Walmsley, T.G.; Atkins, M.J.; Neale, J.R. Methods for improving heat exchanger area distribution and storage temperature selection in heat recovery loops. Energy 2013, 55, 15–22. [Google Scholar] [CrossRef]
- Wittenmark, B.; Åström, K.J. Computer Control: An Overview. In IFAC Professional Brief Computer; International Federation of Automatic Control: Zurich, Switzerland, 2002. [Google Scholar]
- Borrelli, F.; Morari, M.; Bemporad, A. Predictive Control for Linear and Hybrid Systems; Cambridge University Press: Cambridge, UK, 2017. [Google Scholar]
- Löfberg, J. YALMIP: A toolbox for modeling and optimization in MATLAB. In Proceedings of the CACSD Conference, Taipei, Taiwan, 2–4 September 2004. [Google Scholar] [CrossRef]
- Gurobi Optimization, L. Gurobi Optimizer Reference Manual; Gurobi: Beaverton, OR, USA, 2019. [Google Scholar]
- Bitzer Kühlmaschinenbau GmbH. Semi-Hermetic Reciprocating Compressors, 50 Hz, KP-100-1 EN. Brochure 2019. Available online: https://www.bitzer.de/shared_media/documentation/kp-100-1-en.pdf (accessed on 10 July 2024).
- Agner, R.; Lucas, E.J.; Olsen, D.G.; Gruber, P.; Wellig, B. Robust Control of Heat Exchangers in Stratified Storage Systems-Simulation and Experimental Validation. Chem. Eng. Trans. 2019, 76, 781–786. [Google Scholar] [CrossRef]
- Bell, I.H.; Wronski, J.; Quoilin, S.; Lemort, V. Pure and Pseudo-pure Fluid Thermophysical Property Evaluation and the Open-Source Thermophysical Property Library CoolProp. Ind. Eng. Chem. Res. 2014, 53, 2498–2508. [Google Scholar] [CrossRef] [PubMed]
- Lei, Z.; Zaheeruddin, M. Dynamic simulation and analysis of a water chiller refrigeration system. Appl. Therm. Eng. 2005, 25, 2258–2271. [Google Scholar] [CrossRef]
- Villasmil, W.; Troxler, M.; Hendry, R.; Worlitschek, J. OPTSAIS—Exergetic and Economic Optimization of Seasonal Thermal Energy Storage Systems; Swiss Federal Office of Energy: Bern, Switzerland, 2019.
- Fritsch, F.N.; Carlson, R.E. Monotone Piecewise Cubic Interpolation. SIAM J. Numer. Anal. 1980, 17, 238–246. [Google Scholar] [CrossRef]
Disclaimer/Publisher’s Note: The statements, opinions and data contained in all publications are solely those of the individual author(s) and contributor(s) and not of MDPI and/or the editor(s). MDPI and/or the editor(s) disclaim responsibility for any injury to people or property resulting from any ideas, methods, instructions or products referred to in the content. |
© 2024 by the authors. Licensee MDPI, Basel, Switzerland. This article is an open access article distributed under the terms and conditions of the Creative Commons Attribution (CC BY) license (https://creativecommons.org/licenses/by/4.0/).