Abstract
In view of the necessity of measuring the air content in oil in two-phase flows in the context of general industry, a review of the most popular methods of measuring the air content in oil was carried out. This review includes an assessment of their advantages and disadvantages and of whether they meet criteria such as the degree of filling, the size and number of bubbles, verification, the absence of additional pressure drops, simplicity, and repeatability. In the review, the following methods were examined: the classic trapping method, a modified trapping method, a trapping method using hydrostatic pressure loss, the pressure loss due to frictional flow resistance, the pressure loss with a rapid increase in diameter, the pressure drop in a Venturi tube, the pressure drop in an orifice, a method using the Coriolis effect, the electrical resistance method, the electrical conductivity method, the electromagnetic method, the electrical capacitance method, the thermal anemometry method, the liquid–solid contact electrification method, the photographic method, holography, light scattering, sound dispersion, the ultrasonic transit-time method, X-ray radiation, gamma radiation, neutron radiation, and fiber-optic methods.
1. Introduction
In this review, we examine methods of measuring the undissolved air content in oil in two-phase flows, and we present the advantages and disadvantages of each. The comparison of these methods of measuring air content enables easier selection of the measurement method for use in general industrial and laboratory applications and for studies that will be conducted in the future. Two-phase flows of air in oil commonly occur in different branches of industry—for example, the energy industry, oil and gas industry, chemical industry, paper industry, mining industry, and others where oil is used. The presented methods can be helpful, for example, in measuring the air content in oil during studies of a tank’s return chamber in lubrication systems.
The tank is one of the basic elements of a hydraulic system; without it, it is impossible to operate such a system. It performs many important functions, which include storing, degassing, and cooling the oil. All functions performed by the tank require a certain amount of time. The time needed for the implementation of all functions performed by the tank is called the retention time [1,2] (definition: the retention time is the time allowed for the disengagement of entrained air or gas (according to [1,2])).
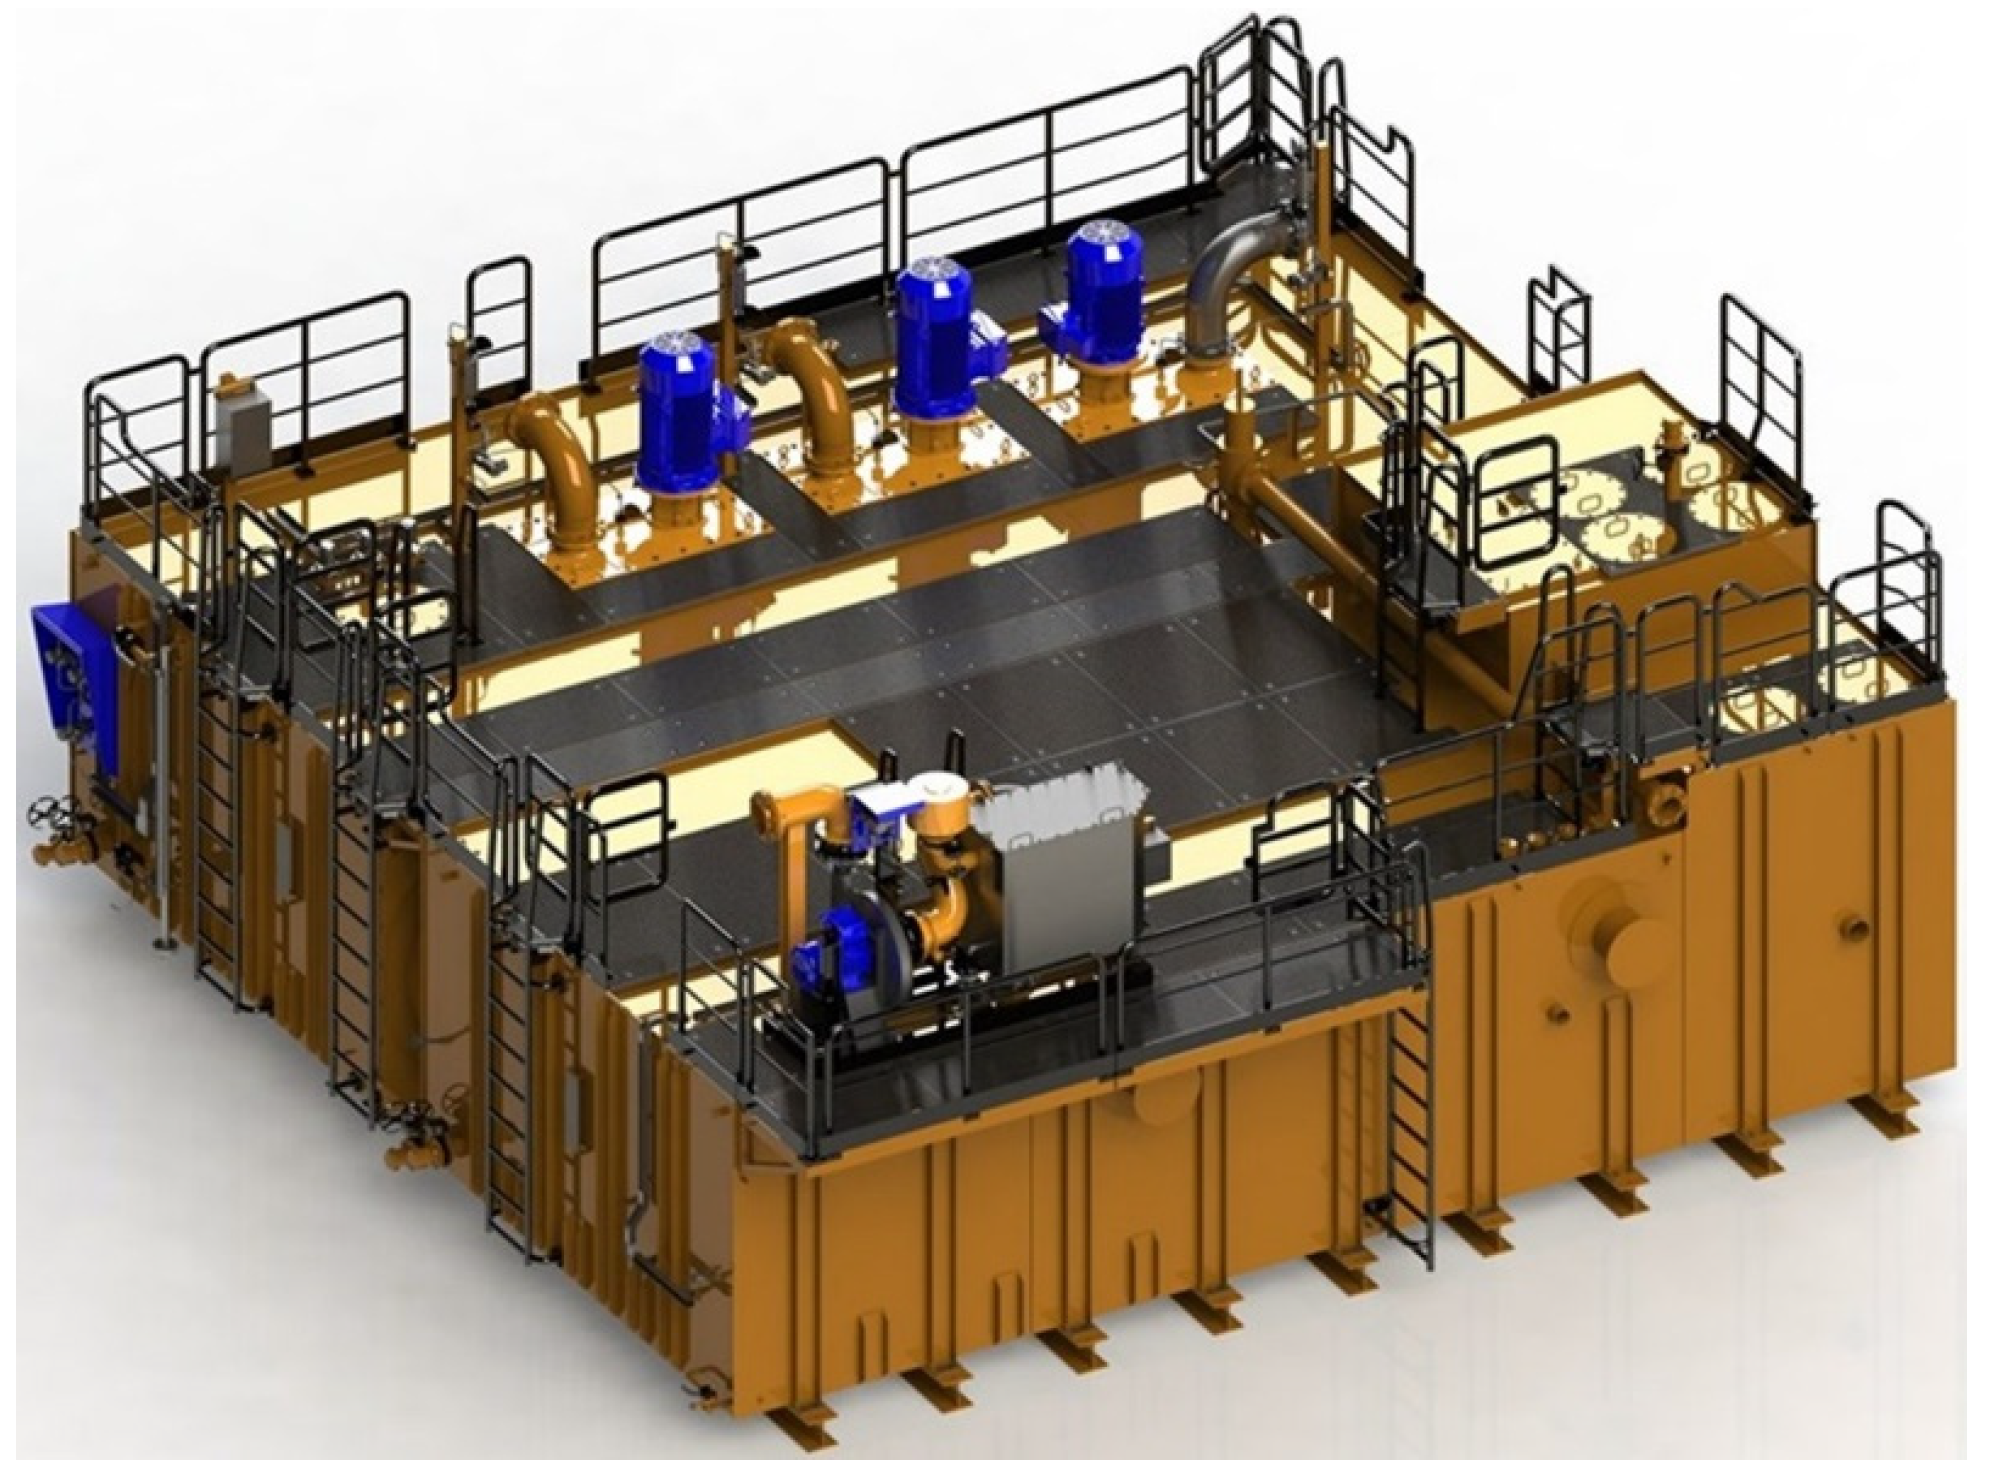
Oil lubrication systems supply oil to slide bearings located on the turbine set shaft. In order to ensure proper and trouble-free operation of the bearings, the oil should have an appropriate viscosity, temperature, purity, and air and water content and be supplied in an appropriate quantity. During the operation of the lubrication system, the oil in slide bearings forms an oil film, reducing the coefficient of friction. Oil additionally performs the function of heat dissipation by cooling the slide bearings. Slide bearings are equipped with seals through which air enters the bearing. During the operation of the bearing, air comes into contact with oil in the gap between the rotating shaft and the fixed surface of the bearing. This results in air being drawn into the oil, intensive mixing, and compression of the mixture. Then, the oil–air mixture flows out of the bearing, expanding rapidly to form a spray jet, which then goes through the return pipelines in the form of a heavily aerated and heavily agitated mixture and into the tank. Lubrication systems are often equipped with oil mist separators (OMSs), which perform several functions: they generate negative pressure in the tank, return pipeline, and bearings; precipitate oil from the oil mist; and blow air from the tank into the atmosphere. The resulting negative pressure in the slide bearings additionally prevents oil from leaking, but at the same time, increases the amount of air entering the bearing and then being entrained in the oil. Figure 1 shows an example of a lubrication system’s tank [3]. The lube oil tank presented in Figure 1 is equipped not only with a tank body, but also with elements such as pump units, a pressure control valve, an oil mist separator, return strainers, pressure transmitters, temperature transmitters, level transmitters, shut-off valves, manholes, ladders, and railings.
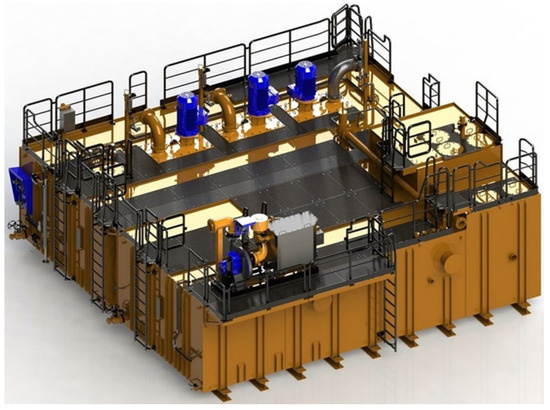
Figure 1.
An example of a lubrication system tank (total capacity of the tank: 149 m3) [3].
Figure 2 shows an example of a simplified diagram of a lubrication system. The diagram shows the following: a lube oil tank with pump units and a pressure control valve, a cooler skid, a filter skid, a turbine set shaft with turbine stages, bearings, a generator, and a gearbox with a main pump and starting motor. Air enters the hydraulic system through all slide bearings located on the turbine set shaft [3].

Figure 2.
An example diagram of a lubrication system [3].
The oil returning to the tank takes a long time to restore its properties to the optimal values. Thus, the retention time is long. It is possible to shorten this time by properly designing the tank and, in particular, the tank return chamber. In the next section, the methods of measuring the content of undissolved air in oil are shown.
2. Known Methods for Measuring Undissolved Air Content in Oil
In this section, an overview of the methods of measuring the undissolved air content in liquids is presented. Furthermore, the section includes an assessment of these methods in terms of the following criteria:
- -
- The method allows for the determination of the degree of filling for the mixture;
- -
- The method allows for the determination of the size and number of bubbles;
- -
- The method allows verification;
- -
- The method does not cause additional pressure drops;
- -
- The method should be simple;
- -
- The method should be repeatable.
The following methods of measuring air content in oil are the most frequently used:
- (1)
- Trapping methods;
- (2)
- Methods using two-phase flow resistance;
- (3)
- Methods using the Coriolis effect;
- (4)
- Electrical methods;
- (5)
- Optical methods;
- (6)
- Acoustic methods;
- (7)
- Radiation methods;
- (8)
- Fiber-optic methods.
2.1. Trapping Methods
Trapping methods include the classical method, the modified method, and those that use hydrostatic pressure loss.
2.1.1. Classic Trapping Method
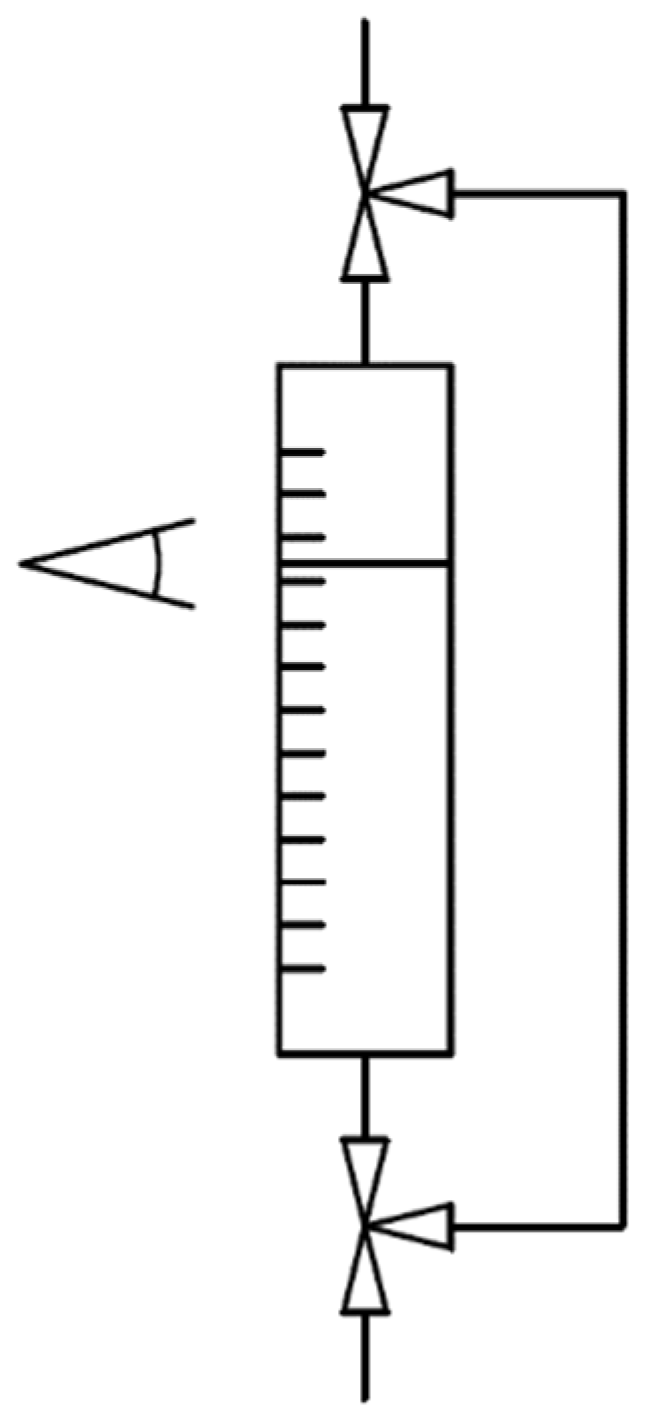
The classic trapping method relies on a visual assessment of the content of gas and liquid phases by means of locating the boundary between the phases. In order to perform the measurement, the flow of a two-phase mixture is passed through a transparent, marked test section. Then, using two three-way quick-acting valves, the marked test section is closed, and at the same time, the bypass allowing the mixture to flow is opened. In the closed and marked test section, the phases are separated. After a sufficient amount of time, a clear phase separation boundary appears. A diagram of the measurement system for the classic trapping method is shown in Figure 3 [4,5].
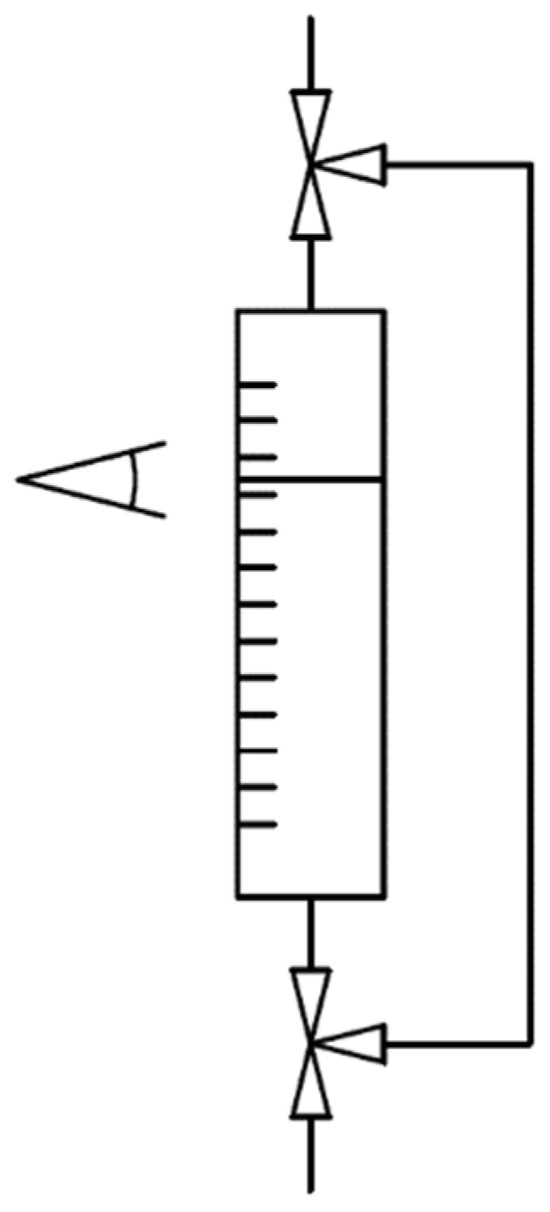
Figure 3.
Diagram of the measurement system for the classic trapping method [4,5].
The advantages of the classic trapping method are its simple operation and lack of pressure loss. However, the disadvantages of this method are the following:
- -
- The need to modify the system;
- -
- The lack of suitability for measurements of two-phase flows with a long time for phase separation;
- -
- The strength of the transparent test section;
- -
- The measurement of the filling degree is feasible only in steady states;
- -
- It is not possible to measure the filling degree in real time.
This method fulfills all of the criteria, and it should be taken into account when selecting the research method for air content in oil, especially when selecting the best research method.
2.1.2. Modified Trapping Method
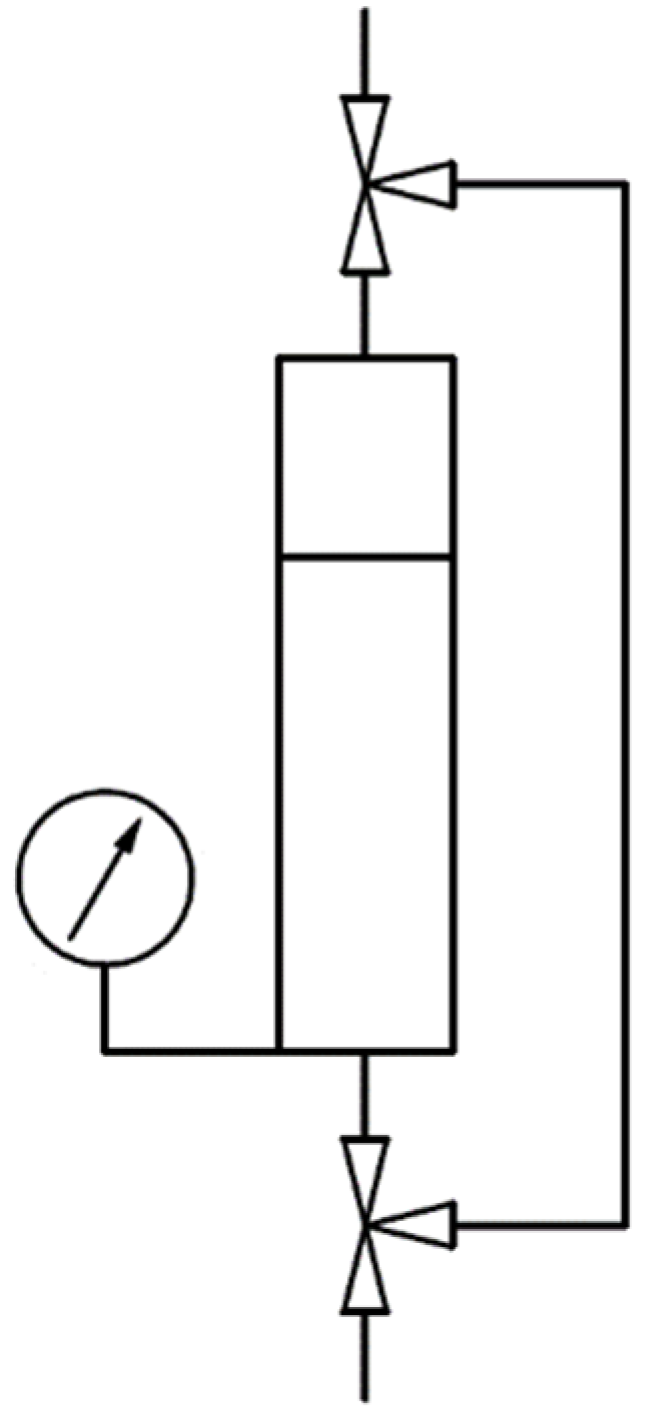
The modified trapping method involves assessing the content of the gas phase and liquid phase by reading the change in hydrostatic pressure. In order to perform a measurement, a two-phase mixture flow is passed through a test section. Then, using two three-way fast-acting valves, the test section is closed and, at the same time, the bypass allowing the mixture to flow is opened. Then, the test section should be vented, and the pressure shown by the pressure gauge may be converted into the degree of filling of the test section. By calibrating the pressure gauge and filling the test section only with the liquid phase, it is possible to read the degree of filling directly from the pressure gauge with a good approximation. A diagram of the measurement system for the classic trapping method is shown in Figure 4 [4].
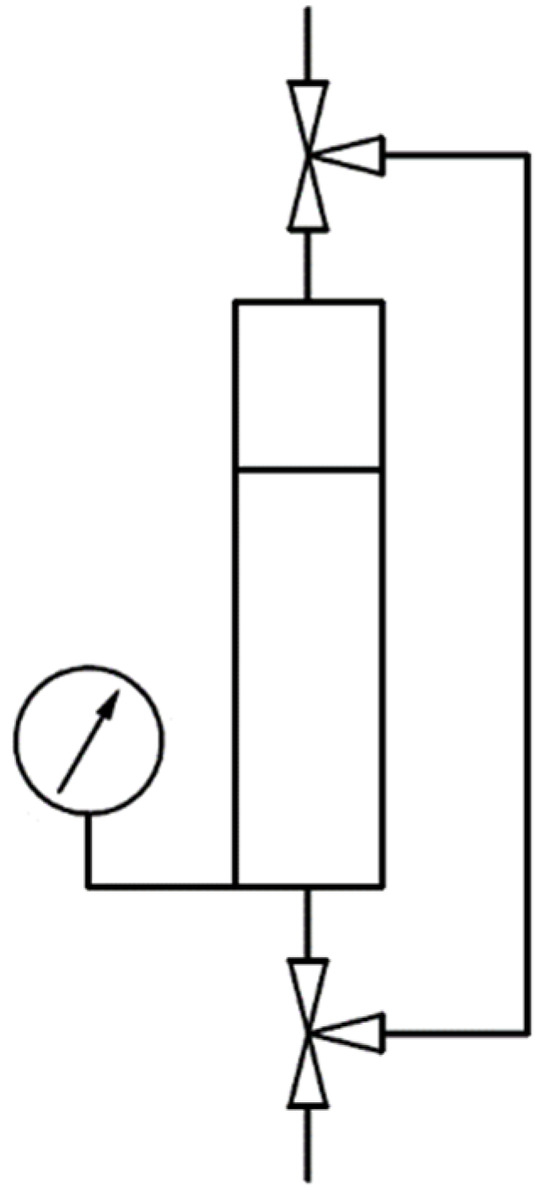
Figure 4.
Diagram of the measurement system for the modified trapping method [4].
The advantages of the modified trapping method are its simple operation, shorter measurement than that of the classic trapping method, and the lack of a need to use a transparent test section. However, the disadvantages of this method are the following:
- -
- It is not suitable for measuring the degree of filling of mixtures with a low boiling point;
- -
- The gas phase is partially released into the atmosphere, which precludes the determination of some parameters, such as the mass and degree of dryness of ‘x’ in the case of measuring water vapor parameters.
This method fulfills all of the criteria, and it should be taken into account when selecting a research method for the air content in oil, especially when selecting the best research method.
2.1.3. Trapping Method Using Hydrostatic Pressure Loss
The trapping method using hydrostatic pressure loss, otherwise known as the side-tube method, is based on the assumption that the only pressure losses during a two-phase flow in a vertical pipe are losses resulting from the gravitational resistance of the two-phase flow. Therefore, it is assumed that the total pressure loss during the flow of the two-phase mixture through the side-tube test section is hydrostatic pressure loss. The measured hydrostatic pressure is a function of the amounts of liquid and gas in the side tube, i.e., a function of the degree of filling ϕ. A diagram of the measurement system for the trapping method using hydrostatic pressure loss is shown in Figure 5 [4,6].
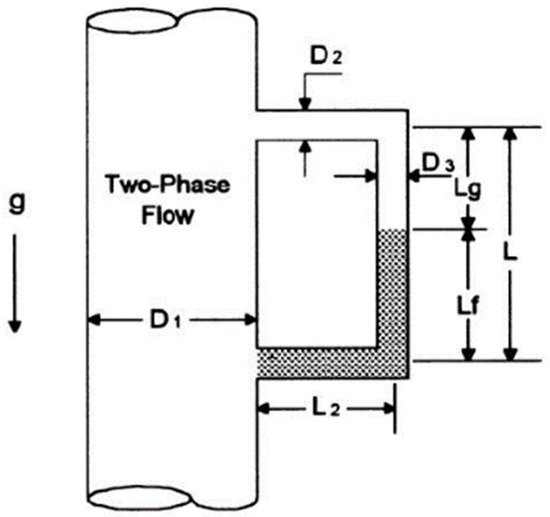
Figure 5.
Diagram of the measurement system for the trapping method using hydrostatic pressure loss [4,6].
The advantages of the trapping method using hydrostatic pressure loss are that it is easy to apply and allows real-time measurement. However, the disadvantages of this method are the following:
- -
- The flow should be directed vertically upward.
This method fulfills the majority of the criteria, and it should be taken into account when selecting a research method for the air content in oil, especially when selecting the best research method.
2.2. Methods Using Two-Phase Flow Resistance
Methods for determining air content in a liquid using two-phase flow resistance include methods based on:
- (1)
- Calculating the pressure loss as a result of frictional flow resistance;
- (2)
- The pressure loss with a rapid increase in diameter;
- (3)
- The pressure loss in the Venturi tube;
- (4)
- The pressure loss in the orifice.
2.2.1. Pressure Loss Due to Frictional Flow Resistance
The total resistance of a two-phase flow consists of the following three components [4,7]:
- (1)
- The friction component of the pressure drop: This is an important component of the total resistance of a two-phase flow. Multiple calculation models or experimental studies are used to determine the friction component of the pressure drop.
- (2)
- The acceleration component of the pressure drop: This is important during the phase change in the course of a flow, but in the absence of a phase change, it can be omitted.
- (3)
- The hydrostatic component of a pressure drop: This is important in vertical flows. It can be omitted in horizontal flows.
The advantage of this method is that it allows easy measurement of the amount of gas in a two-phase flow after proper preparation of the measurement apparatus. However, its disadvantages are the following:
- -
- It is not suitable for measurements in flows where small pressure drops are required;
- -
- It requires one to force a high flow rate;
- -
- It is not suitable for measurements at a low flow rate;
- -
- It requires many calculations or much research to obtain good results.
This method does not fulfill any of the criteria, and it should not be taken into account when selecting a research method for the air content in oil, especially when selecting the best research method.
2.2.2. Pressure Loss with a Rapid Increase in Diameter
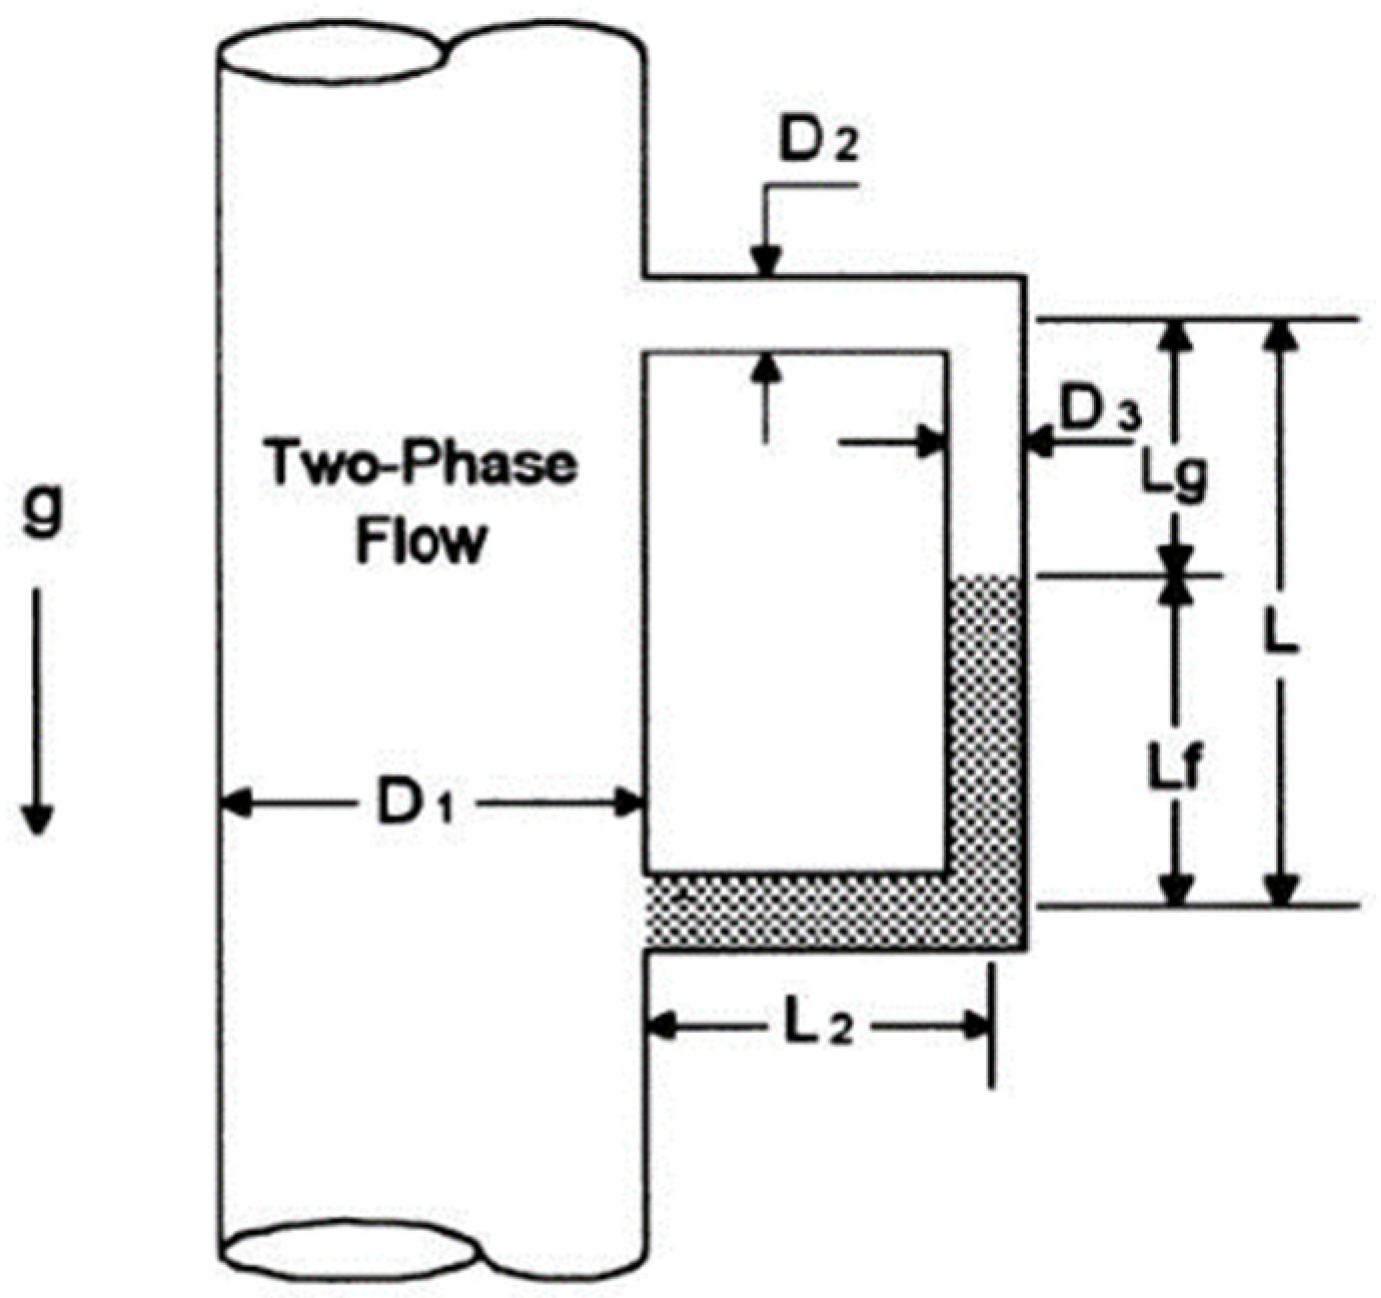
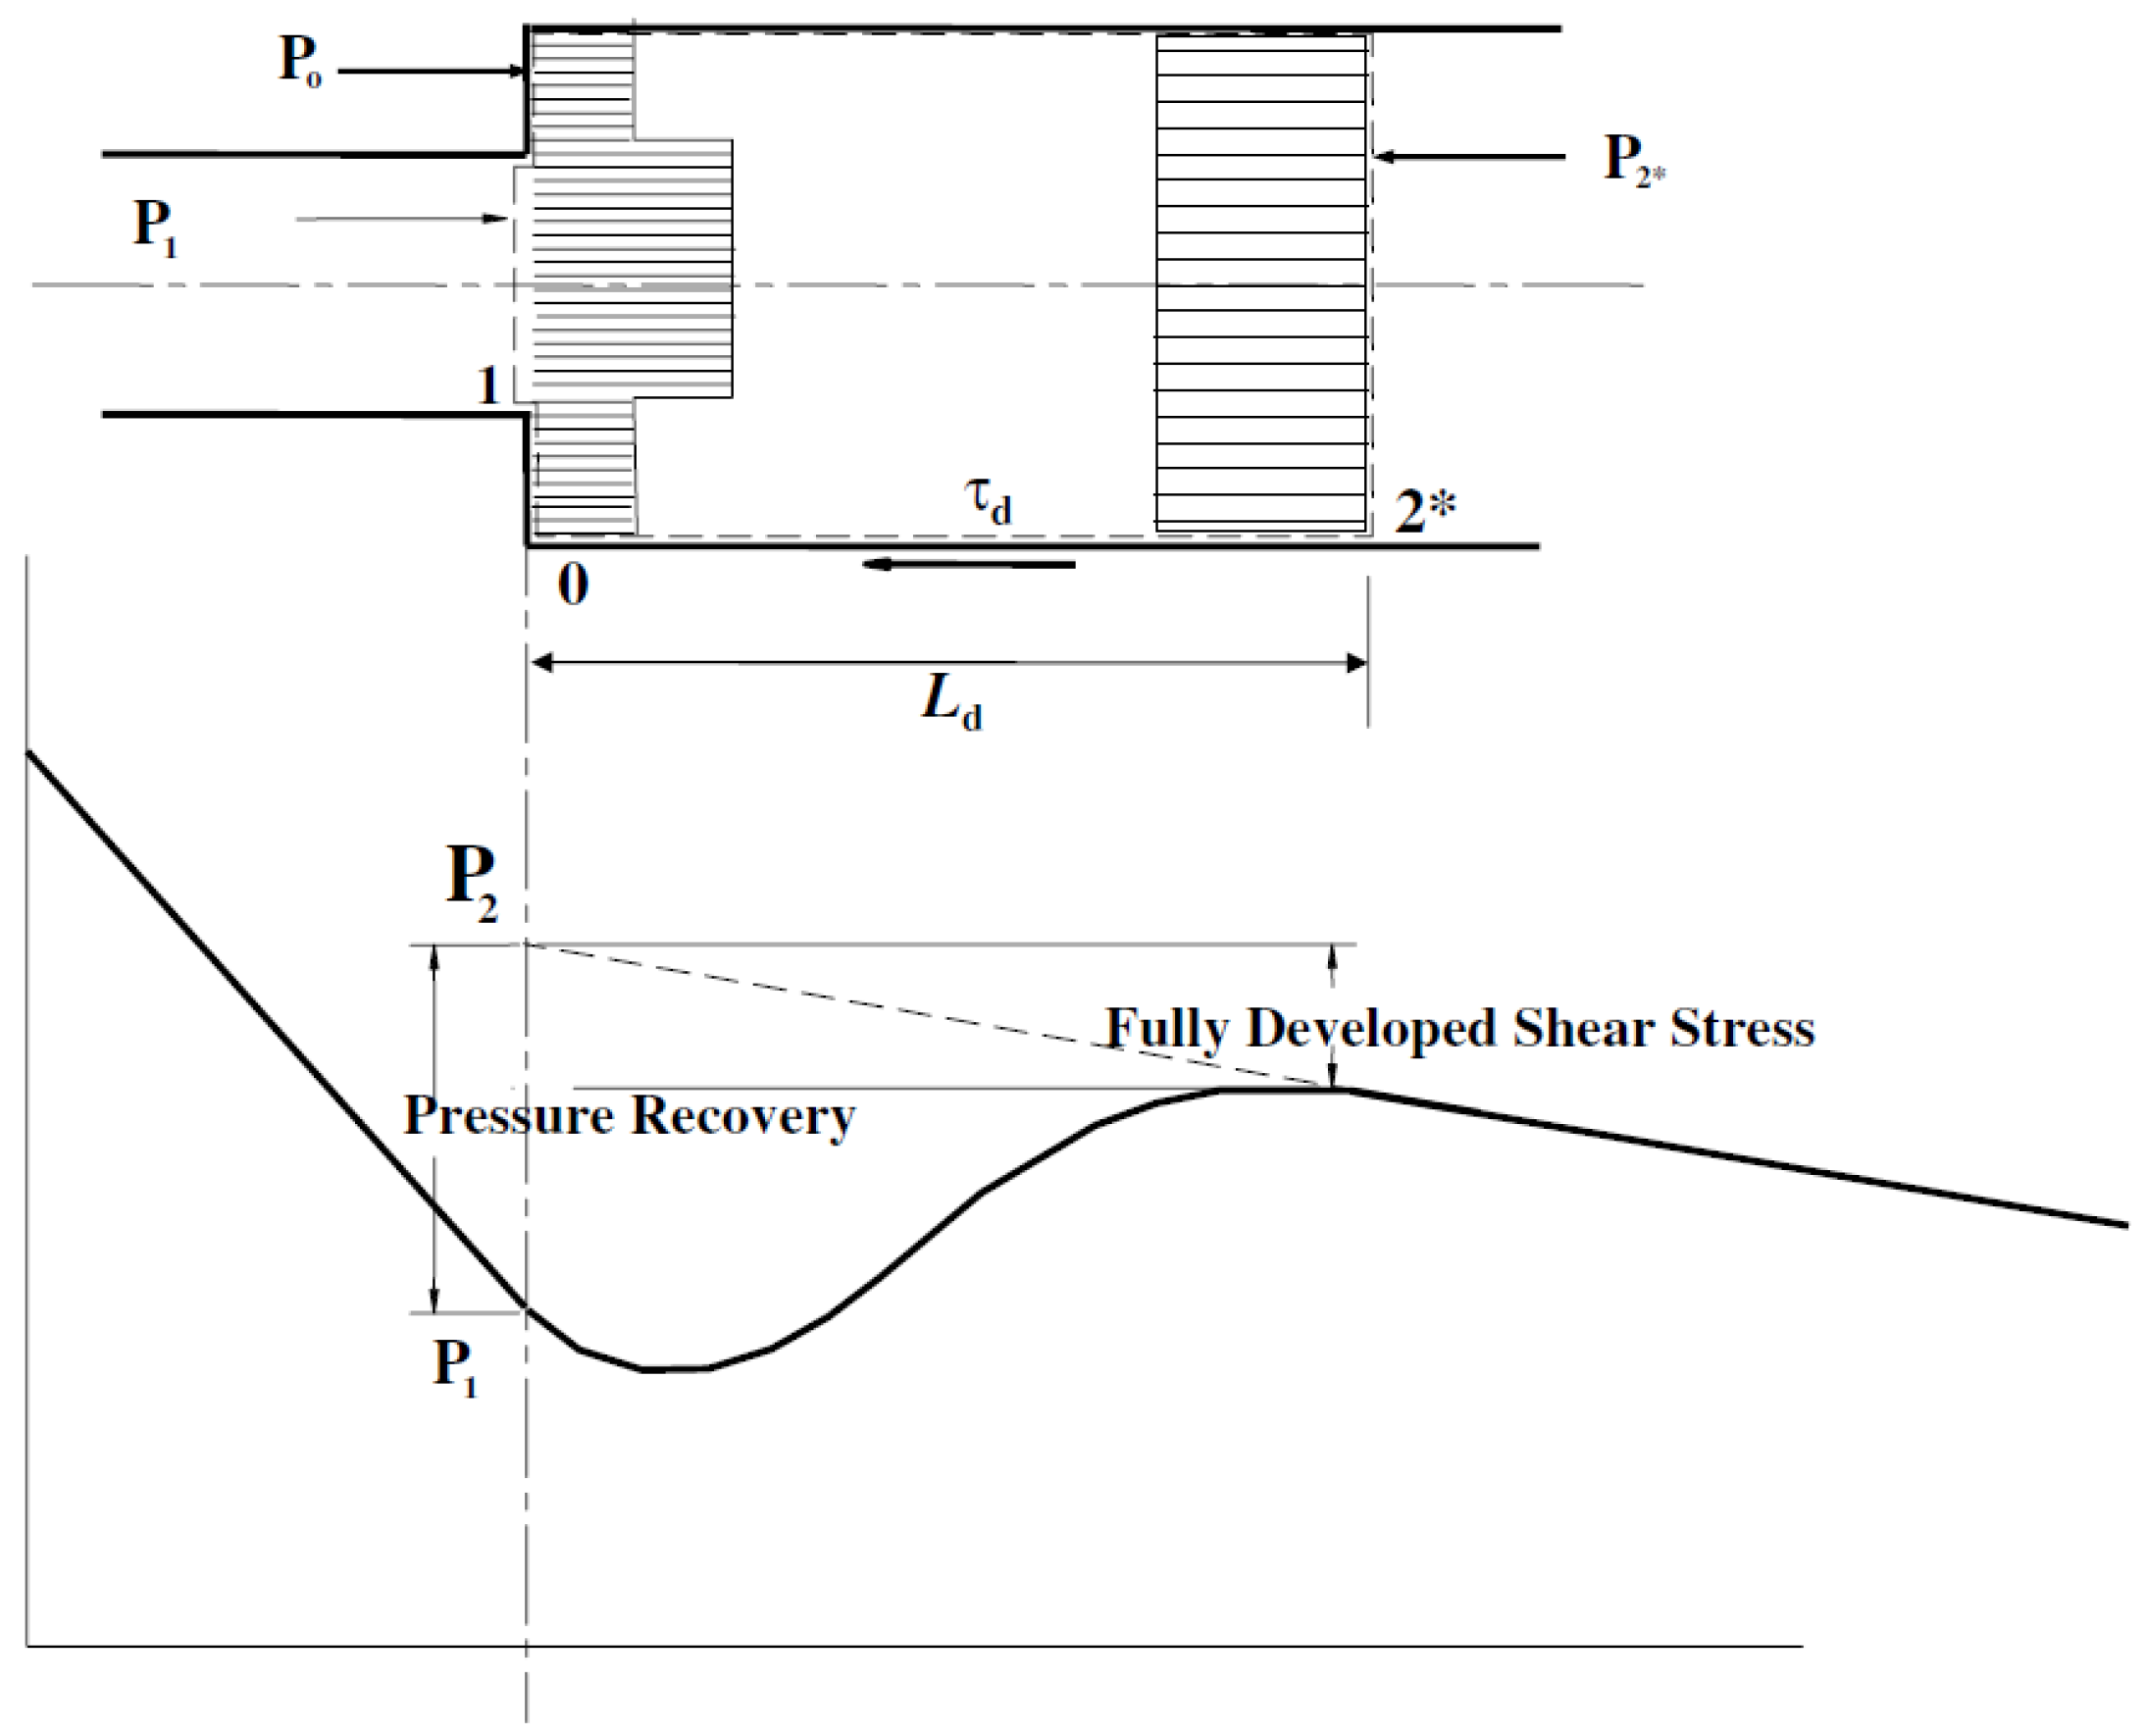
This method consists of measuring the pressure recovery in the cross-section of a segment with an enlarged diameter. In order to perform the measurement, a sufficiently high flow rate in the supply pipeline should be forced so that the pressure drop in the supply pipeline and in the outlet pipeline with a larger diameter can be measured. According to the Bernoulli equation, due to a reduction in the two-phase flow rate, the pressure changes, which depends, among other things, on the degree of filling of the two-phase mixture (see Figure 6) [4,8].
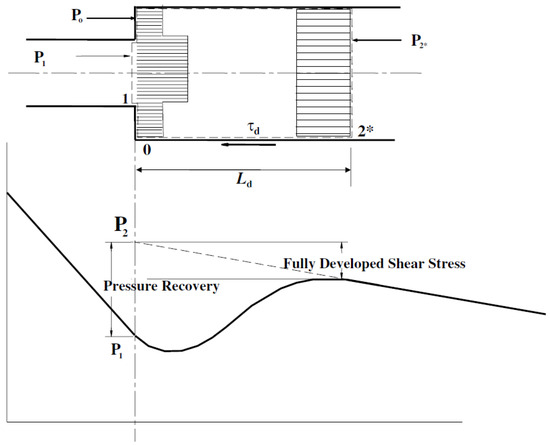
Figure 6.
Diagram of the pressure change during a rapid increase in diameter [4,8]. * A section where the flow is fully developed.
The advantage of this method is that it allows easy measurement of the amount of gas in a two-phase flow after proper preparation of the measurement apparatus. The disadvantages of this method are the following:
- -
- It is not suitable for measurements in flows where small pressure drops are required;
- -
- It requires a high flow rate to be forced;
- -
- It is not suitable for measurements at a low flow rate;
- -
- It requires prior analytical calculations to be conducted.
This method does not fulfill any of the criteria, and it should not be taken into account when selecting a research method for the air content in oil, especially when selecting the best research method.
2.2.3. The Pressure Drop in a Venturi Tube
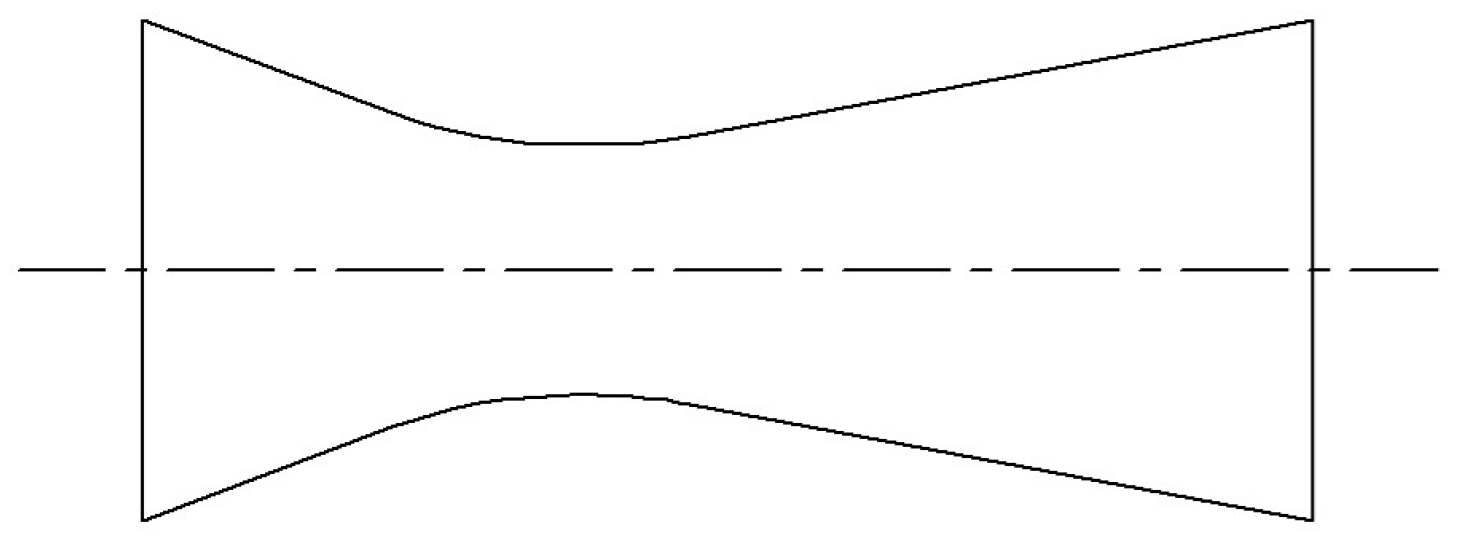
This method consists of measuring the pressure drop in a Venturi tube. In order to measure a pressure drop, the flow of a two-phase liquid through the Venturi tube should be forced, and experimental measurements should be carried out to determine the characteristics of the pressure drop for mixtures with different filling degrees (see Figure 7) [4,9].
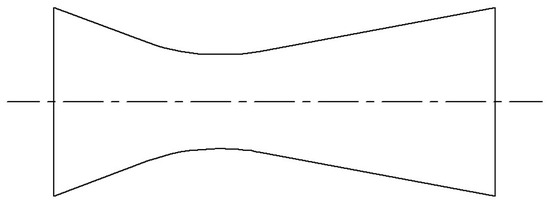
Figure 7.
Venturi tube [4,9].
The advantage of this method is that it allows easy measurement of the amount of gas in a two-phase flow after proper preparation of the measurement apparatus. The disadvantages of this method are the following:
- -
- It is not suitable for measurements in flows where small pressure drops are required;
- -
- It is not suitable for measurements at a low flow rate;
- -
- It requires prior analytical calculations to be conducted.
This method does not fulfill any criteria, and it should not be taken into account when selecting a research method for the air content in oil, especially when selecting the best research method.
2.2.4. Pressure Drop in an Orifice
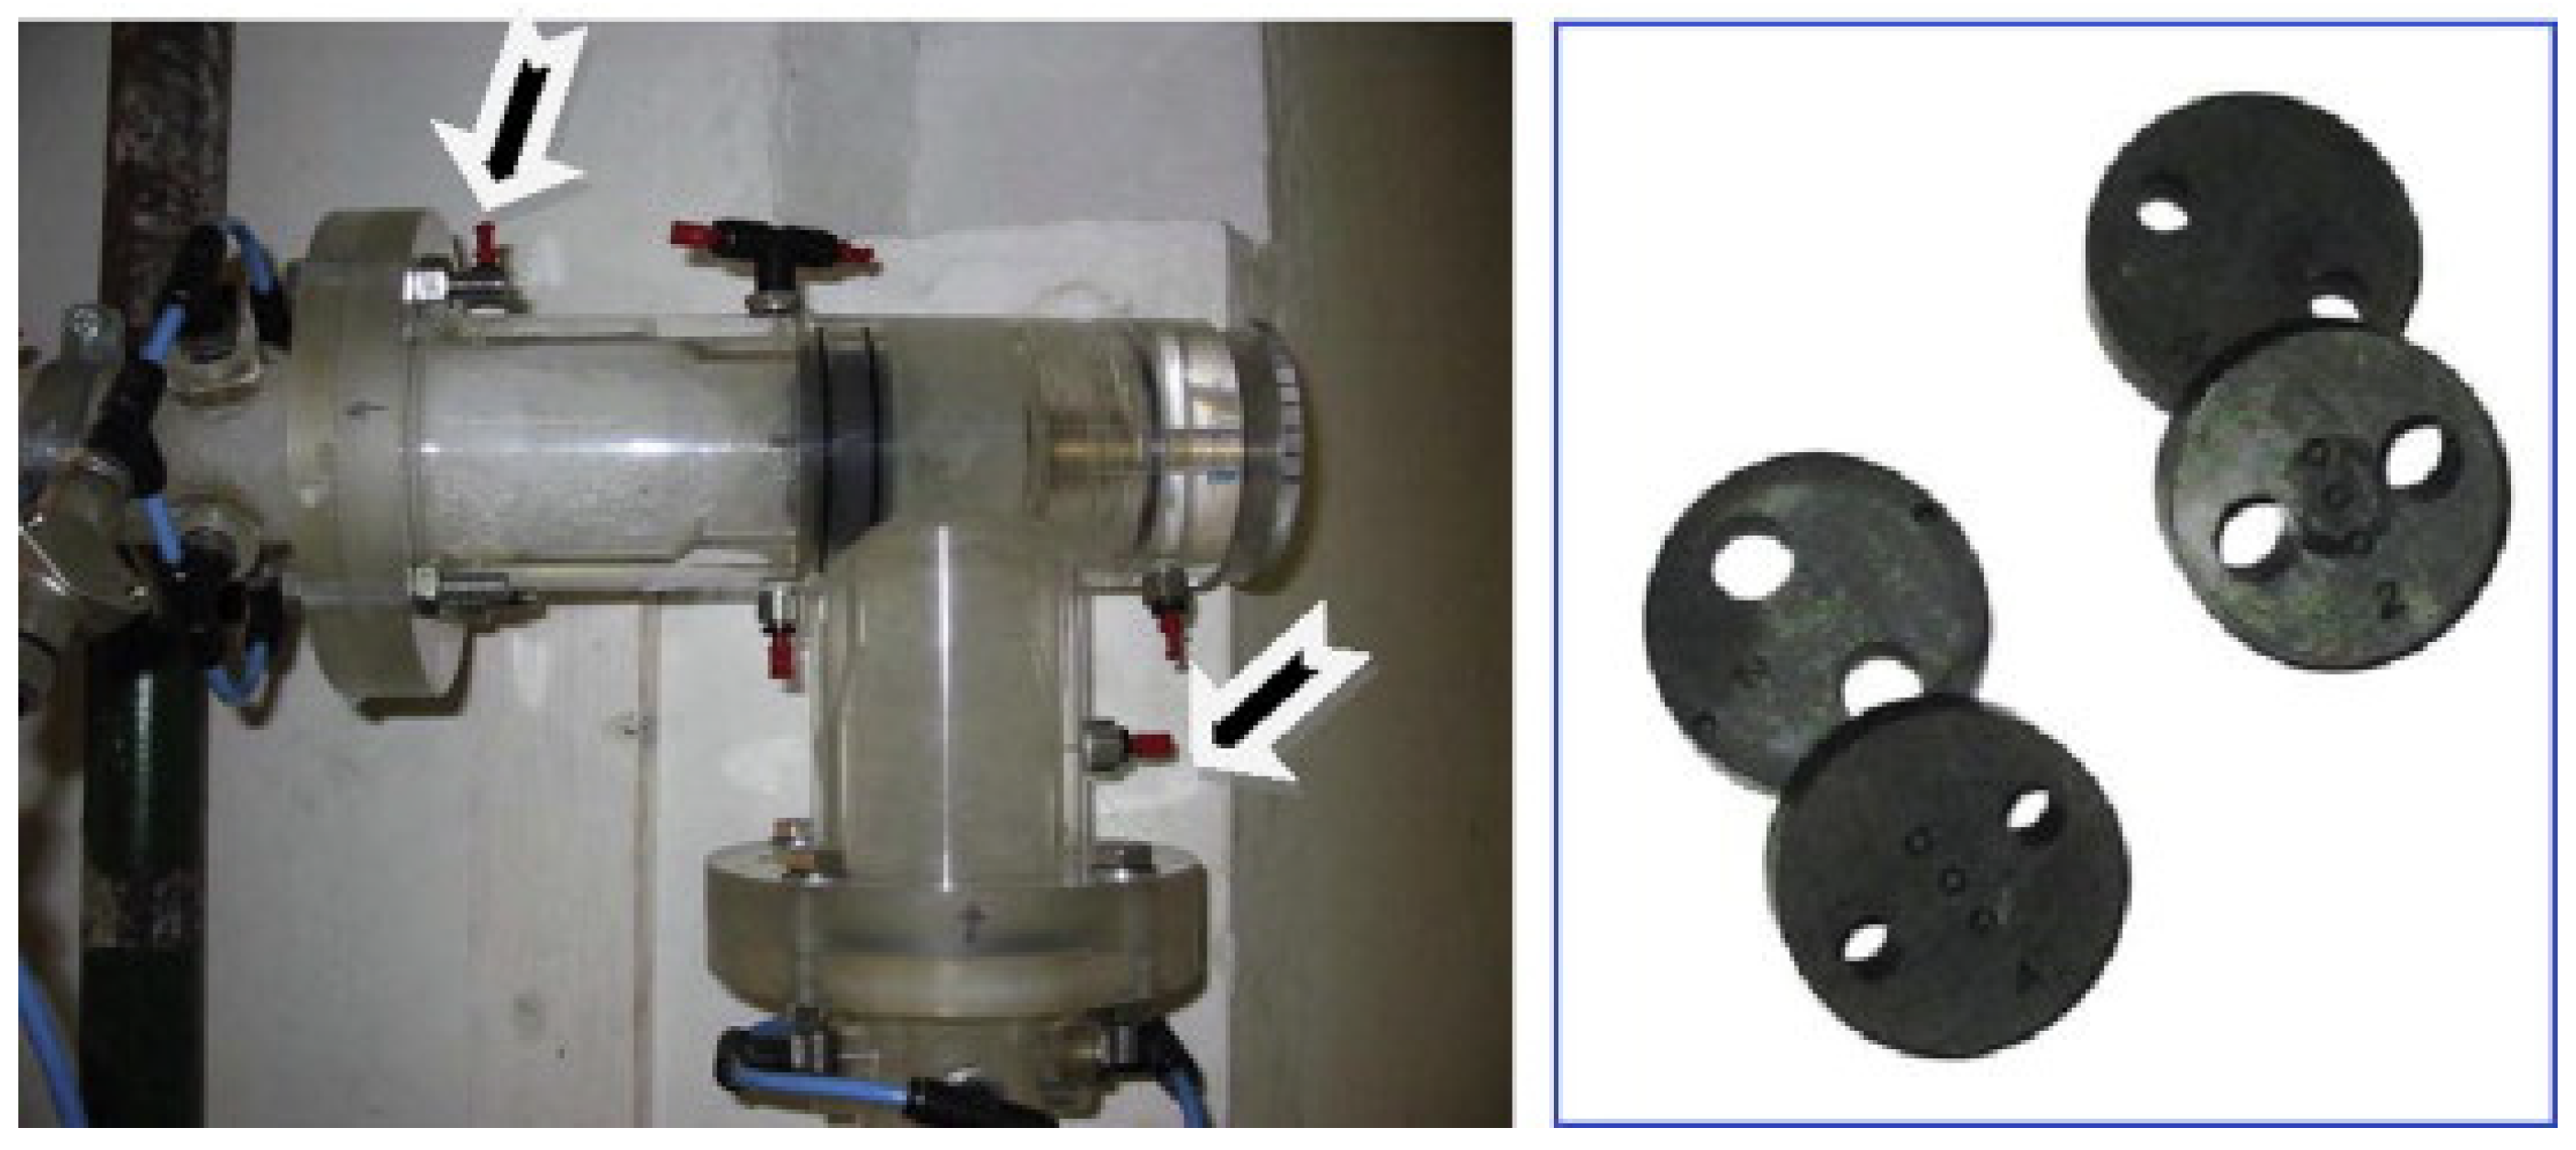
This method, which is similar to the method of measuring pressure drops in a Venturi tube, consists of measuring the pressure drop in an orifice. In order to measure the degree of filling of a two-phase mixture, the pressure drop and the flow rate should be measured. On the basis of the parameters measured and using the determined appropriate correction factors, it is possible to determine the degree of filling of the mixture (correction factors are determined experimentally for the needs of the mathematical model). Figure 8 shows examples of orifices [4,10].
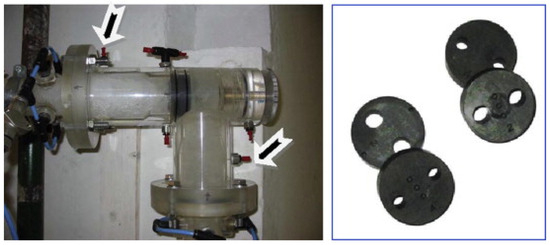
Figure 8.
Examples of orifices used when measuring the degree of filling by means of a pressure drop in an orifice [4,10].
The advantage of this method is that it allows easy measurement of the amount of gas in a two-phase flow after proper preparation of the measurement apparatus. The disadvantages of this method are the following:
- -
- It is not suitable for measurements in flows where small pressure drops are required;
- -
- It is not suitable for measurements at a low flow rate;
- -
- It requires prior analytical calculations to be conducted.
This method does not fulfill any of the criteria, and it should not be taken into account when selecting a research method for the air content in oil, especially when selecting the best research method.
2.3. The Method That Uses the Coriolis Effect
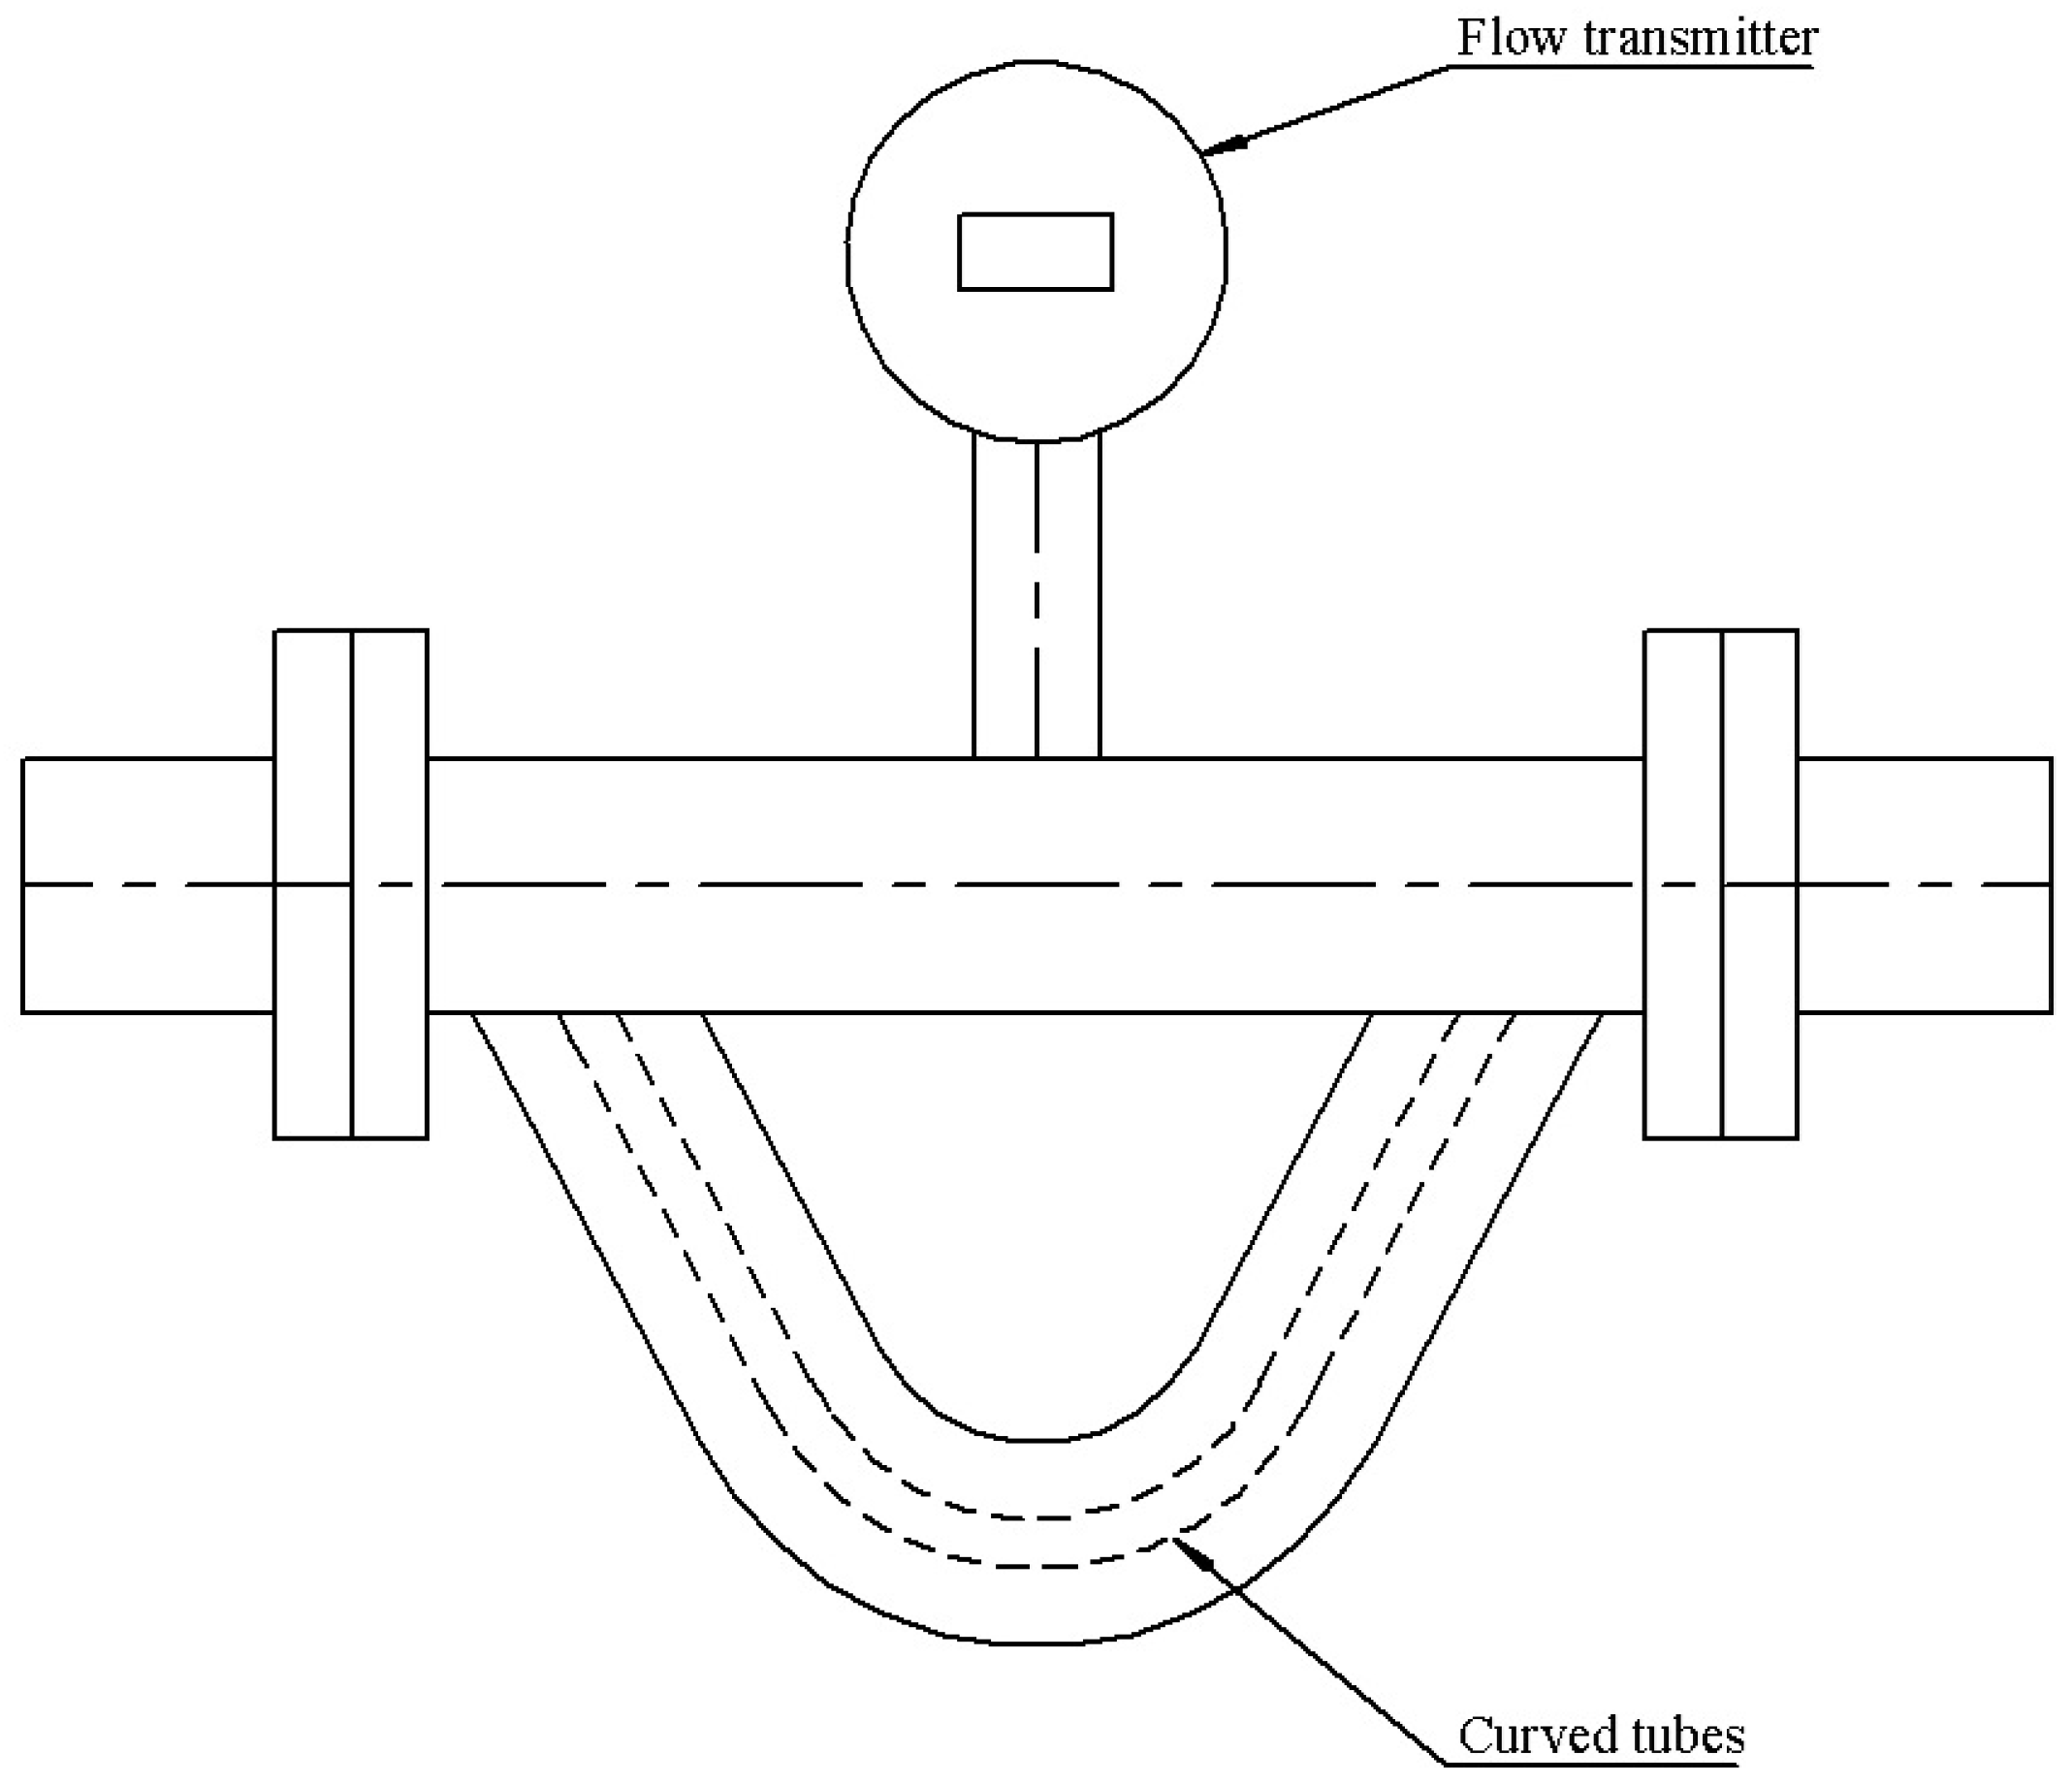
The method of measuring the gas content in a liquid using the Coriolis effect consists of measuring the frequency of oscillatory vibrations recorded by two pairs of sensors placed at some distance from each other on two bent measuring tubes. The flowing mixture is subjected to oscillatory vibrations of different frequencies in both measuring tubes. The recorded vibration frequencies allow for an accurate calculation of the density and degree of filling of the two-phase mixture. Figure 9 shows the PromassQ flowmeter using the Coriolis phenomenon to measure two-phase flow [4,11].
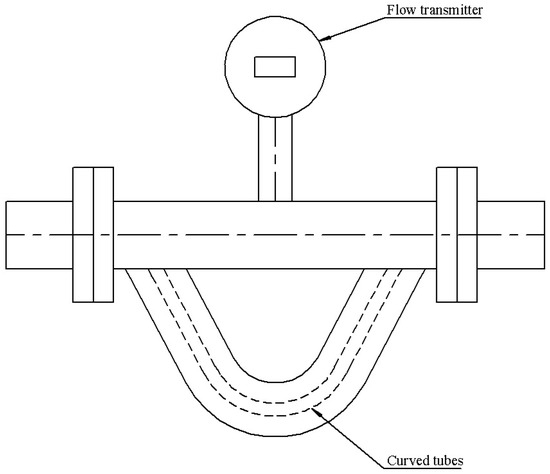
Figure 9.
The PromassQ flowmeter is dedicated to measuring the flow of two-phase fluids [4,11].
The advantage of this method is that it allows easy measurement of the mass flow rate and density of a liquid. The disadvantages of this method are the following:
- -
- It is not suitable for measurements in flows where small pressure drops are required;
- -
- It is not suitable for measurements at a low flow rate;
- -
- It does not allow for the measurement of the size of air bubbles.
This method does not fulfill any of the criteria, and it should not be taken into account when selecting a research method for the air content in oil, especially when selecting the best research method.
2.4. Electric Methods
Electric methods are used to determine air content in liquids. These methods include the following:
- (1)
- Electrical resistance method;
- (2)
- Electrical conductivity method;
- (3)
- Electromagnetic method;
- (4)
- Electrical capacitance method;
- (5)
- Thermal anemometry method;
- (6)
- Liquid–solid contact electrification method.
2.4.1. Electrical Resistance Method
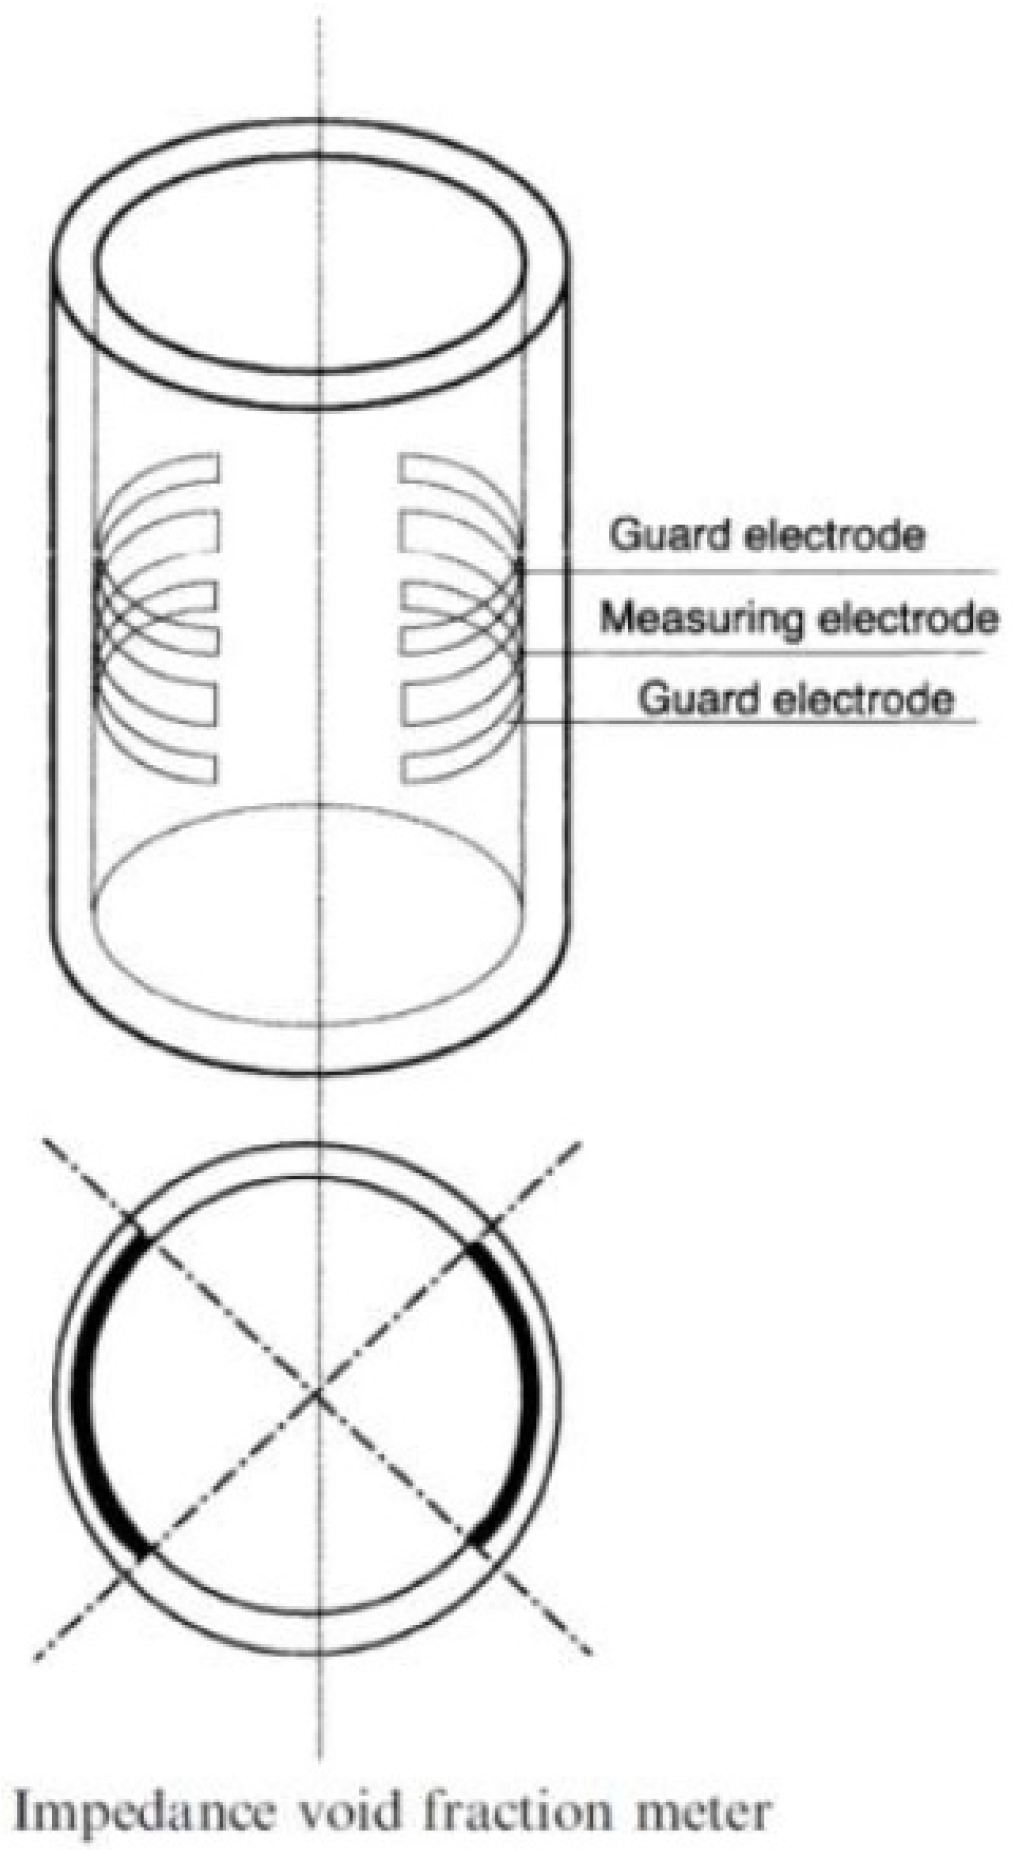
The electrical resistance method involves measuring the magnitude of electrical resistance that occurs when current flows through a two-phase mixture. This method uses the difference in electrical resistance between each phase. Many kinds of measurement probes are available, allowing for local or average measurements. Figure 10 shows an example of a method of measuring the electrical resistance in a measurement pipeline [4,12].
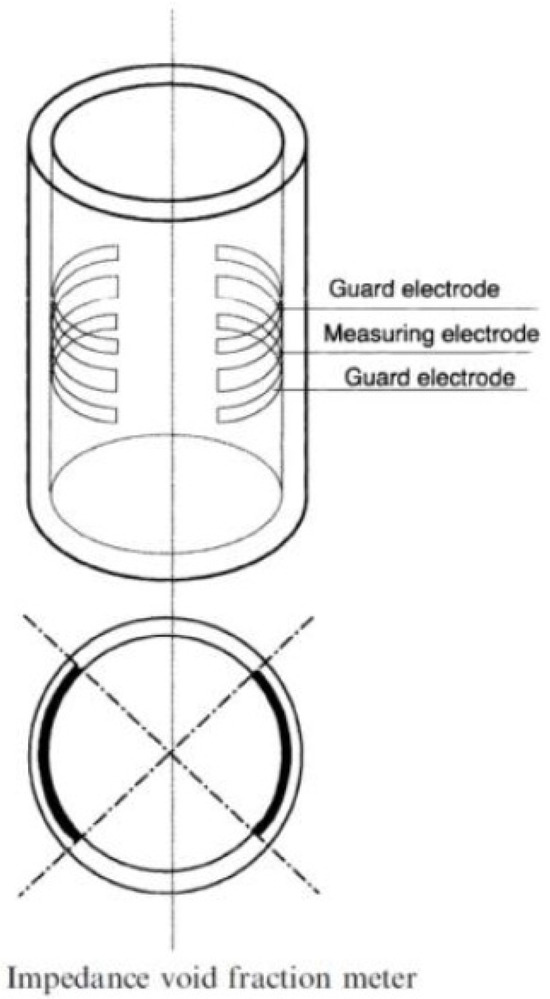
Figure 10.
An example of a method of measuring electrical resistance in a measurement pipeline [4,12].
The advantage of this method is its ability to measure the degree of filling in real time with high accuracy. The disadvantages of this method are the following:
- -
- The construction and calibration of the electronic system;
- -
- It is not suitable for liquids with high electrical resistance, such as oils;
- -
- It does not allow for the measurement of the size of air bubbles.
This method does not fulfill any of the criteria, and it should not be taken into account when selecting a research method for the air content in oil, especially when selecting the best research method.
2.4.2. Electrical Conductivity Method
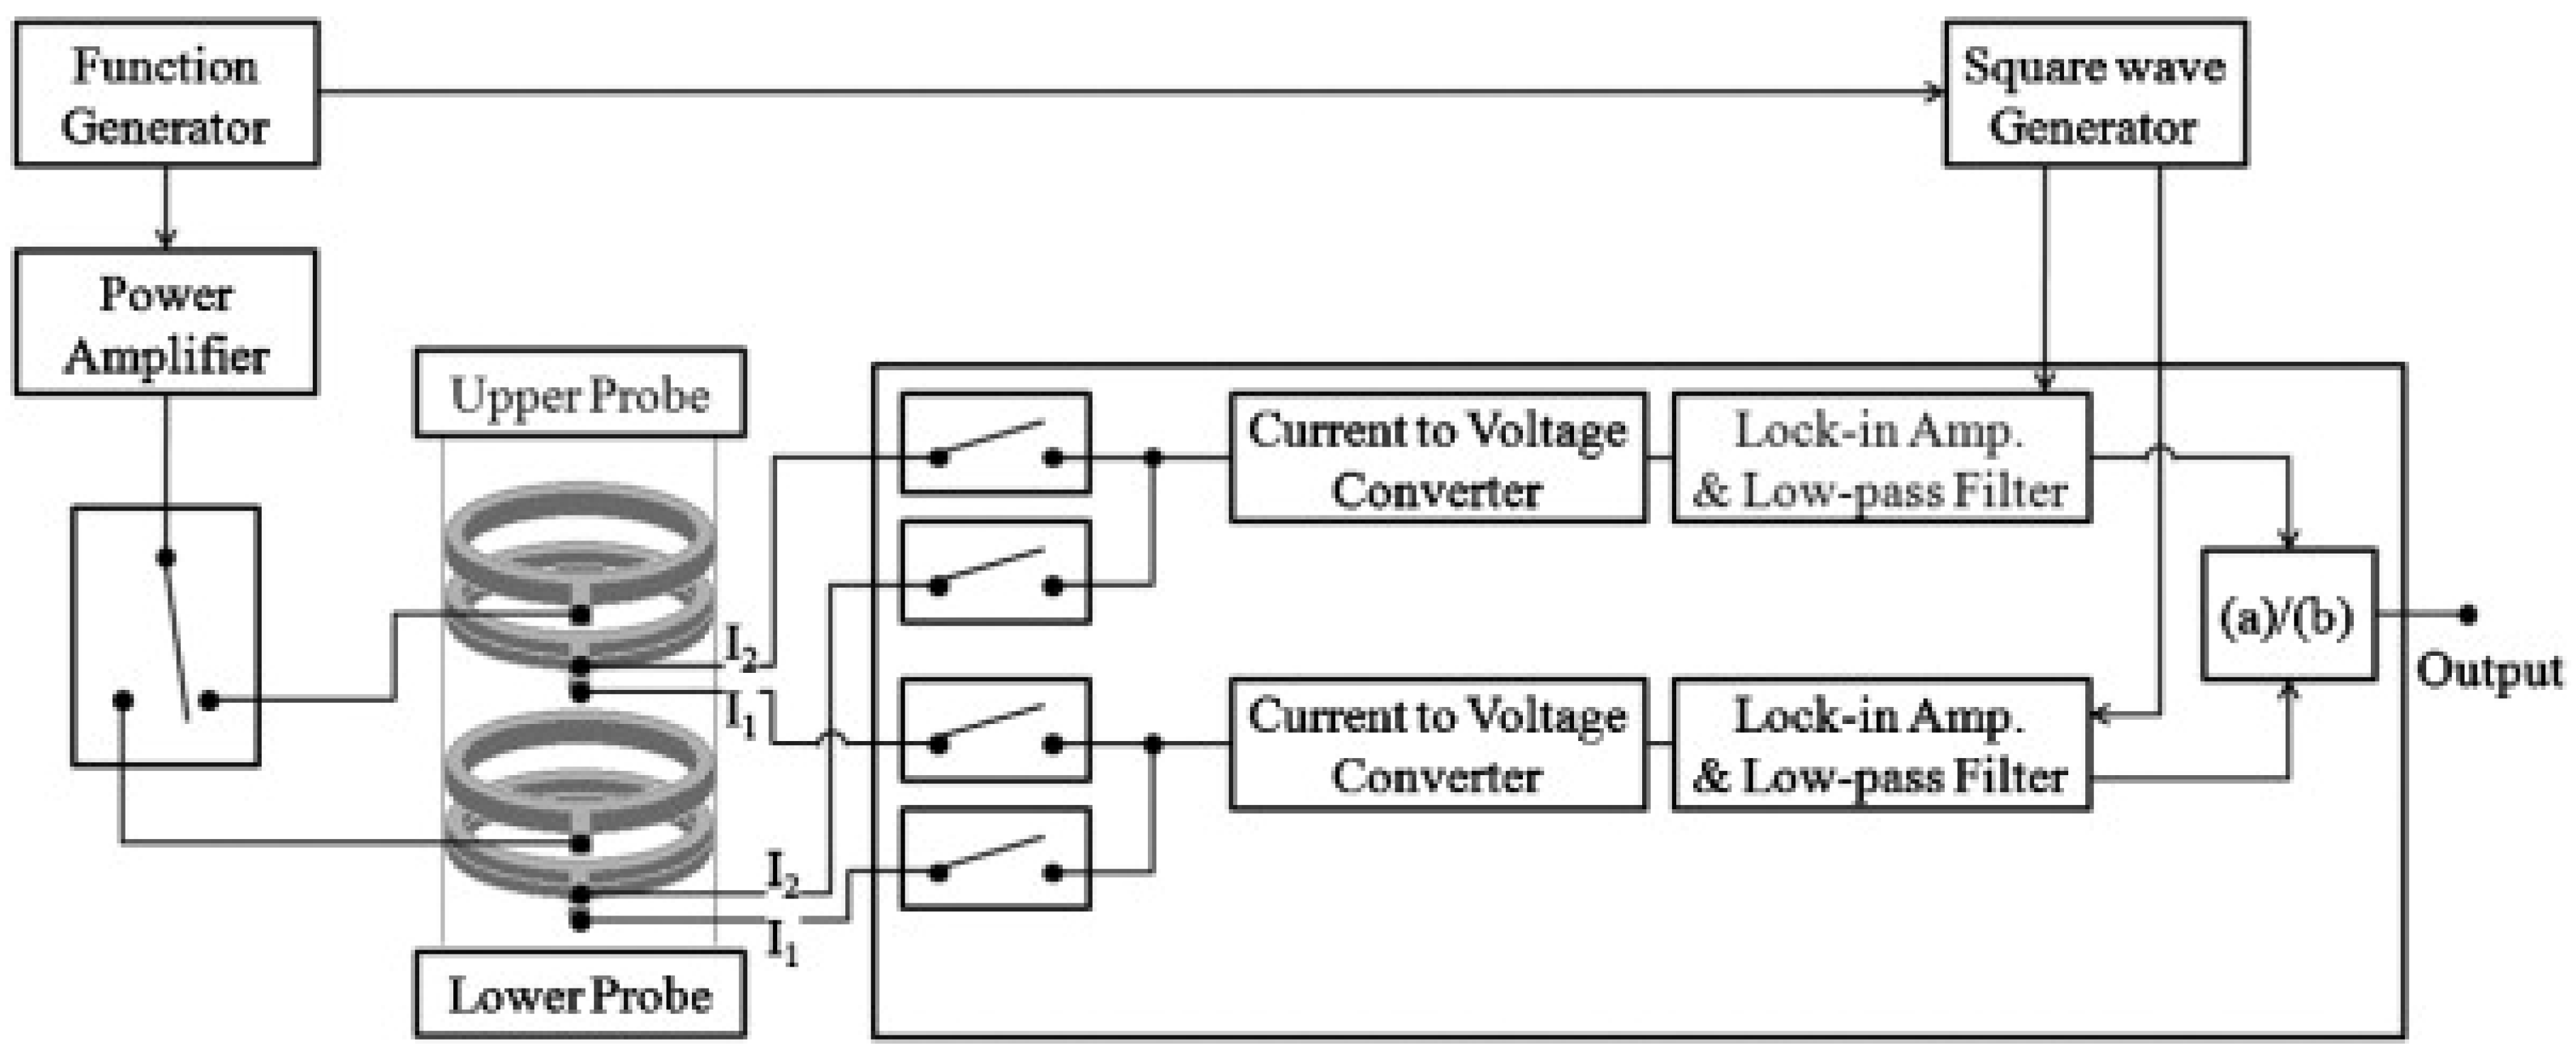
The electrical conductivity method involves measuring the electrical conductivity (the inverse of electrical resistance) that occurs as current flows through a two-phase mixture. Similar to the electrical resistance method, this method exploits the difference in electrical conductivity between each phase. Figure 11 shows an example of a method of measuring electrical conductivity in a measurement pipeline [4,13].
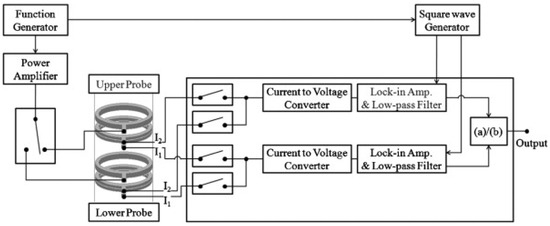
Figure 11.
An example of a method of measuring electrical conductivity in a measurement pipeline [4,13].
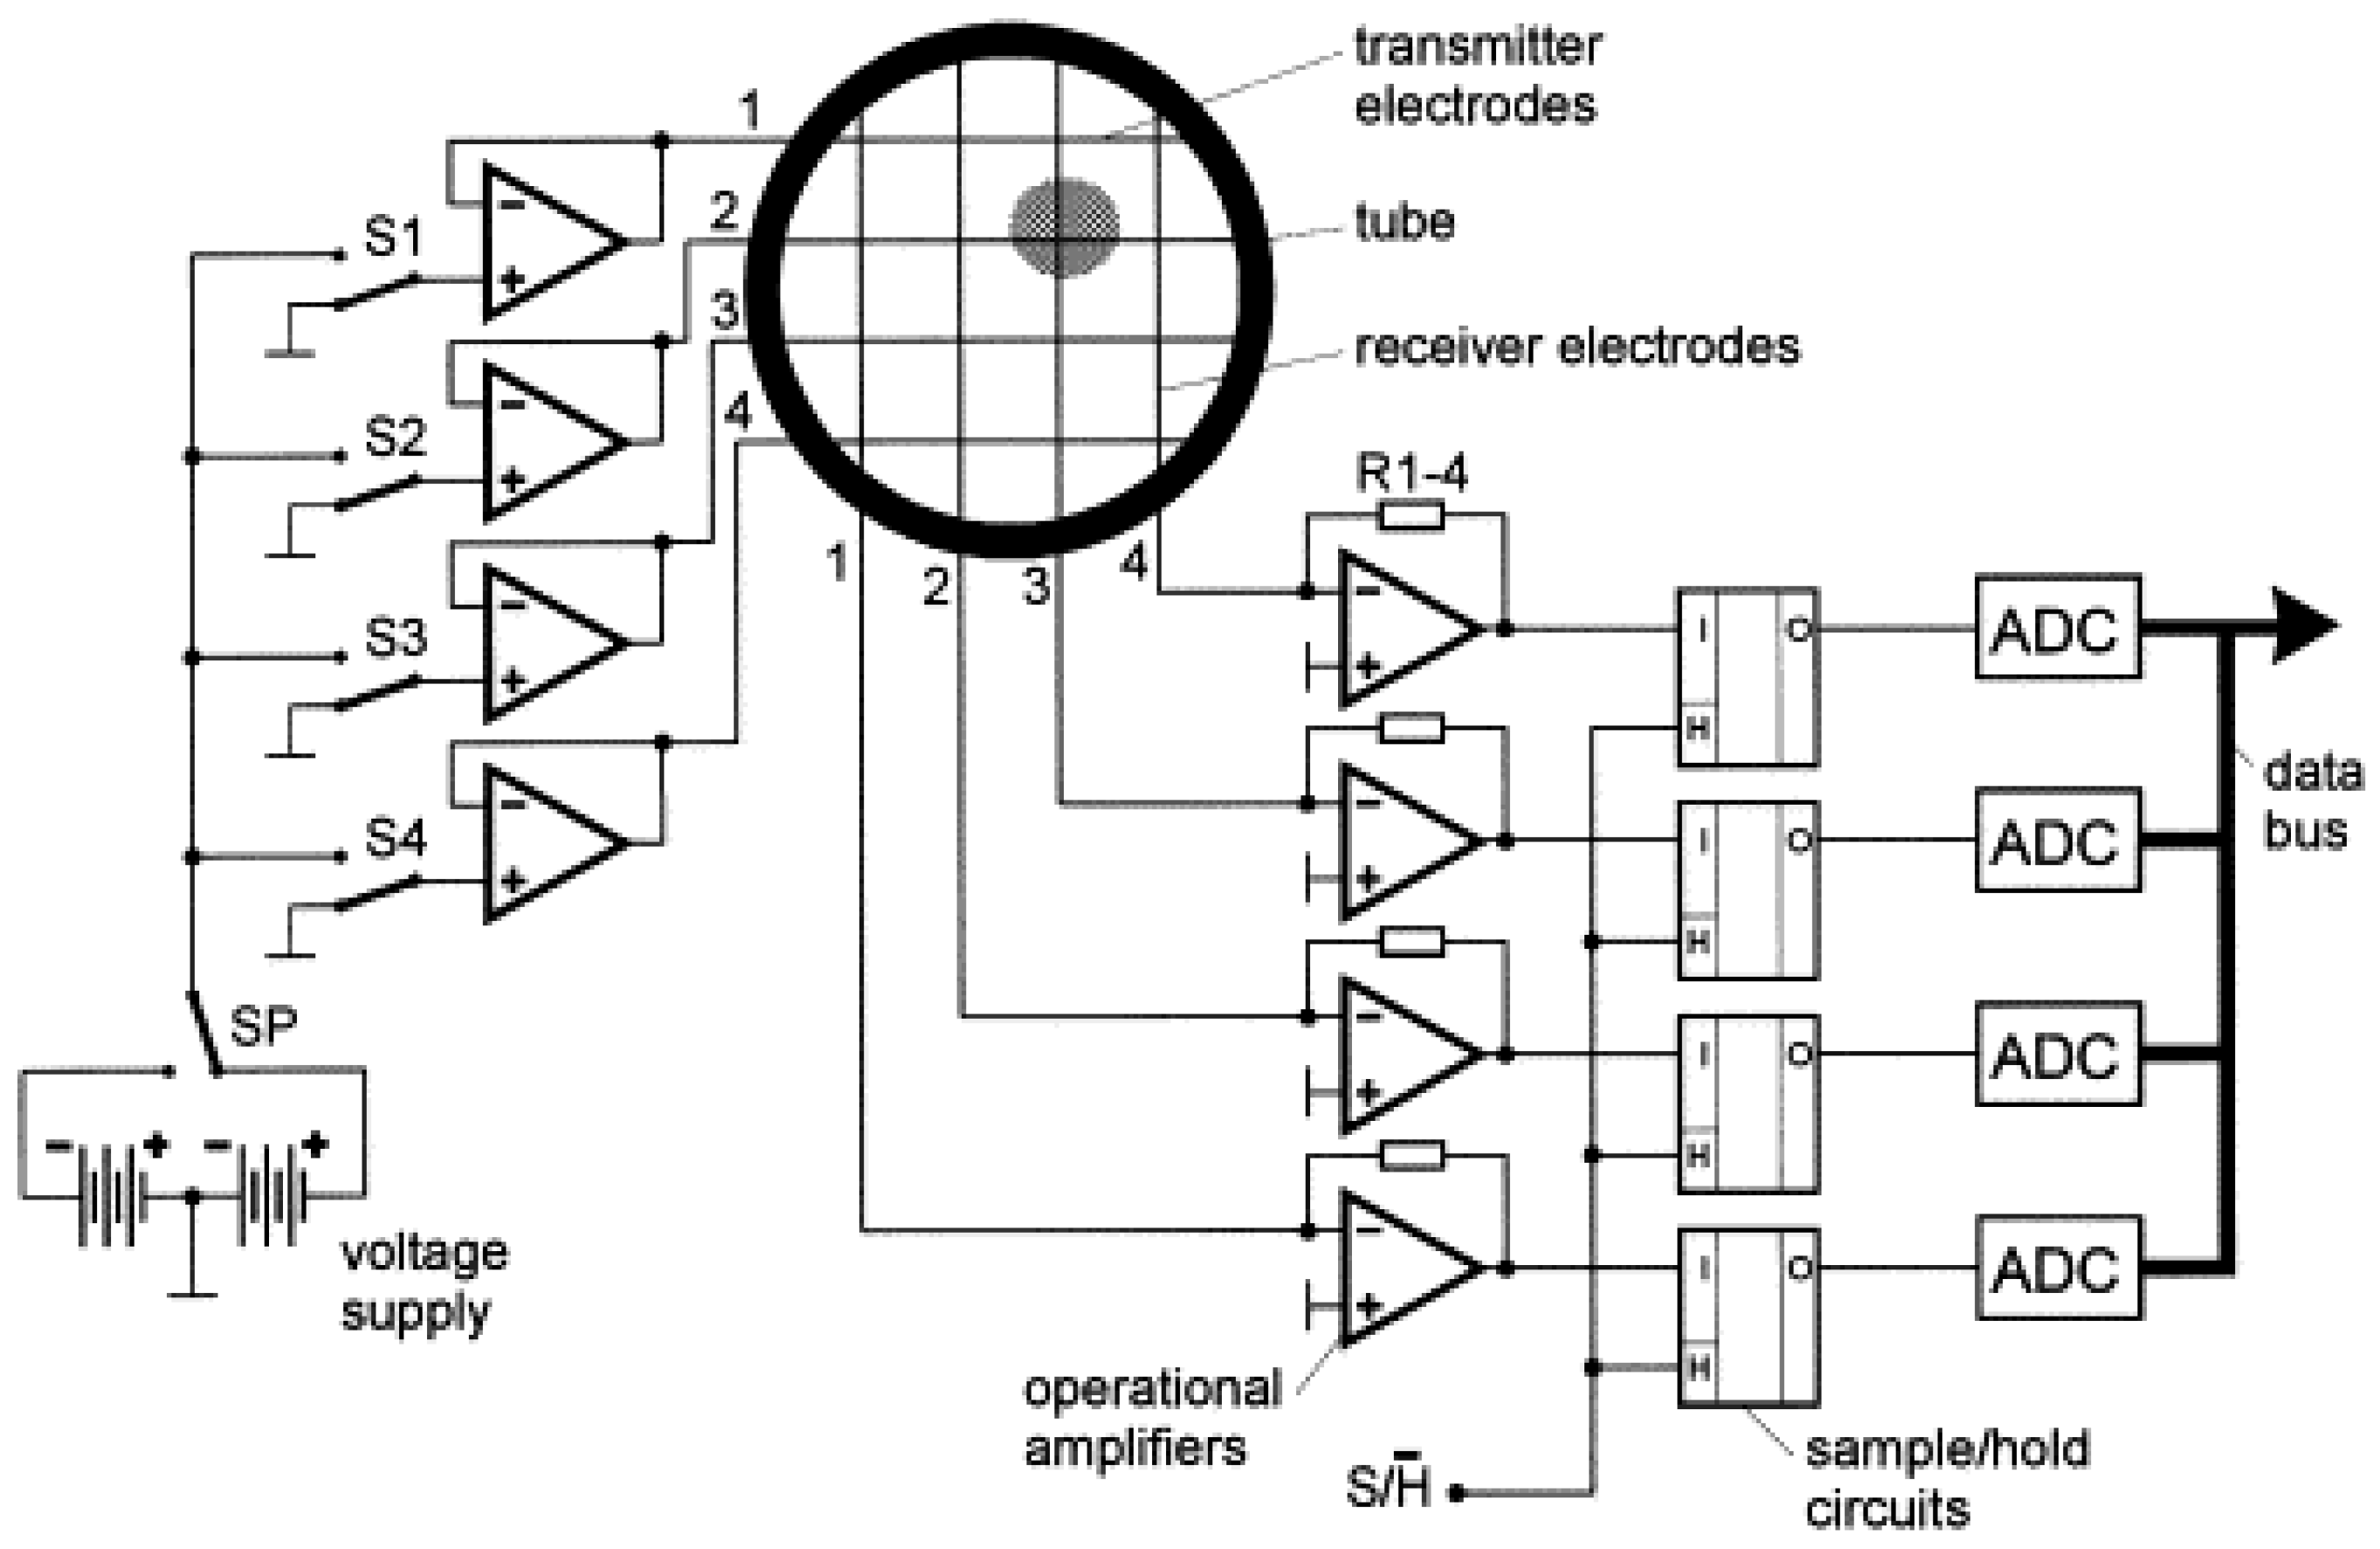
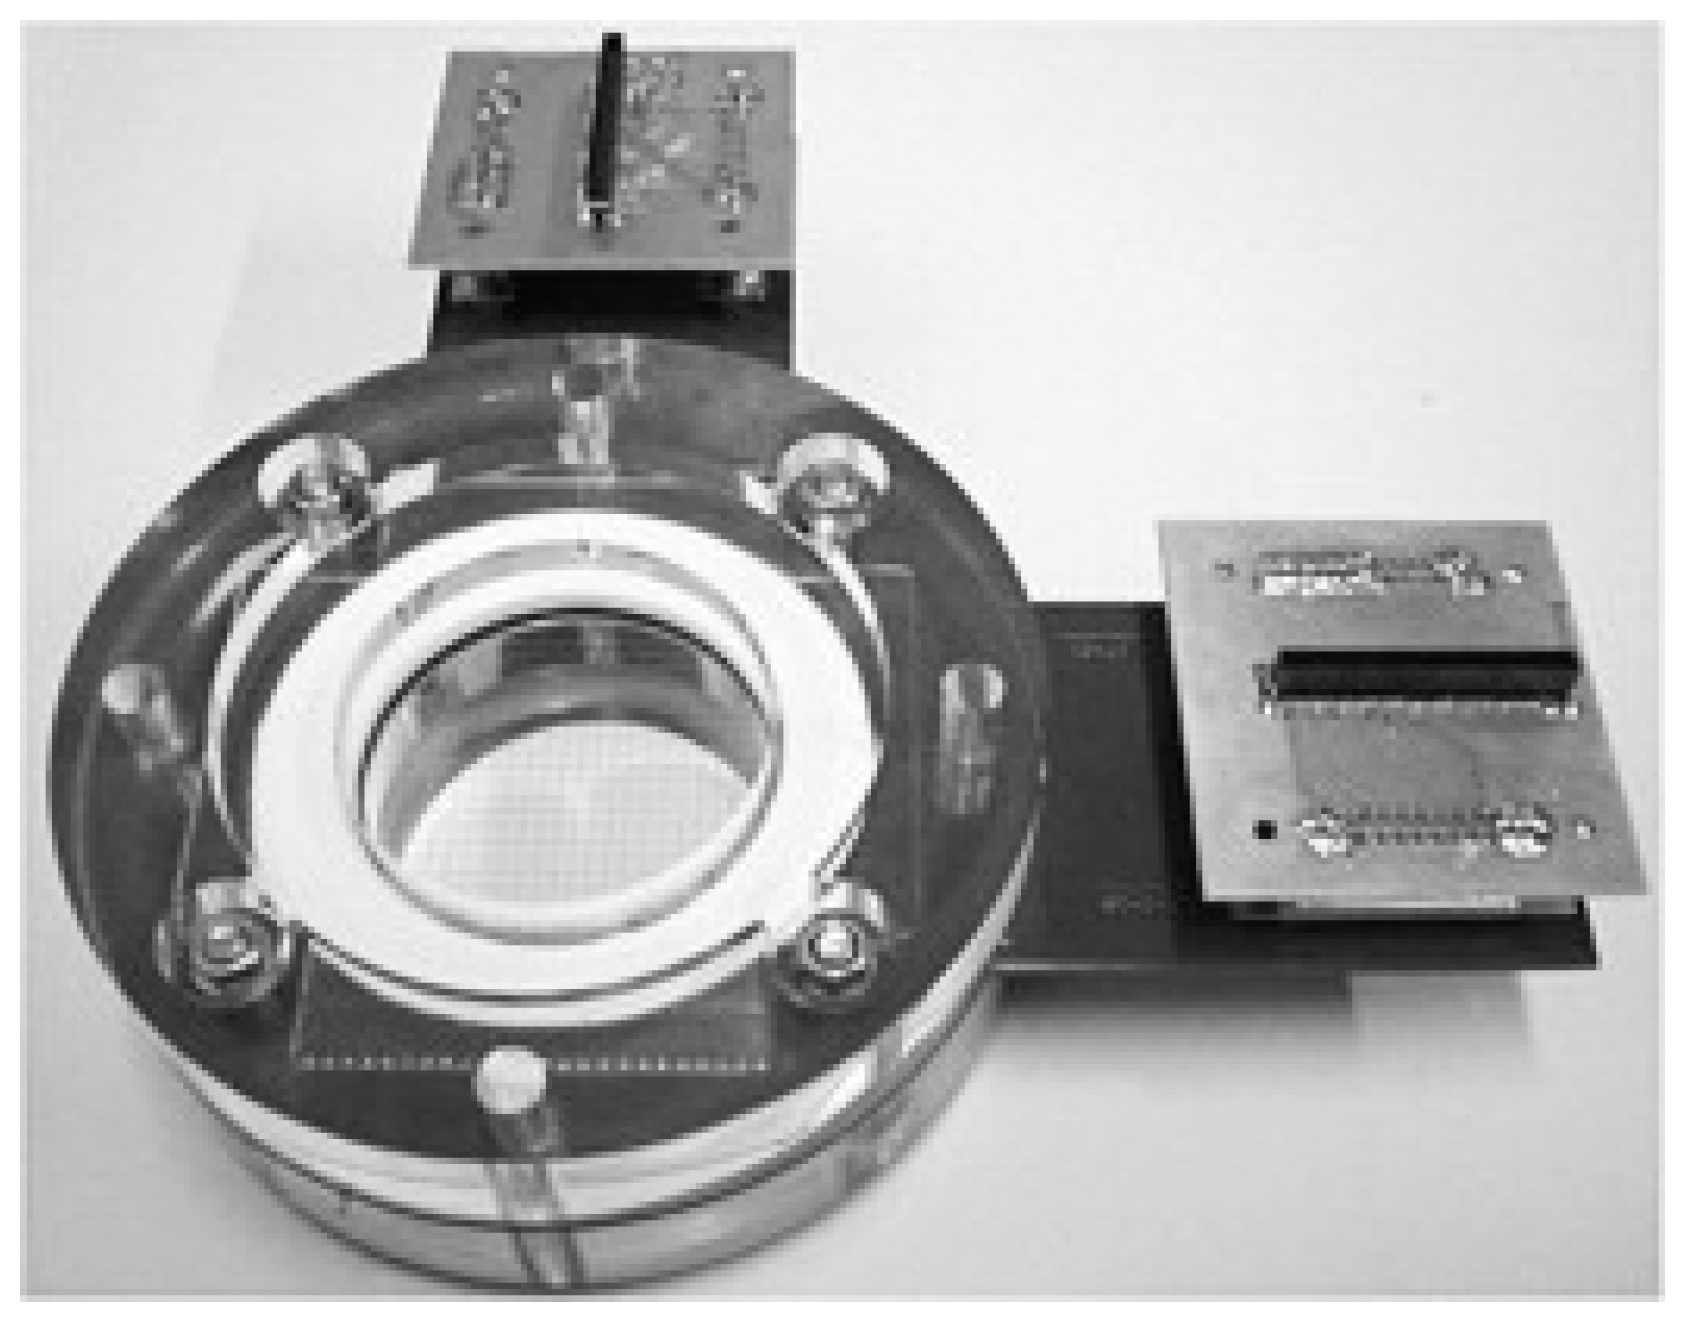
Many kinds of measurement probes are available, allowing for local or average measurements using the electrical conductivity method. One such probe is the wire-mesh sensor (WMS), which allows for the visualization of two-phase flow. Figure 12 and Figure 13 show examples of WMSs [4,14,15].
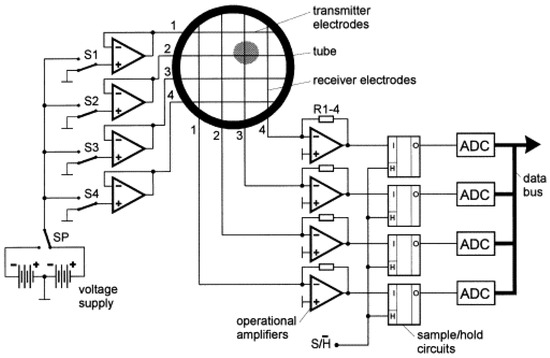
Figure 12.
The diagram of a wire-mesh sensor (WMS) [14].
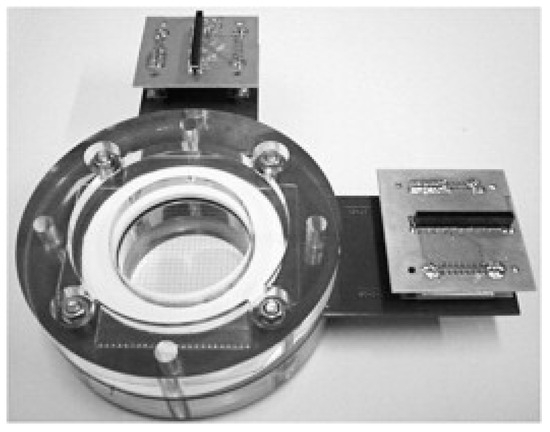
Figure 13.
An example of a WMS [4,15].
The advantage of this method is its ability to measure the degree of filling in real time with high accuracy. The disadvantages of this method are the following:
- -
- The construction and calibration of the electronic system;
- -
- It is not suitable for liquids with low electrical conductivity, such as oils;
- -
- It does not allow for the measurement of the size of air bubbles (except with WMSs).
This method does not fulfill any of the criteria, and it should not be taken into account when selecting a research method for the air content in oil, especially when selecting the best research method.
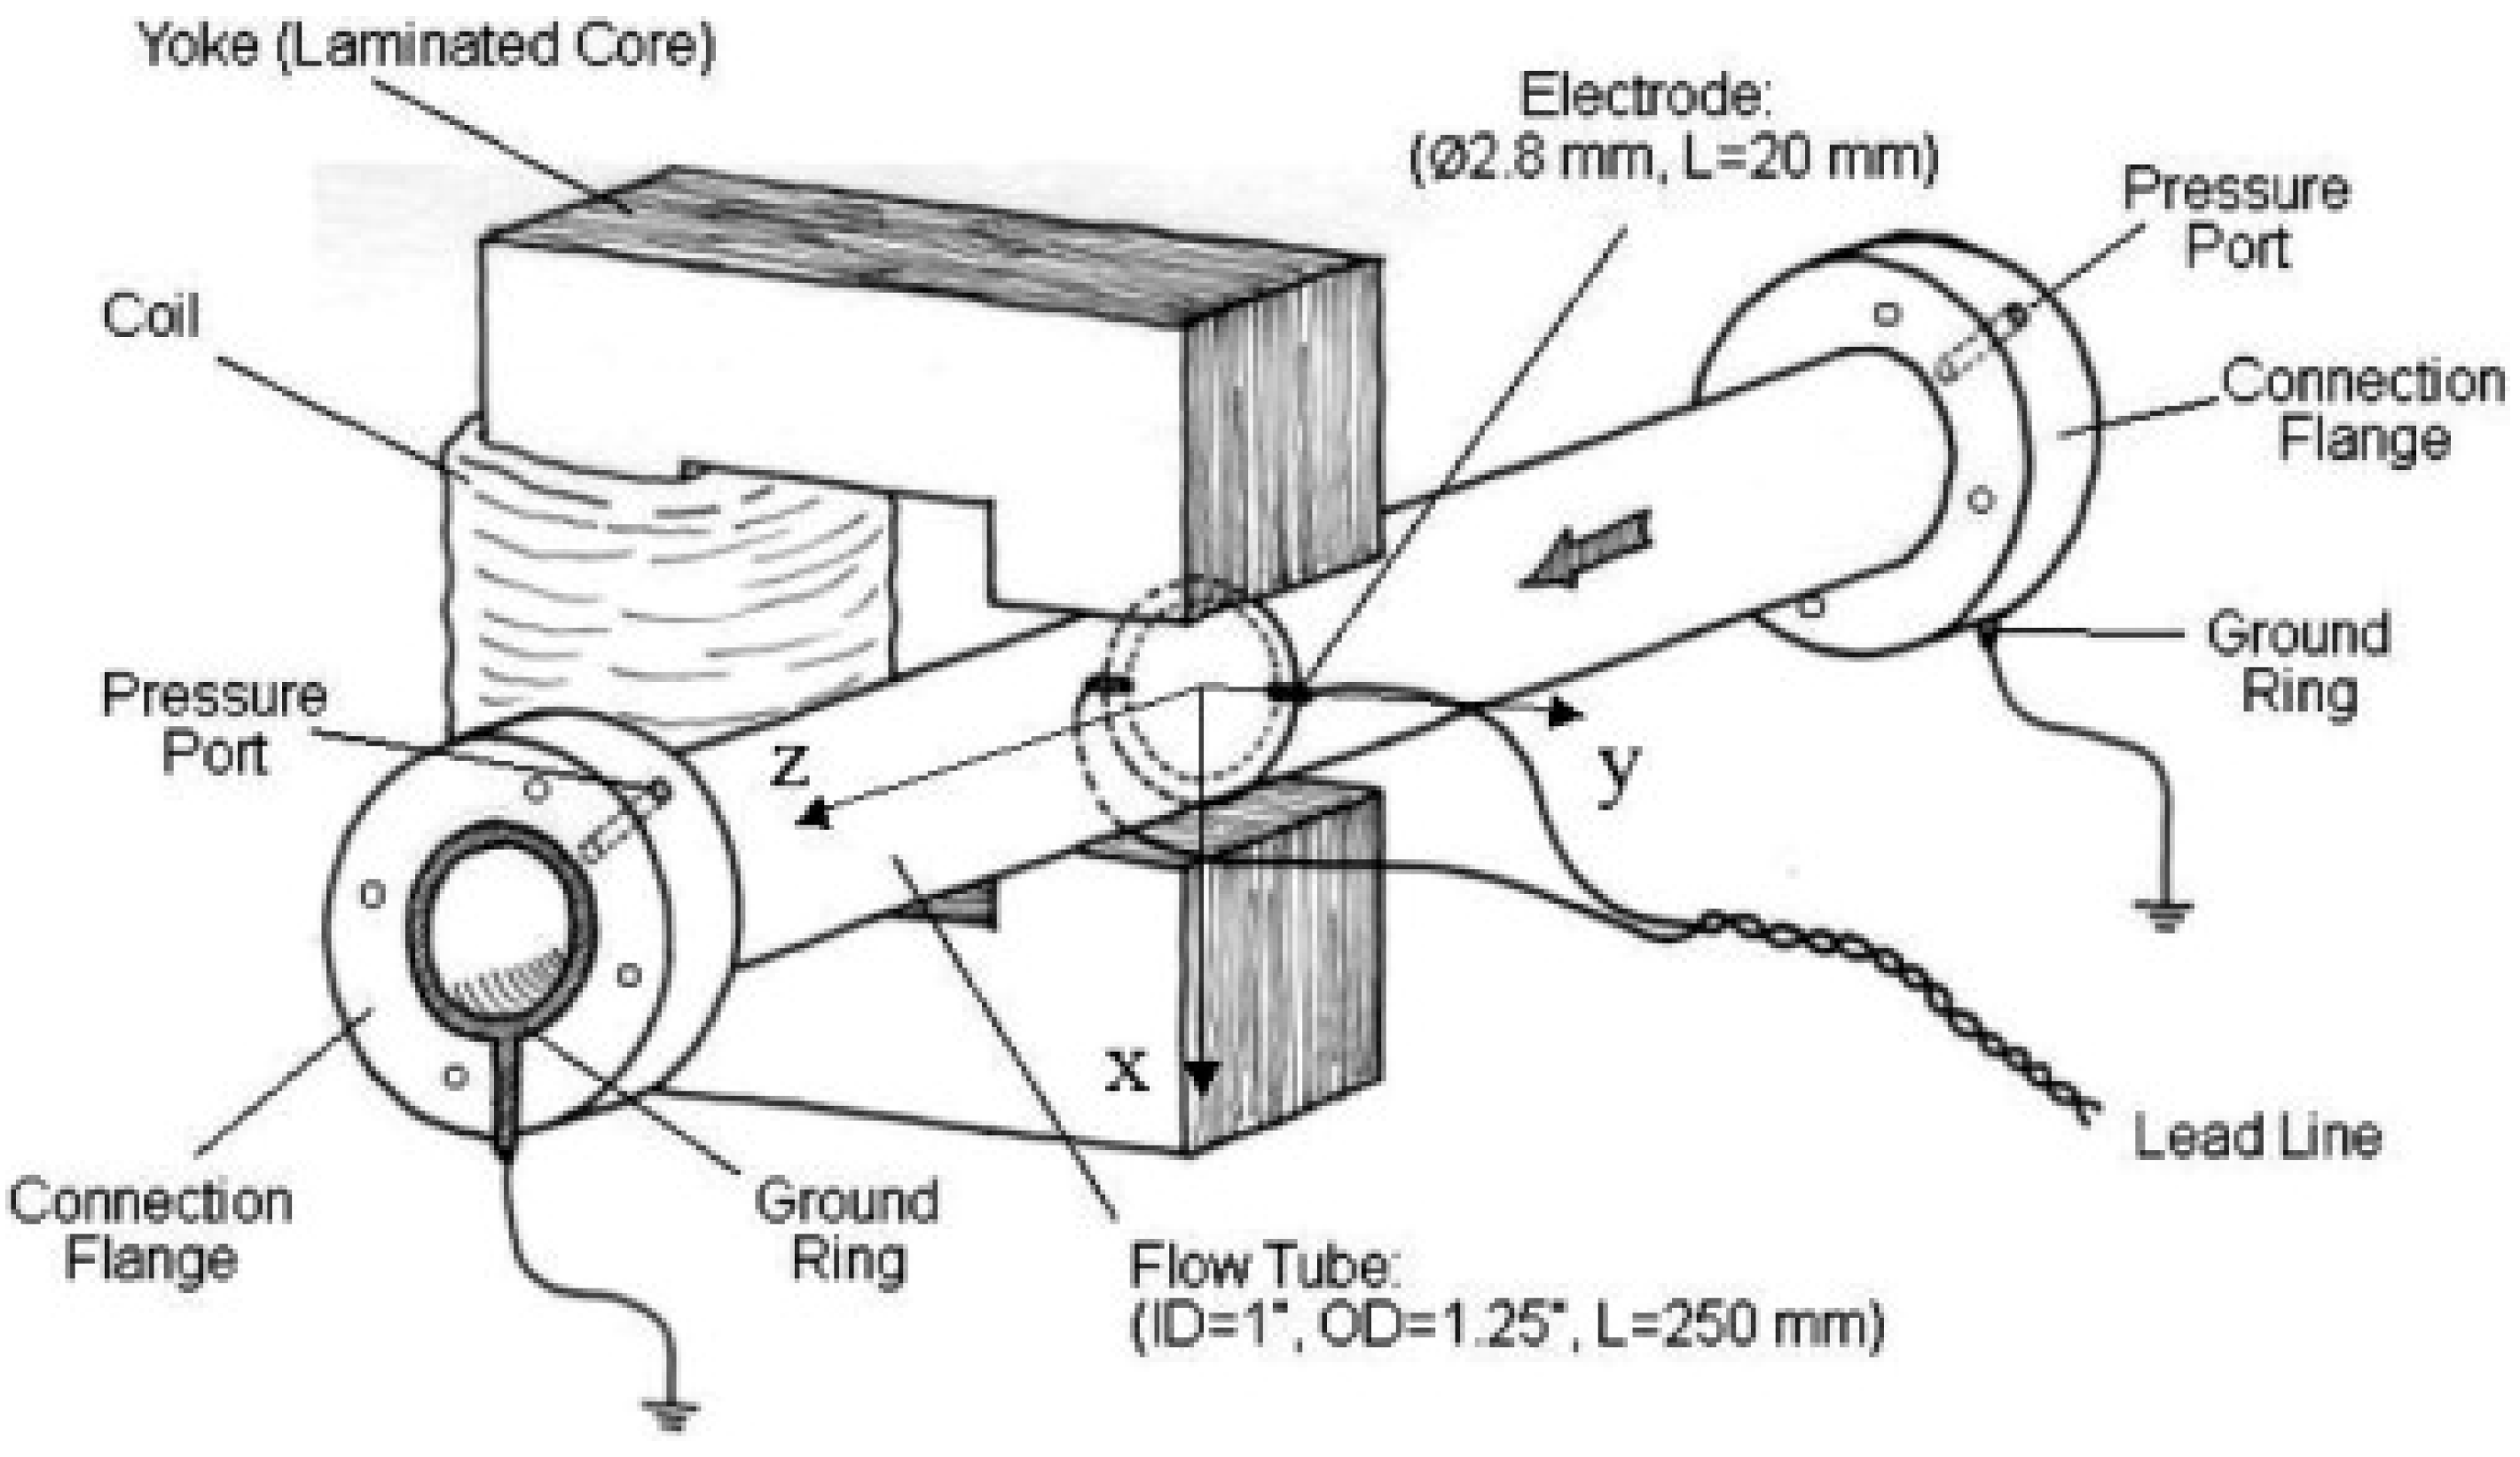
2.4.3. Electromagnetic Method
The electromagnetic method is based on exploiting the phenomenon of electromagnetic induction. As a liquid flows through a pipe in a variable magnetic field oriented perpendicularly to the direction of flow, a difference between potentials arises on electrodes positioned along a line perpendicular to the plane formed by the direction of the magnetic field and the velocity of the liquid flow over the measured section of the pipe [4,16]. Figure 14 shows a diagram of an electromagnetic flowmeter.
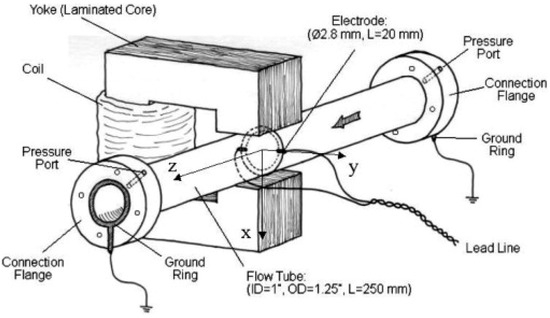
Figure 14.
A diagram of an electromagnetic flowmeter [4,16].
The advantage of this method is its ability to measure the degree of filling in real time. The disadvantages of this method are the following:
- -
- It is not suitable for liquids with low electrical conductivity, such as oils;
- -
- It has a complex power supply system;
- -
- The construction and calibration of the electronic system;
- -
- Noise (transformer, power source, electromagnet);
- -
- It does not allow for the measurement of the size of air bubbles (except for detecting passing air pockets).
This method does not fulfill any of the criteria, and it should not be taken into account when selecting a research method for the air content in oil, especially when selecting the best research method.
2.4.4. Electrical Capacitance Method
The electrical capacitance method consists of measuring the electrical capacitance during the flow of a two-phase mixture. Oil and air have different electrical capacitance coefficients, due to which it is possible to measure the degree of filling (the ratio of the amount of air to the amount of oil) [4,17]. Figure 15 shows a diagram of a flowmeter exploiting the phenomenon of electrical capacitance.
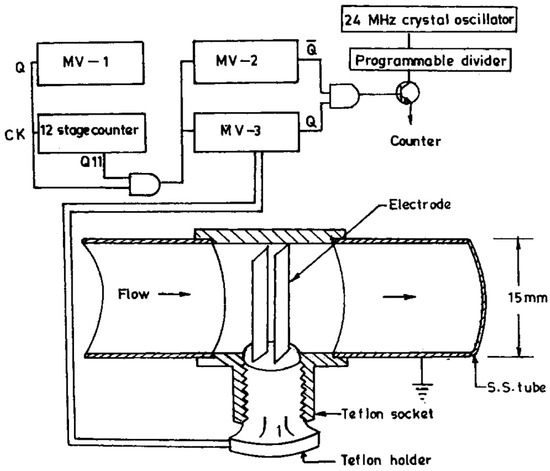
Figure 15.
A diagram of a flowmeter using the phenomenon of electrical capacitance [4,17].
The advantages of this method are its ability to measure the degree of filling in real time and its suitability for liquids with low electrical conductivity, such as oil. The disadvantages of this method are the following:
- -
- It is not suitable for evaluating the structure of a two-phase flow;
- -
- The construction and calibration of the electronic system;
- -
- It does not allow for the measurement of the size of air bubbles.
This method does not fulfill any of the criteria, and it should not be taken into account when selecting a research method for the air content in oil, especially when selecting the best research method.
2.4.5. Thermal Anemometry Method
The thermal anemometry method involves measuring the voltage change in a thin insulated wire through which electric current flows. As electric current passes through, it generates heat, which is then released into the environment. During the two-phase flow of a liquid and a gas, the cooling conditions of the wire change due to the varying thermal conductivity and heat capacity properties of the phases, leading to a change in the wire’s temperature and its resistance and, consequently, a change in the voltage drop along the wire. Figure 16 shows a hot-wire anemometric probe [18].

Figure 16.
A hot-wire anemometric probe used to measure a two-phase flow [18].
The advantage of this method is the possibility of measuring the size of air bubbles in a two-phase flow. The disadvantages of this method are the following:
- -
- It has a complicated nature;
- -
- It only allows for local measurements in a small volume;
- -
- Difficult interpretation of results (multiple air bubbles can simultaneously affect the voltage characteristics measured by the probe).
This method does not fulfill any of the criteria, and it should not be taken into account when selecting a research method for the air content in oil, especially when selecting the best research method.
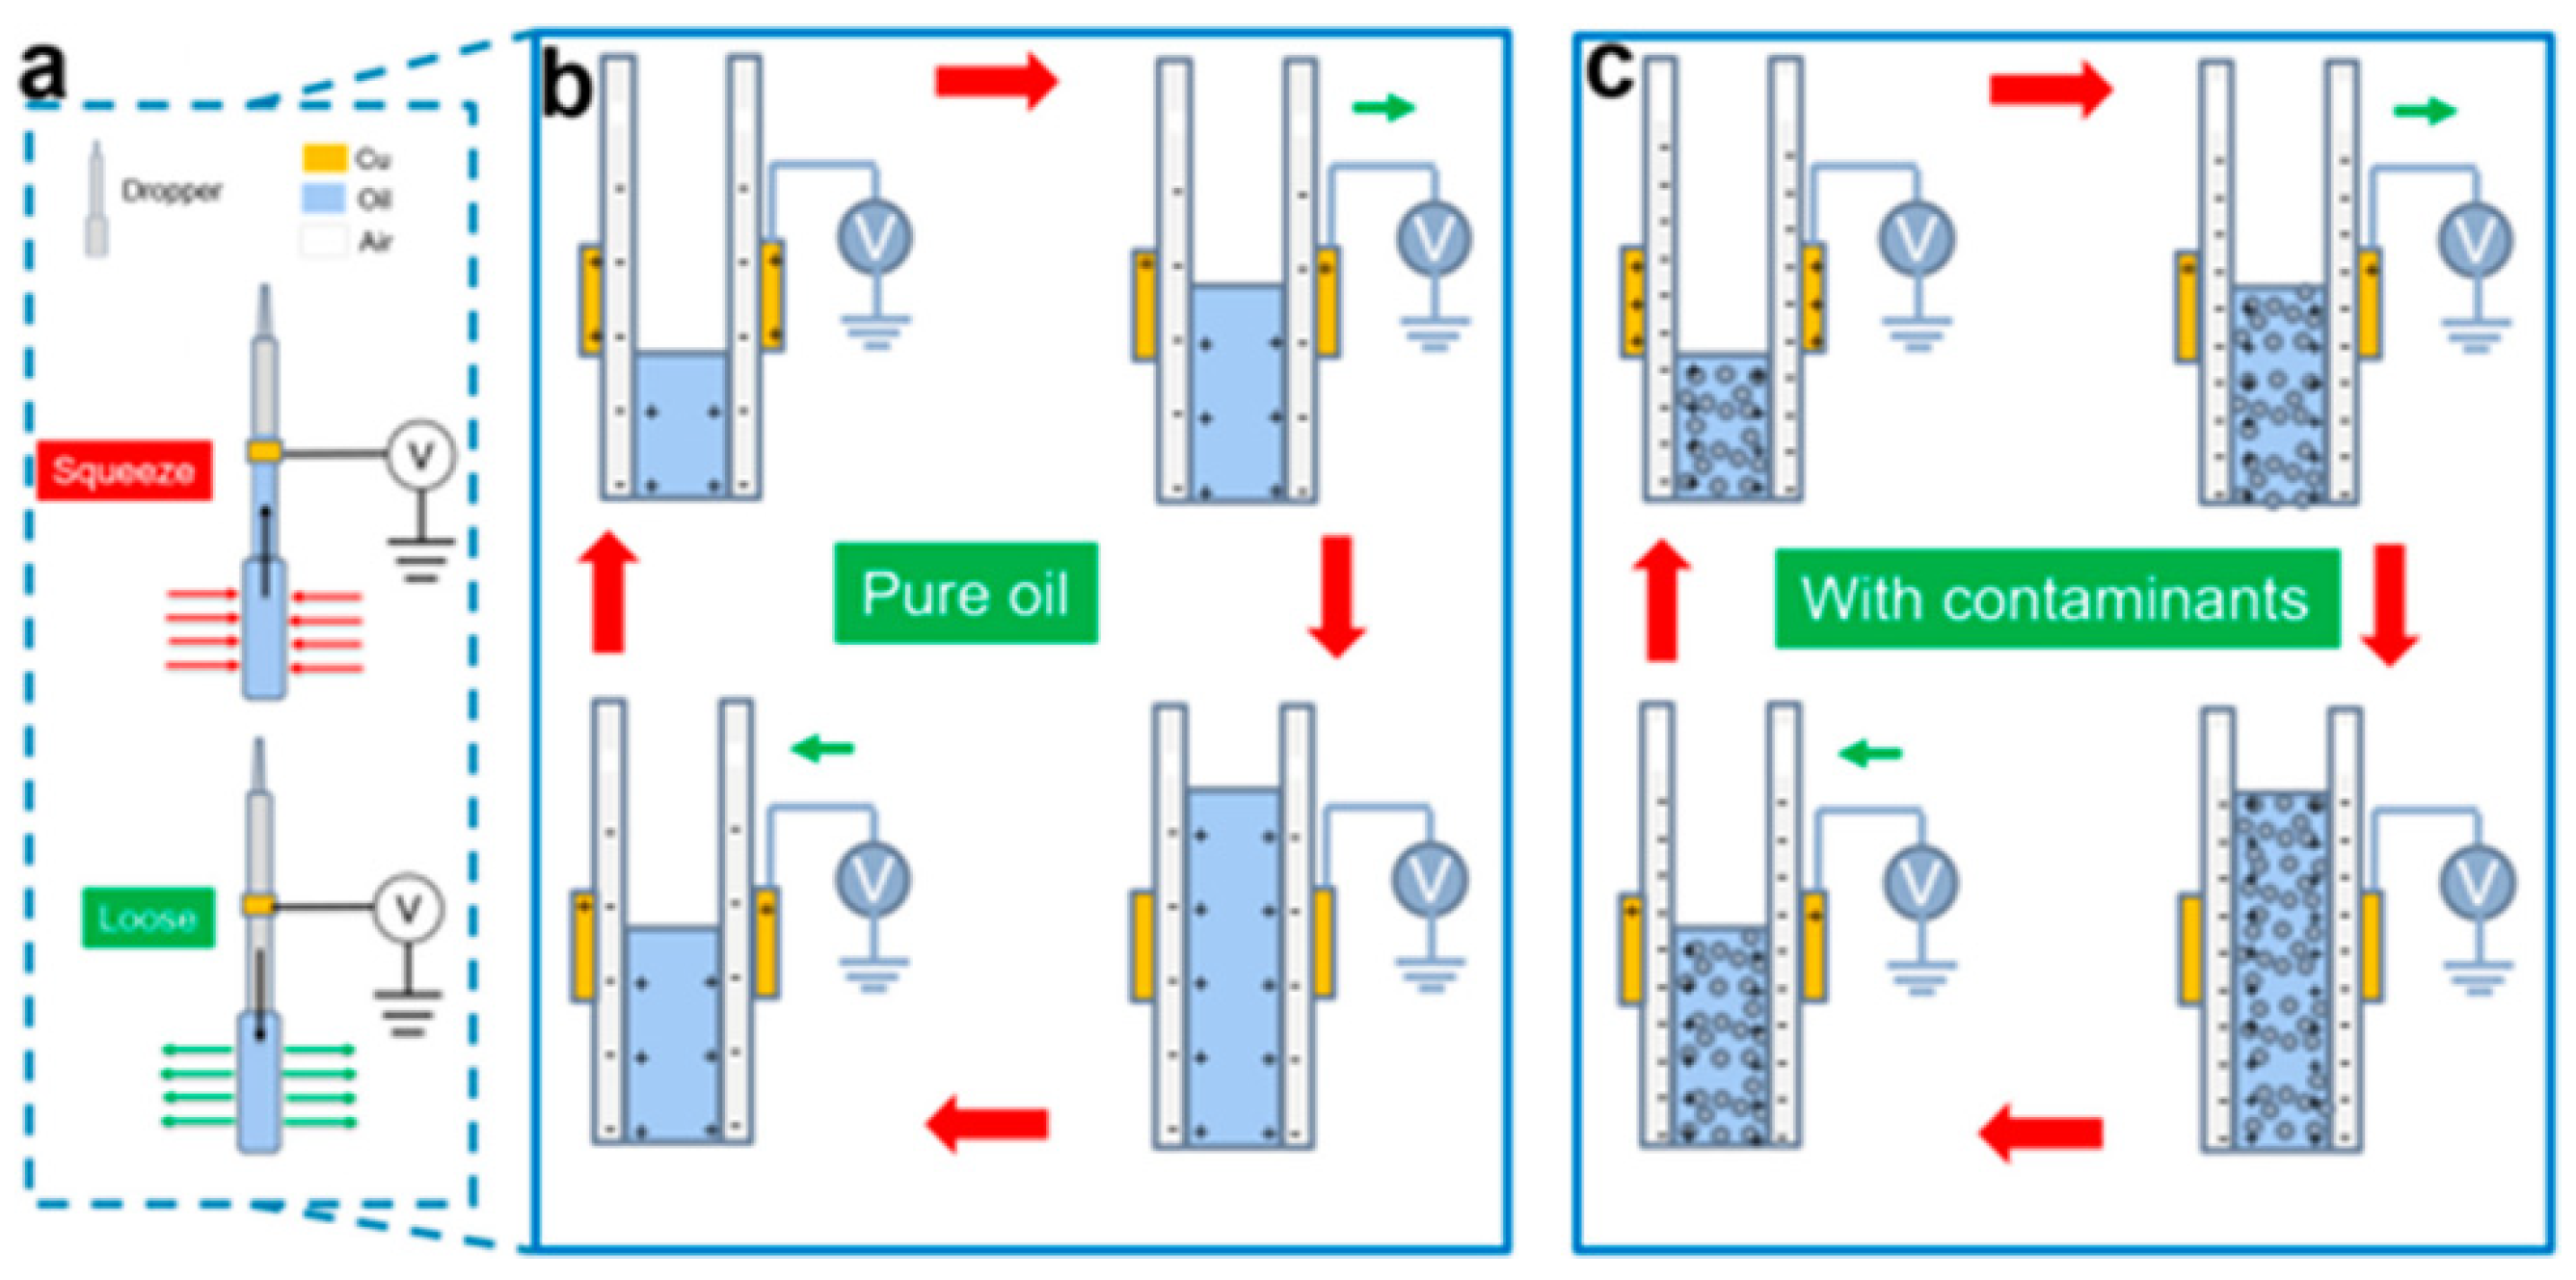
2.4.6. The Liquid–Solid Contact Electrification Method
The liquid–solid contact electrification method consists of measuring the voltage change when a liquid makes contact with an electrode. The voltage change depends on a liquid and its contamination. The sensor does not need an external power supply. Figure 17 shows a diagram of an O-S TENG sensor [19].
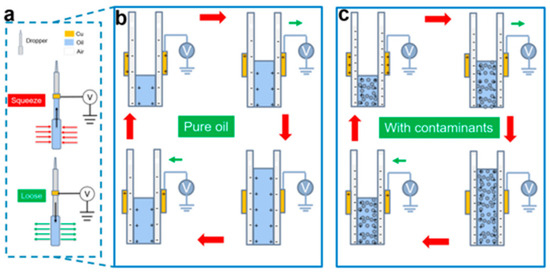
Figure 17.
Diagram of an O-S TENG sensor [19]. (a) Structural schematic diagram of the O−S TENG sensor; (b) typical output signal generated by the interfacial interaction between a pure lubricating oil and a Cu electrode; (c) output generation of the lubricating oil with contaminant ingressions.
The advantage of this method is the possibility of continuously measuring a two-phase flow. The disadvantages of this method are the following:
- -
- It does not allow for the measurement of a two-phase flow with big air bubbles;
- -
- Difficult interpretation of the results.
This method does not fulfill any of the criteria, and it should not be taken into account when selecting a research method for the air content in oil, especially when selecting the best research method.
2.5. Optical Methods
Optical methods are used to determine the air content in liquids, and such methods include the following:
- (1)
- The photographic method;
- (2)
- The holographic method;
- (3)
- Light scattering.
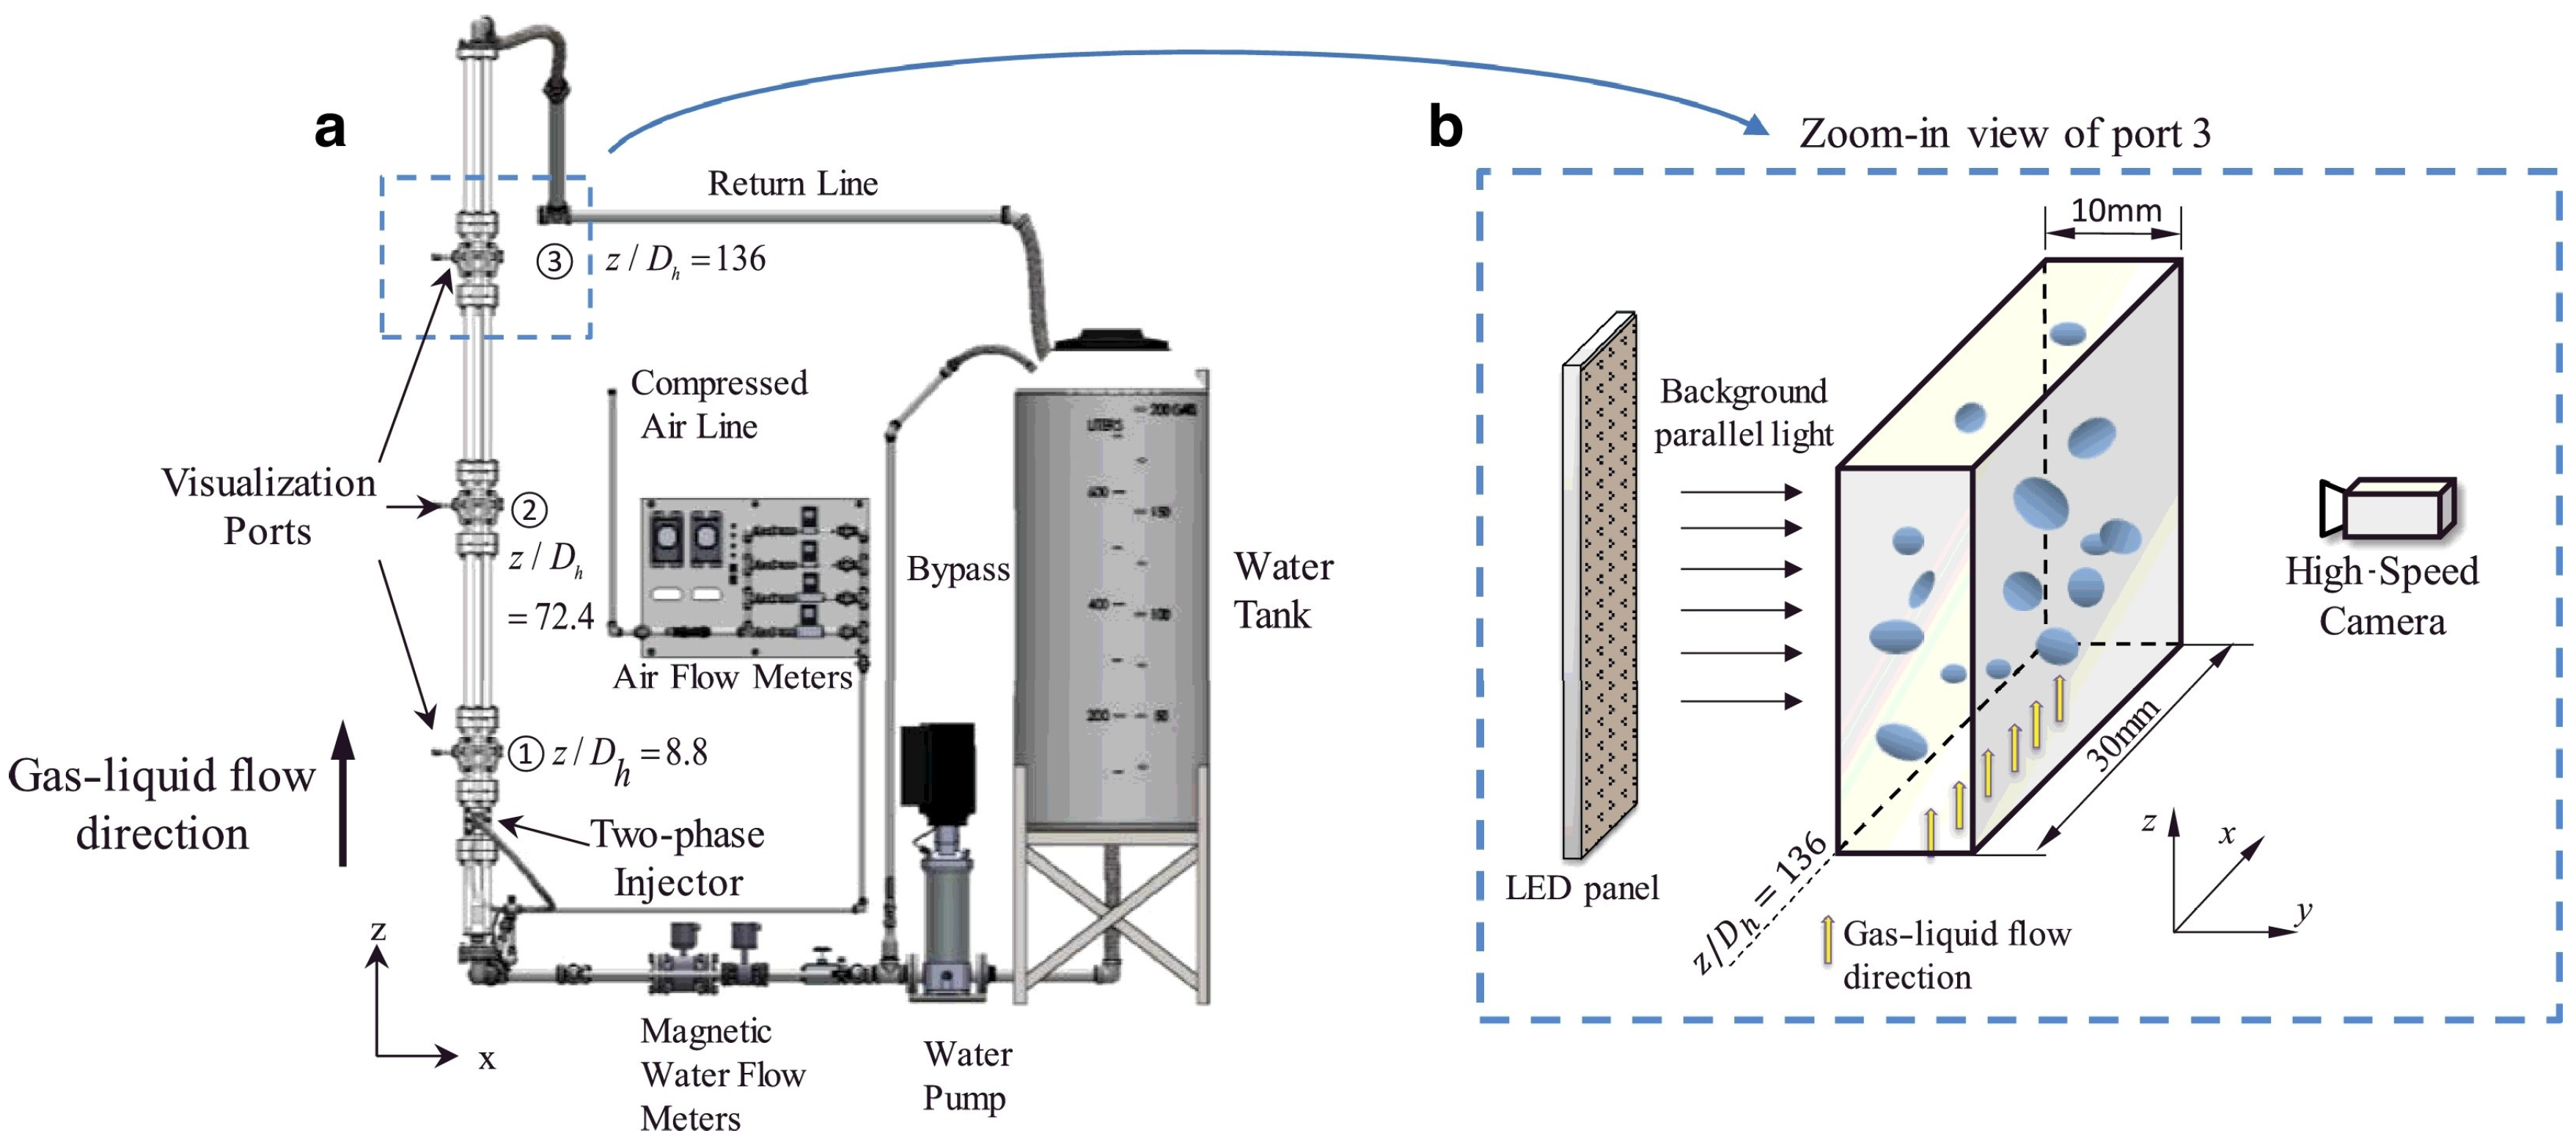
2.5.1. Photographic Method
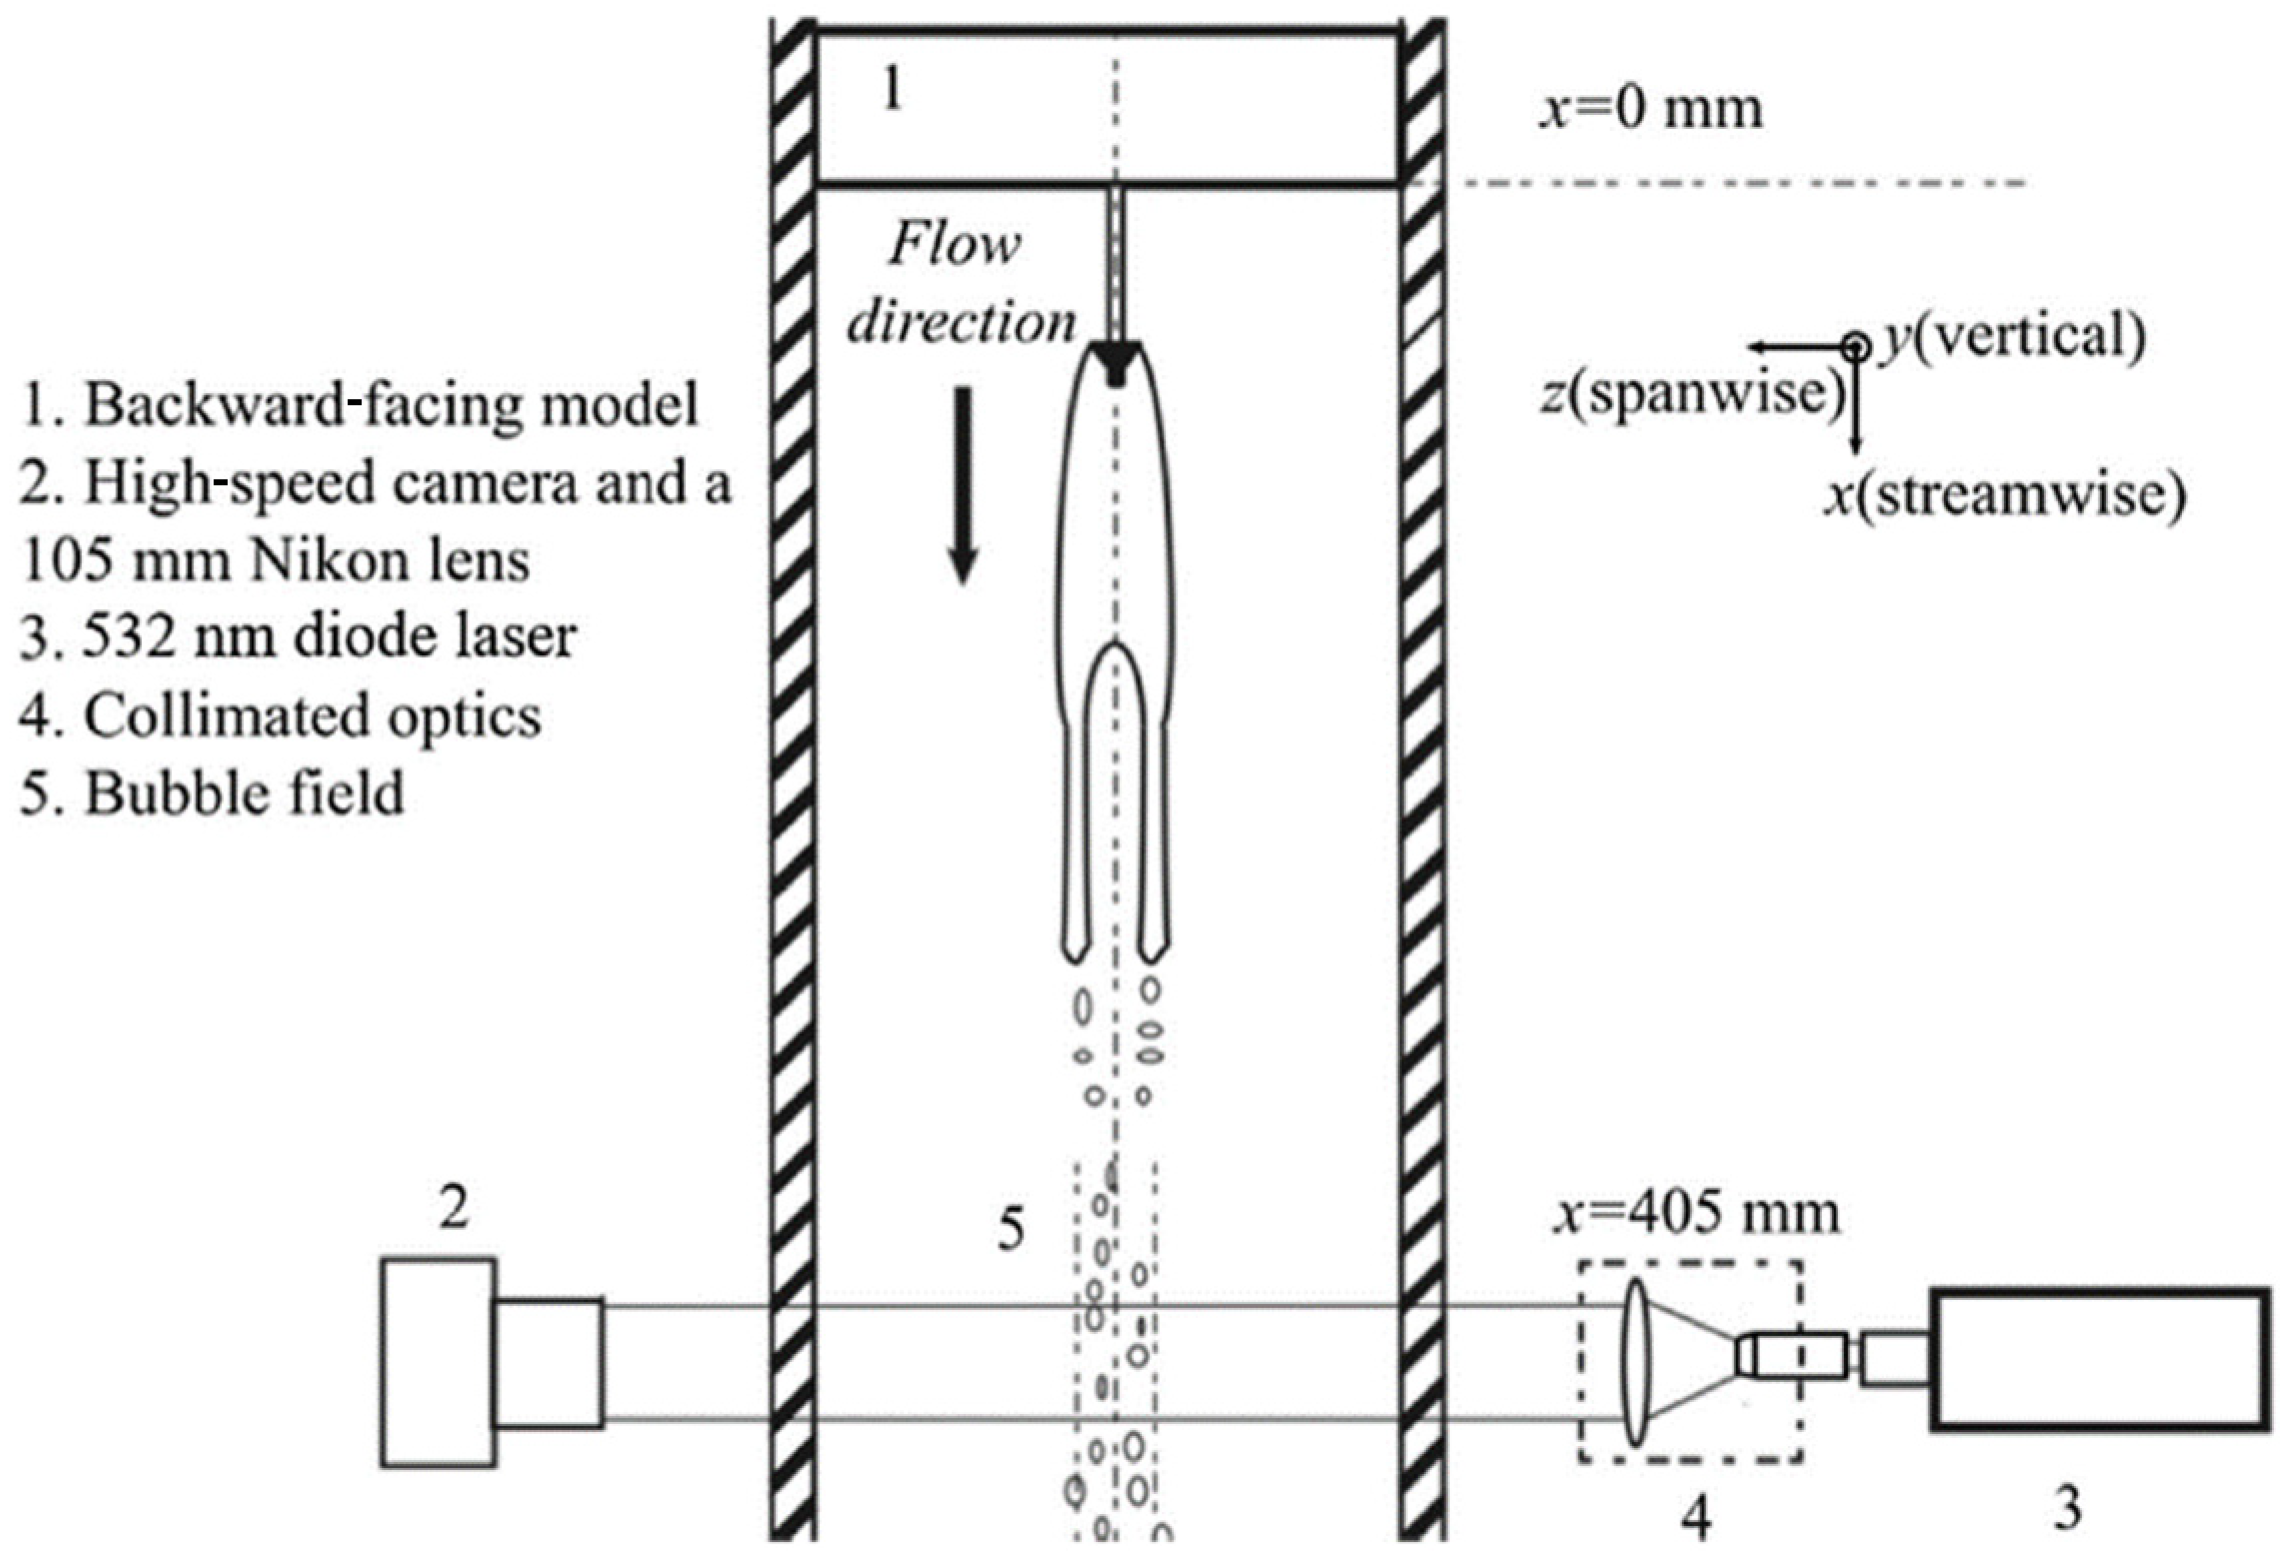
The photographic method consists of taking photographs of a two-phase mixture flowing through a specially prepared section of a pipeline, which should be transparent. The resulting images are then processed so that gas bubbles in the liquid can be counted and measured. On this basis, it is possible to determine the degree of filling and the nature of the flow. High-speed cameras are increasingly replacing traditional ones. Figure 18 shows a diagram of the use of the photographic method [4,20].
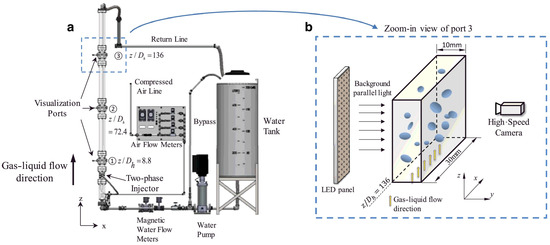
Figure 18.
A diagram of the use of the photographic method [4,20]. (a) Schematic diagram of the test stand. (b) The imaging system.
The advantage of this method is the possibility of measuring the size and number of air bubbles, the degree of filling, and the nature of the flow in a two-phase flow. The disadvantages of this method are the following:
- -
- Complicated data processing;
- -
- In order to implement this method, a high-quality camera or high-speed camera is needed.
This method fulfills all of the criteria, and it should be taken into account when selecting a research method for the air content in oil, especially when selecting the best research method.
2.5.2. The Holographic Method
The holographic method involves capturing holographic images of a flowing two-phase mixture through a specially prepared section of a pipeline, which should be transparent. Unlike a standard photographic image, which captures the wave amplitude and frequency information (as seen in color photos), a holographic image also contains additional information about the wave phase. Taking a holographic image requires a suitable light source emitting two beams of light with the same wave phase. One light beam illuminates the object under study, while the other one is reflected off of a mirror, creating a reference wave. These waves then converge on the hologram, where the information is recorded. The resulting images are processed and analyzed to count and measure gas bubbles in the liquid. On this basis, it is possible to determine the degree of filling and the nature of the flow. Figure 19 shows a diagram of the use of the holographic method [21].
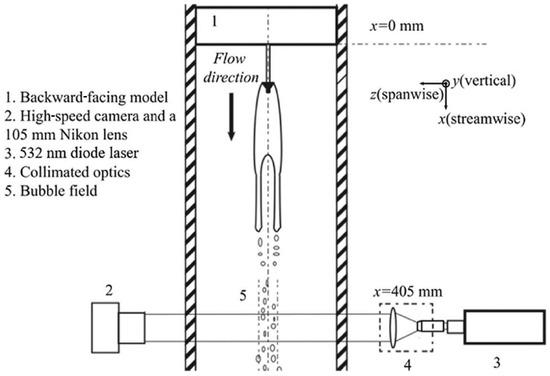
Figure 19.
A diagram of the use of the holographic method [21].
The advantage of this method is the possibility of measuring the size and number of air bubbles, the degree of filling, and the nature of the flow in a two-phase flow. The disadvantages of this method are the following:
- -
- More complicated construction of the measurement system compared with that in the photographic method (requiring a suitable light source);
- -
- Complicated data processing;
- -
- In order to implement this method, a high-quality/high-speed camera capable of capturing holographic images is needed.
This method fulfills the majority of the criteria, and it should be taken into account when selecting a research method for the air content in oil, especially when selecting the best research method.
2.5.3. Light Scattering
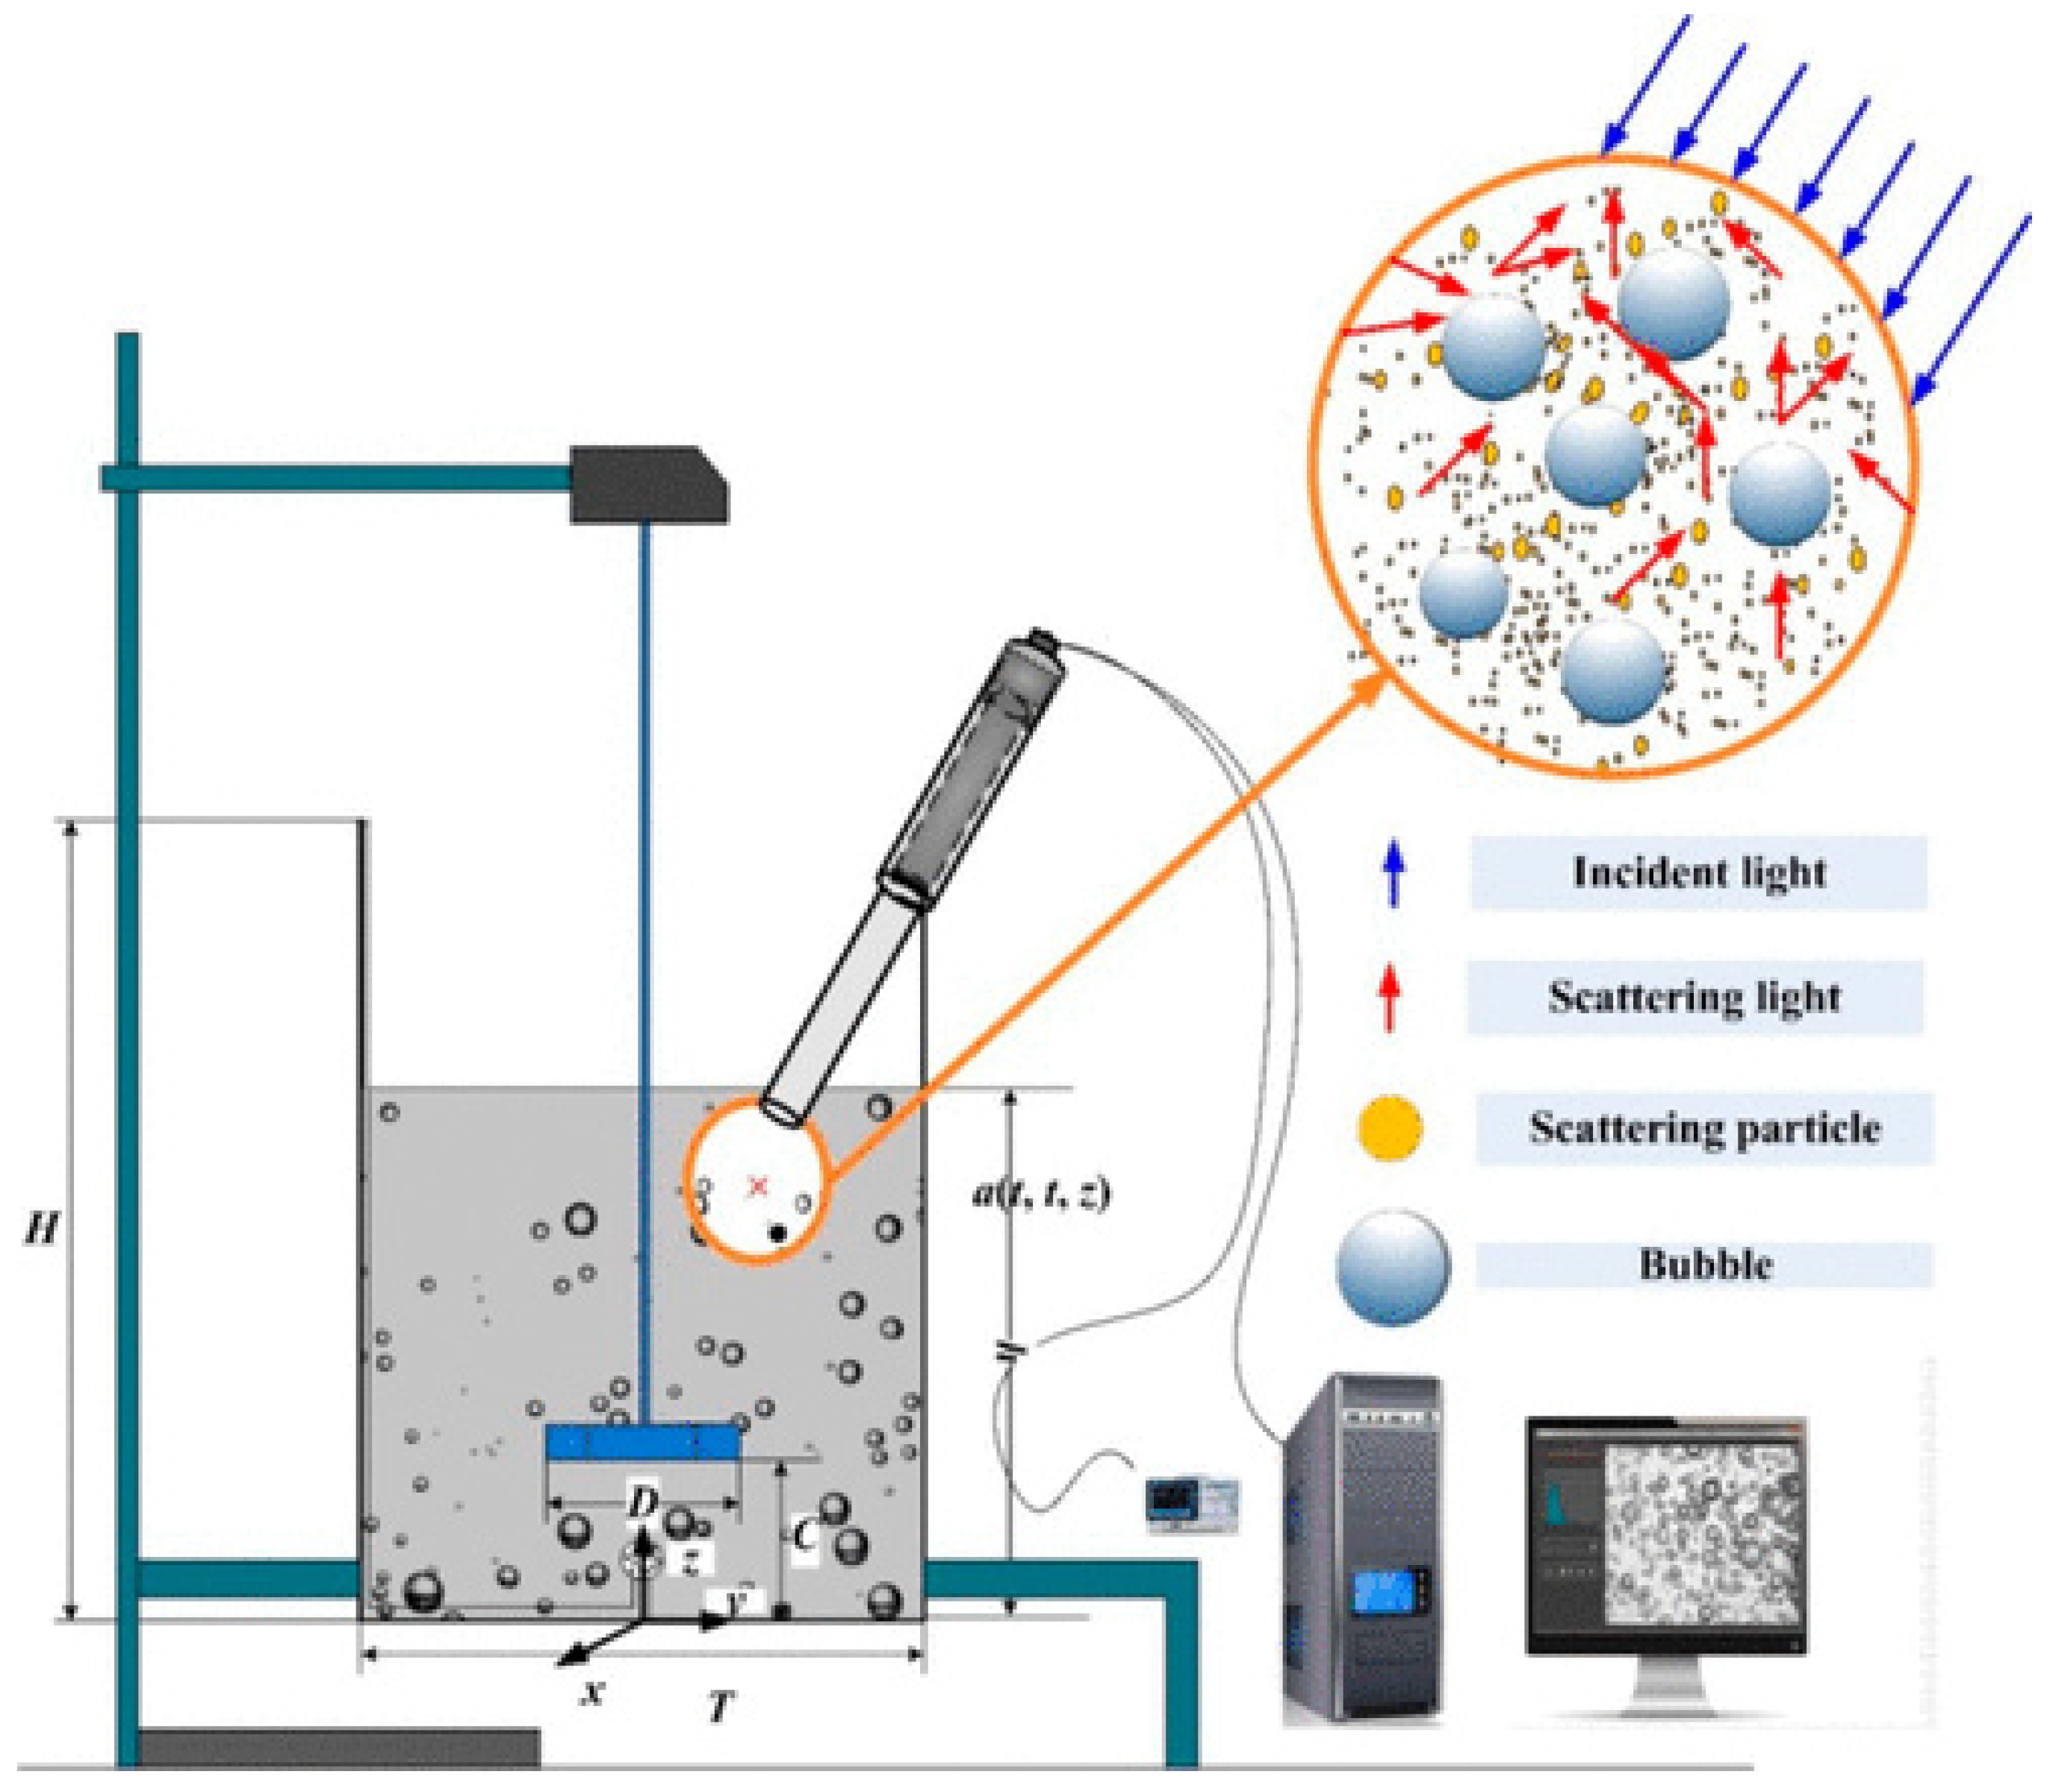
The light-scattering method involves taking photographs that capture light reflected from the photographed measurement section through which a two-phase mixture flows. The resulting images are then processed so that gas bubbles in the liquid can be counted and measured. On this basis, it is possible to determine the degree of filling and the nature of the flow. Figure 20 shows a diagram of the use of this method, which exploits the phenomenon of light scattering [22].
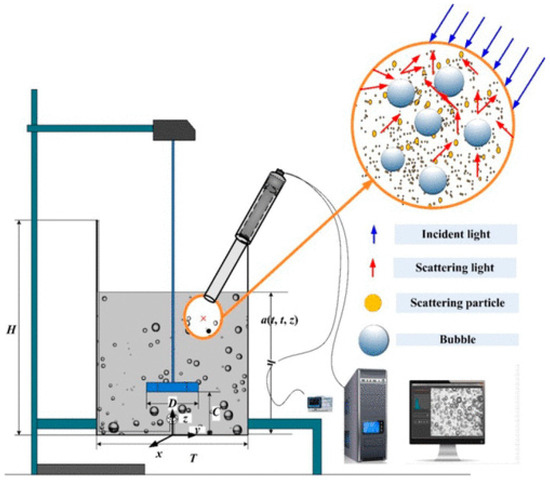
Figure 20.
A diagram of the use of the method exploiting the phenomenon of light scattering [22].
The advantage of this method is the possibility of measuring the size and number of air bubbles, the degree of filling, and the nature of the flow in a two-phase flow. The disadvantages of this method are the following:
- -
- More complicated construction of the measurement system compared with that in the photographic method (suitable light source);
- -
- Complicated data processing;
- -
- In order to implement this method, an accurate camera/high-speed camera is needed.
This method fulfills the majority of the criteria, and it should be taken into account when selecting a research method for the air content in oil, especially when selecting the best research method.
2.6. Acoustic Methods
Acoustic methods are used to determine the air content in a liquid. These methods include the following:
- (1)
- Sound dispersion;
- (2)
- The ultrasonic transit-time method.
2.6.1. Sound Dispersion
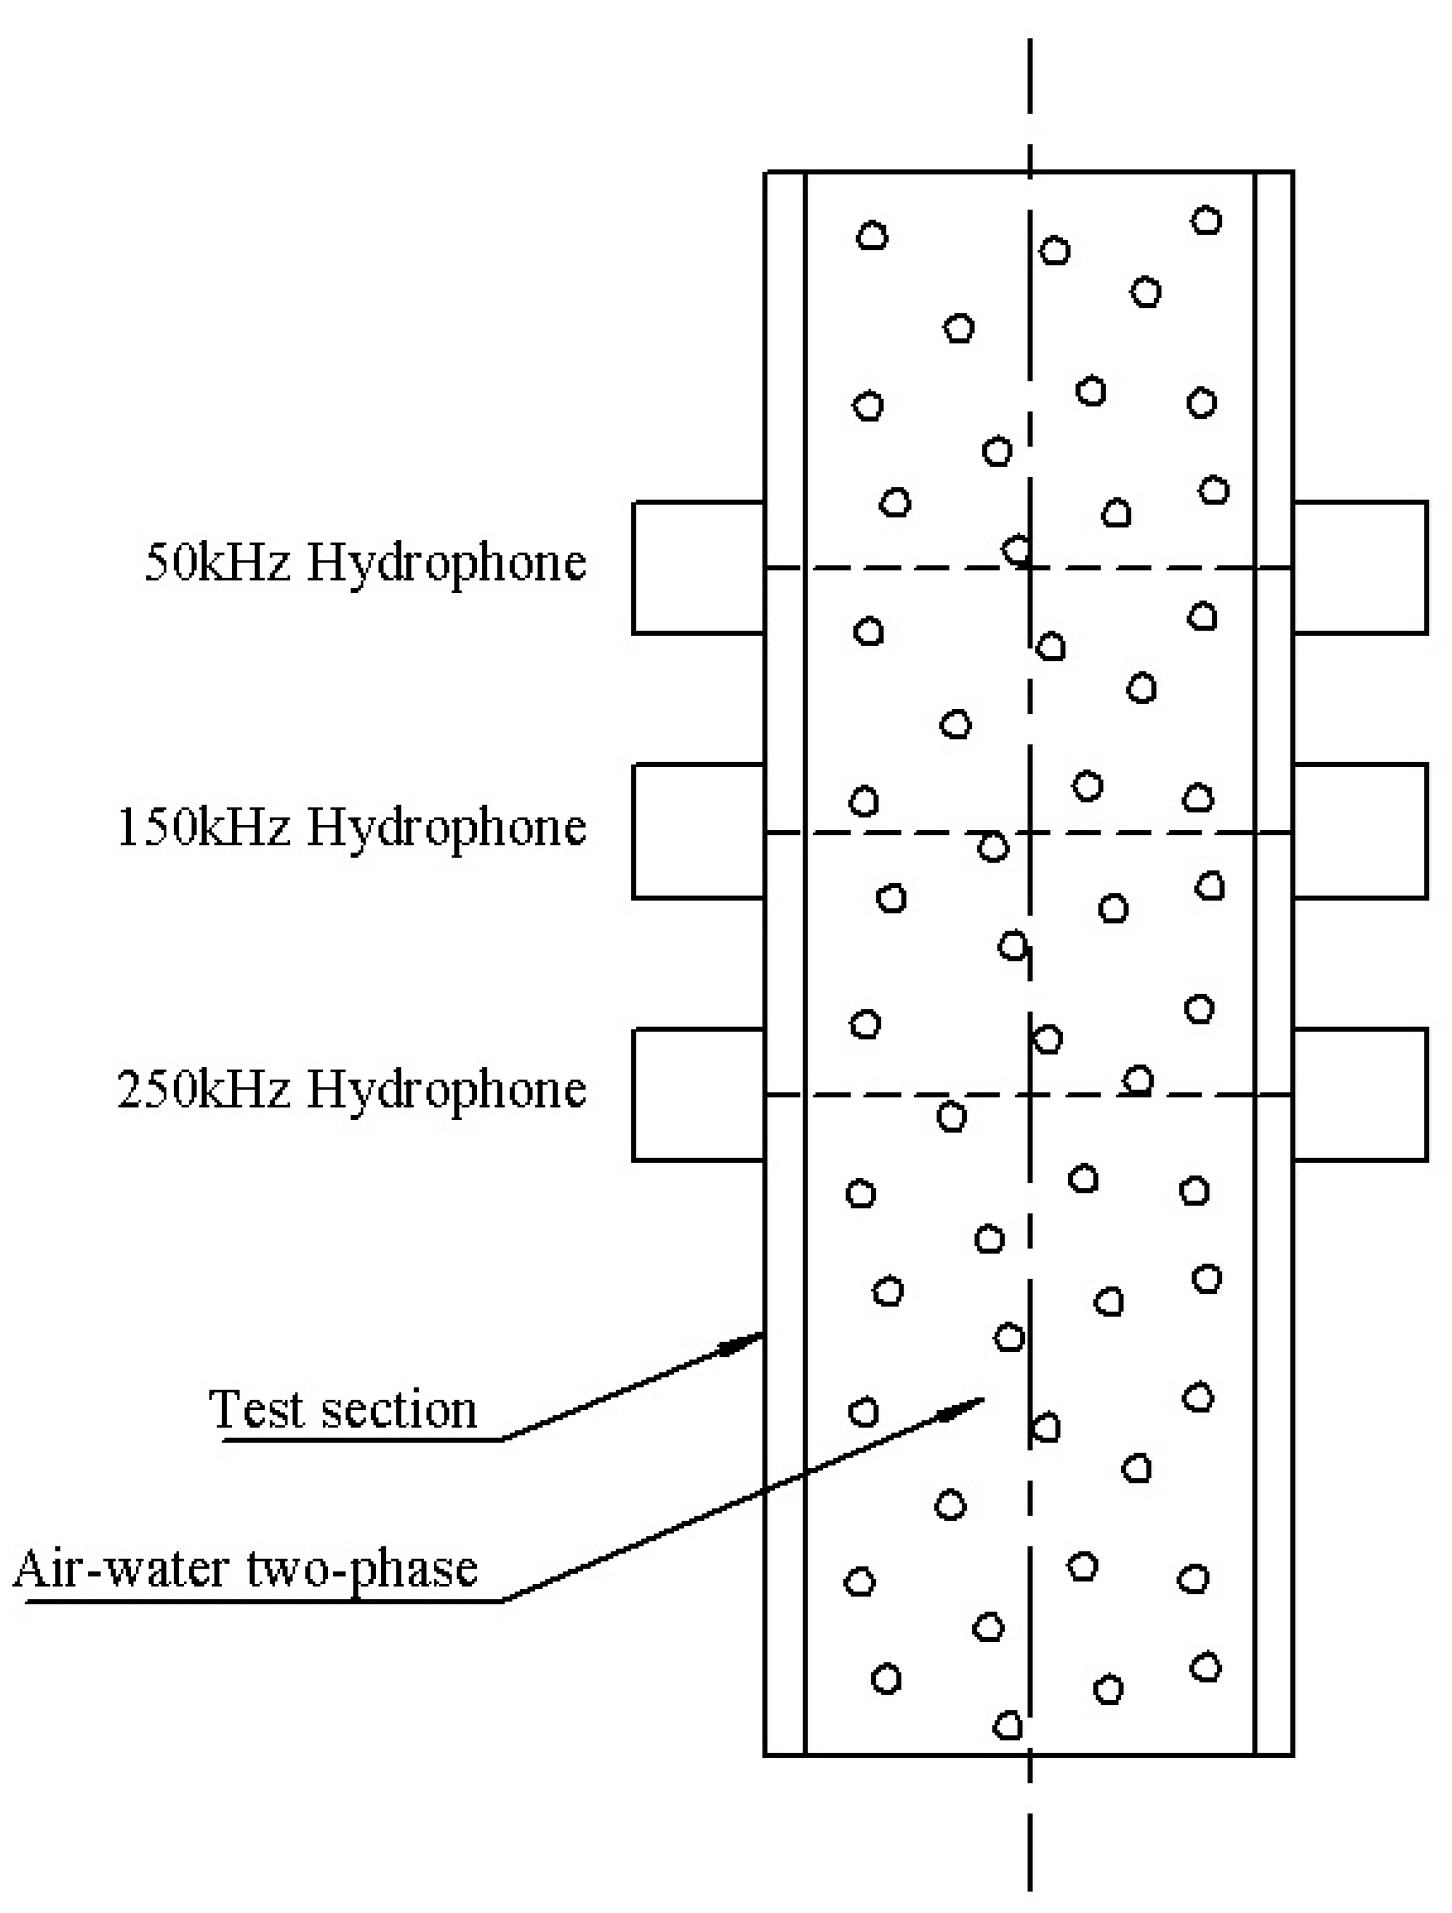
The method using the phenomenon of sound dispersion consists of measuring the parameters of an acoustic wave that a sensor receives after the acoustic wave passes through the two-phase mixture under study; then, the parameters of this wave are compared with those of the wave emitted by the emitter. Changing the velocity and phase of the acoustic wave allows for the determination of the number and size of gas bubbles in liquids. Figure 21 shows a diagram of the use of the acoustic method of sound dispersion [4,23].
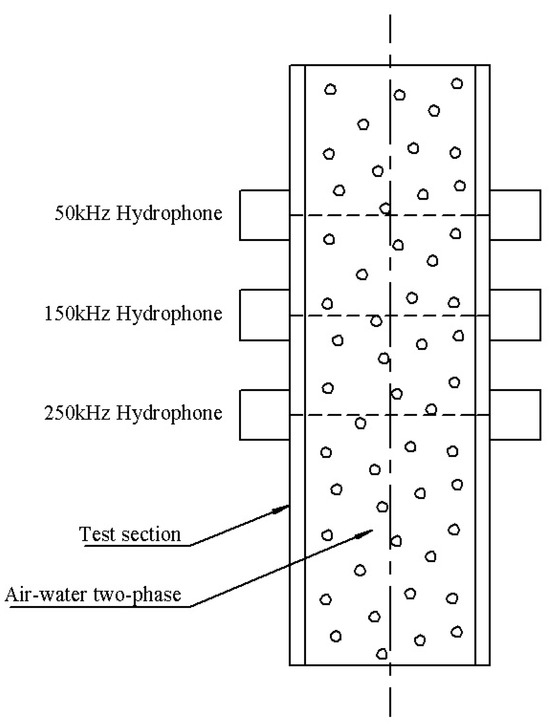
Figure 21.
A diagram of the use of the acoustic method of sound dispersion [4,23].
The advantage of this method is the possibility of measuring the size and number of air bubbles, the degree of filling, and the nature of the flow in a two-phase flow. The disadvantages of this method are the following:
- -
- Complicated construction of the measurement system;
- -
- Complicated data processing.
This method does not fulfill any of the criteria, and it should not be taken into account when selecting a research method for the air content in oil, especially when selecting the best research method.
2.6.2. Ultrasonic Transit-Time Method
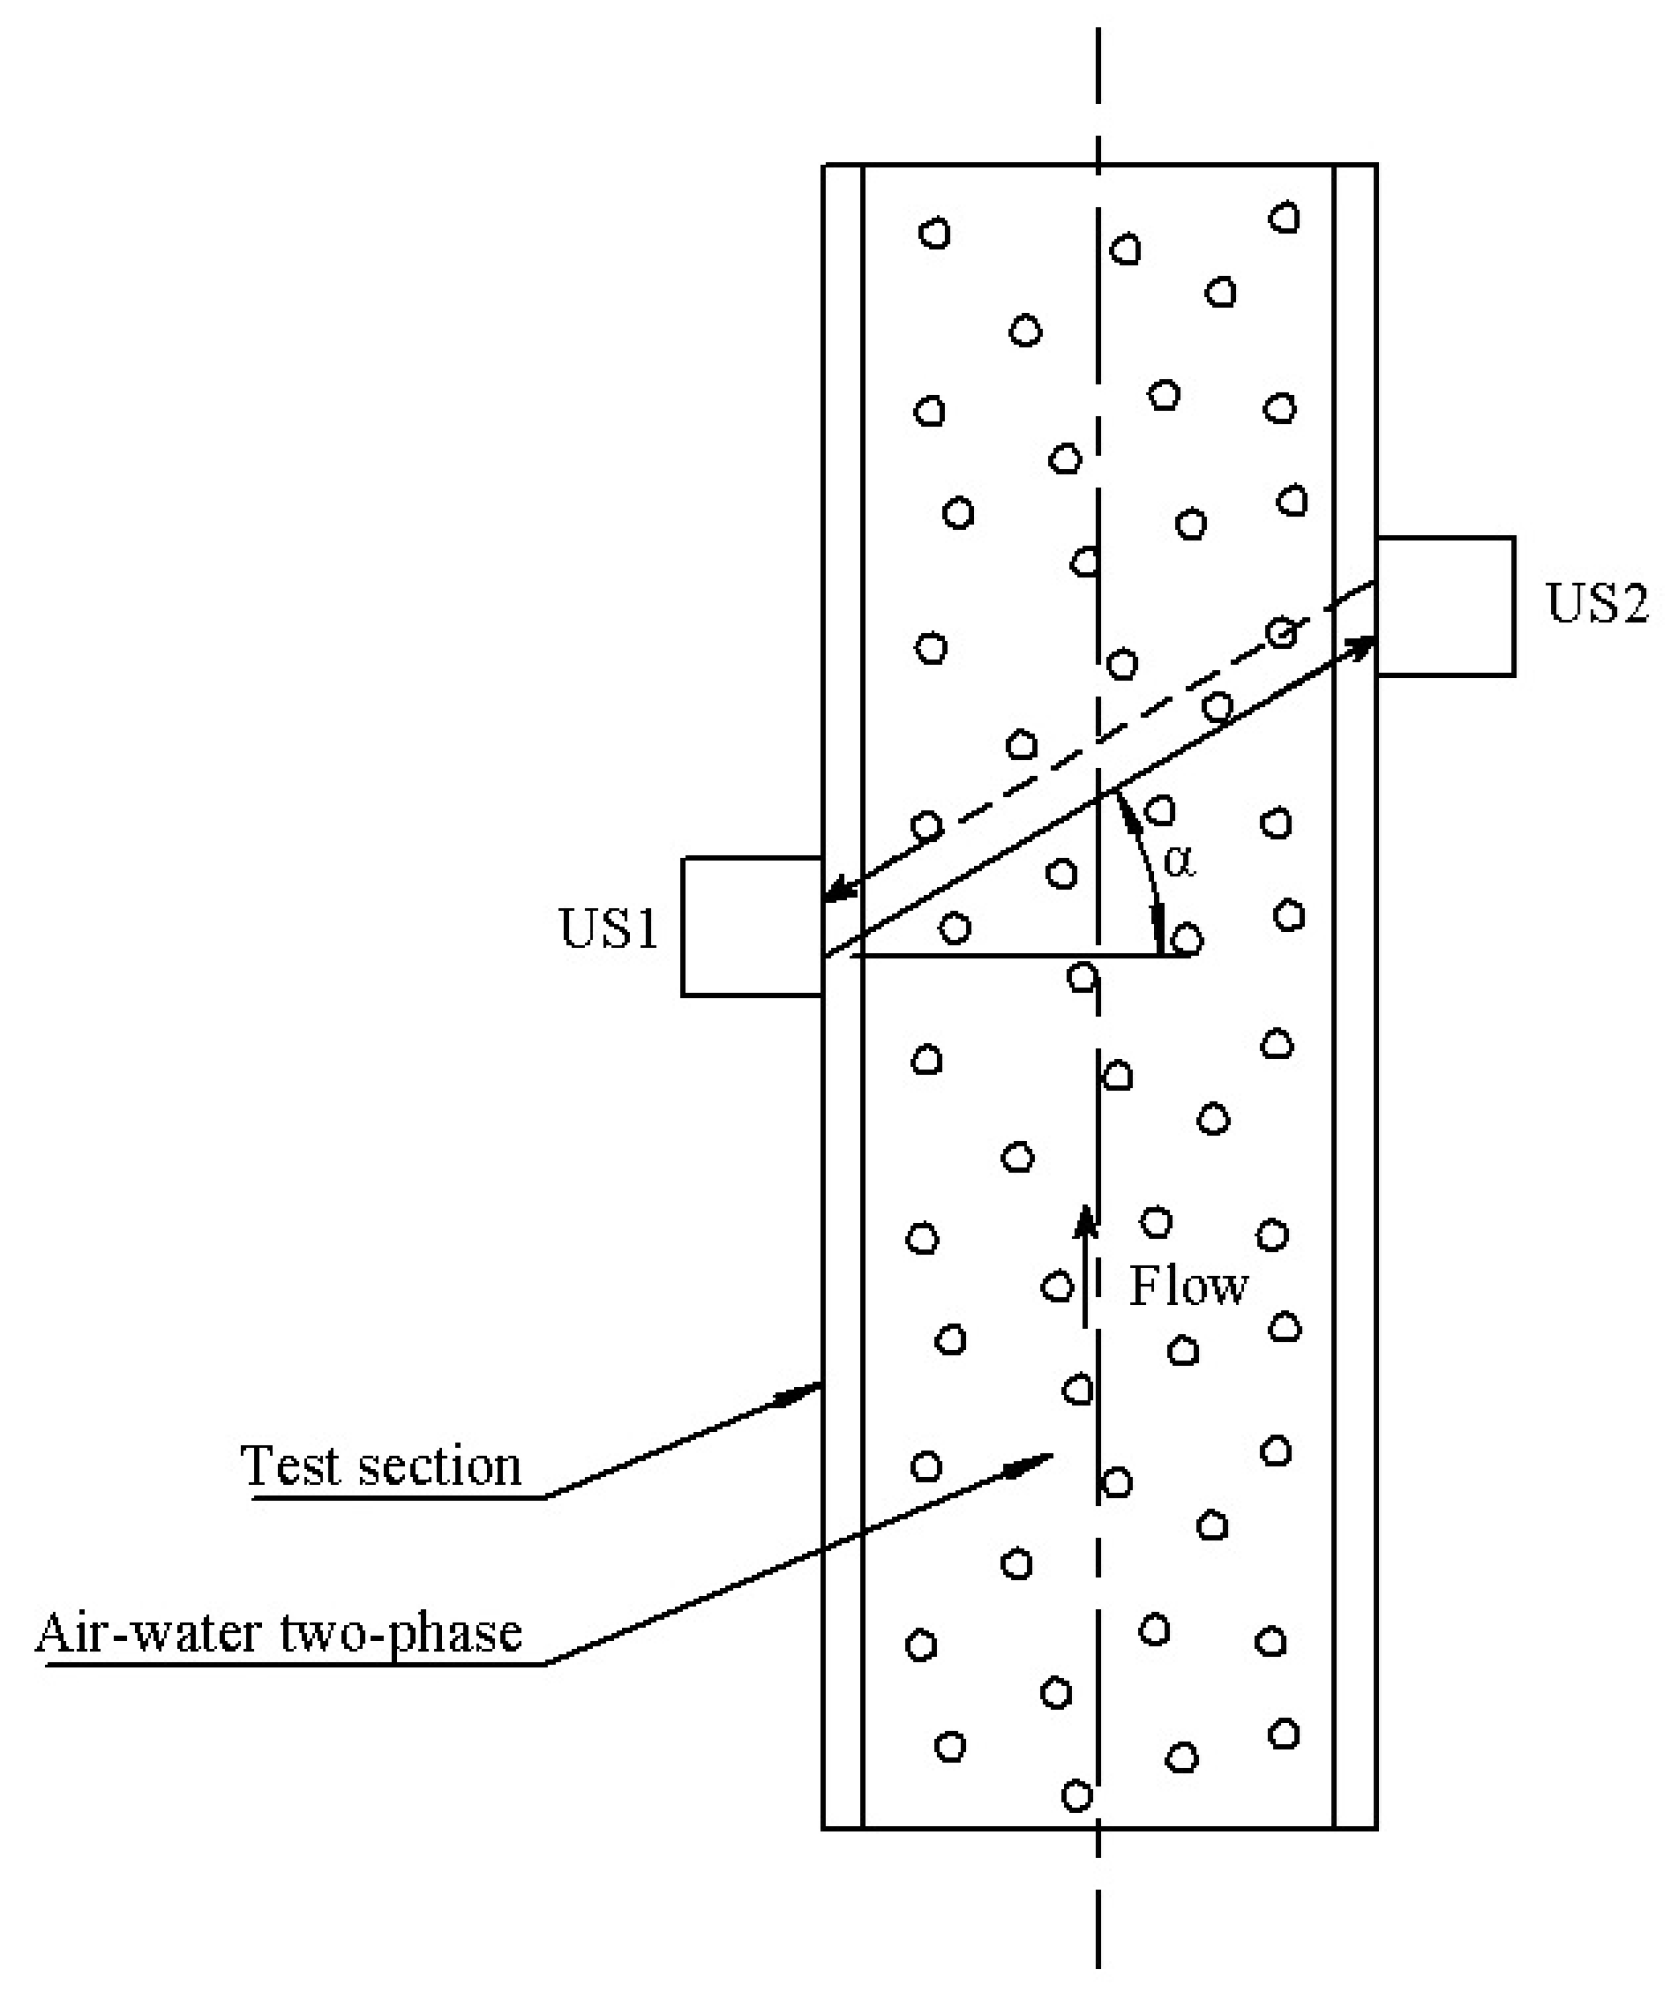
The ultrasonic transit-time method consists of measuring the difference in the transit times of an ultrasonic wave through a flowing two-phase mixture. An ultrasonic wave is sent in two directions: downstream and upstream. The difference in the time of transit of the ultrasonic wave through the mixture allows for the calculation of the flow rate and the number and size of air bubbles. Figure 22 shows a diagram of a measurement method exploiting an ultrasonic flowmeter using the transit-time method [24].
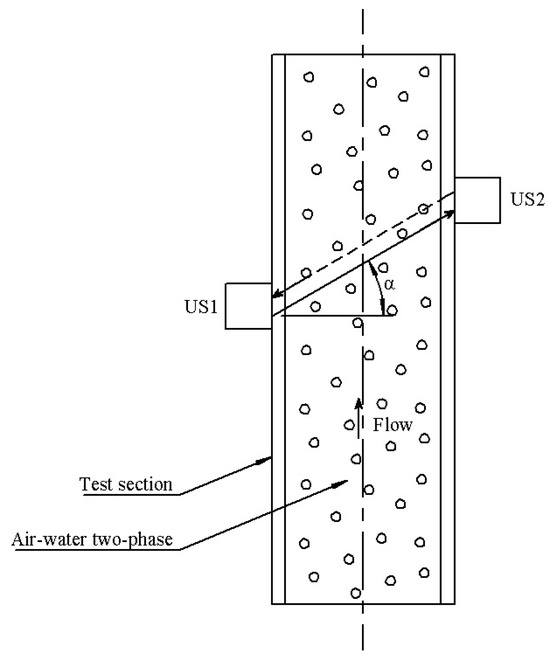
Figure 22.
A diagram of a measurement method exploiting an ultrasonic flowmeter using the transit-time method [24].
The advantage of this method is the ability to measure the size and number of air bubbles, the degree of filling, and the flow rate. The disadvantages of this method are the following:
- -
- Complicated construction of the measuring system;
- -
- Complicated data processing.
This method does not fulfill any of the criteria, and it should not be taken into account when selecting a research method for the air content in oil, especially when selecting the best research method.
2.7. Radiation Methods
Radiation methods are used to determine the air content in a liquid. These methods may include the following:
- (1)
- X-ray radiation (X-ray radiography);
- (2)
- Gamma radiation;
- (3)
- Neutron radiation.
2.7.1. X-ray Radiation
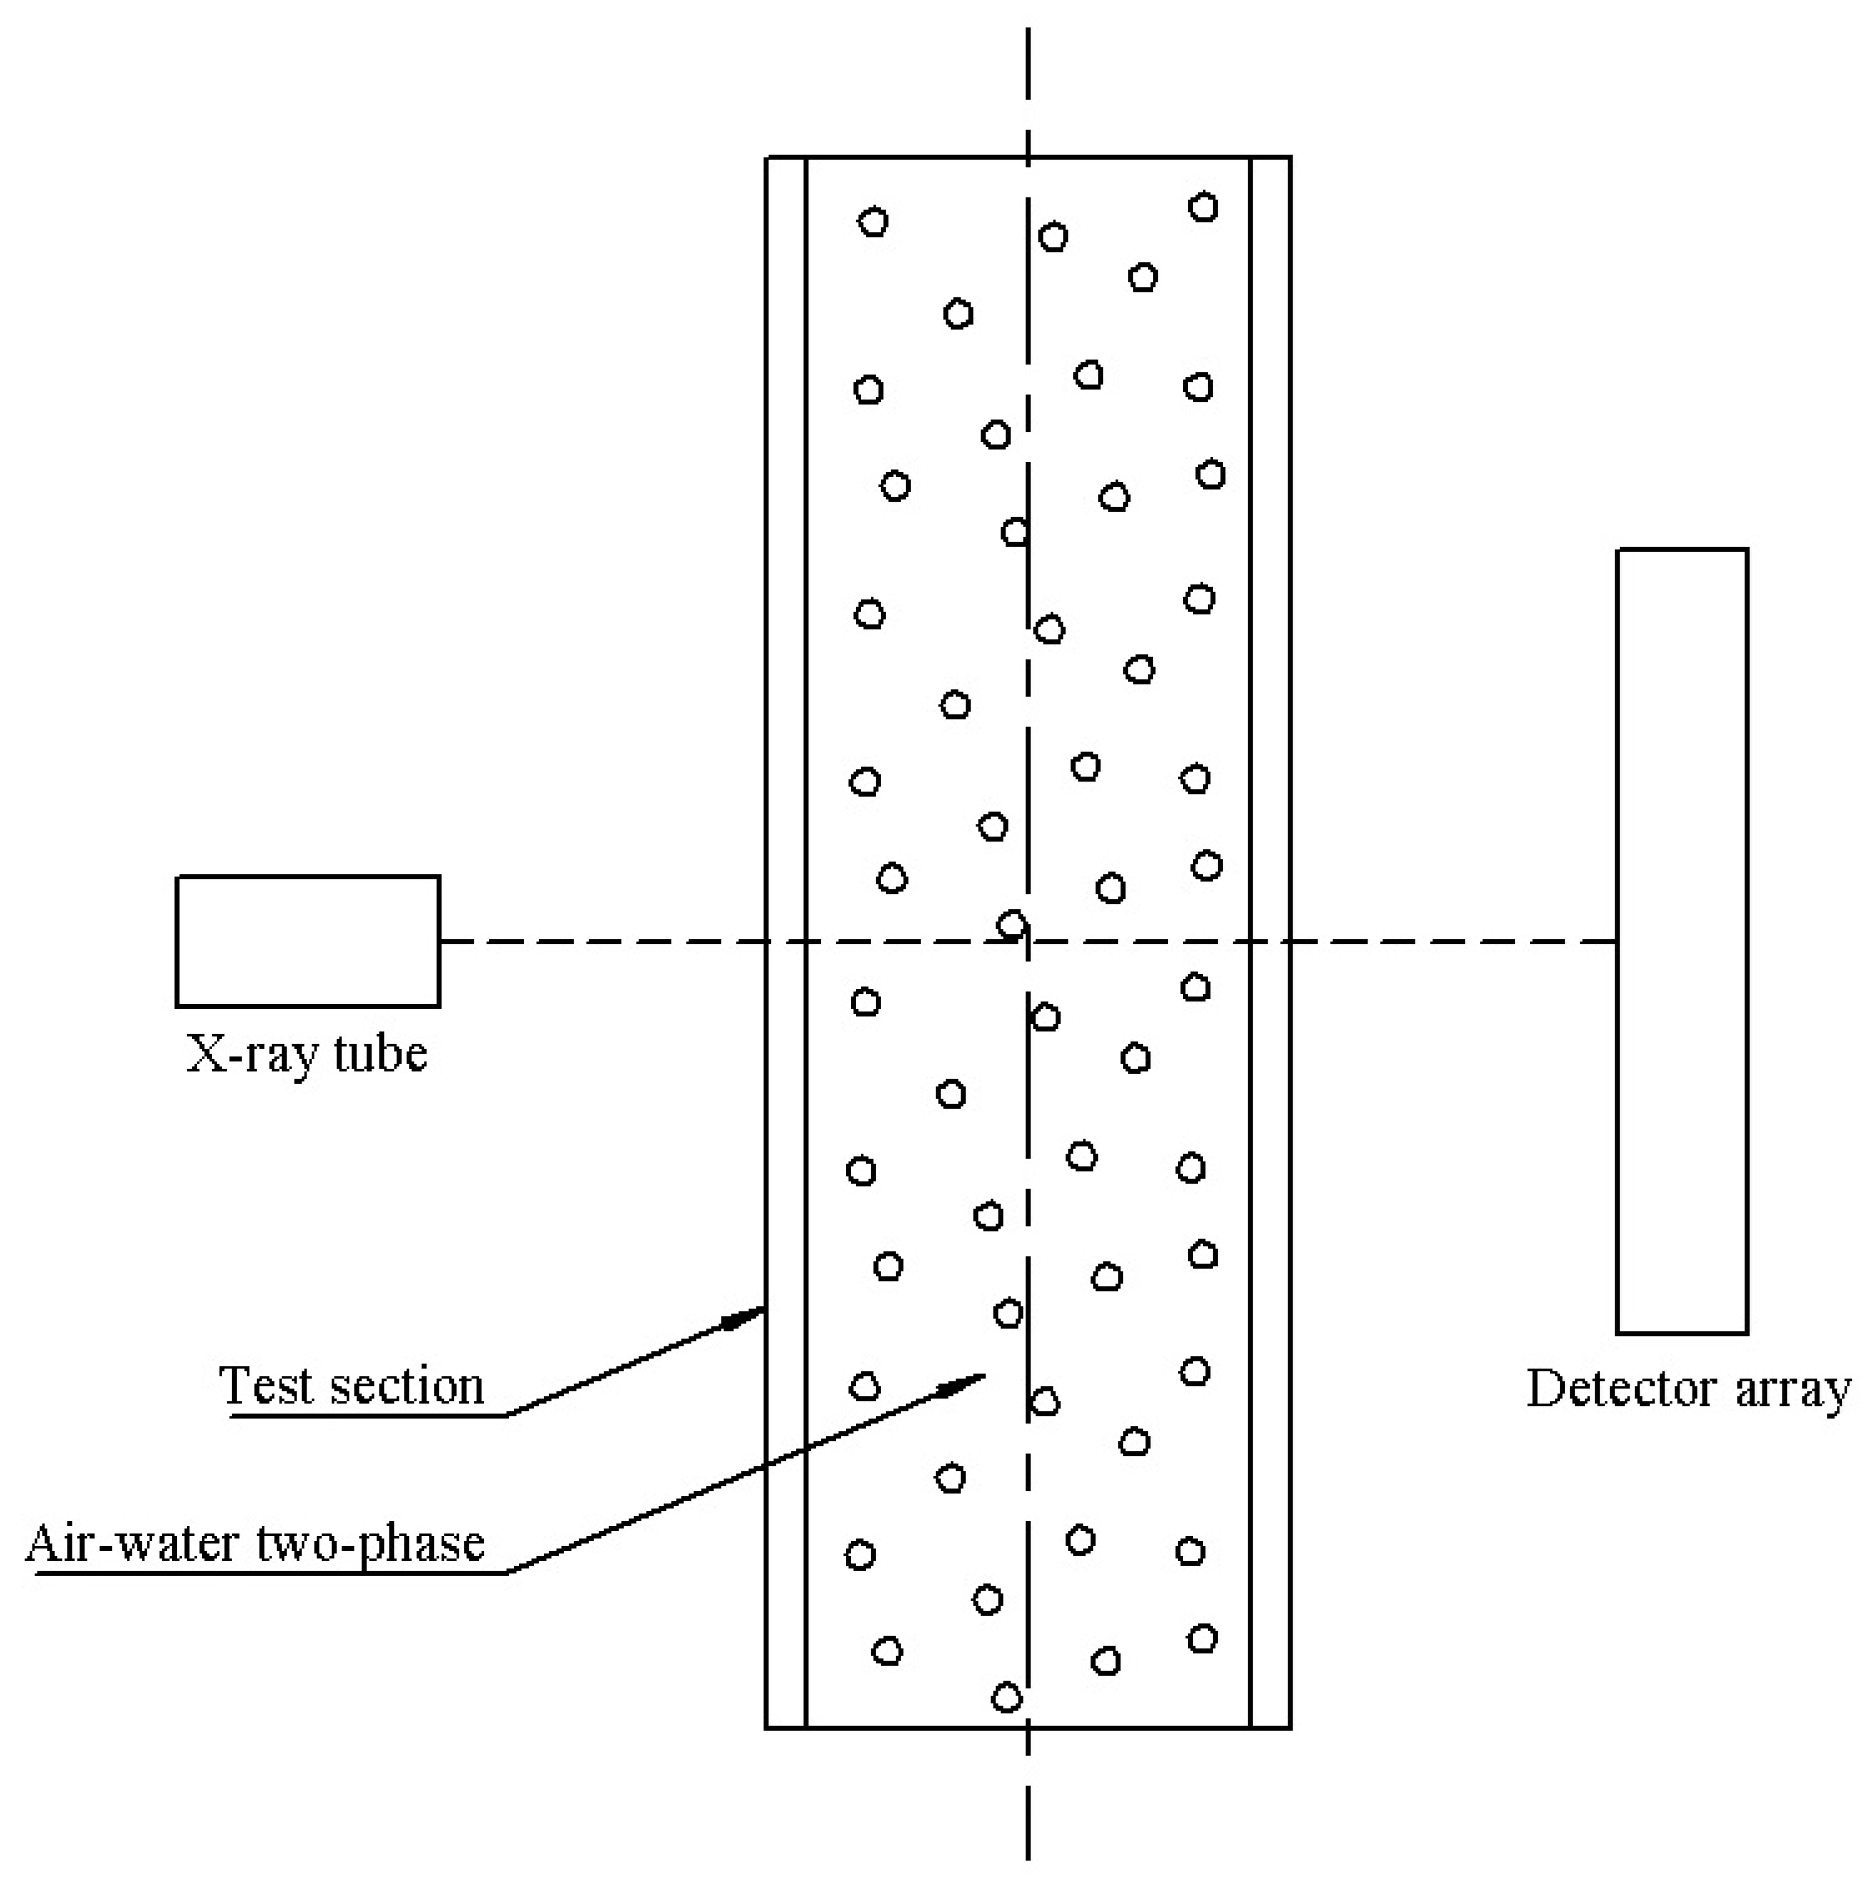
Methods based on X-ray radiation use the phenomenon of attenuating X-ray radiation penetrating the object under study. X-rays emitted by the source passing through the medium under study are attenuated in proportion to the density of the medium and then reach the detector. When testing a two-phase mixture of a liquid and a gas, the liquid, which has a much higher density, will attenuate the radiation more strongly than the gas. Figure 23 shows a diagram of the use of the X-ray radiation method [25].
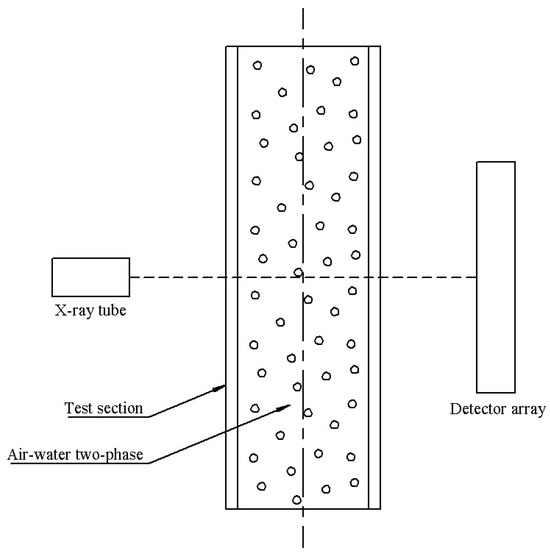
Figure 23.
A diagram of the use of the X-ray radiation method [25].
The advantage of this method is the possibility of measuring the size and number of air bubbles, the degree of filling, and the nature of the flow in a two-phase flow. The disadvantages of this method are the following:
- -
- Very complicated construction of the measurement system;
- -
- Risk of irradiation;
- -
- Complicated data processing;
- -
- Irradiation of the object under study.
This method does not fulfill any of the criteria, and it should not be taken into account when selecting a research method for the air content in oil, especially when selecting the best research method.
2.7.2. Gamma Radiation
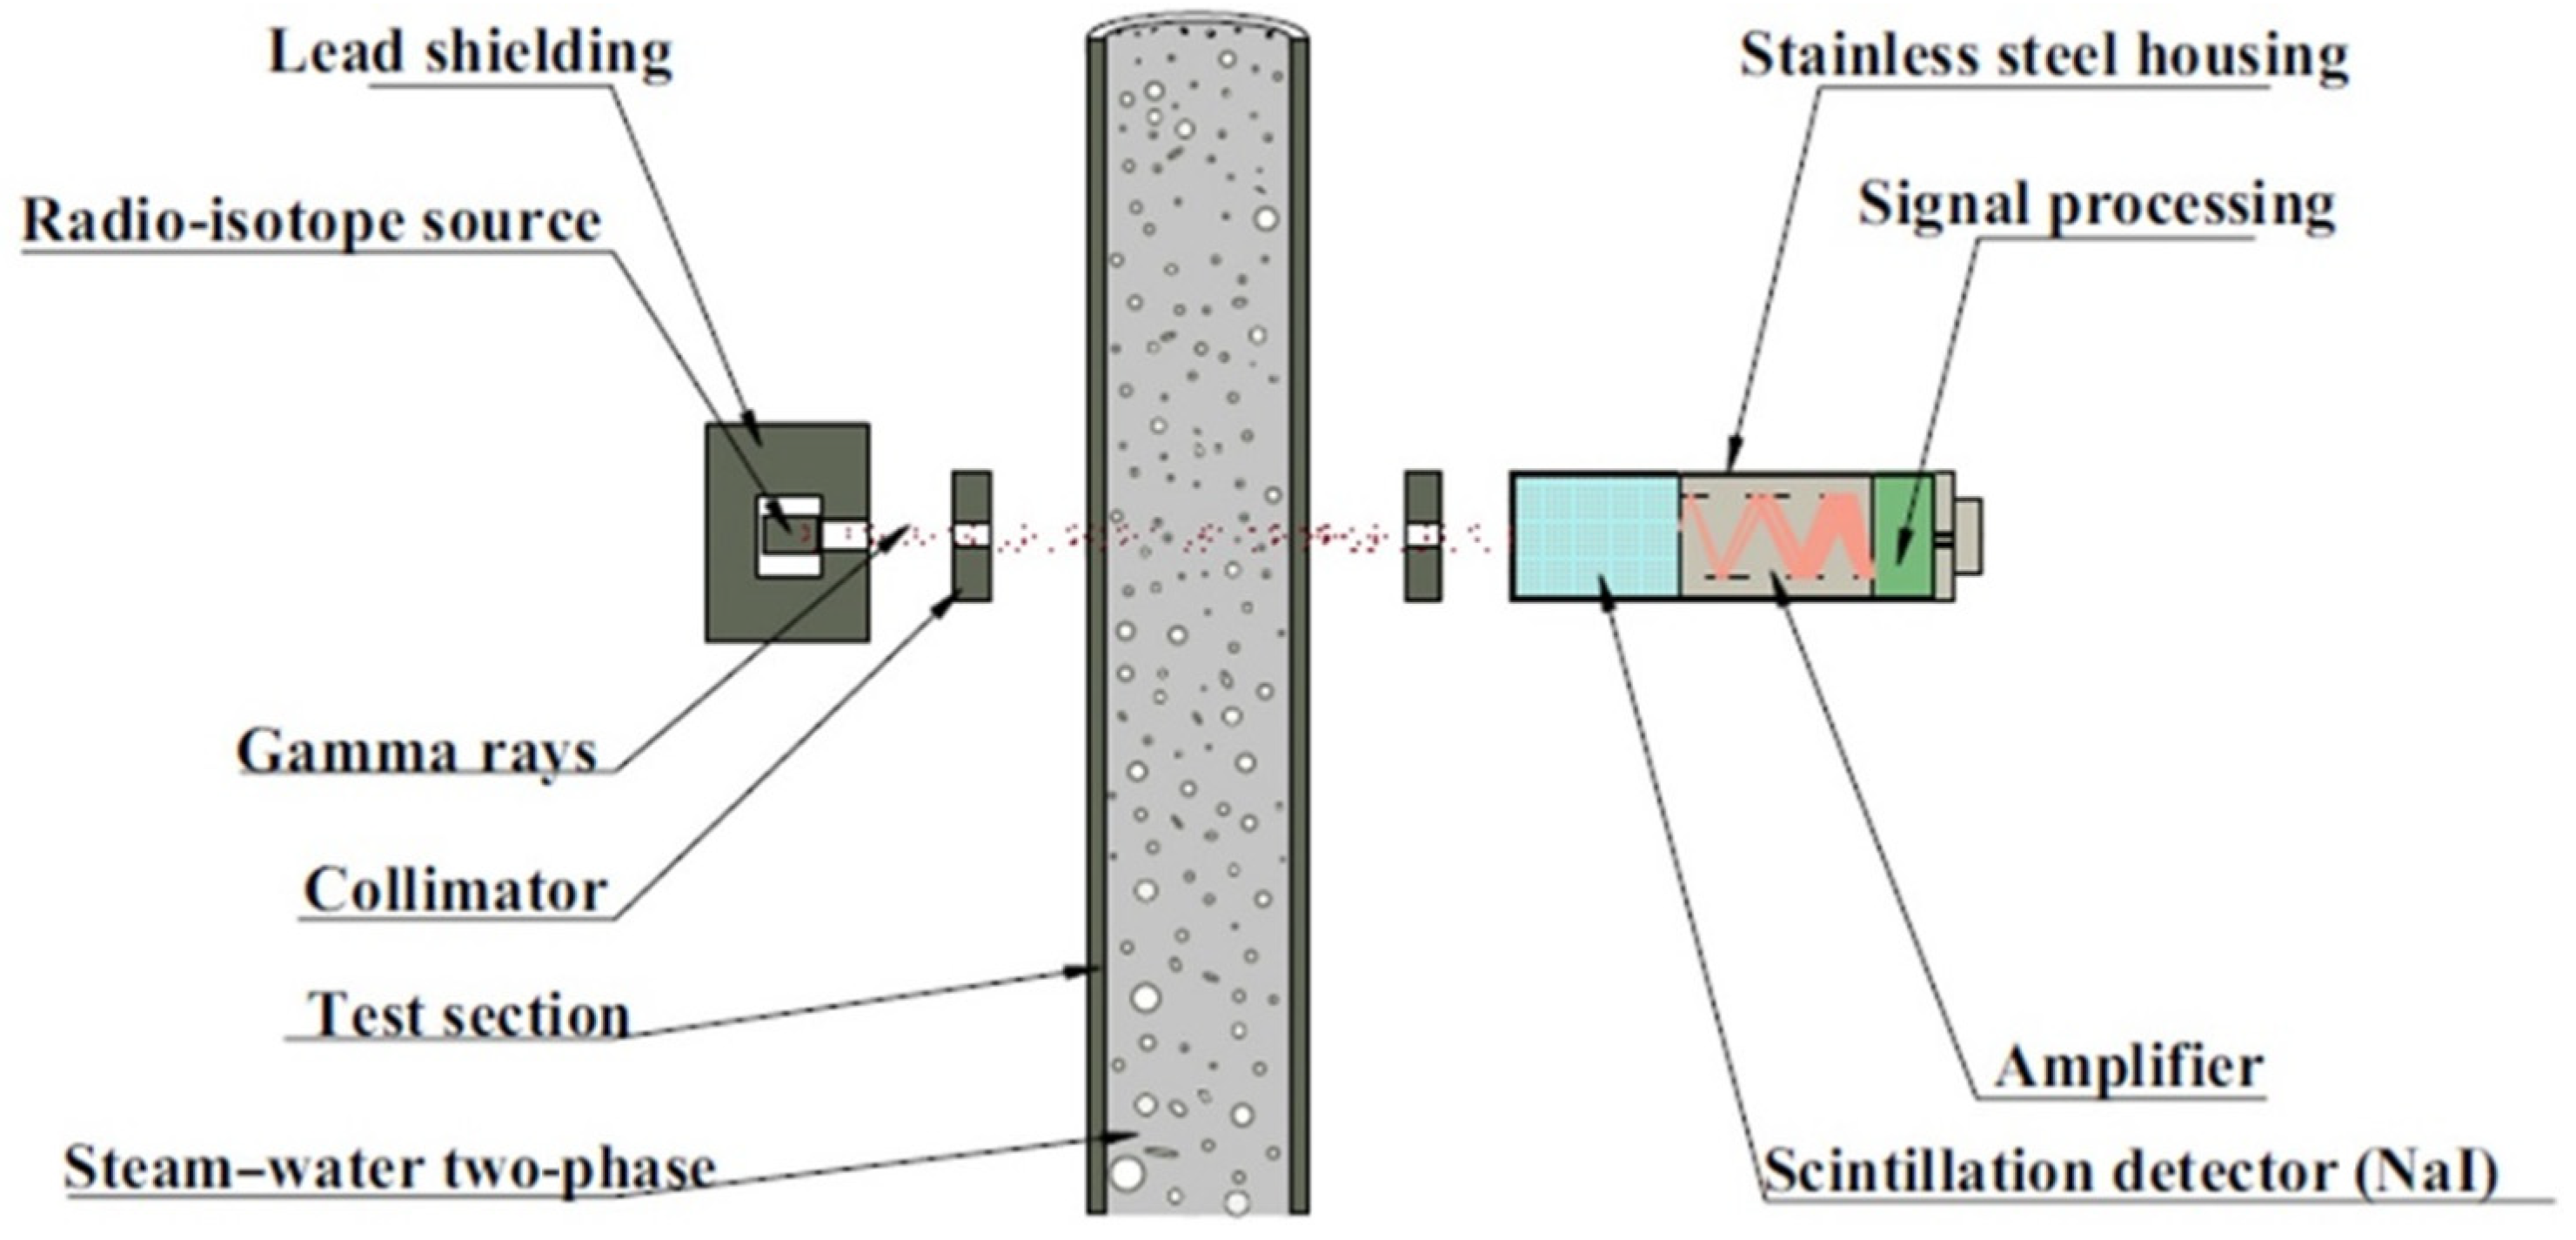
Methods based on gamma radiation use the phenomenon of attenuating gamma radiation penetrating the object under study. Gamma radiation emitted by the source while passing through the medium under study is attenuated in proportion to the density of the medium and then reaches the detector. When testing a two-phase mixture of a liquid and a gas, the liquid, which has a much higher density, will attenuate the radiation more strongly than the gas. Figure 24 presents a diagram of the use of the gamma radiation method [4,26].
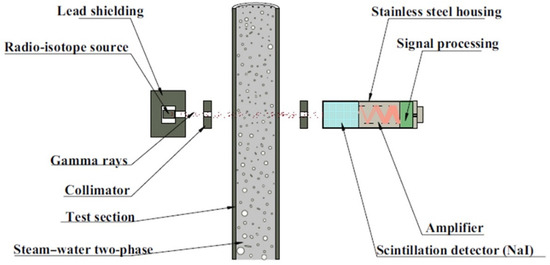
Figure 24.
A diagram of the use of the gamma radiation method [4,26].
The advantage of this method is the possibility of measuring the size and number of air bubbles, the degree of filling, and the nature of the flow in a two-phase flow. The disadvantages of this method are the following:
- -
- Very complicated construction of the measurement system;
- -
- Risk of irradiation;
- -
- Complicated data processing;
- -
- Irradiation of the object under study.
This method does not fulfill any of the criteria, and it should not be taken into account when selecting a research method for the air content in oil, especially when selecting the best research method.
2.7.3. Neutron Radiation
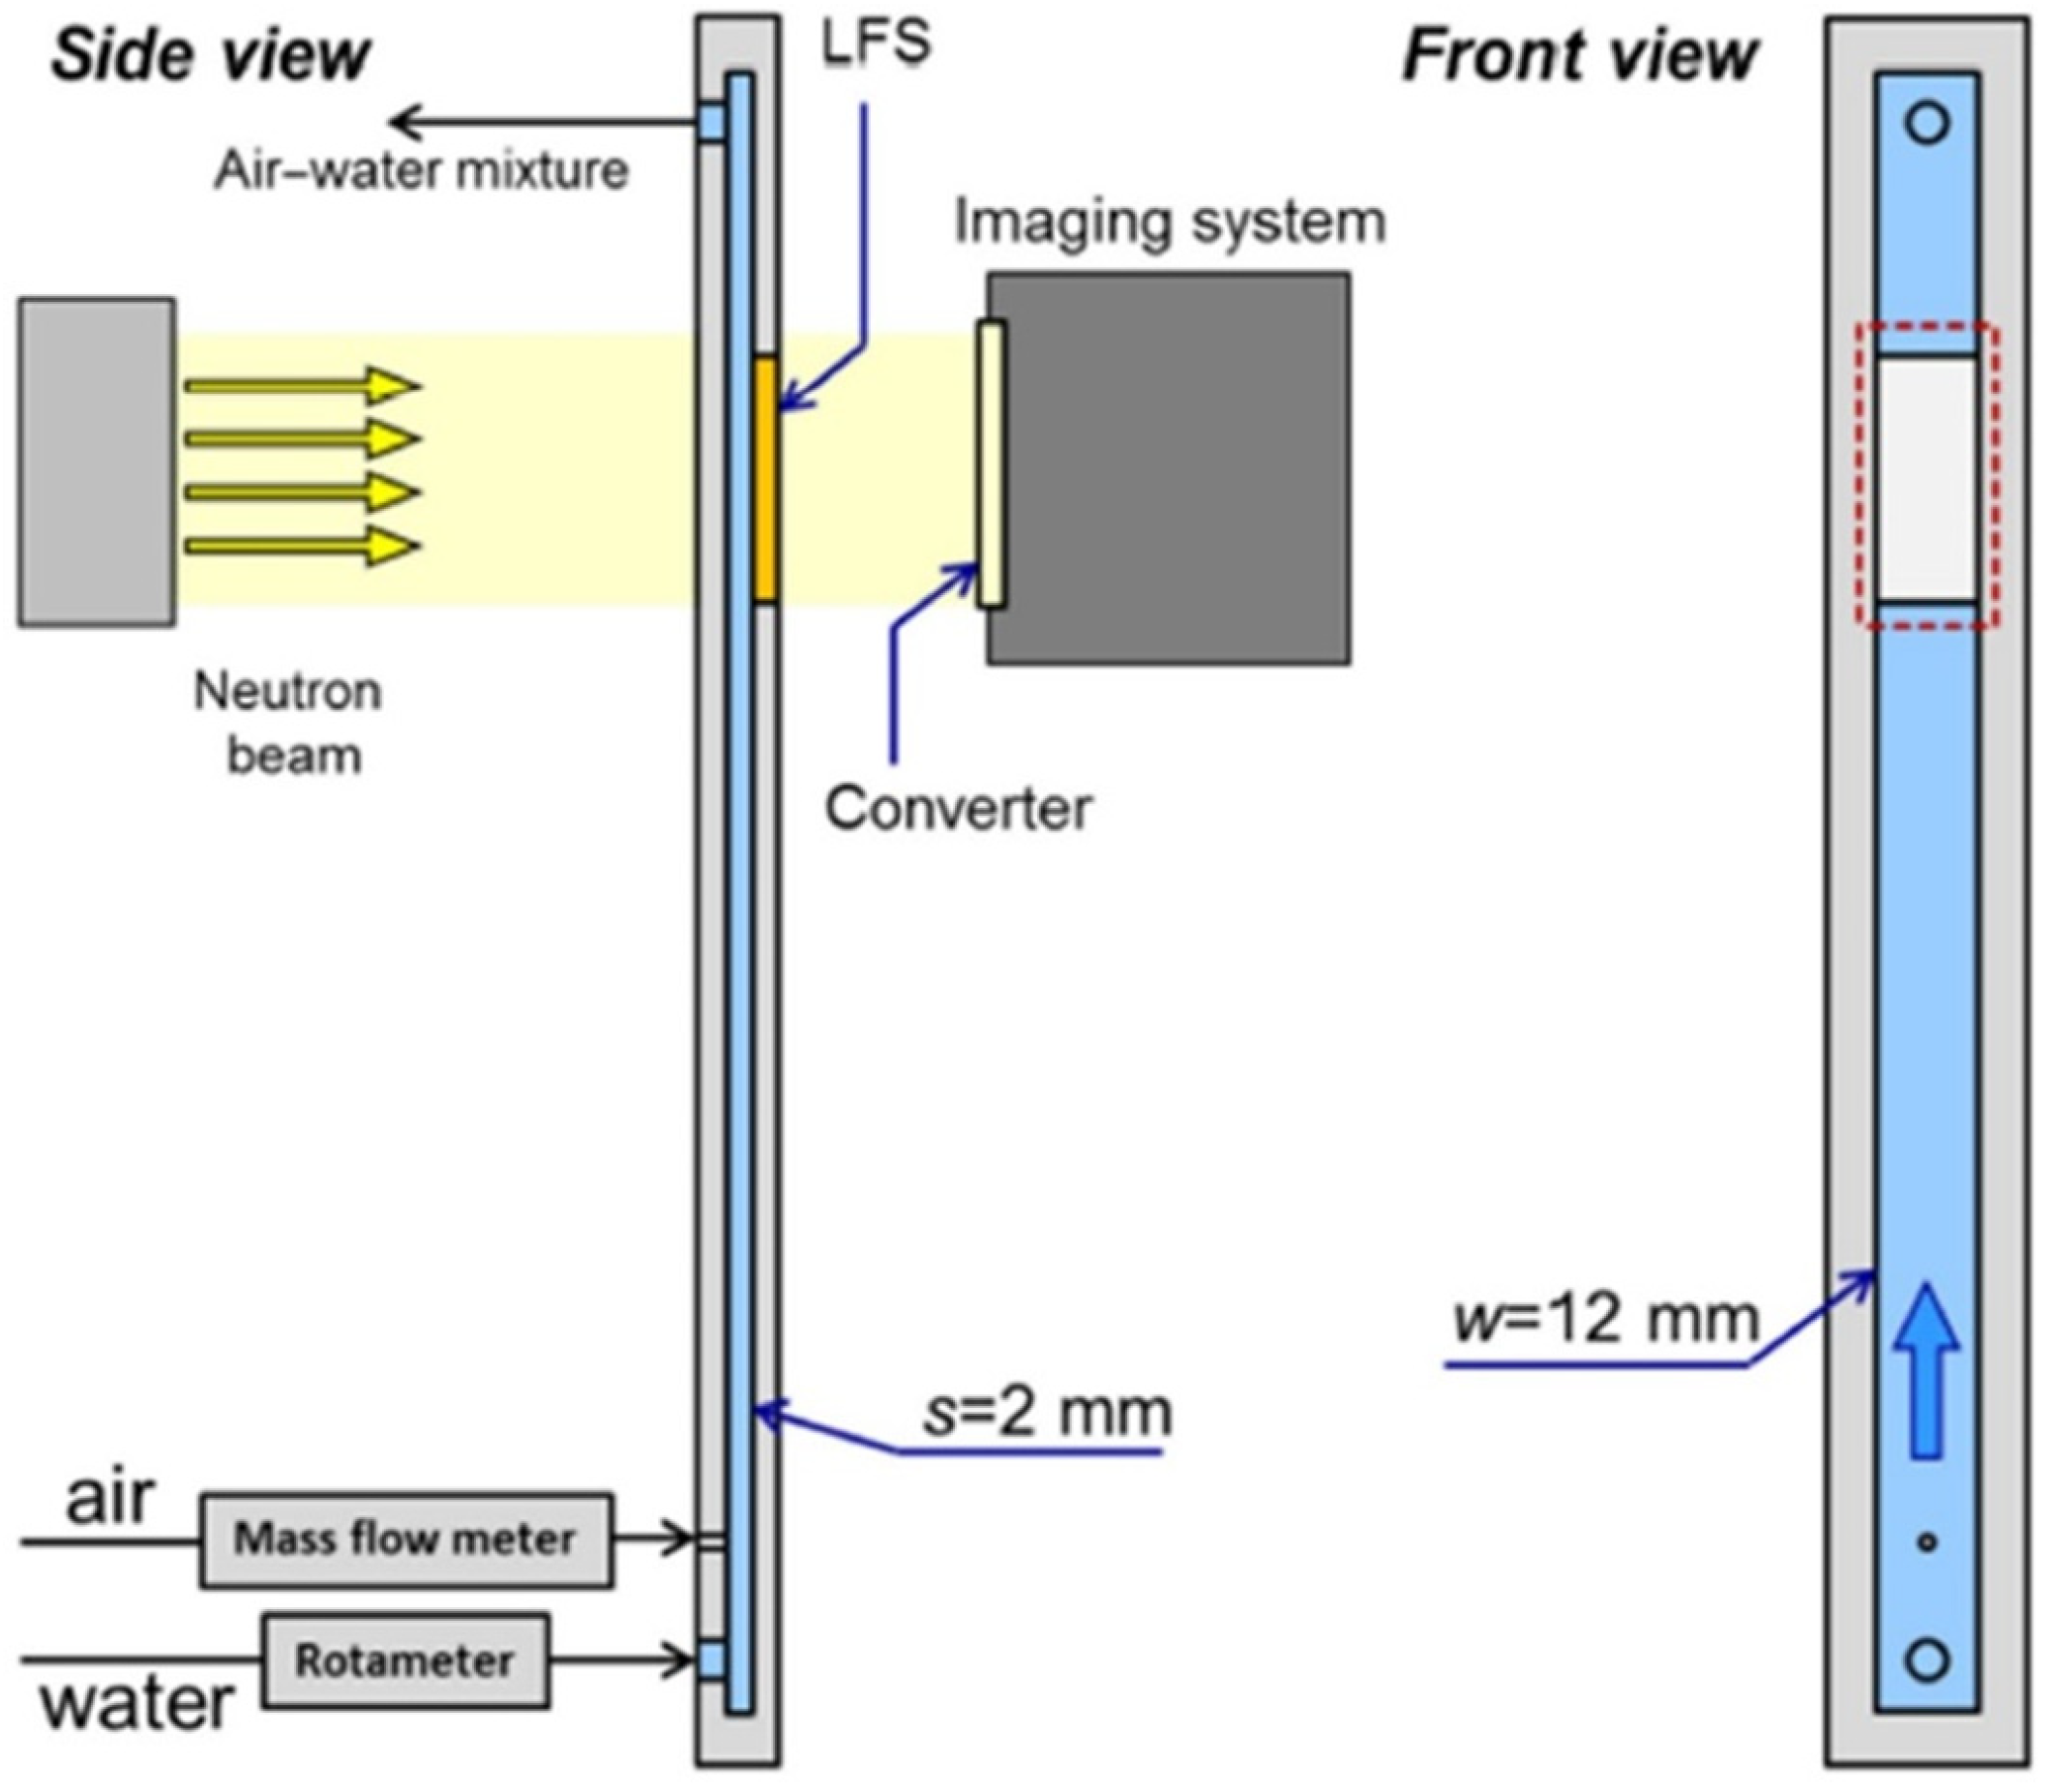
Methods based on neutron radiation use the phenomenon of the absorption thereof by the atoms of the object under study. The neutron radiation emitted by the source while passing through the medium under study is attenuated and then reaches the detector. When testing a two-phase mixture of a liquid and a gas, the liquid, which has a much higher density of atoms, will attenuate the radiation more strongly than the gas. Figure 25 presents a diagram of the use of the neutron radiation method [4,27].
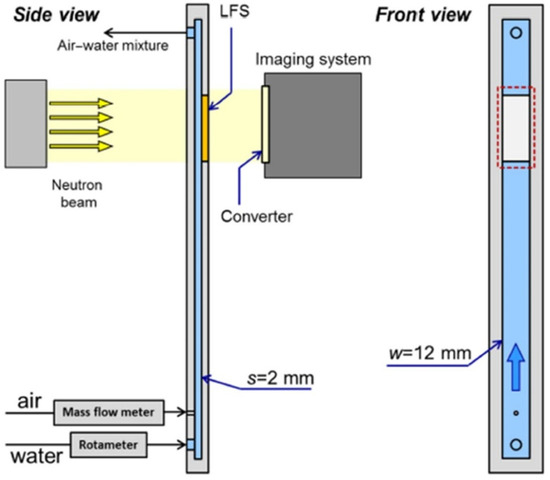
Figure 25.
A diagram of the use of the neutron radiation method [4,27].
The advantage of this method is the possibility of measuring the size and number of air bubbles, the degree of filling, and the nature of the flow in a two-phase flow. The disadvantages of this method are the following:
- -
- Very complicated construction of the measurement system;
- -
- Risk of irradiation;
- -
- Complicated data processing;
- -
- Irradiation of the object under study.
This method does not fulfill any of the criteria, and it should not be taken into account when selecting a research method for the air content in oil, especially when selecting the best research method.
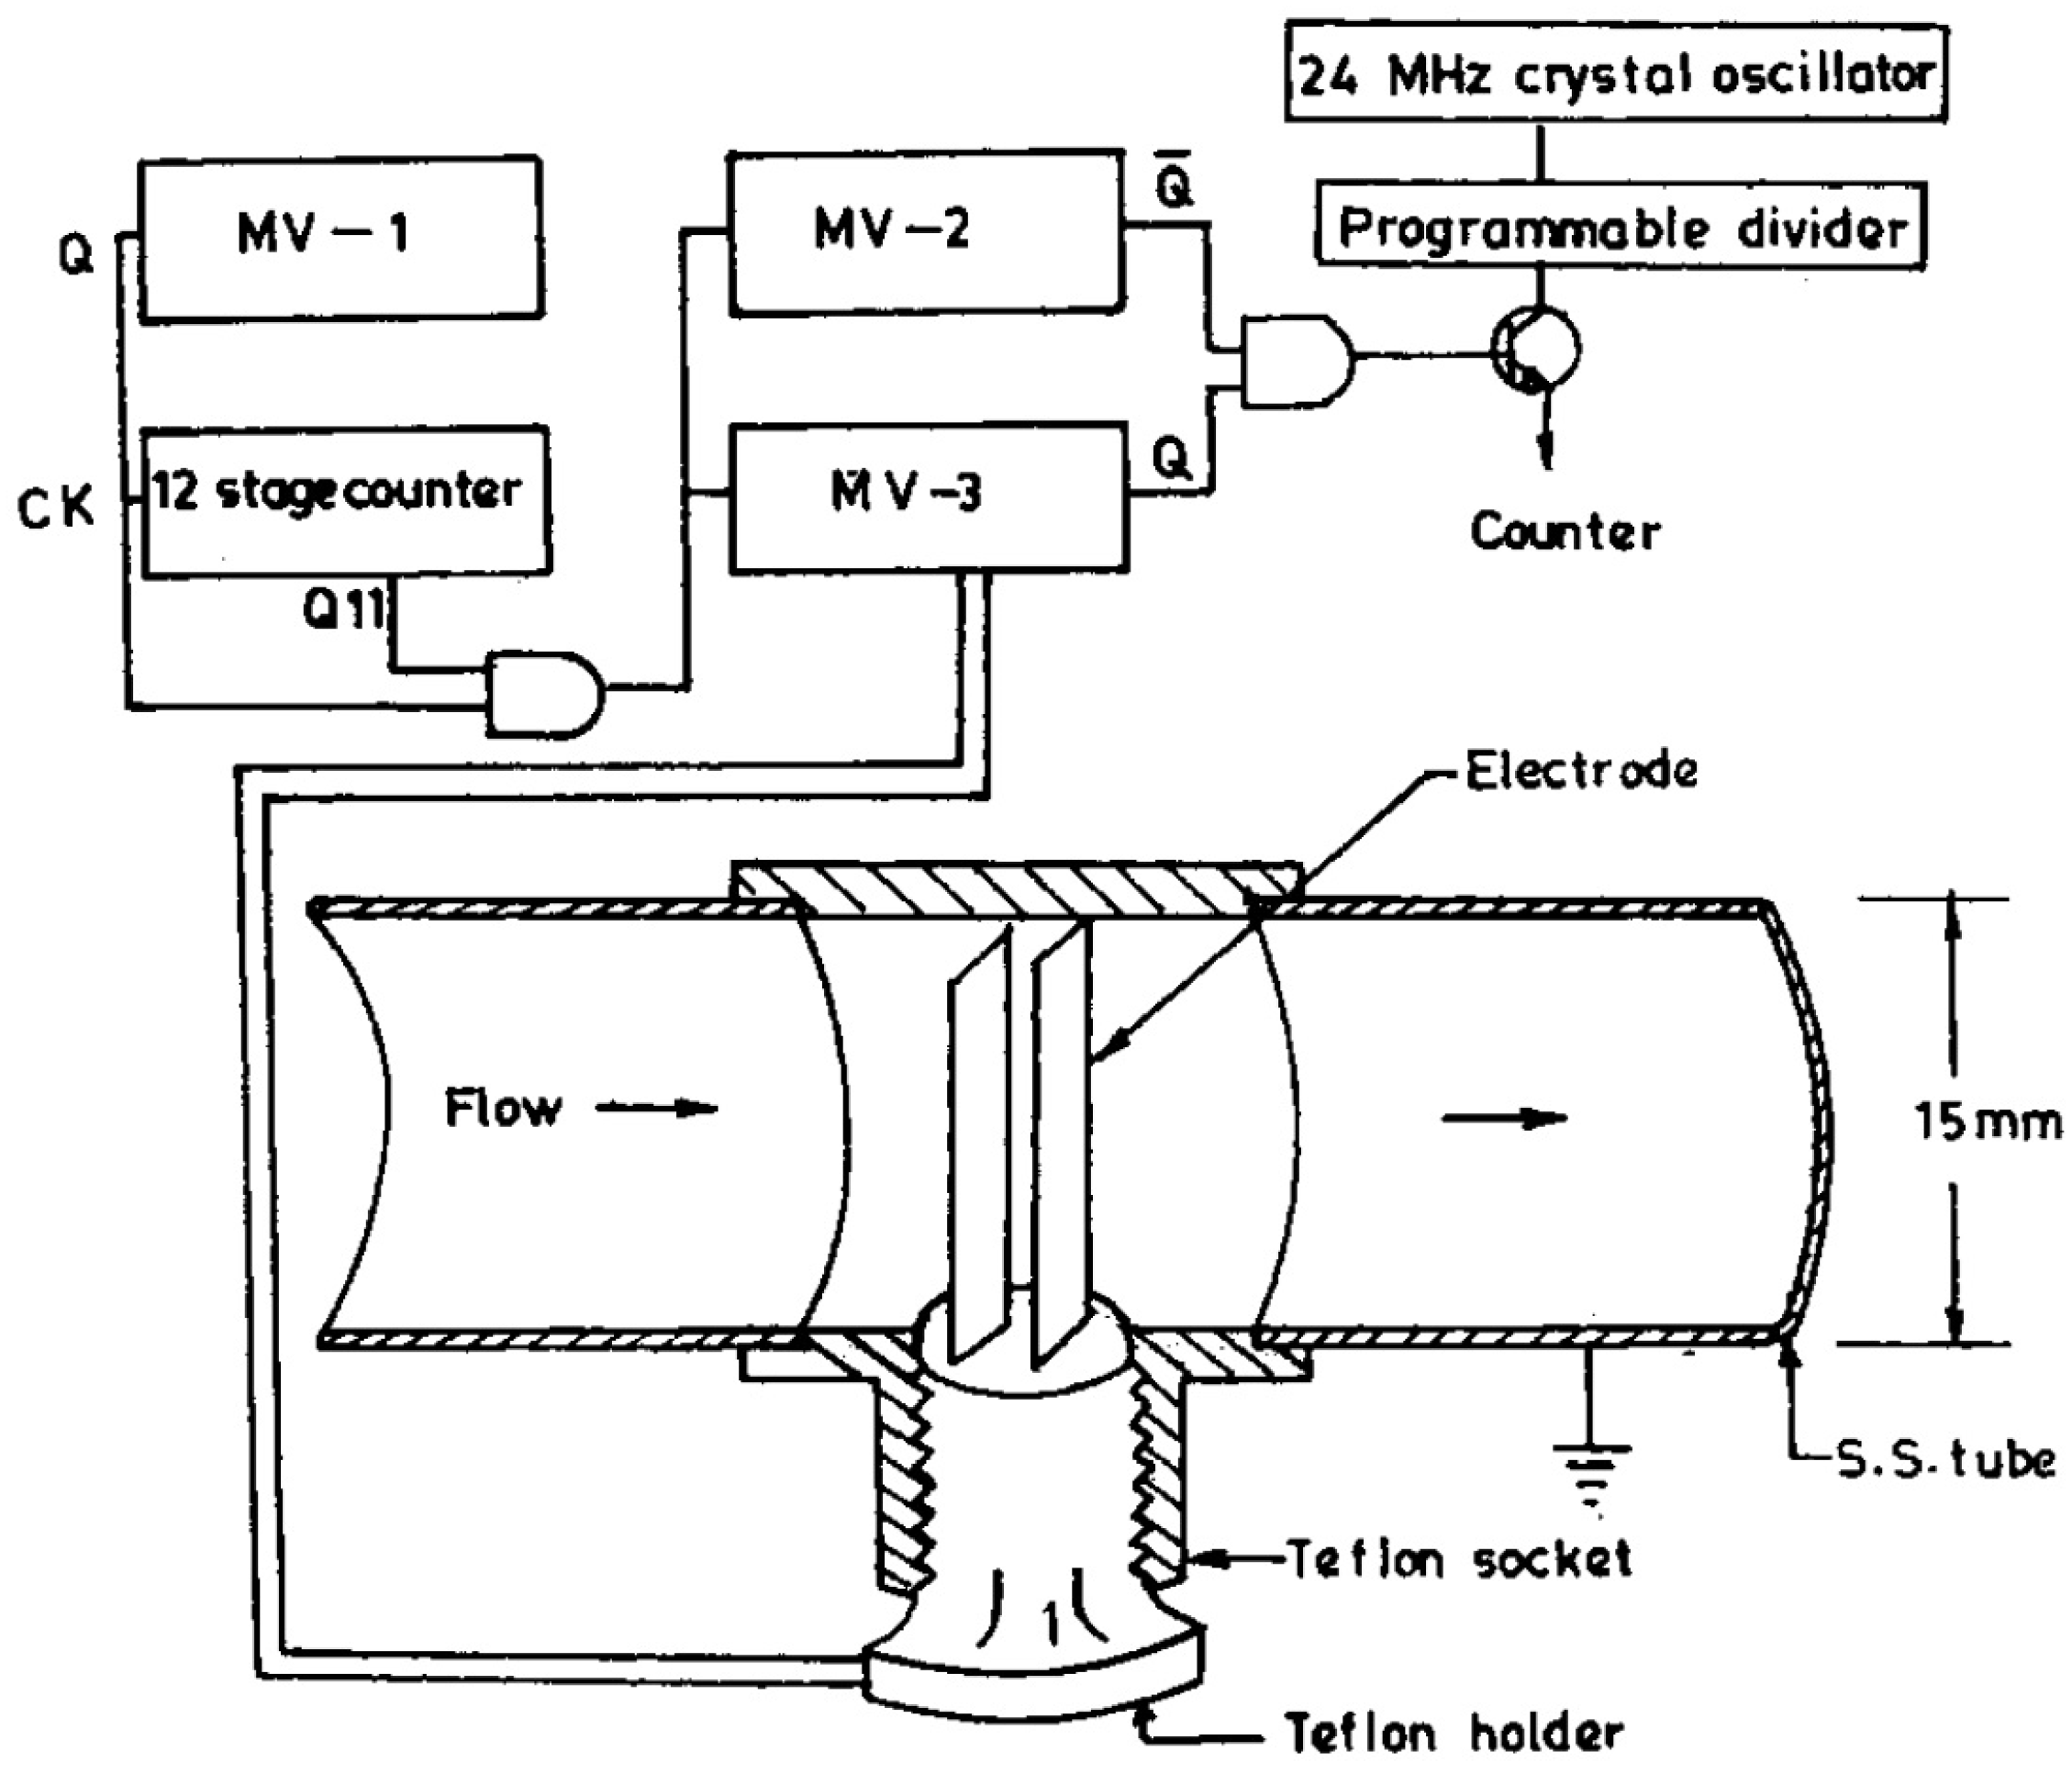
2.8. Fiber-Optic Methods
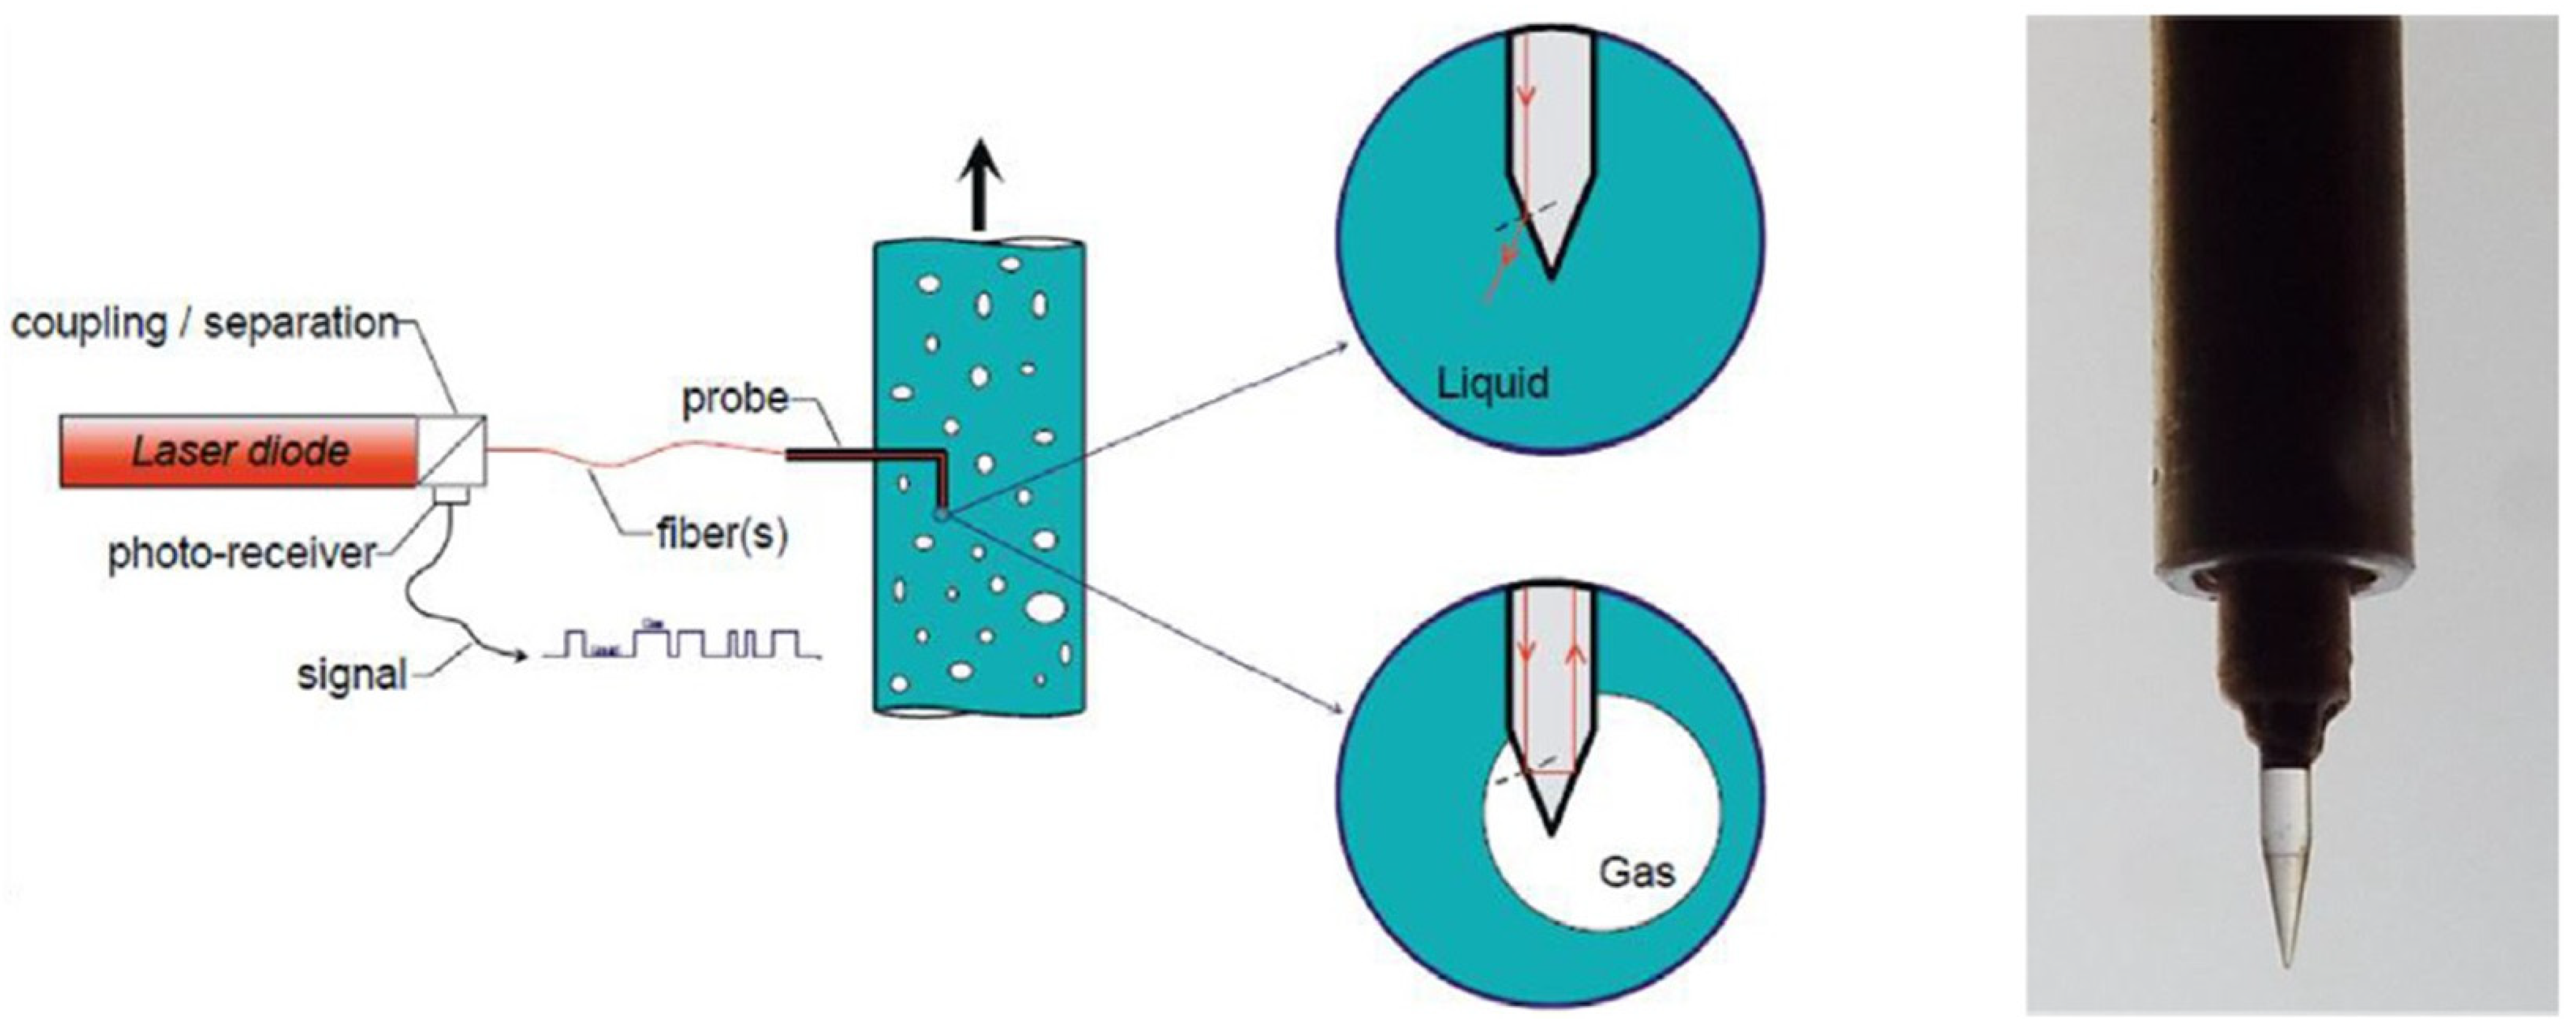
The fiber-optic method consists of measuring reflected light in an optical probe, the tip of which is placed in a measuring tube through which a two-phase mixture flows. The light flowing through the optical fiber reaches the end of the probe, which has the shape of a sharp cone. If the end of the probe comes into contact with a liquid, then, due to light refraction at the liquid–probe border, light is emitted from the optical fiber. If the end of the probe comes into contact with a gas, the light is reflected internally and returns through the optical fiber to the detector. Based on the analysis of signals from the optical probe, the local fill coefficient, bubble size, and flow velocity can be determined. Figure 26 presents a diagram of the use of the fiber-optic method [4,28].
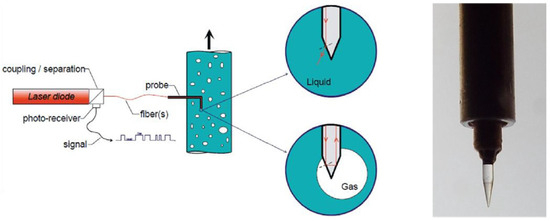
Figure 26.
A diagram of the use of the fiber-optic method [4,28].
The advantages of the optical method are its simple design and the ability to measure the size and number of air bubbles. The disadvantages of this method are the following:
- -
- Local measurement;
- -
- Complicated data processing.
This method does not fulfill any of the criteria, and it should not be taken into account when selecting a research method for the air content in oil, especially when selecting the best research method.
2.9. Summary of the Measurement Methods
The analysis of the available methods for the measurement of the undissolved air content in oil carried out in this study indicated that the most promising methods are the following: the classic trapping method, modified trapping method, trapping method using hydrostatic pressure loss, photographic method, holography, and light scattering.
However, the methods that were rejected were the following: the pressure loss due to frictional flow resistance, the pressure loss with a rapid increase in diameter, the pressure drop in a Venturi tube, the pressure drop in an orifice, methods using the Coriolis effect, the electrical resistance method, the electrical conductivity method, the electromagnetic method, the electrical capacitance method, the thermal anemometry method, the liquid–solid contact electrification method, sound dispersion, the ultrasonic transit-time method, X-ray radiation, gamma radiation, neutron radiation, and the fiber-optic method.
3. Conclusions
The methods for the measurement of the amount of undissolved air in oil presented in this study constitute the main set of methods used for measurement. Depending on individual needs, the choice of method may be different. However, on the basis of the review carried out here, it is worth noting that the best accuracy was demonstrated by the trapping and optical methods. The analysis of these methods allows the development of the ways of conducting measurements in industrial installations and in tests in future research.
Author Contributions
C.E.: Conceptualization, methodology, data curation, formal analysis, investigation, resources, software, validation, visualization, and writing—original draft; P.Ś.: supervision, conceptualization, and writing—review and editing. All authors have read and agreed to the published version of the manuscript.
Funding
This research received no external funding.
Data Availability Statement
The data presented in this study are available on request from the corresponding author due to privacy, legal, ethical and trade secret reasons.
Acknowledgments
Our gratitude goes to Rockfin S.A. (Rockfin PLC) (ul. Pałacowa 9, Małkowo, 83-330 Żukowo, Poland).
Conflicts of Interest
The authors declare no conflicts of interest.
References
- API 614. 6th Edition. Lubrication, Shaft-Sealing, and Oil-Control Systems and Auxiliaries. 2022. Available online: https://www.apiwebstore.org/standards/614 (accessed on 30 June 2024).
- ISO 10438-1:2007; Petroleum, Petrochemical and Natural Gas Industries—Lubrication, Shaft-Sealing and Control-Oil Systems and Auxiliaries—Part 1: General Requirements. ISO: Geneva, Switzerland, 2007.
- Chmiel, P.; Edling, C. Lube Oil Unit; Project: 1104-15-01; Rockfin S.A. (Rockfin PLC): Żukowo, Poland, 2019. [Google Scholar]
- Dutkowski, K. Metody Pomiaru Zawartości Powietrza Nierozpuszczonego w Olejach Hydraulicznych (Methods for Measuring the Content of Undissolved Air in Hydraulic Oils); Developed on Commission of Rockfin S.A. (Rockfin PLC): Koszalin, Poland, 2017. [Google Scholar]
- Kockum, H.; Jernqvist, Å. Boiling vertical two-phase flow at sub-atmospheric pressures. Int. J. Heat Mass Transf. 1998, 41, 2909–2924. [Google Scholar] [CrossRef]
- Chien, K.; Chen, T.; Pei, B.; Lin, W. Void fraction measurement by using the side-tube method. Flow Meas. Instrum. 1997, 8, 103–112. [Google Scholar] [CrossRef]
- Kanizawa, F.T.; Ribatski, G. Void fraction and pressure drop during external upward two-phase crossflow in tube bundles—Part I: Experimental investigation. Int. J. Heat Fluid Flow 2017, 65, 200–209. [Google Scholar] [CrossRef]
- Ahmed, W.H.; Ching, C.Y.; Shoukri, M. Pressure recovery of two-phase flow across sudden expansions. Int. J. Multiph. Flow 2007, 33, 575–594. [Google Scholar] [CrossRef]
- Monni, G.; De Salve, M.; Panella, B. Two-phase flow measurements at high void fraction by a Venturi meter. Prog. Nucl. Energy 2014, 77, 167–175. [Google Scholar] [CrossRef]
- Alimonti, C.; Falcone, G.; Bello, O. Two-phase flow characteristics in multiple orifice valves. Exp. Therm. Fluid Sci. 2010, 34, 1324–1333. [Google Scholar] [CrossRef]
- Endress+Hauser. Available online: https://www.endress.com/en/press-center/news-and-press-releases/promass-q-news (accessed on 27 January 2024).
- Cheng, H.; Hills, J.; Azzopardi, B. Effects of initial bubble size on flow pattern transition in a 28.9 mm diameter column. Int. J. Multiph. Flow 2002, 28, 1047–1062. [Google Scholar] [CrossRef]
- Kim, J.; Ahn, Y.-C.; Kim, M.H. Measurement of void fraction and bubble speed of slug flow with three-ring conductance probes. Flow Meas. Instrum. 2009, 20, 103–109. [Google Scholar] [CrossRef]
- Prasser, H.-M.; Böttger, A.; Zschau, J. A new electrode-mesh tomograph for gas–liquid flows. Flow Meas. Instrum. 1998, 9, 111–119. [Google Scholar] [CrossRef]
- Da Silva, M.; Thiele, S.; Abdulkareem, L.; Azzopardi, B.; Hampel, U. High-resolution gas–oil two-phase flow visualization with a capacitance wire-mesh sensor. Flow Meas. Instrum. 2010, 21, 191–197. [Google Scholar] [CrossRef]
- Cha, J.-E.; Ahn, Y.-C.; Kim, M.-H. Flow measurement with an electromagnetic flowmeter in two-phase bubbly and slug flow regimes. Flow Meas. Instrum. 2002, 12, 329–339. [Google Scholar] [CrossRef]
- Das, R.; Pattanayak, S. Flow regime identification in cryogenic gas-liquid flow through vertical tubes. Cryogenics 1995, 35, 393–398. [Google Scholar] [CrossRef]
- Benk, H.; Schmidt, T.; Loth, R. Investigations of static and dynamic interactions between bubbles and X-hot-film probes. Meas. Sci. Technol. 2001, 12, 119–130. [Google Scholar] [CrossRef]
- Zhao, J.; Wang, D.; Zhang, F.; Liu, Y.; Chen, B.; Wang, Z.L.; Pan, J.; Larsson, R.; Shi, Y. Real-time and online lubricating oil condition monitoring enabled by triboelectric nanogenerator. ACS Nano 2021, 15, 11869–11879. [Google Scholar] [CrossRef] [PubMed]
- Fu, Y.; Liu, Y. Development of a robust image processing technique for bubbly flow measurement in a narrow rectangular channel. Int. J. Multiph. Flow 2016, 84, 217–228. [Google Scholar] [CrossRef]
- Shao, S.; Li, C.; Hong, J. A hybrid image processing method for measuring 3D bubble distribution using digital inline holography. Chem. Eng. Sci. 2019, 207, 929–941. [Google Scholar] [CrossRef]
- Xiao, Y.; Li, X.; Yang, C.; Shen, J.; Mao, Z.-S. Particle Scattering Photography Approach for Poorly Illuminated Multiphase Reactors. II: Experimental Validation and Optimization. Ind. Eng. Chem. Res. 2018, 57, 8405–8412. [Google Scholar] [CrossRef]
- Wu, X.-J.; Chahine, G.L. Development of an acoustic instrument for bubble size distribution measurement. J. Hydrodyn. 2010, 22 (Suppl. S1), 325–331. [Google Scholar] [CrossRef]
- Piechota, P.; Synowiec, P.; Andruszkiewicz, A.; Wędrychowicz, W. Selection of the relevant turbulence model in a CFD simulation of a flow disturbed by hydraulic elbow comparative analysis of the simulation with measurements results obtained by the ultrasonic flowmeter. J. Therm. Sci. 2018, 27, 413–420. [Google Scholar] [CrossRef]
- Song, K.; Liu, Y. A compact x-ray system for two-phase flow measurement. Meas. Sci. Technol. 2018, 29, 025305. [Google Scholar] [CrossRef]
- Zhao, Y.; Bi, Q.; Yuan, Y.; Lv, H. Void fraction measurement in steam–water two-phase flow using the gamma ray attenuation under high pressure and high temperature evaporating conditions. Flow Meas. Instrum. 2016, 49, 18–30. [Google Scholar] [CrossRef]
- Ito, D.; Saito, Y.; Kawabata, Y. Hybrid two-phase flow measurements in a narrow channel using neutron radiography and liquid film sensor. Phys. Procedia 2015, 69, 570–576. [Google Scholar] [CrossRef]
- Le Corre, J.-M.; Bergmann, U.; Hallehn, A.; Tejne, H.; Waldemarsson, F.; Morenius, B.; Baghai, R. Measurements of local two-phase flow parameters in fuel bundle under BWR operating conditions. Nucl. Eng. Des. 2018, 336, 15–23. [Google Scholar] [CrossRef]
Disclaimer/Publisher’s Note: The statements, opinions and data contained in all publications are solely those of the individual author(s) and contributor(s) and not of MDPI and/or the editor(s). MDPI and/or the editor(s) disclaim responsibility for any injury to people or property resulting from any ideas, methods, instructions or products referred to in the content. |
© 2024 by the authors. Licensee MDPI, Basel, Switzerland. This article is an open access article distributed under the terms and conditions of the Creative Commons Attribution (CC BY) license (https://creativecommons.org/licenses/by/4.0/).

