Article

Research on Differentiated Lightning Protection of Overhead Distribution Lines under Continuous Lightning Strikes

1
Guangdong Power Grid Co., Ltd., China Southern Power Grid, Guangzhou 510620, China
2
Electric Power Research Institute, Guangdong Power Grid Co., Ltd., Guangzhou 510050, China
3
Huizhou Power Supply Bureau, Guangdong Power Grid Co., Ltd., Huizhou 516001, China
4
College of Electrical and Information Engineering, Hunan University, Changsha 410082, China
*
Author to whom correspondence should be addressed.
Energies 2024, 17(18), 4568; https://doi.org/10.3390/en17184568
Submission received: 2 August 2024 / Revised: 29 August 2024 / Accepted: 5 September 2024 / Published: 12 September 2024
(This article belongs to the Special Issue Progress and Challenges in Power and Smart Grid)

Abstract

:
Distribution lines are an important component of a power system. Lightning disasters have serious adverse effects on the reliability of the power supply in distribution networks. In response to the current lack of research on lightning protection in distribution networks under continuous lightning strikes, we built a transient simulation model and calculated the lightning withstanding level and lightning outage rate of distribution lines under continuous lightning strikes. In addition, the impact of different factors on the lightning withstanding level and lightning outage rate of distribution lines under continuous lightning strikes was calculated for different lightning protection strategies. Finally, differentiated lightning protection strategies based on the lightning outage rate calculation were proposed.

1. Introduction

The 10 kV overhead lines are the network connecting the transmission lines and the users. Whether the overhead lines could be safe and stable is crucial for both the power system and power users. The 10 kV overhead lines have the characteristics of low voltage levels, wide distribution range, and high lightning-tripping rates. Improving the lightning protection level of the 10 kV overhead lines is the key to ensuring their safe and stable operation [1,2].
Lightning strikes accounted for the majority of distribution line faults [1]. However, there are still relatively few pieces of lightning protection equipment for the actual operation of the 10 kV overhead lines. In addition, the research on lightning protection for the distribution lines is far less than that for the transmission lines. Therefore, it is necessary to conduct research on lightning protection of the distribution lines.
In recent years, researchers have conducted research on the impact of different factors on the lightning withstanding level (LWL) of the overhead distribution lines. The influencing factors studied included lightning strike location [3], lightning overvoltage type [4], presence or absence of shielding wire [5], tower height [6], tower grounding mode [7], grounding distance [8], installation method of lightning arrester [9], insulation strength of insulators [10], soil resistivity [11], and terrain characteristics [12]. In addition, Farhan Mahmood et al. [13] applied the Monte Carlo method to calculate the probability distribution of lightning overvoltage. Hongcai Chen et al. [14] proposed the finite difference time domain method for faster calculation of lightning-induced overvoltage. Koji Michishita et al. [15] used the EMTP software (Version 7.5) to calculate the probability of lightning strikes on distribution lines. Yingbin Nie [16] used the BP Neural Network Algorithm to locate lightning fault points in distribution lines.
However, the above research was not comprehensive enough and still had the following issues:
(1)
The lightning strikes studied were all related to single lightning strikes (SLSs), without studying multiple or continuous lightning strikes (CLSs). However, the lightning strikes usually include multiple lightning strikes. M.M.F. Saba et al. [17] and Vladimir A. Rakov et al. [18] both observed through high-speed cameras that the proportion of lightning composed of multiple lightning strikes could reach 80%. Mohammad E. M. Rizk et al. [19] found that although the peak current of subsequent lightning strikes was lower than that of the first lightning strike, the steepness was higher and might have a more serious impact than the first lightning strike. In addition, the lightning arrester was likely to be damaged because, when subsequent lightning strikes occurred, the energy absorbed by the lightning arrester might exceed its limit.
(2)
There was relatively little research on differentiated lightning protection. For widely distributed overhead lines, the economic consumption would be high if lightning arresters or shielding wires were installed throughout the entire line. On the contrary, the failure rate would be high if lightning protection facilities were not installed. Differential lightning protection referred to a means of formulating different lightning protection strategies for different distribution lines, which was conducive to balancing the economy and reliability of distribution lines. Jinxin Cao et al. [20] studied how to use different numbers of lightning arresters to protect different distribution lines. However, the influencing factors studied in reference [20] were not comprehensive enough.
Based on the above issues, we conducted research on differentiated lightning protection strategies for 10 kV distribution lines under continuous lightning strikes, including the following contents.
Firstly, the simulation model of lightning strike distribution lines was built on the Alternative Transients Program—Electric Magnetic Transient Program (ATP-EMTP), the most widely used electromagnetic transient calculation standard program in the world. It could simulate various transient processes of the power system through linearization of nonlinear components, matrix inversion operations, and discretization of differential equations. The simulation models consisted of three parts, which were the lightning struck on lines, lightning struck on towers, and lightning-induced strikes.
Secondly, the lightning withstanding level and lightning outage rate of 10 kV overhead lines under different influencing factors were calculated when using different lightning protection facilities. The lightning protection facilities included lightning arresters and insulators. The influencing factors included grounding resistance, tower types, and ground flash density.
Then, the method for evaluating the lightning risk level of 10 kV overhead lines was proposed. Furthermore, differentiated lightning protection strategies have been developed for distribution lines with different lightning risk levels.
Finally, the simulation results indicated that continuous lightning strikes could increase the lightning outage rate of the 10 kV overhead lines. Then, the simulation results were discussed and analyzed. Based on the above analysis, differentiated lightning protection suggestions were proposed.

2. Methodology

To study the lightning protection effects of various lightning protection measures in 10 kV overhead lines, a simulation model was built on ATP-EMTP.

2.1. Direct Lightning Voltage Model

The direct lightning voltage model constructed in this article is shown in Figure 1, which includes the lightning current model, tower and grounding resistance model, overhead line and coupling ground wire model, insulator model, and lightning arrester model.

2.1.1. Lightning Current Model

For the waveform of lightning current caused by an SLS, the Heilder model in IEC62305-4 [21] was usually used, with a rise time of 2.6 μs, a fall time of 50 μs, and a channel impedance of 300 Ω.
For continuous lightning strikes, according to the standard IEC62858, lightning strikes that met the following conditions could be classified as the CSL [22]:
  • The interval between the first lightning strike would be less than or equal to 1 s;
  • The distance from the first lightning strike location would be less than or equal to 10 km;
  • The interval between the previous lightning strikes would be less than or equal to 500 ms.
Huang et al. [23] measured that the subsequent lightning current steepness was approximately 1.5 times that of the first lightning through manual lightning-triggering experiments. In addition, Silveira et al. [24] measured the lightning current amplitude data of multiple lightning strikes and calculated that the lightning current amplitude of the first lightning strike was approximately 43 kA and 17 kA for the subsequent lightning strike. Matsui et al. [25] measured the number of lightning strikes included in the CSL using the lightning positioning system. They analyzed over 10,000 samples and calculated that the average number of lightning strikes was 3.5, with a continuous lightning strike ratio of 66% and a return strike interval of approximately 88 ms.
Therefore, in this article, the ratio of the amplitude of subsequent lightning current to the amplitude of the first lightning current was fixed at 17/43. The number of the CSL was 2, and the interval time was taken as 88 ms. In addition, the rise time of the subsequent lightning current was set to 0.25 μs, while the fall time was set to 100 μs.

2.1.2. Tower and Grounding Resistance Model

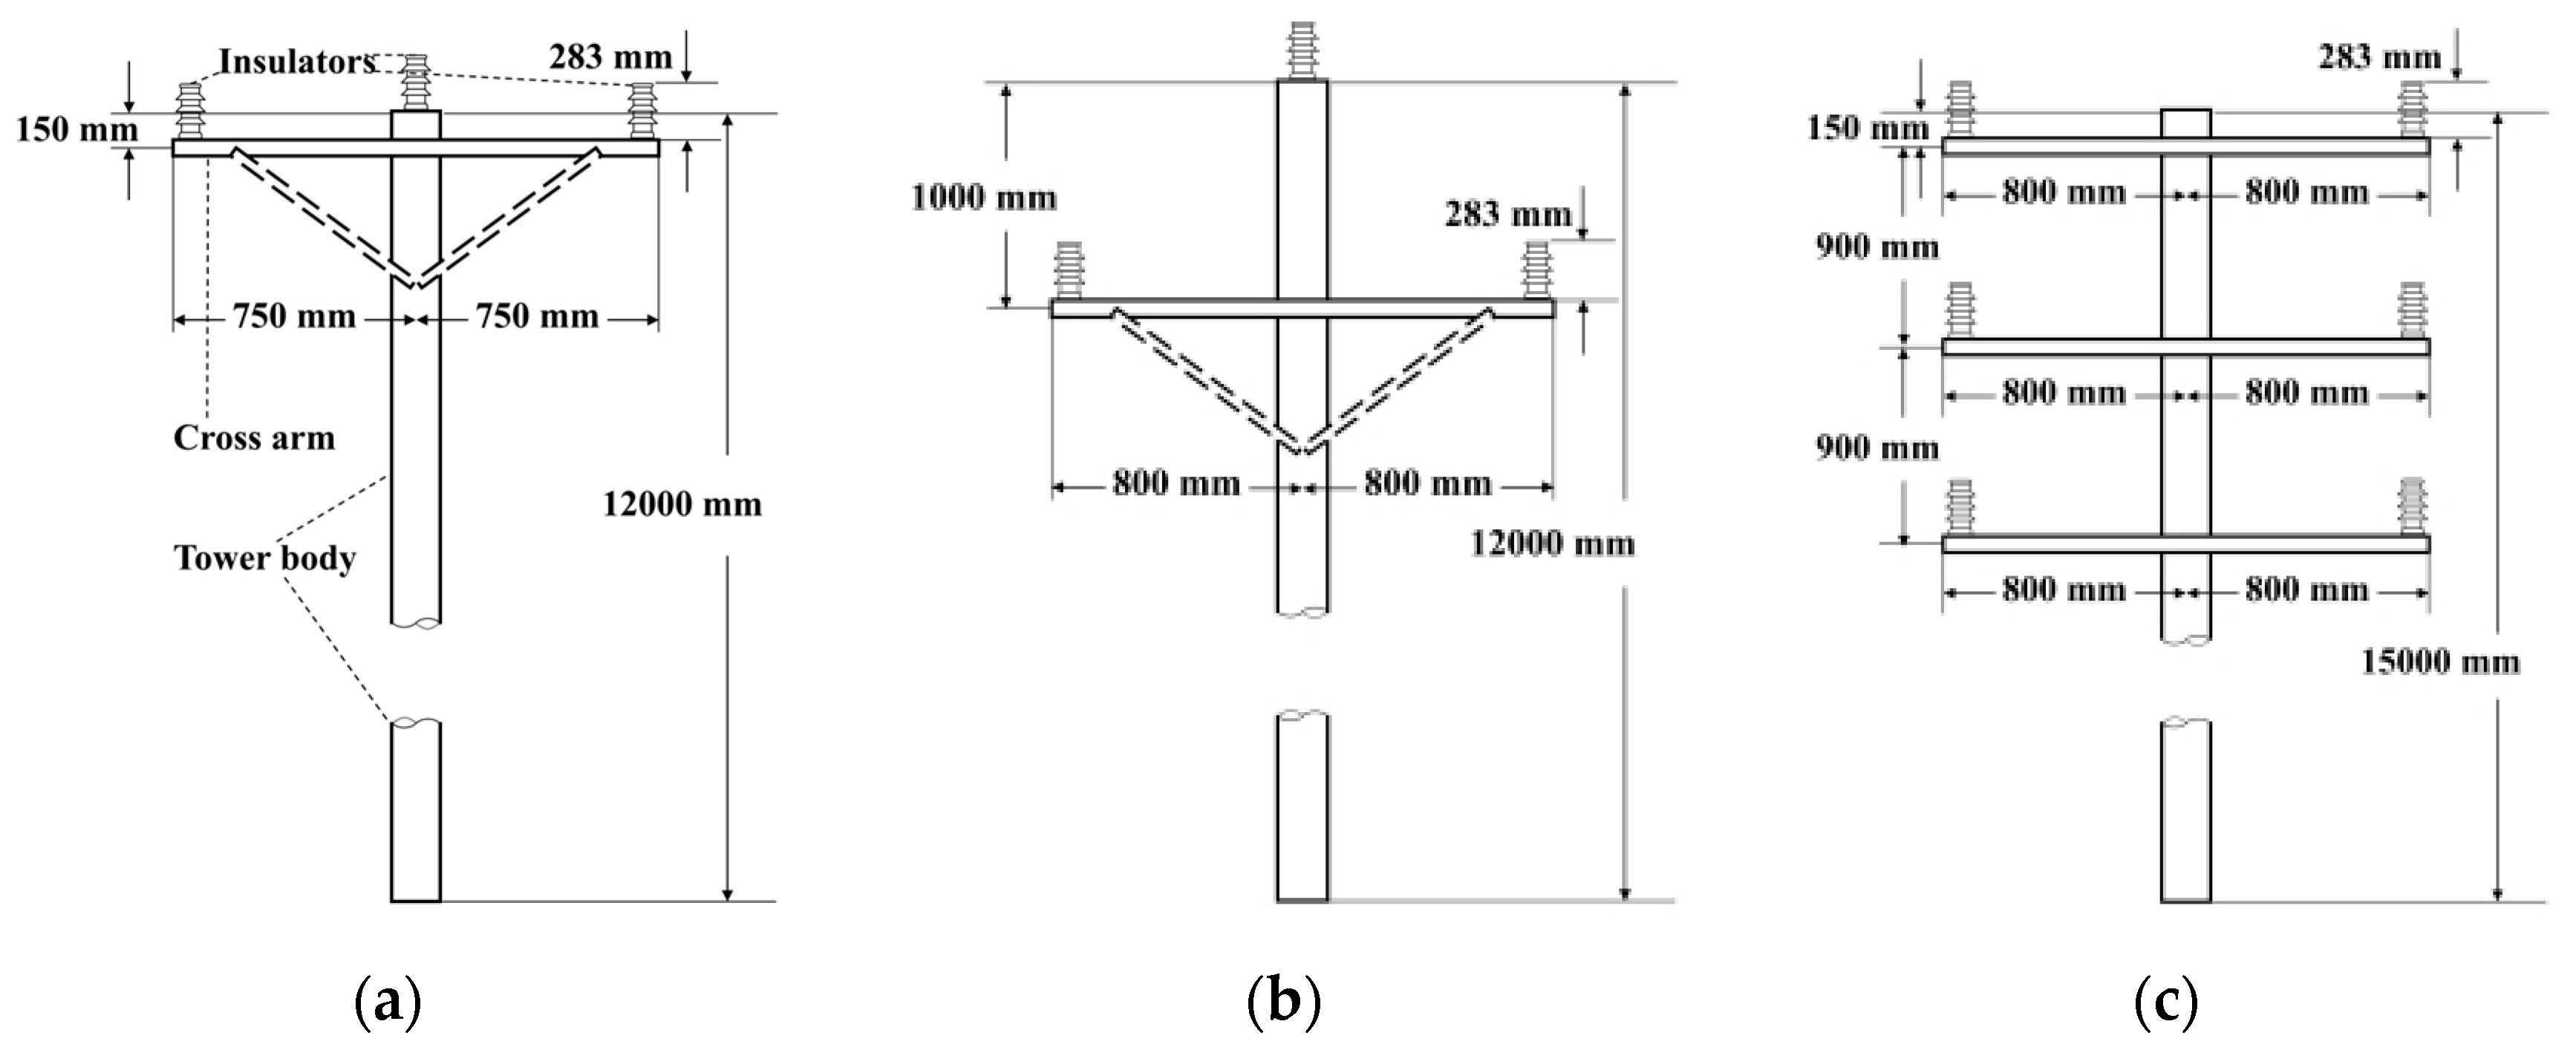
The height of the overhead lines did not exceed 30 m, usually. Zhang et al. [26] pointed out that the wave process could be ignored if the tower height was less than 30 m when analyzing the lightning protection. Therefore, a centralized inductance model was set for the tower model in this paper, with the equivalent inductance of 0.84 μH/m. The height of the tower was set to 30 m. The categories of towers included the single circuit tower and the double circuit tower, as shown in Figure 2.
For the grounding resistance, as no special grounding device was proposed in this study, a constant value was taken for the grounding resistance, with a range of 15–30 Ω.

2.1.3. Overhead Line

Due to the high-frequency lightning current waveform in the lightning strike process analyzed in this paper, the 10 kV overhead line adopted the JMarti model. The wire was bare, with JL/G1A-95/15 as the type of wire. The span length was 50 m.
The parameters are shown in Table 1.

2.1.4. Insulator Model

The PS-15 pin insulator and P-15 pin insulator were the types of insulators modeled in this paper, with the impulse discharge voltage values of 105 kV and 118 kV, respectively [28]. In ATP-EMTP, the insulator was simulated using a voltage-controlled switch.

2.1.5. Lightning Arrester Model HY5WS-17/50

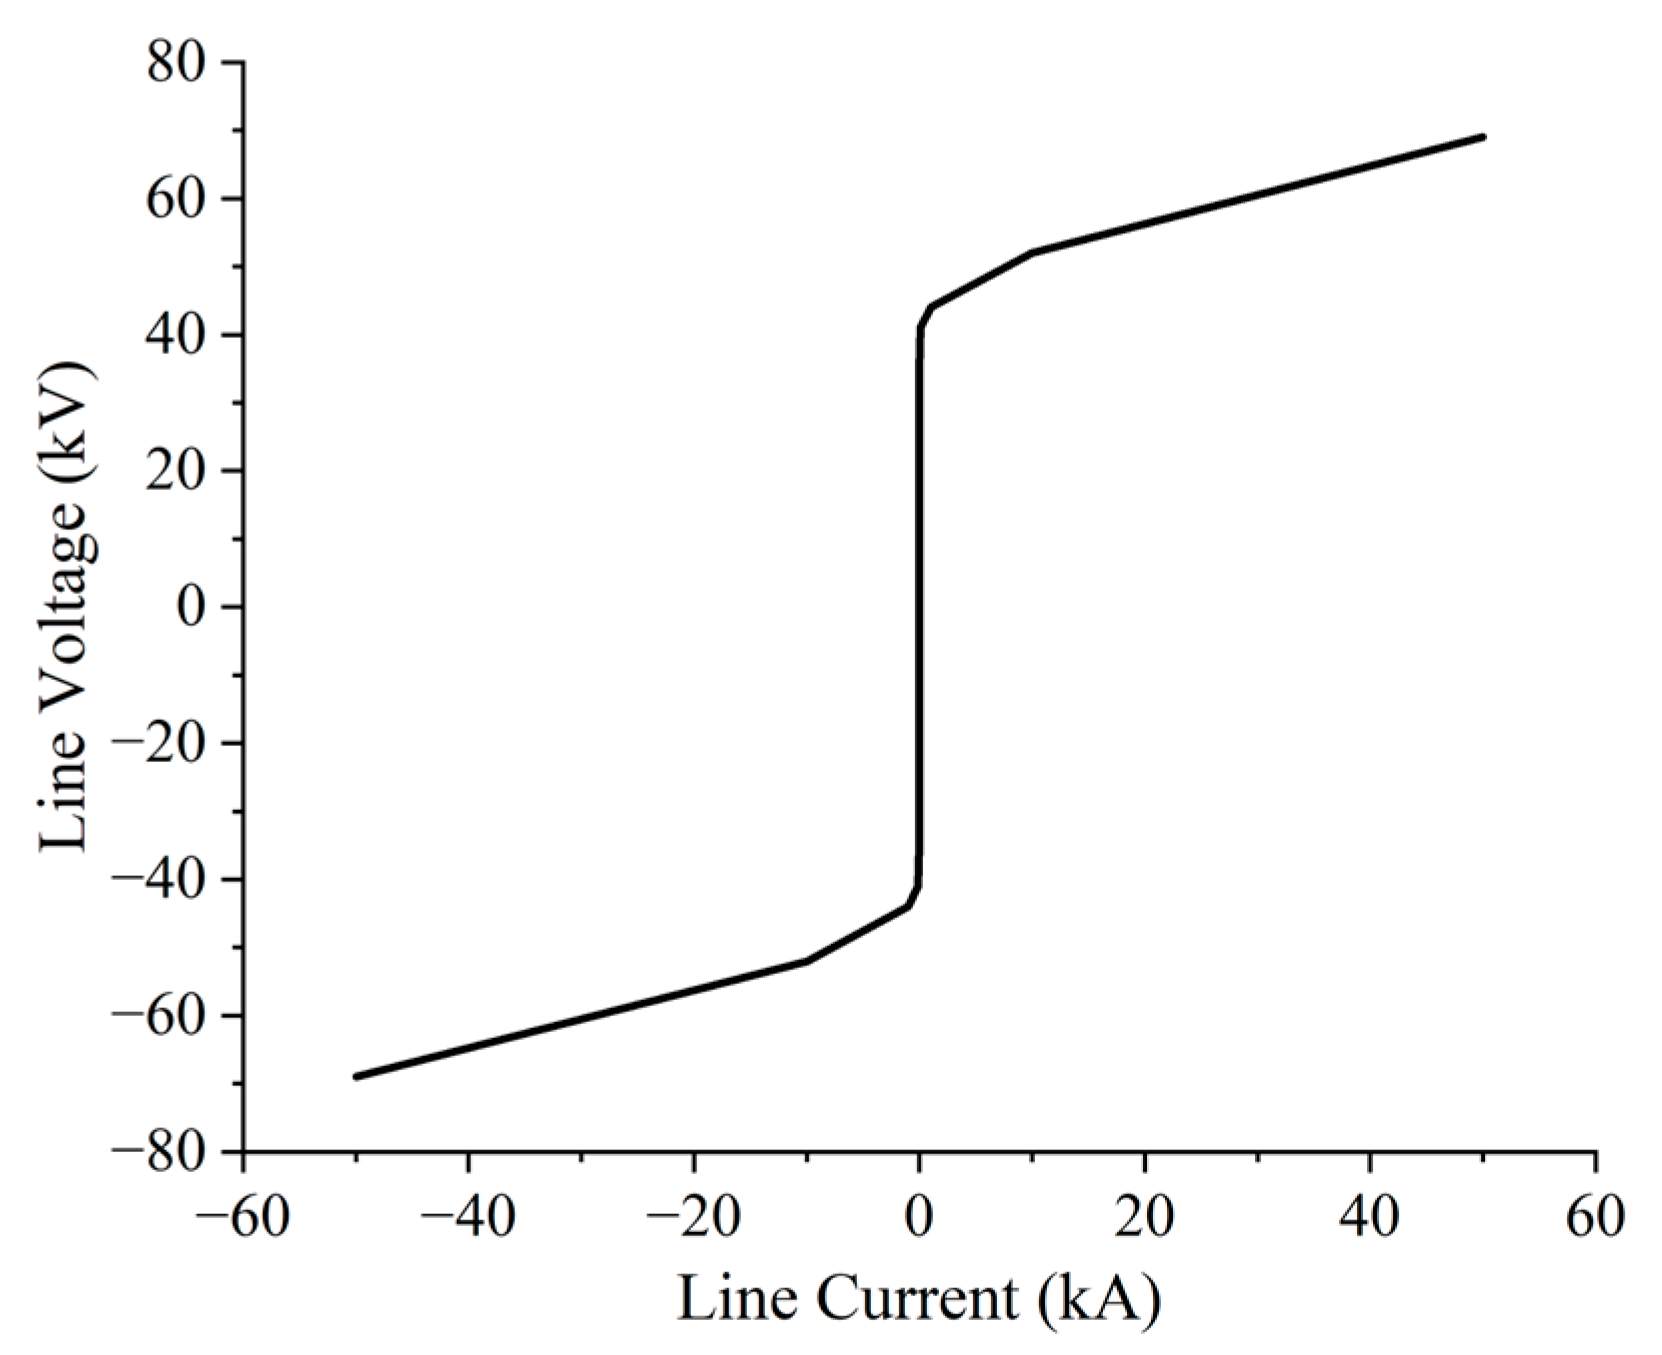
The lightning arrester model was selected as HY5WS-17/50, with a nominal discharge current value of 5 kA. The maximum absorbed energy of this lightning arrester was 12,300 J [29]. The Volt-Ampere characteristic curve of the lightning arrester is shown in Figure 3.

2.2. Lightning-Induced Voltage Model

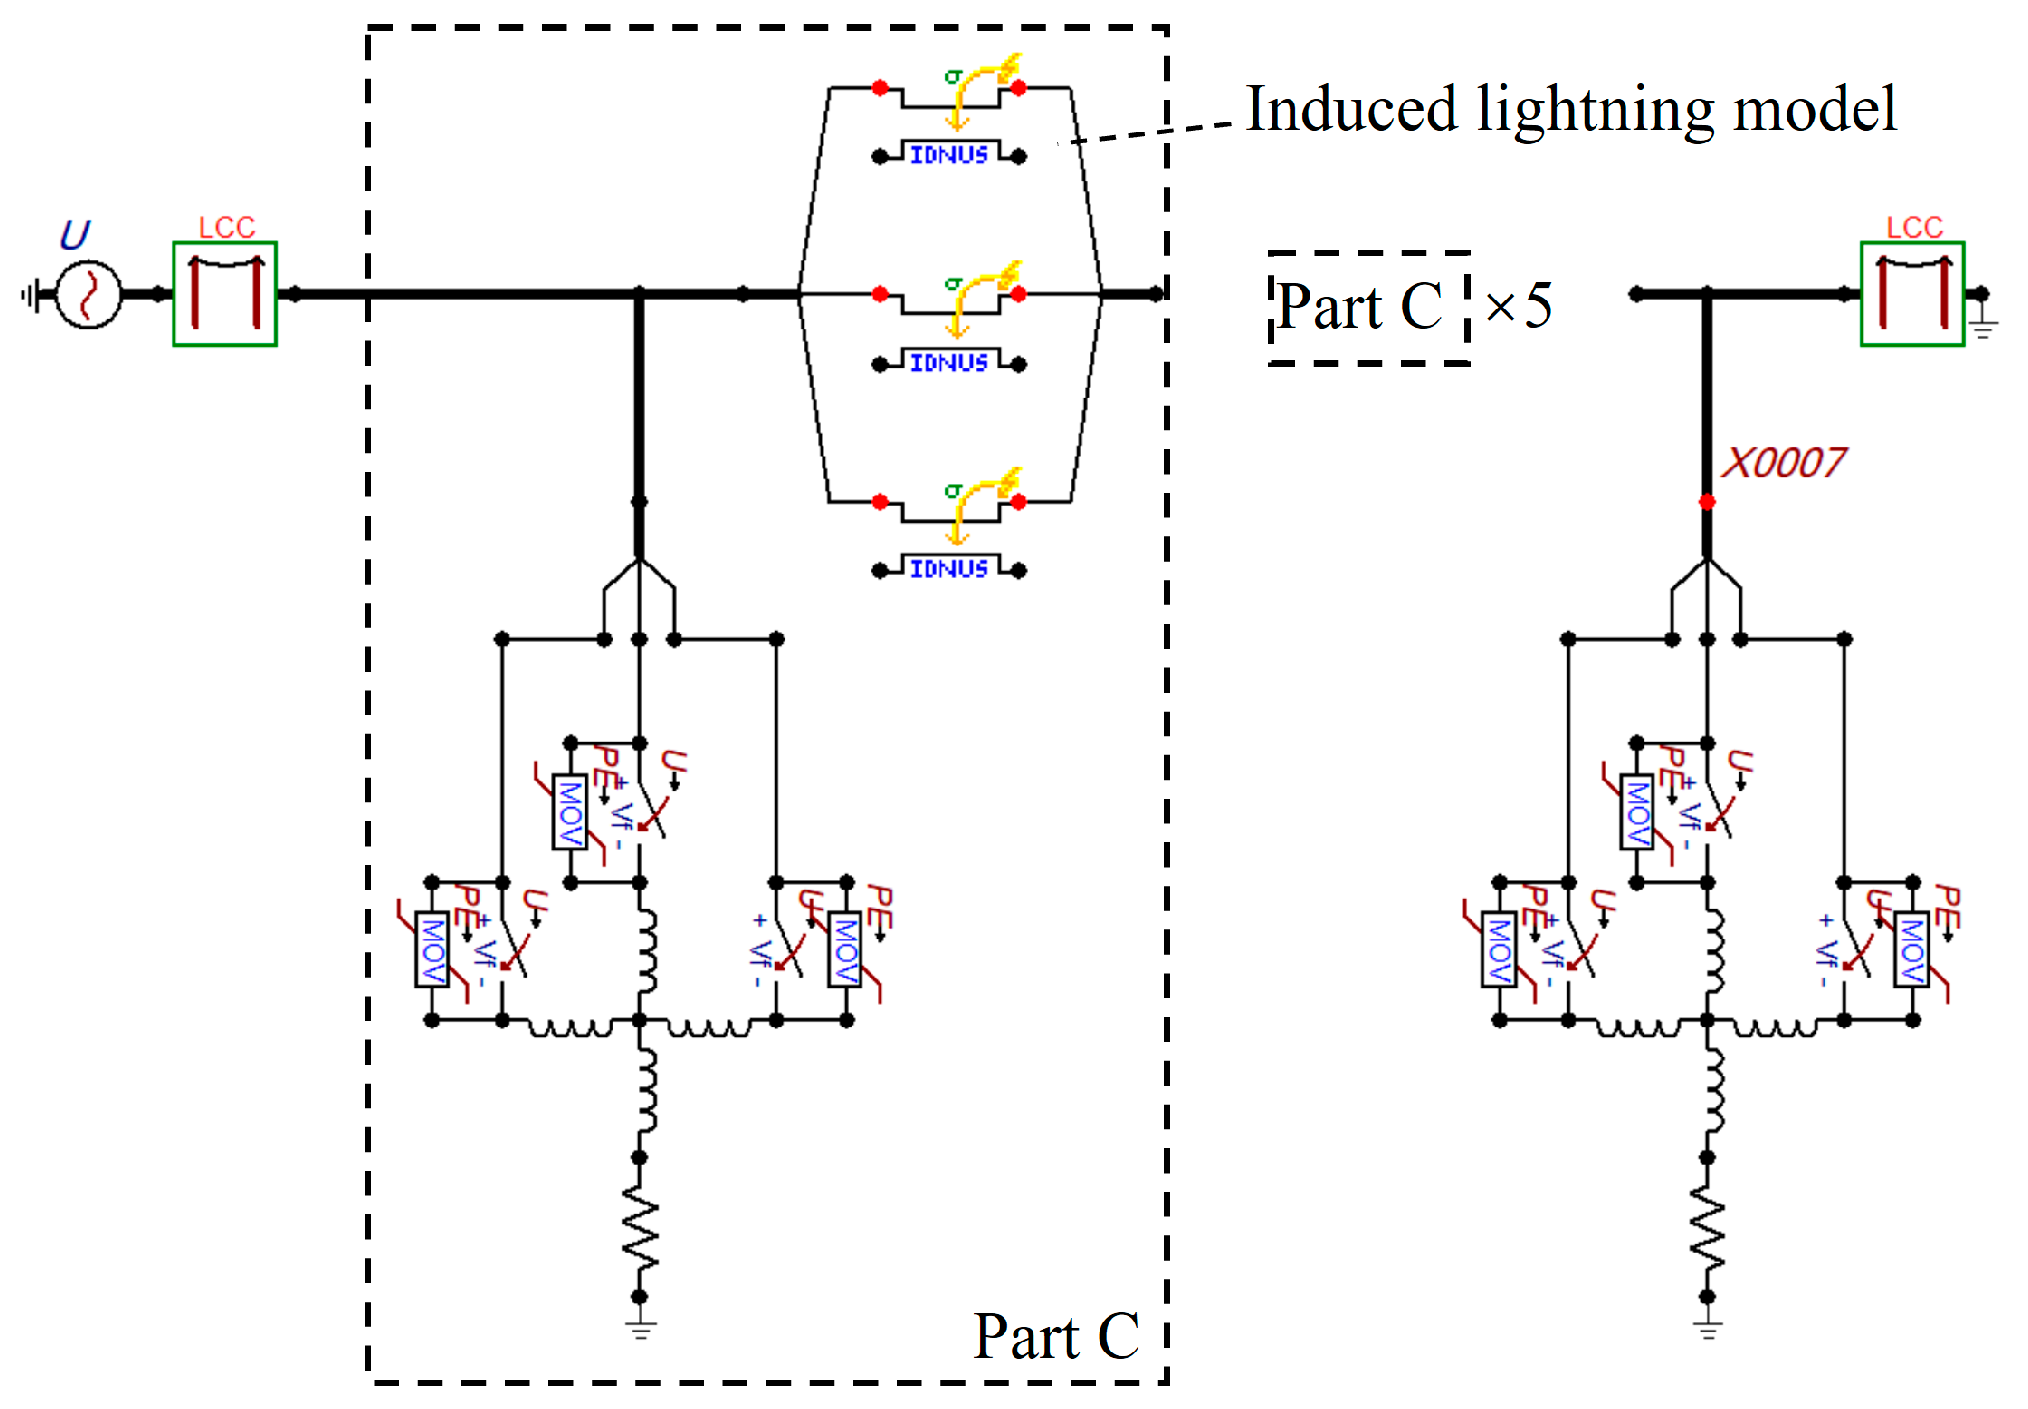
The lightning-induced voltage model constructed in this article is shown in Figure 4:
The calculation method for the lightning-induced voltage is shown in Equation (1) [12]:
U = 25 I h c S
where I represents the amplitude of the lightning current. The parameter hc represents the average height of the overhead lines. S represents the distance from the lightning position to the lines, taken as 50 m in this paper.

2.3. Calculation Method for Energy Absorption of the Lightning Arresters

Firstly, TACS was used to record the voltage and current flowing through the lightning arrester, and then the actual absorbed energy W of the lightning arrester was calculated according to Equation (2).
W = t 0 t p ( t ) d t = t 0 t u ( t ) i ( t ) d t

2.4. Calculation Method for Lightning Withstanding Level

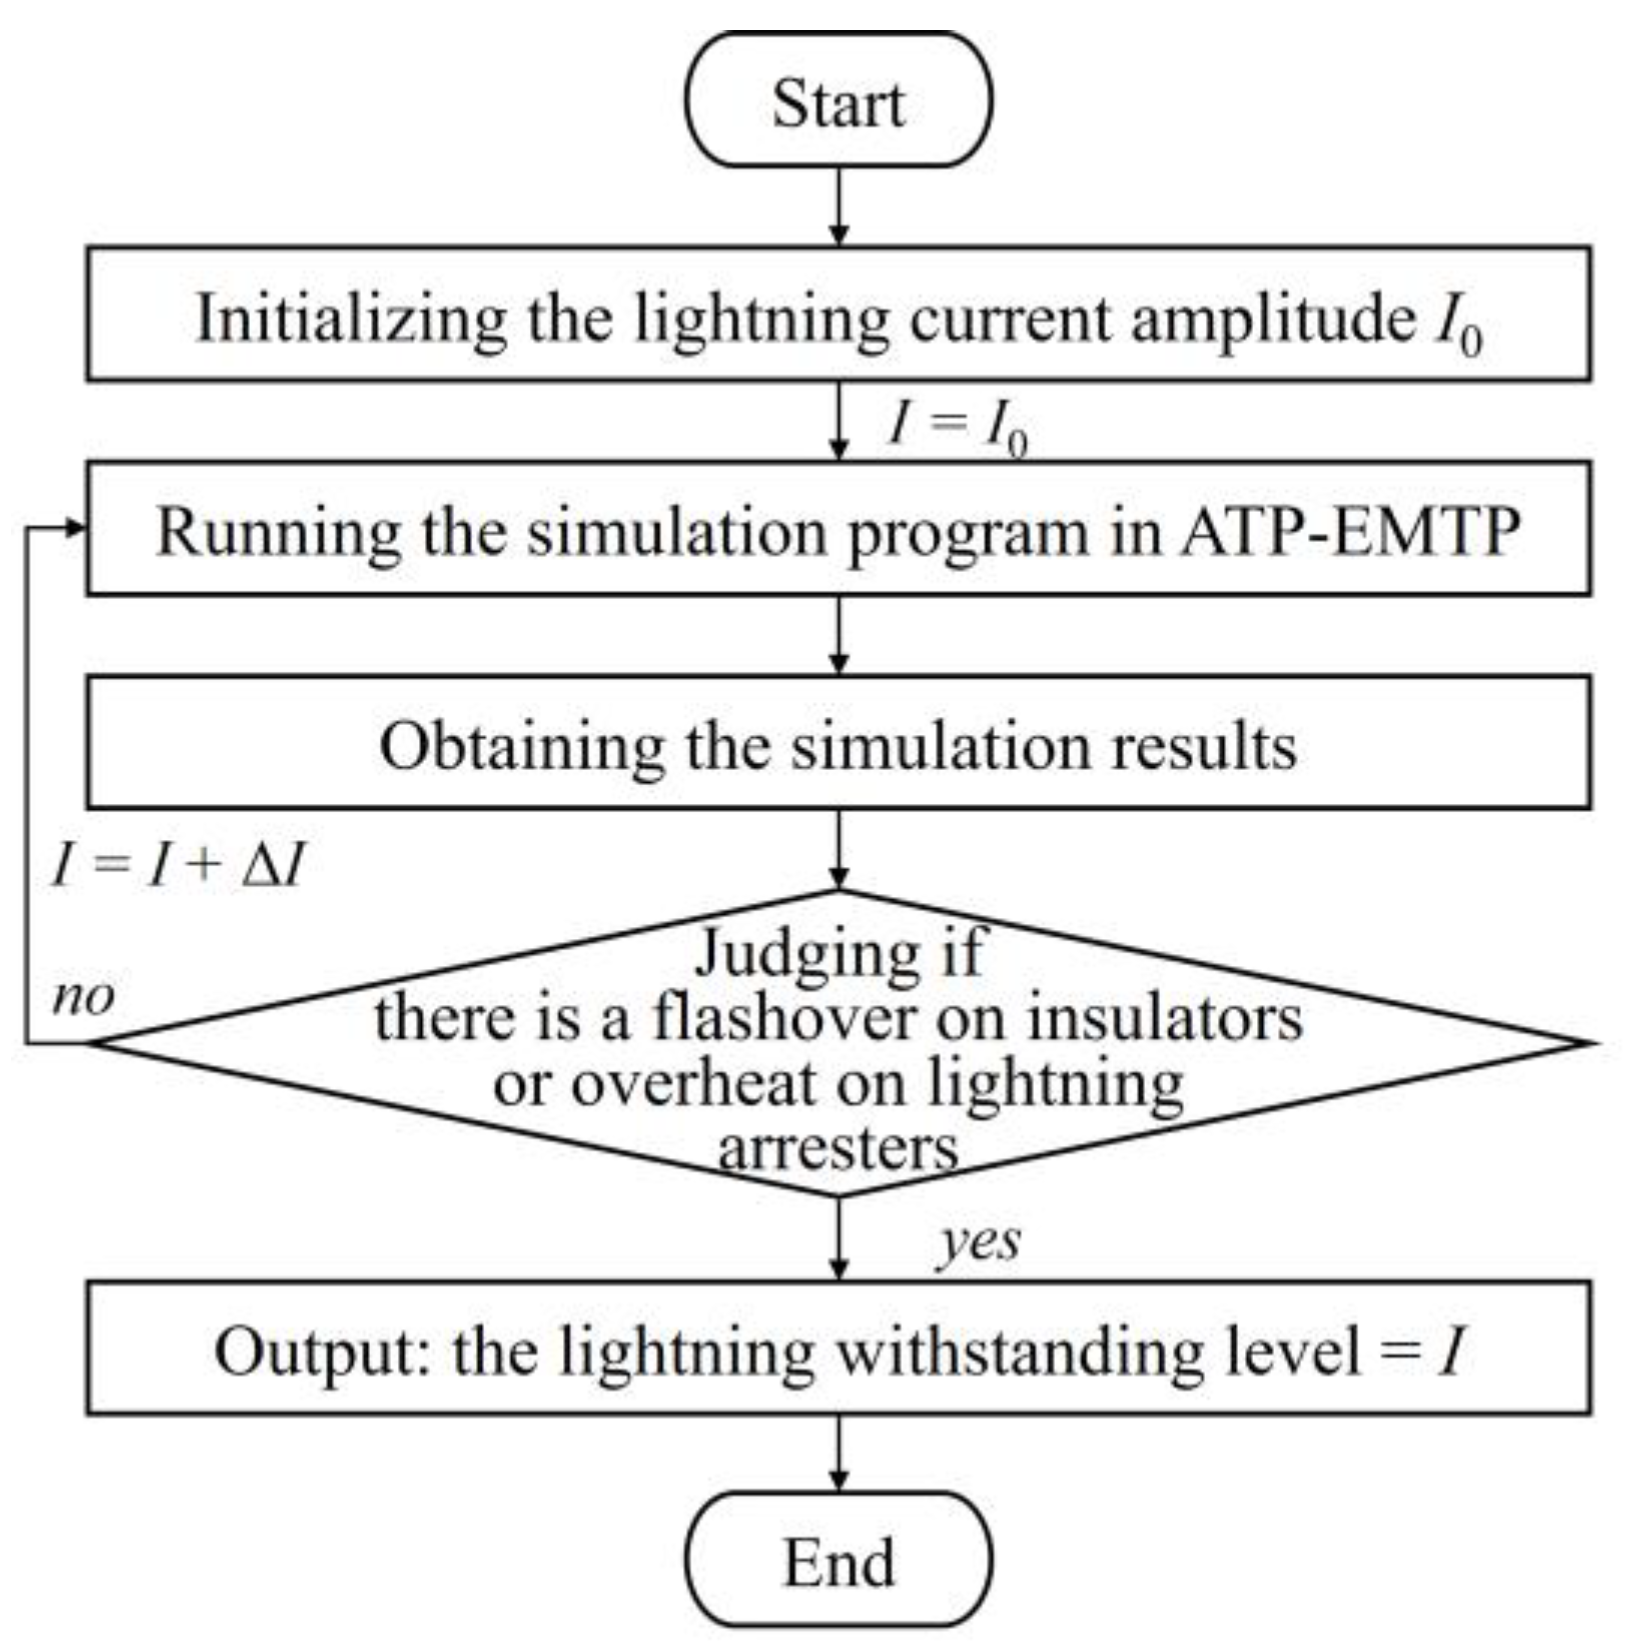
The calculation process of the lightning withstanding level is shown in Figure 5:
Firstly, a small amplitude of lightning current was set at the beginning of the simulation, after building the simulation model, and then increasing the amplitude of the lightning current gradually until there was a two-phase or three-phase flashover in the lines. Finally, the amplitude of the lightning current at this time was recorded as the LWL of the line.

2.5. Calculation Method for Lightning Outage Rate

In 10 kV overhead lines, direct lightning strikes could be divided into the lightning struck on lines and the lightning struck on towers. Therefore, the overall lightning outage rate consisted of three parts: the outage rate of the lightning strike on lines, the outage rate of the lightning strike on towers, and the outage rate of the lightning-induced strike [29].
N = N l + N t + N i
where N represents the overall lightning outage rate, Nl represents the outage rate of the lightning strike on lines, Nt represents the outage rate of the lightning strike on towers, and Ni represents the outage rate of the lightning-induced strike.

2.5.1. Calculation of Nl

The calculation method of the Nl is shown in Equation (4).
N l = 0.1 N g ( b + 28 h c 0.6 ) η ( 1 g ) P l
where Ng represents the ground flash density. b represents the width of the tower structure. η represents the arc over the rate. The parameter g represents the probability of lightning struck on towers. Pl represents the probability of lightning current amplitude exceeding the LWL of the lightning struck on lines.

2.5.2. Calculation of Nt

The calculation method of the Nt is shown in Equation (5).
N t = 0.1 N g ( b + 28 h c 0.6 ) η g P t
where Pt represents the probability of lightning current amplitude exceeding the LWL of the lightning struck on towers.

2.5.3. Calculation of Ni

The calculation method of the Ni is shown in Equation (6).
N i = 0.1 N g ( b + 28 h c 0.6 ) η P i P r a t i o
where Pi represents the probability of lightning current amplitude exceeding the LWL of the lightning-induced strike. Pratio represents the lightning-induced strike ratio, with a value of 70%.

2.5.4. Calculation of η

The calculation method of the η is shown in Equation (7).
η = 4.5 U N 2 l 1 0.75 14 100
where UN represents the effective value of the rated voltage of the lines. The parameter l1 represents the discharge distance between insulator gaps.

2.5.5. Calculation of the Probability of the Lightning Strikes

The calculation method of the probability of the lightning strike is defined in IEEE Standard [30], as shown in Equation (8).
P ( I I 0 ) = 1 1 + ( I 0 31 ) 2.6

3. Experiment

3.1. Parameter Settings

During the simulation, the parameters and types of the model are shown in Table 2.

3.2. Lightning Protection Strategy

The lightning protection facilities considered included lightning arresters and insulators. Different lightning protection strategies have been proposed for these two types of lightning protection facilities.
For the lightning arresters, five installation ways have been proposed: A = {ai|i = 1, 2, 3, 4, 5}. The way’a1 indicates no installation of the lightning arresters. The installation a2 indicates the installation of lightning arresters on the highest phase of the entire lines. The installation a3 indicates the installation of lightning arresters on the whole three phases of the entire lines. The installation a4 indicates the installation of lightning arresters on the highest phase every two towers, and a5 indicates the installation of lightning arresters on the whole three phases every two towers.
For the insulators, two kinds of insulators have been studied: B = {bi|i = 1, 2}. The insulator b1 indicates the PS-15 pin insulator, with the lower dielectric strength. The insulator b2 indicates the P-15 pin insulator, with the higher dielectric strength.
Therefore, a total of 10 lightning protection strategies S = {si|i = 1, 2, …, 10} were obtained. The corresponding relationship between the lightning protection strategy S and the installation methods of lightning arresters and insulators is shown in Table 3.

3.3. Analysis of Lightning Withstanding Levels

In this section, the LWL was calculated for the SLS and CSL. Furthermore, the lightning strike situation studied in this paper was divided into lightning strikes on lines, lightning strikes on towers, and lightning-induced strikes.
The influencing factors of the study included the types of towers and the grounding resistance. On the one hand, the grounding resistance was fixed to 15 Ω when studying the effect of the tower type on LWL. On the other hand, the tower type was fixed to Z1-1 when studying the effect of the grounding resistance on LWL.
In addition, there were 10 types of lightning protection strategies, as shown in Table 3. For each lightning protection strategy, the LWL under different influencing factors was calculated according to the process shown in Figure 5.

3.3.1. Lightning Struck on Lines

The LWL when lightning struck the lines is shown in Table 4.
From the data in Table 4, it was apparent that when lightning struck on lines, the LWL was the highest when three-phase lightning arresters were installed on the entire line. On the contrary, the LWL was the lowest when lightning arresters were not installed. In addition, the LWL decreased as the grounding resistance increased. However, the LWL showed the opposite trend when lightning arresters were installed in all three phases on the entire line.
Comparing the LWL when struck on lines of three different towers, it can be seen that the LWL of Z1-2 and Z1-1 towers were basically the same, while the LWL of Z2-3 towers was generally lower than that of single circuit towers. Nevertheless, when the lightning arresters were installed in single-phase on the entire line, the LWL of the Z2-3 tower was the highest, while that of the Z1-1 tower was the lowest. When the insulators with higher impulse voltages were used, the LWL, when lightning struck on lines, was also improved.
Comparing the LWL under continuous lightning strikes and single lightning strikes, it can be seen that the LWL under continuous lightning strikes was lower when strategies s2, s3, s7, and s8 were selected. And the LWL was consistent when using other lightning protection strategies.

3.3.2. Lightning Struck on Towers

The LWL when lightning struck the towers is shown in Table 5.
By comparing the data in Table 4 and Table 5, it can be seen that when lightning struck the tower, the influencing trend of the grounding resistance, insulator impulse voltage, and lightning current waveform, on the LWL was consistent with that when lightning struck the lines. Similarly, the LWL was the highest when three-phase lightning arresters were installed on the entire line but lowest when lightning arresters were not installed. However, when lightning struck the tower, the impact of the type of tower on LWL was different from when lightning struck the lines. At this time, the LWL of the Z2-3 tower was the highest and that of the Z1-1 tower was the lowest.
Considering the single lightning strike, the LWL when lightning struck on the tower was lower than that of the lightning struck on lines if strategies s2, s3, s7, and s8 were adopted. However, the opposite conclusion would be drawn if other strategies were adopted. Considering the continuous lightning strike, the LWL when lightning struck the tower was higher than that when the lightning struck the lines, only for strategies s1 and s6.

3.3.3. Lightning-Induced Strike

As shown in Equation (1), since the lightning-induced voltage was mainly affected by the amplitude of the lightning current, only the lightning withstand level under the single lightning strike was calculated in the simulation. The LWL on lightning-induced strikes is shown in Table 6.
Comparing Table 4, Table 5 and Table 6, it can be seen that the LWL on lightning-induced strikes was much higher than that of when lightning struck the towers and lines. Similarly, the LWL was the highest when three-phase lightning arresters were installed on the entire line but lowest when lightning arresters were not installed.
Comparing the LWL under different grounding resistances, it can be found that the LWL decreases as the grounding resistance increases when strategies s4, s5, s9, and s10 are adopted. In addition, the LWL increased as the grounding resistance increased when strategies s2, s3, s7, and s8 were adopted.

3.4. Analysis of Lightning Outage Rate

In this section, the lightning outage rate was calculated according to Equations (3)–(8). The influencing factors of the study included the grounding resistance, the types of towers, and the ground flash density. The ground flash density was taken as five when analyzing the effect of the grounding resistance and tower type. In addition, when analyzing the effect of the ground flash density, the tower type was selected as Z2-3, and only the lightning outage rate under continuous lightning strikes was analyzed.

3.4.1. The Influence of Grounding Resistance

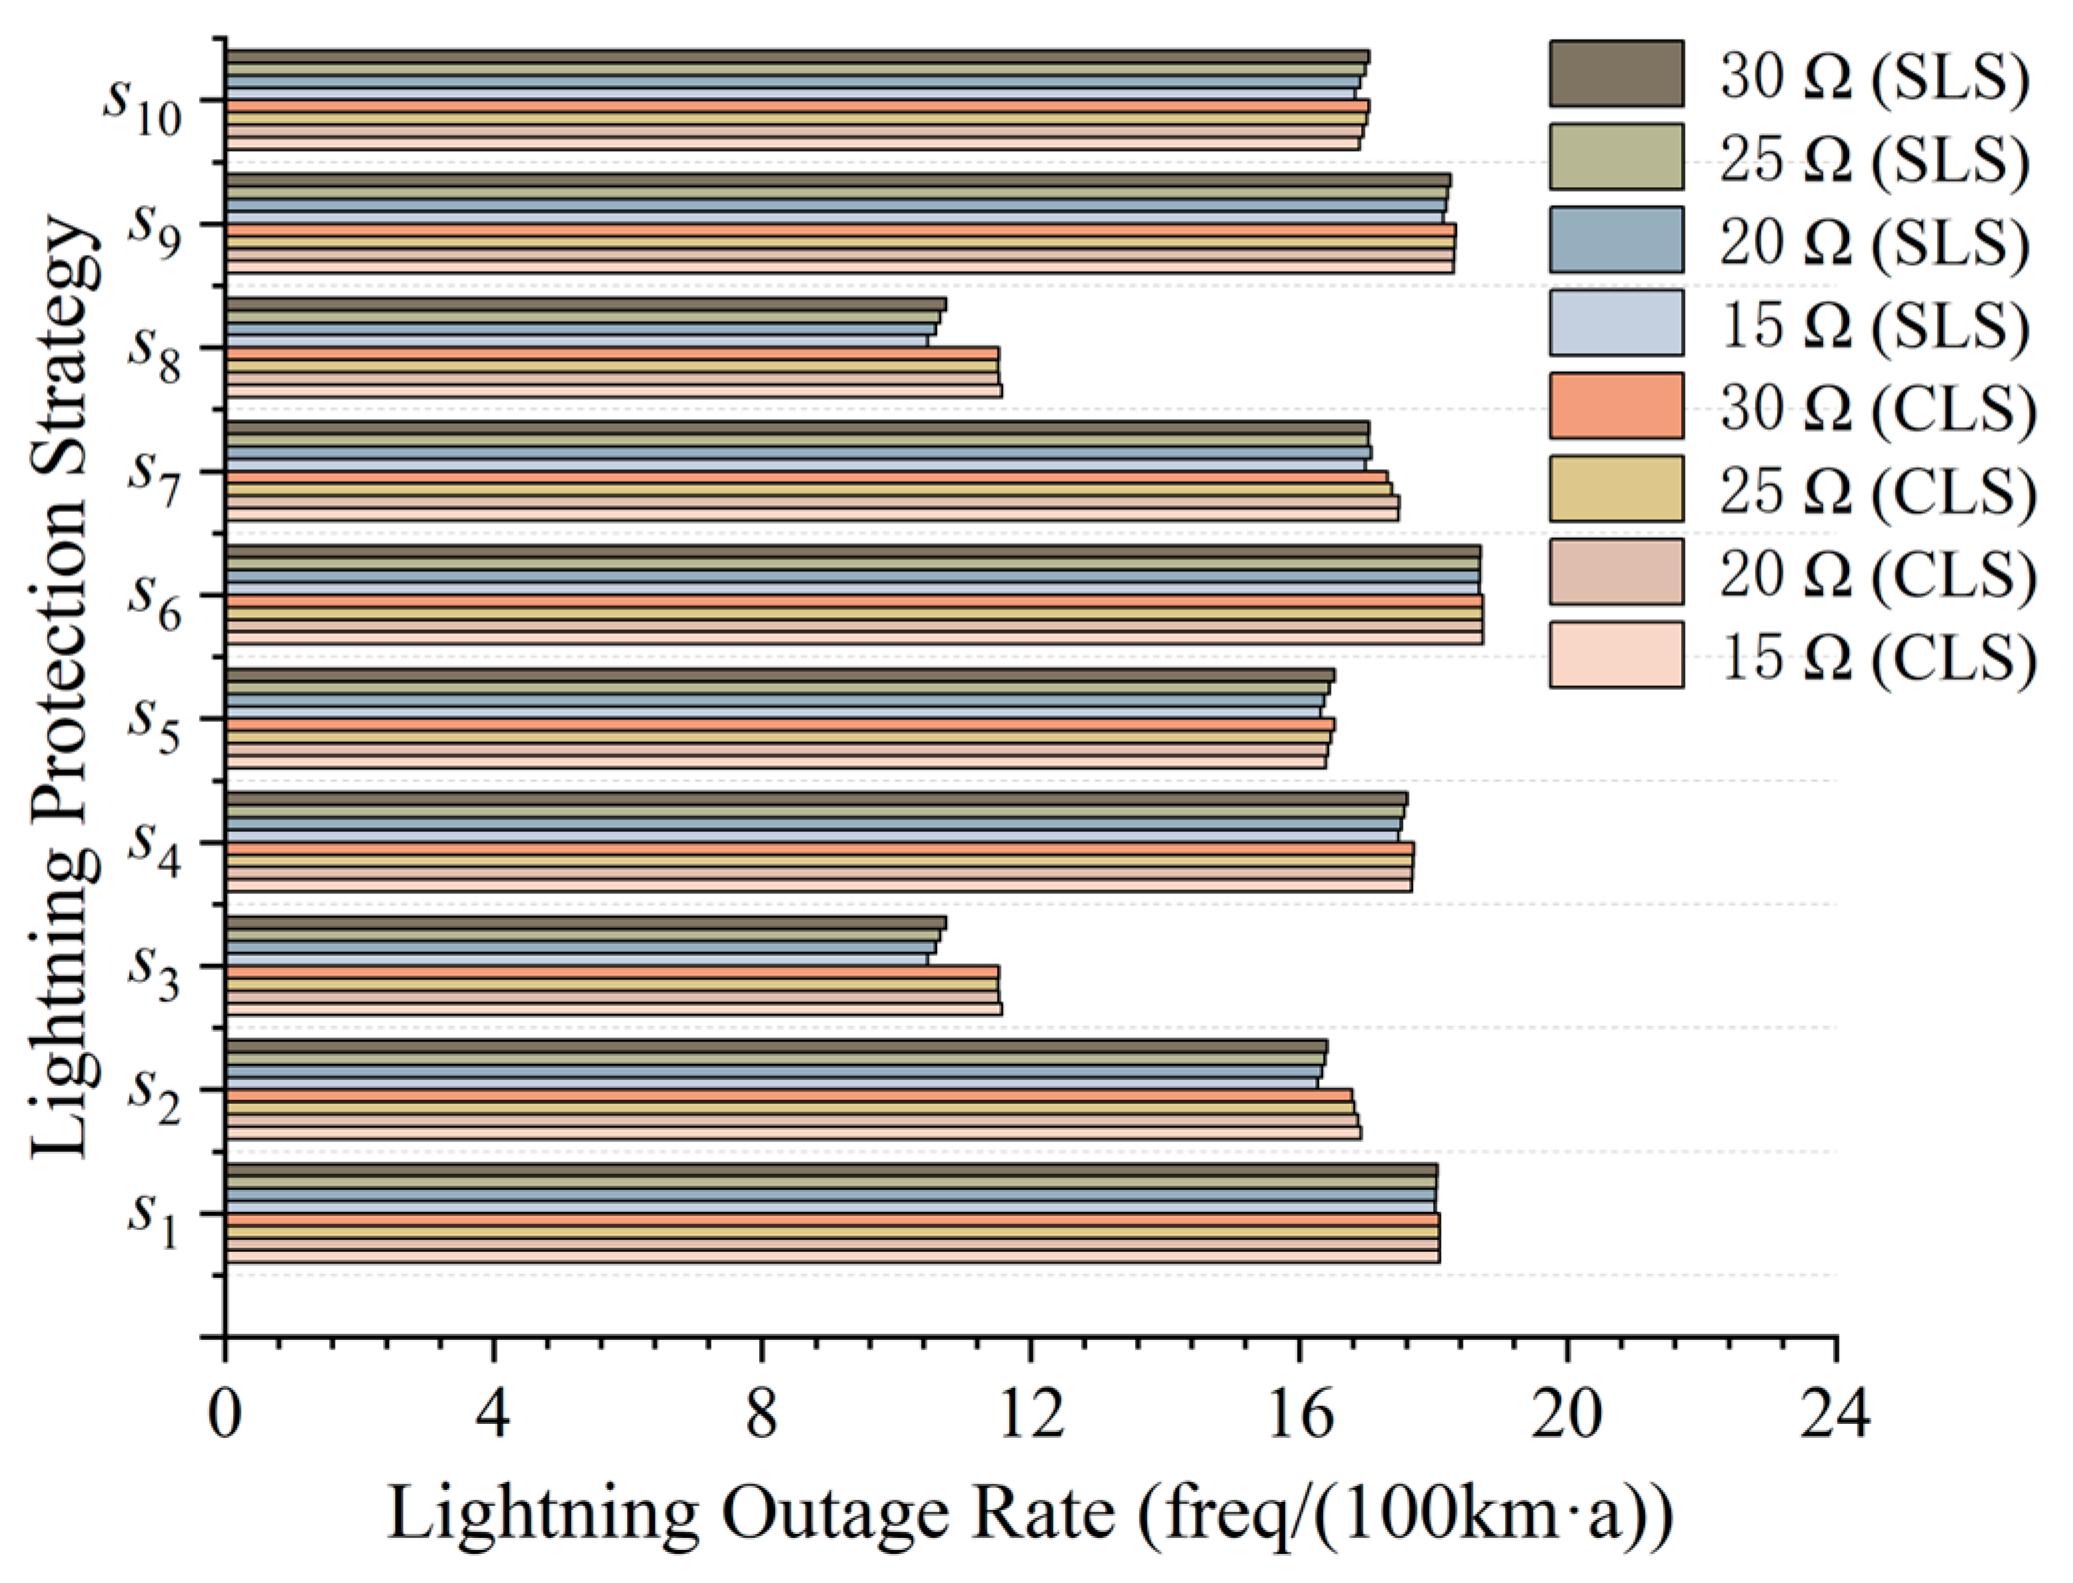
The lightning outage rates on different grounding resistances are shown in Figure 6.
As shown in Figure 6, it can be seen that the lightning outage rate under a single lightning strike was lower than that under continuous lightning strikes. Considering the single lightning strike, the lightning outage rate increased as the grounding resistance increased. But there was no fixed trend when considering the continuous lightning strikes. Comparing the lightning outage rates when using two different types of insulators, it was found that the lightning outage rate decreased by 2.73% on average when using P-15 type insulators compared to using PS-15 type insulators.

3.4.2. The Influence of Tower Type

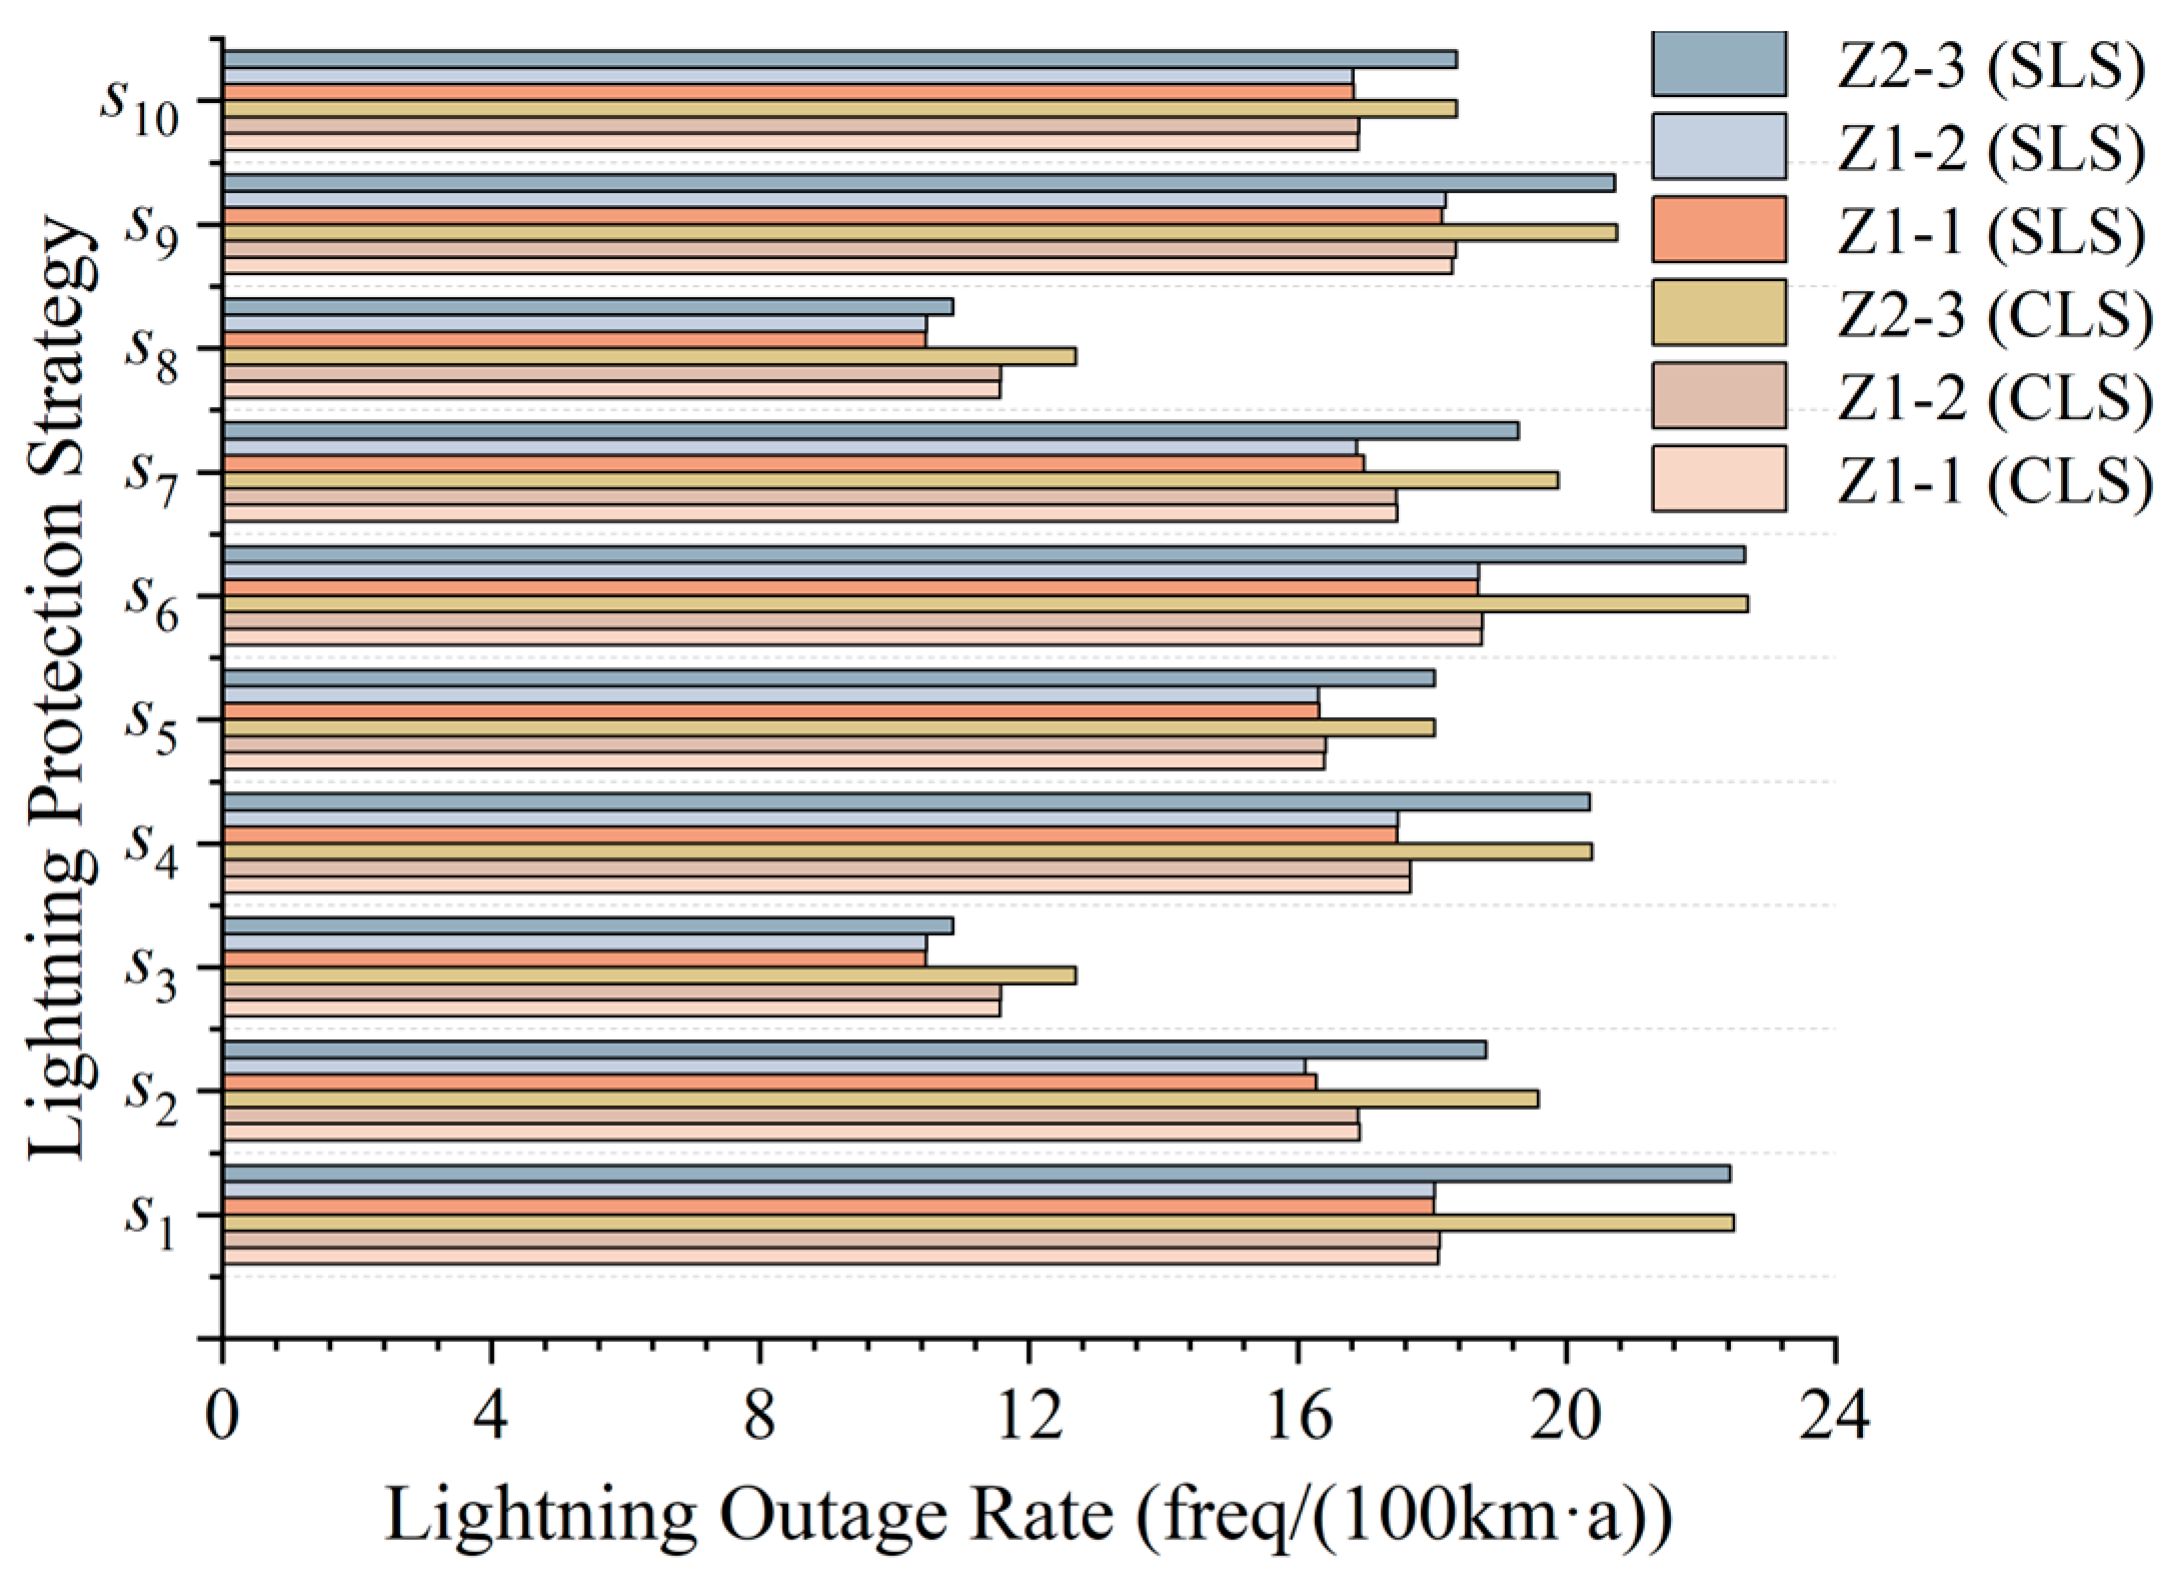
The lightning outage rates on different tower types are shown in Figure 7, it can be concluded that the lightning outage rate of the Z2-3 type tower was the highest, and the lightning outage rates of the Z1-1 and Z1-2 type towers were close.

3.4.3. The Influence of Ground Flash Density

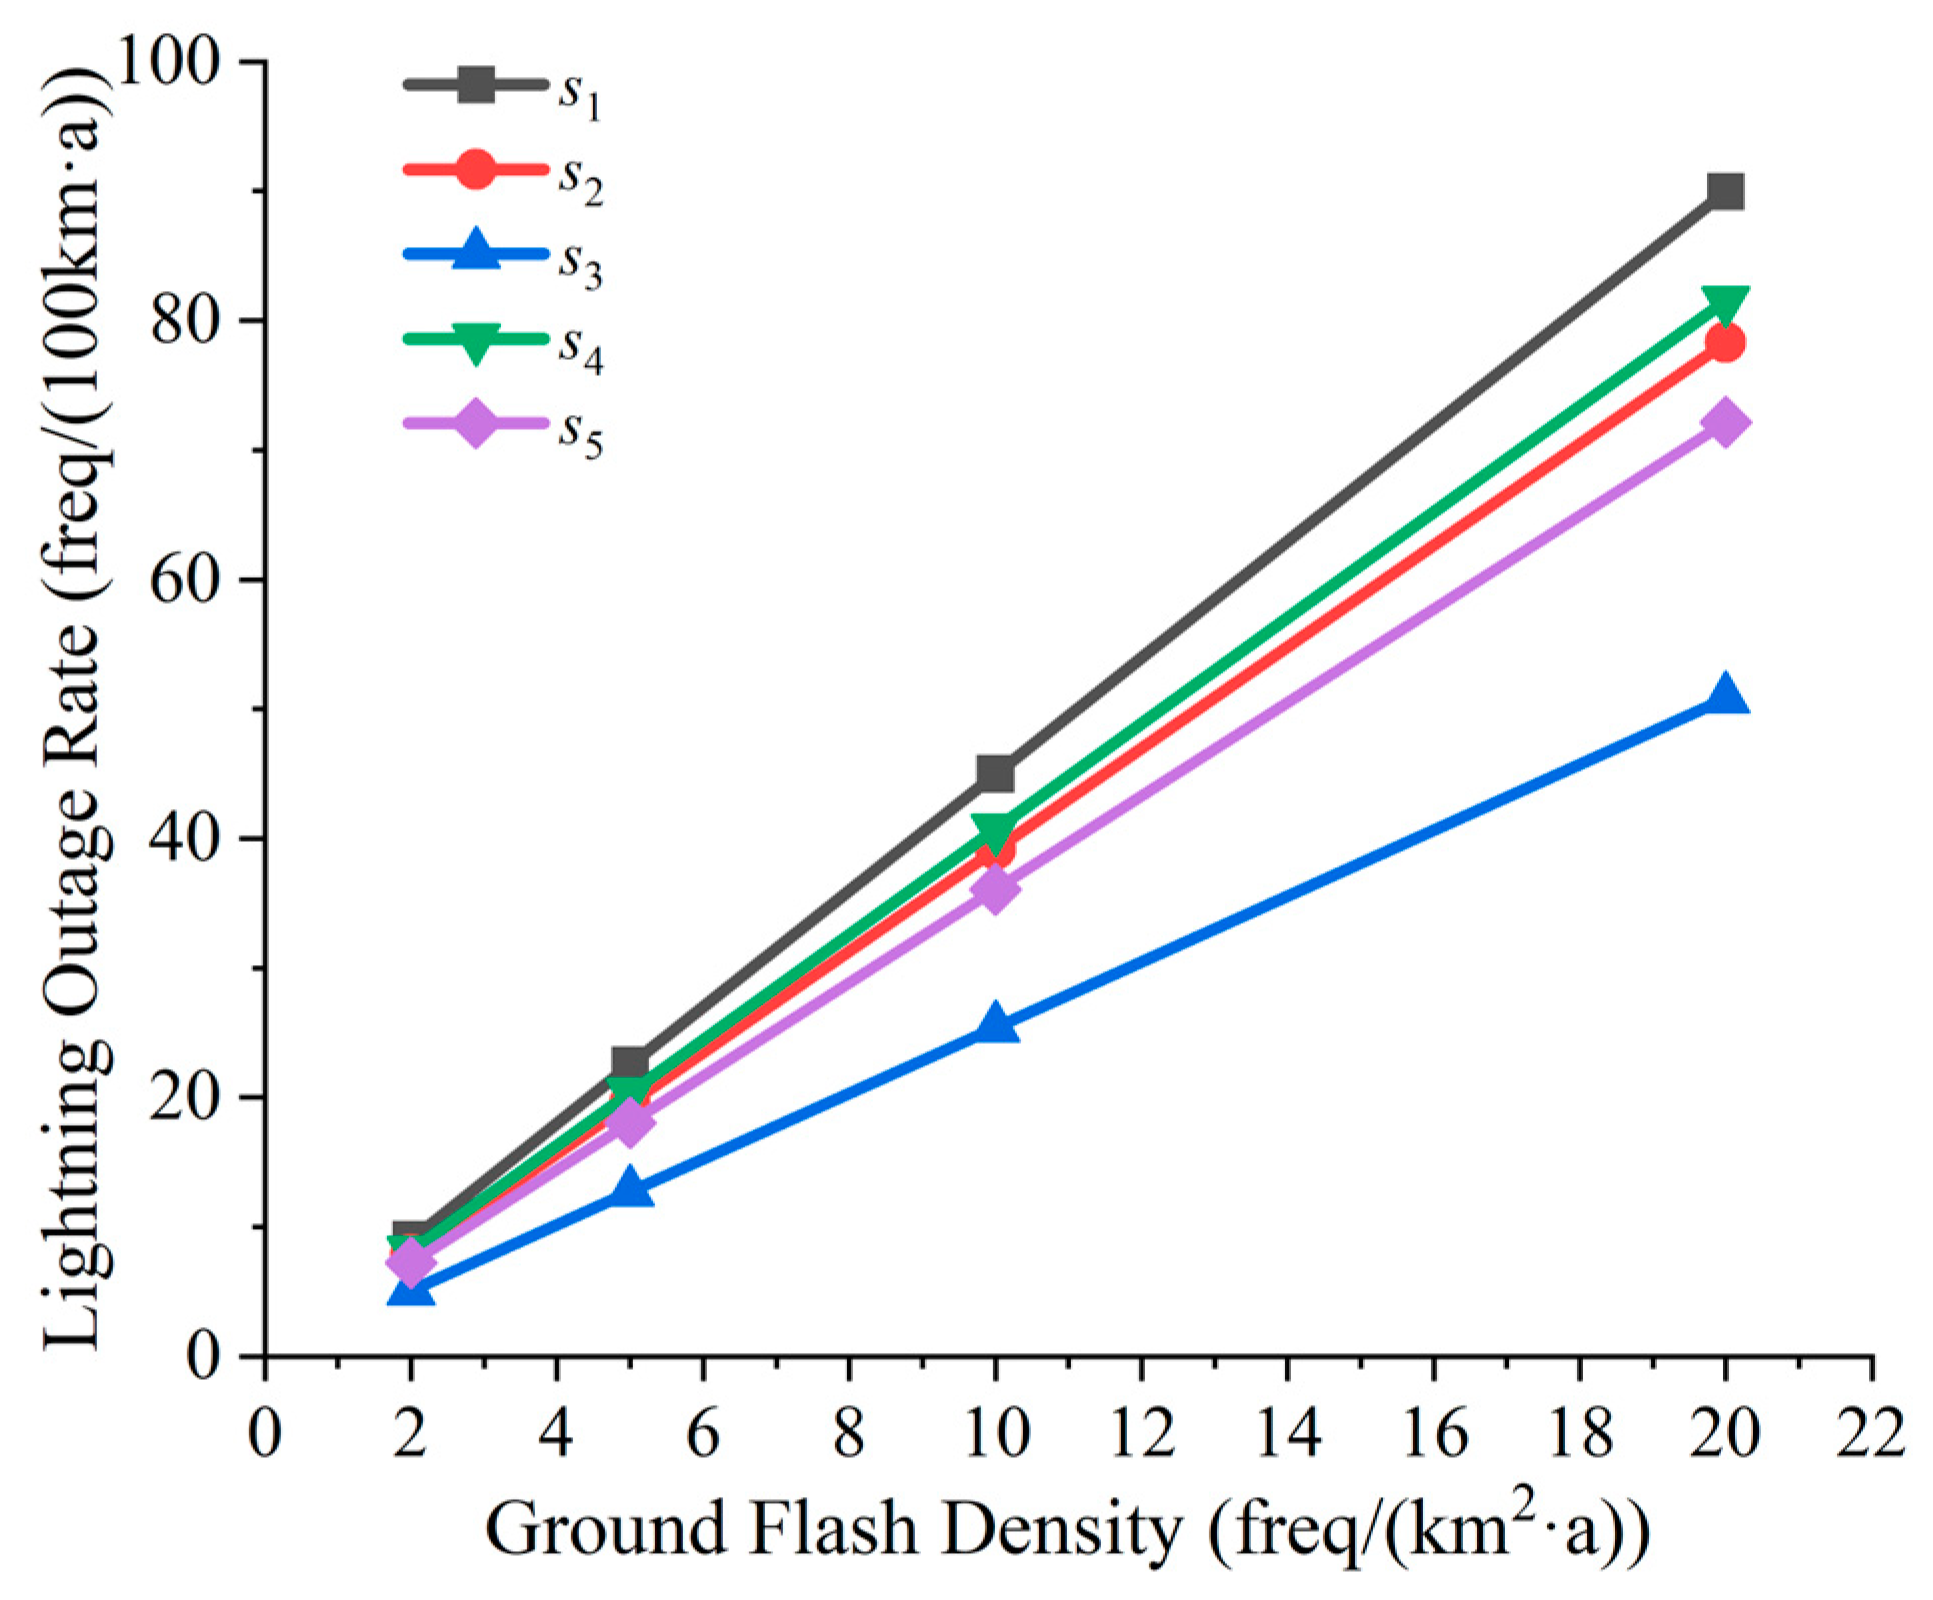
The lightning outage rates on different ground flash densities are shown in Figure 8. The meaning of the Y-axis unit in Figure 8 is the number of lightning strikes per 100 km long line per year that caused outage, while the meaning of the X-axis is the number of lightning strikes per square kilometer area per year.
As shown in Figure 8, there is a linear relationship between ground flash density and lightning outage rate, which could also be derived from Equations (3)–(8). In addition, the lightning outage rate was the lowest when installing lightning arresters on the whole three phases of the entire lines, which decreased by 39.75% compared to not installing lightning arresters. In addition, the lightning outage rate decreased by 8.06% when installing lightning arresters on the highest phase of the entire lines, 2.44% when installing lightning arresters on the highest phase on every two towers, and 9.19% when installing lightning arresters on the whole three phases every two towers.

4. Discussion

In this paper, the transient simulation models for directed and lightning-induced strikes were constructed. Then, the effect of different factors on the lightning withstanding level and lightning outage rate under continuous lightning strikes and single lightning strikes were calculated and analyzed. In this section, the regular patterns presented by the calculated data are discussed and explained.

4.1. Discussion on the Lightning Withstanding Level

From Table 4, Table 5 and Table 6, it can be seen that when lightning arresters were installed on the whole three phases of the entire lines, the LWL was much higher than that in other situations. This was because the lightning overcurrent could only flow through the lightning arrester to the ground when adopting this lightning protection strategy, and the LWL was determined by the nonlinear characteristics of the lightning arrester.
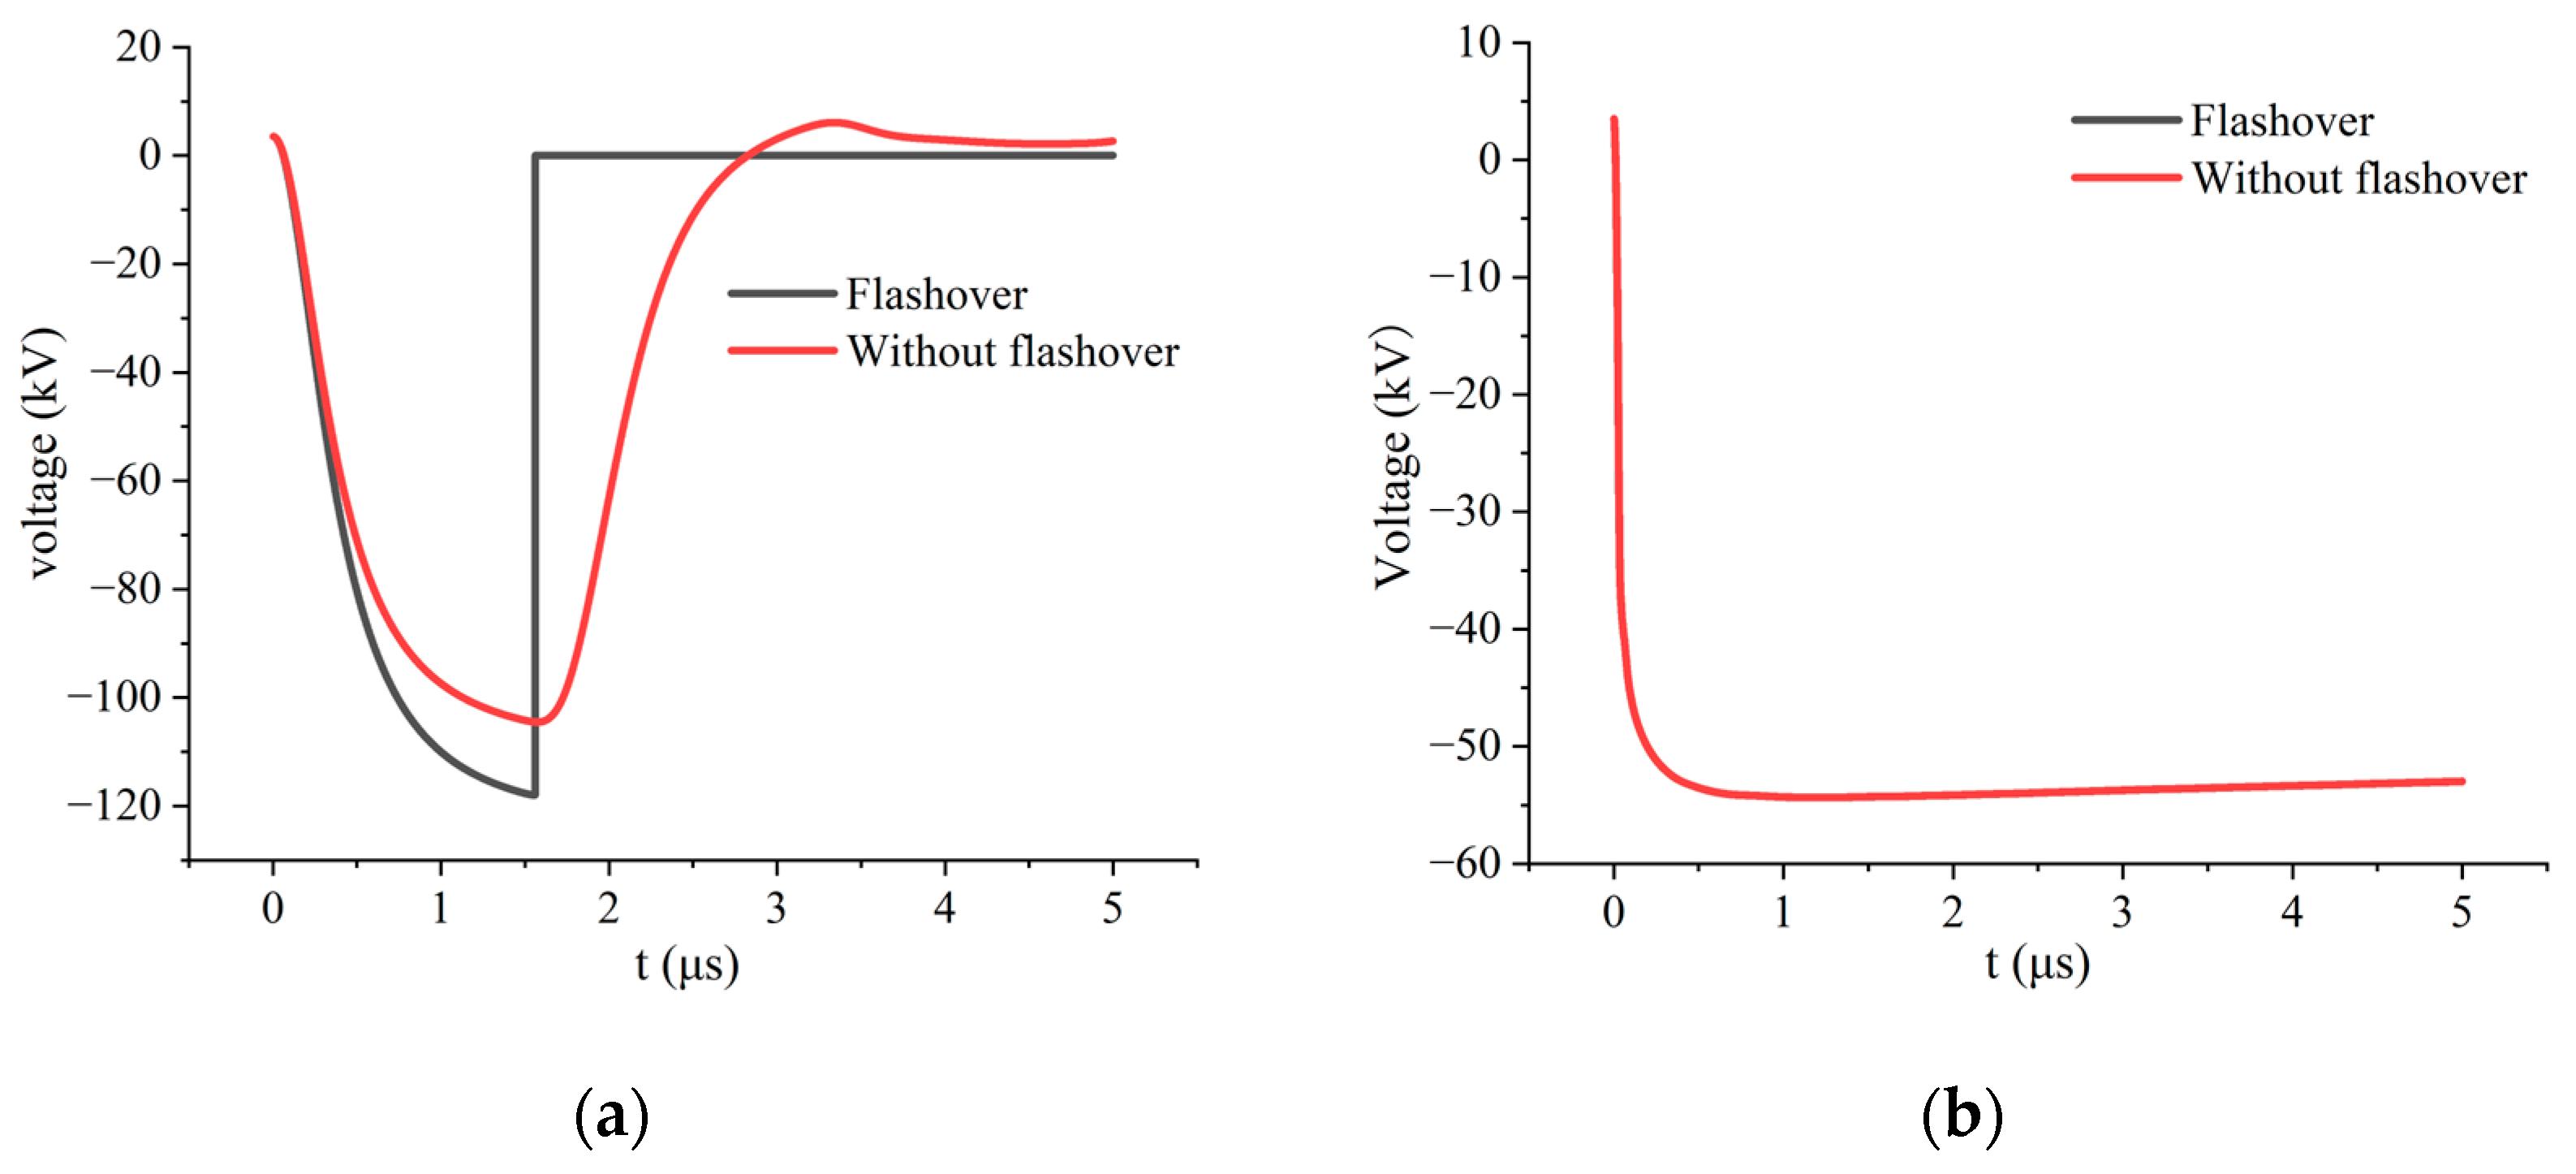
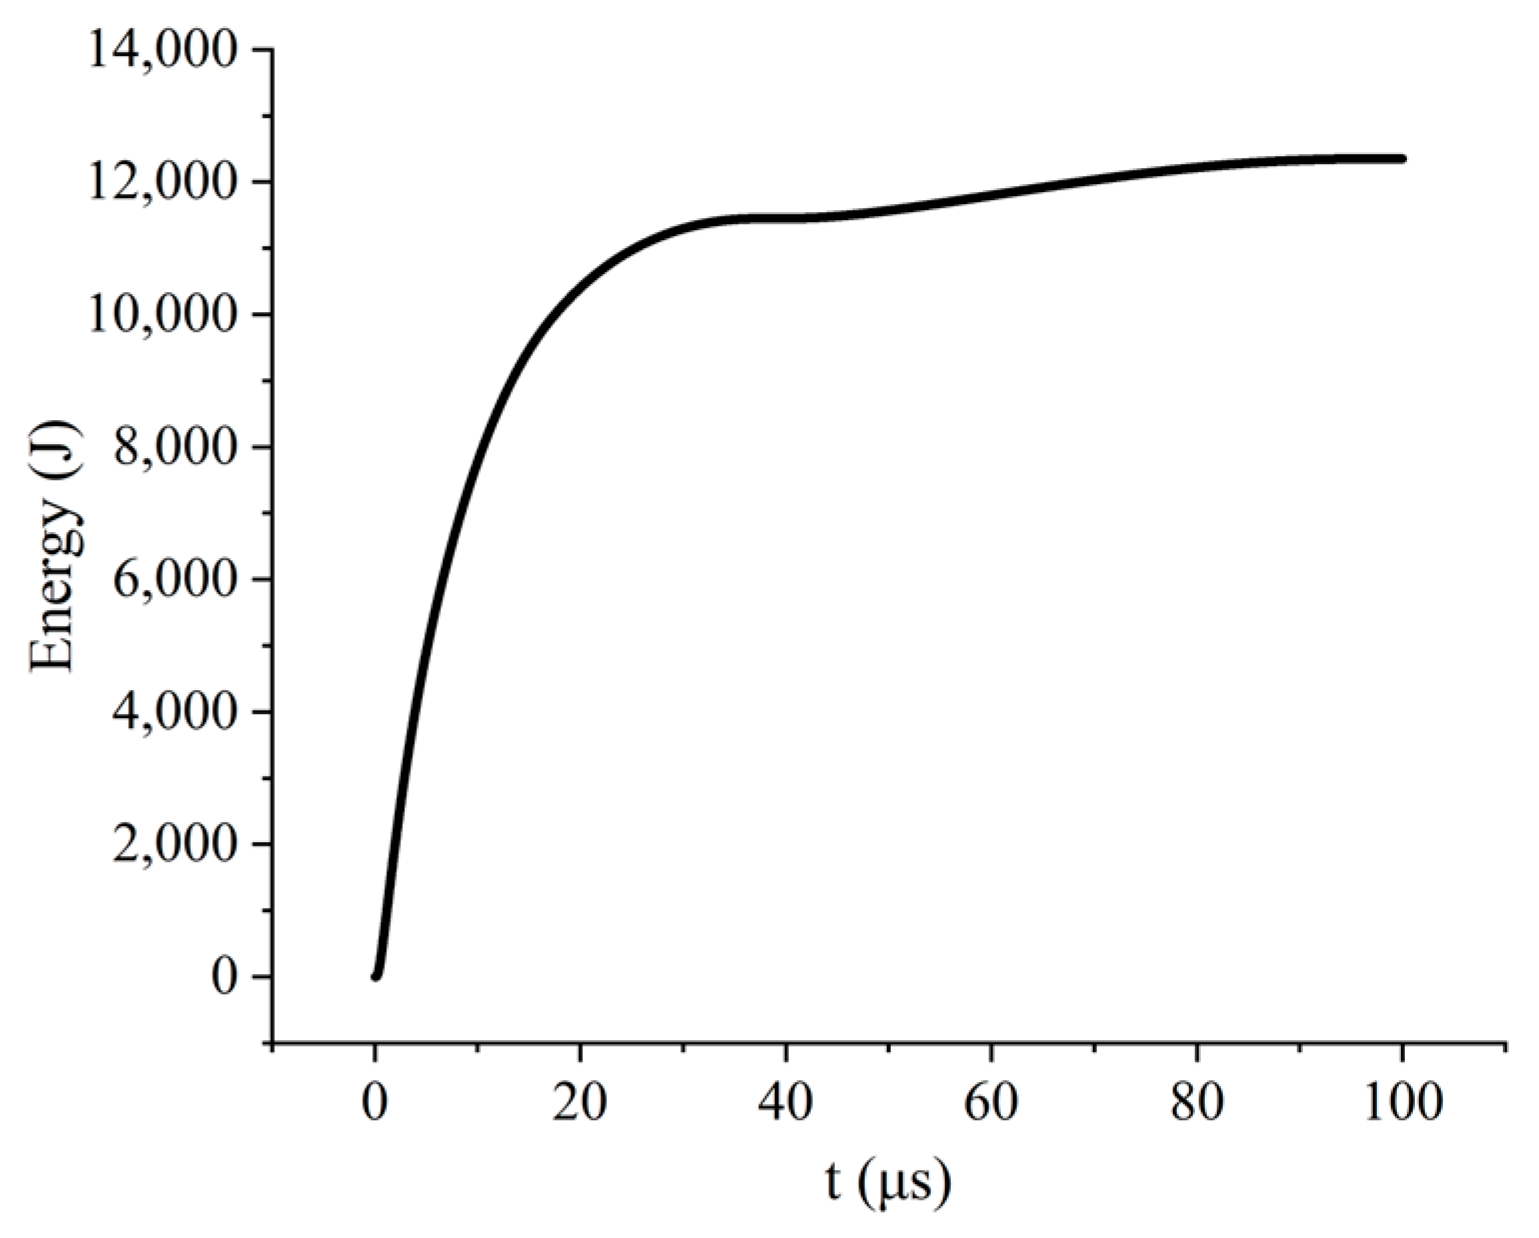
Taking lightning strikes on lines as an example, Figure 9 compares the voltages of the insulator when the lightning current amplitude is higher and lower than the LWL. The ‘Flashover’ in Figure 9 refers to a short circuit occurring in the insulators or lightning arresters due to the parallel connection between insulators and lightning arresters. Figure 10 shows the energy absorption curve of the lightning arrester when the lightning strike amplitude reaches the LWL under CLS.
As shown in Figure 9, when strategy s1 was adopted, there was a significant change in the insulators’ voltage waveform as the lightning current amplitude increased. Then, the flashover occurred when the insulators’ voltage exceeded the impulse voltage. In addition, when strategy s3 was adopted, there was no significant change in the waveform of the insulators’ voltage as the lightning current amplitude increased. Even if the amplitude of the lightning current was higher than the LWL, the insulator’s voltage was much smaller than the impulse voltage. As shown in Figure 10, the energy absorbed by the lightning arrester gradually increased until it exceeded 12,300 J, causing a short circuit.
Based on the Volt-Ampere characteristic curve of the lightning arrester shown in Figure 3, it can be concluded that the state of the lightning arrester changed from high impedance to low impedance when the voltage of the lightning arrester exceeded a certain value. Then, the current flowing through the lightning arrester to the tower and the ground rapidly increased. At this point, the voltage divider of the tower and grounding resistance rapidly increased, stabilizing the voltage at both ends of the insulator and lightning arrester. Furthermore, the flashover condition had changed from insulator voltage exceeding the limit to lightning arrester energy absorption exceeding the limit. Due to the need for lightning arresters to absorb more energy to cause short circuits, the LWL was greatly improved when lightning arresters were installed in all three phases of the line.
Therefore, when lightning struck the lines or when lightning-induced strikes occurred near the lines, the greater the grounding resistance, the stronger its voltage divider ability, the slower the lightning arrester absorbed energy, and the higher the LWL. Unlike this, when lightning struck the towers, the insulators, lightning arresters, and towers were connected in parallel. At this point, the greater the grounding resistance, the greater the current flowing through the lightning arrester, the faster the energy absorption, and the lower the LWL.
In addition, when other lightning protection strategies were adopted, the lightning current did not have to flow through the lightning arrester to the ground. Thus, the flashover’s condition was still the insulator voltage exceeding the limit. Therefore, the LWL was lower than that of when strategy s3 was adopted.

4.2. Discussion on the Lightning Outage Rate

From Figure 6, it can be concluded that the lightning outage rate under a single lightning strike was lower than that under continuous lightning strikes. Combining the data from Table 4, Table 5 and Table 6, it can be seen that this difference was mainly because when lightning struck the tower, the LWL under continuous lightning strikes was significantly lower than that under a single lightning strike. In the simulation process, it was found that the insulator was more likely to break down in subsequent lightning strikes under continuous lightning strikes, rather than the first lightning strike when lightning struck the tower.
This indicated that even if the amplitude of subsequent lightning strikes was smaller than that of the first lightning strike, its greater steepness had a greater impact on the insulators’ voltage. It is probably because the greater lightning current steepness increased the inductive impedance of the tower, resulting in high insulator voltage even at smaller lightning current amplitudes.

4.3. Differentiated Lightning Protection Strategy

From Figure 6, Figure 7 and Figure 8, the installation of lightning arresters on the whole three phases of the line was the most effective lightning protection method, but the economic cost was relatively high. The lightning protection effect of installing lightning arresters on the highest phase of the entire line was similar to that of installing lightning arresters on the whole three phases every two towers. The lightning protection effect of installing lightning arresters on the highest phase of every two towers was similar to that of replacing insulators, and the economic cost of replacing insulators was lower.
Based on the above analysis, for areas with huge ground flash density, lightning arresters should be installed on the whole three phases of the line as much as possible to ensure reliability. For areas with high ground flash density, lightning arresters on the whole three phases of every two towers should be considered preferentially. For areas with low ground flash density, priority could be given to installing suitable insulators, without the need for installing lightning arresters.

5. Conclusions

A simulation model of lightning strike distribution lines was built on ATP-EMTP in this paper. The lightning withstanding level under continuous lightning strikes and single lightning strikes when using different lightning protection strategies was calculated. In addition, the influence of grounding resistance and tower type on the lightning withstanding level has also been analyzed. Furthermore, the lightning outage rate was calculated after obtaining the lightning-withstanding levels of lightning-struck lines, lightning-struck towers, and lightning-induced strikes. The following conclusions were found by the analysis of the simulation results:
  • The continuous lightning strikes had a greater impact on distribution lines. Especially when lightning struck the towers, the lightning withstanding level under continuous lightning strikes was significantly lower than that under single lightning strikes;
  • In general, the higher the grounding resistance, the lower the lightning withstanding level. However, there was an opposite trend in the lightning withstanding level when lightning struck the lines and induced lightning if the lightning arresters were installed on the whole three phases of the entire lines. In addition, the lightning outage rate of the double-circuit tower was higher than that of the single-circuit tower;
  • It was recommended to install lightning arresters on the whole three phases of the entire line as a lightning protection strategy in areas with huge ground flash density, to install lightning arresters on the whole three phases every two towers in areas with high ground flash density, and to replace insulators with higher impulse voltage in areas with low ground flash density.

Author Contributions

Conceptualization, D.L. and W.S.; methodology, K.S.; software, D.L. and R.Z.; validation, D.L., W.S. and R.Z.; formal analysis, D.L.; investigation, Z.Z.; resources, Z.Z.; data curation, Z.Z.; writing—original draft preparation, T.D.; writing—review and editing, J.G.; visualization, D.L.; supervision, D.L.; project administration, D.L.; funding acquisition, D.L. All authors have read and agreed to the published version of the manuscript.

Funding

This research was funded by the Technology Project of China Southern Power Grid, grant number 031300KC23040015.

Data Availability Statement

The data presented in this study are available on request from the corresponding author due to privacy.

Conflicts of Interest

Authors Duanjiao Li and Wenxing Sun are employed by Guangdong Power Grid Co., Ltd., China Southern Power Grid, Guangzhou 510620, China. Author Kunyu Song is employed by Electric Power Research Institute, Guangdong Power Grid Co., Ltd., Guangzhou 510050, China. Authors Ruifeng Zhu and Zhenxin Zhong are employed by Huizhou Power Supply Bureau, Guangdong Power Grid Co., Ltd., Huizhou 516001, China. The authors declare that they have no known competing financial interest or personal relationships that could have appeared to influence the work reported in this paper.

References

  1. Cai, L.; Xu, C.F.; Wang, J.G.; Chu, W.X.; Zhou, M.; Fan, Y.D.; Cao, J.X. Three-Phase Overvoltage Induced on Overhead Distribution Line 40 m from Rocket-Triggered Lightning. IEEE Trans. Power Deliv. 2023, 38, 3782–3791. [Google Scholar] [CrossRef]
  2. Cao, J.X.; Du, Y.P.; Ding, Y.X.; Qi, R.H.; Li, B.H.; Chen, M.L.; Li, Z. Practical Schemes on Lightning Energy Suppression in Arresters for Transformers on 10 kV Overhead Distribution Lines. IEEE Trans. Power Deliv. 2022, 37, 4272–4281. [Google Scholar] [CrossRef]
  3. Ishimoto, K.; Asakawa, A.; Sato, T.; Miyama, Y. Study on Lightning Protection Measures for Distribution Lines and Customer Equipment against Back Flow Lightning Current from Radio Communication Station. Electr. Eng. Jpn. 2017, 200, 30–44. [Google Scholar] [CrossRef]
  4. Alves, A.F.S.; Araújo, M.A. Survey on analytical and numerical methods for lightning-induced voltages calculations. Electr. Eng. 2024, 106, 905–916. [Google Scholar] [CrossRef]
  5. Cai, L.; Xu, C.F.; Cao, J.X.; Zhou, M.; Chu, W.X.; Wang, J.G.; Fan, Y.D. Observation of induced voltage on 10 kV overhead distribution lines with and without shield wire by rocket triggered lightning. Electr. Power Syst. Res. 2023, 224, 109707. [Google Scholar] [CrossRef]
  6. Soto, E.; Pérez, E. Lightning Performance of Non-Homogeneus Overhead Distribution Lines. In Proceedings of the 2018 34th International Conference on Lightning Protection (ICLP), Rzeszow, Poland, 2–7 September 2018; pp. 1–5. [Google Scholar]
  7. Tang, X.L.; Yang, F.; Zheng, Z.Y.; Hu, Y.F.; Wu, X.X.; Hou, H. Research on the Improving Lighting Protection Level for Strong Lightning Activity Area and Easily Suffering Lighting Strike Distribution Line. Procedia Comput. Sci. 2019, 155, 809–814. [Google Scholar] [CrossRef]
  8. Sestasombut, P.; Ngaopitakkul, A. Evaluation of a Direct Lightning Strike to the 24 kV Distribution Lines in Thailand. Energies 2019, 12, 3193. [Google Scholar] [CrossRef]
  9. Alipio, R.; Duarte, M.H.R.; Dias, J.C.A. Lightning performance of transmission lines partially protected by surge arresters considering typical Brazilian conditions. In Proceedings of the 2017 International Symposium on Lightning Protection (XIV SIPDA), Natal, Brazil, 2–6 October 2017; pp. 365–369. [Google Scholar]
  10. Yokoyama, S.; Sato, T. Designing Method of Insulation Strength and Lightning Protection for Overhead Power Distribution Lines. In Proceedings of the 2018 34th International Conference on Lightning Protection (ICLP), Rzeszow, Poland, 2–7 September 2018; pp. 1–7. [Google Scholar]
  11. Paulino, J.O.S.; Barbosa, C.F.; Lopes, I.J.S.; Boaventura, W.C.; Cardoso, E.N.; Guimarães, M.F. Lightning protection of overhead distribution lines installed on high resistivity soil. Electr. Power Syst. Res. 2022, 209, 107952. [Google Scholar] [CrossRef]
  12. Yang, Y.; Wang, S.; Wang, S.F.; Yang, Y.; Wang, S.; Wang, S.F.; Wang, Q.J.; Xie, W.; Ye, L.; Tu, J.L.; et al. Lightning trip-out risk assessment and differential lightning protection of 35 kV transmission lines in mountain wind farm. Energy Rep. 2022, 8, 581–588. [Google Scholar] [CrossRef]
  13. Mahmood, F.; Rizk, M.E.M.; Lehtonen, M. Risk-based insulation coordination studies for protection of medium-voltage overhead lines against lightning-induced overvoltages. Electr. Eng. 2019, 101, 311–320. [Google Scholar] [CrossRef]
  14. Chen, H.C.; Du, Y.P.; Yuan, M.Q.; Liu, Q.H. Lightning-Induced Voltages on a Distribution Line With Surge Arresters Using a Hybrid FDTD–SPICE Method. IEEE Trans. Power Deliv. 2018, 33, 2354–2363. [Google Scholar] [CrossRef]
  15. Michishita, K.; Hirao, A.; Yokoyama, S. Fault Rate of Power Distribution Line Connected to Wind Turbine by Winter Lightning. In Proceedings of the 2018 34th International Conference on Lightning Protection (ICLP), Rzeszow, Poland, 2–7 September 2018; pp. 1–5. [Google Scholar]
  16. Nie, Y. Optimization Design of Distribution Line Lightning Protection Based on BP Neural Network Algorithm. In Proceedings of the 2022 Euro-Asia Conference on Frontiers of Computer Science and Information Technology (FCSIT), Beijing, China, 16–18 December 2022; pp. 56–59. [Google Scholar]
  17. Saba, M.M.F.; Ballarotti, M.G.; Pinto, O. Negative cloud-to-ground lightning properties from high-speed video observations. J. Geophys. Res. Atmos. 2006, 111, D03101. [Google Scholar] [CrossRef]
  18. Rakov, V.A.; Huffines, G.R. Return-Stroke Multiplicity of Negative Cloud-to-Ground Lightning Flashes. J. Appl. Meteorol. 2003, 424, 1455–1462. [Google Scholar] [CrossRef]
  19. Rizk, M.E.M.; Mahmood, F.; Lehtonen, M.; Badran, E.A.; Abdel-Rahman, M.H. Computation of Peak Lightning-Induced Voltages Due to the Typical First and Subsequent Strokes Considering High Ground Resistivity. IEEE Trans. Power Deliv. 2017, 32, 1861–1871. [Google Scholar] [CrossRef]
  20. Cao, J.X.; Du, Y.P.; Ding, Y.X.; Qi, R.H.; Chen, M.L.; Li, Z.; Zhao, X.G.; Andreotti, A. Lightning Protection with a Differentiated Configuration of Arresters in a Distribution Network. IEEE Trans. Power Deliv. 2023, 38, 409–419. [Google Scholar] [CrossRef]
  21. IEC 62305-4:2010; Protection against Lightning—Part 4: Electrical and Electronic Systems within Structures. IEC: Geneva, Switzerland, 2010.
  22. IEC 62858:2019 RLV; Lightning Density Based on Lightning Location Systems—General Principles. IEC: Geneva, Switzerland, 2019.
  23. Huang, J.N.; Han, Y.X.; Liao, Z.M. Simulation Modeling and Protection of Lightning Intrusion Wave in Substation Under Multiple Return Strike Cloud-ground Flashes. Guangdong Electr. Power 2023, 35, 66–75. [Google Scholar]
  24. Silveira, F.H.; Visacro, S. Lightning Parameters of a Tropical Region for Engineering Application: Statistics of 51 Flashes Measured at Morro do Cachimbo and Expressions for Peak Current Distributions. IEEE Trans. Electromagn. Compat. 2020, 62, 1186–1191. [Google Scholar] [CrossRef]
  25. Matsui, M.; Michishita, K.; Yokoyama, S. Characteristics of Negative Flashes with Multiple Ground Strike Points Located by the Japanese Lightning Detection Network. IEEE Trans. Electromagn. Compat. 2019, 61, 751–758. [Google Scholar] [CrossRef]
  26. Zhan, Y.J.; Sima, W.X.; Zhang, Z.J. Summary of the study of tower models for lightning protection analysis. High Volt. Eng. 2006, 32, 93–97. [Google Scholar]
  27. Yan, X.; Wang, Y.F.; Tang, G.D.; Zhu, H.H.; Hu, J.Y.; Qiu, W. Research on Application of Coupled Ground Wire in 10 kV Overhead Line. High Volt. Apparatus 2022, 12, 92–101. [Google Scholar]
  28. Lin, G.; Bao, M.Z.; He, Y.C. Differential Lightning Protection Strategy and Comprehensive Evaluation of 10 kV Distribution Lines. South. Power Syst. Technol. 2023, 17, 32–41. [Google Scholar]
  29. Wang, Y.F.; Tang, X.; Jiang, L.F.; Wu, W.F.; Hu, J.Y. Lightning Protection Method for 10 kV Overhead Line Using MOA and Coupling Ground Wire. Insul. Surge Arresters 2023, 5, 18–27. [Google Scholar]
  30. IEEE Standard 1243-1997; IEEE Guide for Improving the Lightning Performance of Transmission Lines. IEEE: New York, NY, USA, 2021.
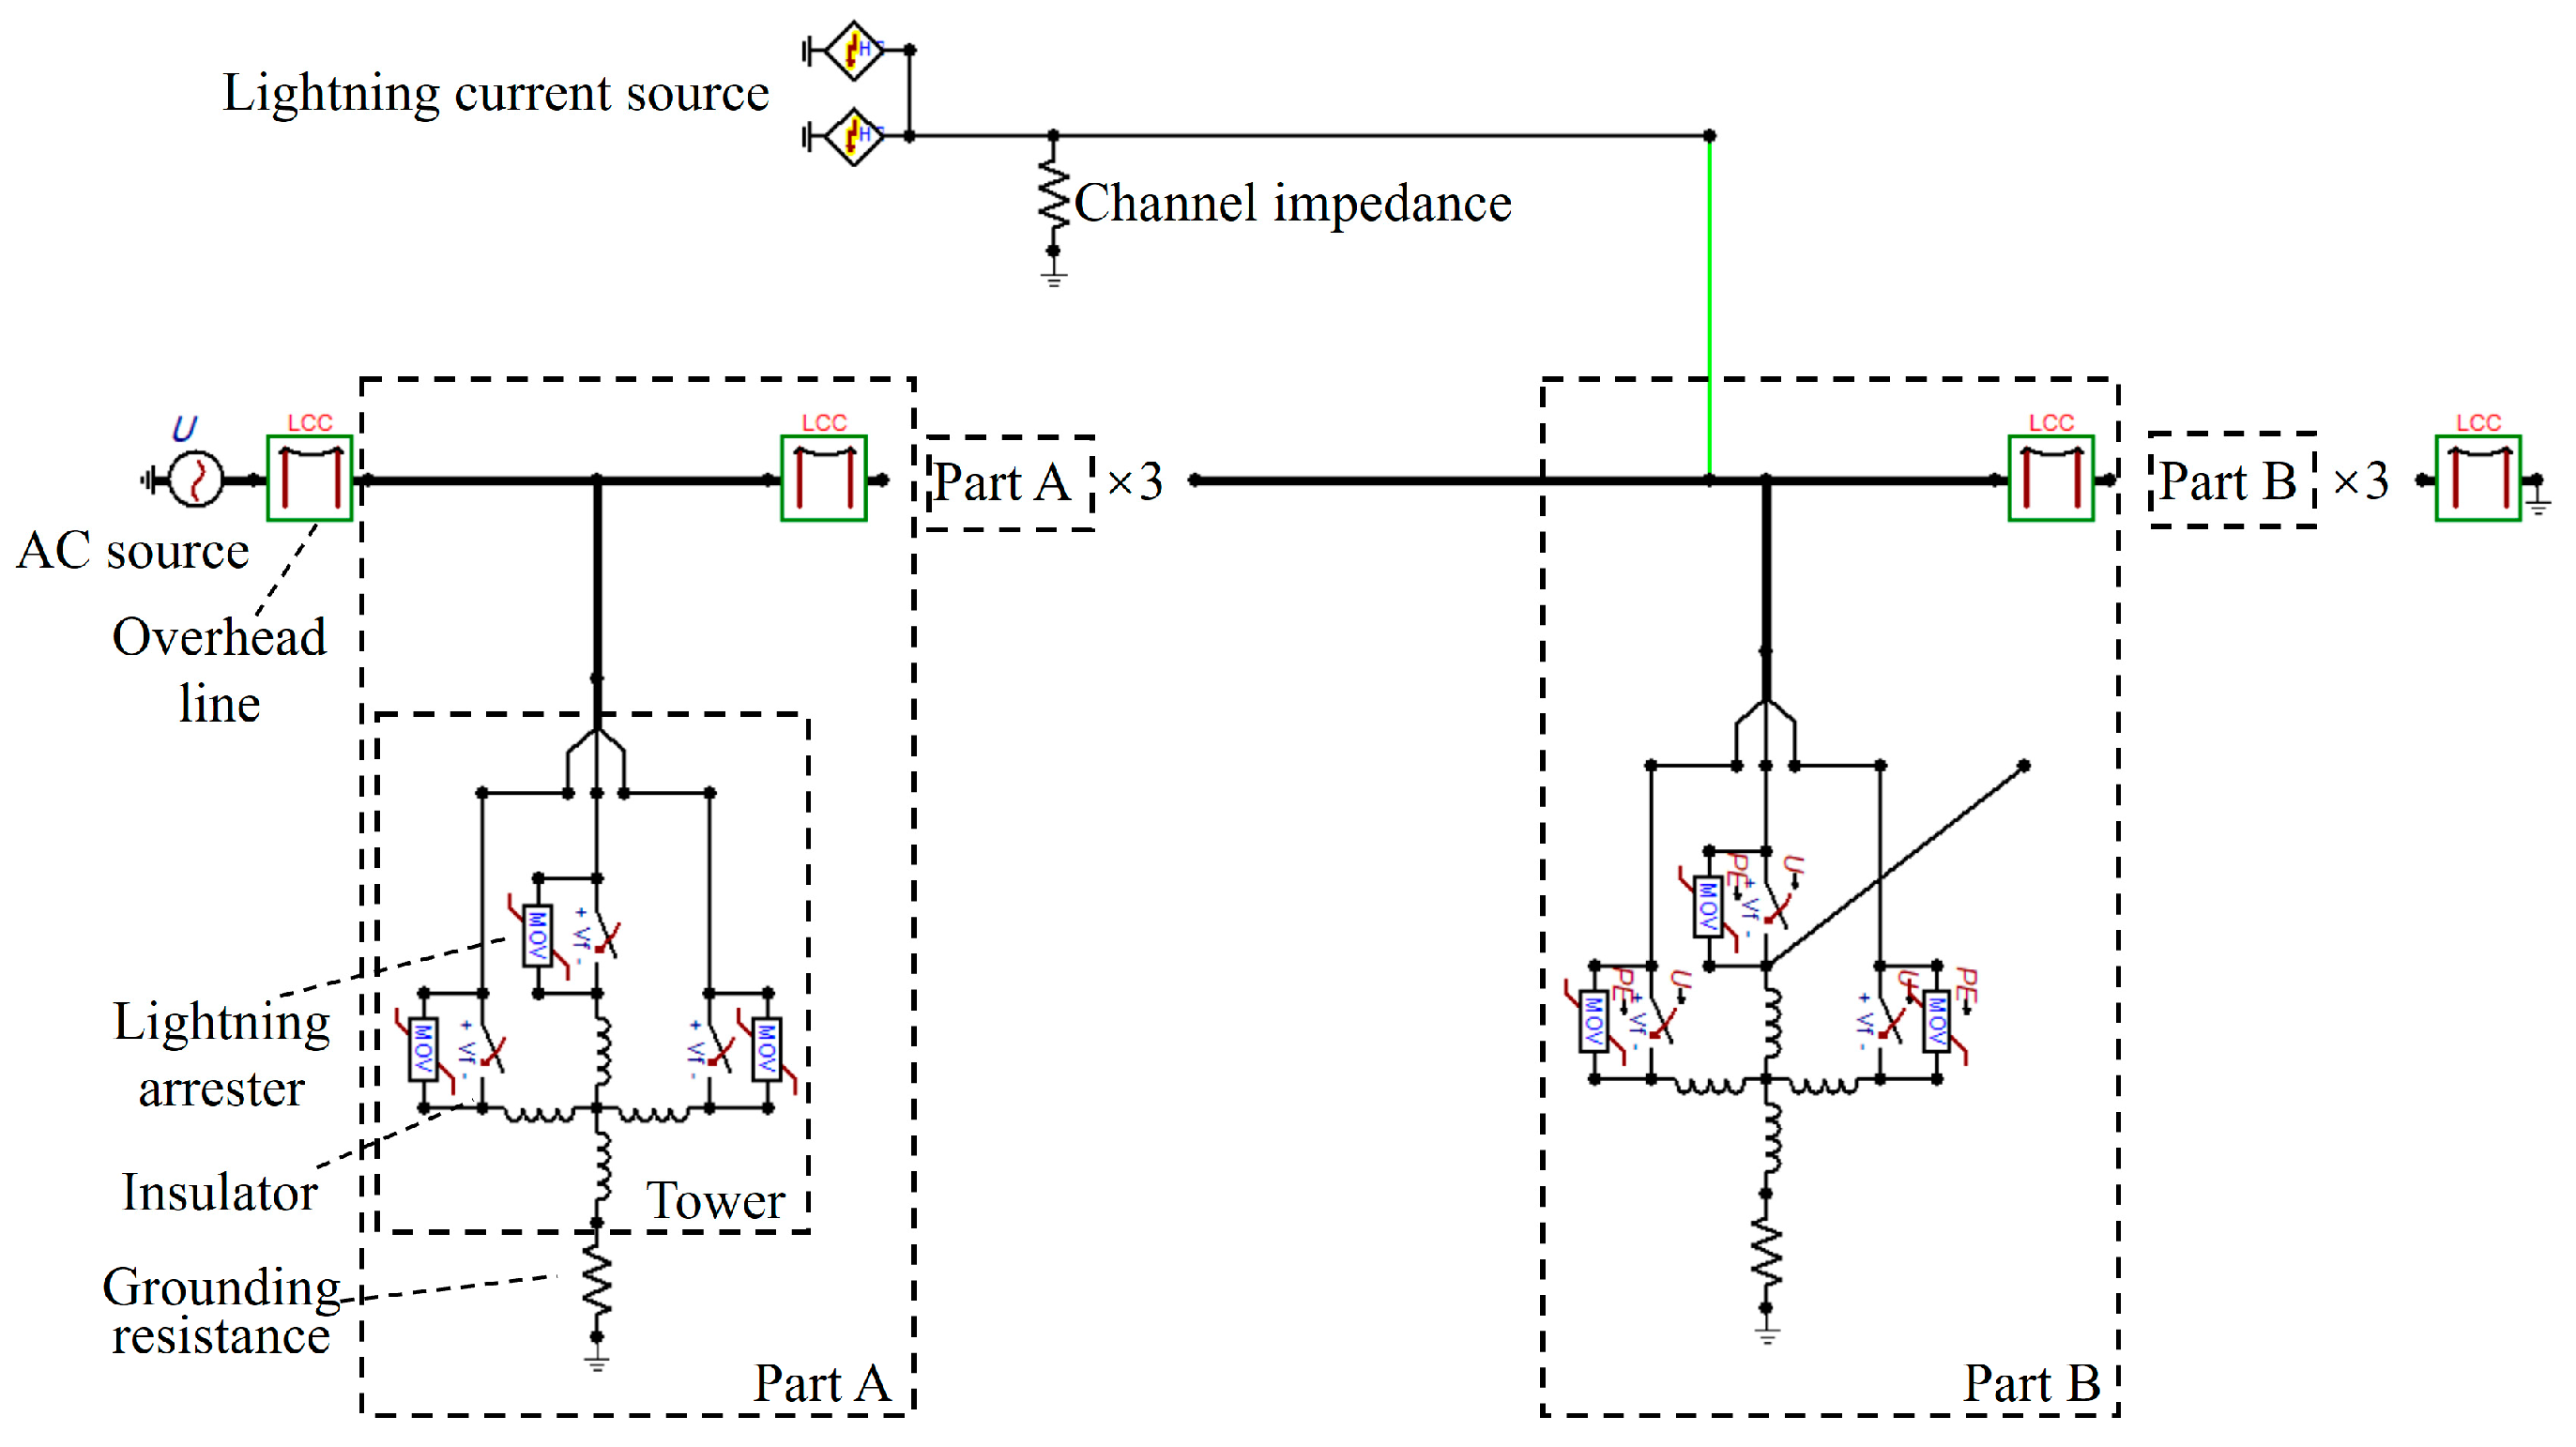
Figure 1. The direct lightning voltage model.
Energies 17 04568 g001
Figure 2. Tower structure diagram: (a) Single horizontal tower; (b) Single triangular tower; (c) Double circuit tower.
Energies 17 04568 g002
Figure 3. Volt-Ampere characteristic curve of the lightning arrester.
Energies 17 04568 g003
Figure 4. The lightning-induced voltage model.
Energies 17 04568 g004
Figure 5. Calculation process of the lightning withstanding level.
Energies 17 04568 g005
Figure 6. Lightning outage rates on different grounding resistances.
Energies 17 04568 g006
Figure 7. Lightning outage rates on different tower types.
Energies 17 04568 g007
Figure 8. Lightning outage rate on different ground flash densities.
Energies 17 04568 g008
Figure 9. Voltage waveform of the insulators: (a) strategy s1; (b) strategy s3.
Energies 17 04568 g009
Figure 10. Energy absorbed by the lightning arrester when adopting strategy s3.
Energies 17 04568 g010
Table 1. Parameters of overhead lines and coupling ground lines [27].
TypeSectional Area
(in mm2)
Inside Diameter
(in mm)
Outside Diameter (in mm)Sag
(in m)
Insulation Thick
(in mm)
JL/G1A-95/15109.374.4213.60.6660.0
Table 2. Parameters.
ModelParameters
Time parameter of the lightning impulse waveformFirst lightning2.6/50 μs
Subsequent lightning0.25/100 μs
Inductance of the tower0.84 μH/m
Types of the towerssingle horizontal towerZ1-1
single triangle towerZ1-2
Double circuit towerZ1-3
Grounding resistance15, 20, 25, 30 Ω
Types of the overhead linesJL/G1A-95/15
Impulse voltage of the insulatorsPS-15105 kV
P-15118 kV
Type of the arrestersHY5WS-17/50
Ground flash density2, 5, 10, 20 (km2·a)−1
Table 3. Lightning protection strategy.
Numbers1s2s3s4s5s6s7s8s9s10
Installation typea1
b1
a2
b1
a3
b1
a4
b1
a5
b1
a1
b2
a2
b2
a3
b2
a4
b2
a5
b2
Table 4. Lightning withstanding level when struck on lines.
Single Lightning Strike (in A)Continuous Lightning Strikes (in A)
Type of TowerGrounding ResistanceType of TowerGrounding Resistance
Z2-3Z1-2Z1-1202530Z2-3Z1-2Z1-1202530
s10.9111110.911111
s213.612.711.61110.49.910.17.16.46.46.46.4
s331.132.732.633.433.833.826.927.827.829.33030.4
s43.63.93.93.83.63.43.63.93.93.83.63.4
s53.63.93.93.83.63.43.63.93.93.83.63.4
s60.80.90.90.90.90.90.80.90.90.90.90.9
s712.211.510.5109.599.16.55.95.95.95.9
s831.132.732.633.433.833.826.927.827.829.33030.4
s933.33.33.232.933.33.33.232.9
s1033.33.33.232.933.33.33.232.9
Table 5. Lightning withstanding level when struck the towers.
Single Lightning Strike (in A)Continuous Lightning Strikes (in A)
Type of TowerGrounding ResistanceType of TowerGrounding Resistance
Z2-3Z1-2Z1-1202530Z2-3Z1-2Z1-1202530
s14.35.25.24.94.64.21.51.51.51.51.51.5
s210.498.27.77.26.77.14.23.63.73.73.6
s321.514.614.7131211.316.712.612.610.79.68.7
s47.3887.576.56.94.23.73.73.73.6
s57.58.48.47.97.46.97.56.97.27.17.16.9
s63.84.64.64.343.71.31.31.31.31.31.3
s79.17.87.26.76.35.86.23.63.23.23.23.2
s821.514.614.7131211.316.712.612.610.79.68.7
s96.67.47.26.76.35.863.63.23.23.23.2
s106.87.77.77.26.76.36.86.26.56.56.46.3
Table 6. Lightning withstanding level on lightning-induced strike.
Single Lightning Strike (in A)
Type of TowerGrounding Resistance
Z2-3Z1-2Z1-1202530
s137.8 49.5 49.5 49.5 49.5 49.5
s253.8 63.0 63.3 64.2 65.2 66.1
s34030.5 1037.8 1033.2 1288.9 1534.5 1769.6
s450.3 53.4 53.4 53.3 53.2 53.1
s5108.3 75.4 74.9 74.2 73.0 72.0
s636.8 44.0 44.0 44.0 44.0 44.0
s752.4 54.9 55.1 55.0 56.5 57.4
s84030.5 1037.8 1033.2 1288.9 1534.5 1769.6
s947.7 46.8 47.2 47.1 47.1 47.0
s1090.0 64.1 63.7 62.8 62.0 61.4
Disclaimer/Publisher’s Note: The statements, opinions and data contained in all publications are solely those of the individual author(s) and contributor(s) and not of MDPI and/or the editor(s). MDPI and/or the editor(s) disclaim responsibility for any injury to people or property resulting from any ideas, methods, instructions or products referred to in the content.