1. Introduction
The increasing demands for reliability in distribution networks align with the ongoing development of society. Under normal operating conditions, distribution networks can swiftly identify fault components, isolate faults, and restore power supplies [
1,
2]. Nevertheless, in recent years, the occurrence of high-impact and low-probability (HILP) events has increased, resulting in catastrophic failures in power systems [
3]. These events adversely affect numerous power components, thereby severely compromising the safe and reliable operation of distribution networks. The occurrence of power outages due to disasters, both domestically and internationally, has emphasized the urgent necessity to enhance the reliability of power grids [
4,
5]. For example, in September 2016, severe storms and lightning struck Australia, causing overnight power losses for 1.6 million residents in South Australia [
6]. Similarly, in February 2021, Texas faced a cold wave of ice and snow, compelling the shutdown of 40,000 MW generating units. The maximum power limit load exceeded 20% of the pre-incident load, leaving approximately 5 million users without power [
7].
Catastrophic failures resulting from extreme disasters continue to pose significant threats to the uninterrupted and stable power supply provided by distribution networks. To evaluate the power system’s ability to withstand extreme disasters and recover from fault states, scholars have introduced the concept of ‘resilience’ [
8,
9]. Resilience encompasses not only the system’s capacity to enhance its ability to recover but also emphasizes the system’s reliable absorption and adaptation to external disturbances. This enables it to maintain operational functionality to the greatest extent possible and promptly return to normal operation [
10]. In the event of a fault in the distribution network, a highly resilient distribution network can not only swiftly prevent fault propagation and facilitate fault removal but also expeditiously restore normal and stable operational states. This ensures the reliability of the power supply within the distribution network [
11,
12].
Active distribution networks (ADNs) play a crucial role in the integration of large-scale intermittent renewable energy sources and in enhancing the reliability of users’ power consumption [
13]. It is evident that ADNs will shape the future development of distribution networks. Compared to transmission networks, distribution networks have lower redundancy, aging equipment, outdated protection methodologies, and limited resilience against extreme disasters [
14,
15]. Consequently, distribution networks are significantly impacted by extreme disasters. In such scenarios, fast and accurate fault localization becomes a prerequisite for enhancing the resilience and power supply reliability of distribution networks [
16].
Considerable research has been conducted by many scholars on active distribution network protection.
Table 1 provides a horizontal comparison between the method proposed in this paper and other existing methods. The comparison indicates that the proposed method exhibits strong functionality and adaptability, enabling the identification of short-circuit and open-circuit faults even in scenarios with high fault resistance and penetration rates. Existing protection schemes for distribution networks can be categorized as follows:
1. Enhancement of Traditional Current Protection and Distance Protection: Traditional current and distance protection methods have been improved to accommodate the integration of distributed generation. Proposed adaptations include adaptive current protection or combinations with other protection methods. While directional current protection can adapt to power flow changes resulting from DG integration, traditional directional overcurrent protection schemes suffer from lengthy operation times. To address this, a directional overcurrent protection scheme utilizing double renormalization was proposed in [
17] using double renormalization. Each protection setting included two inverse-time overcurrent protection settings based on fault direction.
In [
18], a distance protection scheme suitable for highly permeable active distribution networks was proposed. Compared to traditional distance protection, this approach incorporated additional parameters, such as distribution transformer parameters and upstream system zero-sequence impedance, effectively enhancing protection performance. A novel directional relay protection scheme based on post-fault current was introduced in [
19]. By defining a new fault current vector, this scheme succeeded in detecting power direction and determining fault location solely based on post-fault current, independent of power direction, fault transition resistance, and fault starting angle. This method, relying solely on local information, reduced the dependence on communication, enabling easy implementation and rapid response.
However, due to its reliance on local information, this approach faces challenges in fully adapting to the complex fault conditions in distribution networks. This is particularly true with the increasing penetration of distributed power sources and the influence of extreme disasters. Consequently, there is a need to further enhance active distribution network protection schemes;
2. Centralized Protection Scheme: The centralized protection scheme utilizes multi-point information, where measurement information from various points is transmitted to the distribution terminal. The master station utilizes this multi-point measurement information to identify the fault area [
5].
In [
20], a centralized intelligent protection scheme based on communication was proposed, and the communication model and hardware architecture of the protection scheme were given. The protection scheme employed various protection criteria to guarantee protection selectivity. In [
21], an intelligent protection scheme for complex distribution networks based on the wireless token ring protocol (WTRP) was introduced. By leveraging a wireless token ring network protocol for relay data sharing, stations no longer require direct connections to each other or to the main station. This approach effectively enhanced the accuracy and reliability of distribution network protection.
Compared to local protection that uses local information, centralized protection using multi-point information can adapt to complex distribution network faults, leading to more accurate fault identification. However, centralized protection often relies on the availability of multi-point information, demanding high communication and data processing capabilities at the master station. Additionally, because the centralized protection scheme relies on the master station for decision making, it becomes vulnerable to failure in the event of communication or a master station malfunction;
3. Based on the pilot protection of communication: A pilot protection can be constructed using various fault characteristics such as phase current amplitude, current fault component amplitude, and current phase angle change direction.
In [
22], an active distribution network protection scheme was proposed using the positive sequence current mutation at both ends of the line. The protection scheme represents the positive sequence current mutation in the form of a binary to extract the current direction information. This information acquisition method is simple and has low requirements for data communication synchronization. In addition, the scheme has good anti-interference to harmonics, noise, and measurement errors generated using power electronic devices, nonlinear loads, and switching operations. To enhance protection sensitivity and mitigate the influence of load, a new longitudinal current differential protection scheme was constructed. This scheme, detailed in [
23], utilizes the positive sequence fault component. The realization of the scheme involved the utilization of both the data synchronization scheme and point-to-point communication technology. In addition, a protection prototype was developed to test the proposed method.
The pilot protection can accurately identify the fault in the feeder area only by using the information on both sides of the line. It has the advantages of both centralized protection and local protection. It can reflect any point fault in the line area and has absolute selectivity [
24]. At present, many scholars have studied the pilot protection of active distribution networks;
4. Protection against line break faults: The treatment of short-circuit faults in distribution networks has received substantial attention in current research. However, studies addressing line break faults remain limited. Most research focused on fault detection and fault section location in traditional distribution networks, identifying faults by analyzing the voltage at both ends of the line.
In [
25], an analysis was conducted on the voltage characteristics of various types of single-phase line break faults in resonant grounding systems. Considering factors such as fault point location, unbalanced load impedance, and grounding resistance, a detailed mathematical model was established. This model enables accurate identification of single-phase line break faults and single-phase grounding faults.
In [
26], a technique was introduced to differentiate between line break faults and medium-voltage side short-circuit faults. This method involved analyzing the voltage amplitude and phase on the low-voltage side of the distribution transformer (DT) using the symmetrical component method. The amplitude was used to distinguish two-phase faults with line breaks (TPFs-LBs) and two-phase short-circuit faults (TPFs-SCs). The phase was used to distinguish single-line-to-ground faults with line breaks (SLGFs-LBs) and single-line-to-ground faults (SLGFs). This method demonstrated robustness under extreme operating conditions, considering different network topologies and radial distribution networks.
Table 1.
Comparison between different fault location methods.
Table 1.
Comparison between different fault location methods.
| Ref. | Techniques | Equipment 1 | Measured Parameters | Fault Types 2 | Results 3 | Contributions |
|---|
| [27] | Improved current protection and distance protection | Distance relay, PT, CT, Phase selector | Current and voltage phasor | 1ph-g, 3p, 2ph-g, 2p | Fault distance, fault type, fault phase | Strong adaptability to fault resistance and system operating conditions |
| [28] | Relay, PT, CT, Circuit breaker | Current and voltage phasor | 1ph-g, 2ph-g | Fault distance | Simple calculation and not affected by fault resistance |
| [20] | Centralized protection | Relay, CIU, VIU, BIU, VT, CPU, CB, Directional element | Current and voltage magnitude | 2p | Fault section, fault region, fault type | Fast fault clearing time; high reliability and suitable for high permeability network |
| [29] | Relay, IED | Current magnitude | Pole-to-ground fault | Fault section, fault region | High adaptability to communication delay, communication failure, and fault resistance |
| [22] | Pilot protection | Relay, Communication system | Current phasor | 1ph-g, 3p, 2p | Fault section | Low requirements for data communication and great anti-interference to different reactive currents and load switching |
| [23] | STU, WLAN | Current phasor | 2p, 3p | Fault region, fault section | Does not depend on communication channel or external GPS clock; high reliability |
| [30] | Line break fault protection | PMU, Wireless communication | Voltage phasor | SLGF-LB, 1ph-g | Distinguishing 1ph g and SLGF-LB | Keeping high accuracy and robustness even in extreme cases, such as frequency fluctuation and power factor |
| [26] | TTU | Voltage phasor | SLGF-LB, 1ph-g, TPF-LB, 2p | Distinguishing 1ph-g, SLGF-LB, TPF-LB, and 2p | Effective and robust in different topologies and under extreme cases of radial distribution networks |
| [31] | Elastic mapping | PMU at bifurcations | Voltage phasor | All types | Fault region, fault severity | Proposed a distribution network fault location and severity assessment method with 99% accuracy |
| This paper | Pilot protection | PMU | Current and voltage magnitude | All types (including line break fault and multiple fault) | Fault region, fault section | Short-circuit and line break faults can be detected; high adaptability to fault resistance and high permeability network |
The distributed energy access power system disrupts the traditional one-way power flow and radial network structure of the distribution network [
32]. This transformation gradually shifts the traditional distribution network from a passive mode to an active mode known as active distribution networks.
Figure 1 provides an illustrative structure diagram of an active distribution network [
1,
32]. The aforementioned algorithms serve as a foundational framework for facilitating the extensive integration of DG into the distribution network, both in theory and technology. However, these algorithms face certain limitations, including the following: (a) weak resilience against transition resistance; (b) predominantly considering scenarios with DG penetration below 25%, which does not adequately address high-penetration DG integration; and (c) the inability to simultaneously meet the protection requirements for both short-circuit faults and disconnection faults.
Hence, it becomes imperative to explore enhanced protection methodologies to address these challenges. Recognizing the advantageous characteristics of fault components, specifically their insensitivity to load states and transition resistance at fault points, as well as their high sensitivity. This paper proposes a pilot protection method for active distribution networks based on the fault component coefficient.
The proposed method leverages the ratio between the estimated and measured voltage fault components to identify internal and external faults in the line. Solely through measuring three-phase current and voltage. It caters to the protection requirements of active distribution networks in various fault scenarios, such as short-circuit and open-circuit faults, eliminating the need for fault phase identification. The method boasts advantages, including minimal susceptibility to the penetration of distributed energy sources and strong tolerance to transient resistances. Firstly, in
Section 2, through the analysis of the mechanisms of short-circuit and line break faults in the distribution network, it is concluded that a disparity exists between the measured and calculated values of the voltage fault component during the fault occurrence. A method of measuring the measured value and the calculated value by using the voltage fault component is proposed. Then, using the conclusion of
Section 2, the fault criterion is designed in
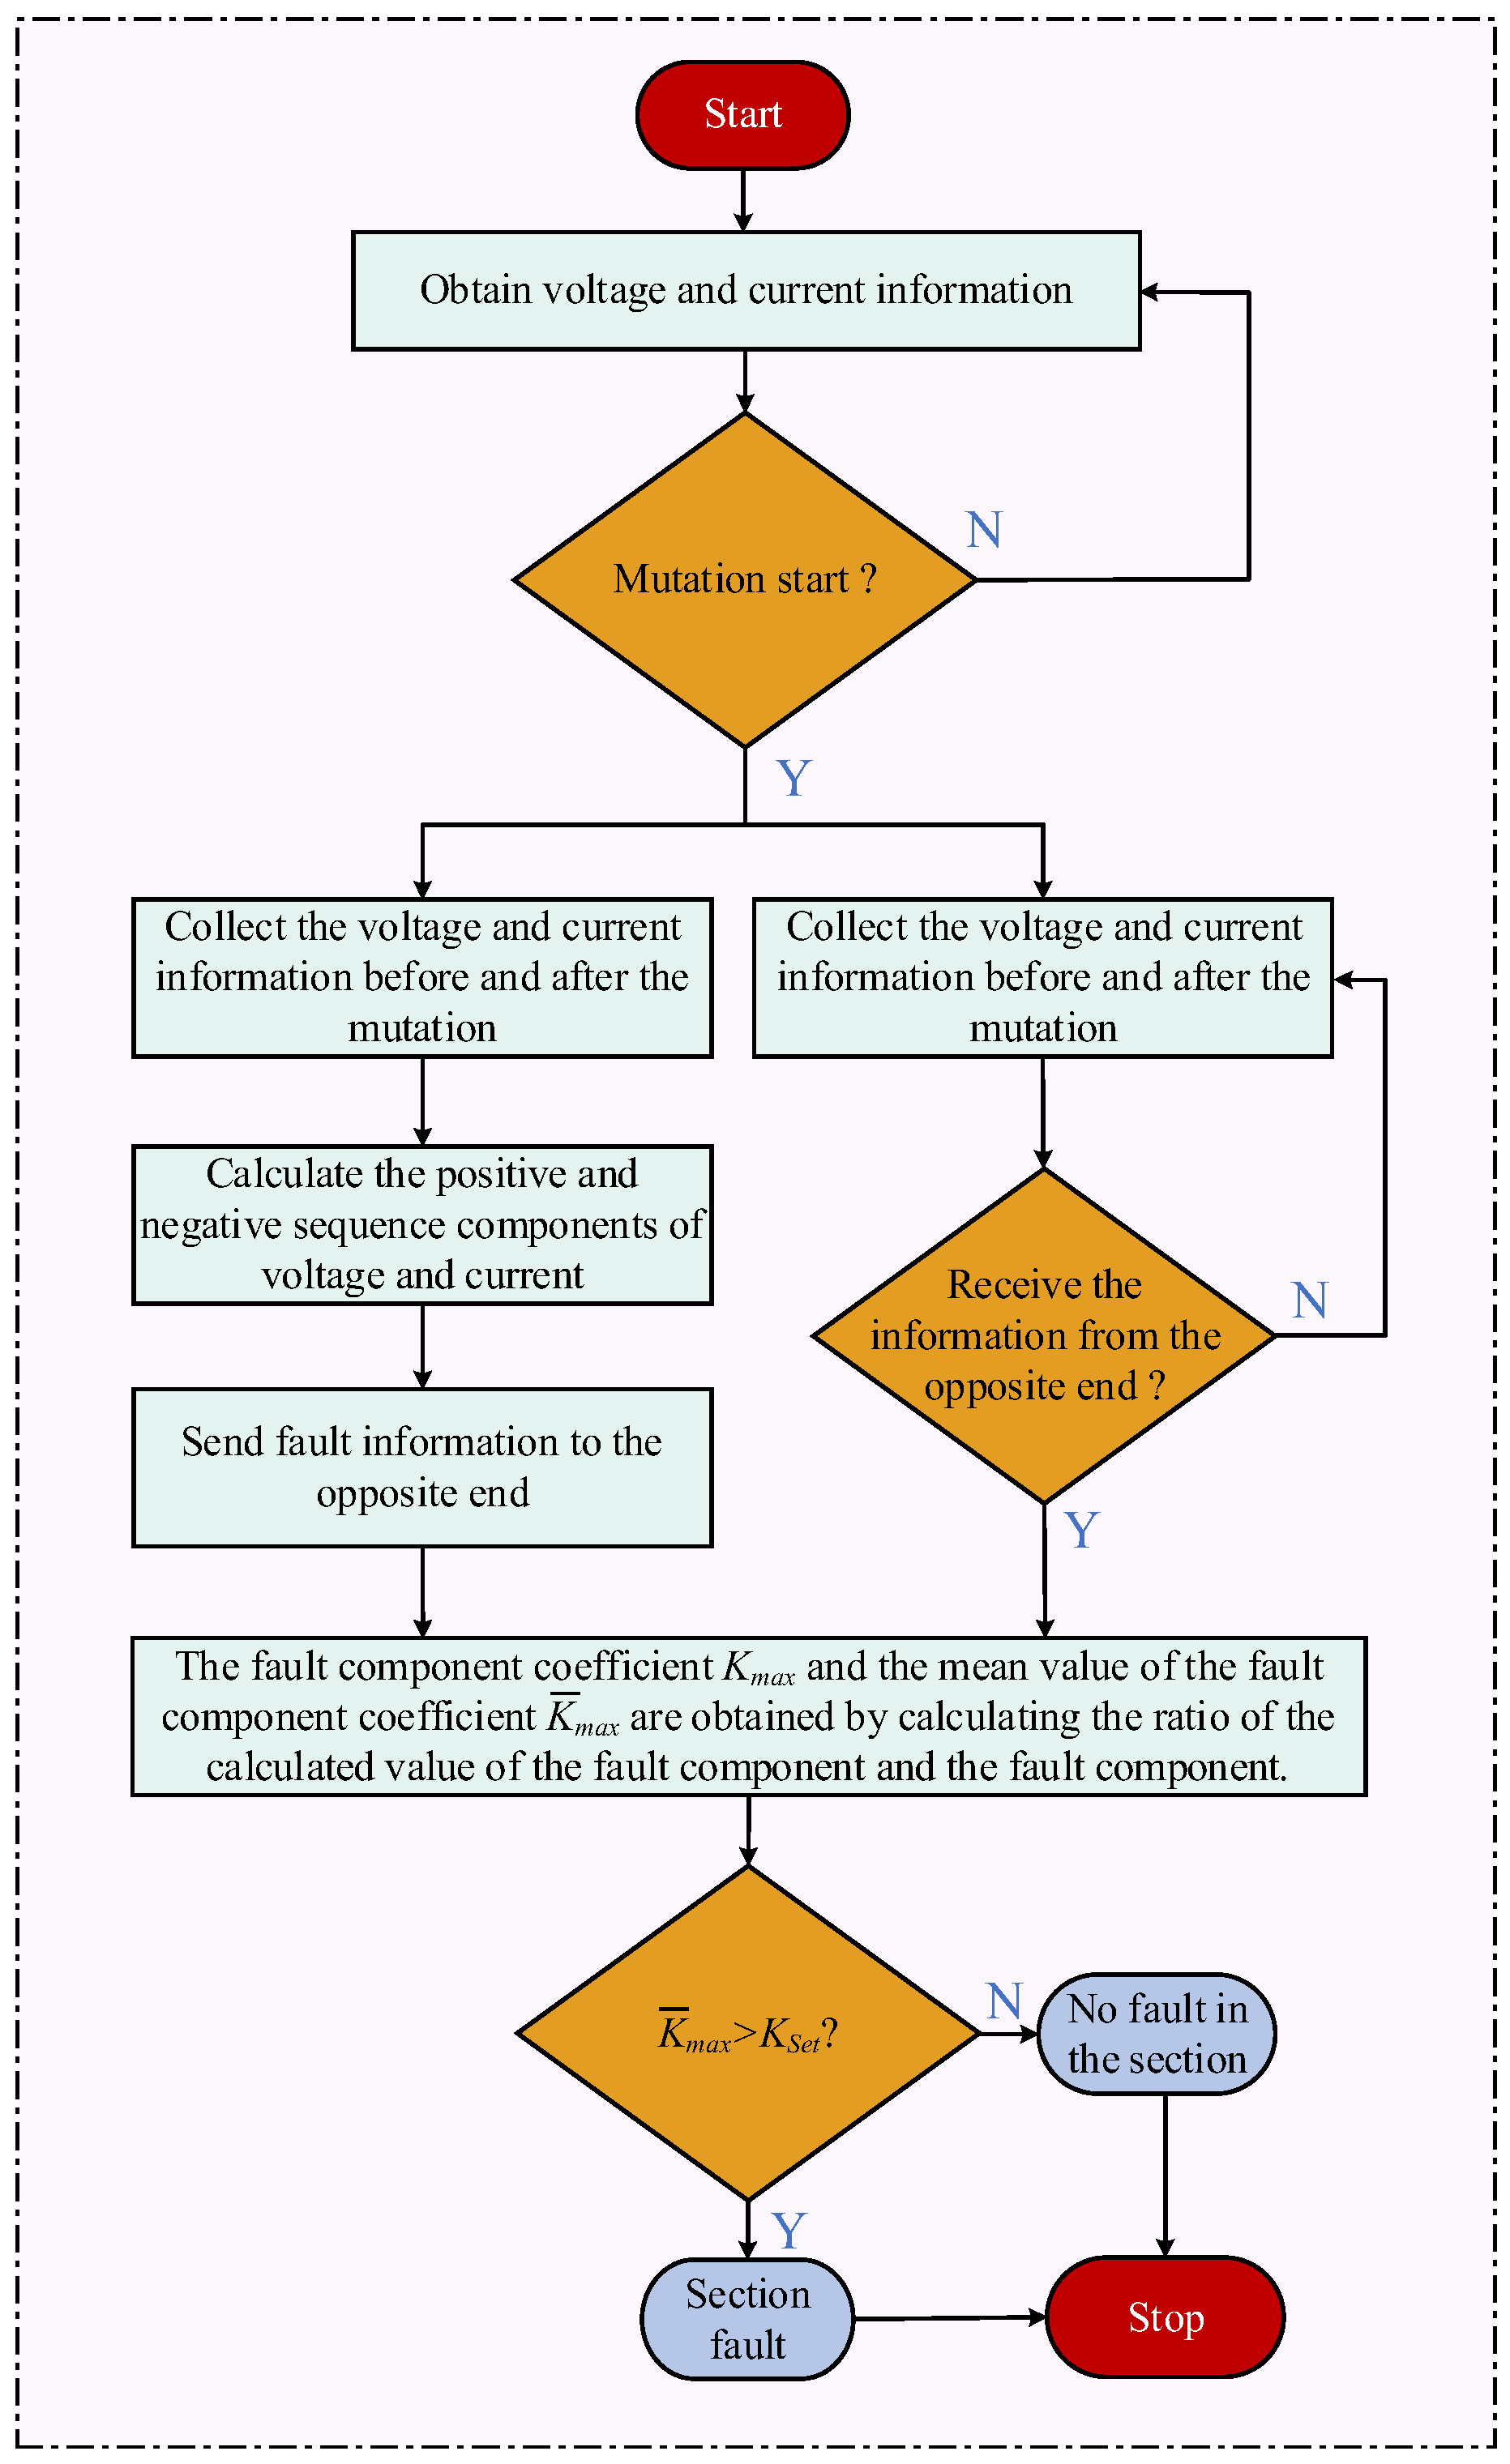
Section 3. Fault detection is carried out via the fault mutation quantity, which improves the sensitivity of the algorithm. Finally,
Section 4 verifies the correctness of the proposed algorithm by considering the simulation of short-circuit faults, line break grounded/ungrounded faults, high penetration, and transition resistance.
2. Analysis of Fault Component Characteristics of Active Distribution Network
Figure 2 presents a simplified diagram illustrating line faults in an active distribution network. In the diagram, DG represents distributed power supply,
f1 denotes the internal fault point,
f2 represents the external fault point, and
ZL denotes the line impedance. Additionally, the fault location parameter,
d, is introduced to represent the distance ratio from the fault point to bus M to the total length of the feeder MN. The value range for
d is [0, 1].
Distributed generation in an active distribution network can be broadly classified into two main types: motor-type distributed generators (MTDG) and inverter-interfaced distributed generators (IIDG) [
23,
33]. Regarding MTDG, the additional fault network can be described in
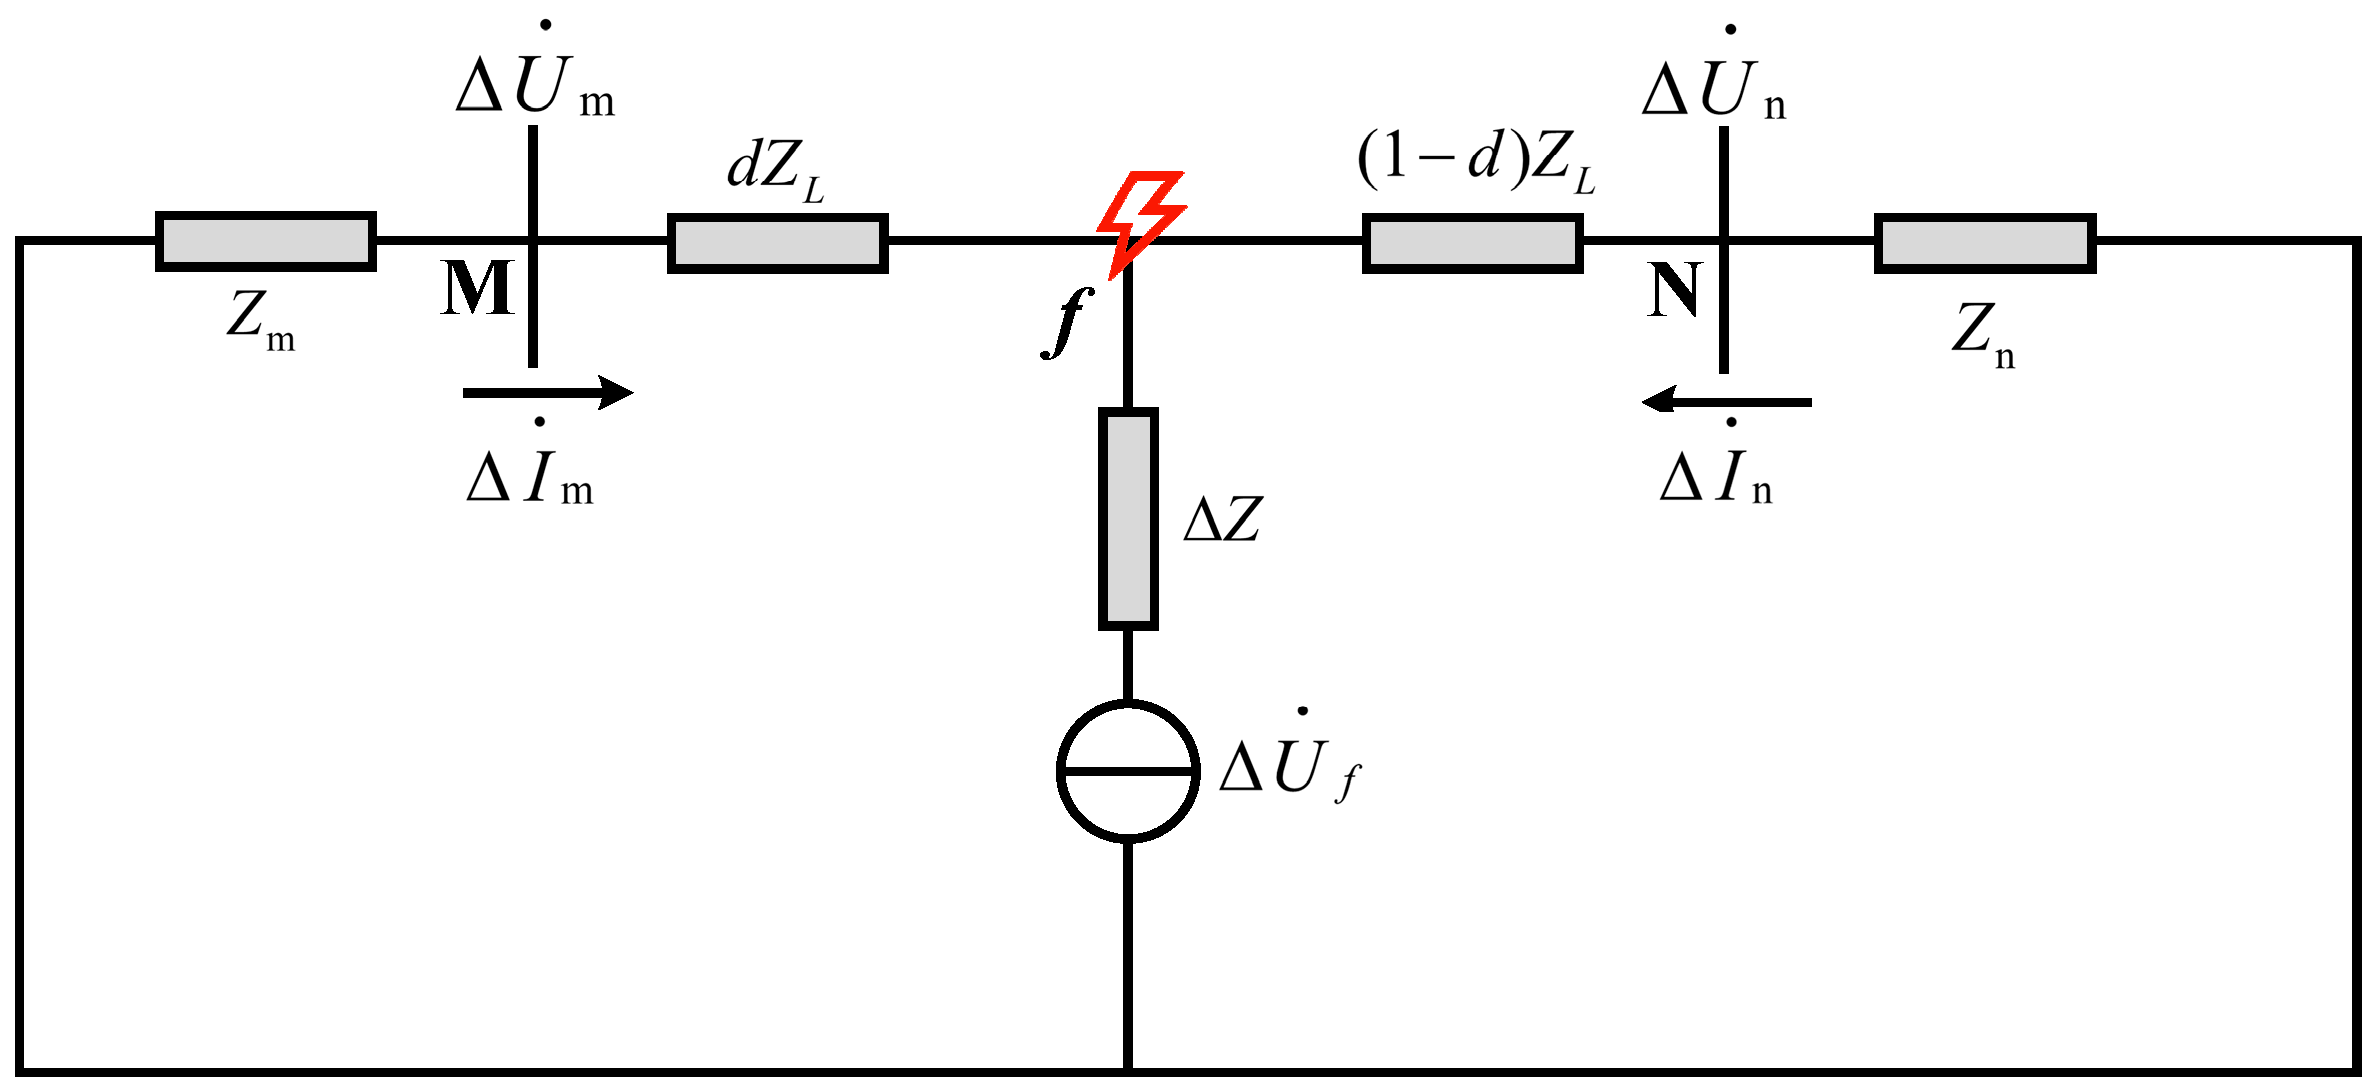
Figure 3 [
34].
Figure 2.
Simplified line fault diagram of an active distribution network [
33,
35,
36].
Figure 2.
Simplified line fault diagram of an active distribution network [
33,
35,
36].
Figure 3 shows the additional short-circuit fault network of the distribution network. The fault is located at point
f;
Zm = −(Δ
m/Δ
m) is the equivalent impedance of the M-terminal back-side system of the line,
Zn = −(Δ
n/Δ
n) is the equSSivalent impedance of the N-terminal back-side system of the line;
ZL is the line impedance; Δ
Z is the transition resistance of the fault point; Δ
f is the additional fault voltage source; Δ
m and Δ
n are the measured values of the current fault components at both ends; and Δ
m and Δ
n are the actual values of the voltage fault components at both ends.
As a nonlinear power supply, the output current of an IIDG undergoes abrupt changes following a fault occurrence. It is crucial to highlight that IIDG exclusively generates positive sequence current and has no impact on the negative sequence network [
37,
38]. Consequently, IIDG can be effectively represented as a controlled positive sequence current source [
39,
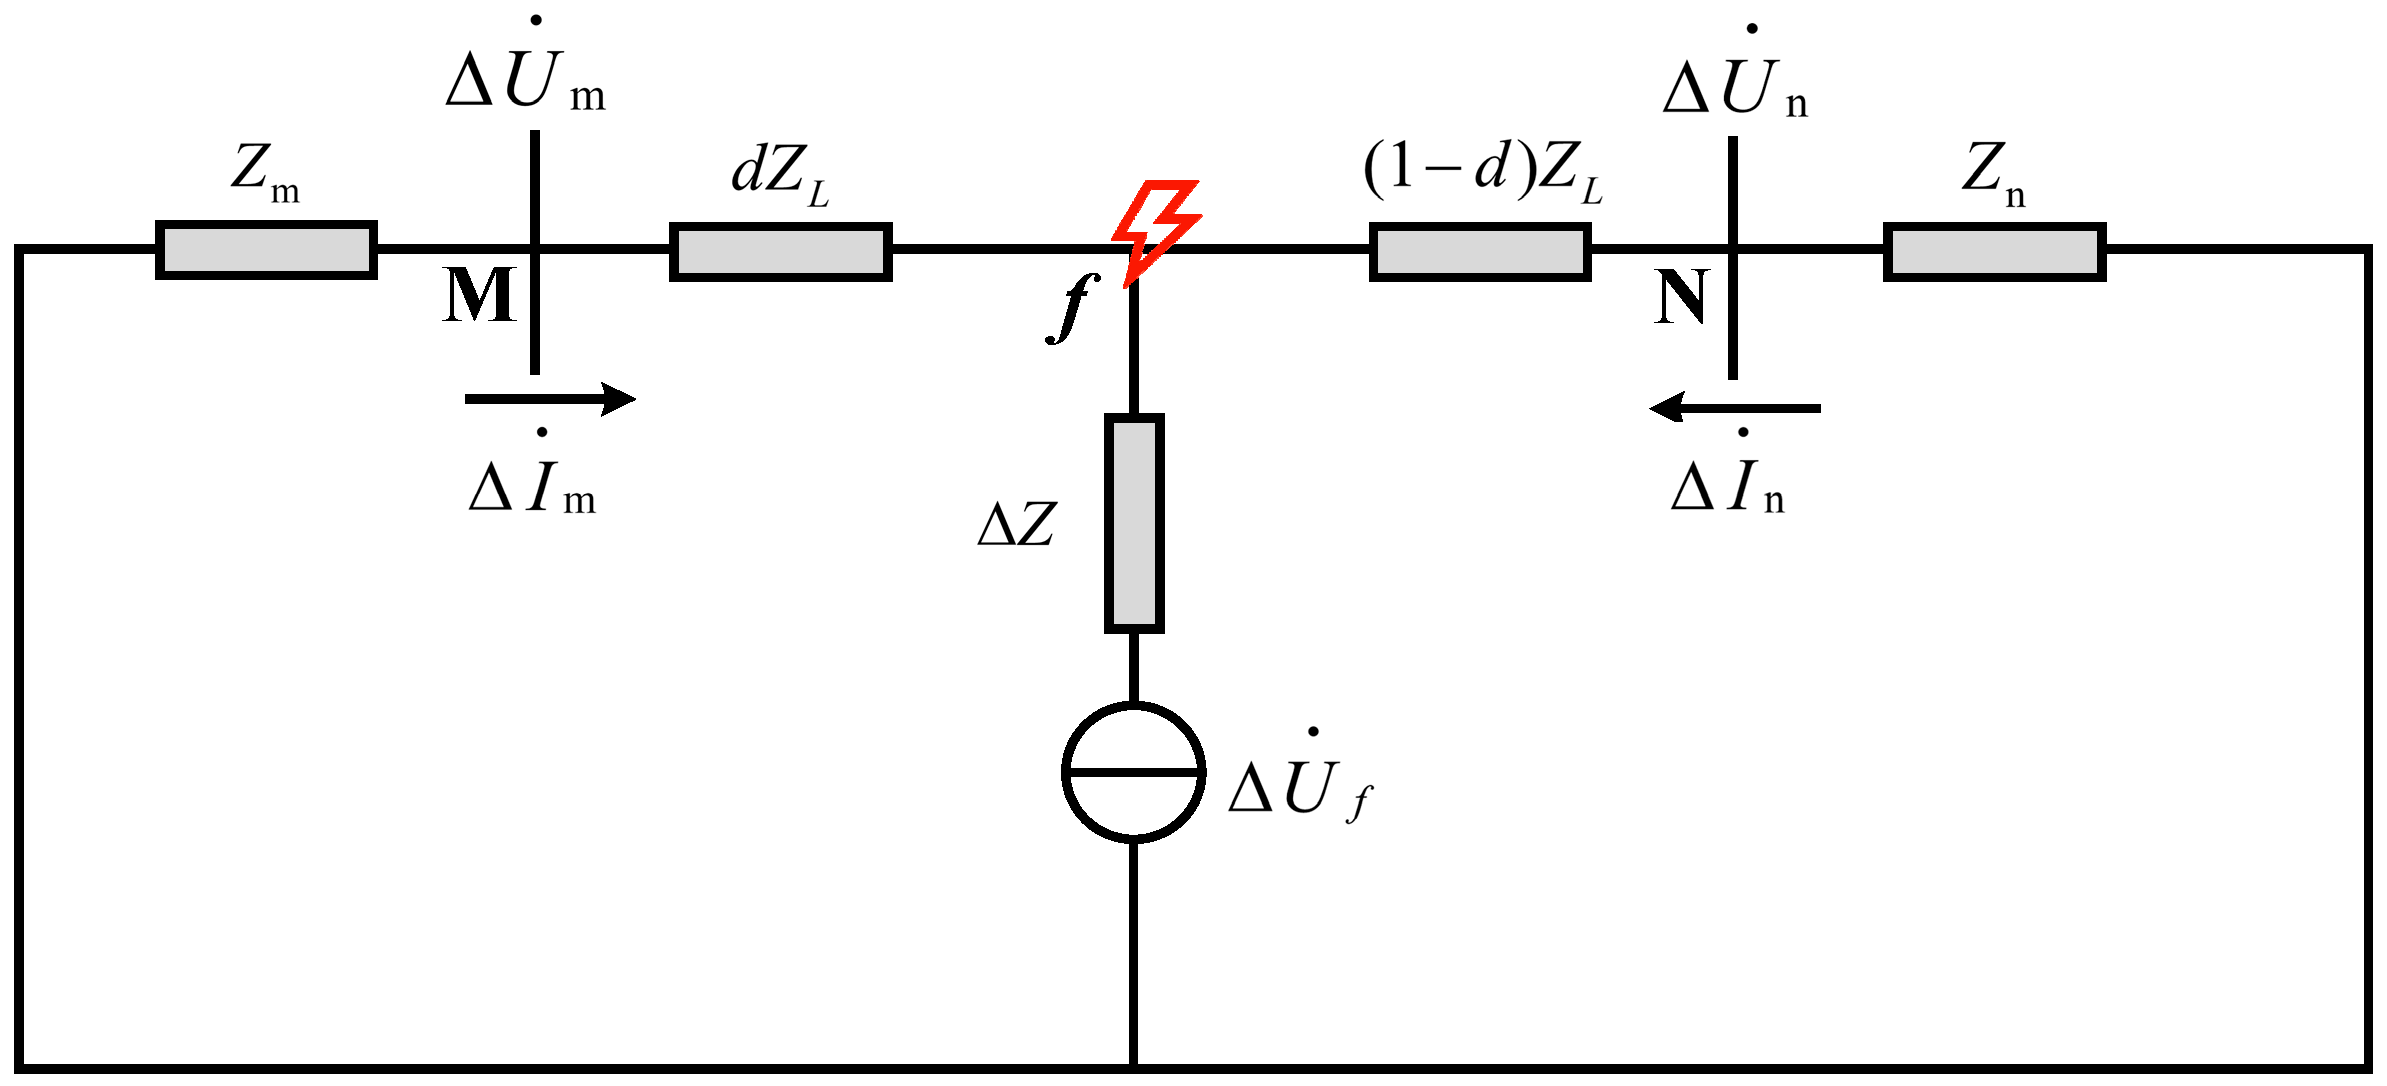
40]. The additional fault network for IIDG is shown in
Figure 4.
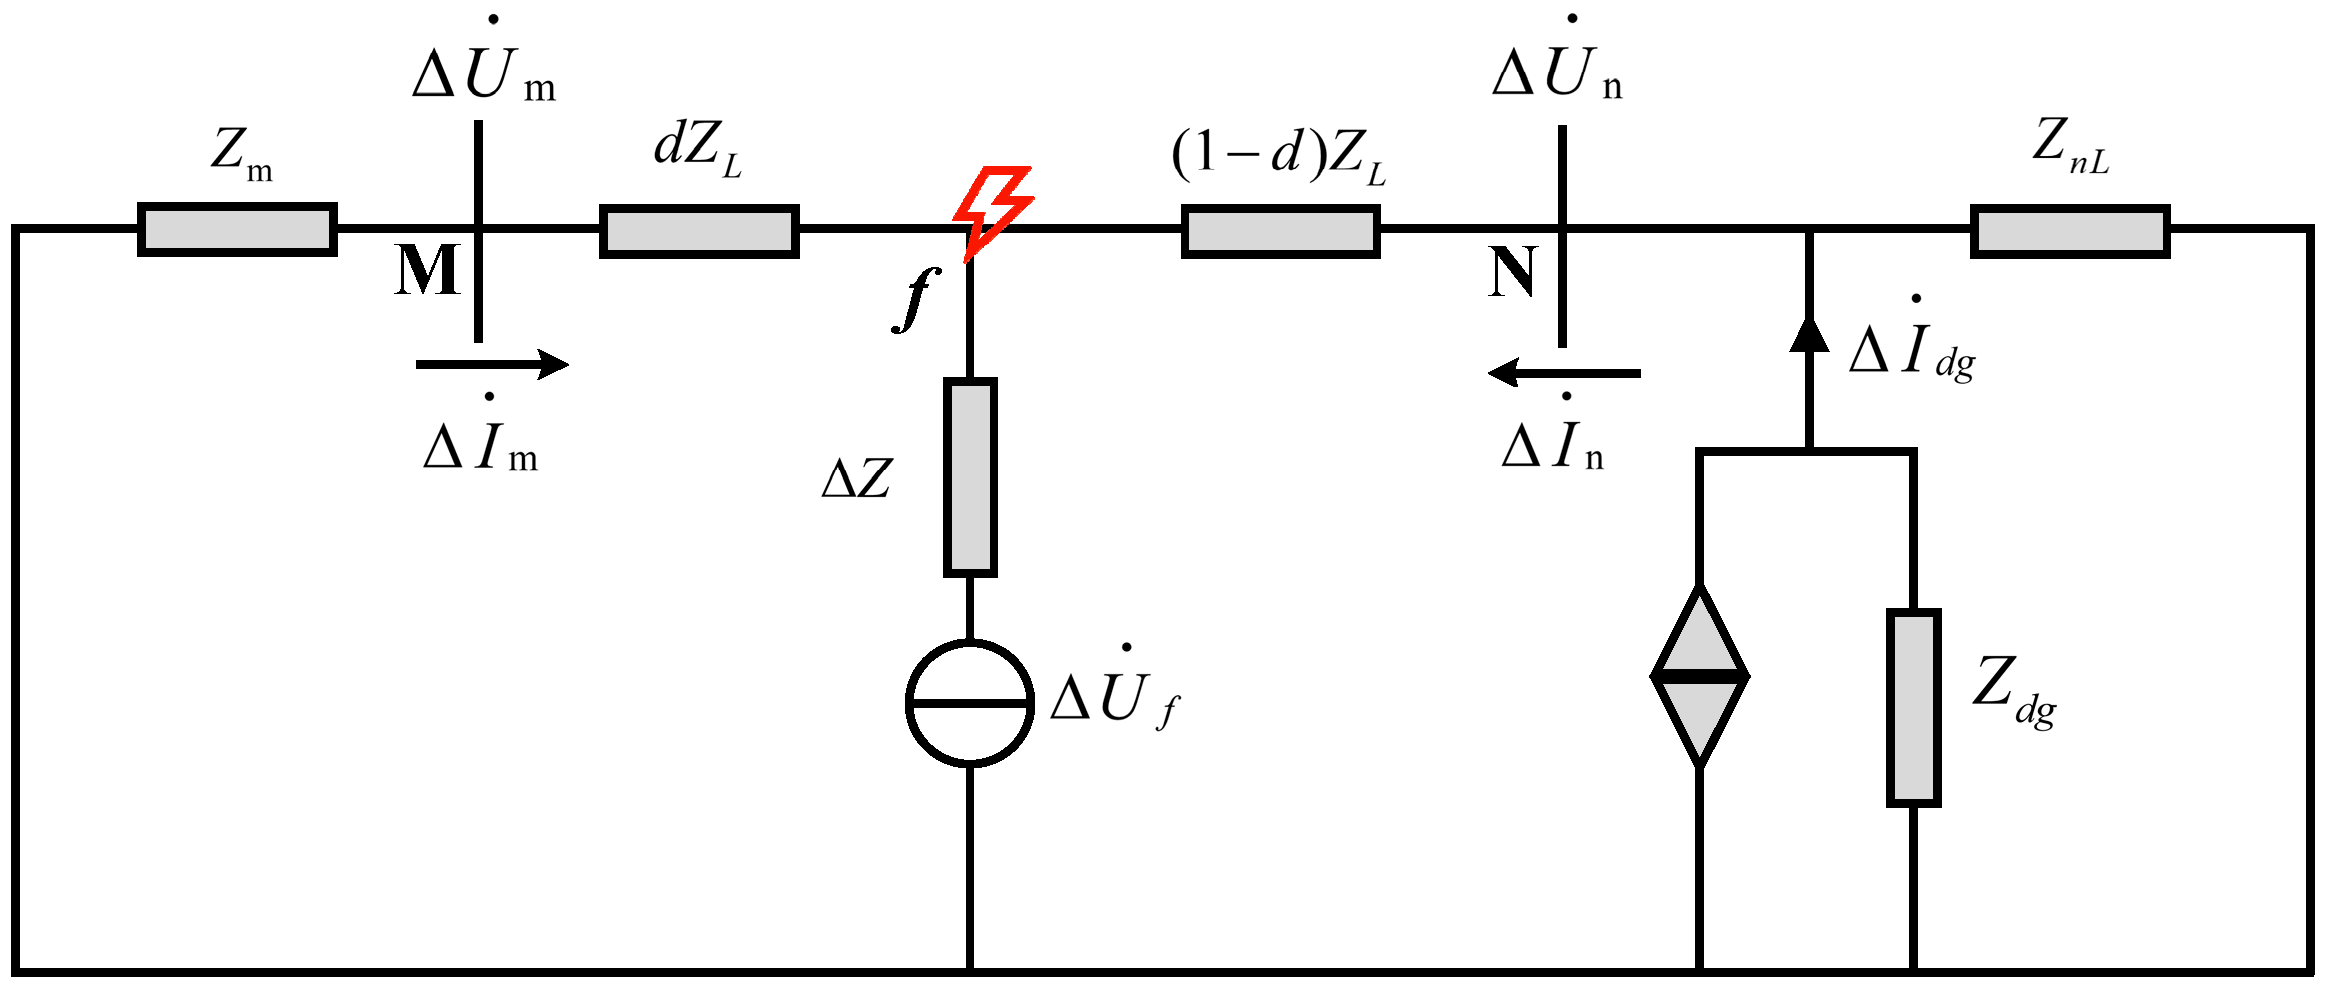
As shown in
Figure 4,
Zn is the equivalent impedance of the downstream line and load of the distributed power supply;
Zdg is an infinite equivalent impedance, which is used to limit the maximum short-circuit current of IIDG. Δ
dg is the current fault component of the IIDG output.
For the convenience of subsequent analysis, the additional fault network shown in
Figure 5 is used. For the positive sequence additional fault network, the N-terminal back-end system is equivalent to the impedance
Zn = −(Δ
n/Δ
n) = −
ZnL(Δ
dg − Δ
n)/Δ
n = −
ZnL(Δ
dg/Δ
n − 1) that changes with the current fault component output using IIDG, and the changing impedance Z
n is used to reflect the influence of IIDG on the fault component [
41]. For the negative sequence network, Z
n is a fixed impedance.
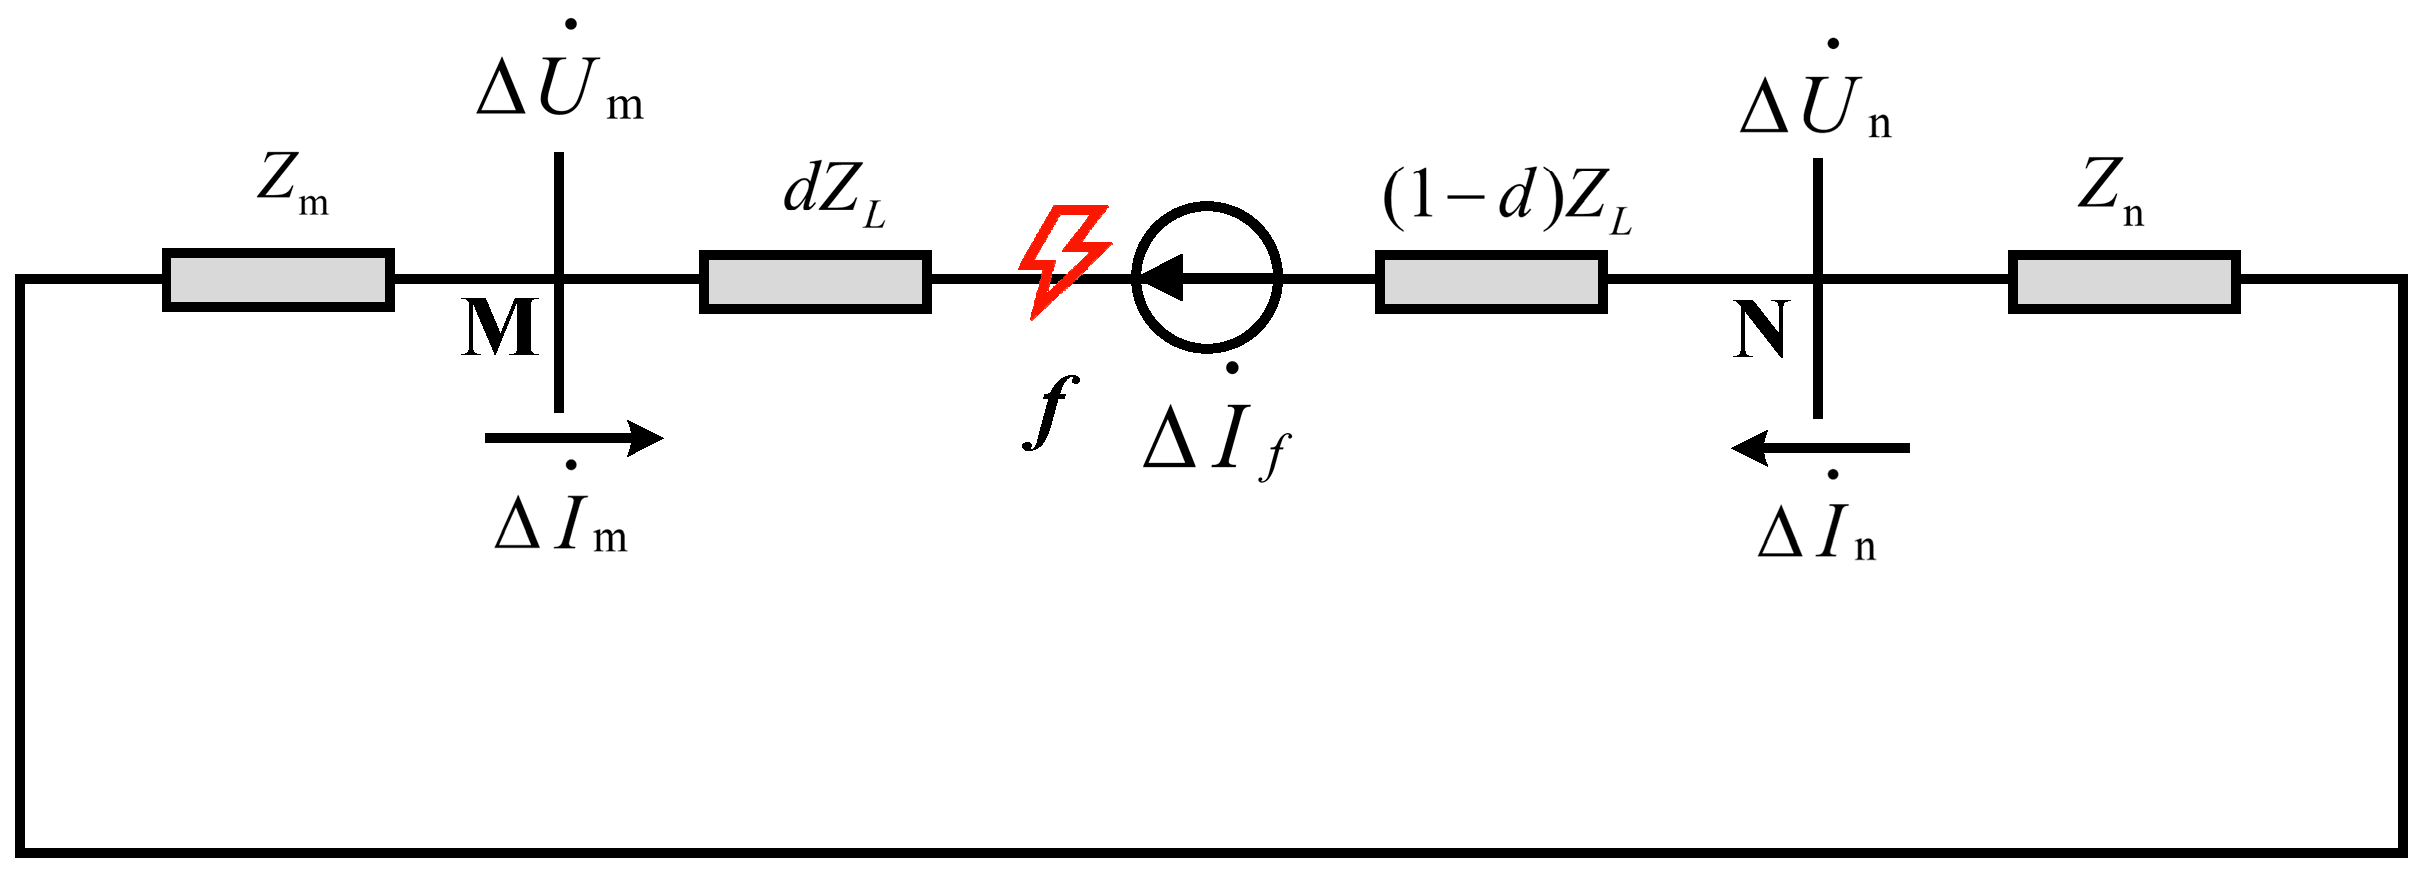
Similarly, the additional fault network of the distribution network with line break fault is shown in
Figure 6.
The fault point of the line break fault in the circuit shown in
Figure 6 is the
f point; Δ
f is an additional fault current source; Δ
m and Δ
n are the measured values of the current fault components at both ends; Δ
m and Δ
n are the actual values of the voltage fault components at both ends;
d is the ratio of the distance from the fault point to the M-terminal to the full length of the line MN; and the value range is [0, 1].
2.1. Analysis of Short-Circuit Fault Characteristics of Active Distribution Network
Figure 7a,b depict the additional fault network for external and internal distribution line short-circuit faults, respectively. In the case of a fault occurring outside the line, the actual voltage and current fault component values can be measured at one end of the line, and the line impedance can be obtained using Ohm’s law. The voltage fault component value on the opposite side of the line can be calculated using the following equation [
42]:
Based on Equation (1), the calculation formula of the terminal voltage fault component is defined as the following:
where Δ
′m and Δ
′n are the estimated values of the voltage fault components at both ends of the line. Obviously, when an external fault occurs, the measured value of the voltage fault component at both ends of the line is consistent with the calculated value.
When an internal fault occurs in the line, the measured value of the voltage fault component at both ends of the line can be expressed using Equation (3) [
23]:
To assess the deviation between the calculated and actual values of the voltage fault component on both sides of the line, a comparison is conducted. This is achieved by introducing the voltage fault component ratio, as depicted in Equation (4):
The ratio of voltage fault components on both sides of the line can be obtained from Equations (2)–(4), as expressed using Equation (5):
From Equation (5), it can be seen that if a short-circuit fault occurs, regardless of the size of Zm and Zn, the values of Km and Kn are greater than 1, so the change of system impedance Zm and Zn on both sides of the line does not affect the effectiveness of the proposed method. Therefore, the proposed method is less affected by the change in DG penetration. When d = 0, Km is equal to 1, and Kn is greater than 1; when d = 1, Kn is equal to l, and Km is greater than 1; when 0 < d < 1, the fault component ratio coefficients on both sides of the line are greater than l. From the above analysis, it can be concluded that the maximum value of the ratio of voltage fault components on both sides of the line is greater than l when a short-circuit fault occurs.
2.2. Analysis of Fault Characteristics of Active Distribution Network Line Break Fault
In the event of a line break fault in the distribution network, it is typical to encounter a line break grounding fault on one or both sides of the fault point. Depending on whether the power supply side or the load side is grounded, line break faults can be categorized into two cases: line break faults without grounding and line break faults accompanied by grounding. This section provides an analysis of these two types of line break faults.
2.2.1. Analysis of Ungrounded Fault Characteristics of Line Break Fault
Figure 8a,b depict the additional networks that emerge when the external and internal feeders of the distribution network experience a breakage at fault point
f. Δ
f indicates an additional fault current source. The fault component of the terminal voltage can be calculated using Equation (2). For an external fault, the relationship between the estimated value and the actual value of the voltage fault component is elucidated using Equation (6):
When an internal fault occurs, the measured value of the voltage fault component on both sides of the line is calculated as shown in Equation (7):
The calculated values of the voltage fault components on both sides of the line can be calculated from Equations (2)–(7), as shown in Equation (8):
By substituting Equations (7) and (8) into Equation (4), the ratio of voltage fault components on both sides of the line can be obtained, as shown in Equation (9):
It can be seen from Equation (9) that the change in DG penetration and the output fault component of IIDG will lead to a change in Zn, which will affect the ratio of the voltage fault component. With the change of Zn, there will be three impedance relationships: Zn > Zm, Zn = Zm, and Zn < Zm. The analysis is as follows:
- (1)
Zn > Zm, then Zn + ZL > Zm, Km > 1; Kn is affected by the values of Zm + ZL and Zn in the following three cases: Zm + ZL > Zn, Kn > 1; Zm + ZL = Zn, Kn = 1; and Zm + ZL < Zn, Kn < 1. From the above analysis, the maximum value of the voltage fault component ratio on both sides of the line is greater than l.
- (2)
Zn = Zm, then Zn + ZL > Zm, Km > 1; Zm + ZL > Zn, Kn > 1; the maximum value of the ratio of voltage fault components on both sides of the line is greater than 1.
- (3)
Zn < Zm, which is dual to Case (1). Similarly, the maximum value of the ratio of voltage fault components on both sides of the line is greater than 1.
In summary, the maximum value of the voltage fault component ratio on both sides of the line is also greater than 1 when the feeder is disconnected and ungrounded.
2.2.2. Analysis of the Characteristics of Line Break Fault Accompanied by Grounding Fault
When both sides of the disconnection points are grounded, the characteristics of the line break fault align with those of grounding short-circuit faults [
26]. Hence, this section exclusively focuses on analyzing scenarios where grounding occurs on one side of the disconnection point.
Figure 9a,b illustrate the additional fault networks that arise when the distribution line experiences an external or internal line break fault accompanied by a ground fault on one side at fault point f. In the case of an external line break fault, the relationship between the estimated value and the actual value of the voltage fault component aligns with Equation (6). Meanwhile, for an internal fault, the measured value of the voltage fault component on both sides of the line can be expressed using Equation (10):
where the coefficient
k is the ratio of the M-side current Δ
m to the fault current source current Δ
f, and
k = −Δ
m/Δ
f.
From Equations (2)–(10), the estimated value of the voltage fault component on both sides of the line can be obtained, as shown in Equation (11):
Substituting Equations (10) and (11) into Equation (4), the ratio of voltage fault components on both sides can be obtained, which can be expressed using Equation (12):
It can be seen from Equation (12) that DG penetration and coefficient k will affect the ratio of voltage fault components. With the change of DG penetration and k value, there will be three impedance relationships: Zn > kZm, Zn = kZm, and Zn < kZm. The analysis is as follows:
- (1)
Zn > kZm, then Zn + ZL > kZm, Km > 1; at this time, Kn is affected by the value of k(Zm + ZL) and Zn in the following three cases: k(Zm + ZL) > Zn, Kn > 1; k(Zm + ZL) = Zn, Kn = 1; k(Zm + ZL) < Zn, Kn < 1; from the above analysis, it can be concluded that in any case, the maximum value of the voltage fault component ratio on both sides of the line is greater than 1.
- (2)
Zn = kZm, then Zn + ZL > kZm, Km > 1; k(Zm + ZL) > Zn, Kn > 1; the maximum value of the ratio of voltage fault components on both sides of the line is greater than 1.
- (3)
Zn < kZm, then k(Zm + ZL) > Zn, Kn > 1; at this time, Km is affected by the value of Zn + ZL and kZm in the following three cases: Zn + ZL > kZm, Km > 1; Zn + ZL = kZm, Km = 1; Zn + ZL < kZm < kZm, Km < 1: The maximum value of the voltage fault component ratio on both sides of the line is greater than l.
In summary, when the distribution network breaks with one side of the ground fault, the maximum value of the voltage fault component ratio on both sides of the line is also greater than l.
