Article

Multi-Criterial Carbon Assessment of the City

by
Piotr Sobierajewicz
1,
Janusz Adamczyk
2,* and
Robert Dylewski
3
1
Institute of Architecture and Urban Planning, Faculty of Civil Engineering, Architecture and Environmental Engineering, University of Zielona Góra, Licealna 9 St., 65-417 Zielona Góra, Poland
2
Institute of Economics and Finance, Faculty of Economics and Management, University of Zielona Góra, Licealna 9 St., 65-417 Zielona Góra, Poland
3
Institute of Mathematics, Faculty of Mathematics, Computer Science and Econometrics, University of Zielona Góra, Licealna 9 St., 65-417 Zielona Góra, Poland
*
Author to whom correspondence should be addressed.
Energies 2024, 17(18), 4555; https://doi.org/10.3390/en17184555
Submission received: 13 August 2024 / Revised: 3 September 2024 / Accepted: 6 September 2024 / Published: 11 September 2024
(This article belongs to the Section B: Energy and Environment)

Abstract

:
Decision-makers in cities have difficulties in implementing an effective climate policy for their own building resources due to the heterogeneous and dispersed distribution of buildings with low energy classes and different management specifics. Special zones include old towns, pre-war buildings (before 1945), and those built by the end of the 20th century. There is a noticeable shortage of methods for the comprehensive assessment of the emissions of urban complexes, taking into account social, economic, and environmental aspects. Exemplary individual examples of good thermal modernization practices towards low-emission and zero-energy solutions do not solve the problem of the poor-quality urban environment. This article proposes a simple integrated assessment of CO2 emissions of separate urban zones using the example of a medium-sized city in Poland. The adopted ASEET assessment methodology takes into account socio-economic criteria, but above all, the technical and energy criteria of urban development. Sensitive information was collected from users and owners of buildings and gathered in a data matrix. From the inventory data on energy consumption and technical conditions related to socio-economic status, environmental indicators were introduced, which were called critical for their improvement. By analyzing local efficiency indicators Wei of individual development zones, we can influence TWCi, the total indicators for the city. In the case of the studied city of Gubin, the total final energy consumption indicator EKC is 252.68 kWh/m2/year and is 58% lower than the most energy-intensive zone I, for which EKI = 399.6 kWh/m2/year, similar to emission indicators EEj between zones. Therefore, energy efficiency or emission indicators as resultant characteristics of urbanized areas can be treated as sensitive parameters in administrative activities, for example when planning thermal modernization or health risk assessment. The recommended solutions for continuous monitoring of ecological identifiers of urban zones, especially those with the lowest technical status, are to facilitate the creation of own environmental urban policies in the future and directly affect the city’s climate in local and global terms. The environmental data obtained using the ASEET method can be digitized using various IT techniques and then the results can be visualized on a city map in the form of environmental urban mapping with an indication of the GIS system. As a result, simple methodological tools for city managers were indicated. In the authors’ opinion, the ASEET method can serve urban policy, especially energy and climate policy, because the instrument for calculation is a database of indicators from subsequent periods of monitoring one’s own urban development.

1. Introduction

In the era of an energy crisis and decreasing access to hydrocarbon sources, energy efficiency may be one of the first steps in decarbonizing cities. According to the Renovation Wave for Europe Green Deal strategy (October 2020) [1], buildings in the EU are responsible for about 40% of energy consumption and 36% of greenhouse gas (GHG) emissions, mainly from the combustion of fuels for heating and cooling. In the world, however, buildings are responsible for 32% of energy consumption and 19% of CO2 emissions according to the IPCC report from 2022 [2,3]. The EU’s goal is deep renovation with thermal modernization, which is expected for 35 million buildings in Europe by 2030 [1]. In European countries, decarbonizing cities involves the typological identification of buildings responsible for excessive energy consumption. Buildings with poor energy performance (classes G–H), which constitute about 75% in Europe, together with the transport infrastructure, generate significant GHG emissions [4,5]. However, most resources in poor technical conditions concern residential buildings constructed with traditional technologies and owners with an energy poverty status and inefficient heating systems [5,6]. In order to determine the energy demand and emission levels, it is very important to determine the energy efficiency of buildings as accurately as possible [7].
Using Poland as an example, the Long-Term Building Renovation Strategy (DSRB) [8] assumes an average annual rate of thermal modernization at the level of approx. 3.8%, assuming that by 2050, 65% of buildings should achieve an EP index of no more than 50 kWh/(m2year) [9]. There are 14.2 million buildings in Poland, of which almost 40% are single-family residential buildings. According to the strategy, by 2050, it is estimated that approximately 7.5 million thermal modernization projects should be carried out, of which 4.7 million buildings require deep thermal modernization (in accordance with the requirements of the Technical Guidelines for new buildings from 2021), also as part of a phased thermal modernization [8].
The need to decarbonize cities and the low level of insulation of buildings in Poland has led to the need to systematize actions at the national level. The Long-Term Building Renovation Strategy (LTBR) aims to provide a kind of remedy for the existing problems in the construction sector. The National Energy and Climate Plans (NECPs) [10] present the assumptions, goals, EU policies [11], and actions aimed at implementing five dimensions of the energy union: energy security, internal energy market, energy efficiency, emission reduction, research, and innovation and competitiveness. Poland adopted a plan specifying the climate and energy goals for 2030, which include the following [10]:
A 7% reduction in greenhouse gas emissions in sectors not covered by the ETS compared to 2005 levels.
A 21–23% share of RES in gross final energy consumption (the 23% target will be achievable if Poland receives additional EU funds, including those earmarked for just transformation), taking the following into account:
A 14% share of RES in transport.
An annual increase in the share of RES in heating and cooling by 1.1 percentage points on average per year.
An increase in energy efficiency by 23% compared to PRIMES2007 forecasts.
A reduction in coal share in electricity production to 56–60%.
In conclusion, in line with the current EU policy aimed at decarbonizing cities [1,12,13] to achieve the EU’s overall greenhouse gas emissions reduction target for 2030, the sectors covered by the EU Emissions Trading System (EU ETS) must reduce their emissions by 43% compared to 2005 levels. Three main strategic programs were introduced to achieve the assumed climate goals: Green Deal [14], financing the green transition [15], and Fit for 55 [16], which are strongly linked to the social and economic environment. Strategic plans, NECPs, DSRB, and the introduced MEPS (Minimum Energy Performance Standard) standards will enforce low-emission solutions for buildings and urban areas in the local government decisions and strategic spatial development plans.
In order to promote energy savings through behavioral change, the Energy Efficiency Directive [17] introduces a mandatory requirement for cost allocation based on consumption and accounting for heating, cooling, and domestic hot water in multi-apartment and multi-purpose buildings with collective heating/cooling systems. The methods of managing building complexes [18] have a major impact on energy savings, for example through feedback on consumption, which contributes to reductions of an average of 10–15%, as confirmed by numerous studies [19,20].
An essential cognitive element for decision-makers is the knowledge they need to identify the largest sources of greenhouse gas emissions in the areas of the cities they manage. The literature on the subject describes city decarbonization initiatives undertaken by the interested parties themselves. It was the cities that attempted to create networks and developed standard methodological tools for decarbonizing cities. One of the established C40 networks proposes two approaches to determining a city’s carbon footprint: a sector-based approach and a consumption-based approach [21]. The sector-based approach concerns all emissions from sectors within the city, while the consumption-based approach includes all emissions related to consumption within the city. The discussed approaches concern all sectors of the economy. In both approaches, Maisonneuve C. [22] identifies a high level of error in determining the total greenhouse gas emissions. The distinction between a city and its approach turns out to be important due to its nature. A city can be either production-based or consumption-based.
The proposed ASEET method is a method aimed at identifying greenhouse gas emissions from the construction sector and existing residential, commercial, service, and manufacturing buildings. The method does not include emissions from road, air, and rail transport and waste management. The method is a tool that will help decision-makers in determining zones with the highest level of greenhouse gas emissions.
The purpose of this research is to determine the city’s carbon footprint in an annual cycle as a CO2 timer towards improving energy efficiency and urban climate quality. The aim of the research is consistent with the EU requirements included in the climate packages: DSRB until 2050, Fit for 55, and other directives: EED (Energy Efficiency Directive) [17], EPBD (Energy Performance of Buildings Directive) [21], and the Renovation Wave for Europe communication [1].
The auxiliary objective is to develop basic tools for the needs of local governments in the form of carbon eco-indicators of existing urban resources for comparative and subsequent intervention purposes.
Environmental mapping of critical values of energy efficiency indicators responsible for CO2 emissions in the city development areas will be introduced. Characteristic features of individual buildings in the analyzed zones have been parameterized, taking into account not only energy characteristics but also socio-economic ones. In the discussed ASEET method, the values of individual indicators were obtained from each monitoring stage, which determined the boundary conditions for subsequent stages of data measurement. Changing legal regulations combined with the real-time monitoring system of development areas creates a mechanism for the continuous improvement of climate standards of existing buildings to an increasingly higher level of efficiency. In turn, for new buildings, monitoring of indicators will cover the life cycle, including a full LCA [23]. This obligation will support local government authorities in the correct creation of anti-smog policy.

2. Method and Assumptions

2.1. The Algorithm of the ASEET Method

This research adopted the multi-criteria ASEET method of environmental assessment of building resources [24]. The research subject adopted in the ASEET approach is the environment of urban built space, the features of which differ both in Europe and worldwide in terms of geographical, social, political, economic, and environmental conditions. Despite these differences, however, fixed criteria were adopted, on which the condition of the urban environment largely depends. The methodological approach was inspired by the idea of EU Smart Cities [25] and the results of B.J. Sovacool’s research [26] due to the indication of modern and pro-social directions of development. The main research inspiration is the direction of development of the European Green Deal adopted by the EU, the program of achieving climate neutrality by 2055. The EU’s “zero pollution” strategy by 2030 [27], which concerns the effects of air pollution and the impact of these pollutants on the health and life of society, was taken into account. Currently, more than 10% of premature deaths in the European Union each year are related to environmental pollution [28]. The research method focuses the most attention on the living environment for people. Local communities will largely verify methodological approaches; therefore, it is important to develop a bottom-up method together with public–private partnership at the stage of inventory of development zones, which the authors used. It is people who create cities and use them under the conditions of specific urban policies. The focus was on four main problem pillars of the studied urbanized space: architectural, socio-economic, energy, and technical.
The multi-criteria nature of the ASEET assessment (Figure 1) consists of identifying critical development indicators based on detailed data from the scope of the considered environmental characteristics of urban zones:
Architectural—containing data on buildings (form, function, construction with technology, and year of construction).
Social—identification of the ownership status of the building resources of the analyzed localities, affecting the ability to invest in improving energy efficiency. This affects the social costs of maintaining healthy climatic conditions in the city.
Energy—collecting data on the demand for final energy in the resource use phase.
Economic—components taking into account the necessary investment costs that residents are able to bear in order to improve the energy and technical standard of buildings. This component also affects the social costs resulting from the poor conditions of the urban environment.
In this study, the buildings have their ASEET data represented in the form of the building eco-indicators, which are used to balance the environmental effects in the annual comparative analysis.
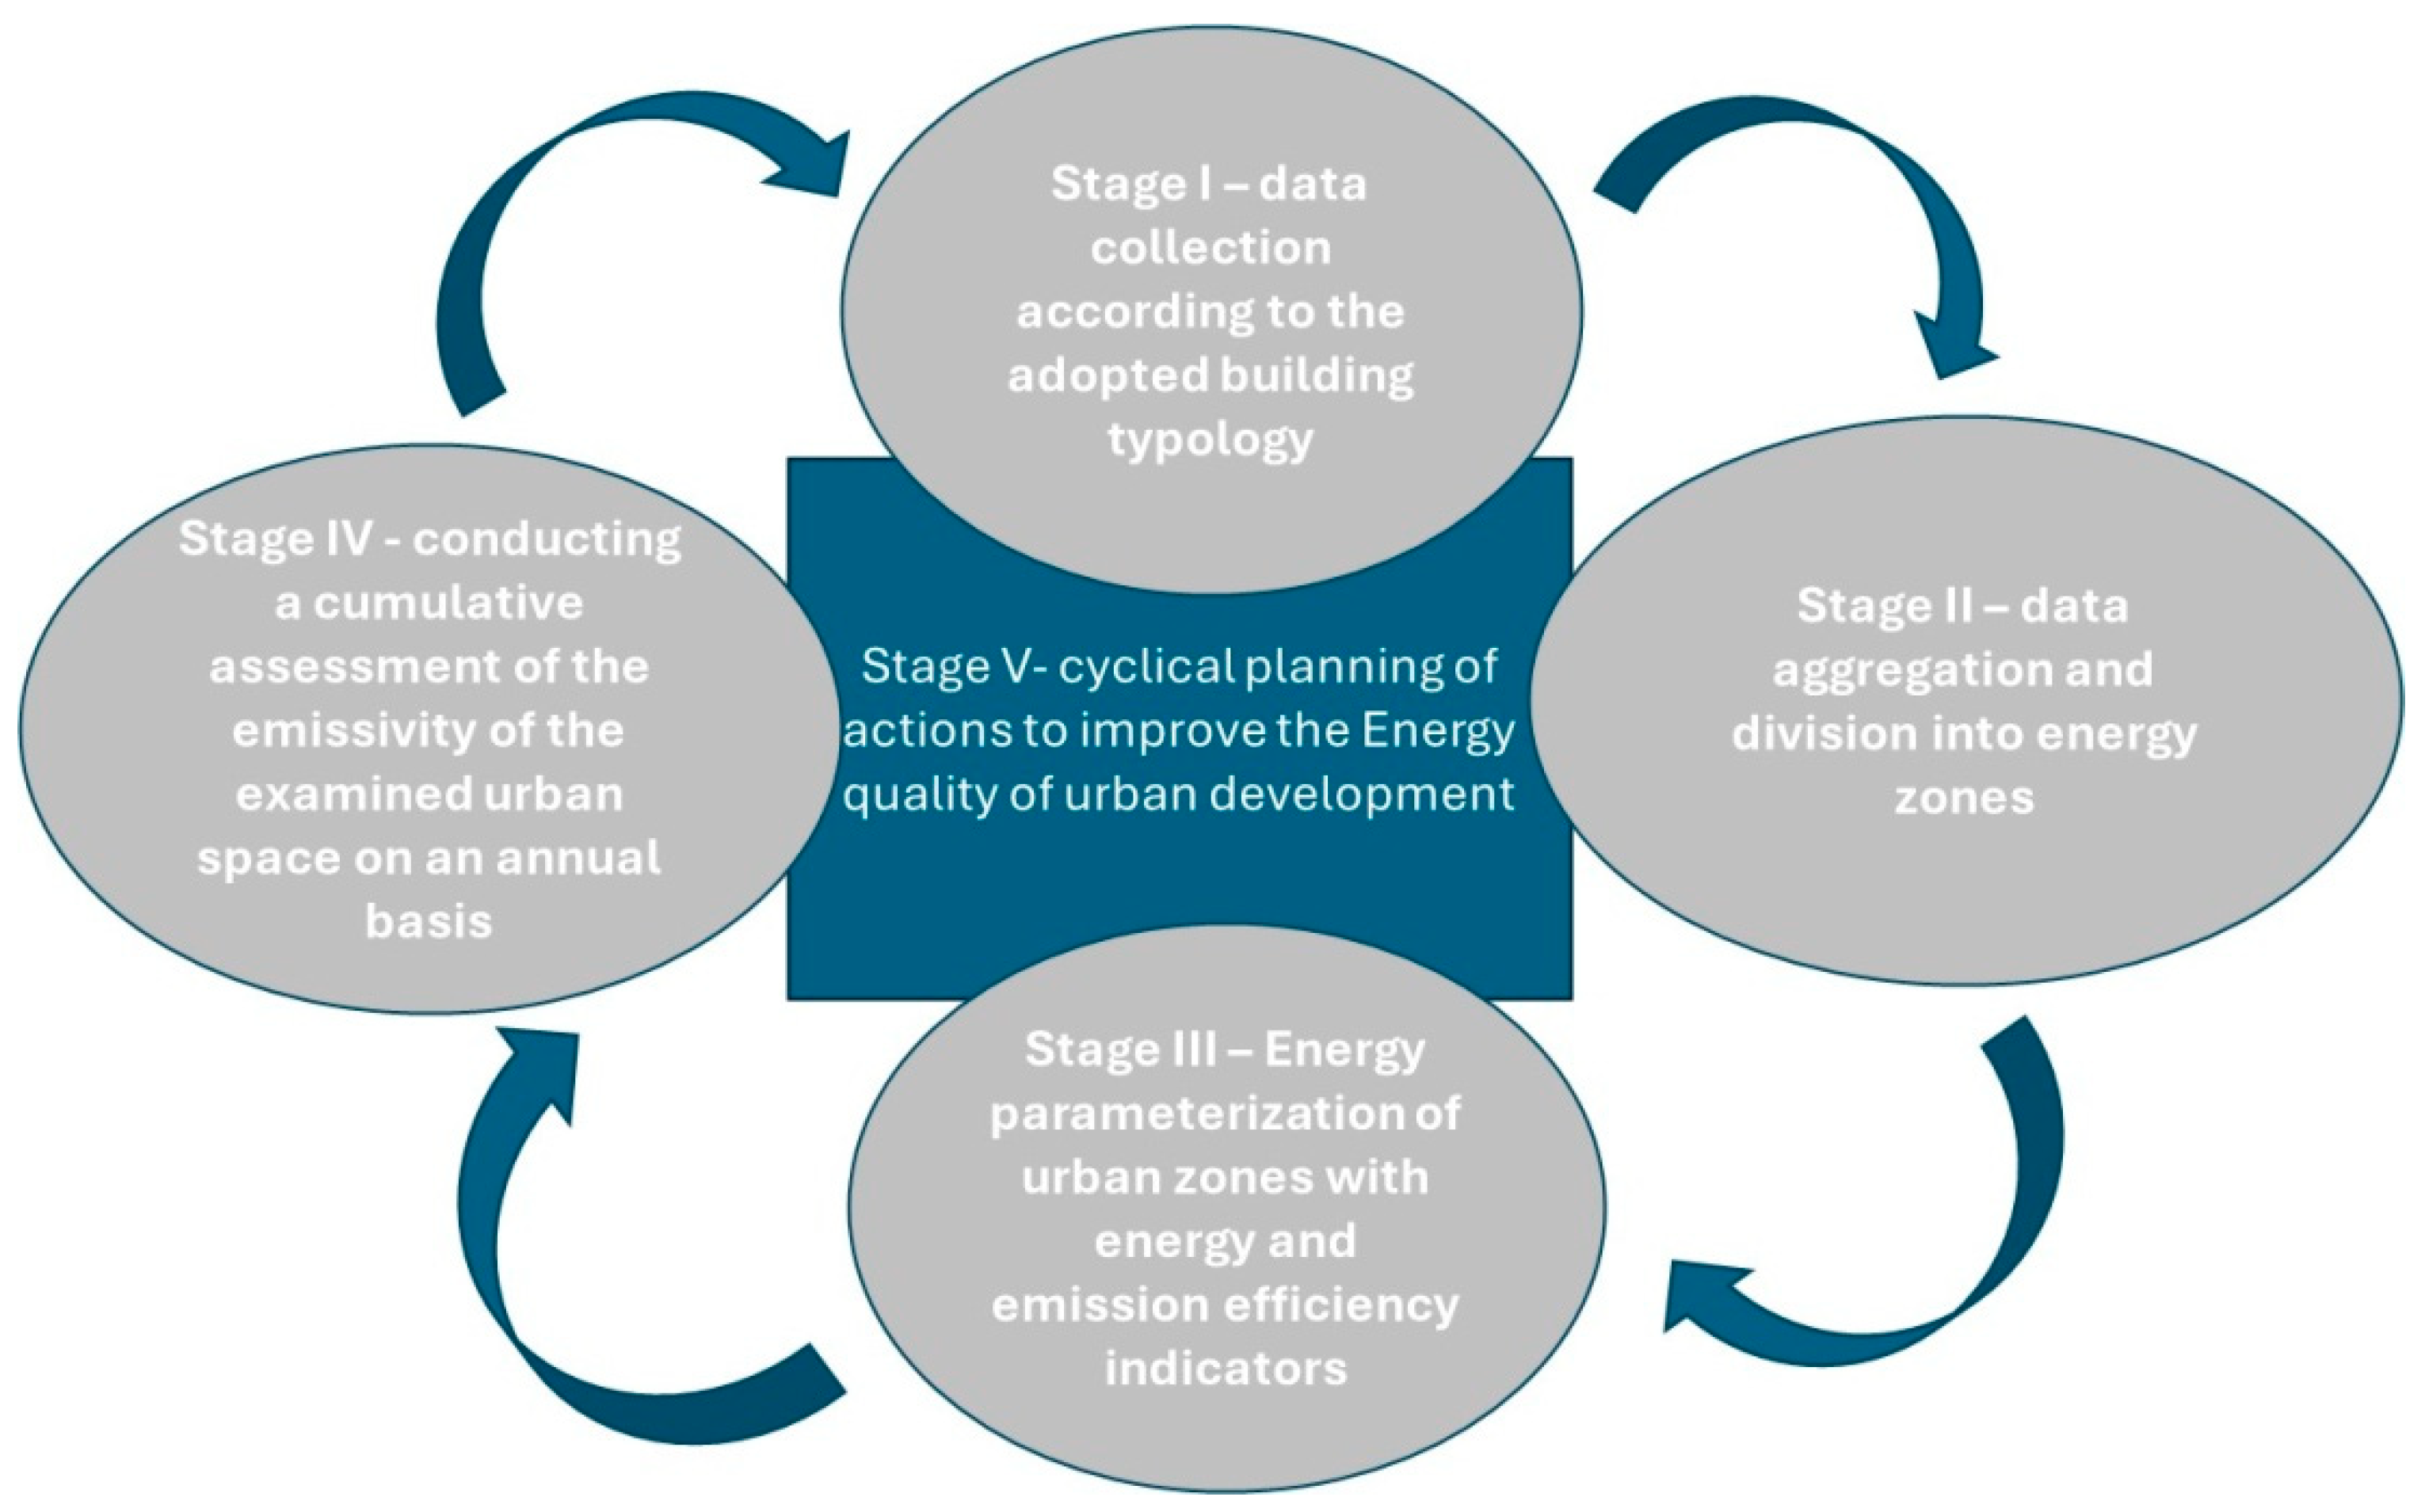
The algorithm of actions for the environmental assessment of the urban development was divided into stages (see Figure 2):
  • Stage I—collecting data from buildings (basic architectural unit of JAR).
  • Stage II—aggregating data and assigning buildings to energy zones.
  • Stage III—parameterization of buildings and introduction of energy efficiency and emission indicators to the created city development zones.
  • Stage IV—annual balance of sustainable environmental efficiency indicators in relation to the city’s emission intensity.
  • Stage V—cyclical planning of actions to improve the energy quality of urban development.
The characteristics of individual methodological stages:
  • Stage I (data collection)
The environmental data were updated and obtained in direct interviews from residents, users, and owners of private and public buildings with a specific legal and economic status using the survey method as part of the UZ research grant (no. SP/B/1/91454/10).
Information about the built-up area:
Obtained from the local law: records in local land development plans, local agenda, development strategy, and operational programs. The important data include, among others, the areas of building plots and development (Pz), development intensity (Iz), green areas and other biologically active areas, type of land development, population density, and types of development. The data were also obtained from the Central Statistical Office (GUS) and Geographic Information System (GIS), which are used to enter, collect, process, and visualize data on cities.
Architectural and technical information:
The data collected from the technical documentation of buildings in individual architectural units: building areas, usable areas and heated volumes, the purpose and function of the building, construction technology, and types of heating systems, including fuel type, to determine the estimated energy audit.
Socio-economic information:
Surveys were conducted among residents or environmental declarations were introduced for each resident/property manager, regarding the priorities for improving the technical and energy conditions, operating costs, and water and energy consumption in accordance with the ownership status of the building.
  • Stage II (data aggregation)
The creation of an electronic data matrix: architectural—types of buildings, age, and their technical features; socio-economic—types of ownership, maintenance costs, central heating, domestic hot water; energy—the heating system and types of fuel used as an energy source,
The preliminary assignment of buildings to energy zones depending on the type of technology and heating technique: red zone—buildings with coal-fired boiler rooms; yellow zone—buildings heated remotely from a central boiler room powered by coal or gas fuel; green zone—buildings powered by gas fuel; and the planned future blue zone—zero-emission buildings.
  • Stage III (energy data parameterization)
We performed data processing for buildings and their complexes in order to determine their energy efficiency potential indicators, calculated in accordance with the adopted input parameters, the so-called critical ones, intended for the comparative analysis.
  • Stage IV (balance of sustainable efficiency indicators in relation to energy emissions of urban areas)
We balanced indicators representing the individual climate zones of the city and their graphical presentation (it is possible to use Automated Mapping/Facility Management (AM/FM) technology).
  • Stage V (cyclical planning, bottom-up method—declarative or mandatory statutory—currently there is no such obligation in the EU)
The city government, through cooperation with building owners and managers, should update matrix data and then energy efficiency indicators in a cycle to identify extreme environmental threats, in order to be able to properly plan modernization intervention activities. Collecting the processed indicator data from development zones in an electronic form will allow for the results to be presented on a city map, creating a real picture of the energy efficiency and emissions of the development.
The indicator assessment concerns the existing development in one monitoring cycle, i.e., one year, omitting the full life cycle of existing architectural units. (The building is treated as a link in the urban ecosystem—an architectural unit of the JAR in the analyzed development zones). Data on the consumption of the city’s zone resources, including energy, water resulting from the technical condition and use of buildings, technical infrastructure, land coverage with green and hardened surfaces, operating and organizational costs, etc., can be collected using any electronic database. In the inventory studies, the authors obtained data from users and owners of individual buildings and the city board through direct interviews. To sum up, a simple assessment of the built space using the multi-criteria method was adopted from declarative data in order to calculate the leading indicators of the city’s energy and emission efficiency in order to illustrate the actual state of the living environment. This article does not provide methods for digitizing and processing data due to the general availability of graphic and editing programs that allow for imaging, cataloging, and calculation depending on the direction of environmental issues. However, it is possible to optimize data processing methods using advanced numerical techniques cooperating with big data databases, for example, using Bayesian networks [28,29], which are particularly useful in assessing soft socio-economic indicators. The final assessment presents research results using classic editing programs. The aim of the final assessment in the ASEET method adopted by the authors is to demonstrate the CO2 emission burden of the urban zones QEC and to indicate summary energy efficiency indicators for the final energy EK and primary energy EP of the city.

2.2. Research Assumptions

The assumptions resulting from the interdisciplinary methodological approach to the urbanized space, such as architectural–technical, socio-economic, and energy, were adopted. The research used an interdisciplinary approach to identify the source of emissions, which will be helpful in achieving zero net emissions by combining various elements: epistemic, economic, technical, social, political, and environmental [30,31].
The integrated energy management model proposed by Hari Srinivas is based on three interdependent components (see Figure 3) [32]:
Efficiency—the use of appropriate technologies, and the planning and management of energy systems that will facilitate the most effective use of energy in human activity.
Equity—the introduction of financial mechanisms for the research, development, and use of the limited and alternative sources of energy distributed in the urban development, together with the establishment of priorities for their fair distribution.
Sustainability—determining the distribution of energy consumption in a way that ensures long-term stability, quality, and social access to alternative renewable energy sources, taking into account the impact of the existing energy sources on changes in the local and global ecosystem.
The sustainable city scheme in the energy management model of H. Srinivas does not consider the social, architectural, and environmental conditions of the development. The research by C. M. Baum and C. Gross [33,34], which the authors took into account in the adopted method, shows that the increase in negative impacts, including emissions, on the environment is related to excessive consumption, sometimes irrational social behaviors, and weak tools for conducting the urban resource management policy [28,35].

2.2.1. Architectural and Technical Assumptions: Case Study

This study used the urban environment of the city of Gubin in Poland, which is a small city according to the Degurba classification (NTS-4 and NTS-5, currently LAU). (The latest update of the classification is based on the 2011 population grid and the 2016 Local Administrative Units (LAU) boundaries. The next major update will be based on the 2020 Census results. Background—Degree of urbanization—Eurostat (europa.eu).) A further description of the ASEET method and the method of collecting inventory data was given for the selected model city. The method concerns activities in the urbanized areas, so the size of the city does not matter. (The authors continue and monitor the research started in 2010 (Research Task No. 1 for NCBiR in the years 2010–2011: Analysis of the possibilities and socio-economic effects of increasing energy efficiency in construction. Carried out by the research team of the University of Zielona Góra WILiŚ under the supervision of Dr. Eng. Arch. J. Kopietz-Unger, prof. UZ. The research for the city of Gubin was conducted by Dr. Eng. Arch. P. Sobierajewicz.)
In the research model, at the inventory stage, assumptions were made for the initial classification of buildings into zones in terms of the potential for environmental hazards, including CO2 emissions, in order to separate intervention areas with similar typological features. In the second stage, the ASEET data were analyzed in terms of leading parameters, such as indicators of effective energy demand QK, including fuel consumption, which in turn will affect emissions.
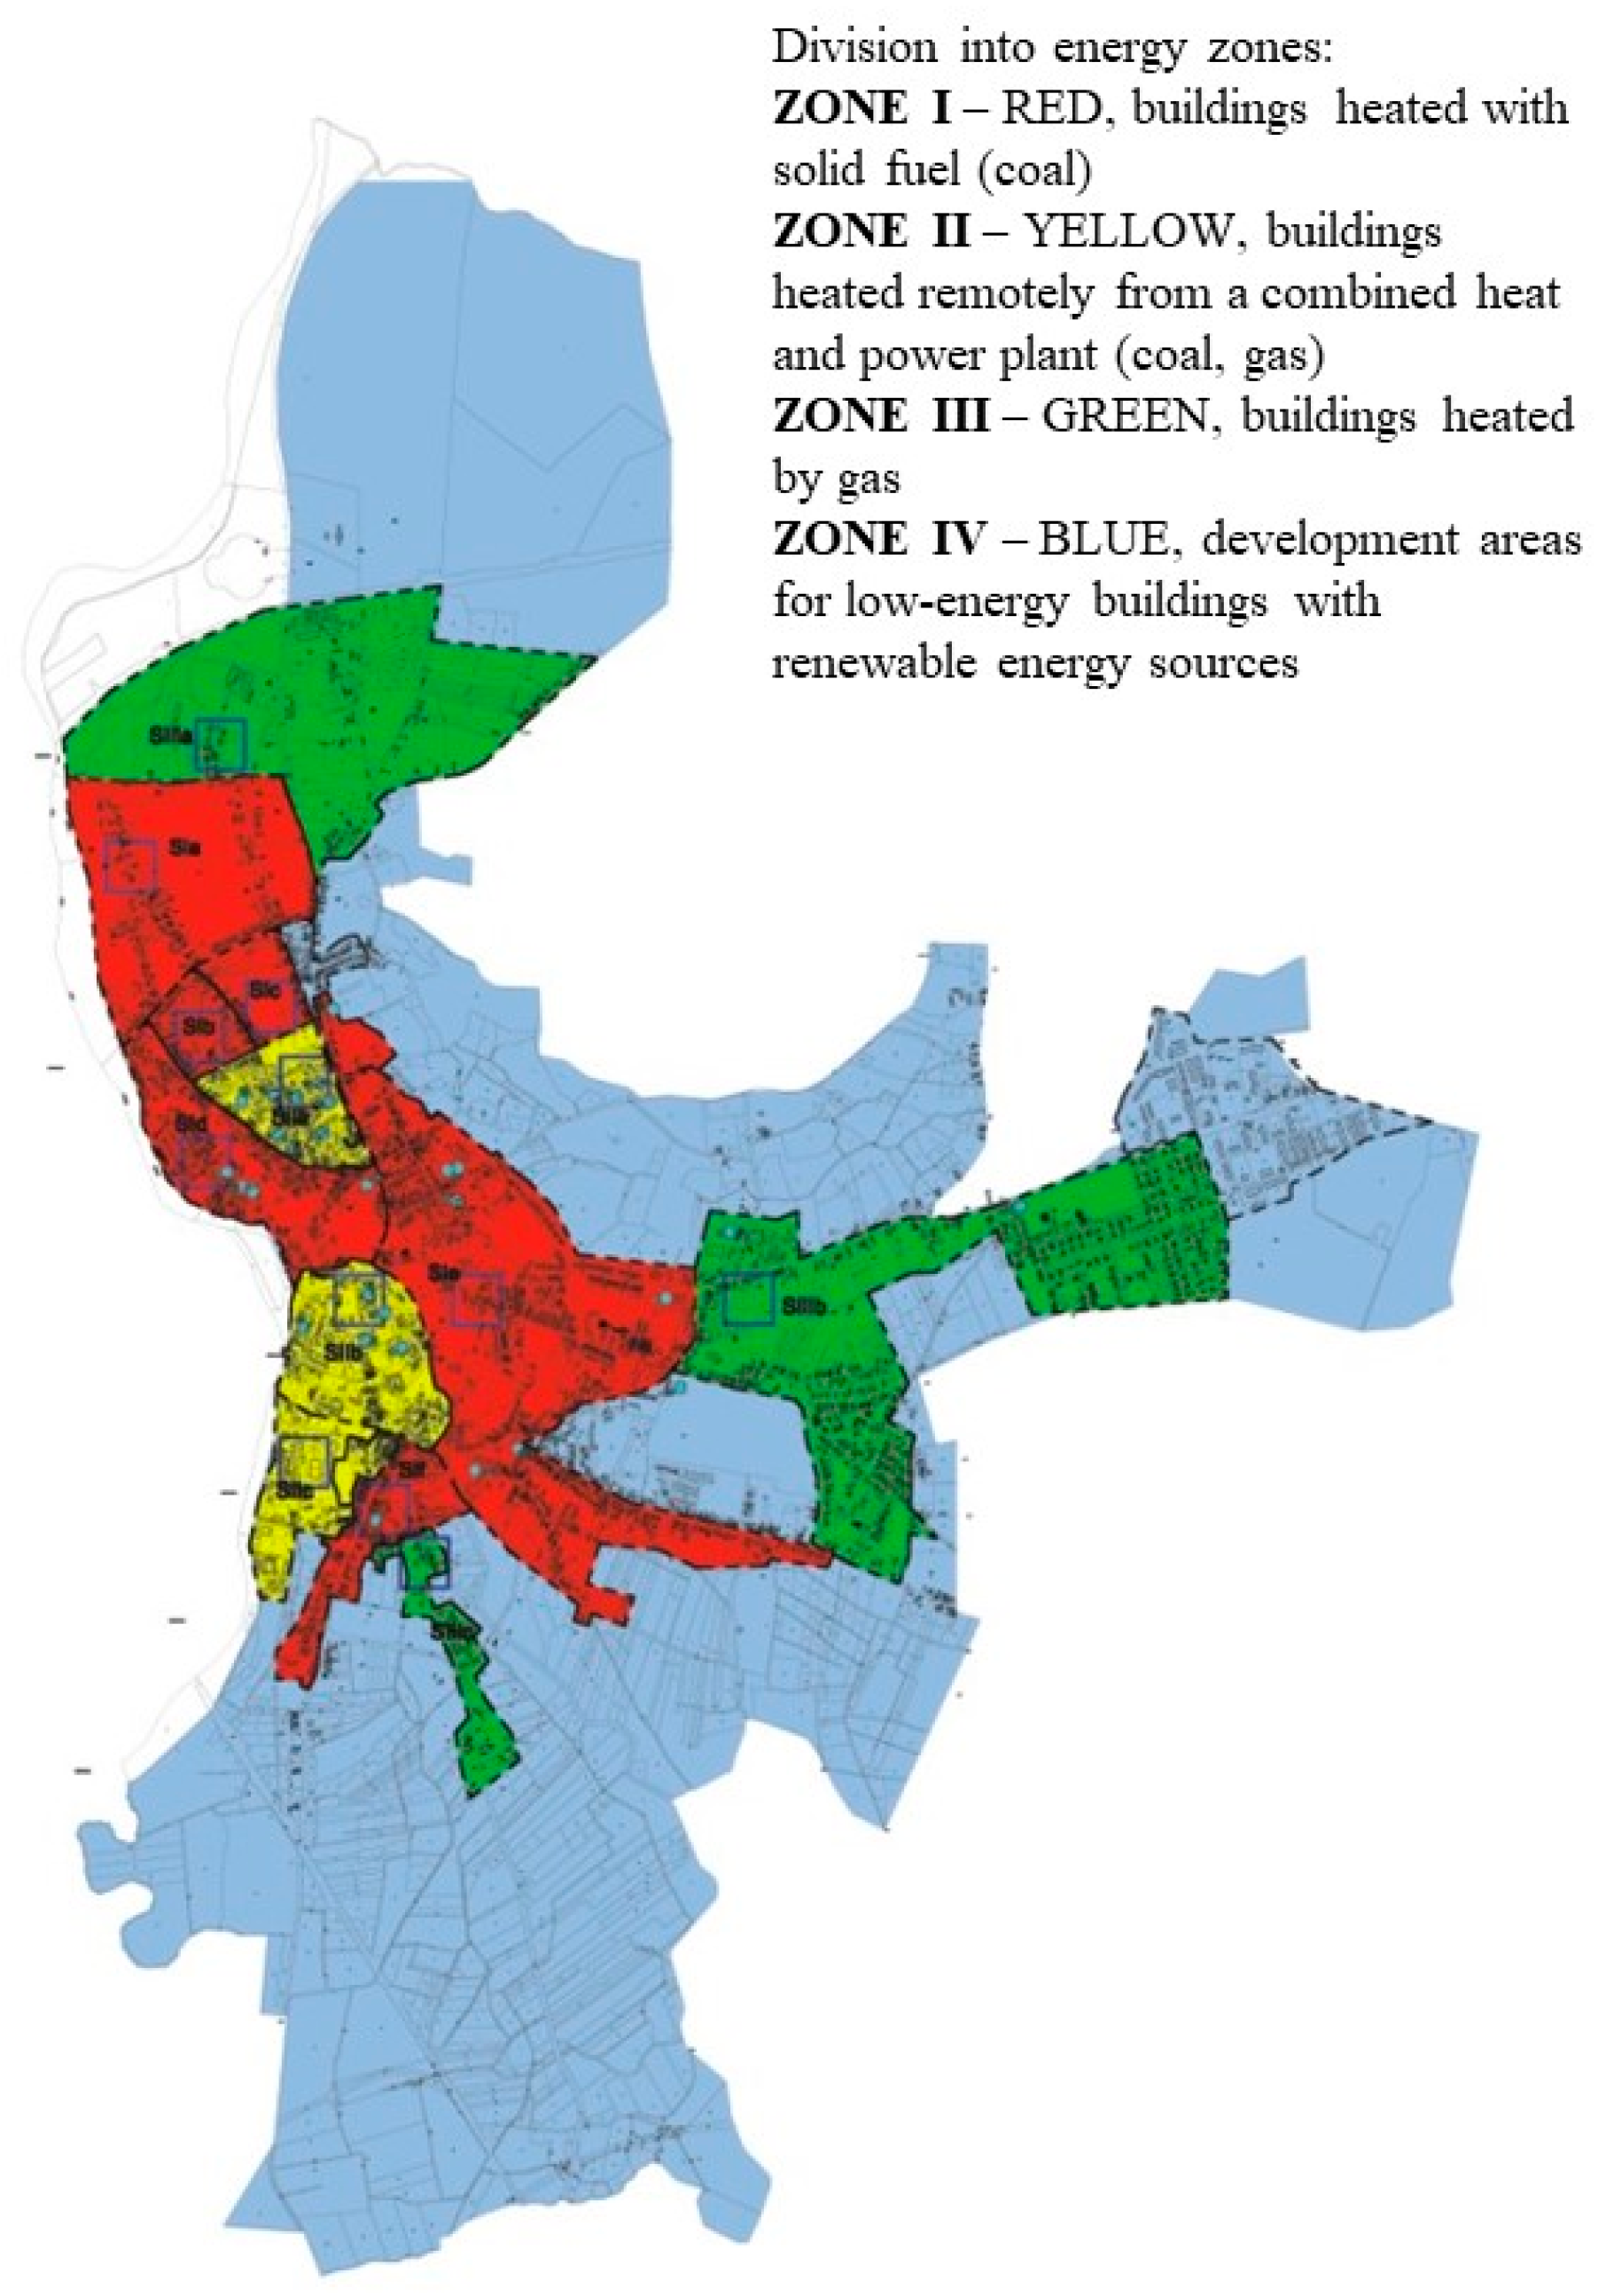
The assumption was made to divide the city area into energy zones resulting from various energy sources, i.e., coal-fired boiler rooms, gas-fired boiler rooms, district heating plants, and RES.
The presented zonal division of the buildings was proposed for the purposes of conducting the energy optimization studies. The buildings were divided into a series of types from R1 to R6 and are listed in Table 1. The additional division of buildings in terms of ownership rights affects the possibility of conducting a socio-economic assessment of the built-up area.
The adopted typological division of the buildings is used to select and optimize the technical solutions responsible for energy savings in the studied development zones. The focus was on those elements whose energy parameters U, EK, and EP are used to select the optimal thermal modernization version of the buildings [36]. These include the following elements:
External wall insulation;
Flat roof insulation;
Basement/floor insulation on the ground;
Replacement of joinery;
Modernization of the central heating system with the possibility of combining it with renewable energy sources;
Modernization of domestic hot water using RES systems;
Modernization of ventilation.
There are also interdependent ones such as building area, heated areas, number of residents, number of premises, and heated volume of the building.
In further ASEET analysis, technical and energy parameters will be called hard energy consumption indicators. An elementary approach to each building indicates weak points and the possibility of their assessment and improvement.
It is also possible to assess the costs of bringing the building to a state of maximum energy efficiency [37], taking into account the style and manner of use as soft indicators of energy consumption [28], which are the subject of the authors’ scientific research and are not analyzed in this article.
The knowledge of both types of energy consumption indicators, hard and soft, allows for rational actions and the development of research towards zero-energy buildings [21]. This article focuses on hard indicators, with the goal of their representation in the city.

2.2.2. Socio-Economic Assumptions

This research took into account the status of the buildings, e.g., municipal, housing communities, private owners, administration, and public utility. The economic data were collected regarding the operating costs of the main energy sources, which affect the costs of adapting the building to the current climate requirements. Table 2 presents a quantitative summary of the buildings with various ownership statuses adopted in the studied urban zones.
The selected buildings in Table 2 represent this specific type of development in the studied zones.

2.2.3. Spatial and Energy Assumptions

The next stage of the ASEET method is to determine the initial division of the city’s spatial area into zones, resulting from the characteristics of the power supply of the buildings and their complexes. This division is important in order to launch a self-repair mechanism, improving the energy status of the built-up areas, for example, using learning systems [38,39]. Therefore, the built-up areas were arranged according to the adopted criteria, into energy and emission groups used for the graphical presentation of the studied energy efficiency issues.
In collecting the data, the approach adopted was the amount of the fuel consumption (coal, gas, electricity, diesel oil) for heating purposes (C.H.) and the domestic hot water (C.H.W.) of individual building types on an annual basis.
The individual building types are assigned to the energy (emission) zones according to the following division criteria, based on the age of the building, construction technology, and type of main heat source:
Zone I (red), heat delivered to the recipient from a local boiler room for solid fuel (coal, coke);
Zone II (yellow), district heat delivered to the recipient from a central heating plant powered by gas or solid fuel;
Zone III (green), heat delivered to the recipient from a local gas boiler room;
Zone IV (blue), heat delivered from renewable energy sources (RESs), low-energy-consumption development, with almost zero and plus energy features.
The survey and inventory studies covered existing buildings belonging to zones I, II, and III, while the buildings in the blue zone were omitted as they had no emissions (see Figure 4).
The buildings and greenery accepted in the zones constitute a database of the technical, energy, environmental, and socio-economic data for further expansion in subsequent research cycles [40,41] as big data.

3. Research Process

3.1. Stage I and II: Collection of Building Data (SI) and Data Aggregation (SII)

At the data collection stage, the socio-economic and legal structure of the city’s buildings was taken into account and examined in terms of the qualitative state of the individual types of urban buildings, in accordance with the criteria included in the research assumptions.
The collection of the technical–energy and socio-economic data in the studied architectural and urban units was carried out using the survey method in direct interviews (see Figure 1). Three types of survey were prepared: Q1—survey regarding the building; Q2—information about the adjacent area; Q3—user/resident (method of use of the premises and operating costs). The survey was carried out optionally with the residents’ awareness of the improvement of the existing living and use conditions with the simultaneous impact on the environment. For this reason, a bottom-up approach was used.
The data on energy consumption in the zones were obtained from an individual approach to each building and were collected in a central zone data matrix. This paper describes the ASEET emission assessment path by selecting sample areas belonging to the entire study. The final results present all emission zones in the entire city.
The survey studies were conducted in direct interviews with 500 users from 44 representative buildings assigned to the energy (emission) zones in accordance with Table 3.
The data matching the criteria for the division into energy and emission zones and data necessary for further analysis were selected from the surveys, as follows:
Year of construction of the building (or thermal modernization);
Function of the building: residential, service, other;
Construction technology;
Architectural parameters: total area, usable area, cubic capacity, number of stories, number of residents, biologically active areas;
Type of infrastructure, including type of fuel and method of supplying heat to the building (local, remote);
Energy consumption and costs of heating the building and domestic hot water, lighting, and other costs related to the energy consumption;
For the buildings with an energy certificate, the indicators of annual demand for primary energy EP or final energy EK.
All the obtained information about the buildings for each of the SI, SII, and SIII zones was collected in data matrices for further environmental analyses.

3.1.1. Data for Zone I

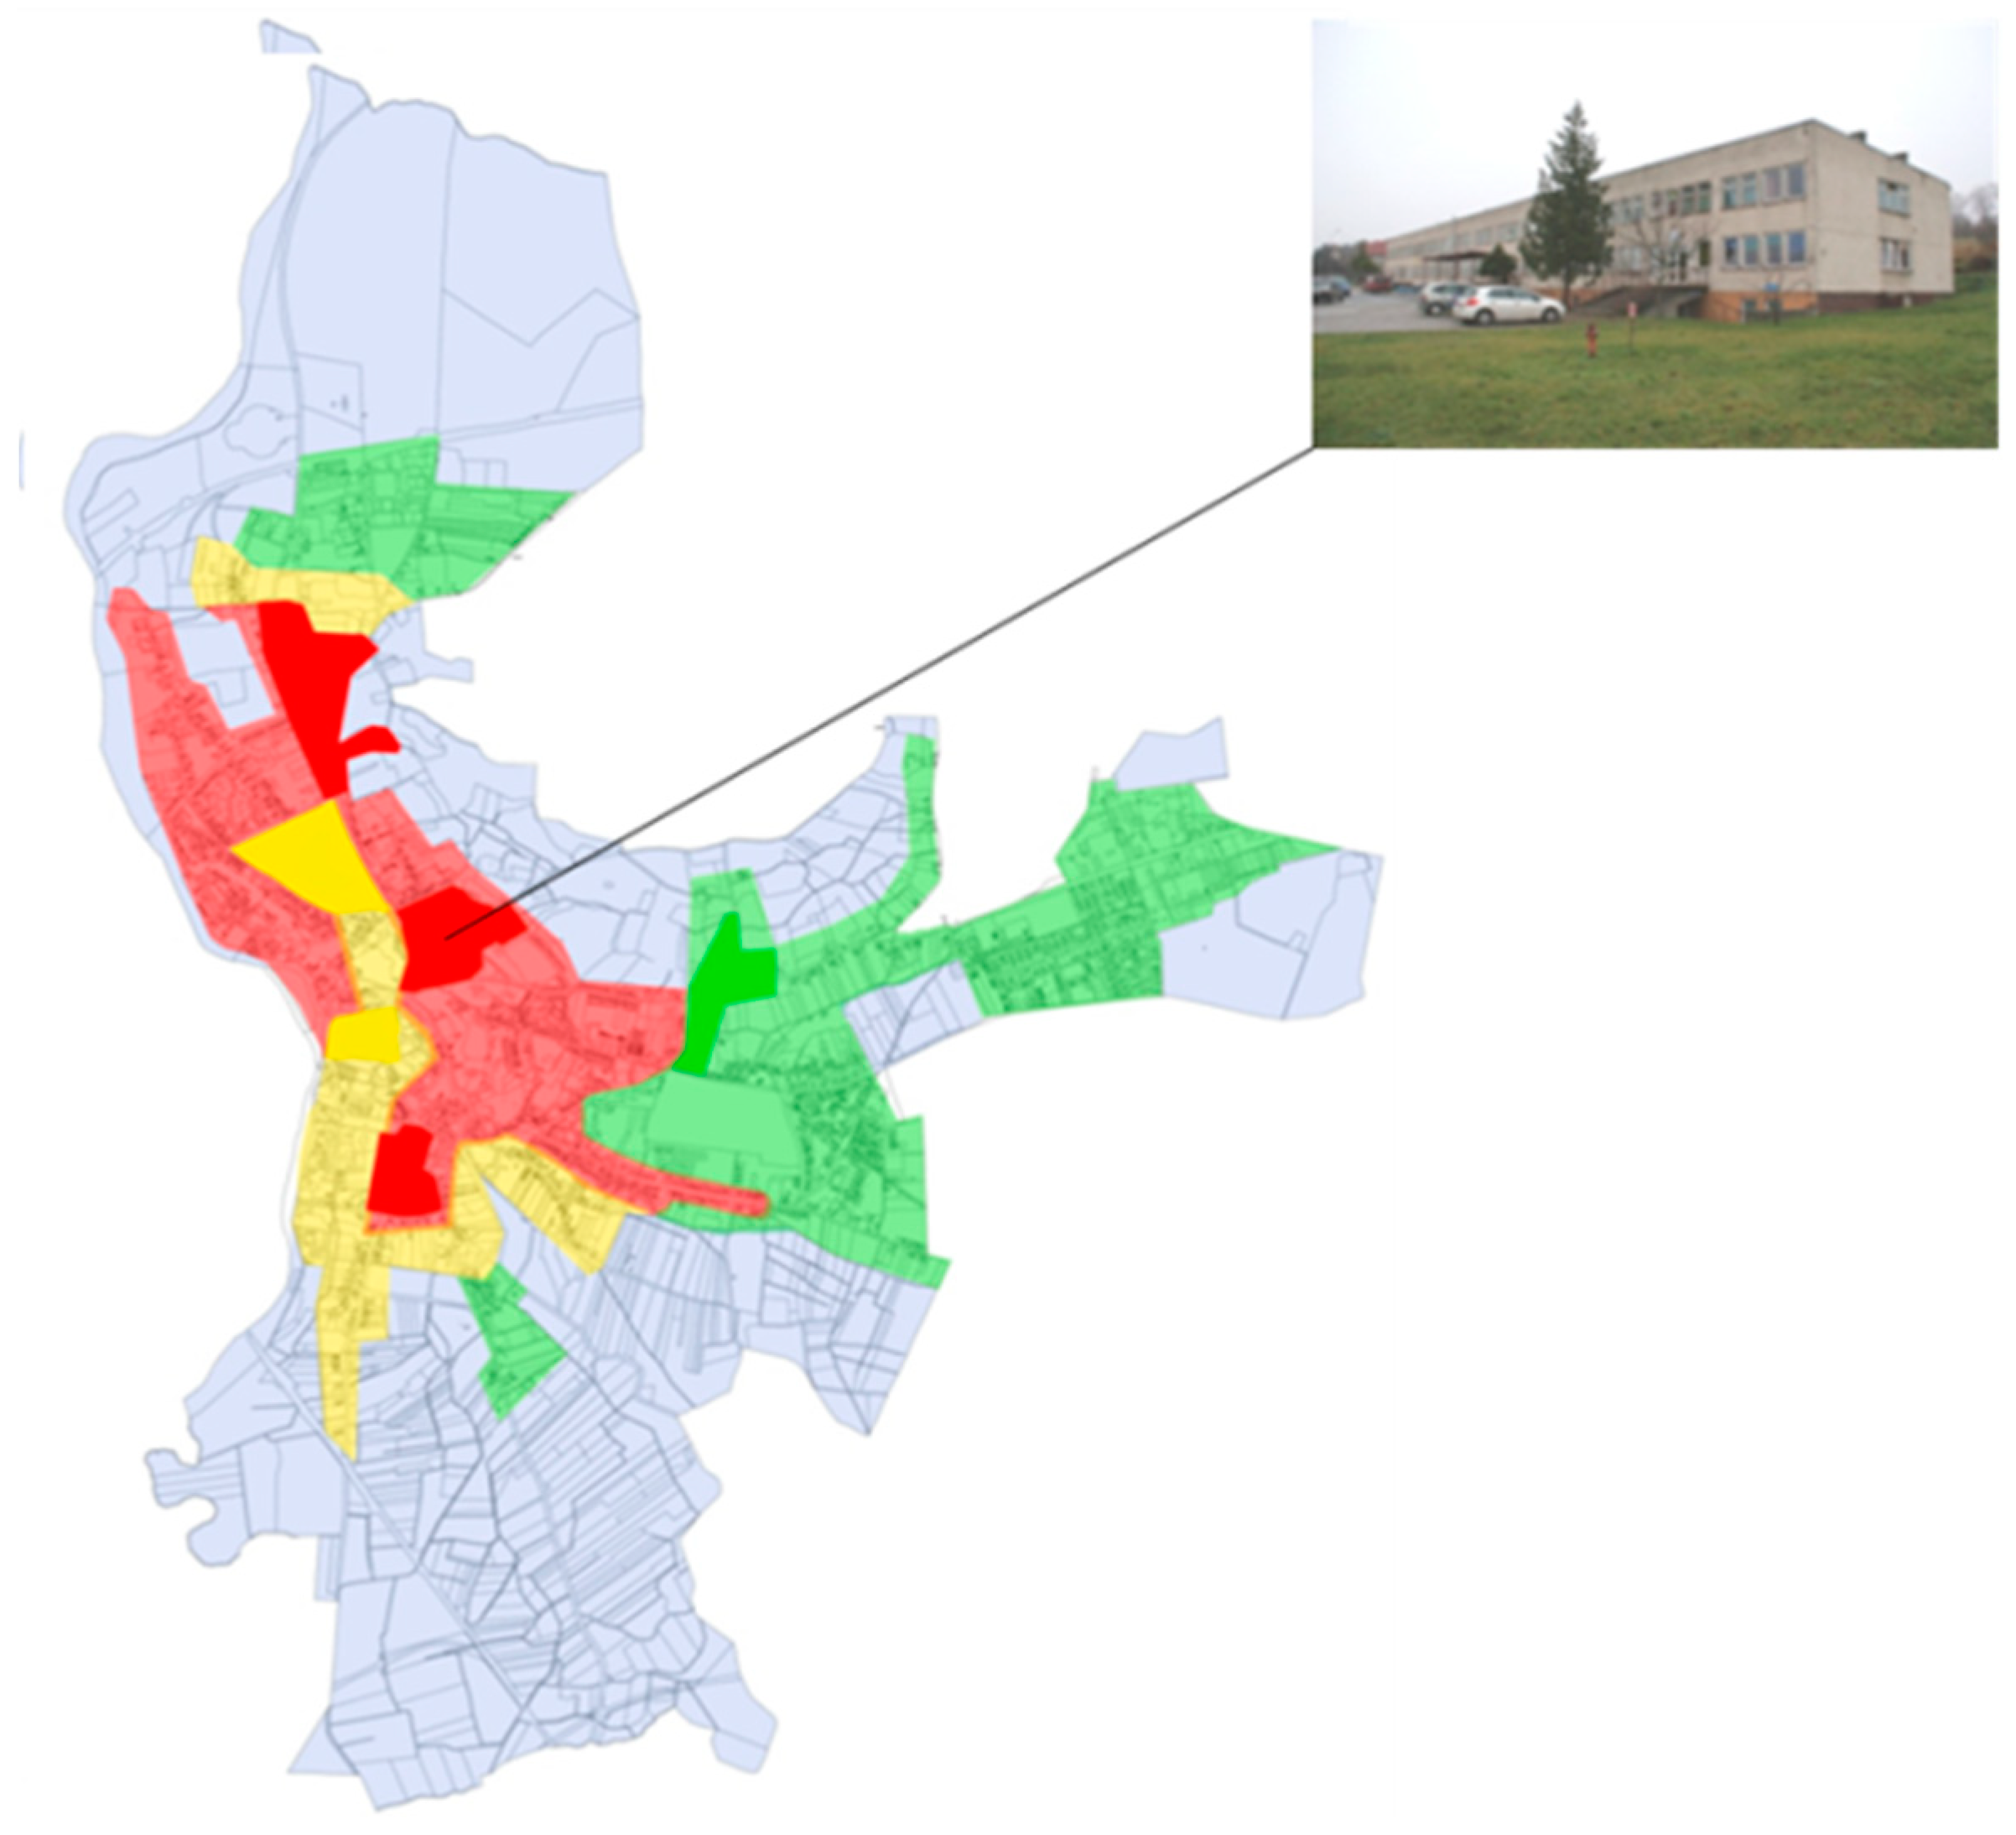
At stage I, each building was assigned to an energy and emission zone according to the technical and energy criteria (Figure 5 and Table 5). Collecting and gathering the technical, energy, and socio-economic data of the building is a process that requires the constant monitoring of the parameters responsible for the emission status of the buildings.
The next step is to assign the buildings to the individual categories (Table 4), which enables the monitoring of the environmental parameters within one typology.
The majority of the buildings examined in the zones were constructed using traditional technology—Cat. 1. This category contains buildings from the pre-war period (before 1945) and often contemporary single-family buildings fueled with solid fuel (coal), while in the industrialized technology of Cat. 3, the majority are buildings fueled with district heating (zone SII).
Each analyzed zone is characterized by a specific representative type of development (R1–R6) with similar technical features. In this case, the number of repeatable typologies is important, e.g., in the case of a housing estate of prefabricated large-panel buildings (zone II) or the tenement houses in old towns (zone I).
Table 5 presents a set of data for the Health Clinic building in the R6 typology, year of construction 1975–80, no thermal modernization, solid fuel boiler room. Data from the inventory matrix (Table 4), located in zone I (Figure 5).
The collected data were systematized according to the ASEET methodology and divided into architectural–technical, economic, and energy, focusing on hard indicators. The data from the individual buildings were transferred to the collective matrix of the buildings in zones (Appendix A, Table A1—matrix for zone SI; Table A2—matrix for zone SII; Table A3—matrix for zone SIII).
The output parameters such as Ep, Ev or Qk, Qkl from each building monitoring cycle are called critical. They are subject to analysis when planning changes that increase the energy and emission efficiency of the city zone in annual periods.
The exposure of one of the representative buildings of type R6 in Category 3, i.e., a public utility building assigned to emission zone I in the city plan (Figure 5), was presented. This is one of the examples of creating emission zones based on hard parameters—the technical and energy parameters of the existing development. The characteristic features of the analyzed building are listed in Table 5.
The parameters of the development zones are recommended for the potential local environmental database. Buildings with low energy efficiency are particularly important for the development of the future EU renovation policy [10]. The renovation path of such buildings is difficult due to the requirements of the staged implementation of the thermal modernization works, starting with the heating systems, replacement of door and window joinery, or major renovation in order to achieve the effect of reducing the primary energy consumption indicator EP below 120 kW/m2 year [10]. Reducing EP in the existing buildings depends on many factors, such as the type of energy source, the technical condition of the building, and the way the building is used, which is related to the size of the demand for final energy EK [10]. The data collection and aggregation reveal the first problem of access to the data at various levels, i.e., legal restrictions and organizational barriers to obtaining the sensitive and hard data related to the building that affect the energy condition of the urban environment. The main problem is the poorly developed network of a publicly available database or its absence. However, the data on the buildings are easiest to obtain from residents/users/owners or from declarations at the commune level.

3.2. Stage III—Indicator Parameterization of Energy Zones

3.2.1. Characteristic Critical Indicators for Red Zones SI a–f

Processing the input data for the representative buildings is required to determine the efficiency potential indicators (We1–11) for buildings and their complexes. The ASEET parameters for modeling the buildings adopted in the study (Table 5) are the input–output parameters in the city monitoring system, which are critical in the planning process. The indicated spatial parameters of zone I belonging to the hard energy consumption indicators (SI data matrix Appendix A Table A1) were determined for 6 urban subzones SI a–f. In this study, the area of interest was the buildings with the highest share of energy consumption of solid fuel from non-renewable sources. Most of these buildings are municipal resources, as well as private tenement houses in the city center. A large group of buildings using solid fuel for central heating and domestic hot water purposes are multi-family and single-family buildings, and they appear in the adopted R6 classification (Figure 6). Most of the single-family housing estates built even in the 1990s were equipped with coal-fired boiler rooms as the main or alternative heat source. (In Gubin, until 1995/6, there were no permits for supplying buildings with gas for heating purposes. Pre-accession Funds—non-repayable financial aid provided by the EU to candidate countries. Their main goal is to prepare these countries for EU membership and to help level out economic differences. The instruments operating within these funds include PHARE, ISPA, and SAPARD).
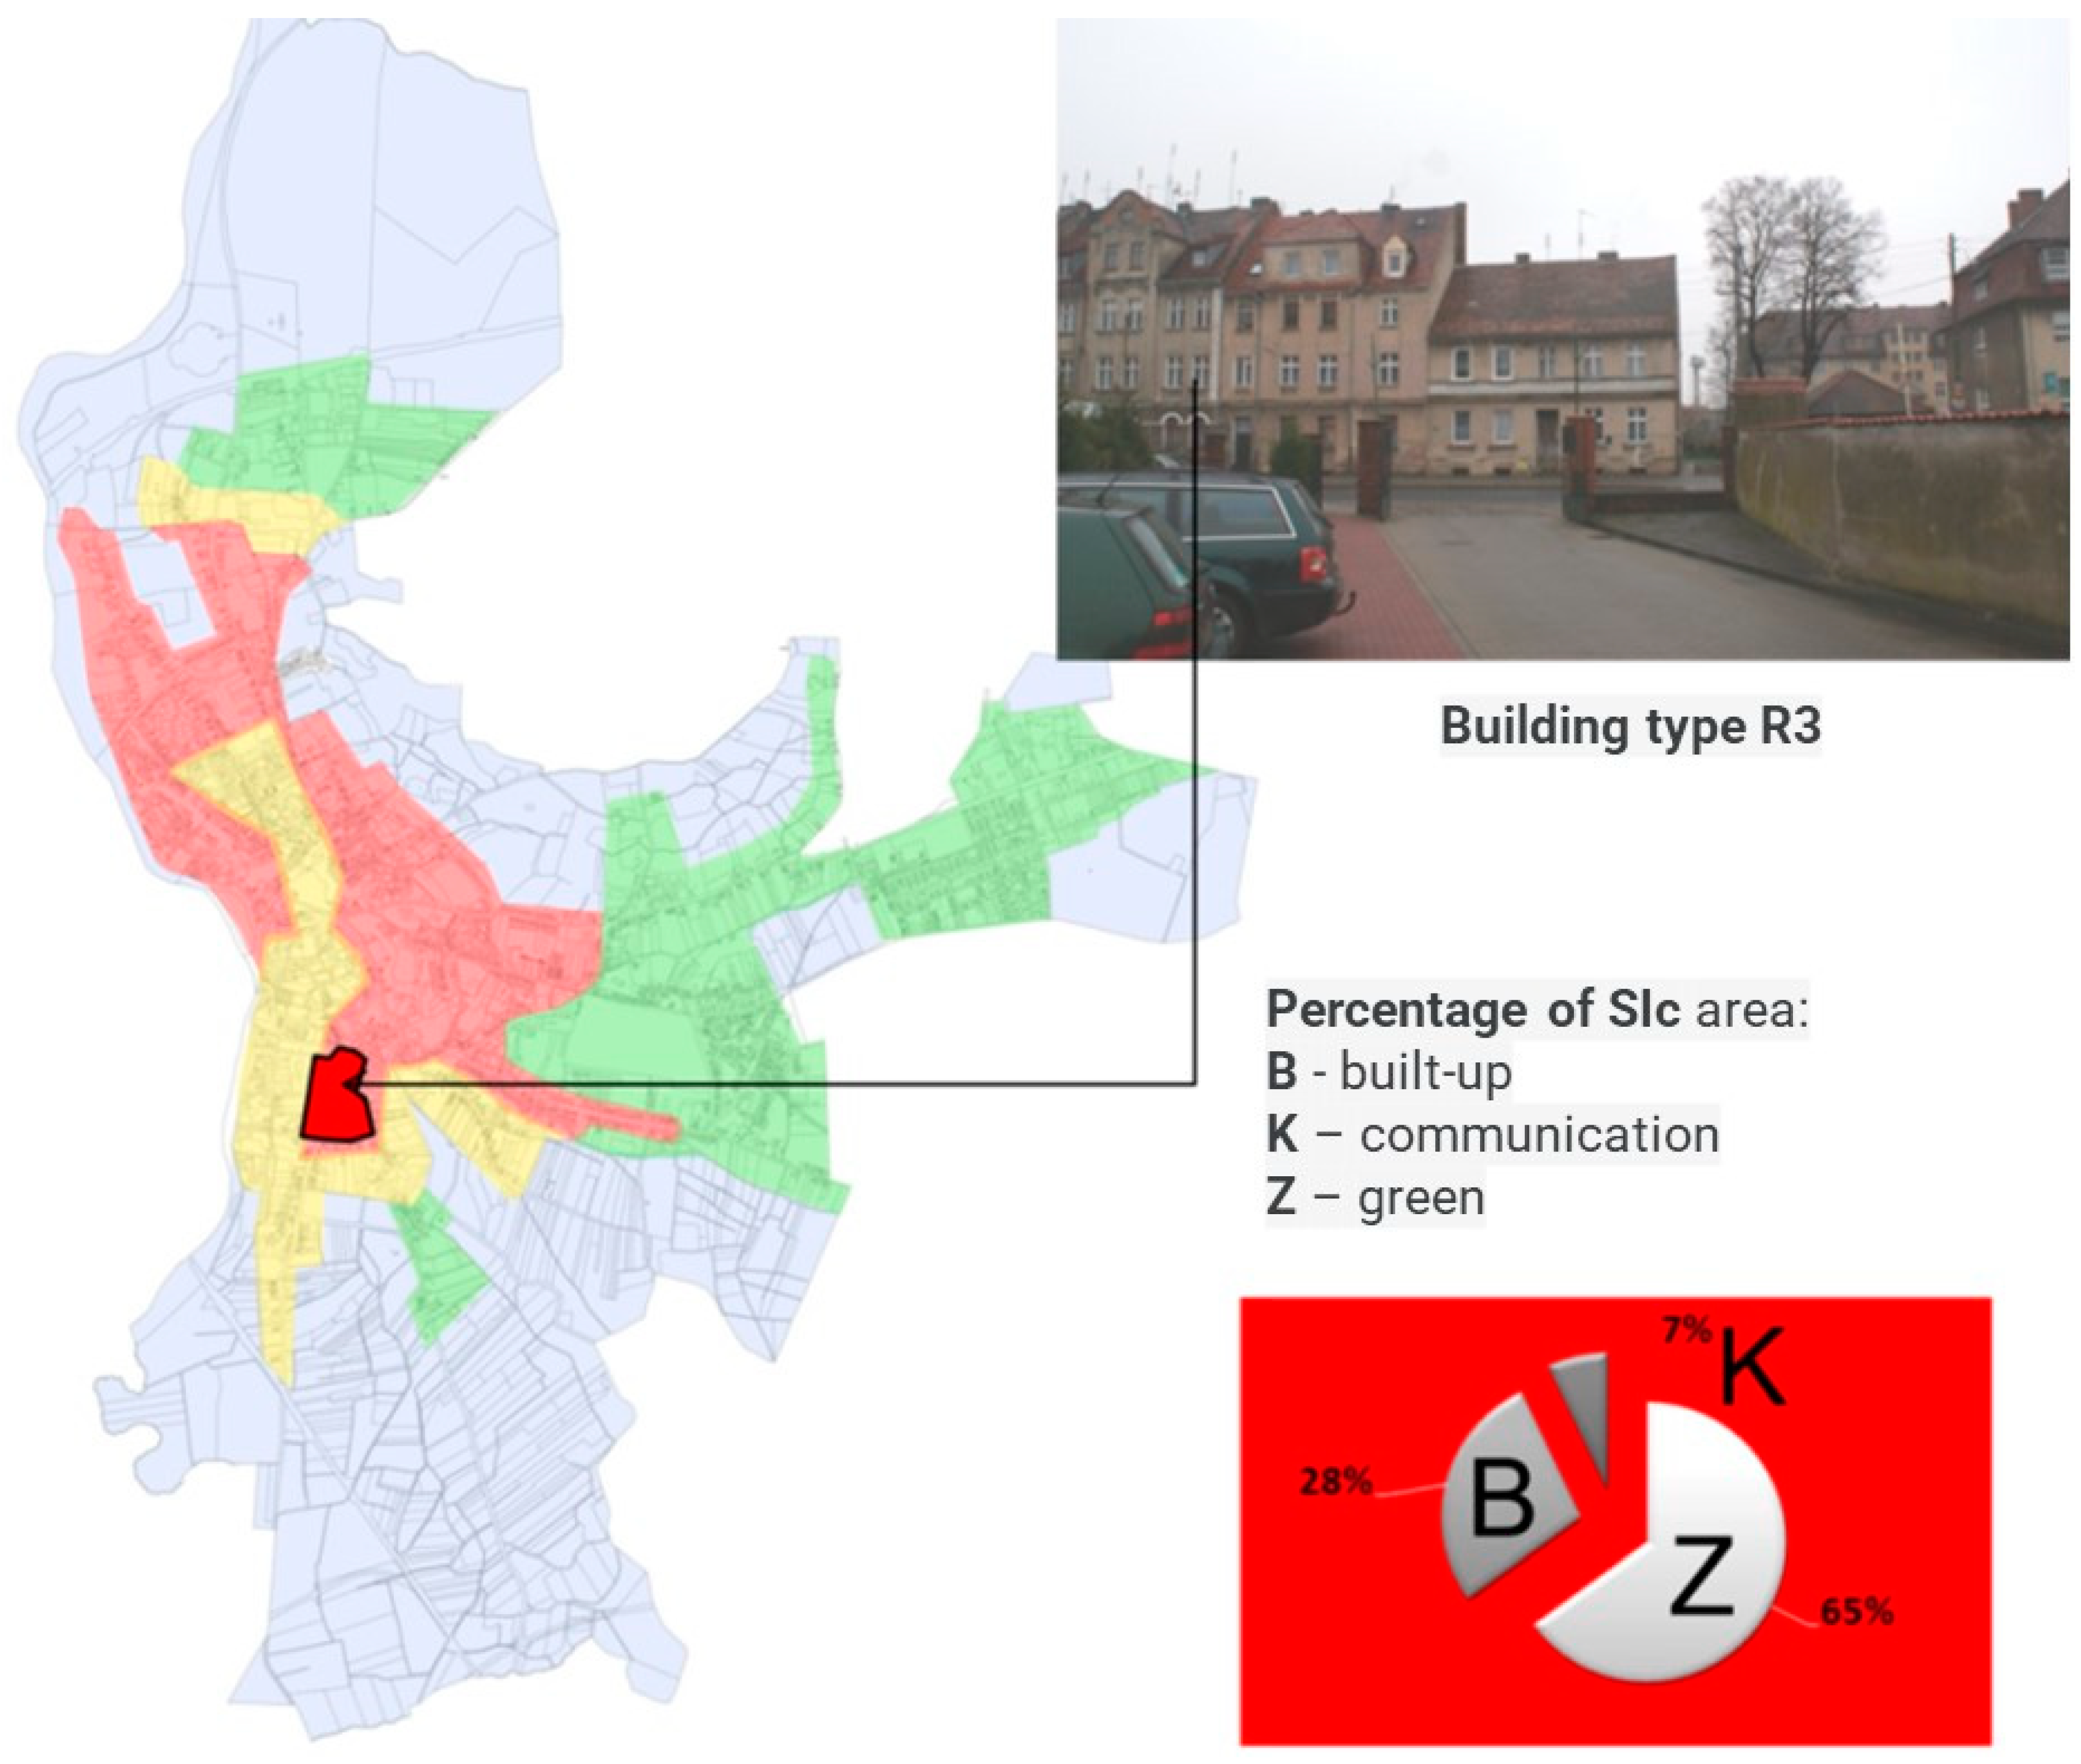
The SIc zone (Figure 4) consists of buildings mainly from the pre-war period, multi-family tenement houses in the R3 typology and public utility buildings such as a hospital and a Municipal Services company. The quantitative division of the area parameters is as follows:
  • B—28% of the built-up area;
  • K—7% of the communication area;
  • Z—65% of the green area.
Each of the emission zones (SI, SII, SIII), for which the representative buildings were selected in terms of the architectural, technical, and energy criteria (Section 3.1.1), was parameterized with efficiency indicators We1–11 as urban and energy indicators of the zone development. An example of the parameterization of one of the areas in zone I (red)—zone SIc—is presented in Table 6.
The emission factors We10 and We11 of zone SIc in accordance with Table 6 reflect the actual situation of the air pollution in the studied area. An important role is played by the biologically active undeveloped areas We3, because they can significantly reduce the We10 parameter of the development’s CO2 emissions. In Table 6, the unit emission of the zone refers to the development area of the zone, which contains the cumulative value of the energy demand (We6 = 394.48 kWh/m2/year) from all floors. The green areas in zone SIc reduce the emission factor of the development We10 75 times, which is evidenced by the emission factor of the zone, We11 = 0.0017 Mg/m2/year. On the other hand, the total emission factor We9 of the studied SIc zone is 215.77 Mg CO2/year, which is a critical parameter in the next monitoring cycle. The soft indicators are also important in comparison with EK = 394.48 kWh/m2/year, building density, population, and socio-economic indicators such as the costs of final energy consumption in the zone (We8 = 19,031.5 EUR/year), which are the subject of the authors’ research.

3.2.2. Characteristic Critical Indicators for Yellow Zones SII a–c

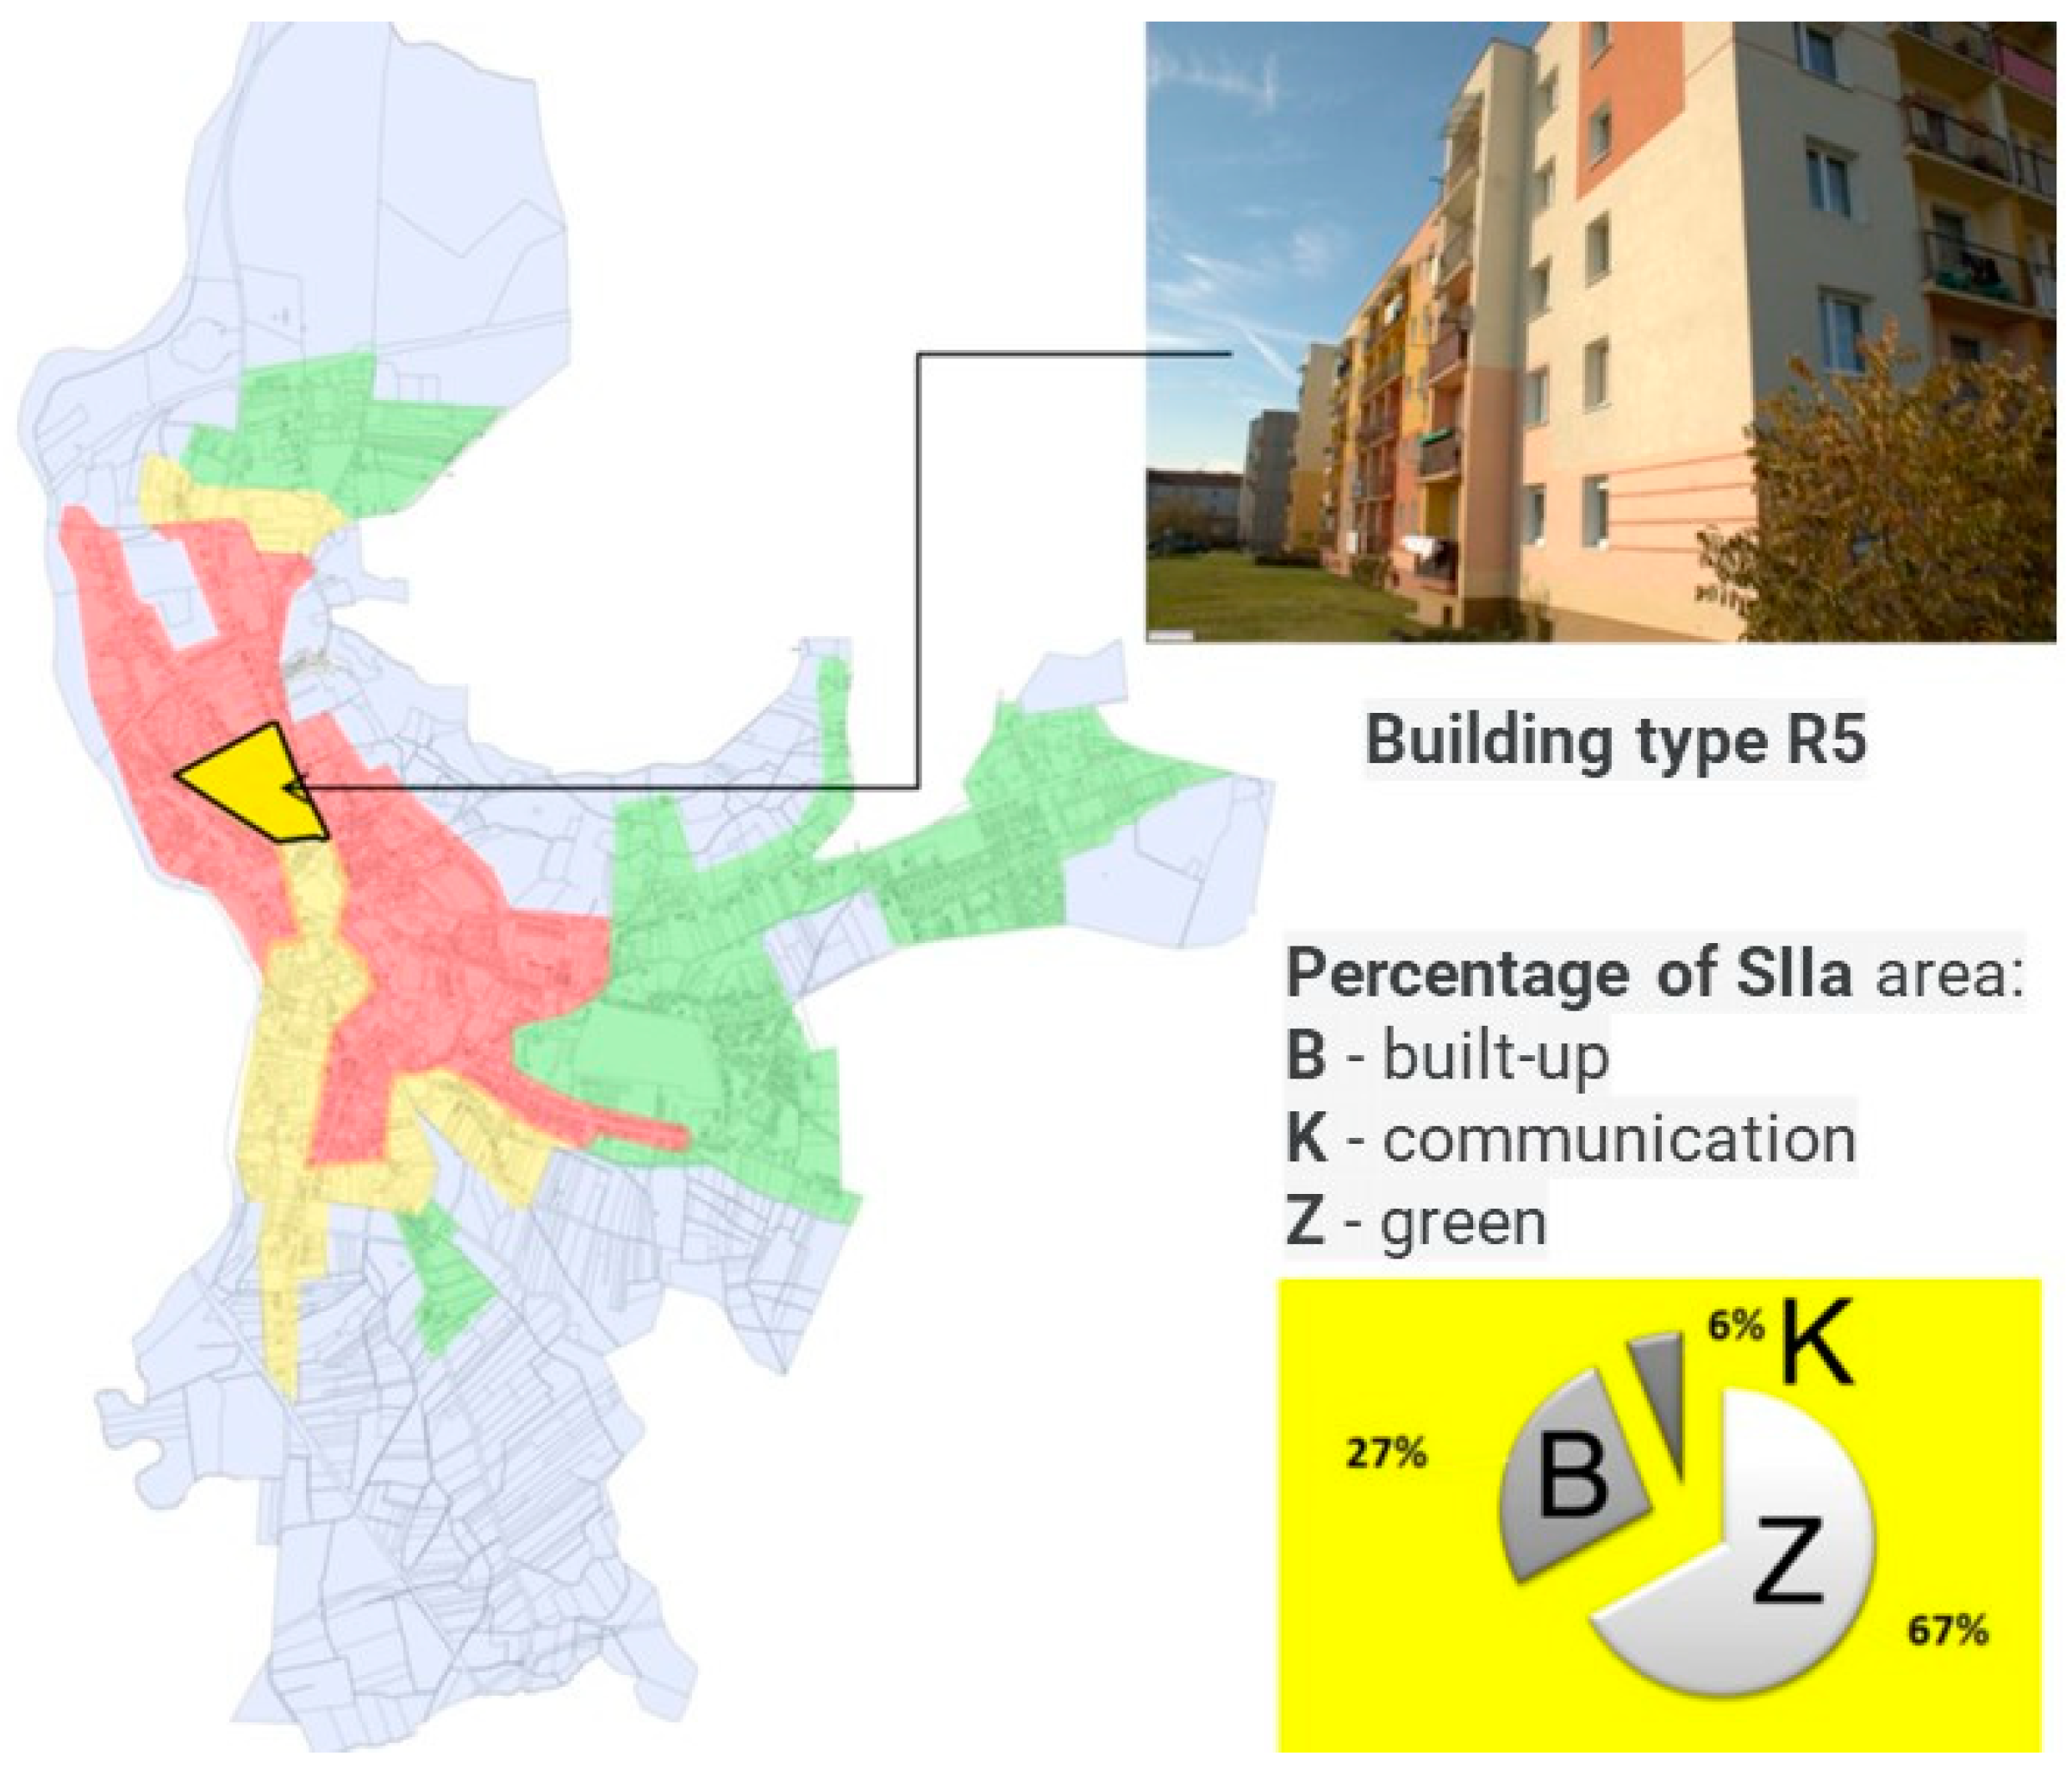
Next, for comparative purposes, the critical parameters of zone SII with monotypological development belonging to the R5 group with multi-family residential buildings in prefabricated large-panel technology were presented. The buildings are supplied with heating from a heating system, the efficiency of which depends on many factors [42]; the research focuses only on buildings. The selected SIIa zone is characterized by the block development from the 1970s and 1980s, common throughout Europe. The buildings with a cuboid shape in the typological classification R6 are classified as Category 3 (Figure 7).
Zone SIIa consists of multi-family residential buildings as shown in Figure 7 using large-panel technology. The quantitative division of the zone’s area parameters is as follows:
  • B—27% of the built-up area;
  • K—6% of the communication area;
  • Z—67% of the green area.
The acceptance of the zone boundaries for this research is related to the measurement of critical parameters of the buildings belonging to the zone and the balance of the area, taking into account the biologically active areas of the zone. Therefore, their boundaries must be precisely defined, preferably by the layout of streets and the ownership division of the area. Figure 8 shows the SIIa zone, which is one of three energy zones supplied with the system heat from a solid fuel boiler room. It is possible to determine the We1–11 parameters on a modular grid, for example, 200 × 200 m (see Figure 8), based on the highest density of the buildings that emit the most CO2 in the zone. This methodology is the subject of further research by the authors.
The emission efficiency indicators We10,11 for the presented SIIa zone, which are critical indicators of the development zone, are presented in Table 7.
The determination of the emission factor for the entire urban development zone results from the need to plan further actions towards improving the condition of the built environment. The assessment of biologically active areas is also important, as well as introducing a healthy urban microclimate and absorbing carbon dioxide produced in the zones.
The list of integrated environmental characteristics of the zone is the basis for multidirectional indicator analyses, in particular for the comparative analyses of the emission indicators of zones We10 and We11. For the selected zone SIIa, We11 = Wes is 8.6 kg/(m2·year). The cost of final energy consumption for the zone is 174,233.0 EUR/year, while the final energy consumption QK is 5,694,605.5 kWh/year and primary energy QP = 6,264,066.05 kWh/year with a transmission factor of 1.1. The indicators obtained in the assessment of the development using the ASEET method for zone SIIa are used for the comparative analysis in the next monitoring cycle, and at the same time, they are comparative indicators in relation to the other neighboring zones, combined into one sustainable urban system. It should be noted that the system heat is largely derived from coal; however, compared to the red zones of SII, the specific energy demand We6 is about 7 times lower in the SII zones.
Improving the quality of red zones of the urban development requires an exceptionally subtle approach due to the downtown character of often historic buildings. The red zones are characterized by high gross CO2 emission rates. Their reduction with bioactive We3 indicators may seem deceptive.

3.2.3. Characteristic Critical Indicators for Green Zones SIII a–c

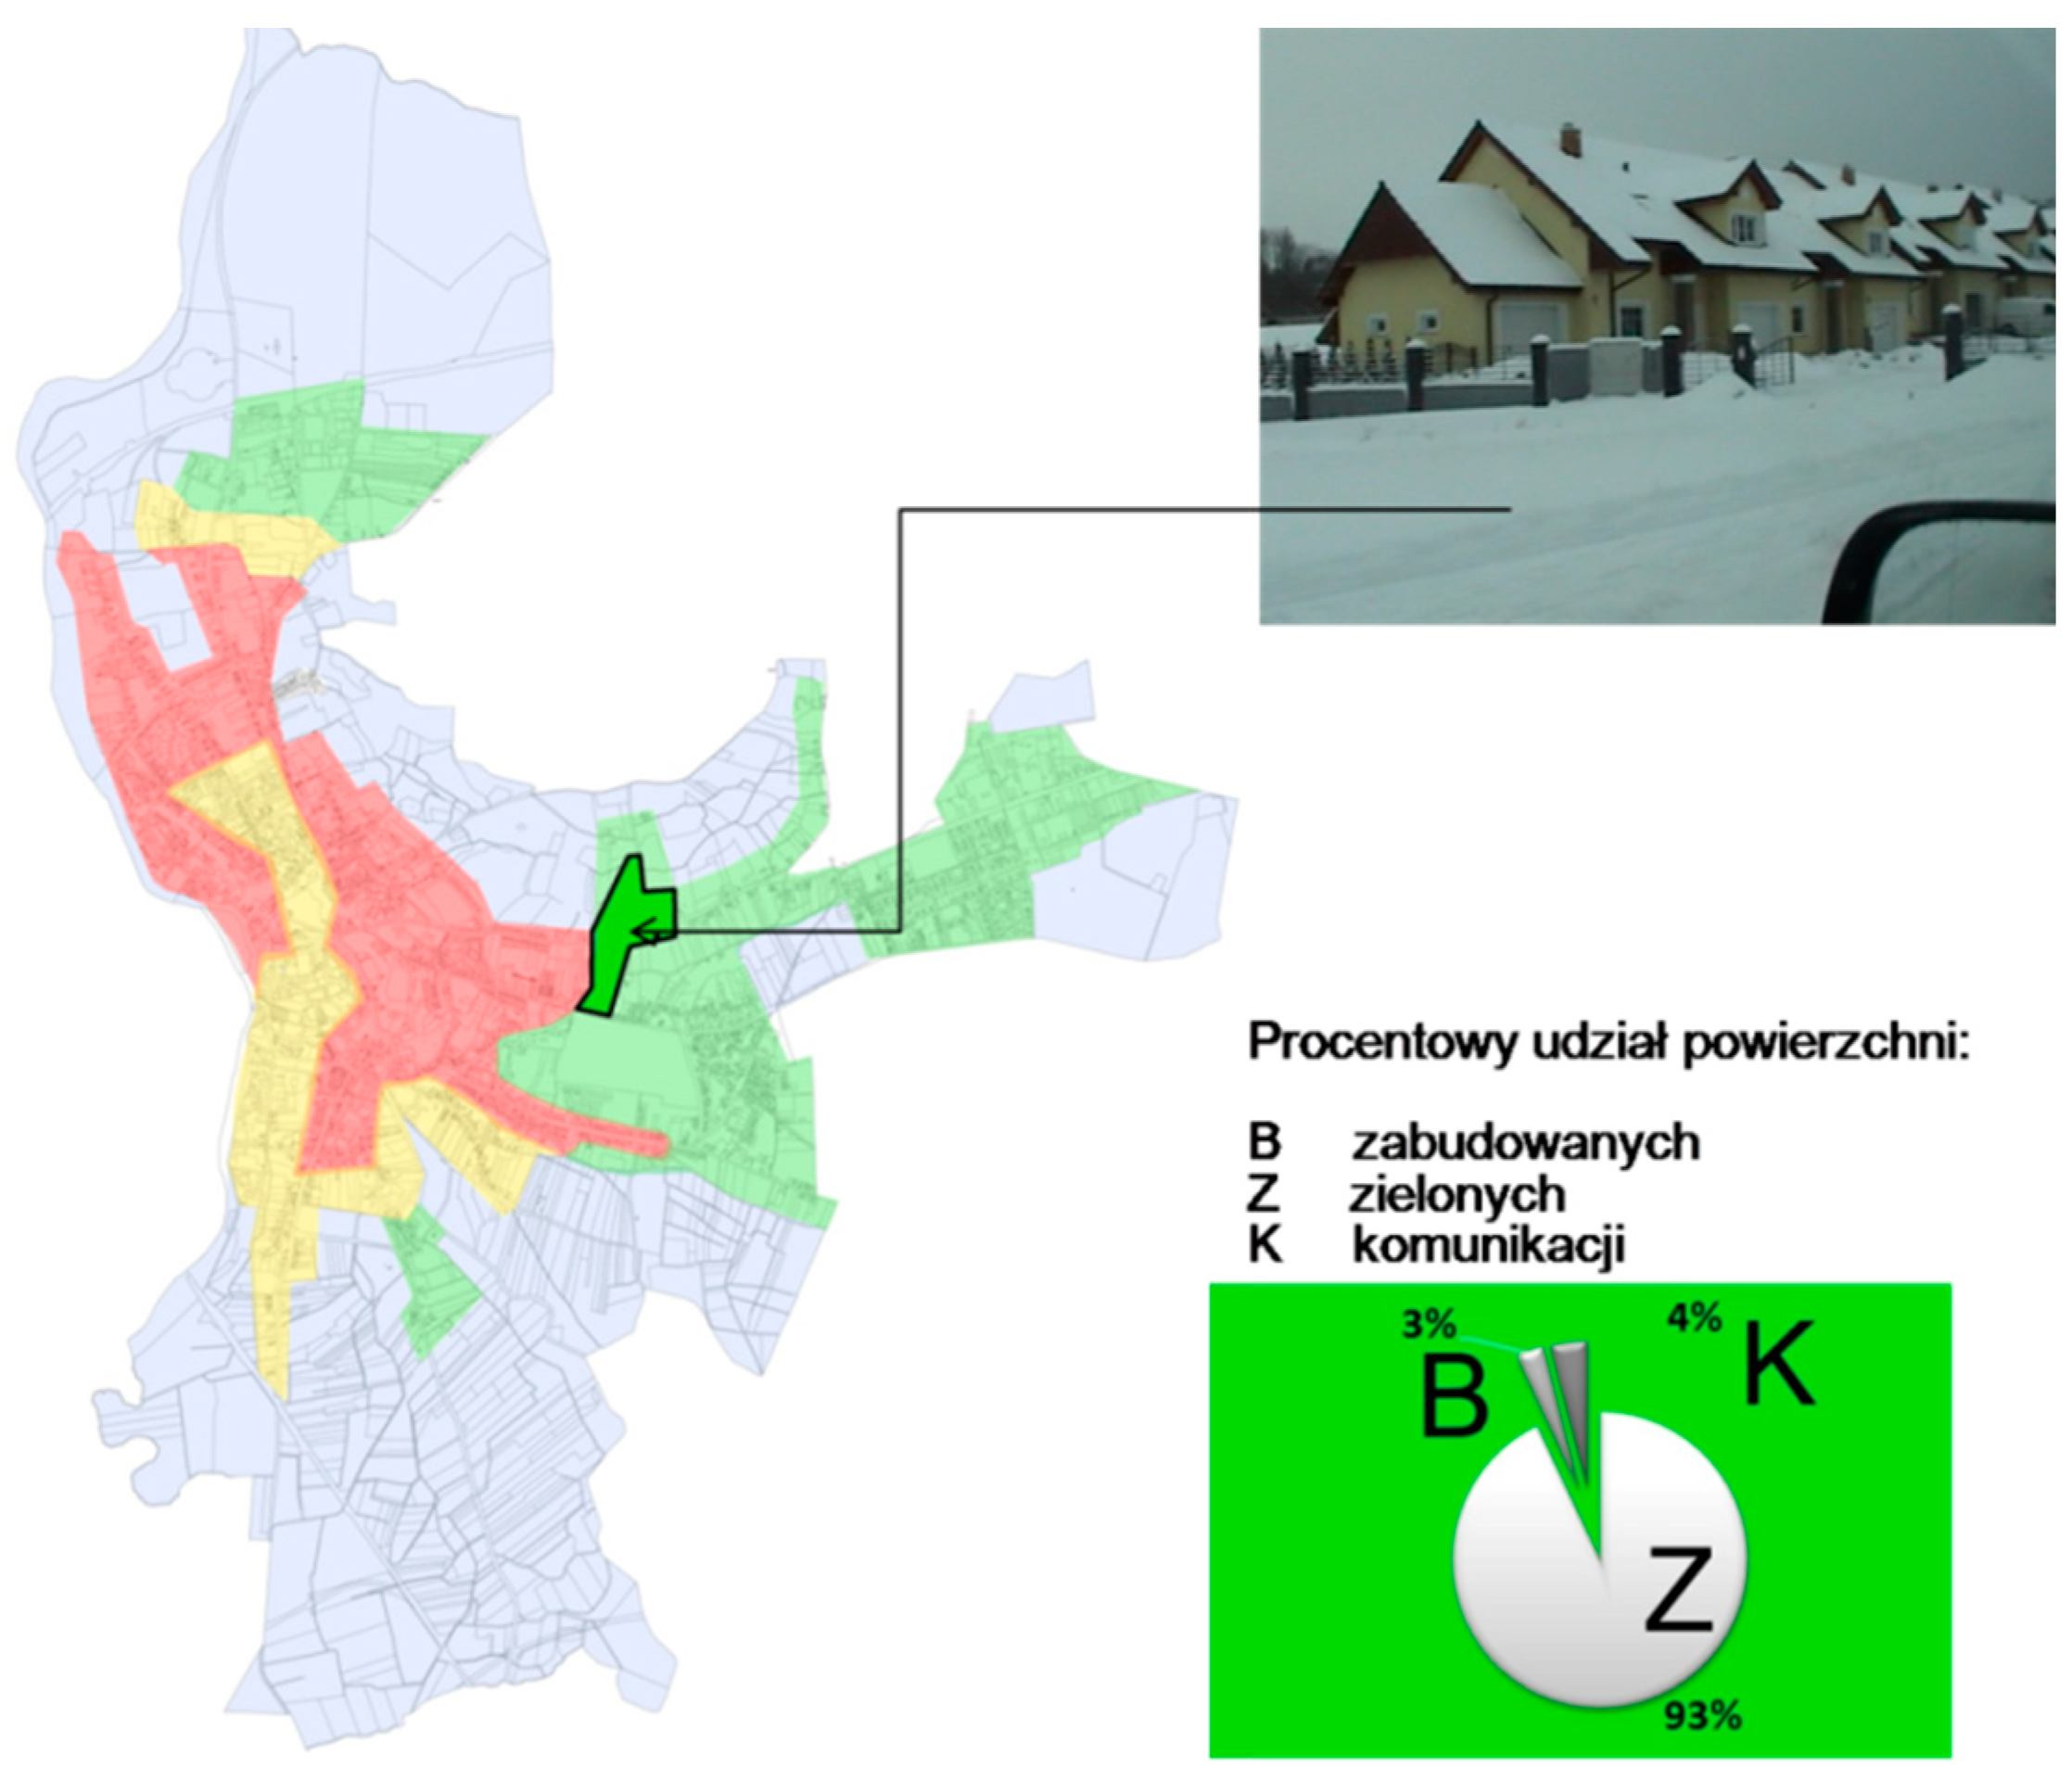
Below is zone SIIIa, where the buildings are powered by energy from natural gas combustion. This is currently the most common solution, not only for environmental protection reasons but also due to the operating costs. In the future, however, these sources should have to be associated with RESs, e.g., photovoltaics.
The buildings are classified into various types from R1 to R6 and categories K1 to K3; however, they are thermally modernized or new low-energy buildings (Figure 9).
Designation of active areas in the zone
The quantitative division of the area parameters for the zone is as follows (Figure 9):
  • B—12% of the built-up area;
  • K—7% of the communication area;
  • Z—81% of the green area.
Zone SIIIa consists of mainly single-family buildings from the various periods of construction from the 1980s to 2020, from traditional buildings through typical cubic forms with gable and flat roofs. The zone parameters are presented in Table 8.
It should be noticed that changing the heating system in the buildings can bring good environmental effects almost immediately. Using the example of zone SIIIa, the unit indicator of building emissions CO2 (We10) is comparable to the SIIc parameter and amounts to 61 kg CO2/m2/year. This proves the possible universal approach of municipalities to thermal modernization and decarbonization activities in urban areas.

4. Balance and Graphical Presentation of Efficiency Indicators (Indicator Mapping We) of Cities

The culmination of the conducted procedural activities of assessing the energy efficiency of the urban space is the energy balance of all development zones, including the total CO2 emissions for the city. Based on the model test conducted for the city of Gubin, the critical parameters of all spatial units in the city were calculated. The balance of critical parameters in connection with the active areas is presented in graphic form on the city plan (Figure 10).
The basic energy and ecological parameters were presented in graphic form as a parameterized map of the quality of the built environment in the city. The indicator map of the leading parameters is the result of the ASEET assessment of the urban development units and is used for the presentation and comparative analysis of the energy efficiency of the development. The obtained parameters were used to calculate the summary energy efficiency and emission indicators (TWe) necessary for the assessment and the balance indicators (Table 9) of the final energy, primary energy, and emissions characterizing the ecological model of the city of Gubin.
The parameterized active area indicators of the urban space TA(i) are indications for the recommendation of planning and design activities in the scope of the qualitative changes in the built environment, including the urban ecosystem. The indicators determine the balanced (from all ASEET urban units) share of active areas in the entire city of Gubin and amount to the following:
TAb—cumulative area indicator of development: 27%;
TAc—cumulative area indicator of traffic—communication: 14%;
TAg—cumulative area indicator of urban greenery: 59%.
In the authors’ opinion, it is necessary to conduct further research on green active surfaces in terms of CO2 assimilation from buildings and communication. In the case of Gubin, 59% of surfaces are biologically active, which have the potential to absorb approx. 43% of negative emissions from the built-up area, including communication. The ASEET indicator procedure allows for the analysis of the environmental potential contained in the cumulative indicators of active areas with resources, as the authors demonstrated with the example of the city of Gubin.

5. Summary

The city’s cumulative efficiency indicators, energy TWe7, emission TWe9, and active green areas TWe3, are the final parameters for recommending planning and investment activities as the fifth stage of the ASEET method for improving the quality of the urban environment. The city can monitor the indicators on an ongoing basis, conduct a modernization policy, and economically support the most problematic areas with the knowledge contained in the environmental indicators of both local We and total TWe, which are presented below.
The cumulative TWe efficiency indicators are represented by the cumulative final and primary energy and CO2 emissions for the entire city area, taking into account emission zones. A summary balance of the ecological indicators was made according to the division into zones, to which cumulative indicators were assigned:
Energy efficiency TWI–IIIe7 (see Equation (1)).
T W I I I I e 7 = i = 1 n W e 7 i
n—number of subzones in individual zones I–III.
Emission efficiency TWI–IIIe9 (see Equation (2)).
T W I I I I e 9 = i = 1 n W e 9 i
The distribution of cumulative indicators for the individual city zones is as follows:
  • Zone I: TWIe7 (QK) = 564,981.0 GJ, CO2 emissions TWIe9 (QEI)= 33,899.0 Mg/GJ;
  • Zone II: TWIIe7 (QK)= 202,784.0 GJ, CO2 emissions TWIIe9 (QEII)= 12,167.0 Mg/GJ;
  • Zone III: TWIIIe7 (QK) = 42,907.0 GJ, CO2 emissions TWIIIe9 (QEIII)= 2402.8 Mg/GJ.
Using the zone data (zones I–III) as the ASEET building units, characteristic efficiency indicators were calculated, defining the energy load and CO2 emissions for the entire city. For the entire city of Gubin, the cumulative energy efficiency and emission indicators TWCe are as follows:
Cumulative final energy consumption efficiency indicator of the city QKC = TWCe7 (see Equation (3)):
T W C e 7 = j = 1 m i = 1 n W e 7 i j
n—number of subzones in individual zones (i) I–III.
  • m—number of analyzed zones (j) in the city.
Cumulative primary energy consumption efficiency indicator of the city QPC (see Equation (4)):
Q P C = j = 1 m Q k C j
Cumulative emission efficiency indicator QEC = TWCe9 (see Equation (5)):
T W C e 9 = j = 1 m i = 1 n W e 9 i j
Cumulative final energy demand indicator QKC = 810,672.0 GJ;
Cumulative primary energy consumption indicator QPC = 932,296.0 GJ;
Cumulative emission factor QEC = 48,468.8 Mg CO2/year.
The cumulative ecological efficiency indicators TWCe are determined at the end of the sustainable assessment of Gubin’s urban development using the ASEET method. They can be compiled with the area or person indicators to obtain direct information on the unit final energy consumption EKC, primary EPC, or emissions per building area or resident. As mentioned in the introduction, by analyzing the local efficiency indicators Wei of individual development zones, we can influence the total indicators TWCi for the city. In the case of the analyzed city of Gubin, the total final energy consumption indicator EKC is 252.68 kWh/m2/year, which is 58% lower than the most energy-intensive zone I for which EKI = 399.6 kWh/m2/year, similarly to the emission indicators QEj between zones. Therefore, energy efficiency or emission indicators as resultant characteristics of urbanized areas can be treated as sensitive parameters in administrative activities. Therefore, after creating a data matrix, the city’s energy efficiency potential is easily monitored in real time (city timer), which can go hand in hand with education and raising public awareness. According to the 8th Environment Action Programme, it is necessary to “Ensure that environmental policies and actions at EU, national, regional and local level are based on the best available science and on strengthening the environmental knowledge base and its dissemination, including research, innovation, promoting environmental skills and further developing environmental and ecosystem accounting, and on supporting the continuous improvement of scientific knowledge on the basis of comparable indicators also at regional level in order to inform decision-making” [43].

6. Conclusions

In the city of Gubin, the urban environment was studied in terms of energy parameters and emissions using the ASEET method. The studies were conducted in the residential, administrative, educational, health care, municipal, cooperative, and private development units with various socio-economic, functional, and ownership characteristics, e.g., buildings: cooperative—GUBIN Cooperative; municipal—MZUK, managed by the commercial law companies PUM Ltd., LOCUM General Partnership, and private owners. The indicator method of the energy parameters of the development zones presents the characteristics of the conditions of the development environment, its technical conditions, and the environmental burden of CO2 emissions. In this way, it is possible to determine the limits of the investment risk and the effectiveness and durability of the actions taken. Through the indicator analysis, it is possible to constantly improve and introduce better procedures and techniques for managing own resources. The recommendations for actions should include a change to the Spatial Planning Act, which should take into account procedures resulting from the energy law. This is related to the need to monitor urban space, e.g., through energy efficiency indicators. The effectiveness of the actions is possible only and exclusively if the municipality’s own tasks are implemented through the continuous updating of local plans resulting from the monitoring of the eco-energy indicators as urban indicators that are an annex to local plans or a study of the conditions and directions of the spatial development of the municipality in connection with the Geographic Information System.
As mentioned in the Introduction, Section 2.1’s data processing methods, i.e., tabulation, compilation, and then presentation of indicators on city maps are a process dependent on the economic possibilities of city managers and the policy of informing residents about the state of the environment. The possibilities of digitizing data therefore depend on the implementation of IT systems in combination with GIS information. The article does not map indicators, it only indicates the path to such possibilities by having tabulated electronic matrices of zone data (using basic editing programs) for optimizing and managing the city’s environment.
The proposed ASEET assessment algorithm mechanism assumes the need to monitor the building resources in terms of the level of building renovation. According to the DSRB assumptions, approximately 15.0 million buildings in Poland should undergo thermal modernization. First, by 2027, all buildings with an EP index greater than 330 kWh/(m2·year) will be modernized, and by 2035, buildings with an EP index greater than 230 kWh/(m2·year), and in 2045, all buildings will have an EP index no greater than 150 kWh/(m2·year) [9]. The implementation of the scenario assumes, however, that by 2050, 65% of buildings will achieve an EP index of no more than 50 kWh/(m2·year), and 22% will increase from 50 to 90 kWh/(m2·year), while the remaining 13% of the buildings, which for technical or economic reasons cannot be modernized so deeply, will achieve an EP index in the range of 90–150 kWh/(m2·year) [10]. An additional problem is the fact that building owners are not obliged to assess the energy performance of the buildings if they do not sell the house or rent it. In view of the above, the owners of single-family buildings do not know what energy demand their building has. Hence, the proposed solution suggests using building typology.
Energy efficiency is included in the European Union strategy for 2030 [44] and earlier ones such as the Strategy for Smart and Sustainable Development [45] in order to move towards an efficient economy. Buildings are particularly responsible for the energy status of the urban environment. An indicator method for assessing the energy performance of the built-up space was proposed, which will allow for determining and selecting areas of the development with the best and worst energy and climate features.
Major renovations of existing buildings, regardless of their size, are an opportunity to take cost-effective measures to improve energy performance.
To ensure decent housing for all, it is necessary to define the areas at risk or neighborhoods associated with energy poverty in a way that allows for more accurate detection of less developed micro-urban areas within more developed areas. This would help identify and localize the most vulnerable social sectors and those suffering from energy poverty [46] and the households that are exposed to high energy costs and do not have the means to renovate their buildings, thus helping to combat the social inequalities that can be created by different climate action measures [47]. Furthermore, inefficient housing is a systemic cause of energy poverty, with 50 million people in the Union living in energy poverty, unable to adequately light, heat, or cool their homes, and more than 20% of the poor households in the Union live in moldy, damp, or rotting buildings [48].
The popularization of the ASEET method can support local governments in their social participation and involvement and increase activities that improve the energy efficiency of buildings and urban areas.
A method was proposed that complies with the requirements of the energy law, the Energy Efficiency Act of 2011, which is a response to the EPBD Directive 2002/91/EC as amended in 2010 as the so-called Recast of the EPBD Directive (2010/31/EU).
Analyzing the data on heat sources in the matrix for the red zone (SI), a very large diversity can be noticed (see Appendix A). Therefore, in further research, the authors plan to take into account more specific ecological aspects (using LCA) of thermal modernization, in particular, the replacement of the heat source [49].

Author Contributions

Conceptualization, P.S.; methodology, P.S., R.D. and J.A.; software, P.S.; validation, P.S., J.A. and R.D.; formal analysis, P.S.; investigation, P.S., J.A. and R.D.; resources, P.S.; data curation, P.S.; writing—original draft preparation, P.S., J.A. and R.D.; writing—review and editing, P.S., R.D. and J.A.; visualization, P.S.; supervision, P.S.; project administration, P.S. All authors have read and agreed to the published version of the manuscript.

Funding

This research received no external funding.

Data Availability Statement

The original data presented in the study are openly available in Appendix A.

Conflicts of Interest

The authors declare no conflicts of interest.

Abbreviations

ASEETa multi-criteria method of collecting critical data in built-up urban zones and illustrating the results in the form of environmental indicators for assessment and planning in subsequent measurement cycles
Aftotal area of external walls [m2]
Cgcost of gas consumption [PLN/month]
Cccost of coal consumption [PLN/year]
Celcost of electricity [PLN/month]
Eparea seasonal heat demand indicator [kWh/m2year]
Evcubature seasonal heat demand indicator [kWh/(m3/year)]
QKannual final energy demand [kWh/year]
QHthermal energy consumption [GJ/year]
Dcdemand for coal [tonne/year]
TAbcumulative building area indicator [%]
TAccumulative area traffic indicator—communication [%]
TAgcumulative urban greenery area indicator [%]
TWe7summary cumulative energy efficiency indicator [GJ]
TWe9summary cumulative emission efficiency indicator [Mg/GJ]
TWe3summary cumulative efficiency indicator of active green areas [m2]
We1area of the zone: Pz [m2]
We2building area in the zone: Abz [m2]
We3biologically active area: Aga [m2]
We4density of population: Dp [person/m2]
We5heated area in the zone: Ahz [m2]
We6average final energy indicator of the heated area in the zone EKzj [GJ/m2/year] or [kWh/m2/year] where j—type of zone
We7final energy consumption in the zone: QKZ [GJ/year], [kWh/year]
We8final energy cost CKZ in the zone: CKZ = We7 × nj * [EUR] where * cost of district heating in Poland—GLOBENERGIA 150,95 PLN/GJ (34.62 EUR) from 2022
We9CO2 emission of zone QEj [kg CO2/year]
We10EEjb unit CO2 emission indicator of the development in the zone [kg CO2/m2/year]
We11EEjz unit CO2 emission indicator of the zone [kg CO2/m2/year], where j—type of zone
We12non-renewable primary energy consumption factor of the zone EPj [kWh/m2/year]

Appendix A

Table A1. Matrix of survey and inventory data for ZONE SI.
AddressConstruction YearHeat SourceConstruction TechnologyYear of Thermal ModernizationAdministratorBuilding/Development TypeNumber of StaircasesNumber of Floors above/UndergroundPlot Area [m2]Building Area [m2]Heated Usable Area [m2]
Urban zone 1
4 UZP Street. Kresowa 48 (szkoła podst. Nr 3)1964(84)solid fuel boiler roomtraditionalnoMiejskie Zakład Usług KomunalnychUZP/detached building42n 1370.002676.00
6 UZP Ul. Piastowska 20 (przedszkole nr 1)1920solid fuel boiler roomtraditionalnoMiejskie Zakład Usług KomunalnychUZP/detached building33n 299.00807.00
3 UZP Ul. Gdańska 17 (przychodnie)1975-80coal/local boiler roomtraditionalnoMiejskie Zakład Usług KomunalnychUZP/detached building32n/1p2500.001260.933444.00
2 MWK Ul. Gdańska 15<1945mixed: gas-coaltraditional: ceramic brick, trussnoMiejskie Zakład Usług KomunalnychM—tenement/detached building13n/1p290.00290.00603.20
1 MWK Ul. Batalionów Chłopskich 6/8<1945coal furnacestraditional: ceramic brick, trussnoMiejskie Zakład Usług KomunalnychM—tenement/semi-detached buildings12n/1p132.06132.06221.40
5 MWK Ul. Sląska 33<1945mixed: gas-coaltraditional: ceramic brick, trussnoMiejskie Zakład Usług KomunalnychM—tenement/compact construction12n/1p221.40221.40336.20
7 MWK Ul. Kosynierów 18<1945mixed: gas-coaltraditionalnowłaśc. PrywatnyM—tenement/detached building13n/1p330.00110.00255.00
8 W Goniębice 25 (sklep)1966coaltraditionalnoSpółdzielnia SCHU—store detached building11n1230.0075.6975.69
9 W Lipno ul. Powst. Wielkop. 1 (sklep)1962coalmixed: brick walls, flat roofs with corrugated slabsnoSpółdzielnia SCHU—store detached building11n1381.00303.26303.26
10 W Lipno ul. Spółdzielcza 4 (usługi)1970coalmixed: brick walls, densely ribbed ceilingsnoSpółdzielnia SCHU/MN—store, office, apartment12n11089.00380.40742.40
11 W Lipno ul. Spółdzielcza 4 (warsztat)1970coalmixed: brick walls, flat roofs with corrugated slabsnoSpółdzielnia SCHU—workshop21n11089.00174.00174.00
12 W Lipno ul. Spółdzielcza 4 (hala magazyn1972coalmixed: brick walls, flat roofs—steel trussesnoSpółdzielnia SCHU—storage hall41n11089.00873.08873.08
13 W Lipno ul. Spółdzielcza 4 (magazyn paszowy coalmixed: brick walls, flat roofs with corrugated slabsnoSpółdzielnia SCHU—feed warehouse21n11089.00300.00300.00
Cubature [m3]Heated Cubature [m3]Total Area of All External Partitions Including Floor and Ceiling Af [m2]A/V IndicatorWindow Area [m2]Number of Premises [pcs.]Number of Inhabitants [pcs.]Energy End-Use Indicator Ek = QK/Af [kWh/m2 year]Annual End-Use Energy Demand QK = QK,H + QK,W + + QK,L [kWh/year]
10,660.0010,660.005543.200.52 26.00325.000.000.00
3680.003680.001435.200.39 10.00113.000.000.00
12,416.0011,050.244345.600.39517.7839.00200.000.000.00
3837.003414.931402.500.4198.309.0034.000.000.00
1266.001126.74574.920.5129.074.006.000.000.00
1368.001217.52735.920.6028.635.0012.000.000.00
1100.00979.00620.000.6335.303.007.000.000.00
302.76269.46291.941.08 1.0010.000.000.00
1213.041079.61888.280.82 1.0010.000.000.00
2662.802369.891402.800.59 5.0021.000.000.00
696.00619.44567.200.92 1.0011.000.000.00
5238.484662.252490.160.53 1.0010.000.000.00
1050.00934.50880.000.94 1.00brak0.000.00
Table A2. Matrix of survey and inventory data for ZONE SII.
AddressConstruction YearHeat SourceConstruction TechnologyYear of Thermal ModernizationAdministratorBuilding/Development TypeNumber of StaircasesNumber of Floors above/UndergroundPlot Area [m2]Building Area [m2]Heated Usable Area [m2]
Urban zone 2
14 UZP Ul. Wojska Polskiego 16 (przedszkole nr 3)1982ECskeleton, woodennoMiejskie Zakład Usług KomunalnychUZP/detached building31n 956.00900.00
15 UZP Ul. Świerczewskiego 1 (szkoła podst. Nr 2)1900(1970)ECtraditionalnoMiejskie Zakład Usług KomunalnychUZP/detached building43n/1p 2128.004808.18
16 MWB Pl. Katedralny 61970-80ECSystem Żerań2009/2010Przedsiębiorstwo Usług Miejskichresidential/multi-family25n/1p269.00269.00987.80
17 MWB Ul. Bolesława Chrobrego 121962ECSystem ŻerańnoPrzedsiębiorstwo Usług Miejskichresidential/multi-family25n/1p253.00253.00763.00
18 MWB Ul. Roosevelta 11A1970ECSystem Żerań2009Przedsiębiorstwo Usług Miejskichresidential/multi-family25n/1p630.00630.002380.00
19 MWB Ul. Westerplatte 101974ECSystem Żerań2006Spółdzielnia Mieszkaniowa “GUBIN”residential/usługowy45n/1p512.80510.701907.00
20 MWB OŚ. Emilii Plater 91987ECSystem W-702008Spółdzielnia Mieszkaniowa “GUBIN”residential/multi-family45n/1p2462.00847.003328.00
21 MWB Ul. Kosynierów 391994ECexternal walls—lattice brick, full ceilings ŻerańnoSpółdzielnia Mieszkaniowa “GUBIN”residential/multi-family15n/1p1077.00377.001265.00
22 MWB Ul. Kosynierów 491995ECexternal walls—lattice brick, full ceilings ŻerańnoSpółdzielnia Mieszkaniowa “GUBIN”residential/multi-family45n/1p2597.00643.002422.00
23 MWB Ul. Wojska Polskiego 101983ECSystem W-702006Spółdzielnia Mieszkaniowa “GUBIN”residential/multi-family15n/1p1052.00306.901071.00
24 MWB OŚ. Emilii Plater 111988ECSystem W-70noSpółdzielnia Mieszkaniowa “GUBIN”residential/multi-family 5n/1p1518.00620.001530.00
25 MWB Ul. Konopnickiej 11971ECSystem Żerań2004Spółdzielnia Mieszkaniowa “GUBIN”residential/multi-family25n/1p1225.00351.301338.00
26 MWB OŚ. Emilii Plater 41984ECSystem W-70noSpółdzielnia Mieszkaniowa “GUBIN”residential/multi-family25n/1p1917.00350.201151.50
Cubature [m3]Heated Cubature [m3]Total Area of All External Partitions Including Floor and Ceiling Af [m2]A/V IndicatorWindow Area [m2]Number of Premises [pcs.]Number of Inhabitants [pcs.]Energy End-Use Indicator Ek = QK/Af [kWh/m2rok]Annual End-Use Energy Demand QK = QK,H + QK,W + + QK,L [kWh/rok]
3368.003368.002728.080.81 10.00146.000.000.00
17,556.5117,556.517900.430.45 66.00900.000.000.00
24791807.190.729210.226.00360.00119723.47
29942994 18.00340.00
672058802963.520.504393.2 + 19.860940.000.00
8529.004849.002822.120.582410.2240.0080.000.000.00
14,427.008653.004750.500.549603.6060.00128.000.000.00
6220.005278.001169.000.221255.2420.0042.000.000.00
10,287.009001.003230.500.359 39.0088.000.000.00
4350.002862.001662.820.581222.6020.0040.000.000.00
7915.007915.00 30.0067.000.000.00
5964.005964.00 30.0070.000.000.00
4960.004960.001929.000.39 20.0043.000.000.00
Table A3. Matrix of survey and inventory data for ZONE SIII.
AddressConstruction YearHeat SourceConstruction TechnologyYear of Thermal ModernizationAdministratorBuilding/Development TypeNumber of StaircasesNumber of Floors above/UndergroundPlot Area [m2]Building Area [m2]Heated Usable Area [m2]
Urban zone 3
27 M/U Ul. Kujawska 2/Cmentarz<1975gasmixednoMiejskie Zakład Usług Komunalnychresidential/services/detached building22n/1p332610298,4
28 MN ul. Gdańska 18a2000gastraditionalnoWłaściciel Prywatnysingle-family/detached building11n/1p806110245
29 UHot Ul. Kresowa 1221998gastraditionalnoWłaściciel PrywatnyHotel/detached building12n/0p2500490806
30 MWK Ul. Rydla 21975gastraditionalnoPrzedsiębiorstwo Usług MiejskichM—tenement/detached building14n/1p1329168672
31 MN ul. Gdyńska 112009gastraditionalnoWłaściciel Prywatnysingle-family terraced house12n/0p450132.5197.4
32 MN ul. Gdyńska 122009gastraditionalnoWłaściciel Prywatnysingle-family terraced house12n/0p350102.5197.4
33 UZP Ul. Racławicka 2 (szkoła podst. Nr 1)1910 (1980,1900)gastraditionalnoMiejskie Zakład Usług KomunalnychUZP/detached buildingno data4n/1p 2059.314284.8
34 UZP Ul. Piastowska 26 (liceum)1910gastraditionalnoMiejskie Zakład Usług KomunalnychUZP/detached buildingno data3n/1p 15403387.28
35 UA Ul. Piastowska 24 (Urząd miejski)<1920gastraditional—brick2009Gmina GubinUA/detached building43n/1p 1144.32483.7
Ul. Jagiełły 48 LESZNO1998gasmixednoPrywatnysingle-family terraced house13n/1p500160270
Cubature [m3]Heated Cubature [m3]Total Area of All External Partitions Including Floor and Ceiling Af [m2]A/V IndicatorWindow Area [m2]Number of Premises [pcs.]Number of Inhabitants [pcs.]Energy End-Use Indicator Ek = QK/Af [kWh/m2year]Annual End-Use Energy Demand QK = QK,H + QK,W + + QK,L [kWh/year]
541.2481.668423.950.78335181121.27351000
550489.52520.51481103215.44500
24352167.1513920.642318252308.6194200
13291182.819680.818390105 101700
695618.55363.120.5870503614.51400
680605.2363.120.614.51400
15,877,115,877.17779.780.49 6284000
13,690,2713,690.2757,499.910.42 5050000
7812,117812.114609.14490.59 688900
756675398.250.59 21000

References

  1. Communication from the Commission to the European Parliament, the Council, the European Economic and Social Committee and the Committee of the Regions. A Renovation Wave for Europe—Greening Our Buildings, Creating Jobs, Improving Lives, COM(2020) 662 Final; Document 52020DC0662; European Commission: Brussels, Belgium, 2020; Available online: https://eur-lex.europa.eu/legal-content/EN/TXT/?uri=CELEX%3A52020DC0662 (accessed on 25 April 2024).
  2. Raimundo, A.M.; Sousa, A.M.; Oliveira, A.V.M. Assessment of Energy, Environmental and Economic Costs of Buildings’ Thermal Insulation–Influence of Type of Use and Climate. Buildings 2023, 13, 279. [Google Scholar] [CrossRef]
  3. Pathak, M.; Slade, R.; Shukla, P.R.; Skea, J.; Pichs-Madruga, R.; Urge-Vorsatz, D. Technical Summary. In Climate Change 2022: Mitigation of Climate Change. Contribution of Working Group Ill to the Sixth Assessment Report of the Intergovernmental Panel on Climate Change; Shukla, P.R., Skea, L., Slade, R., Al Khourtdajie, A., van Diemen, R., McCollum, D., Pathak, M., Some, S., Vyas, P., Fradera, R., et al., Eds.; Cambridge University Press: Cambridge, UK; New York, NY, USA, 2022. [Google Scholar] [CrossRef]
  4. Commission Staff Working Document, Impact Assessment, Accompanying the Document, Communication from the Commission to the European Parliament, the Council, the European Economic and Social Committee and the Committee of the Regions. Stepping Up Europe’s 2030 Climate Ambition Investing in a Climate-Neutral Future for the Benefit of Our People, SWD (2020) 176 Final; Document 52020SC0176; European Commission: Brussels, Belgium, 2020; Available online: https://eur-lex.europa.eu/legal-content/EN/TXT/?uri=CELEX%3A52020SC0176 (accessed on 25 April 2024).
  5. Sokołowski, J.; Kiełczewska, A.; Lewandowski, P. Defining and Measuring Energy Poverty in Poland, IBS RESEARCH REPORT 01. 2019. Available online: https://ibs.org.pl/app/uploads/2019/01/IBS_Research_Report_01_2019.pdf (accessed on 23 March 2024).
  6. Piwowar, A. Energy Poverty as a Current Problem in the Light of Economic and Social Challenges. Energies 2022, 15, 8554. [Google Scholar] [CrossRef]
  7. Omle, I.; Askar, A.H.; Kovács, E.; Bolló, B. Comparison of the Performance of New and Traditional Numerical Methods for Long-Term Simulations of Heat Transfer in Walls with Thermal Bridges. Energies 2023, 16, 4604. [Google Scholar] [CrossRef]
  8. Długoterminowa Strategia Renowacji Budynków (DSRB), Wspieranie Renowacji Krajowego Zasobu Budowlanego, Załącznik do Uchwały nr 23/2022 Rady Ministrów z Dnia 9 Lutego 2022 r. Available online: https://www.gov.pl/web/rozwoj-technologia/Dlugoterminowa-strategia-renowacji-budynkow (accessed on 23 March 2024). (In Polish)
  9. Commission Recommendation (EU) 2019/786 of 8 May 2019 on Building Renovation (Notified under Document C, 2019, 3352, (Text with EEA Relevance) OJ L 127 16.05.2019. p. 34, ELI. Available online: http://data.europa.eu/eli/reco/2019/786/oj (accessed on 23 March 2024).
  10. Executive Summary of Poland’s National Energy and Climate Plan for the Years 2021–2030 (NECP PL) along with Attachments Has Been Developed in Fulfilment of the Obligation Set Out in Regulation (EU) 2018/1999 of the European Parliament and of the Council of 11 December 2018 on the Governance of the Energy Union and Climate Action; European Commission C: Brussels, Belgium, 2019. 4421. Available online: https://energy.ec.europa.eu/system/files/2020-01/pl_final_necp_summary_en_0.pdf (accessed on 23 March 2024).
  11. Skiba, M.; Mrówczyńska, M.; Sztubecka, M.; Maciejko, A.; Rzeszowska, N. The European Union’s Energy Policy Efforts Regarding Emission Reduction in Cities—A Method Proposal. Energies 2023, 16, 6123. [Google Scholar] [CrossRef]
  12. Revision of the eu Emission Trading System (ETS)—Q2 2021, Fit for 55 Package under the European Green Deal, European Parliament, Legislative 20 April 2024. Available online: https://www.europarl.europa.eu/legislative-train/package-fit-for-55/file-revision-of-the-eu-emission-trading-system-(ets) (accessed on 25 April 2024).
  13. Communication from the Commission to the European Parliament, the Council, the European Economic and Social Committee and the Committee of the Regions. ‘Fit for 55’: Delivering the EU’s 2030, Climate Target on the Way to Climate Neutrality, COM(2021) 550 Final; Document 52021DC0550; European Commission: Brussels, Belgium, 2021.
  14. Communication from the Commission to the European Parliament, the Council, the European Economic and Social Committee and the Committee of the Regions. The European Green Deal, COM/2019/640 Final; Document 52019DC0640; European Commission: Brussels, Belgium, 2019.
  15. Proposal for a Regulation of the European Parliament and of the Council, Establishing a Social Climate Fund, COM(2021) 568 Final; European Commission: Brussels, Belgium, 2021.
  16. Pilszyk, M.; Lipiński, K.; Miniszewski, M. Challenges of the Fit for 55 Package. EU Expert Feedback on the Targets of the Energy Transition; Polish Economic Institute: Warsaw, Poland, 2024; p. 40. [Google Scholar]
  17. Directive 2012/27/EU of the European Parliament and of the Council of 25 October 2012 on energy efficiency, amending Directives 2009/125/EC and 2010/30/EU and repealing Directives 2004/8/EC and 2006/32/EC Text with EEA relevance. Off. J. Eur. Union 2012, L 315, 1–56.
  18. Kazak, J.; Mrówczyńska, M.; Skiba, M.; Bazan-Krzywoszańska, A.; Swiader, M.; Tokarczyk-Dorociak, K.; Szewrański, S. A Decision Support System for the Planning of Hybrid Renewable Energy Technologies. IOP Conf. Ser. Earth Environ. Sci. 2021, 701, 012012. [Google Scholar] [CrossRef]
  19. Castellazzi, L. Analysis of Member States’ Rules for Allocating Heating, Cooling and Hot Water Costs in Multi-Apartment/Purpose Buildings Supplied from Collective Systems, EUR 28630 EN; Publications Office of the European Union: Luxembourg, 2017. [Google Scholar] [CrossRef]
  20. Canale, L.; Dell’Isola, M.; Ficco, G.; Cholewa, T.; Siggelsten, S.; Balen, I. A comprehensive review on heat accounting and cost allocation in residential buildings in EU. Energy Build. 2019, 202, 109398. [Google Scholar] [CrossRef]
  21. Directive (EU) 2024/1275 of the European Parliament and of the Council of 24 April 2024 on the energy performance of buildings (recast) (Text with EEA relevance), Document 32024L1275. Available online: https://eur-lex.europa.eu/legal-content/EN/TXT/HTML/?uri=OJ:L_202401275 (accessed on 25 April 2024).
  22. Maisonneuve, C. Decarbonizing European Cities: How to Speed Up and Build Synergies?”. Notes de l’Ifri, Ifri. 2023, p. 24. Available online: https://www.connaissancedesenergies.org/sites/connaissancedesenergies.org/files/pdf-actualites/ifri_maisonneuve_european_cities_nov2023.pdf (accessed on 25 August 2024).
  23. Mazur, Ł.; Olenchuk, A. Life Cycle Assessment and Building Information Modeling Integrated Approach: Carbon Footprint of Masonry and Timber-Frame Constructions in Single-Family Houses. Sustainability 2023, 15, 15486. [Google Scholar] [CrossRef]
  24. Sobierajewicz, P. Kształtowanie Zabudowy Miejskiej; Uniwersytet Zielonogórski: Zielona Góra, Poland, 2013; p. 272. (In Polish) [Google Scholar]
  25. Communication from the Commission. Smart Cities and Communities—European Innovation Partnership), C(2012) 4701 Final; European Commission: Brussels, Belgium, 2012; Available online: https://digital-strategy.ec.europa.eu/en/library/smart-cities-and-communities-european-innovation-partnership-communication-commission-c2012-4701 (accessed on 1 April 2023).
  26. Sovacool, B.K.; Martiskainen, M.; Hook, A.; Baker, L. Decarbonization and its discontents: A critical energy justice perspective on four low-carbon transitions. Clim. Chang. 2019, 155, 581–619. [Google Scholar] [CrossRef]
  27. European Commission, J.R.C. Zero Pollution Outlook 2022, EUR 31248 EN; Publications Office of the European Union: Luxembourg, 2022; p. 93. [Google Scholar] [CrossRef]
  28. Mrówczyńska, M.; Skiba, M.; Leśniak, A.; Grech, R.; Kazak, J.K. A new fuzzy model of multi-criteria decision support based on Bayesian networks for the urban areas’ decarbonization planning. Energy Convers. Manag. 2022, 268, 116035. [Google Scholar] [CrossRef]
  29. Cant, K.; Evins, R. Improved calibration of building models using approximate Bayesian calibration and neural networks. J. Build. Perform. Simul. 2022, 16, 291–307. [Google Scholar] [CrossRef]
  30. Dzikuć, M. Technika oceny cyklu życia jako narzędzie wsparcia do określenia wpływu wytwarzania energii cieplnej na środowisko. Przemysł Chem. 2018, 1, 106–108. [Google Scholar] [CrossRef]
  31. Sovacool, B.K.; Baum, C.M.; Low, S. Reviewing the sociotechnical dynamics of carbon removal. Joule 2023, 7, 57–82. [Google Scholar] [CrossRef]
  32. Srinivas, H. Key Issues in Urban Energy Management Urban Energy; Global Development Research Center—GDRC. Available online: www.gdrc.org/uem/energy/key-issues.html (accessed on 1 April 2023).
  33. Baum, C.M.; Gross, C. Sustainability policy as if people mattered: Developing a framework for environmentally significant behavioral change. J. Bioecon. 2017, 19, 53–97. [Google Scholar] [CrossRef]
  34. Goodman, J.; Marshall, J. Problems of methodology and method in climate and energy research: Socialising climate change? Energy Res. Soc. Sci. 2018, 45, 1–11. [Google Scholar] [CrossRef]
  35. Sovacool, B. Who are the victims of low-carbon transitions? Towards a political ecology of climate change mitigation. Energy Res. Soc. Sci. 2021, 73, 101916. [Google Scholar] [CrossRef]
  36. Salman, M.G. Design standards for environmentally friendly and energy-efficient buildings. In BIO Web of Conferences; Forestry Forum 2023; EDP Sciences: Paris, France, 2024; Volume 93, p. 05011. [Google Scholar] [CrossRef]
  37. Gil-Mena, A.; Nasimba, V.; Bouakkaz, A.; Salim, H. Analysis and Optimisation of Collective Self-Consumption in Residential Buildings in Spain. Energy Build. 2023, 283, 112812. [Google Scholar] [CrossRef]
  38. Qiao, Q.; Yunusa-Kaltungo, A. A hybrid agent-based machine learning method for human-centred energy consumption prediction. Energy Build. 2023, 283, 112797. [Google Scholar] [CrossRef]
  39. Sezer, N.; Yoonus, H.; Zhan, D.; Wang, L.; Hassan, I.; Rahman, M. Urban microclimate and building energy models: A review of the latest progress in coupling strategies. Renew. Sustain. Energy Rev. 2023, 184, 113577. [Google Scholar] [CrossRef]
  40. Lu, X.; Wang, H.; Chen, H.; Gao, S. Assessing the Impact of Natural Conditions/Socioeconomic Indicators on the Urban Thermal Environment Based on Geographic Big Data. Atmosphere 2022, 13, 1942. [Google Scholar] [CrossRef]
  41. Uribe, S.V.; Villaseñor, N.R. Inequities in urban tree care based on socioeconomic status. Urban For. Urban Green. 2024, 96, 128363. [Google Scholar] [CrossRef]
  42. Skiba, M.; Mrówczyńska, M.; Sztubecka, M.; Bazan-Krzywoszańska, A.; Kazak, J.; Leśniak, A.; Janowiec, F. Probability estimation of the city’s energy efficiency improvement as a result of using the phase change materials in heating networks. Energy 2021, 228, 120549. [Google Scholar] [CrossRef]
  43. Decision (EU) 2022/591 of the European Parliament and of the Council of 6 April 2022 on a General Union Environment Action Programme to 2030. Off. J. Eur. Union 2022, L 114, 22–36.
  44. Towards a Sustainable Europe by 2030; Reflection Paper, COM (2019) 22. European Commission: Brussels, Belgium, 2019. Available online: https://commission.europa.eu/publications/sustainable-europe-2030_en (accessed on 1 April 2023).
  45. EUROPE 2020, A Strategy for Smart, Sustainable and Inclusive Growth; COM (2010) 2020 Final; European Commission: Brussels, Belgium, 2010.
  46. Fabbri, K.; Gaspari, J. Mapping the energy poverty: A case study based on the energy performance certificates in the city of Bologna. Energy Build. 2021, 234, 110718. [Google Scholar] [CrossRef]
  47. James, C.; Aravena, C.; Marco, B.; Eleanor, D. Show Me the Energy Costs”: Short and Long-term Energy Cost Disclosure Effects on Willingness-to-pay for Residential Energy Efficiency. Energy J. 2022, 43, 133–152. [Google Scholar] [CrossRef]
  48. European Parliament: Energy Performance of Buildings (Recast): P9TA(2023)0068: Amendments Adopted by the European Parliament on 14 March 2023 on the Proposal for a Directive of the European Parliament and of the Council on the Energy Performance of Buildings (Recast) (COM(2021)0802—C9-0469/2021—2021/0426(COD))1; European Commission: Brussels, Belgium, 2023. Available online: https://eur-lex.europa.eu/legal-content/EN/TXT/?uri=CELEX%3A52023AP0068 (accessed on 1 April 2023).
  49. Adamczyk, J.; Dylewski, R. Ecological and Economic Benefits of the “Medium” Level of the Building Thermo-Modernization: A Case Study in Poland. Energies 2020, 13, 4509. [Google Scholar] [CrossRef]
Figure 1. Methodological scheme of inventory of existing environmental parameters of urbanized zones in the ASEET multi-criteria approach.
Energies 17 04555 g001
Figure 2. Stages of research implementation.
Energies 17 04555 g002
Figure 3. City scheme as an energy management system (EMS) [32].
Energies 17 04555 g003
Figure 4. Gubin. Division of the city area into energy zones.
Energies 17 04555 g004
Figure 5. Assignment of building to CO2 emission zone I. Representative building of type R6, public utility, Cat. 2.
Energies 17 04555 g005
Figure 6. Gubin. Zonal map with typological parameterization. SIc zone.
Energies 17 04555 g006
Figure 7. Gubin. Zonal map with typological parameterization. Zone SIIa.
Energies 17 04555 g007
Figure 8. Layout of buildings type R5/Cat. 3 for the parameterization of Gubin development in zone SIIa.
Energies 17 04555 g008
Figure 9. Gubin. Zonal map with typological parameterization. Zone SIIIa.
Energies 17 04555 g009
Figure 10. Balance of critical parameters and active areas for the city of Gubin.
Energies 17 04555 g010
Table 1. Typology of buildings depending on the type and category of the building. (Building typology was adopted for this research in order to facilitate segregation and allocation to energy zones in the assessment of integrated development (ASEET). In practice, the typology can be adapted to the European program TABULA (Typology Approach for Building Stock Energy Assessment), which is implemented in Poland by the National Energy Conservation Agency).
Building TypeSchemeDescription
R1Energies 17 04555 i001Single-family residential building—Cat. 1/traditional technology
R2Energies 17 04555 i002Single-family residential building—Cat. 2/mixed technology
R3Energies 17 04555 i003Multi-family residential building—Cat. 1/traditional technology
R4Energies 17 04555 i004Multi-family residential building—Cat. 2/mixed technology
R5Energies 17 04555 i005Multi-family residential building—Cat. 3/industrialized technology
R6Energies 17 04555 i006Public building—Cat. 2/mixed technology
Table 2. List of buildings examined by ownership status.
Type of Building OwnershipQuantity List of Buildings
Municipal buildings [pcs.]5 out of 57 buildings examined
Buildings of housing communities [pcs.]9 out of 475 buildings examined
Cooperative buildings [pcs.]11 out of 21 buildings examined + 1 office building, 1 warehouse, 2 buildings commercial
Budget buildings [pcs.]8 buildings (4 schools, 3 kindergartens, 1 office) with 9 buildings.
Private buildings [pcs.]6 residential buildings, 1 building industrial
Sum44 out of 532 buildings examined
Table 3. Gubin. Distribution of buildings forming the city’s emission zones.
Year of ConstructionNumber of Tested Buildings for Energy Zones [pcs.]
Zone SI
(Red)
Zone SII
(Yellow)
Zone SIII
(Green)
Zone SIV
(Blue)
Until 198512 + 57 *11 + 21 *5No building
1986–1992411No building
1993–1997No building21No building
1998–2008No building12No building
Since 2009No building13No building
* Recommended buildings with the same function and technology.
Table 4. Gubin. Building categories according to construction technology in zones I–IV.
Building CategoryZone SI
(Red)
Zone SII
(Yellow)
Zone SIII
(Green)
Zone SIV
(Blue)
Number of Buildings [pcs.]
Cat. 1—traditional
technology
12 1 9 No buildings
Cat. 2—mixed
technology
4 4 2 No buildings
Cat. 3—industrialized technologyNo buildings11 1 No buildings
Table 5. ASEET parametric data for the representative building of the Health Clinic at 17 Gdańska Street in Gubin, zone SI.
Architectural and technical data:
Year of constructionSource of heatManufacturing technologyA year of thermal modernization
[a]
ManagerType of building/developmentNumber of staircases
1975–80Coal/Boiler roomMixed—Cat. 2noMZUKR-6
UZP/detached
3
Number of floors above ground/
underground
The building area Ab [m2]Heated usable area AUH [m2]The volume of the building V [m3]Heated building volume. VH [m3]Total area of heated external partitions
Af [m2]
Building shape indicator Af/VHNumber of premises [pcs.]Number of users P [psc.]
2/11260.933444.0012,416.0011,050.244345.600.3939.00200.00
Economic data—operating costs:
Cost of gas consumption
Cg [PLN/year]
Cost of gas consumption/person
Cg/person [PLN/person/year]
The cost of coal consumption
Cc [PLN/year]
The cost of coal consumption
/person
Cc/person
[PLN/person/year]
Cost of electricity consumption
Cel [PLN/year]
Cost of electricity consumption/person
Cel/person [PLN/person/year]
Cold water consumption
QCW [m3/year]
720,000.003600.00 3009.00 15.00 1260.00 6.30 2555.00
Energy data:
Surface indicator of seasonal heat demand EP [kWh/m2year]Annual final energy demand QK = QK,H + QK,W + + QK,L [kWh/year]Annual final energy demand for lighting QK,L [kWh/year]Thermal energy consumption QH [Qco,cw]
[GJ/year]
Coal demand
Dc
[ton/year]
Volume indicator of seasonal heat demand
Ev [kWh/(m3/year)]
328.24 694,500.0036,108.00 2500.00 100.0062.85
Table 6. Gubin. Critical efficiency indicators for zone SIc on an annual basis.
Item Number of IndicatorCharacteristic Zone Parameters—Zone SIcNumerical Data *
We1area of the zone: Az126,225.0 m2
We2building area in the zone: Abz1672.0 m2
We3biologically active area: Aag124,583.0 m2
We4density of population: DP0.0006 person/m2
We5heated area in the zone: AHZ1577.0 m2
We6average final energy indicator of the heated area in the zone EKzIc = 1.42 GJ/m2/year × 277.8394.48 kWh/m2/year
We7final energy consumption in the zone:
QKz [GJ] or [kWh]:
2239.0 GJ/ year
621,994.2 kWh/year
We8final energy cost in the zone:
Ckz = We7 × nj * = 2239.0 × 34.62
77,514.18 EUR/year
We9CO2 emission of zone QEIc:
QEIc = We7 × n = 2239.0 × 0.09637
n = 0.09637 GJ
215.77 Mg/year
We10unit CO2 emission indicator of the development in the zone SIc
EEIcb = We9/We2 [kg CO2/m2/year]
0.129 Mg/m2/year
We11unit CO2 emission indicator of the zone SIc
EEIcz = We9/We1 [kg CO2/m2/year]
0.0017 Mg/m2/year
We12non-renewable primary energy consumption factor of the zone EPz
EPz = EKz × wi = We6 × wi
wi—non-renewable primary energy input factor wi = 1.1
433.93 kWh/m2/year
* District heating costs in Poland—GLOBENERGIA 150.95 PLN/GJ (EUR 34.62) from 2022.
Table 7. Gubin. Critical efficiency indicators for zone SIIa on an annual basis.
Item Number of IndicatorCharacteristic Zone Parameters—Zone SIIaNumerical Data *
We1area of the zone: Az228,810.0 m2
We2building area in the zone: Abz30,288.0 m2
We3biologically active area: Aag198,522.0 m2
We4density of population: DP0.01 person/m2
We5heated area in the zone: AHZ120,582.0 m2
We6average final energy indicator of the heated area in the zone EKIc = 0.17 GJ/m2/year × 277.847.2 kWh/m2/year
We7final energy consumption in the zone:
QKz [GJ] or [kWh]
5,694,605.5 kWh/year
(20,498.0 GJ/year)
We8final energy cost CKZ in the zone:
Ckz = W7 × nj * = 20,498.0 × 34.62
709,640.76 EUR/year
We9CO2 emission of zone:
QEIIa =We7 × n = 20,498.0 × 0.09637
n = 0.09637 GJ
1975.39 Mg/year
We10unit CO2 emission indicator of the development in the zone SIIa
EEIIab = We9/We2 [kg CO2/m2/year]
0.065 Mg/m2/year
We11unit CO2 emission indicator of the zone SIIa
EEIIaz = We9/We1 [kg CO2/m2/year]
0.0086 Mg/m2/year
We12non-renewable primary energy consumption factor of the zone EPz
EPz = EKz × wi = We6 × wi
wi—non-renewable primary energy input factor, wi = 1.1
51.92 kWh/m2/year
* District heating costs in Poland—GLOBENERGIA 150.95 PLN/GJ (EUR 34.62) from 2022.
Table 8. Gubin. Critical efficiency indicators for zone SIIIa on an annual basis.
Item Number of IndicatorCharacteristic Zone Parameters—Zone SIIIaNumerical Data *
We1area of the zone: Az1,217,155.0 m2
We2building area in the zone: Abz55,502.0 m2
We3biologically active area: Aab1,161,653.0 m2
We4density of population: DP0.011 person/m2
We5heated area in the zone: AHZ109,848.0 m2
We6average final energy indicator of the heated area in the zone EKzIc = 0.32 GJ/m2/ year × 277.888.90 kWh/m2/year
We7final energy consumption in the zone:
QKz
9,764,947.8 kWh/year
(35,151.0 GJ/rok)
We8final energy cost CKZ in the zone:
Ckz = We7 × nj *
298,783.5 EUR/year
We9CO2 emission of zone:
QEIIIa = We7 × n= 35151.0 × 0.09637
n = 0.09637 × GJ
3387.5 Mg/year
We10unit CO2 emission indicator of the development in the zone SIIIa
EEIIIab = We9/We2 [kg CO2/m2/year]
0.061 Mg/m2/year
We11unit CO2 emission indicator of the zone SIIIa
EEIIIaz = We9/We1 [kg CO2/m2/year]
0.0028 Mg/m2/year
We12non-renewable primary energy consumption factor of the zone EPz
EPz = EKz × wi = We6 × wi
wi—non-renewable primary energy input factor wi = 1.1
97.79 kWh/m2/year
* District heating costs in Poland—GLOBENERGIA 150.95 PLN/GJ (EUR 34.62) from 2022.
Table 9. Total balance sheet indicators of ASEET building units of the city of Gubin.
Balance Indicators of Energy Consumption and CO2 Emissions in City Zones
Zone areafinal energy QKjprimary energy QPjQEj emission CO2
[m2][GJ][GJ][Mg/year]
Zone I3,171,007.0564,981.0621,479.133,899.0
Zone II745,827.0202,784.0263,619.212,167.0
Zone III2,776,140.042,907.047,197.72402.8
Total6,692,974.0810,672.0932,296.048,468.8
Balance Indicators of Active Areas for the City
Building development (TAb)
Greenery (TAg)
Traffic—communication (TAc)
27%
59%
14%
Disclaimer/Publisher’s Note: The statements, opinions and data contained in all publications are solely those of the individual author(s) and contributor(s) and not of MDPI and/or the editor(s). MDPI and/or the editor(s) disclaim responsibility for any injury to people or property resulting from any ideas, methods, instructions or products referred to in the content.