Article

Numerical Study on the Influence of Various Design Variables on the Behavior Characteristics of Oil and Gas in Internal Floating Roof Tanks

1
School of Mechanical and Electrical Engineering, Jining University, Qufu 273155, China
2
Department of Mechanical and Electrical Engineering, Jining Polytechnic, Jining 272103, China
3
Qufu Science and Technology Innovation Service Center, Qufu 273155, China
4
Division of Mechanical and Automotive Engineering, Hoseo University, Asan 31499, Republic of Korea
*
Authors to whom correspondence should be addressed.
Energies 2024, 17(17), 4336; https://doi.org/10.3390/en17174336
Submission received: 24 June 2024 / Revised: 24 August 2024 / Accepted: 27 August 2024 / Published: 29 August 2024
(This article belongs to the Special Issue Coal, Oil and Gas: Lastest Advances and Propects)

Abstract

:
With the development of the petrochemical industry, the number of storage tanks has continuously increased, exacerbating the issue of oil evaporation losses. Therefore, it is urgent to find efficient and economical measures to reduce oil evaporation losses. This paper establishes a diffusion model for internal floating roof tanks (IFRTs) and uses numerical simulation methods to study the mass fraction distribution, pressure distribution, and the variation patterns of oil vapor inside the tanks at different floating roof heights. The results show that the closer to the top of the tank, the lower the oil vapor mass fraction, and the mass fraction distribution is almost symmetrical. As the floating roof height decreases, the vapor mass fraction in the mixed gas region inside the tank gradually decreases, showing a distribution below the lower explosive limit (LEL), indicating improved safety. Furthermore, the study found that in the benchmark model, the behavior characteristics of gasoline vapor are reflected in the changes in mass fraction, velocity, and pressure distribution, where the oil vapor concentration in the upper part is lower but evenly distributed. By comparing the behavior characteristics of oil vapor inside the tank at different floating roof heights, it was found that the floating roof height significantly affects the diffusion and accumulation of oil vapor. The presence of vents effectively reduces the accumulation of oil vapor concentration, improving the stability and safety inside the tank. For different floating roof height scenarios (such as CASE 1, CASE 2, and CASE 4), the oil vapor behavior characteristics are similar. The study results provide important theoretical support for the future development of oil vapor recovery technologies and the design of enclosed energy-saving recovery devices inside tanks, indicating that optimizing the floating roof height and vent system design can significantly reduce oil evaporation losses.

1. Introduction

With the rapid development of the world economy, the global demand for energy is continuously increasing. Currently, the primary energy source globally is oil, accounting for approximately 33% of the world’s total energy consumption [1]. Along with the continuous improvement of oil refining technology and the increase in large-scale oil tank farms, the petrochemical industry has developed significantly. However, this has also led to a series of problems, such as fires, explosions, and environmental pollution. The main reason for these safety hazards in oil tanks is the evaporation of oil. To address this, internal floating roofs are currently used to cover the liquid surface to reduce oil evaporation and thus reduce safety issues [2,3]. This technology is currently an ideal solution. However, since the internal floating roof is connected to the tank wall with a sealing ring, there are inherent gaps; over time, the evaporated oil and gas will further corrode the sealing ring, increasing the gap. Usually, the concentration of oil vapor in the space above the floating roof is less than the lower limit of flame propagation, but as the gap increases, the evaporation rate accelerates, causing the upper oil vapor concentration to rise, which is a very serious safety hazard. Therefore, studying the influence of the floating roof height and the sealing ring gap leakage on reducing oil and gas evaporation in internal floating roof tanks is of great significance [4,5,6].
With the rapid development of simulation technology, numerical simulation methods have become a hot topic in the study of oil and gas diffusion laws in internal floating roof tanks. The effectiveness of using Computational Fluid Dynamics (CFD) to simulate gas leakage and component diffusion phenomena has been widely verified [7,8]. Parvini et al. [9] established near-field and far-field sub-models to determine the natural gas leakage in underground supply pipelines, concluding that the more dispersed the hydrogen release, the more likely it is to cause accidents. Some studies have used CFD methods to construct a shell model to study the release and diffusion of chlorine and hydrogen in indoor and ventilated environments [10,11,12]. The results show that in a ventilated environment, when the ventilation port is configured correctly, the higher the ventilation rate, the lower the hydrogen concentration. Conversely, the hydrogen concentration will increase. Li et al. [13] systematically simulated gas leakage and diffusion in subsea pipelines using a CFD-based research method. The model includes gas release, diffusion, and deflagration, and predicts the mass flow rate of the leakage gas, rise time, horizontal diffusion distance, and diffusion area. Stamoudis et al. [14,15] first studied the oil and gas diffusion and mass transfer process in conventional domed tanks, external floating roof tanks, internal floating roof tanks, and gas stations using numerical simulation methods (such as Fluent), and then verified these results through experiments, revealing the laws of oil evaporation, oil–gas–air diffusion and mass transfer, and external emissions in tanks. Galeev [16] conducted a thermal sensitivity analysis by establishing an evaporation model, concluding that when the buoyancy effect above the pool surface increases, the liquid evaporation rate decreases with the increase in the pool diameter. When the wind speed above the liquid surface increases, the impact of pool size on volatility decreases. Weiqiu Huang [17] proposed an equivalent film thickness and evaporation rate model based on single-film mass transfer theory and wind tunnel experiments. The model calculated the airflow velocity, concentration, and evaporation loss rate inside and outside the tank and analyzed the impact of vent location, rim gap position, and the tightness of the annular rim gap seal on the loss rate. Kim et al. [18] simulated hydrogen leakage at hydrogen refueling stations to study the diffusion behavior of leaked hydrogen jets, which helps in the marginal hydrogen safety design of hydrogen refueling stations. Hata [19] studied oil and gas evaporation by establishing a model based on thermodynamic theory, showing that the evaporation of minicar fuel tanks is faster than that of ordinary cars. Sauf et al. [7] used numerical simulation methods to establish evaporation models for acetic acid and ethylene glycol, finding that the internal mixed solution preferentially evaporates the more volatile component, leading to dual-stage evaporation. Hai Juan et al. [20] calculated the breathing loss of internal floating roof gasoline storage tanks using the experience formula of the Chinese petrochemical industry and conducted large-scale diffusion simulations using PHAST. The study showed that when atmospheric pressure is stable, the diffusion distance of tank breathing loss increases with wind speed. Numerical simulations and experimental studies have investigated the impact of floating roof height on oil and gas migration and emissions in internal floating roof tanks [21]. Zhang et al. [21] used numerical simulations and wind tunnel tests to analyze the impact of floating deck height and wind speed changes on oil vapor diffusion. The results showed that the height of the floating deck in internal floating roof tanks affects the oil and gas loss rate. The larger the gas space volume in the internal floating roof tank, the weaker the airflow exchange inside and outside the tank, which is conducive to the accumulation of oil vapor in the tank’s gas space. Hou et al. [22] proposed a CFD simulation model for gasoline evaporation during refueling. The results showed that increasing the loading speed reduces the total evaporation mass. Sun et al. [23] established a theoretical model of abnormal heat transfer in large-scale internal floating storage tanks using relative heat transfer theory, studying the periodic changes in the surrounding environment of storage tanks and the physical properties of crude oil. Huang et al. [6] discovered a “wave-like” distribution of oil and gas above the leakage side gap through numerical simulation methods for oil evaporation and diffusion, with higher oil vapor concentration on the windward side when the wind speed exceeds 4 m/s. Liang et al. [24] conducted a finite element analysis of tanks under overpressure conditions, concluding that after maintenance, the maximum design liquid level of the tank decreases under overpressure conditions. Pasley et al. [25] and Zhao et al. [26] conducted numerical simulations and experimental measurements to study the wind speed distribution and flow field around an external floating roof tank and above the floating deck. They discovered that the airflow exhibited distinct flow characteristics when the floating deck was positioned at lower and higher levels, respectively. Uematsuet et al. [27,28] explored the distribution of wind forces and examined the buckling behavior in open-topped oil storage tanks. Hassanvand et al. [15,29] applied the volume-of-fluid (VOF) model in CFD simulations to analyze multiple factors influencing gasoline tank loading. They investigated how temperature variations, oil loading speeds, and initial oil–vapor concentrations affect the rate of oil loss from the tank. Hao et al. [30] utilized numerical simulation techniques alongside experimental validation to investigate the leakage and diffusion of oil vapor from both large and small external floating roof tanks (EFRTs) at various leakage points and pore sizes. Their findings indicated that in cases of rim leakage between the floating deck and tank wall, oil vapor diffuses along the tank wall towards the upper space of the floating deck.
In conclusion, previous studies on the evaporation and diffusion of oil and gas have considered variable factors such as wind speed, liquid surface size, and vent configuration. However, the effects of the floating roof height and the rim gap seal of internal floating roof tanks (IFRTs) on oil and gas evaporation and diffusion have not been taken into account. Therefore, this study aims to address this gap by analyzing the impact of floating roof height and rim gap seal on oil and gas evaporation and diffusion in IFRTs. Specifically, this research establishes a diffusion model for IFRTs and employs numerical simulation methods to analyze the effects of different floating roof heights and rim gap seals on the distribution and variation patterns of oil and gas mass fractions and pressure within the tank. By filling this research gap, we hope to provide theoretical support for the design and optimization of storage tanks and identify effective measures to reduce oil evaporation losses.

2. Model Analysis

2.1. Governing Equations

The actuating fluid for the internal flow of IFRT is air, and it can be predicted by simultaneously calculating the conservation equations of mass, momentum, and energy for three-dimensional turbulent flow. To study the heat and mass transfer phenomena of air and oil vapor (multi-component gas) without chemical reactions, it is also necessary to additionally consider the conservation equations of the chemical components listed below.
Mass conservation equation:
ρ μ i x i = 0
where ρ is the fluid density, and μ i is the velocity component primarily describing convective mass transport.
Momentum conservation equation:
x j ( ρ μ i μ j ) = p x i + x j ( μ t μ i x j ) + ( ρ ρ a ) g i
where p is pressure, μ t is turbulent viscosity, and g i is gravitational acceleration; the velocity variables μi and μj describe convective transport and interactions of momentum.
Energy conservation equation:
( ρ E ) t + ( ρ μ j E ) x j = ρ f j μ j ( p μ j ) x j + ( τ i j μ j ) x i + x j ( k T x j ) + S h
The energy E is:
E = h p ρ + μ 2 2
where fj: volume force; T: temperature; K: fluid heat transfer coefficient; Sh: energy source term.
Component conservation equation:
t ( ρ Y i ) + x j ( ρ u i Y i ) = J i x j + S i
j i = ρ D i , m + μ t S c t Y i x i
where Yi: local mass fraction of component I; Ji: diffusion flux of the i-th species; Di,m: mass diffusion coefficient of substance i in the mixture; DT,i: thermal diffusion coefficient; SCT: turbulent Schmidt number

2.2. Turbulence Equations

The Realizable k-ε turbulence model was applied in this study, and the following is a brief explanation: In addition to including time-averaged values ( u i ¯ ) and ( p ¯ ) , it also includes Reynolds stresses ( ρ u i u j _ _ _ _ _ _ ). Moreover, determining the turbulent viscosity coefficient (μt) is also very important. The following are the transport equation models for k and ε in the Realizable k-ε model:
t ( ρ k ) + x j ( ρ k u j ) = x j [ ( μ + μ t σ k ) k x j ] + G k + G b ρ ε Y M + S k
t ( ρ ε ) + x j ρ ε u j = x j μ + μ t σ ε ε x j + ρ C 1 S ε ρ C 2 ε 2 k + ν ε + C 1 ε ε k C 3 ε G b + S ε
Among:
C 1 = m a x [ 0.43 , η η + 5 ] , η = S k ε , S = 2 S i j S i j
In the above equations, k represents the turbulent kinetic energy (m2/s2), and ε represents the turbulence energy dissipation rate (m2/s3). Additionally, Gk and Gb, respectively, represent the generation of turbulent kinetic energy due to mean velocity gradients and buoyancy (kg·m−1·s−1). YM denotes the contribution of fluctuating dilation in compressible turbulence to the overall dissipation rate (kg·m−1·s−1). C2 and C1ε are constants. σk and σε are the turbulent Prandtl numbers for turbulent kinetic energy and dissipation rate, respectively. Sk denotes the source term for turbulent kinetic energy (kg·m−1·s−3), and denotes the source term for the dissipation rate (kg·m−1·s−4).

2.3. Meshing

In the process of conducting CFD (Computational Fluid Dynamics) simulations, the first step is to discretize the computational domain, which means dividing it into a mesh. The form, quality, and size of the mesh will affect the computational results; thus, the importance of mesh generation has a significant impact on achieving stable and accurate computational results. When performing flow field analysis using CFD, the analysis domain needs to be divided into a finite number of meshes. Mesh generation can be classified into structured meshes and unstructured meshes, typically using four types of meshes (hexahedral, tetrahedral, polyhedral, etc.) and their deformed forms to create the mesh. As shown in this study, for cases with significant variations in flow phenomena, unstructured meshes are usually employed for numerical simulations.
In this paper, when liquid gasoline is filled from the bottom of the storage tank to a height of 7 m, the mesh system for this situation is used as the reference. For regions with expected significant flow variations, such as the inlet, outlet, and areas near the walls, a dense division is made to 20% of the basic size (400 mm), ultimately forming approximately 530,000 structured meshes. At this time, the mesh quality is 0.51154, and more detailed mesh generation methods are shown in Table 1.
The quality assessment of the mesh shows that it is topologically valid with no negative volume cells. The face validity is very high, with 99.889% of the faces having a validity of 1.00, and only 0.111% of the faces having a validity slightly below 1.00 but still above 0.95. The volume change statistics indicate that 91.084% of the cells have a volume change between 0.1 and 1.0, with only 0.567% of the cells having a volume change below 0.01. Overall, the mesh quality is high, making it suitable for accurate and stable CFD simulations without the need for major adjustments.
Figure 1 shows the mesh division of the baseline model (with an analysis region of 7.7 m, and a distance of 7 m from floating roof to the top of the storage tank).

2.4. Mesh Independence Verification

To verify the mesh independence of the model, models with different numbers of meshes were established, as shown in Table 2. Figure 2 shows the effect of the number of meshes on the mass fraction of gasoline vapor. It can be seen from the figure that as the number of meshes increases, the impact of the number of meshes on the mass fraction becomes smaller. Therefore, the number of computational meshes for numerical simulation is 523,536. This verifies the mesh independence of the numerical model.

2.5. Boundary Conditions

In this study, it is necessary to simultaneously reveal the heat and mass transfer caused by the interaction of mixed gases (air and gasoline vapor) inside the storage tank, as well as the effect of external temperature on the mixed gases inside the tank. To analyze the heat and flow phenomena caused by the interaction of mixed gases (air and gasoline vapor) inside the storage tank, the following flow-related boundary conditions were applied: A no-slip condition is used for all walls, gasoline vapor enters the tank at a constant velocity (6.69 × 10⁻⁷ m/s) through the edge (diameter 0.01 m) formed between the floating roof and the tank wall, and the five ventilation openings at the outlet use pressure boundary conditions. The temperature boundary conditions are as follows: the tank wall uses a heat flux condition corresponding to a convective heat transfer coefficient (h = 10 W/m2K), the IFRT surface inside the tank is maintained at a constant temperature (298 K), and the ventilation openings use outlet conditions. The physical boundary conditions are detailed in Table 3 and Table 4.

3. Results and Discussion

In this study, numerical analyses were conducted on four models, including the baseline model, based on the height differences in gasoline filling levels within the storage tank, revealing the heat and mass transfer phenomena inside the oil storage tank. The results demonstrated flow characteristics, velocity fields, pressure fields, and the mass fraction of gasoline vapor in the air–oil vapor space. Through these results, the behavioral characteristics of air–gasoline vapor were explained, thereby predicting environmental and explosion risks.

3.1. Behavioral Characteristics of Gasoline Vapor in the Baseline Model

In the internal floating roof tanks (IFRTs), the behavioral characteristics of gasoline vapor under the interaction of mixed gases (air and gasoline vapor) were studied. This study particularly focuses on the gap of 0.01 m (i.e., 10 mm) between the storage tank and the internal floating roof, through which evaporated gasoline enters the upper space of the floating roof at a speed of (3.8813 × 10⁻⁷) m/s. The total height of the storage tank is 14.7 m, and liquid gasoline (i.e., the lower part of the floating roof) is filled to 7 m; thus, the actual analysis region height is 7.7 m, filled with mixed gases. These are the conditions for the baseline model.

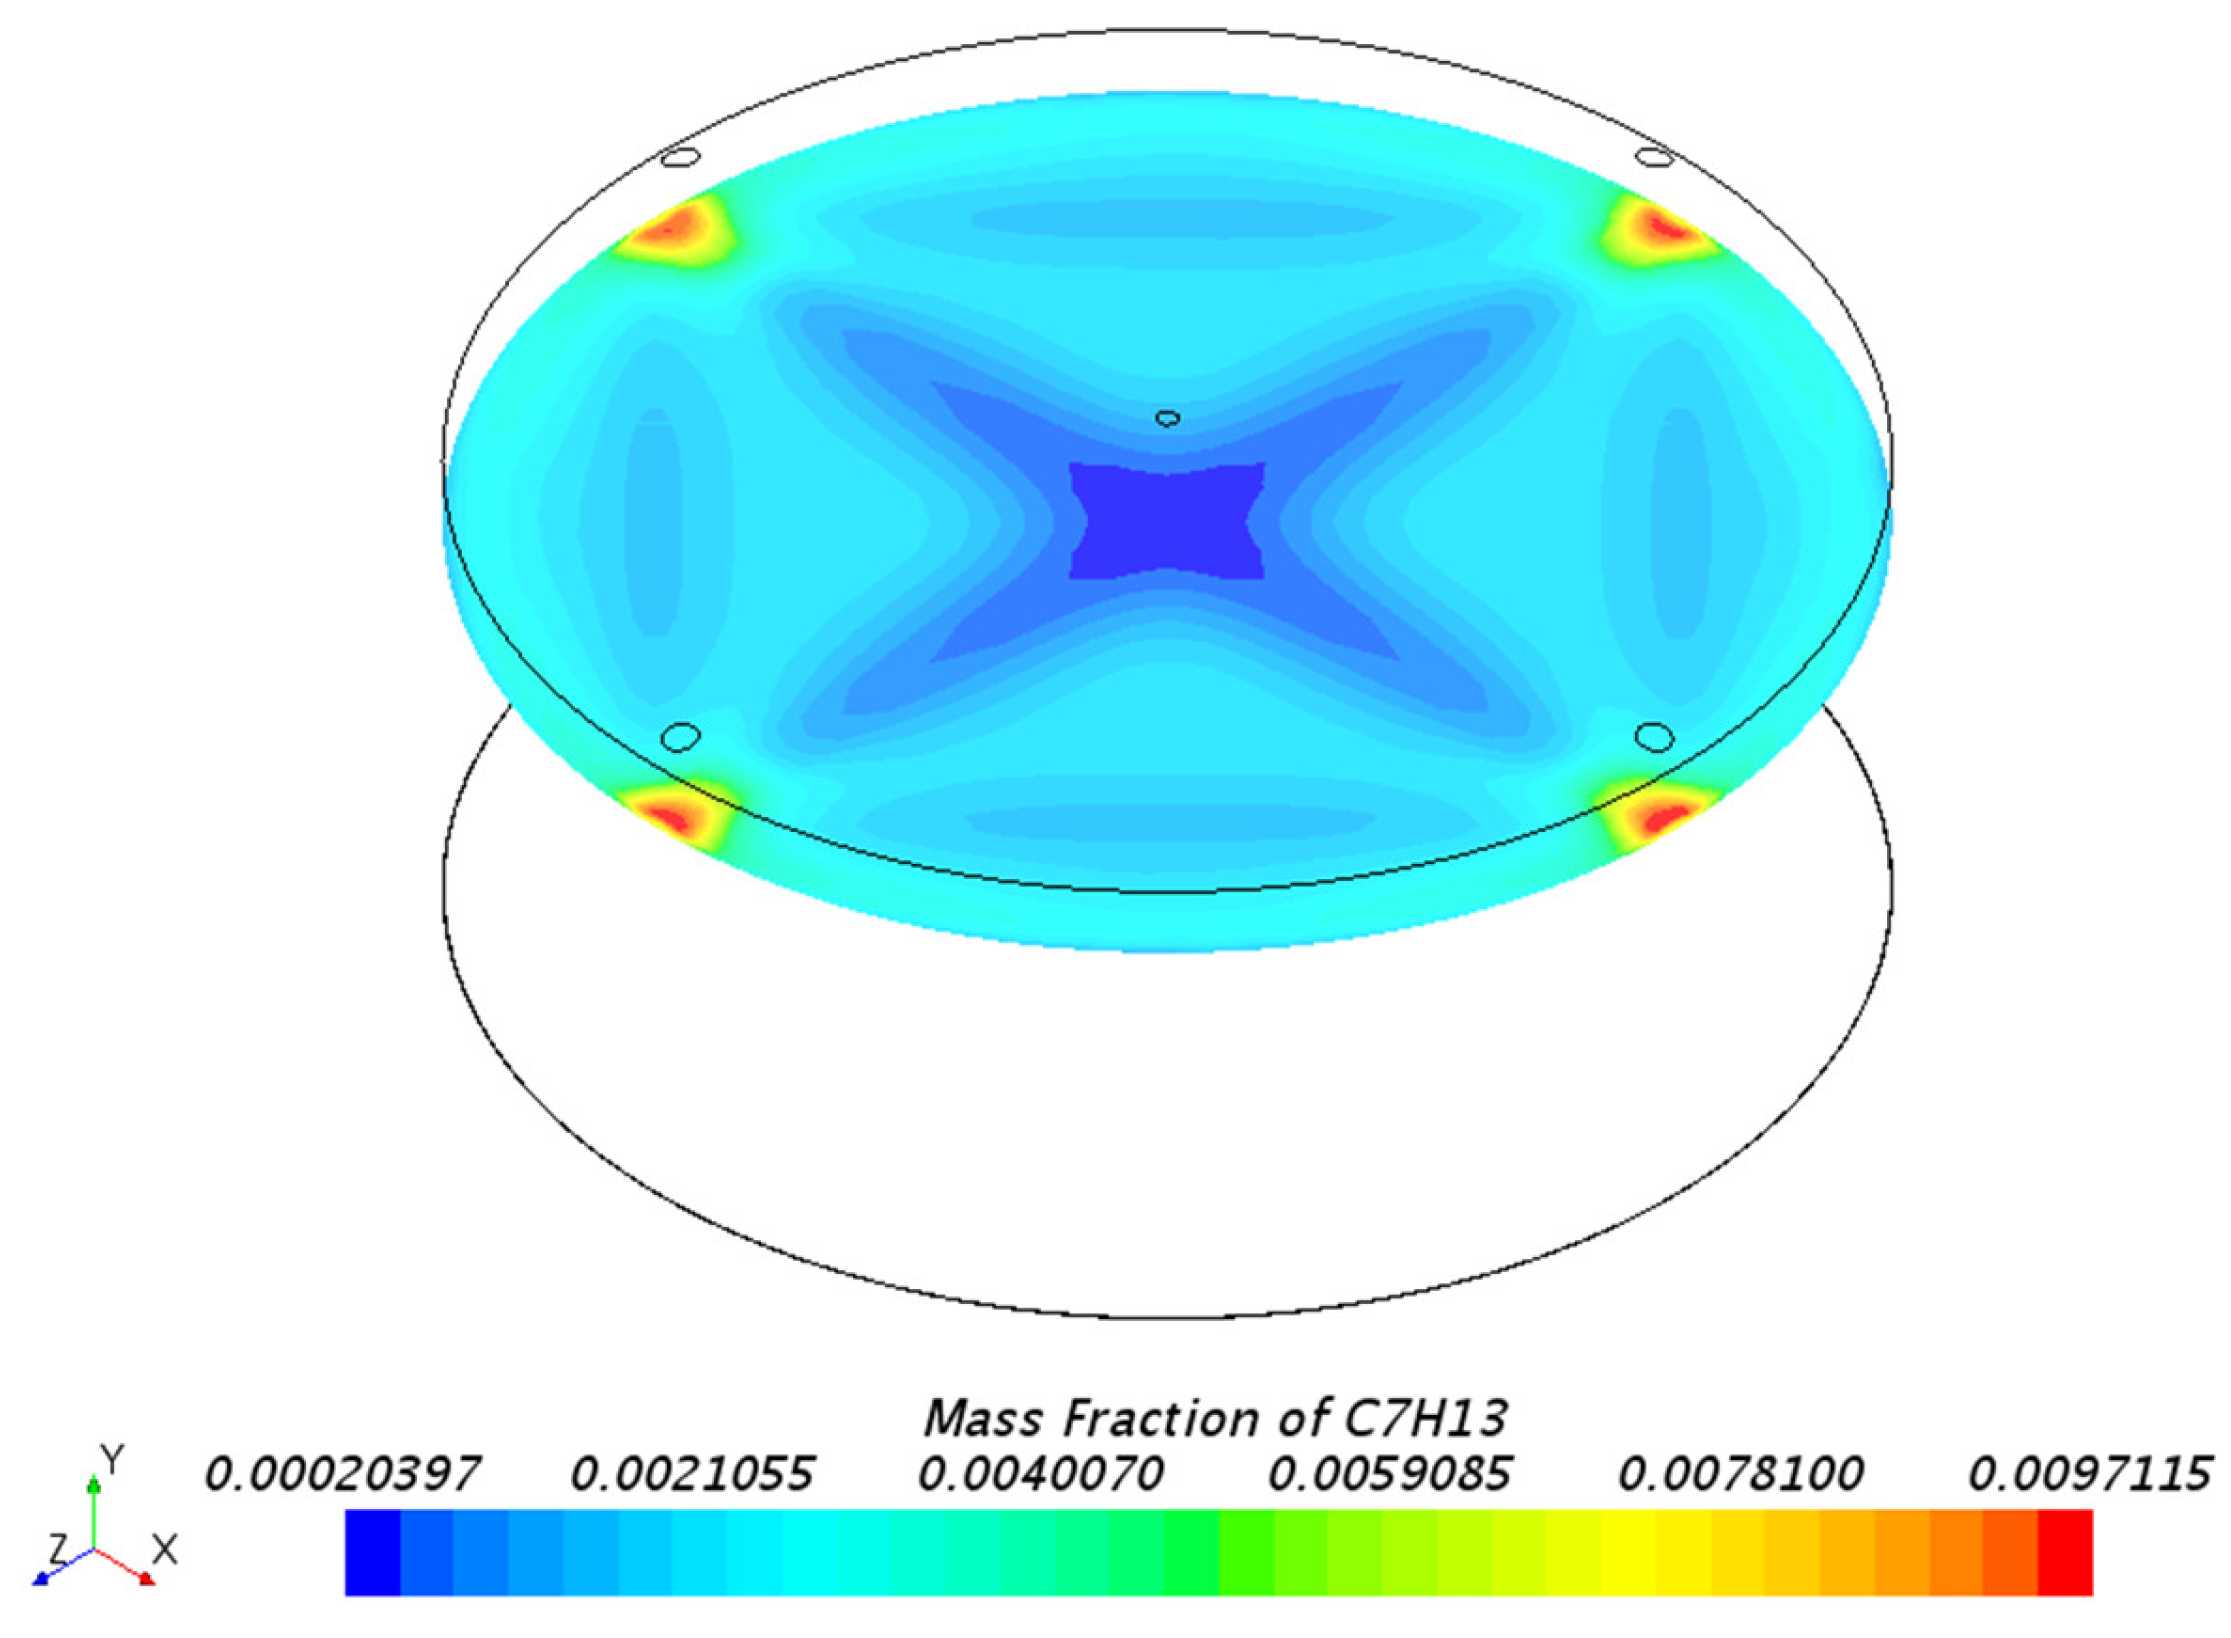
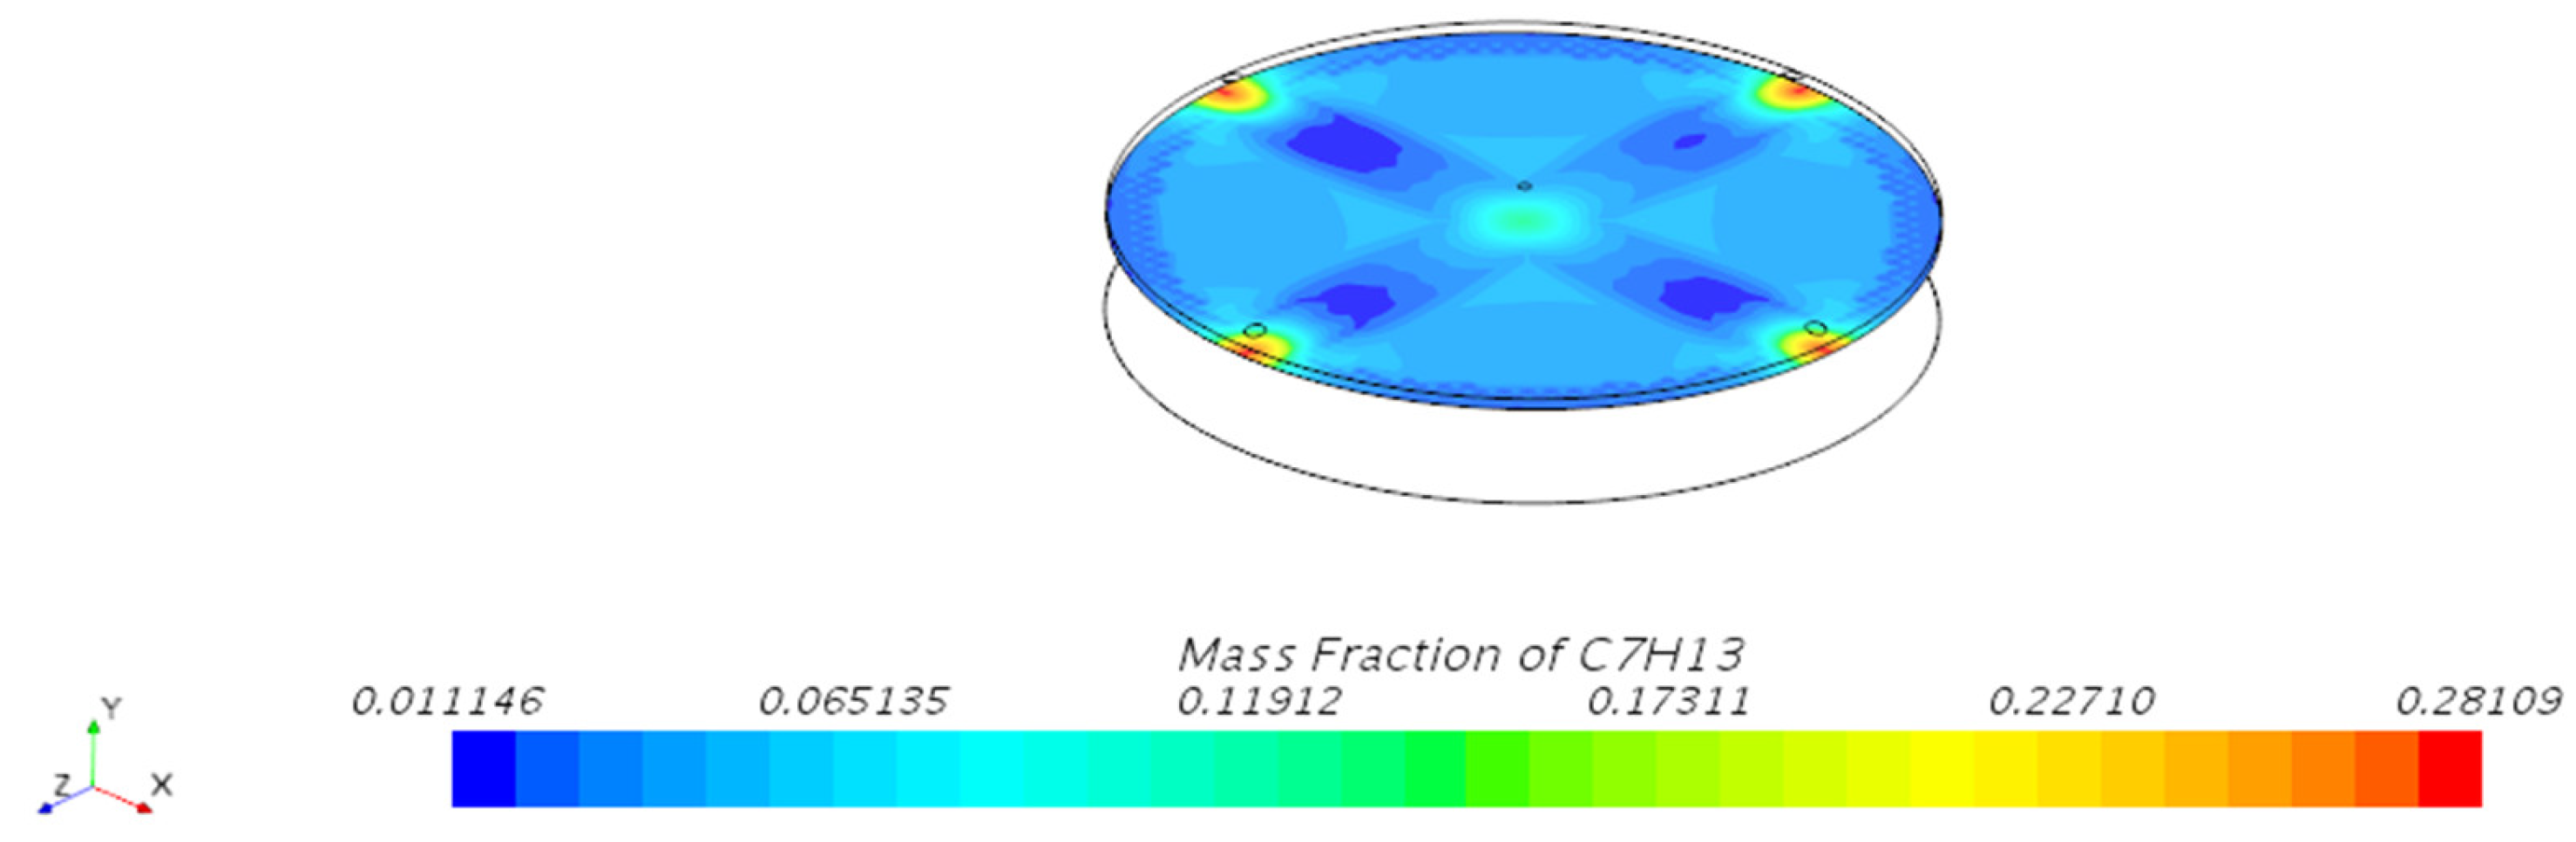
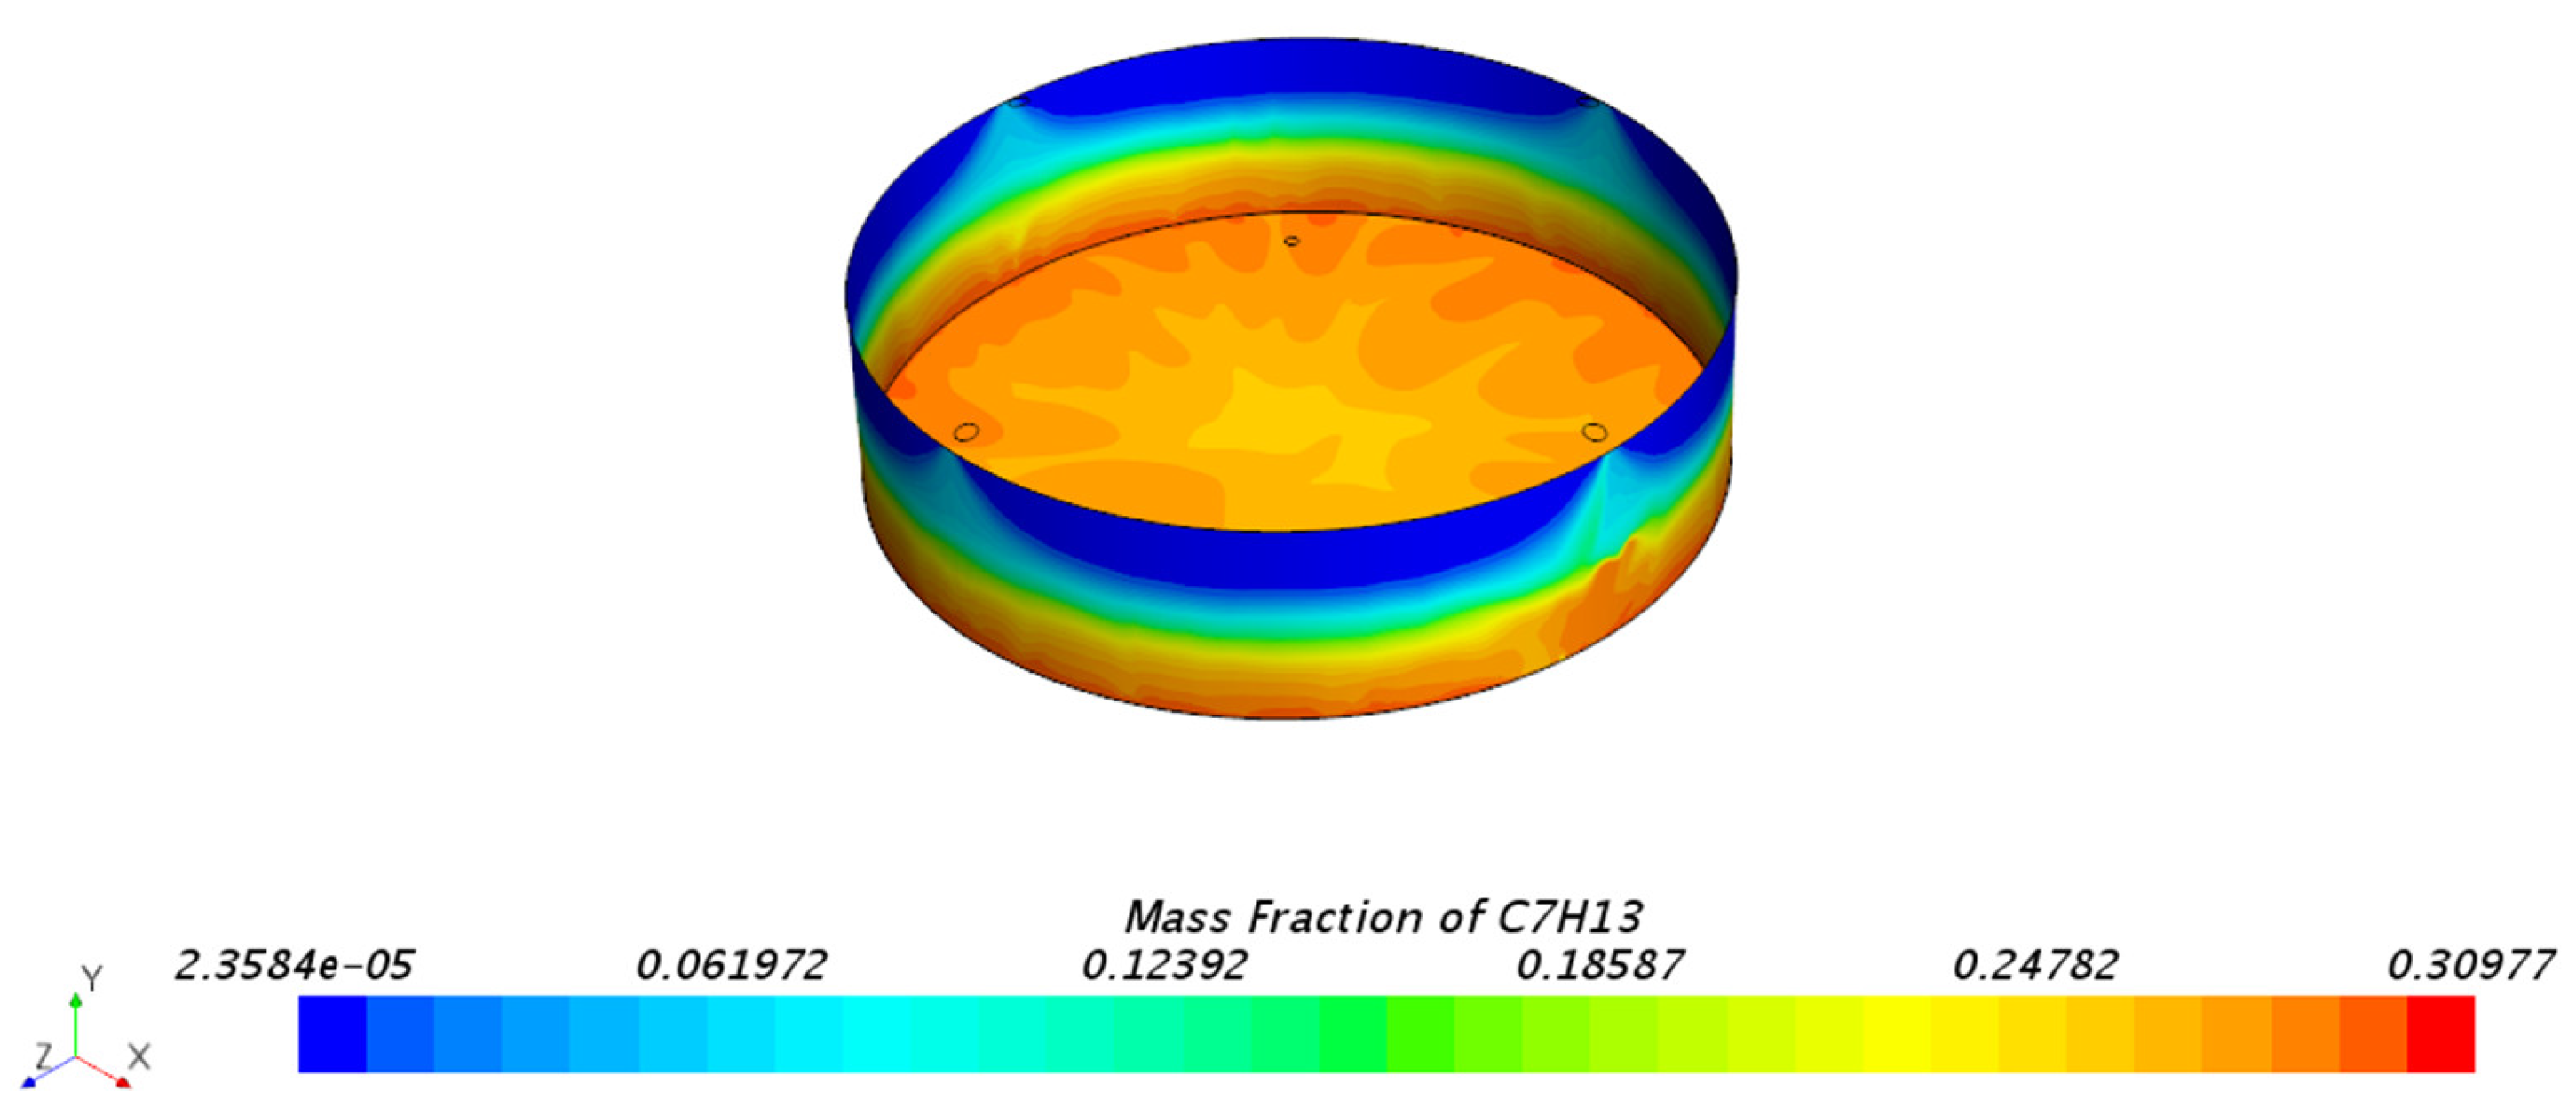
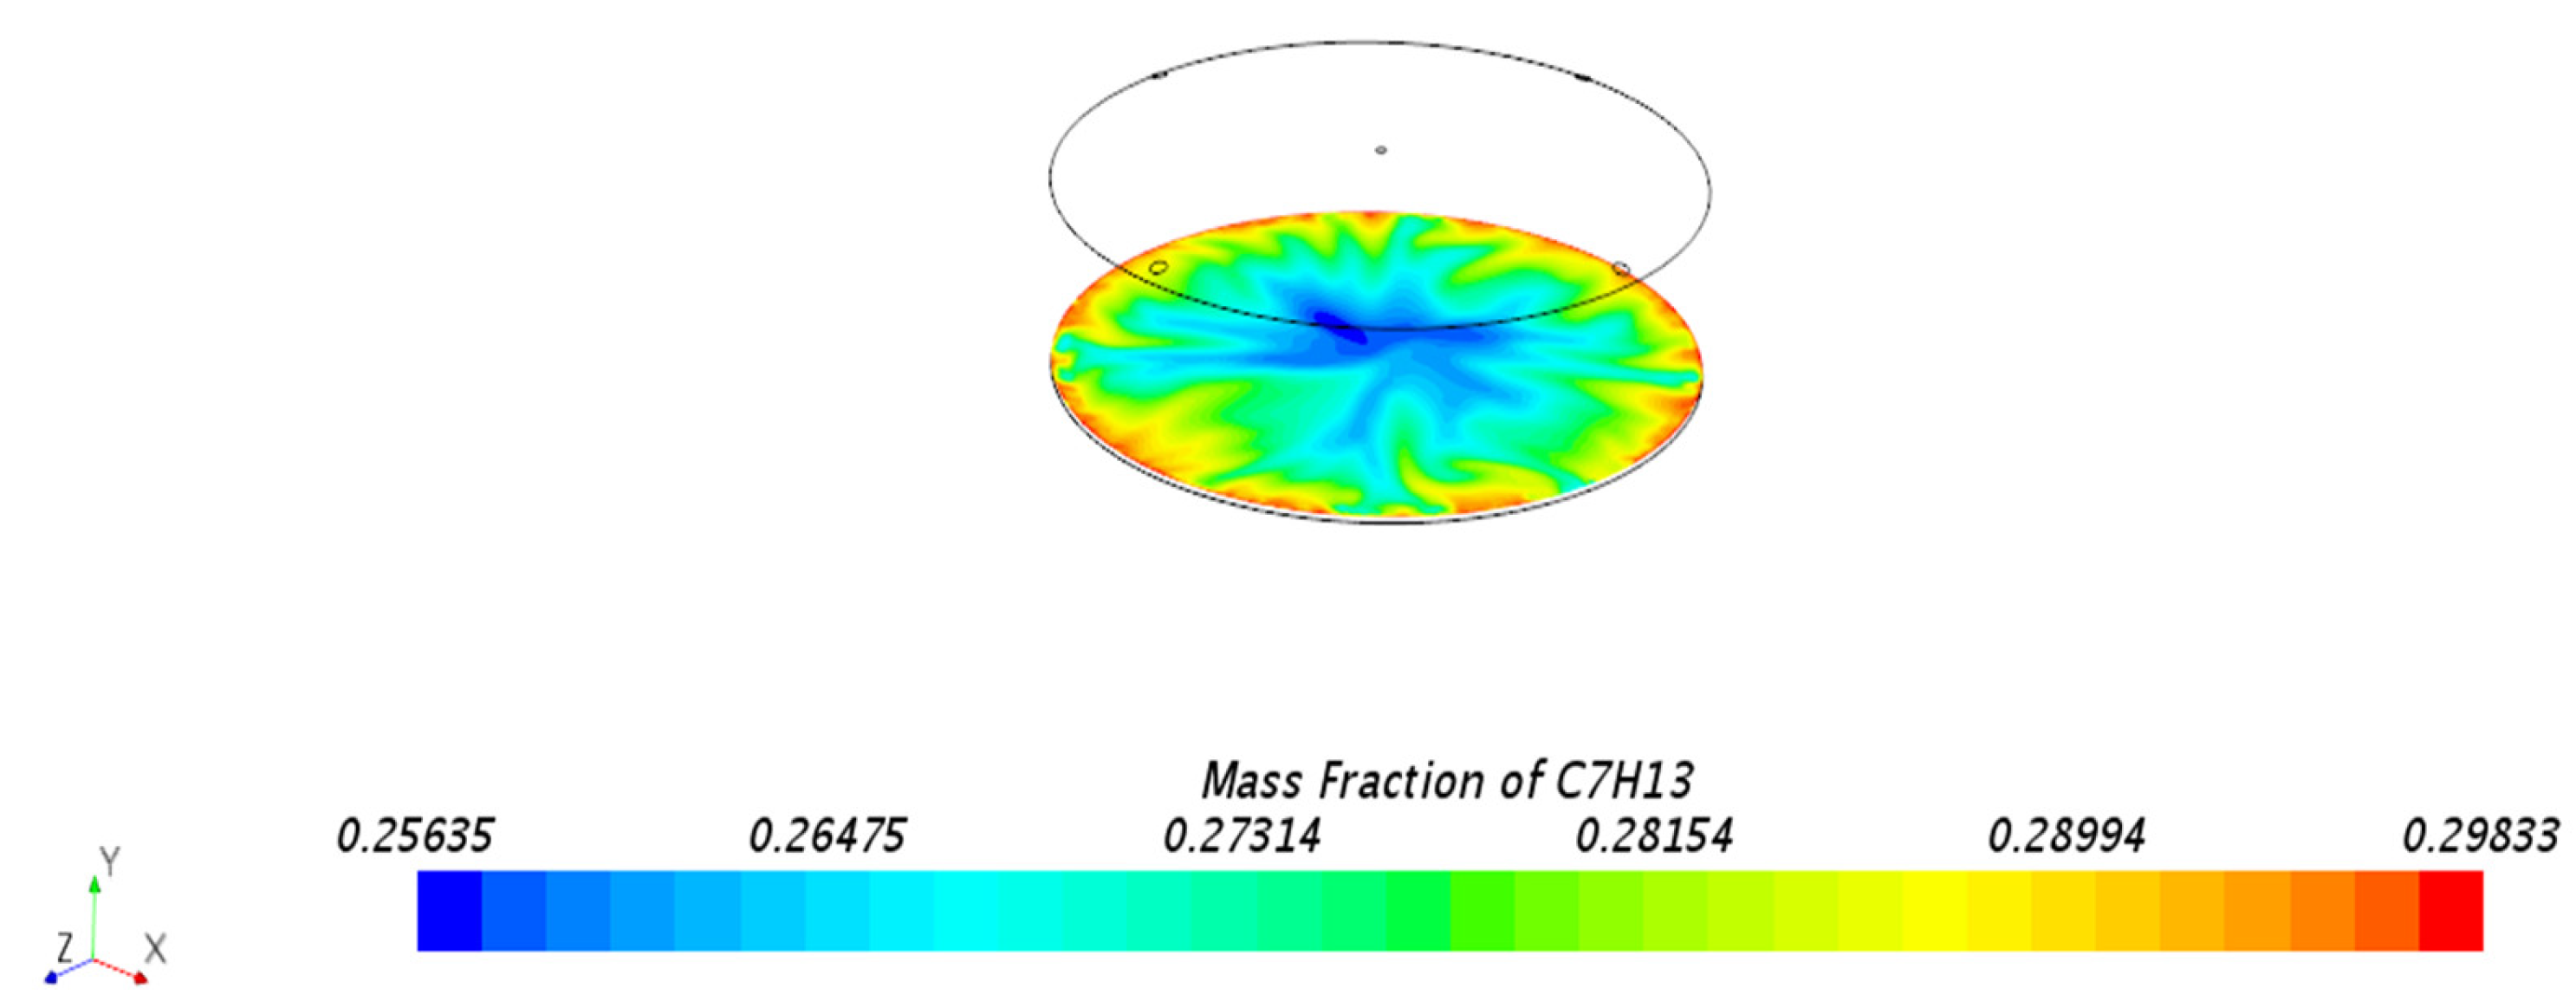
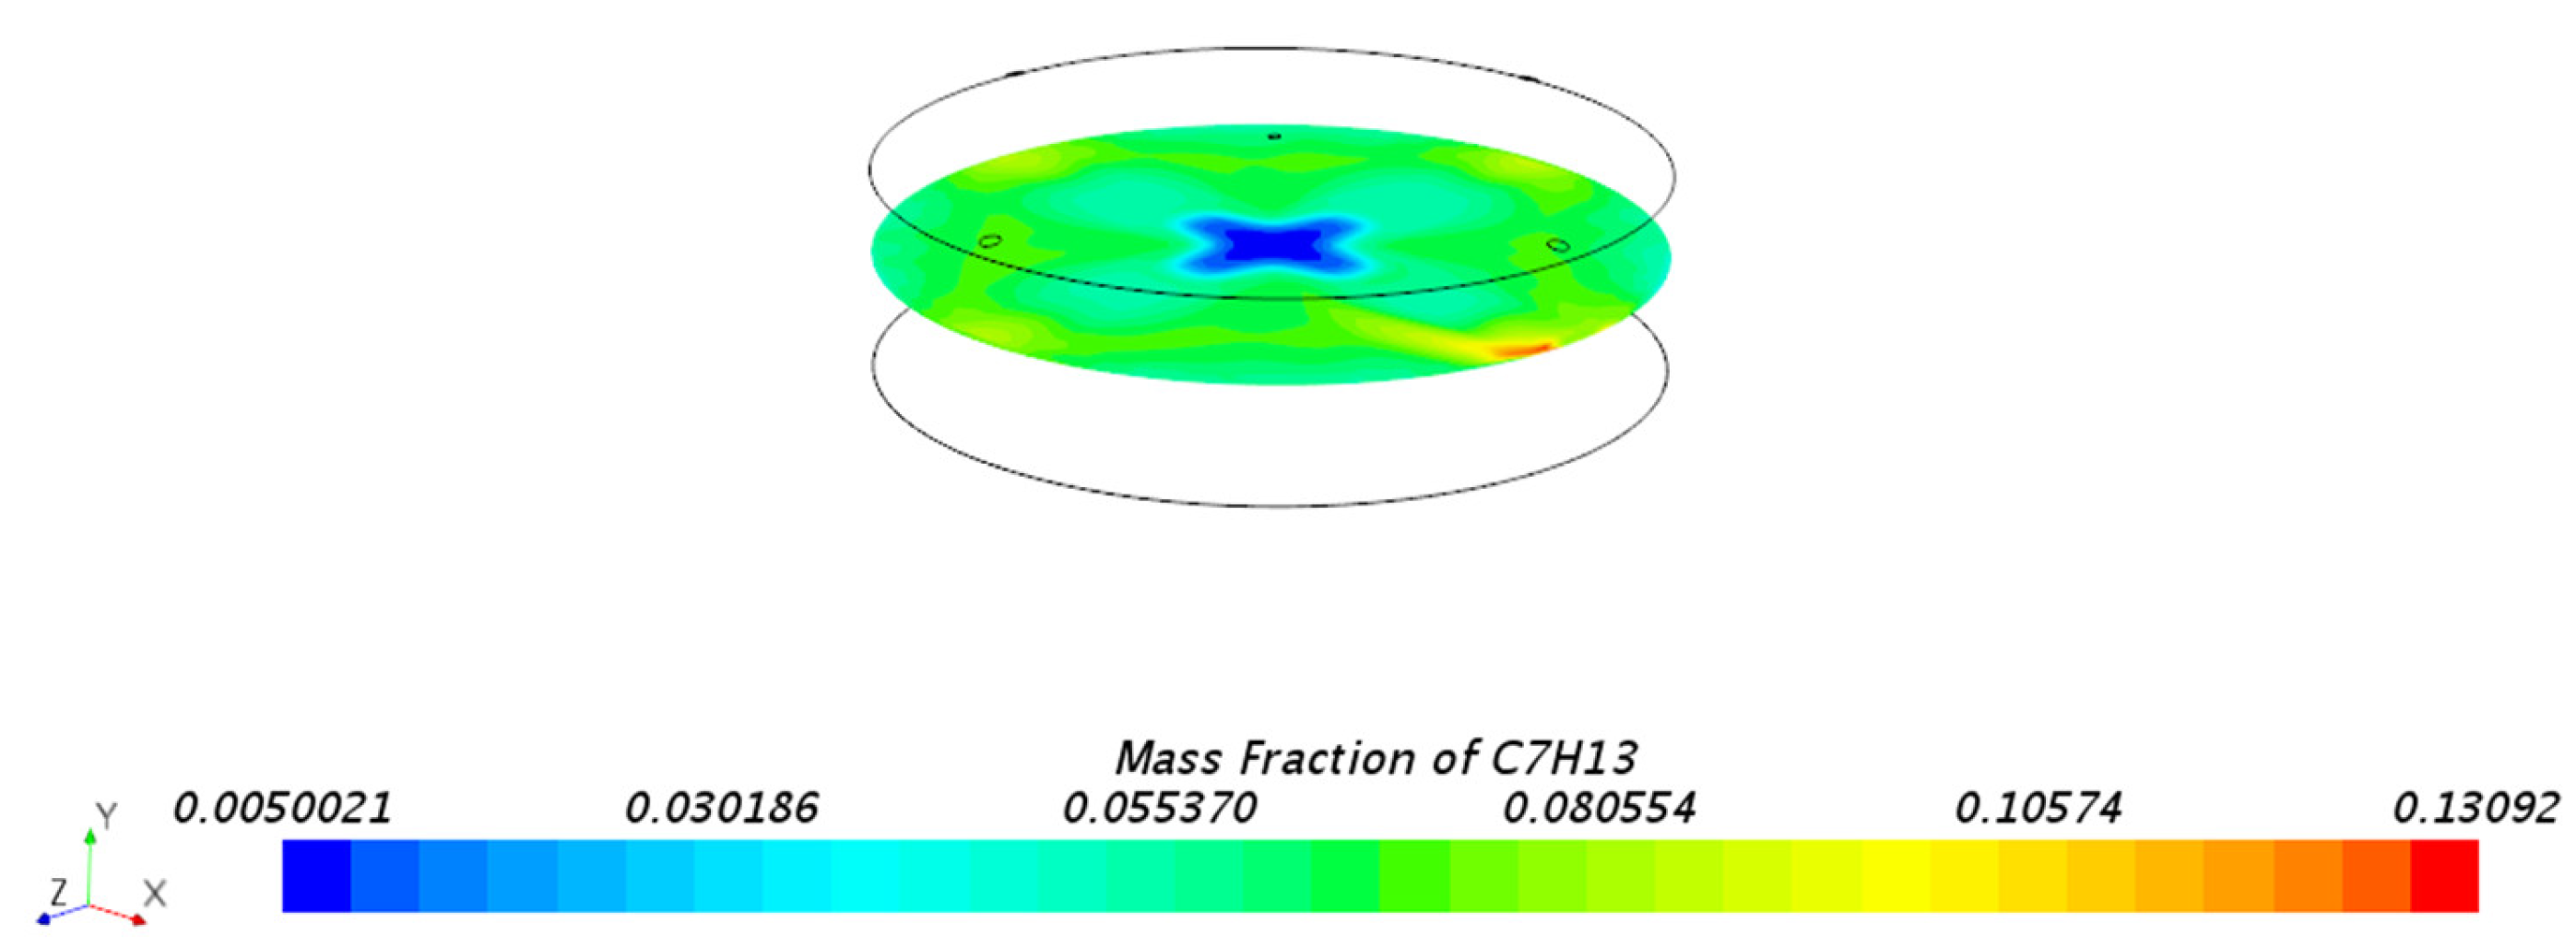
3.1.1. Mass Fraction Distribution

As shown in Figure 3, gasoline vapor maintains a mass fraction distribution of 0.3 in the small annular space between the floating roof and the outer wall of the storage tank. As it rises vertically, towards the exhaust port and the top of the tank, the mass fraction gradually decreases, with a minimum distribution of about 8.27 × 10⁻⁸. At the same time, gasoline vapor entering through the 1 cm annular gap diffuses within the gas region. This indicates that in the gas region filled with air, the diffusion of gasoline vapor forms the behavior of the fluid. Additionally, the stratification phenomenon of gasoline vapor concentration (mass fraction) is well demonstrated.
Furthermore, Figure 3 shows that oil and gas diffuse at the sealing ring, with a distinct interface between the oil–gas concentration and the air. In the vertical direction, the concentration is higher on both sides of the tank, while the exhaust port at the top of the tank causes the gas flow to concentrate towards the center. Inside the tank, gasoline vapor and gas mainly accumulate on the surrounding walls.
This phenomenon can be explained from two aspects. First, gasoline vapor enters from the annular space of the floating roof, initially flowing towards the low-concentration area inside the tank. Subsequently, as diffusion progresses, a concentration gradient gradually forms inside the tank. This is because the density of gasoline vapor is about three times that of air, and the effect of gravity promotes the stratification of concentration.
Figure 4, Figure 5 and Figure 6 show the mass fraction distribution of gasoline vapor on the xz plane at different y positions (y = 7 m, 10.5 m, and 14 m). It can be seen that as the position approaches the upper part of the storage tank, the mass fraction gradually decreases. This indicates that gasoline vapor is mainly concentrated in the lower region of the tank, and its concentration gradually decreases with increasing height. Additionally, these figures clearly demonstrate that the mass fraction distribution is almost symmetrical, indicating the uniformity and symmetry of gasoline vapor diffusion at different heights.
At y = 7 m, the highest mass fraction is 0.25, showing the high concentration accumulation of gasoline vapor in the lower height region. As the height increases to y = 10.5 m, the mass fraction significantly decreases but still maintains a certain concentration level. At y = 14 m, near the top of the tank, the mass fraction further decreases to 0.009, approaching zero. This indicates a lower concentration of vapor diffusion in the upper region of the tank.
Furthermore, the figures show that the concentration of gasoline vapor is higher on both sides and lower in the middle. This distribution characteristic is due to gasoline vapor mainly leaking from the annular space of the floating roof, causing the vapor to mainly accumulate on both sides of the tank, with relatively less diffusion in the middle part.
These results indicate that there is a significant concentration gradient of gasoline vapor in the vertical direction inside the storage tank, and the symmetry of the mass fraction distribution suggests that the flow and diffusion process inside the tank is relatively uniform. Additionally, through the data analysis in the figures, the diffusion patterns of gasoline vapor at different heights can be explored in more detail, providing a theoretical basis for the further optimization of tank design and the improvement of safety.

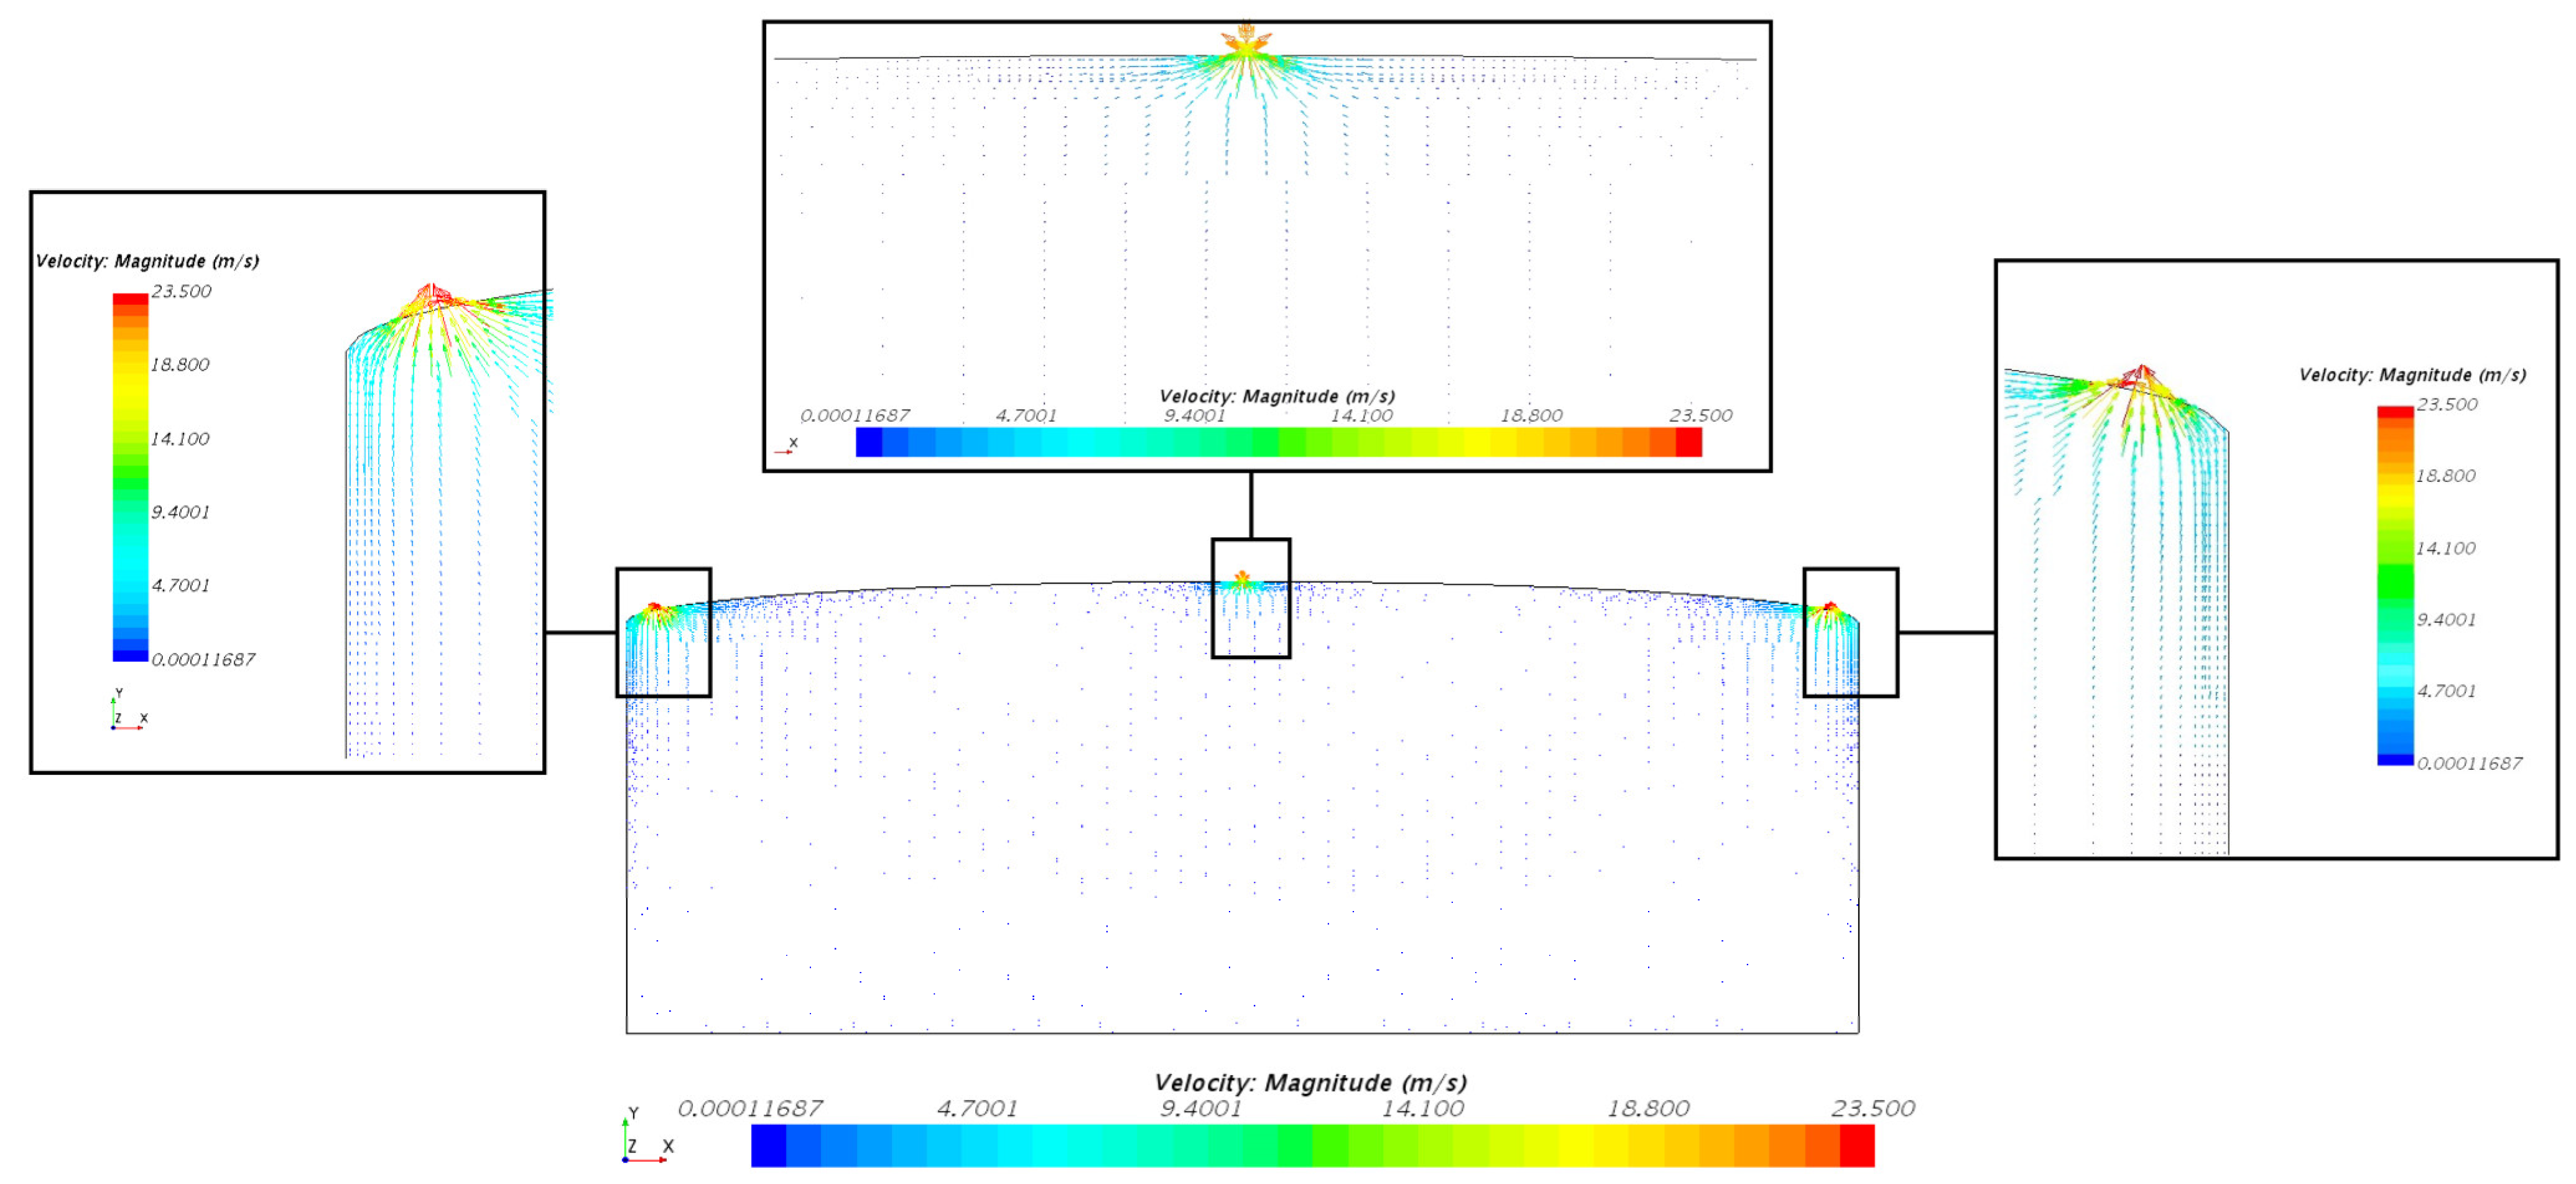
3.1.2. Velocity Distribution

Figure 7 shows the velocity distribution diagram, drawn to illustrate and confirm the flow characteristics in the vent area. From the diagram, it can be seen that the mixed gas flows out through the vent, and a faster flow rate is formed in the vent area, with a diameter of 5 cm. This result clearly shows that vapor and air flow out through the larger diameter vents on both sides.
Since the velocity distribution of the mixed gas inside the storage tank is closely related to the behavior of gasoline vapor, the overall trend can be understood through the velocity distribution.

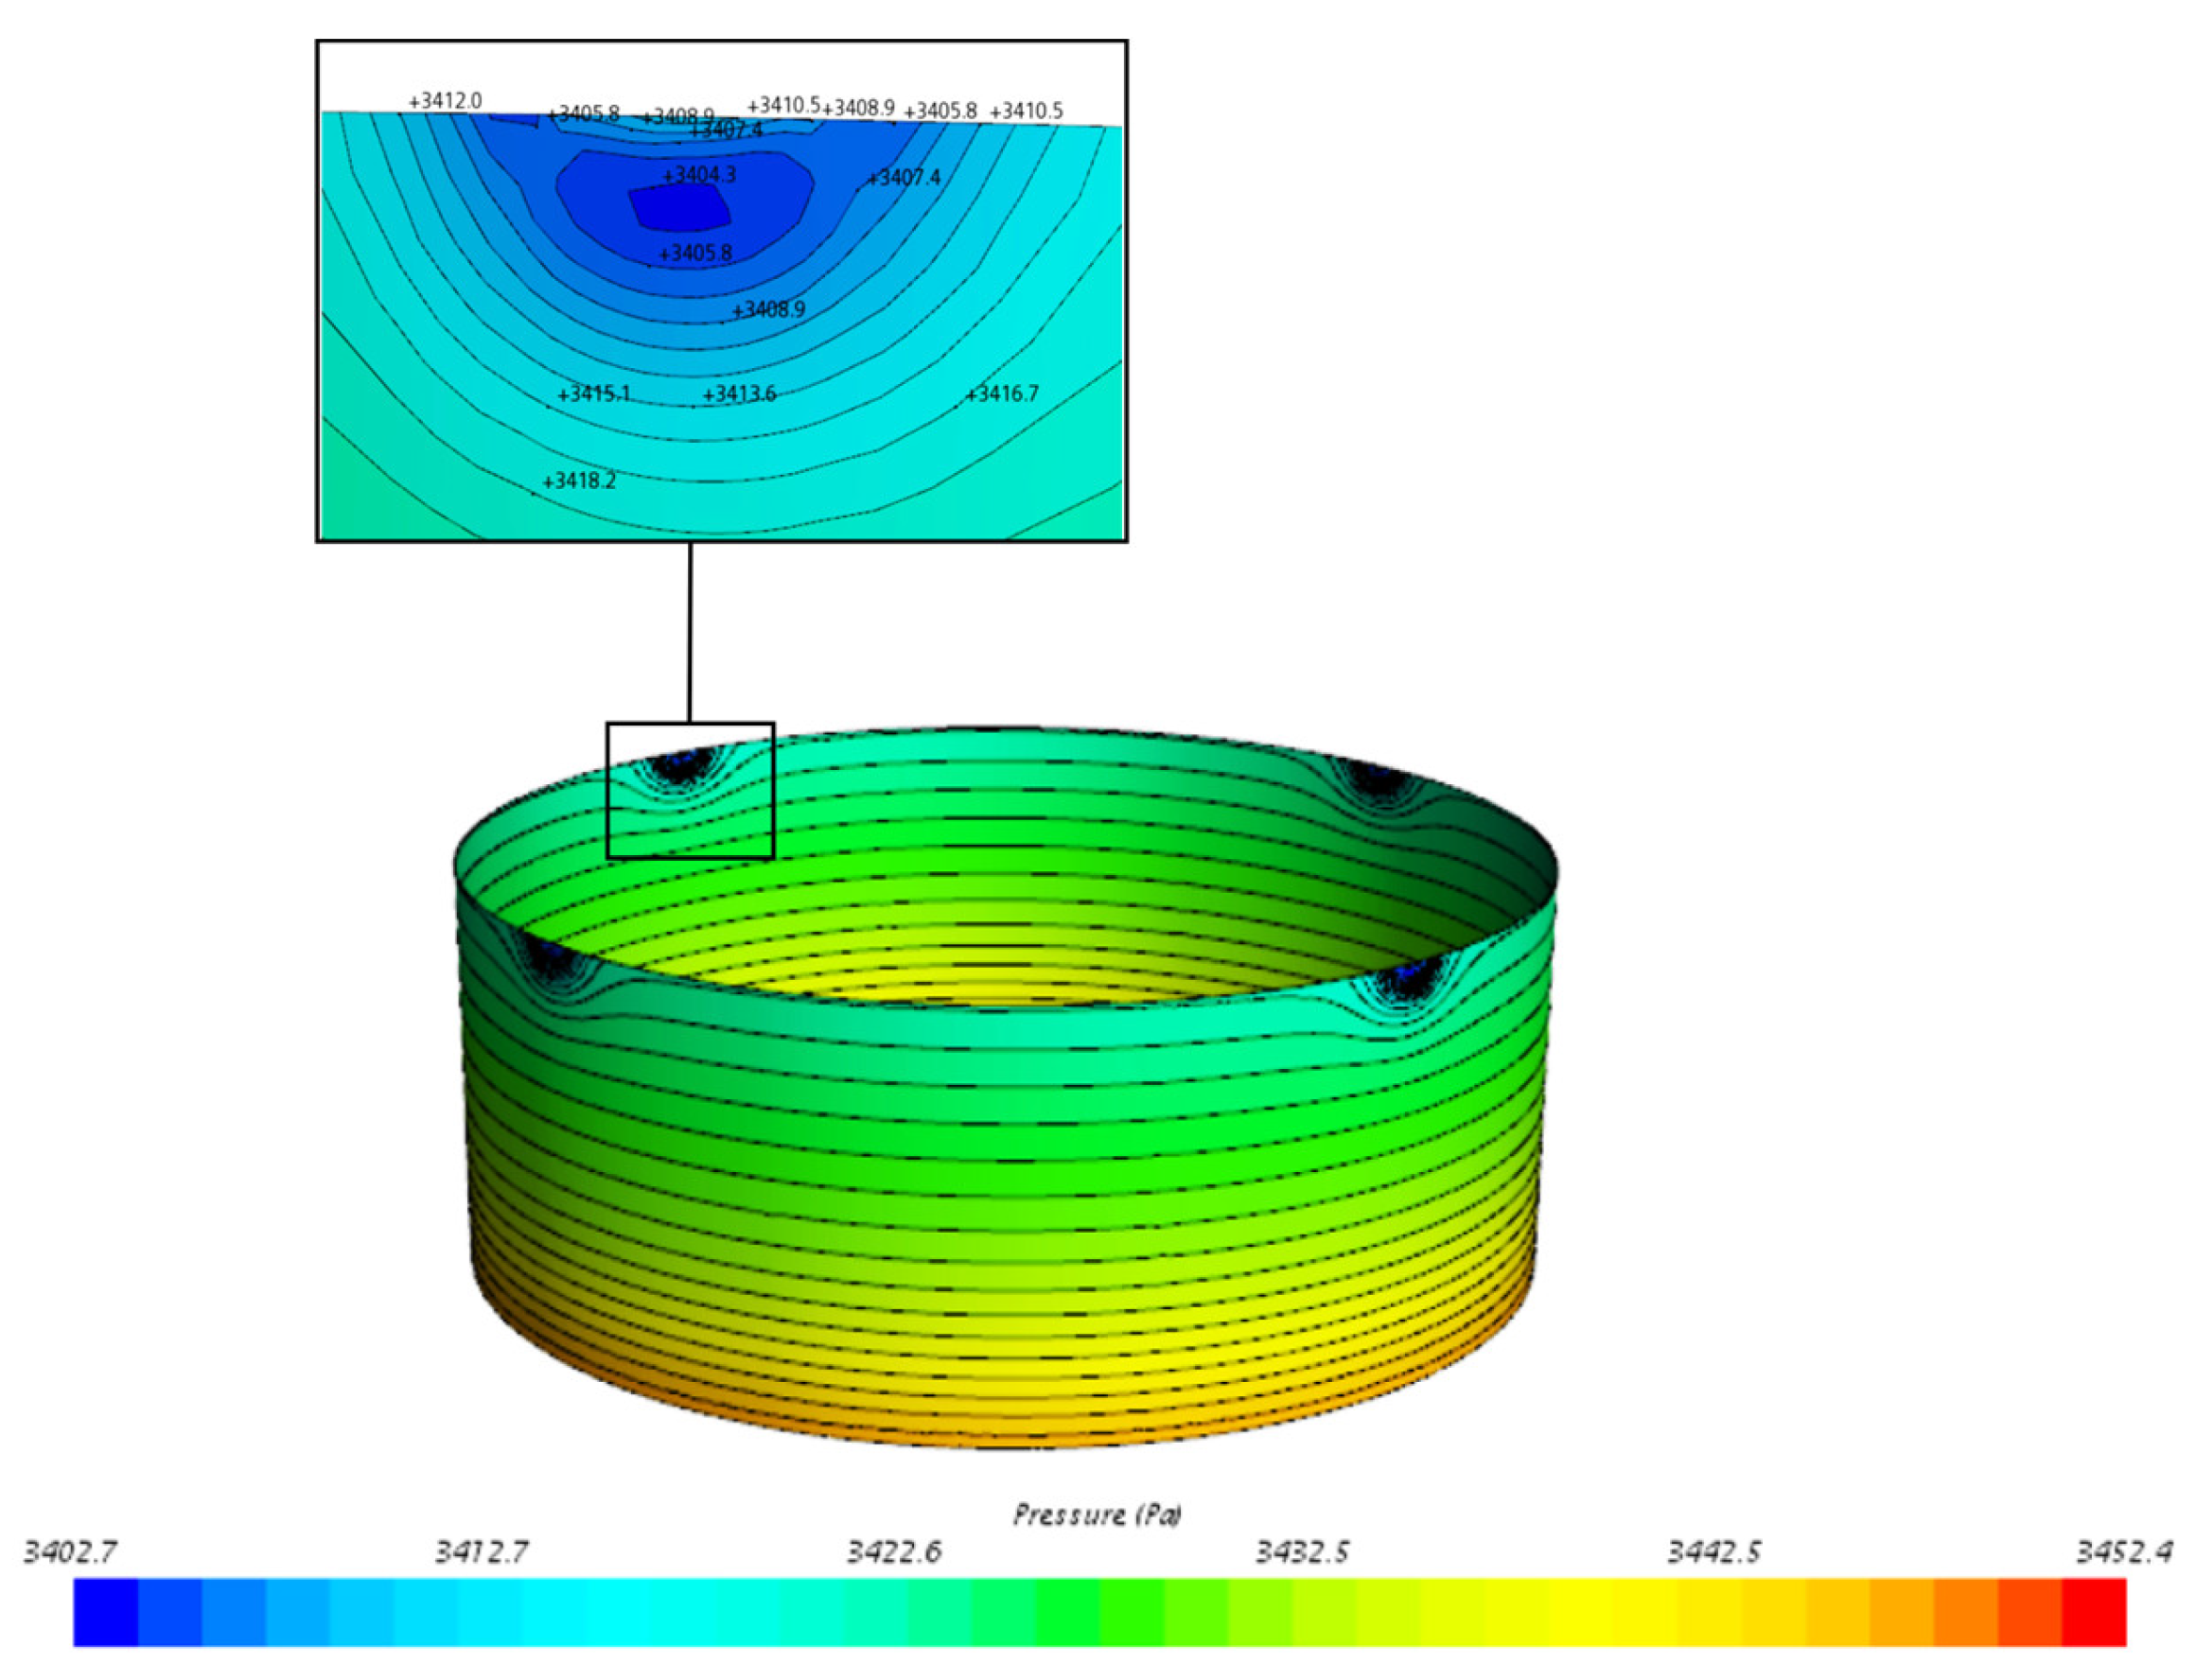
3.1.3. Pressure Distribution

The pressure difference between the inside and outside of the annular gap (rim) formed between the floating roof and the tank wall in the internal storage tank is the main cause of oil and gas leakage. External pressure is mainly influenced by factors such as wind speed, while internal pressure is primarily affected by changes in vapor pressure.
The velocity distribution and pressure distribution inside the storage tank are shown in Figure 8. From the diagram, it can be seen that the internal pressure varies between 3.452 kPa and 3.402 kPa, indicating that the pressure distribution inside the tank is in a very stable state.

3.1.4. Evaluation of Explosion Stability Caused by Oil Vapor inside Oil Tank

The volume ratio (or mass ratio) of vapor inside the oil storage tank relative to the air in the tank can be used to quantitatively estimate its safety. Representative standards that can define this safety are the lower explosive limit (LEL) and upper explosive limit (UEL), which are defined as follows.
Firstly, the LEL refers to the minimum concentration of a specific combustible gas in the air that can cause combustion. The LEL is a numerical value representing the volume ratio of explosive gas in the air. If the concentration is below the LEL, combustion will not occur. Secondly, the UEL refers to the maximum concentration of a specific combustible gas in the air that can cause combustion. The UEL is also a numerical value representing the volume ratio of explosive gas in the air. If the concentration exceeds the UEL, combustion becomes more likely to occur.
The flammable range here refers to the area between the LEL and UEL, within which a flame can form and an explosion may occur. Generally, the relationship between the volume fraction (%) and mass fraction of vapor is as follows:
M F h = ρ h · V F h ρ h · V F h + ρ a i r · 1 V F h
where MFh: mass fraction of n-hexane; VFh: volume fraction of n-hexane; Rhoh: density of n-hexane [3.65 kg/m3]; Rhoair: density of air [1.23 kg/m3].
The condition that the LEL is met inside the storage tank is a very important factor for safety and other aspects. The UEL and LEL for gasoline and n-hexane are defined as shown in the table below. Generally, the lower/upper explosive limits defined by volume fraction are converted to mass fraction, as shown in Table 5.
Figure 9 shows the measurement locations of mass fractions in the vertical cross-section. Figure 10 shows the mass fraction of gasoline vapor at five positions in the vertical direction (height direction of the tank) inside the storage tank. From the figure, it can be seen that the horizontal axis represents the starting point of the mixed gas (oil vapor + air) part in the vertical direction inside the storage tank, which is 7 m. This means that the region from the bottom of the oil storage tank (y = 0 m) to the floating roof (y = 7 m) is filled with liquid oil, while the region from y = 7 m to y = 14.7 m is filled with mixed gas. From the figure, it can be seen that from the floating roof to the 3 m position, that is, the entire storage tank from 10.5 m above the ground to the roof, the mass fraction of gasoline vapor is below the LEL of 0.0530.

3.2. Behavior Characteristics of Oil Vapor in Tanks at Different Float Heights

In order to confirm the effect of the change in floating roof height on the diffusion pattern of oil vapor in the air in the mixed gas area, we will analyze the following four cases. As shown in Table 6

3.2.1. Gasoline Vapor Behavior Characteristics of CASE 1

In order to predict the impact of the floating roof operation on the thermal and material properties of gasoline vapor, the height of the floating roof in CASE 1 is 11 m from the ground; thus, the mixed gas area of oil vapor and air inside the storage tank is 3 m. The qualitative results of the behavior characteristics of oil vapor inside the storage tank in CASE 1 are almost similar to the basic model CASE 3. Therefore, results such as mass fraction in CASE 1 will be shown to be the same as those in CASE 3, but the differences in UEL and LEL under the perspective of mass fraction at the y position will be compared with CASE 3.
Figure 11, Figure 12, Figure 13 and Figure 14 show the distribution of gasoline vapor mass fraction in the x-z cross-section as well as at the wall at different vertical positions (y = 11 m, 12.5 m, 14 m). It can be observed that as the mixed gas region approaches the exhaust vents located at the top cover, the mass fraction gradually decreases, but the concentration of gasoline vapor is relatively high around the five exhaust vents. This can be seen more clearly around the exhaust vents from Figure 12, Figure 13 and Figure 14, as the mixed gas region is much narrower than other regions, causing the gasoline vapor entering the mixed gas region to be expelled into the atmosphere due to the relatively low pressure at the exhaust vents. Based on these results, it is considered that CASE 1, with a mixed gas region height of 3 m, is not suitable in terms of the important explosion safety criteria of LEL and UEL.

3.2.2. Gasoline Vapor Behavior Characteristics of CASE 2

In CASE 2, the height of the floating roof is 9 m from the ground; thus, the analysis region is 5 m. In this study, we investigated the behavior characteristics of oil vapor in the mixed gas region under different oil-filling levels using numerical methods. However, from a qualitative perspective, the differences compared to other CASEs are not significant. The differences are minimal. Figure 15 below shows the distribution of the overall mass fraction, illustrating the distribution on the tank wall. The figure clearly shows the stratified accumulation of oil vapor inside the tank.
Figure 16, Figure 17 and Figure 18 show the mass fraction of gasoline vapor in the x-z cross-section at three different vertical heights (y = 9 m, 11.5 m, 14 m). From the figures, it can be seen that this model exhibits the same characteristics as the other models, especially showing a symmetrical distribution at the center of the cross-section.

3.2.3. Gasoline Vapor Behavior Characteristics of CASE 4

CASE 4 refers to the state where the floating roof height is 5 m and the mixed gas region height is 9 m.
Figure 19, Figure 20, Figure 21 and Figure 22 show the distribution of gasoline vapor in the x-z cross-section as well as at the wall for CASE 4, corresponding to y = 5 m, 9.5 m, and 14 m, respectively. As previously mentioned, from a qualitative perspective, such as the trend in mass distribution, there is no significant difference compared to other CASEs.

3.3. Behavior of n-Hexane in the Benchmark Model

The oil stored in storage tanks is usually gasoline and n-hexane. Their chemical and physical properties are very similar, but there is a significant difference in the diffusion coefficient of oil vapor in the air. The diffusion coefficient of n-hexane is about 10 times higher than that of gasoline. This difference in chemical properties also affects the behavior characteristics of oil vapor inside the storage tank. Therefore, this paper aims to study the impact of changes in working fluids on the thermal and mass transfer phenomena of the mixed gas inside the storage tank.
Figure 23 shows the mass fraction of n-hexane vapor on the tank wall. Figure 24, Figure 25 and Figure 26 show the distribution of n-hexane vapor in the x-z sections of the standard model, corresponding to y = 7 m, 10.5 m, and 14 m, respectively.

3.4. Prediction of (Gasoline) UEL and LEL by Floating Roof Height

The storage tank contains liquid oil products, which evaporate inside the tank due to various physical and chemical factors, forming oil vapor. Therefore, in this study, we assume a 1 cm gap between the tank wall and the internal floating roof, allowing oil vapor to diffuse into the air-filled space above the floating roof. This helps predict the behavior characteristics of the mixed gas (air + gasoline vapor) in the upper region of the storage tank.
Based on the definitions of the lower explosive limit (LEL) and upper explosive limit (UEL), we predict the LEL and UEL of gasoline from the perspective of mass fraction to assess the explosion potential and stability inside the tank.
In this study, the working fluid used is gasoline, and the mass fractions corresponding to the LEL and UEL for gasoline vapor are 0.0530 and 0.247, respectively.
As shown in Figure 27, in most of the mixed gas region (y = 11 m ~ 14.7 m), the mass fraction of gasoline vapor exceeds the LEL, indicating a relatively high possibility of explosion. Particularly in the vertical direction below the exhaust vent located at the center of the roof, the mass fraction is close to 0.3.
However, as the height of the floating roof decreases (with a reduction in the amount of liquid gasoline), the vapor mass fraction in the mixed gas region of the tank gradually decreases. The results indicate a distribution below the lower explosive limit (LEL) along the y-axis height. This is clearly shown in Figure 28 and Figure 29. In other words, when the amount of gasoline is less than half of the tank’s capacity, the likelihood of an explosion caused by vapor is significantly reduced. It is evident that the five vents installed on the roof of the storage tank contribute to ensuring its stability.

4. Conclusions

In this paper, we developed a numerical analysis method to determine the behavior characteristics of oil vapor in an internal floating roof tank (IFRT) under steady-state conditions, caused by the evaporation and diffusion of oil. To predict the behavior characteristics of oil vapor diffusion into the air within the mixed gas region of the storage tank, we adopted CFD techniques that simultaneously solve the continuity, momentum, energy, and chemical species equations, based on the fundamental assumptions of three-dimensional, turbulent, steady-state, and incompressible flow. Through this study, we obtained the following results:
  • Impact of Floating Roof Height: Based on numerical simulations, the significant impact of floating roof height on the diffusion phenomenon of oil vapor in IFRT was confirmed. The simulation results showed that the lower the floating roof height, the lower the oil vapor mass fraction in the mixed gas region, with higher oil vapor mass fractions near the vent locations.
  • Vapor Diffusion Characteristics: In the internal floating roof tank, the evaporated oil vapor primarily diffuses horizontally under the influence of gravity and exhibits a distinct vertical stratification characteristic. This characteristic is particularly evident near the vents, indicating that the vent locations significantly impact the diffusion of oil vapor.
  • Tank Stability: By predicting the impact of floating roof height on oil vapor behavior, the study demonstrated the influence of the amount of oil inside the tank on the stability of the tank. Changes in floating roof height and the amount of oil inside the tank directly affect the diffusion and evaporation processes of oil vapor, thereby impacting the overall stability of the tank.

Author Contributions

Conceptualization, J.-C.L. and S.-D.Z.; methodology, S.-W.D.; software, X.-H.K.; validation, L.-C.H. and G.C.; formal analysis, H.X.; investigation, J.-C.L.; resources, M.L.; data curation, S.-W.D.; writing—original draft preparation, H.X.; writing—review and editing, S.-D.Z.; visualization, X.-H.K.; supervision, M.L.; project administration, J.-C.L. and M.L.; funding acquisition, L.-C.H. All authors have read and agreed to the published version of the manuscript.

Funding

This research was funded by the “Hundred Outstanding Talents” Support Program of Jining University, a provincial-level key project in the field of natural sciences, grant number 2023ZYRC23 and Reform and practice of innovative education system applied in “Multi-dimensional” Inland ship and ocean engineering specialty in local undergraduate university, grant number Z2023085.

Data Availability Statement

The data that supports the findings of this study are available within the article.

Conflicts of Interest

The authors declare no conflicts of interest.

References

  1. Karavaichenko, M.G.; Fathiev, N.M. Natural ventilation of gas space in reservoir with internal floating roof. Записки Гoрнoгo Института 2018, 234, 637–642. [Google Scholar]
  2. Pouyakian, M.; Jafari, M.J.; Laal, F.; Nourai, F.; Zarei, E. A comprehensive approach to analyze the risk of floating roof storage tanks. Process. Saf. Environ. Prot. 2020, 146, 811–836. [Google Scholar] [CrossRef]
  3. Wu, D.; Chen, Z. Quantitative risk assessment of fire accidents of large-scale oil tanks triggered by lightning. Eng. Fail. Anal. 2016, 63, 172–181. [Google Scholar] [CrossRef]
  4. Liu, Y.; Fu, Z.; Jiang, A.; Liu, Q.; Liu, B. FDTD analysis of the effects of indirect lightning on large floating roof oil tanks. Electr. Power Syst. Res. 2016, 139, 81–86. [Google Scholar] [CrossRef]
  5. Tauseef, S.; Abbasi, T.; Pompapathi, V.; Abbasi, S. Case studies of 28 major accidents of fires/explosions in storage tank farms in the backdrop of available codes/standards/models for safely configuring such tank farms. Process. Saf. Environ. Prot. 2018, 120, 331–338. [Google Scholar] [CrossRef]
  6. Huang, W.; Huang, F.; Fang, J.; Fu, L. A calculation method for the numerical simulation of oil products evaporation and vapor diffusion in an internal floating-roof tank under the unsteady operating state. J. Pet. Sci. Eng. 2020, 188, 106867. [Google Scholar] [CrossRef]
  7. Saufi, A.; Calabria, R.; Chiariello, F.; Frassoldati, A.; Cuoci, A.; Faravelli, T.; Massoli, P. An experimental and CFD modeling study of suspended droplets evaporation in buoyancy driven convection. Chem. Eng. J. 2019, 375, 122006. [Google Scholar] [CrossRef]
  8. Afshar-Mohajer, N.; Fox, M.A.; Koehler, K. The human health risk estimation of inhaled oil spill emissions with and without adding dispersant. Sci. Total. Environ. 2018, 654, 924–932. [Google Scholar] [CrossRef]
  9. Parvini, M.; Gharagouzlou, E. Gas leakage consequence modeling for buried gas pipelines. J. Loss Prev. Process. Ind. 2015, 37, 110–118. [Google Scholar] [CrossRef]
  10. Siddiqui, M.; Jayanti, S.; Swaminathan, T. CFD analysis of dense gas dispersion in indoor environment for risk assessment and risk mitigation. J. Hazard. Mater. 2012, 209–210, 177–185. [Google Scholar] [CrossRef]
  11. Giannissi, S.; Hoyes, J.; Chernyavskiy, B.; Hooker, P.; Hall, J.; Venetsanos, A.; Molkov, V. CFD benchmark on hydrogen release and dispersion in a ventilated enclosure: Passive ventilation and the role of an external wind. Int. J. Hydrogen Energy 2015, 40, 6465–6477. [Google Scholar] [CrossRef]
  12. Giannissi, S.; Shentsov, V.; Melideo, D.; Cariteau, B.; Baraldi, D.; Venetsanos, A.; Molkov, V. CFD benchmark on hydrogen release and dispersion in confined, naturally ventilated space with one vent. Int. J. Hydrogen Energy 2015, 40, 2415–2429. [Google Scholar] [CrossRef]
  13. Li, X.; Chen, G.; Zhu, H.; Xu, C. Gas dispersion and deflagration above sea from subsea release and its impact on offshore platform. Ocean Eng. 2018, 163, 157–168. [Google Scholar] [CrossRef]
  14. Stamoudis, N.; Chryssakis, C.; Kaiktsis, L. A two-component heavy fuel oil evaporation model for CFD studies in marine Diesel engines. Fuel 2014, 115, 145–153. [Google Scholar] [CrossRef]
  15. Hassanvand, A.; Hashemabadi, S.; Bayat, M. Evaluation of gasoline evaporation during the tank splash loading by CFD techniques. Int. Commun. Heat Mass Transf. 2010, 37, 907–913. [Google Scholar] [CrossRef]
  16. Galeev, A.; Salin, A.; Ponikarov, S. Numerical simulation of evaporation of volatile liquids. J. Loss Prev. Process. Ind. 2015, 38, 39–49. [Google Scholar] [CrossRef]
  17. Huang, W.; Fang, J.; Li, F.; Ji, H.; Wang, H. Numerical simulation and applications of equivalent film thickness in oil evaporation loss evaluation of internal floating-roof tank. Process. Saf. Environ. Prot. 2019, 129, 74–88. [Google Scholar] [CrossRef]
  18. Kim, E.; Park, J.; Cho, J.H.; Moon, I. Simulation of hydrogen leak and explosion for the safety design of hydrogen fueling station in Korea. Int. J. Hydrogen Energy 2013, 38, 1737–1743. [Google Scholar] [CrossRef]
  19. Hata, H.; Yamada, H.; Kokuryo, K.; Okada, M.; Funakubo, C.; Tonokura, K. Estimation model for evaporative emissions from gasoline vehicles based on thermodynamics. Sci. Total. Environ. 2018, 618, 1685–1691. [Google Scholar] [CrossRef]
  20. Hai-Juan PA, N.; Jun-Bo ZH, O.U.; Liang-Chao CH, E.N.; Jian-Feng YA, N.G.; Xin-Yuan, L.U. Study on leakage and diffusion law of “large breathing” loss of gasoline storage tank based on PHAST. In Proceedings of the 2018 International Conference on Energy Development and Environmental Protection (EDEP 2018), Nanjing, China, 17–19 August 2018; Atlantis Press: Amsterdam, The Netherlands, 2018; pp. 134–140. [Google Scholar]
  21. Zhang, G.; Huang, F.; Huang, W.; Zhu, Z.; Fang, J.; Ji, H.; Fu, L.; Sun, X. Analysis of Influence of Floating-Deck Height on Oil-Vapor Migration and Emission of Internal Floating-Roof Tank Based on Numerical Simulation and Wind-Tunnel Experiment. Processes 2020, 8, 1026. [Google Scholar] [CrossRef]
  22. Hou, Y.; Chen, J.; Zhu, L.; Sun, D.; Li, J.; Jie, P. Numerical simulation of gasoline evaporation in refueling process. Adv. Mech. Eng. 2017, 9, 1687814017714978. [Google Scholar] [CrossRef]
  23. Sun, W.; Cheng, Q.; Zheng, A.; Gan, Y.; Gao, W.; Liu, Y. Heat flow coupling characteristics analysis and heating effect evaluation study of crude oil in the storage tank different structure coil heating processes. Int. J. Heat Mass Transf. 2018, 127, 89–101. [Google Scholar] [CrossRef]
  24. Du, L.; Zhao, W.; Yan, H.; Liu, D. Stability and Strength Analysis of Internal Floating Roof Atmospheric Tank. In Proceedings of the IOP Conference Series: Materials Science and Engineering, Kazimierz Dolny, Poland, 21–23 November 2019; Volume 592. [Google Scholar]
  25. Pasley, H.; Clark, C. Computational fluid dynamics study of flow around floating-roof oil storage tanks. J. Wind Eng. Ind. Aerodyn. 2000, 86, 37–54. [Google Scholar] [CrossRef]
  26. Zhao, C.L.; Huang, W.Q.; Zhong, J.; Wang, W.J.; Xu, X.Y.; Wang, Y.X. Numerical simulation of oil vapor leakage from external floating-roof tank. CIESC J. 2014, 65, 4203–4209. [Google Scholar]
  27. Uematsu, Y.; Koo, C.; Yasunaga, J. Design wind force coefficients for open-topped oil storage tanks focusing on the wind-induced buckling. J. Wind Eng. Ind. Aerodyn. 2014, 130, 16–29. [Google Scholar] [CrossRef]
  28. Uematsu, Y.; Yasunaga, J.; Koo, C. Design wind loads for open-topped storage tanks in various arrangements. J. Wind Eng. Ind. Aerodyn. 2015, 138, 77–86. [Google Scholar] [CrossRef]
  29. Hassanvand, A.; Hashemabadi, S.H. Direct numerical simulation of interphase mass transfer in gas-liquid multiphase systems. Int. Commun. Heat Mass Transf. 2011, 7, 943–950. [Google Scholar] [CrossRef]
  30. Hao, Q.F.; Huang, W.Q.; Jing, H.B. Numerical simulation of oil vapor leakage and diffusion from different pores of external floating-roof tank. Chem. Ind. Eng. Prog. 2019, 38, 1226–1235. [Google Scholar]
Figure 1. Model meshing.
Energies 17 04336 g001
Figure 2. Mesh independence verification.
Energies 17 04336 g002
Figure 3. Gasoline vapor mass distribution on tank wall (basic model).
Energies 17 04336 g003
Figure 4. Gasoline vapor mass fraction distribution at the tank y = 7 m (basic model).
Energies 17 04336 g004
Figure 5. Gasoline vapor mass fraction distribution at the tank y = 10.5 m (basic model).
Energies 17 04336 g005
Figure 6. Gasoline vapor mass fraction distribution at the tank y = 14 m (basic model).
Energies 17 04336 g006
Figure 7. Velocity distribution of mixed gas on the xy plane of the gas tank (basic model).
Energies 17 04336 g007
Figure 8. Pressure distribution near the inner wall of the tank (basic type).
Energies 17 04336 g008
Figure 9. Vertical profile mass fraction measurement position.
Energies 17 04336 g009
Figure 10. Gasoline vapor mass fraction at points 1–5 in the tank (basic type).
Energies 17 04336 g010
Figure 11. Gasoline vapor mass fraction distribution on the wall of the CASE 1 tank.
Energies 17 04336 g011
Figure 12. Gasoline vapor mass fraction distribution when the floating deck height is 11 m (y = 11 m).
Energies 17 04336 g012
Figure 13. Gasoline vapor mass fraction distribution when the floating deck height is 11 m (y = 12.5 m).
Energies 17 04336 g013
Figure 14. Gasoline vapor mass fraction distribution when the floating deck height is 11 m (y = 14 m).
Energies 17 04336 g014
Figure 15. Gasoline vapor mass fraction distribution on the wall of the CASE 2 tank.
Energies 17 04336 g015
Figure 16. Gasoline vapor mass fraction distribution when the floating deck height is 9 m (y = 9 m).
Energies 17 04336 g016
Figure 17. Gasoline vapor mass fraction distribution when the floating deck height is 9 m (y = 11.5 m).
Energies 17 04336 g017
Figure 18. Gasoline vapor mass fraction distribution when the floating deck height is 9 m (y = 14 m).
Energies 17 04336 g018
Figure 19. Gasoline vapor mass fraction distribution around the tank wall in CASE 4.
Energies 17 04336 g019
Figure 20. Gasoline vapor mass fraction distribution when the floating deck height is 5 m (y = 5 m).
Energies 17 04336 g020
Figure 21. Gasoline vapor mass fraction distribution when the floating deck height is 5 m (y = 9.5 m).
Energies 17 04336 g021
Figure 22. Gasoline vapor mass fraction distribution when the floating deck height is 5 m (y = 14 m).
Energies 17 04336 g022
Figure 23. Mass fraction distribution of n-hexane vapor at the tank wall (basic model).
Energies 17 04336 g023
Figure 24. Distribution of n-hexane vapor mass fraction when the floating deck height is 7 m (basic model).
Energies 17 04336 g024
Figure 25. Distribution of n-hexane vapor mass fraction when the floating deck height is 10.5 m (basic model).
Energies 17 04336 g025
Figure 26. Distribution of n-hexane vapor mass fraction when the floating deck height is 14 m (basic model).
Energies 17 04336 g026
Figure 27. The mass fraction of gasoline vapor at points 1–5 when the floating deck height is 11 m.
Energies 17 04336 g027
Figure 28. The mass fraction of gasoline vapor at points 1–5 when the floating deck height is 9 m.
Energies 17 04336 g028
Figure 29. The mass fraction of gasoline vapor at points 1–5 when the floating deck height is 5 m.
Energies 17 04336 g029
Table 1. Mesh conditions.
Mesh TpyePolyhedral Mesher
Base Size400 mm
Number of Prism Layer7
Prism Layer Stretching1.2
Prism Layer Thickness20%
Volumetric Relative size30
Volumetric Controls120 mm
Number of Volume Mesh Cells530,000
Table 2. Mesh quantity modeling.
Number of Model12345
Number of Meshes443,776496,334523,536657,442704,625
Table 3. Simulate the required physical properties.
BoundaryCondition
SpaceThere-dimensional
FluidMulti-component gas
Flow solverSegregated
Equation of stateConstant Density
Viscous regimeTurbulence
Reynolds-averaged turbulenceRealizable k-ε
Reynolds Number5.5 × 10⁶
Prandtl Number0.9
Schmidt Number1
Table 4. Boundary condition.
Locations/StatesParametersComments
Inlet (Air)Speed entrance2.5 m/s, 4.5 m/s, 6.5 m/sVelocity Inlet
InletGap between the floating deck and tank wall 3.88138 × 10 7 m/sVelocity
OutletFree exit101.325 kPaPressure Outlet
WallTank bottom, wall, floating deck0No-slip
Mass fractionsaturated concentration of N-hexane0.3gap of the floating deck
AmbientOutside of the tank303 KTemperature
Table 5. UEL and LEL of gasoline and n-hexane vapor.
LELUEL
[vol %][Mass Fraction][vol %][Mass Fraction]
Gasoline1.40.05307.60.2447
n-Hexane1.20.03487.60.2435
Table 6. Classification for the four oil storage tank cases.
Height of Floating DeckHeight of Mixed GasComputational Domain
CASE 1113.73.7
CASE 295.75.7
CASE 3 [Basic Model]77.77.7
CASE 459.79.7
Disclaimer/Publisher’s Note: The statements, opinions and data contained in all publications are solely those of the individual author(s) and contributor(s) and not of MDPI and/or the editor(s). MDPI and/or the editor(s) disclaim responsibility for any injury to people or property resulting from any ideas, methods, instructions or products referred to in the content.

