
Decision-Making Model Supporting Eco-Innovation in Energy Production Based on Quality, Cost and Life Cycle Assessment (LCA)


Abstract
1. Introduction
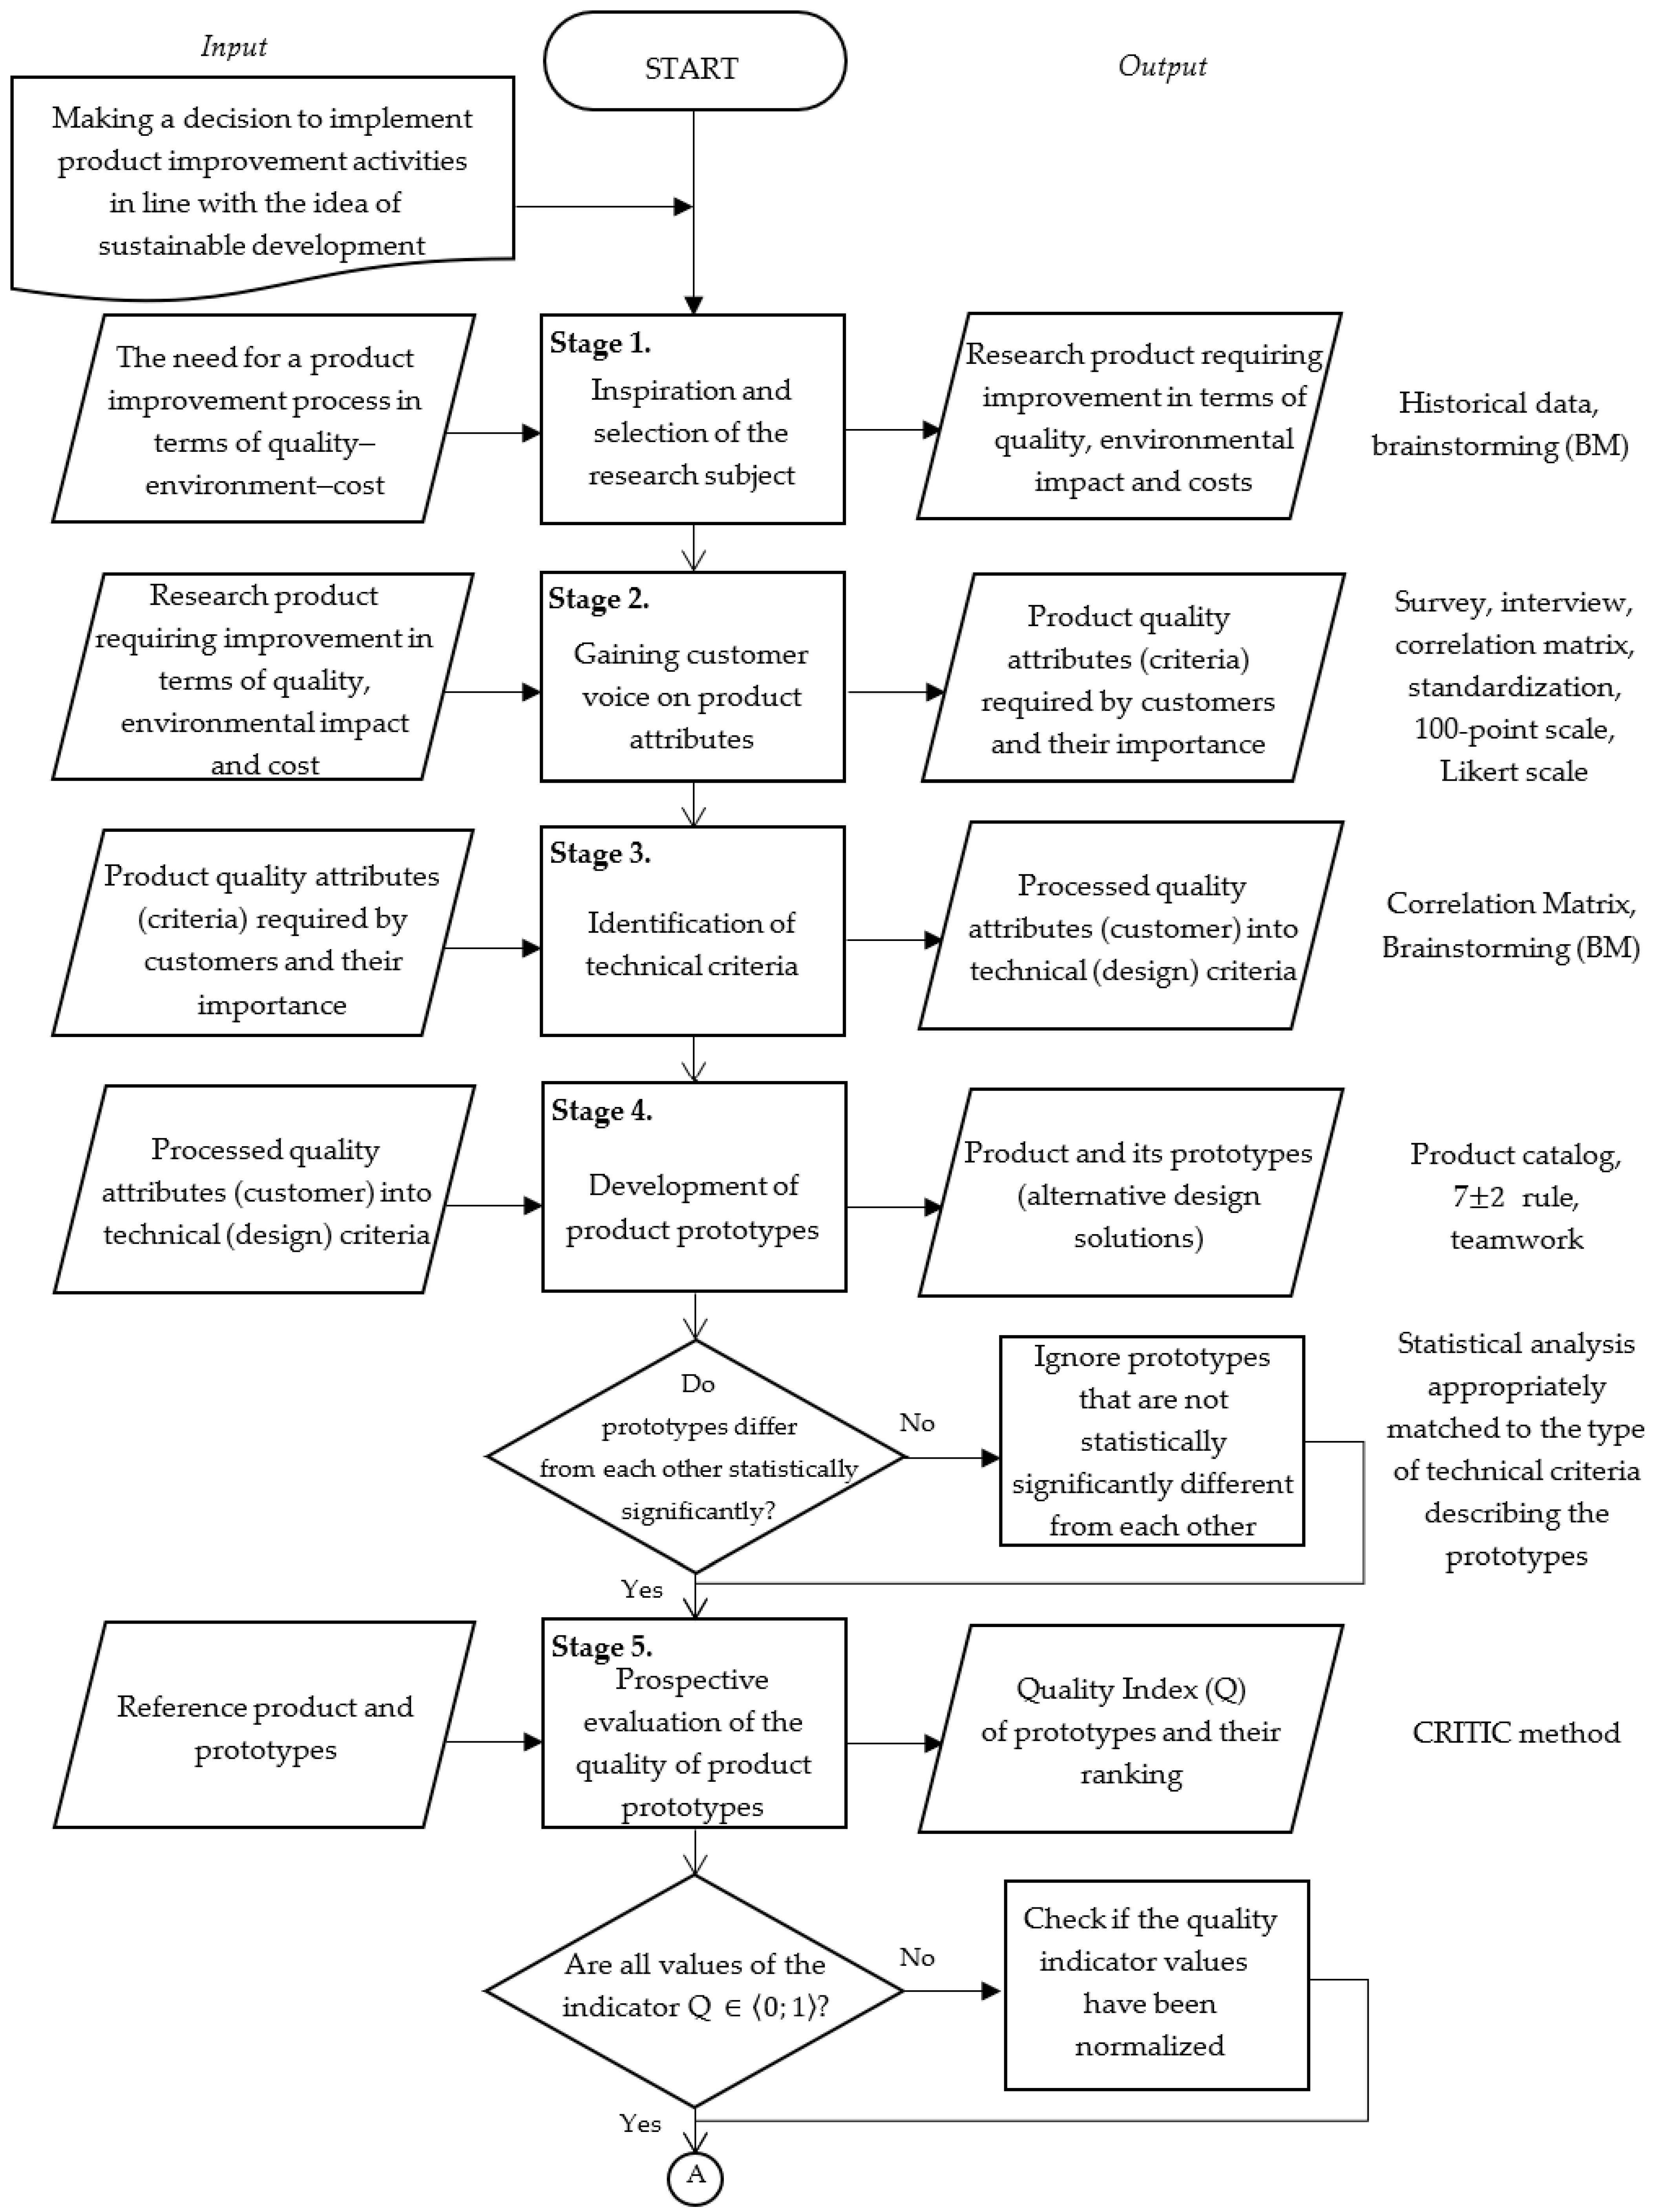
2. Development of Model
- Cost—it is assumed that it is the cost incurred to cover the quality of the prototype, taking into account its environmental impact in the life cycle (LCA), including the cost of investment in the product or the cost of purchasing the final product by the customer [25].
3. Illustration and Test of Model
- Module efficiency (%)—the ability of the installation to convert solar radiation into electrical energy;
- Nominal maximum power (W)—power achieved under test conditions, achieved in short periods of time during use;
- Open circuit voltage (V)—the voltage of the current that occurs when the PV is not connected to any load;
- Voltage at the maximum power point (V)—working voltage related to the maximum power;
- Maximum static load, front (Pa)—load resulting from atmospheric factors, for example, snow, wind;
- Maximum static load, rear (Pa)—load resulting from atmospheric factors, e.g., wind;
- Normal cell operating temperature (°C)—the operating temperature of the photovoltaic panel during normal use;
- Number of cells (pcs.)—the number of cells installed in one photovoltaic panel;
- length × width × height (mm)—the size of the photovoltaic panel;
- Colour—Colour of the photovoltaic panel and its frame;
- mass (kg)—total weight;
- Current at the maximum operating point (A)—operating current;
- Open circuit voltage (V)—voltage of the current when the panel is not connected to any load;
- Short circuit current (A)—current intensity during maximum load.
4. Discussion
- the possibility of improving product quality with the customer’s voice (VoC) in mind;
- prospective assessment of the environmental burden of the product based on the environmental assessment of the current (reference) product and anticipated production changes;
- interpretation of the direction of product development according to the simultaneous consideration of achieving the product quality expected by customers and ensuring an environmentally friendly product;
- estimation of the profitability of investment in product development at the prototyping stage, taking into account not only financial aspects (cost) but also the quality of the product and its impact on the environment in the life cycle (LCA).
- supporting decisions in the early stages of product development, including during its improvement;
- streamlining the company’s preparatory activities for investments related to product development in terms of quality, environment and cost;
- ensuring the ranking of production solutions and searching for alternative production solutions towards sustainable product development;
- reducing the waste of company resources as a result of assistance in well-considered development decisions taking into account key criteria of sustainable development.
5. Conclusions
Author Contributions
Funding
Data Availability Statement
Conflicts of Interest
Appendix A

| Criteria | Ref. | P1 | P2 | P3 | P4 | P5 | P6 | P7 | P8 | P9 |
|---|---|---|---|---|---|---|---|---|---|---|
| C1 | 0.64 | 0.25 | 0.89 | 0.69 | 0.00 | 0.44 | 0.58 | 0.03 | 0.81 | 1.00 |
| C2 | 0.25 | 0.50 | 0.00 | 0.75 | 0.50 | 0.25 | 0.00 | 1.00 | 0.75 | 1.00 |
| C3 | 1.00 | 0.81 | 0.24 | 0.90 | 0.10 | 0.00 | 1.00 | 0.81 | 0.14 | 0.29 |
| C4 | 0.62 | 0.81 | 0.55 | 0.92 | 0.36 | 1.00 | 0.00 | 0.08 | 0.16 | 0.58 |
| C5 | 0.40 | 0.60 | 0.80 | 1.00 | 0.20 | 0.00 | 0.80 | 0.40 | 0.20 | 0.80 |
| C6 | 0.40 | 0.60 | 0.80 | 1.00 | 0.20 | 0.00 | 0.80 | 0.40 | 0.20 | 0.80 |
| C7 | 0.60 | 0.80 | 1.00 | 0.00 | 0.20 | 0.40 | 0.80 | 1.00 | 0.40 | 0.80 |
| C8 | 0.50 | 0.67 | 0.83 | 1.00 | 0.33 | 0.17 | 0.00 | 0.50 | 1.00 | 0.67 |
| C9 | 1.00 | 0.67 | 0.00 | 0.33 | 1.00 | 0.67 | 0.67 | 0.00 | 1.00 | 0.33 |
| C10 | 1.00 | 1.00 | 1.00 | 0.50 | 0.50 | 0.50 | 0.00 | 0.00 | 0.00 | 1.00 |
| C11 | 0.57 | 0.71 | 0.57 | 0.86 | 0.29 | 0.43 | 1.00 | 0.71 | 0.57 | 0.00 |
| C12 | 0.04 | 0.05 | 0.07 | 0.02 | 0.08 | 0.03 | 0.06 | 0.00 | 1.00 | 0.11 |
| C13 | 1.00 | 0.90 | 0.68 | 0.93 | 0.30 | 0.00 | 0.61 | 0.14 | 0.10 | 0.64 |
| C14 | 0.86 | 0.72 | 0.95 | 0.84 | 1.00 | 0.82 | 0.47 | 0.34 | 0.00 | 0.44 |
| St. dev. | 0.31 | 0.25 | 0.37 | 0.35 | 0.31 | 0.33 | 0.39 | 0.37 | 0.39 | 0.33 |
| Product | Ref. | P1 | P2 | P3 | P4 | P5 | P6 | P7 | P8 | P9 |
|---|---|---|---|---|---|---|---|---|---|---|
| Ref. | 1.00 | 0.72 | 0.21 | 0.14 | 0.42 | 0.32 | 0.28 | −0.20 | −0.45 | −0.01 |
| P1 | 0.72 | 1.00 | 0.37 | 0.30 | 0.33 | 0.24 | 0.15 | 0.17 | −0.67 | 0.12 |
| P2 | 0.21 | 0.37 | 1.00 | 0.21 | −0.13 | 0.12 | 0.11 | −0.06 | −0.50 | 0.45 |
| P3 | 0.14 | 0.30 | 0.21 | 1.00 | −0.04 | −0.11 | 0.12 | 0.08 | −0.38 | 0.13 |
| P4 | 0.42 | 0.33 | −0.13 | −0.04 | 1.00 | 0.59 | −0.17 | −0.16 | −0.05 | −0.11 |
| P5 | 0.32 | 0.24 | 0.12 | −0.11 | 0.59 | 1.00 | −0.27 | −0.26 | −0.09 | −0.03 |
| P6 | 0.28 | 0.15 | 0.11 | 0.12 | −0.17 | −0.27 | 1.00 | 0.32 | −0.23 | −0.29 |
| P7 | −0.20 | 0.17 | −0.06 | 0.08 | −0.16 | −0.26 | 0.32 | 1.00 | −0.03 | 0.03 |
| P8 | −0.45 | −0.67 | −0.50 | −0.38 | −0.05 | −0.09 | −0.23 | −0.03 | 1.00 | −0.19 |
| P9 | −0.01 | 0.12 | 0.45 | 0.13 | −0.11 | −0.03 | −0.29 | 0.03 | −0.19 | 1.00 |
| Product | Ref. | P1 | P2 | P3 | P4 | P5 | P6 | P7 | P8 | P9 |
|---|---|---|---|---|---|---|---|---|---|---|
| Ref. | 0.00 | 0.28 | 0.79 | 0.86 | 0.58 | 0.68 | 0.72 | 1.20 | 1.45 | 1.01 |
| P1 | 0.28 | 0.00 | 0.63 | 0.70 | 0.67 | 0.76 | 0.85 | 0.83 | 1.67 | 0.88 |
| P2 | 0.79 | 0.63 | 0.00 | 0.79 | 1.13 | 0.88 | 0.89 | 1.06 | 1.50 | 0.55 |
| P3 | 0.86 | 0.70 | 0.79 | 0.00 | 1.04 | 1.11 | 0.88 | 0.92 | 1.38 | 0.87 |
| P4 | 0.58 | 0.67 | 1.13 | 1.04 | 0.00 | 0.41 | 1.17 | 1.16 | 1.05 | 1.11 |
| P5 | 0.68 | 0.76 | 0.88 | 1.11 | 0.41 | 0.00 | 1.27 | 1.26 | 1.09 | 1.03 |
| P6 | 0.72 | 0.85 | 0.89 | 0.88 | 1.17 | 1.27 | 0.00 | 0.68 | 1.23 | 1.29 |
| P7 | 1.20 | 0.83 | 1.06 | 0.92 | 1.16 | 1.26 | 0.68 | 0.00 | 1.03 | 0.97 |
| P8 | 1.45 | 1.67 | 1.50 | 1.38 | 1.05 | 1.09 | 1.23 | 1.03 | 0.00 | 1.19 |
| P9 | 1.01 | 0.88 | 0.55 | 0.87 | 1.11 | 1.03 | 1.29 | 0.97 | 1.19 | 0.00 |
| Product | Cost (PLN) | C |
|---|---|---|
| Ref. | 280.00 | 1.00 |
| P1 | 300.00 | 0.83 |
| P2 | 370.00 | 0.25 |
| P3 | 385.00 | 0.13 |
| P4 | 290.00 | 0.92 |
| P5 | 300.00 | 0.83 |
| P6 | 400.00 | 0.00 |
| P7 | 380.00 | 0.17 |
| P8 | 390.00 | 0.08 |
| P9 | 310.00 | 0.75 |
References
- Klemeš, J.J.; Varbanov, P.S.; Ocłoń, P.; Chin, H.H. Towards Efficient and Clean Process Integration: Utilisation of Renewable Resources and Energy-Saving Technologies. Energies 2019, 12, 4092. [Google Scholar] [CrossRef]
- Varun; Bhat, I.K.; Prakash, R. LCA of Renewable Energy for Electricity Generation Systems—A Review. Renew. Sustain. Energy Rev. 2009, 13, 1067–1073. [Google Scholar] [CrossRef]
- Singh, A.; Olsen, S.I.; Pant, D. Importance of Life Cycle Assessment of Renewable Energy Sources. In Life Cycle Assessment of Renewable Energy Sources; Springer: London, UK, 2013; pp. 1–11. [Google Scholar]
- Bleischwitz, R. Eco-Innovation—Putting the EU on the Path to a Resource and Energy Efficient Economy; Environment and Energy: Wupertal Institute for Climate; University Library of Munich: Munich, Germany, 2009. [Google Scholar]
- Dincer, I.; Rosen, M.A. A Worldwide Perspective on Energy, Environment and Sustainable Development. Int. J. Energy Res. 1998, 22, 1305–1321. [Google Scholar] [CrossRef]
- Siwiec, D.; Bednárová, L.; Pacana, A.; Zawada, M.; Rusko, M. Decision Support in the Selection of Fluorescent Penetrants for Industrial Non-Destructive Testing. Przemysł Chem. 2019, 1, 92–94. [Google Scholar] [CrossRef]
- Naqvi, S.R.; Jamshaid, S.; Naqvi, M.; Farooq, W.; Niazi, M.B.K.; Aman, Z.; Zubair, M.; Ali, M.; Shahbaz, M.; Inayat, A.; et al. Potential of Biomass for Bioenergy in Pakistan Based on Present Case and Future Perspectives. Renew. Sustain. Energy Rev. 2018, 81, 1247–1258. [Google Scholar] [CrossRef]
- Gürkan Aydin, S.; Özgen, A. Sustainable Jet Fuel Production: Using Pumpkin Seed Oil. TEM J. 2021, 1, 879–882. [Google Scholar] [CrossRef]
- Cao, H.; Zhang, J.; Luo, N.; Zhang, Z. Industrial Sustainable Development Level in China. Zb. Rad. Ekon. Fak. U Rijeci Časopis Za Ekon. Teor./Proc. Rij. Fac. Econ. J. Econ. Bus. 2015, 33, 181–205. [Google Scholar] [CrossRef]
- Van Thanh, N. Sustainable Energy Source Selection for Industrial Complex in Vietnam: A Fuzzy MCDM Approach. IEEE Access 2022, 10, 50692–50701. [Google Scholar] [CrossRef]
- Sobocińska, M.; Mazurek-Łopacińska, K.; Graczyk, A.; Kociszewski, K.; Krupowicz, J. Decision-Making Processes of Renewable Energy Consumers Compared to Other Categories of Ecological Products. Energies 2022, 15, 6272. [Google Scholar] [CrossRef]
- Stoffels, P.; Kaspar, J.; Baehre, D.; Vielhaber, M. Holistic Material Selection Approach for More Sustainable Products. Procedia Manuf. 2017, 8, 401–408. [Google Scholar] [CrossRef]
- Wang, C.-N.; Dang, T.-T.; Tibo, H.; Duong, D.-H. Assessing Renewable Energy Production Capabilities Using DEA Window and Fuzzy TOPSIS Model. Symmetry 2021, 13, 334. [Google Scholar] [CrossRef]
- Majid, S.; Zhang, X.; Khaskheli, M.B.; Hong, F.; King, P.J.H.; Shamsi, I.H. Eco-Efficiency, Environmental and Sustainable Innovation in Recycling Energy and Their Effect on Business Performance: Evidence from European SMEs. Sustainability 2023, 15, 9465. [Google Scholar] [CrossRef]
- Gkeka-Serpetsidaki, P.; Skiniti, G.; Tournaki, S.; Tsoutsos, T. A Review of the Sustainable Siting of Offshore Wind Farms. Sustainability 2024, 16, 6036. [Google Scholar] [CrossRef]
- Arnaoutakis, G.E.; Kocher-Oberlehner, G.; Katsaprakakis, D.A. Criteria-Based Model of Hybrid Photovoltaic–Wind Energy System with Micro-Compressed Air Energy Storage. Mathematics 2023, 11, 391. [Google Scholar] [CrossRef]
- Katsaprakakis, D.A.; Proka, A.; Zafirakis, D.; Damasiotis, M.; Kotsampopoulos, P.; Hatziargyriou, N.; Dakanali, E.; Arnaoutakis, G.; Xevgenos, D. Greek Islands’ Energy Transition: From Lighthouse Projects to the Emergence of Energy Communities. Energies 2022, 15, 5996. [Google Scholar] [CrossRef]
- Wang, S.; Su, D. Sustainable Product Innovation and Consumer Communication. Sustainability 2022, 14, 8395. [Google Scholar] [CrossRef]
- Relich, M. Knowledge Dissemination of Sustainable Product Development. Eur. Conf. Knowl. Manag. 2023, 24, 1106–1115. [Google Scholar] [CrossRef]
- Bucheli-Calvache, J.M.; Zuñiga-Collazos, A.; Osorio-Tinoco, F.; Cervantes-Rosas, M.d.l.Á. Proposal for an Eco-Innovation Concept for Small- and Medium-Sized Enterprises (SMEs). Sustainability 2023, 15, 10292. [Google Scholar] [CrossRef]
- Hansen, E.; Bush, R.J. Understanding Customer Quality Requirements. Ind. Mark. Manag. 1999, 28, 119–130. [Google Scholar] [CrossRef]
- Pacana, A.; Siwiec, D. Analysis of the Possibility of Used of the Quality Management Techniques with Non-Destructive Testing. Teh. Vjesn.-Tech. Gaz. 2021, 28, 45–51. [Google Scholar] [CrossRef]
- Proske, M.; Finkbeiner, M. Obsolescence in LCA–Methodological Challenges and Solution Approaches. Int. J. Life Cycle Assess. 2020, 25, 495–507. [Google Scholar] [CrossRef]
- Pacana, A.; Siwiec, D.; Bednárová, L.; Petrovský, J. Improving the Process of Product Design in a Phase of Life Cycle Assessment (LCA). Processes 2023, 11, 2579. [Google Scholar] [CrossRef]
- Tashkeel, R.; Rajarathnam, G.P.; Wan, W.; Soltani, B.; Abbas, A. Cost-Normalized Circular Economy Indicator and Its Application to Post-Consumer Plastic Packaging Waste. Polymers 2021, 13, 3456. [Google Scholar] [CrossRef] [PubMed]
- Shen, Y.; Zhou, J.; Pantelous, A.A.; Liu, Y.; Zhang, Z. A Voice of the Customer Real-Time Strategy: An Integrated Quality Function Deployment Approach. Comput. Ind. Eng. 2022, 169, 108233. [Google Scholar] [CrossRef]
- Wolniak, E.R.; Sȩdek, A. Using QFD Method for the Ecological Designing of Products and Services. Qual. Quant. 2009, 43, 695–701. [Google Scholar] [CrossRef]
- Siwiec, D.; Pacana, A.; Gazda, A. A New QFD-CE Method for Considering the Concept of Sustainable Development and Circular Economy. Energies 2023, 16, 2474. [Google Scholar] [CrossRef]
- Diakoulaki, D.; Mavrotas, G.; Papayannakis, L. Determining Objective Weights in Multiple Criteria Problems: The CRITIC Method. Comput. Oper. Res. 1995, 22, 763–770. [Google Scholar] [CrossRef]
- Palousis, N.; Luong, L.; Abhary, K. An Integrated LCA/LCC Framework for Assessing Product Sustainability Risk. Ph.D. Dissertation, WIT Press, Southampton, UK, 2008; pp. 121–128. [Google Scholar]
- Finkbeiner, M.; Inaba, A.; Tan, R.; Christiansen, K.; Klüppel, H.-J. The New International Standards for Life Cycle Assessment: ISO 14040 and ISO 14044. Int. J. Life Cycle Assess. 2006, 11, 80–85. [Google Scholar] [CrossRef]
- Rao, C.; Darzi, A.; Athanasiou, T. An Introduction to Decision Analysis. In Evidence Synthesis in Healthcare; Springer: London, UK, 2011; pp. 127–140. [Google Scholar]
- Malindzak, D.; Pacana, A.; Pacaiova, H. An Effective Model for the Quality of Logistics and Improvement of Environmental Protection in a Cement Plant. Przemysł Chem. 2017, 96, 1958–1962. [Google Scholar] [CrossRef]
- Wang, F.; Li, H.; Liu, A.; Zhang, X. Hybrid Customer Requirements Rating Method for Customer-Oriented Product Design Using QFD. J. Syst. Eng. Electron. 2015, 26, 533–543. [Google Scholar] [CrossRef]
- Ponto, J. Understanding and Evaluating Survey Research. J. Adv. Pract. Oncol. 2015, 6, 168–171. [Google Scholar] [PubMed]
- Siwiec, D.; Pacana, A. A Pro-Environmental Method of Sample Size Determination to Predict the Quality Level of Products Considering Current Customers’ Expectations. Sustainability 2021, 13, 5542. [Google Scholar] [CrossRef]
- Hyman, M.; Sierra, J. Selecting a Sample Size for Your Customer Survey. Bus. Outlook 2016, 14, 1–5. [Google Scholar]
- Mu, E.; Pereyra-Rojas, M. Practical Decision Making, 1st ed.; Springer International Publishing: Cham, Switzerland, 2017; Volume 1, ISBN 978-3-319-33860-6. [Google Scholar]
- Sakao, T. A QFD-Centred Design Methodology for Environmentally Conscious Product Design. Int. J. Prod. Res. 2007, 45, 4143–4162. [Google Scholar] [CrossRef]
- Lee, S.H.; Zhou, Y. The Outlook for Sustainable Development Goals in Business and Management: A Systematic Literature Review and Keyword Cluster Analysis. Sustainability 2022, 14, 11976. [Google Scholar] [CrossRef]
- Sullivan, G.M.; Artino, A.R. Analyzing and Interpreting Data from Likert-Type Scales. J. Grad. Med. Educ. 2013, 5, 541–542. [Google Scholar] [CrossRef] [PubMed]
- Kaplan, S.; Tripsas, M. Thinking about Technology: Applying a Cognitive Lens to Technical Change. Res. Policy 2008, 37, 790–805. [Google Scholar] [CrossRef]
- Bortolini, M.; Gamberi, M.; Mora, C.; Pilati, F.; Regattieri, A. Design, Prototyping, and Assessment of a Wastewater Closed-Loop Recovery and Purification System. Sustainability 2017, 9, 1938. [Google Scholar] [CrossRef]
- Elverum, C.W.; Welo, T.; Tronvoll, S. Prototyping in New Product Development: Strategy Considerations. Procedia CIRP 2016, 50, 117–122. [Google Scholar] [CrossRef]
- Halvorsen, K. Team Decision Making in the Workplace. J. Appl. Linguist. Prof. Pract. 2013, 7, 273–296. [Google Scholar] [CrossRef]
- Gajdzik, B.; Siwiec, D.; Wolniak, R.; Pacana, A. Approaching open innovation in customization frameworks for product prototypes with emphasis on quality and life cycle assessment (QLCA). J. Open Innov. Technol. Mark. Complex. 2024, 10, 100268. [Google Scholar] [CrossRef]
- Krishnan, A.R.; Kasim, M.M.; Hamid, R.; Ghazali, M.F. A Modified CRITIC Method to Estimate the Objective Weights of Decision Criteria. Symmetry 2021, 13, 973. [Google Scholar] [CrossRef]
- Chevalier, J.L.; Le Téno, J.F. Requirements for an LCA-Based Model for the Evaluation of the Environmental Quality of Building Products. Build. Environ. 1996, 31, 487–491. [Google Scholar] [CrossRef]
- Khoo, H.H.; Isoni, V.; Sharratt, P.N. LCI Data Selection Criteria for a Multidisciplinary Research Team: LCA Applied to Solvents and Chemicals. Sustain. Prod. Consum. 2018, 16, 68–87. [Google Scholar] [CrossRef]
- Bang, H.; Zhao, H. Cost-Effectiveness Analysis: A Proposal of New Reporting Standards in Statistical Analysis. J. Biopharm. Stat. 2014, 24, 443–460. [Google Scholar] [CrossRef]
- Michelly Gonçalves Brandão, S.; Brunner-La Rocca, H.-P.; Pedroso de Lima, A.C.; Alcides Bocchi, E. A Review of Cost-Effectiveness Analysis: From Theory to Clinical Practice. Medicine 2023, 102, e35614. [Google Scholar] [CrossRef] [PubMed]
- Acharya, A.; Glandon, D.; Hammaker, J.; Masset, E. Cost-Effectiveness Analysis and Joint Public Production of Outputs for Development: A Preliminary Framework. J. Dev. Effect. 2023, 15, 17–30. [Google Scholar] [CrossRef]
- Wang, X.; Tian, X.; Chen, X.; Ren, L.; Geng, C. A Review of End-of-Life Crystalline Silicon Solar Photovoltaic Panel Recycling Technology. Sol. Energy Mater. Sol. Cells 2022, 248, 111976. [Google Scholar] [CrossRef]
- Golroudbary, S.R.; Lundström, M.; Wilson, B.P. Analogical Environmental Cost Assessment of Silicon Flows Used in Solar Panels by the US and China. Sci. Rep. 2024, 14, 9538. [Google Scholar] [CrossRef]
- Heath, G.A.; Silverman, T.J.; Kempe, M.; Deceglie, M.; Ravikumar, D.; Remo, T.; Cui, H.; Sinha, P.; Libby, C.; Shaw, S.; et al. Research and Development Priorities for Silicon Photovoltaic Module Recycling to Support a Circular Economy. Nat. Energy 2020, 5, 502–510. [Google Scholar] [CrossRef]
- Chen, P.-H.; Chen, W.-S.; Lee, C.-H.; Wu, J.-Y. Comprehensive Review of Crystalline Silicon Solar Panel Recycling: From Historical Context to Advanced Techniques. Sustainability 2023, 16, 60. [Google Scholar] [CrossRef]
- Ostasz, G.; Siwiec, D.; Pacana, A. Model to Determine the Best Modifications of Products with Consideration Customers’ Expectations. Energies 2022, 15, 8102. [Google Scholar] [CrossRef]
- Vu, H.; Vu, N.H.; Shin, S. Static Concentrator Photovoltaics Module for Electric Vehicle Applications Based on Compound Parabolic Concentrator. Energies 2022, 15, 6951. [Google Scholar] [CrossRef]
- Grębosz-Krawczyk, M.; Zakrzewska-Bielawska, A.; Glinka, B.; Glińska-Neweś, A. Why Do Consumers Choose Photovoltaic Panels? Identification of the Factors Influencing Consumers’ Choice Behavior Regarding Photovoltaic Panel Installations. Energies 2021, 14, 2674. [Google Scholar] [CrossRef]
- Ciroth, A. ICT for Environment in Life Cycle Applications OpenLCA—A New Open Source Software for Life Cycle Assessment. Int. J. Life Cycle Assess. 2007, 12, 209–210. [Google Scholar] [CrossRef]
- Pacca, S.; Sivaraman, D.; Keoleian, G.A. Parameters Affecting the Life Cycle Performance of PV Technologies and Systems. Energy Policy 2007, 35, 3316–3326. [Google Scholar] [CrossRef]
- Reich, N.H.; Alsema, E.A.; van Sark, W.G.J.H.M.; Turkenburg, W.C.; Sinke, W.C. Greenhouse Gas Emissions Associated with Photovoltaic Electricity from Crystalline Silicon Modules under Various Energy Supply Options. Prog. Photovolt. Res. Appl. 2011, 19, 603–613. [Google Scholar] [CrossRef]
- Perpiñan, O.; Lorenzo, E.; Castro, M.A.; Eyras, R. Energy Payback Time of Grid Connected PV Systems: Comparison between Tracking and Fixed Systems. Prog. Photovolt. Res. Appl. 2009, 17, 137–147. [Google Scholar] [CrossRef]
- Gerbinet, S.; Belboom, S.; Léonard, A. Life Cycle Analysis (LCA) of Photovoltaic Panels: A Review. Renew. Sustain. Energy Rev. 2014, 38, 747–753. [Google Scholar] [CrossRef]
- Life Cycle Inventories and Life Cycle Assessment of Photovoltaic System. Available online: https://iea-pvps.org/wp-content/uploads/2020/01/IEA-PVPS_Task_12_LCI_LCA.pdf (accessed on 25 August 2024).
- Kazemzadeh, E.; Fuinhas, J.A.; Salehnia, N.; Koengkan, M.; Silva, N. Assessing Influential Factors for Ecological Footprints: A Complex Solution Approach. J. Clean. Prod. 2023, 414, 137574. [Google Scholar] [CrossRef]
- García, A.; Monsalve-Serrano, J.; Martinez-Boggio, S.; Soria Alcaide, R. Carbon Footprint of Battery Electric Vehicles Considering Average and Marginal Electricity Mix. Energy 2023, 268, 126691. [Google Scholar] [CrossRef]
- Han, J.; Tan, Z.; Chen, M.; Zhao, L.; Yang, L.; Chen, S. Carbon Footprint Research Based on Input–Output Model—A Global Scientometric Visualization Analysis. Int. J. Environ. Res. Public Health 2022, 19, 11343. [Google Scholar] [CrossRef]
- Bartnik, R.; Pączko, D. Methodology for Analysing Electricity Generation Unit Costs in Renewable Energy Sources (RES). Energies 2021, 14, 7241. [Google Scholar] [CrossRef]
- Li, G.; Bie, Z.; Xie, H.; Lin, Y. Customer Satisfaction Based Reliability Evaluation of Active Distribution Networks. Appl. Energy 2016, 162, 1571–1578. [Google Scholar] [CrossRef]
- Hamelink, M.; Opdenakker, R. How Business Model Innovation Affects Firm Performance in the Energy Storage Market. Renew. Energy 2019, 131, 120–127. [Google Scholar] [CrossRef]
- Khoo, H.H.; Tan, R.B.H.; Tan, Z. GHG Intensities from the Life Cycle of Conventional Fuel and Biofuels. WIT Trans. Ecol. Environ. 2009, 123, 329–340. [Google Scholar]
- Schellscheidt, B.; Richter, J.; Licht, T. Life-Cycle Assessment for Power Electronics Module Manufacturing. In Proceedings of the 2019 22nd European Microelectronics and Packaging Conference & Exhibition (EMPC), Pisa, Italy, 6–19 September 2019; IEEE: Piscataway, NJ, USA, 2019; pp. 1–4. [Google Scholar]
- Jeng, S.; Chang, Y. Classifying and Clustering Noisy Images Using Subset Learning Based on Convolutional Neural Networks. Qual. Reliab. Eng. Int. 2023, 39, 2343–2364. [Google Scholar] [CrossRef]
- Yu, X.; Sekhari, A.; Nongaillard, A.; Bouras, A.; Yu, S. A Sensitivity Analysis Approach to Identify Key Environmental Performance Factors. Math. Probl. Eng. 2014, 2014, 918795. [Google Scholar] [CrossRef]


| Reference | Main Theme | Context |
|---|---|---|
| [7,9] | Sustainable development of product considering social, economic, and environmental criteria | Striving for customer satisfaction, reducing negative environmental impact and optimizing costs |
| [8] | Sustainable development of product considering social and environmental criteria | |
| [12] | Sustainable development of product considering social, economic, environmental, and technical criteria | |
| [13] | Sustainable development of product considering social, economic, environmental, technical, and access to resources criteria | |
| [17] | Energy communities with social, economic and environmental aspects | |
| [15] | Improving product considering social and economic criteria, and also localization and distance from a key place | Spatial planning |
| [16] | Analysis of energy distribution depending on its storage | Storage technologies |
| [11] | Analysis of consumer decision-making towards ecological products and their quality | Consumer decision-making |
| [14] | Analysis of enterprise decision-making towards eco-efficiency, ecological behaviour, innovation policy | Enterprise decision-making |
| Customer Attributes | Selected PV Technical Criteria | Weight (Importance) |
|---|---|---|
| Efficiency Power Possibility of transferring energy | Module efficiency (%) Nominal maximum power (W) Open circuit voltage (V) Voltage at maximum power point (V) Maximum static load, front (Pa) Maximum static load, rear (Pa) | 5 |
| Temperature reached Number of cells | Normal cell operating temperature (°C) Number of cells (szt.) | 4 |
| Dimensions Colour | Length × width × height (mm) Colour | 3 |
| Weight Electrical parameters | Mass (kg) Current at maximum operating point (A) Open circuit voltage (V) Short circuit current (A) | 2 |
| Criteria | Ref. | P1 | P2 | P3 | P4 | P5 | P6 | P7 | P8 | P9 |
|---|---|---|---|---|---|---|---|---|---|---|
| C1 | 21.20 | 19.80 | 22.10 | 21.40 | 18.90 | 20.50 | 21.00 | 19.00 | 21.80 | 22.50 |
| C2 | 502 | 503 | 501 | 504 | 503 | 502 | 501 | 505 | 504 | 505 |
| C3 | 45.70 | 45.50 | 44.90 | 45.60 | 44.75 | 44.65 | 45.70 | 45.50 | 44.80 | 44.95 |
| C4 | 38.52 | 38.76 | 38.44 | 38.90 | 38.20 | 39.00 | 37.75 | 37.85 | 37.95 | 38.48 |
| C5 | 5300 | 5350 | 5400 | 5450 | 5250 | 5200 | 5400 | 5300 | 5250 | 5400 |
| C6 | 2300 | 2350 | 2400 | 2450 | 2250 | 2200 | 2400 | 2300 | 2250 | 2400 |
| C7 | 45 | 46 | 47 | 42 | 43 | 44 | 46 | 47 | 44 | 46 |
| C8 | 130 | 131 | 132 | 133 | 129 | 128 | 127 | 130 | 133 | 131 |
| C9 | 2090 × 1130 × 30 | 2085 × 1135 × 30 | 2065 × 1120 × 40 | 2070 × 1200 × 35 | 2090 × 1130 × 30 | 2085 × 1135 × 30 | 2085 × 1130 × 40 | 2065 × 1120 × 40 | 2090 × 1130 × 30 | 2070 × 1200 × 35 |
| C10 | Black | Black | Black | Graphite | Graphite | Graphite | White | White | White | Black |
| C11 | 24 | 25 | 24 | 26 | 22 | 23 | 27 | 25 | 24 | 20 |
| C12 | 13.09 | 13.10 | 13.12 | 13.07 | 13.13 | 13.08 | 13.11 | 13.05 | 14.00 | 13.15 |
| C13 | 42.79 | 42.66 | 42.36 | 42.70 | 41.85 | 41.44 | 42.27 | 41.63 | 41.57 | 42.30 |
| C14 | 11.33 | 11.20 | 11.42 | 11.31 | 11.47 | 11.29 | 10.95 | 10.82 | 10.49 | 10.92 |
| Product | O | Q | Ranking |
|---|---|---|---|
| Ref. | 2.32 | 0.19 | 9 |
| P1 | 1.82 | 0.00 | 10 |
| P2 | 3.06 | 0.46 | 4 |
| P3 | 2.98 | 0.43 | 6 |
| P4 | 2.55 | 0.27 | 8 |
| P5 | 2.80 | 0.36 | 7 |
| P6 | 3.53 | 0.63 | 2 |
| P7 | 3.38 | 0.58 | 3 |
| P8 | 4.52 | 1.00 | 1 |
| P9 | 2.93 | 0.41 | 5 |
| Data | Ref. | P1 | P2 | P3 | P4 | P5 | P6 | P7 | P8 | P9 |
|---|---|---|---|---|---|---|---|---|---|---|
| E1 | 1.000 | 1.000 | 1.000 | 1.000 | 1.000 | 1.000 | 1.000 | 1.000 | 1.000 | 1.000 |
| E2 | 59.050 | 44.395 | 88.173 | 28.710 | 63.691 | 63.718 | 25.357 | 72.659 | 62.099 | 59.050 |
| E3 | 4.052 | 4.603 | 4.262 | 3.447 | 3.847 | 3.654 | 1.970 | 1.740 | 3.047 | 4.574 |
| E4 | 0.289 | 0.432 | 0.356 | 0.312 | 0.218 | 0.289 | 0.304 | 0.246 | 0.312 | 0.124 |
| E5 | 15.534 | 14.747 | 17.535 | 17.646 | 15.534 | 7.553 | 14.006 | 16.755 | 19.115 | 23.196 |
| E6 | 2.345 | 2.466 | 1.994 | 2.530 | 2.647 | 2.114 | 2.663 | 2.345 | 2.529 | 1.140 |
| E7 | 0.174 | 0.148 | 0.131 | 0.259 | 0.084 | 0.075 | 0.196 | 0.187 | 0.165 | 0.214 |
| E8 | 0.009 | 0.009 | 0.009 | 0.004 | 0.013 | 0.010 | 0.009 | 0.009 | 0.007 | 0.008 |
| E9 | 0.005 | 0.004 | 0.004 | 0.005 | 0.005 | 0.006 | 0.005 | 0.002 | 0.002 | 0.005 |
| E10 | 0.000 | 0.000 | 0.000 | 0.000 | 0.000 | 0.000 | 0.000 | 0.000 | 0.000 | 0.000 |
| E11 | 0.013 | 0.011 | 0.019 | 0.011 | 0.014 | 0.014 | 0.014 | 0.015 | 0.014 | 0.009 |
| E12 | 0.020 | 0.023 | 0.022 | 0.021 | 0.018 | 0.009 | 0.017 | 0.022 | 0.019 | 0.010 |
| E13 | 0.188 | 0.188 | 0.214 | 0.169 | 0.281 | 0.160 | 0.203 | 0.178 | 0.212 | 0.203 |
| E14 | 1.689 | 1.269 | 1.918 | 1.689 | 2.078 | 0.821 | 2.521 | 1.522 | 1.822 | 0.725 |
| E15 | 32.806 | 40.366 | 34.499 | 15.950 | 27.905 | 35.384 | 29.577 | 31.143 | 37.266 | 14.087 |
| E16 | 20.610 | 22.239 | 8.850 | 17.531 | 15.495 | 21.674 | 23.412 | 30.774 | 23.264 | 25.360 |
| E17 | 0.012 | 0.011 | 0.013 | 0.018 | 0.006 | 0.012 | 0.013 | 0.009 | 0.012 | 0.013 |
| E18 | 0.154 | 0.167 | 0.147 | 0.066 | 0.131 | 0.116 | 0.162 | 0.154 | 0.175 | 0.139 |
| E19 | 0.116 | 0.173 | 0.056 | 0.142 | 0.132 | 0.050 | 0.098 | 0.125 | 0.110 | 0.087 |
| Product | EI | LCA | Ranking |
|---|---|---|---|
| Ref. | 891.03 | 0.66 | 5 |
| P1 | 841.58 | 0.76 | 4 |
| P2 | 984.35 | 0.49 | 9 |
| P3 | 768.48 | 0.90 | 2 |
| P4 | 1239.91 | 0.00 | 10 |
| P5 | 713.80 | 1.00 | 1 |
| P6 | 915.01 | 0.62 | 7 |
| P7 | 822.65 | 0.79 | 3 |
| P8 | 963.26 | 0.53 | 8 |
| P9 | 901.54 | 0.64 | 6 |
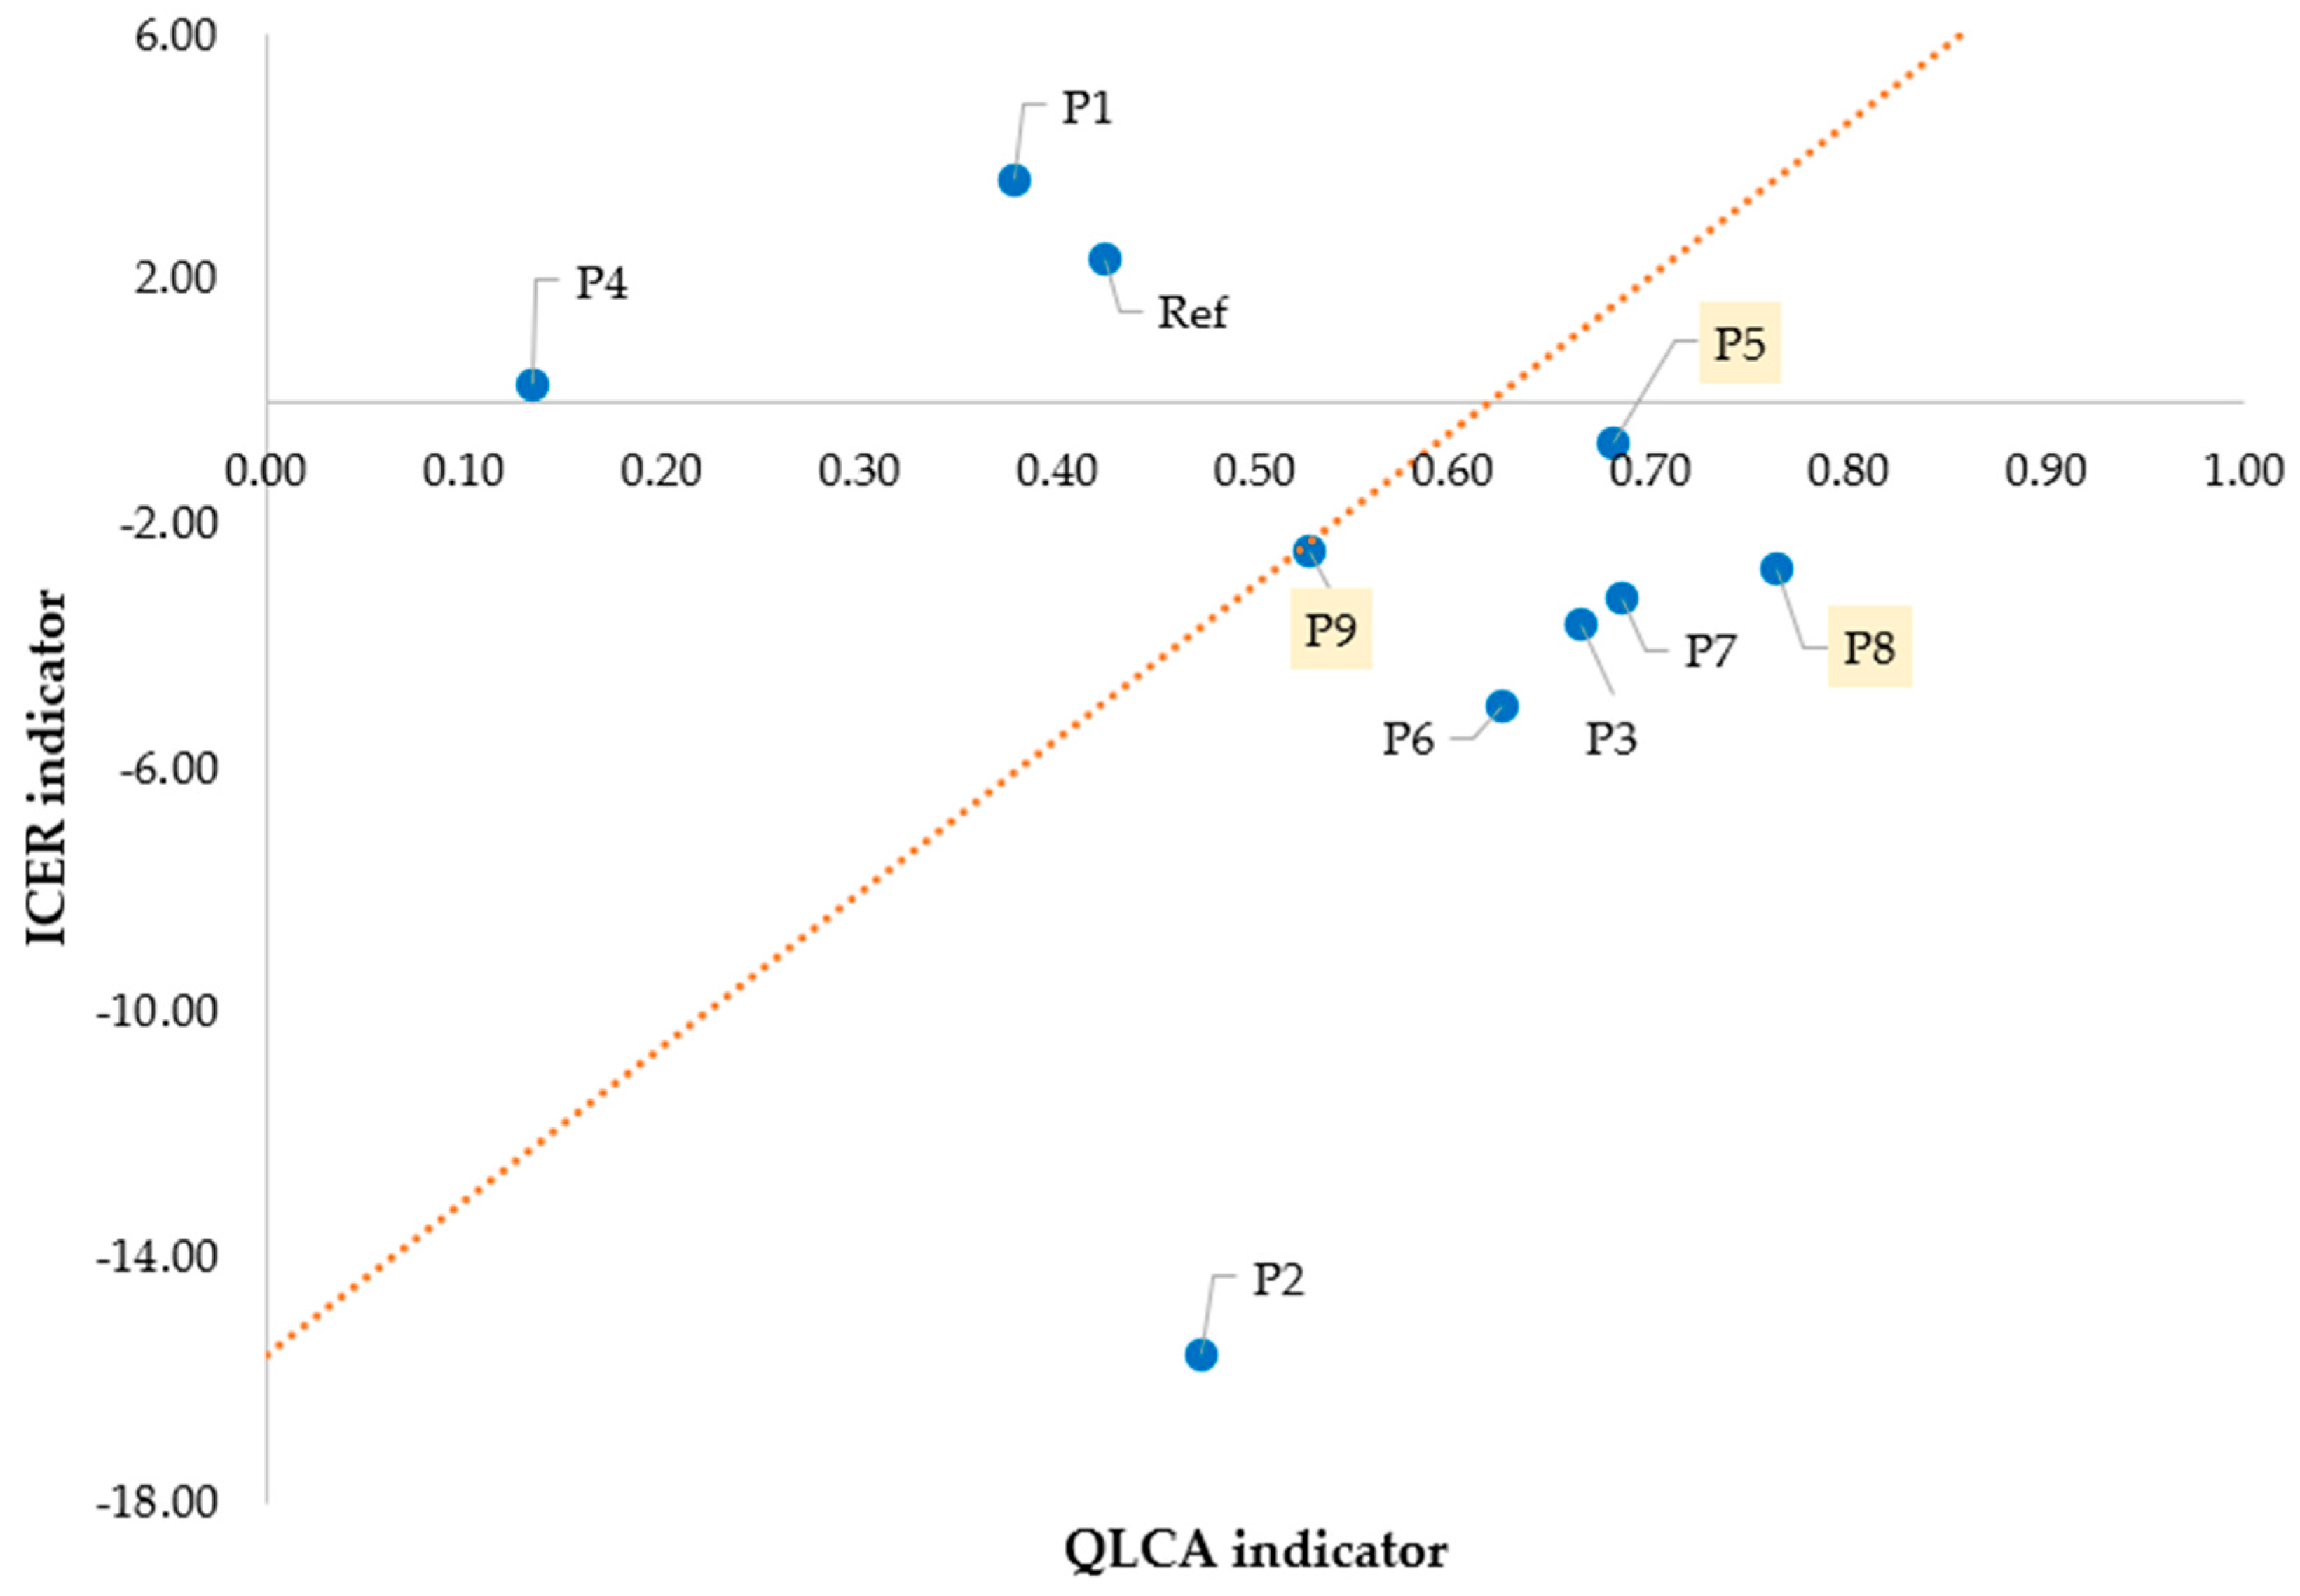
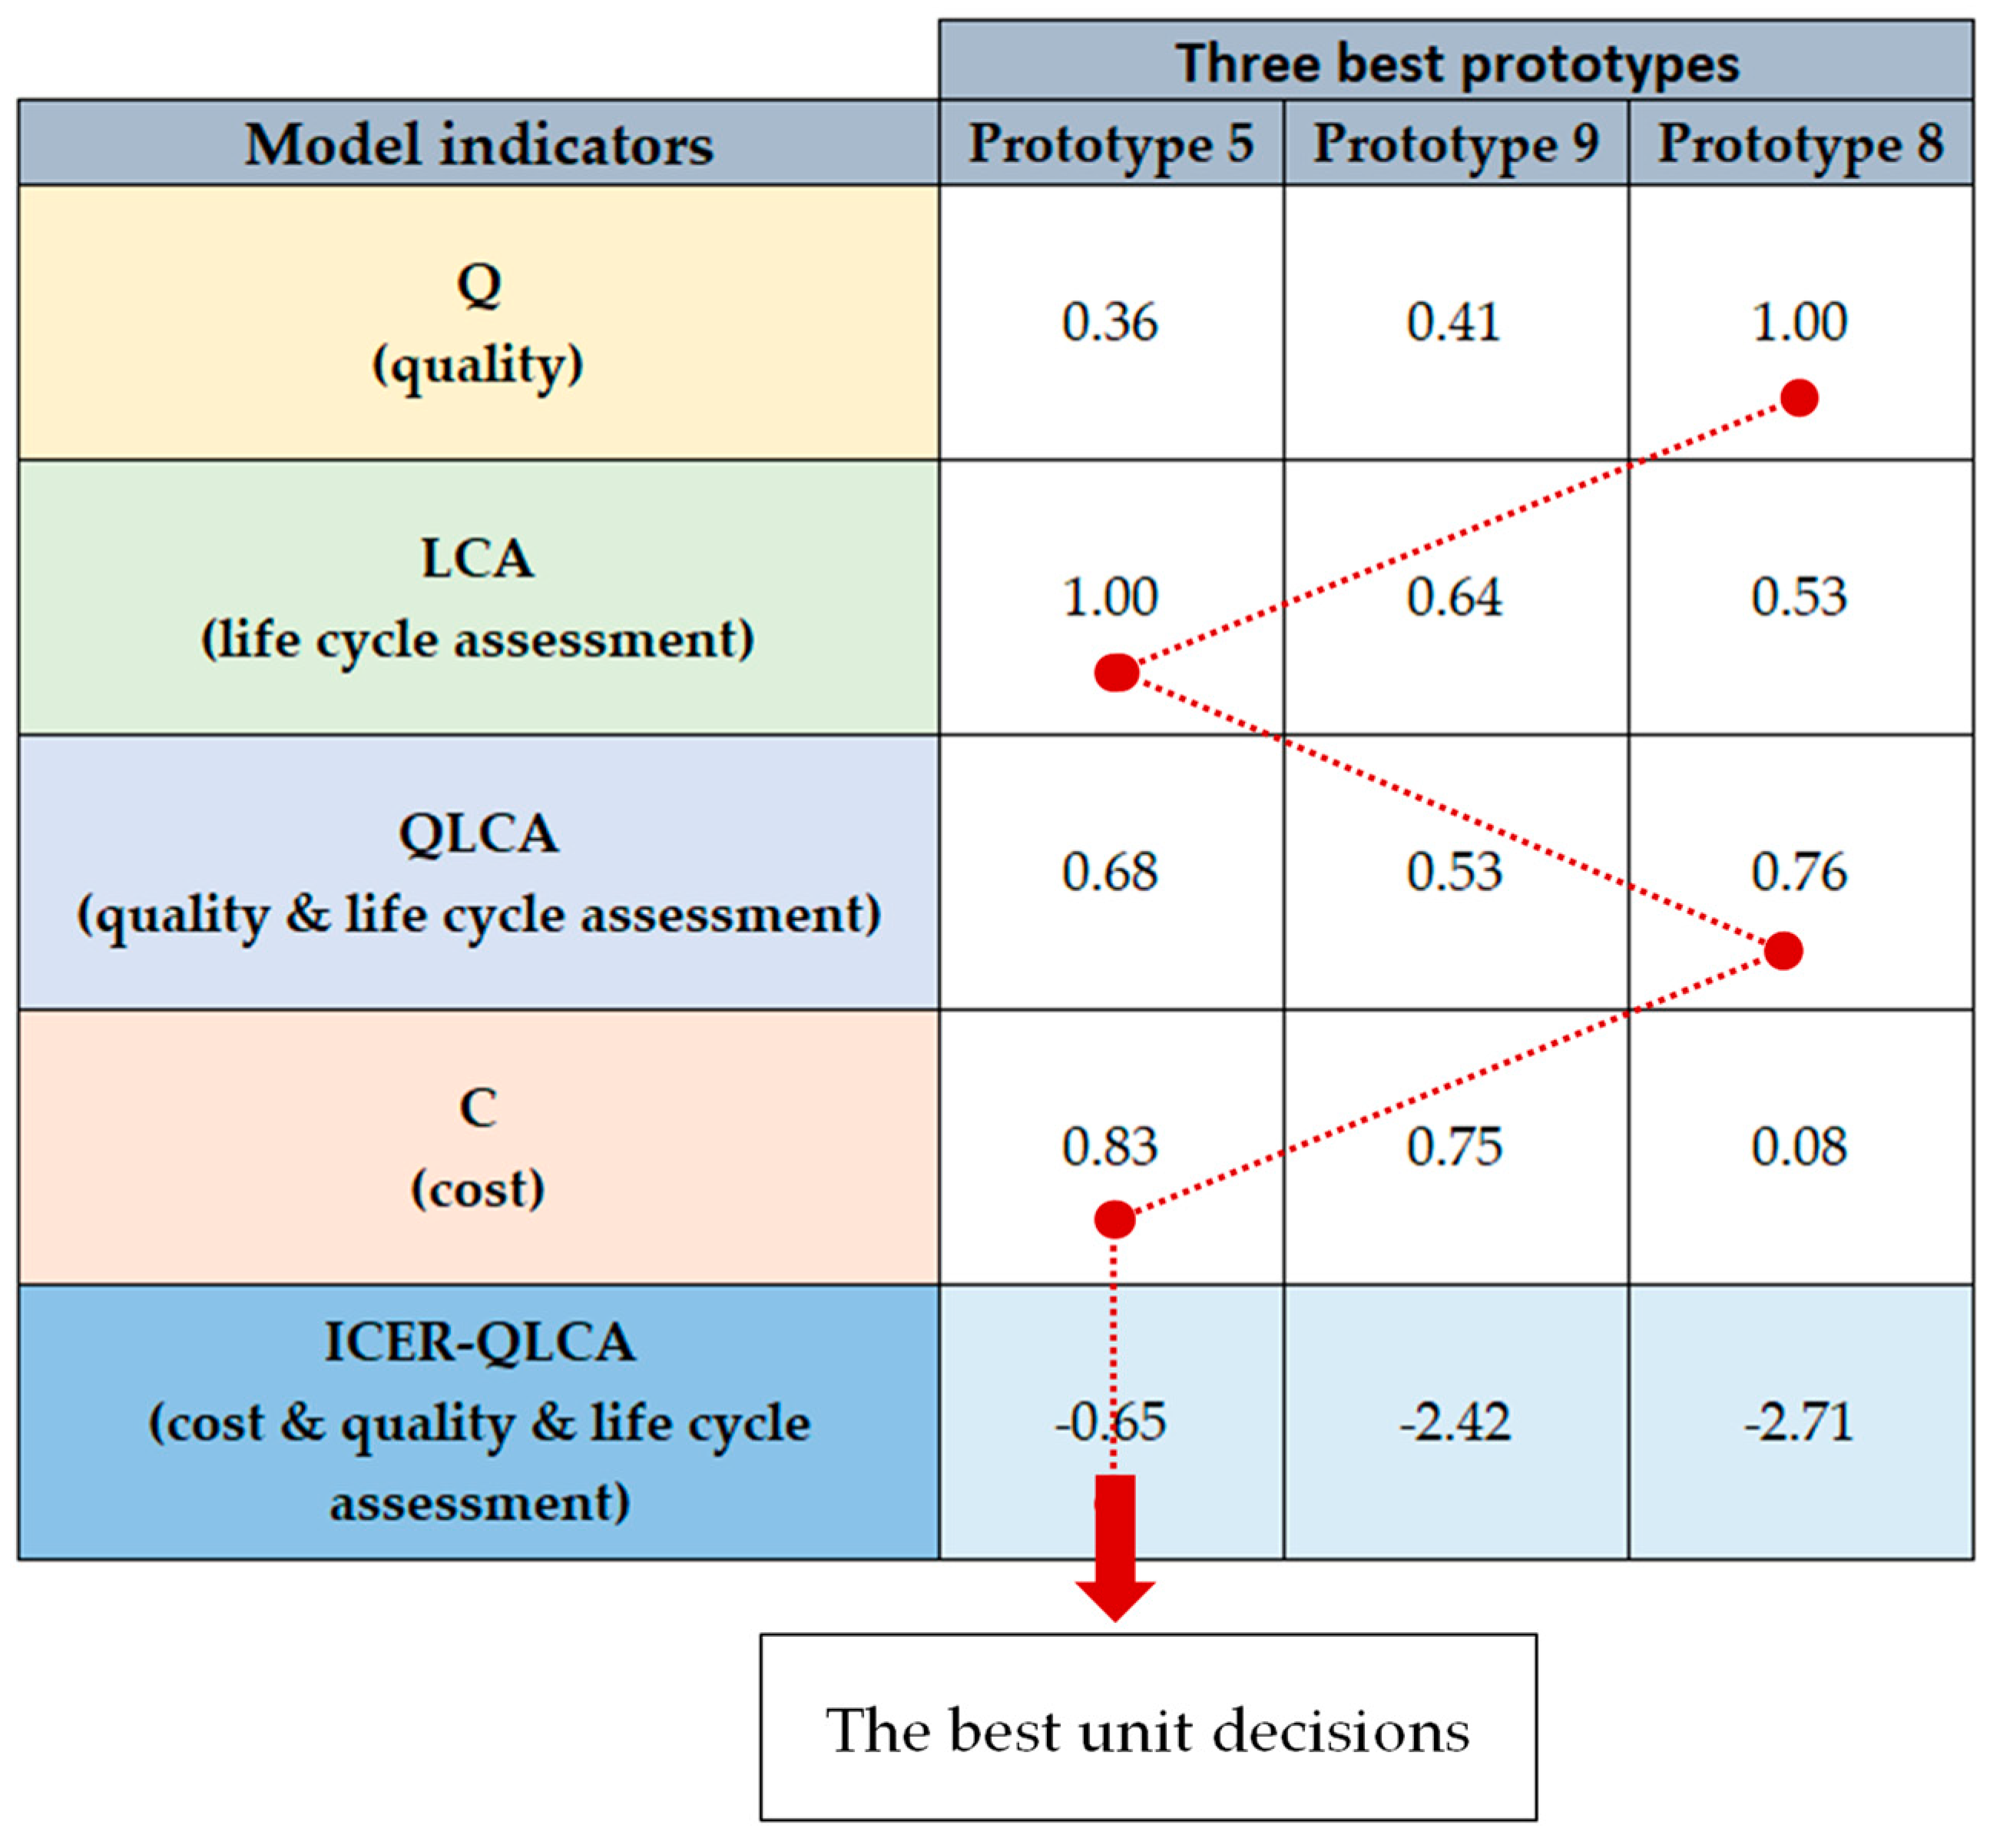
| Product | QLCA | C | ICER–QLCA | Ranking |
|---|---|---|---|---|
| P8 | 0.76 | 0.08 | −2.71 | 3 |
| P7 | 0.69 | 0.17 | −3.19 | 4 |
| P5 | 0.68 | 0.83 | −0.65 | 1 |
| P3 | 0.66 | 0.13 | −3.65 | 5 |
| P6 | 0.63 | 0.00 | −4.98 | 6 |
| P9 | 0.53 | 0.75 | −2.42 | 2 |
| P2 | 0.47 | 0.25 | −15.58 | 8 |
| Ref. | 0.42 | 1.00 | 2.36 | 7 |
| P1 | 0.38 | 0.83 | 3.65 | 9 |
| P4 | 0.14 | 0.92 | 0.29 | 10 |
| Product | Q | Ranking | LCA | Ranking | QLCA | Ranking | C | Ranking | ICER–QLCA | Ranking |
|---|---|---|---|---|---|---|---|---|---|---|
| Ref. | 0.19 | 9 | 0.66 | 5 | 0.42 | 8 | 1.00 | 1 | 2.36 | 7 |
| P1 | 0.00 | 10 | 0.76 | 4 | 0.38 | 9 | 0.83 | 3 | 3.65 | 9 |
| P2 | 0.46 | 4 | 0.49 | 9 | 0.47 | 7 | 0.25 | 5 | −15.58 | 8 |
| P3 | 0.43 | 6 | 0.90 | 2 | 0.66 | 4 | 0.13 | 7 | −3.65 | 5 |
| P4 | 0.27 | 8 | 0.00 | 10 | 0.14 | 10 | 0.92 | 2 | 0.29 | 10 |
| P5 | 0.36 | 7 | 1.00 | 1 | 0.68 | 3 | 0.83 | 3 | −0.65 | 1 |
| P6 | 0.63 | 2 | 0.62 | 7 | 0.63 | 5 | 0.00 | 9 | −4.98 | 6 |
| P7 | 0.58 | 3 | 0.79 | 3 | 0.69 | 2 | 0.17 | 6 | −3.19 | 4 |
| P8 | 1.00 | 1 | 0.53 | 8 | 0.76 | 1 | 0.08 | 8 | −2.71 | 3 |
| P9 | 0.41 | 5 | 0.64 | 6 | 0.53 | 6 | 0.75 | 4 | −2.42 | 2 |
| Indicator | Q | LCA | QLCA | C |
|---|---|---|---|---|
| MLP 4-3-1 | 140.35 | 42.47 | 34.49 | 181.15 |
| Impact on ICER–QLCA ranking | 2 | 3 | 4 | 1 |
Disclaimer/Publisher’s Note: The statements, opinions and data contained in all publications are solely those of the individual author(s) and contributor(s) and not of MDPI and/or the editor(s). MDPI and/or the editor(s) disclaim responsibility for any injury to people or property resulting from any ideas, methods, instructions or products referred to in the content. |
© 2024 by the authors. Licensee MDPI, Basel, Switzerland. This article is an open access article distributed under the terms and conditions of the Creative Commons Attribution (CC BY) license (https://creativecommons.org/licenses/by/4.0/).
Share and Cite
Siwiec, D.; Pacana, A. Decision-Making Model Supporting Eco-Innovation in Energy Production Based on Quality, Cost and Life Cycle Assessment (LCA). Energies 2024, 17, 4318. https://doi.org/10.3390/en17174318
Siwiec D, Pacana A. Decision-Making Model Supporting Eco-Innovation in Energy Production Based on Quality, Cost and Life Cycle Assessment (LCA). Energies. 2024; 17(17):4318. https://doi.org/10.3390/en17174318
Chicago/Turabian StyleSiwiec, Dominika, and Andrzej Pacana. 2024. "Decision-Making Model Supporting Eco-Innovation in Energy Production Based on Quality, Cost and Life Cycle Assessment (LCA)" Energies 17, no. 17: 4318. https://doi.org/10.3390/en17174318
APA StyleSiwiec, D., & Pacana, A. (2024). Decision-Making Model Supporting Eco-Innovation in Energy Production Based on Quality, Cost and Life Cycle Assessment (LCA). Energies, 17(17), 4318. https://doi.org/10.3390/en17174318