Article

Estimation of the Values of Electrical Shock Currents during Live-Line Work in Multi-Circuit, Multi-Voltage HVAC Transmission Lines

by
Agnieszka Dziendziel
1,2
1
Department of Power System and Control, Faculty of Electrical Engineering, Silesian University of Technology, 441-100 Gliwice, Poland
2
PSE Innowacje Sp. z o.o., Al. Jerozolimskie 132, 02-305 Warsaw, Poland
Energies 2024, 17(17), 4276; https://doi.org/10.3390/en17174276
Submission received: 29 July 2024 / Revised: 18 August 2024 / Accepted: 26 August 2024 / Published: 27 August 2024
(This article belongs to the Special Issue Energy, Electrical and Power Engineering 2024)

Abstract

:
This article covers the analysis of voltages induced on the conductors of a de-energized circuit of a multi-circuit, multi-voltage HVAC transmission line. As a result of the multiplied interactions between the circuits in such lines, the expected electrical shock currents (touch currents) to which a lineman performing live work on such a line may be exposed are determined. A number of supporting structures of three- and four-circuit lines with various degrees of geometric asymmetry are analyzed. Analyses have shown that in multi-circuit lines in which circuits of different voltages are carried on a common structure, despite the outage of one of the circuits, touch voltages and electrical shock currents (touch currents) exceeding the permissible values can be expected on its conductors, endangering the safety of the lineman. The arrangements of s in such lines that provide the smallest values of touch currents are indicated.

1. Introduction

Today, ensuring uninterrupted access to quality electrical energy is extremely important. Electrical energy is intertwined with all the needs of daily life. This goal guides the continuous expansion of the electric power grid. Facing economic, legal, and environmental challenges, the ideal solution seems to be to increase the share of multi-circuit lines, including multi-voltage lines, in the structure of the transmission network. One of the advantages of multi-circuit and multi-voltage lines is the flexibility of the way they operate. This is because each circuit can be independently switched off, which does not interfere with the operation of the other circuits. During an outage of one of the circuits, repair work can be performed on it using live work. Such a solution ensures uninterrupted energy transfer while allowing maintenance of overhead line components. With live-line work (LLW), one has additional options for planning and carrying out modernization work on overhead lines. An example of LLW includes the replacement of insulators. Another example is the extension of an overhead line to another circuit. The remaining circuits are then operated normally. The phase conductors of the circuit under construction are then usually earthed at the two nearest line poles, forming a short (about 1 km) section. However, the risks of human error cannot be completely eliminated. Such cases are rare, but they do occur [1]. An example of such an incident is described later in this article. During such an operation, the distance between the fitter and the phase conductor does not exceed several meters.
The term LLW describes work that involves direct contact or approach of a lineman to a live conductor. The primary advantage of using restoration work is the lack of need to de-energize the line. Another advantage is the increase in occupational safety associated with the elimination of line de-energization mistakes, as well as the caution that accompanies linemen when performing this type of work. In high-voltage lines (110 kV, 220 kV, and 400 kV), the most common method of LLW is “bare-hand working” [2]. It involves the lineman adopting the potential of the part of the equipment on which work is to be performed. The condition for adopting the potential of any part of the device is that the line worker is at transient potential [3]. This condition is fulfilled almost exclusively in high-voltage overhead lines, where the distances between parts of the line have different potentials that are large enough that there is no likelihood of the lineman coming into contact with different line potentials, with the uncomplicated nature of the facilities allowing for relative freedom of movement.
The current methods of transmission-line diagnostics have already been quite well developed [4,5]. They range from aircraft (unmanned aerial vehicles) [6,7,8,9] to dedicated devices that move along line conductors [10,11]. However, they are no substitute for human participation when repair or operational work is needed [12,13]. There are guidelines and regulations governing the performance of LLW (IEC TC78 Live Working Standards and Documents). These requirements include methods, algorithms for the relevant activities, regulation of the parameters of the clothing in which the lineman performs the work [14,15,16] and also permissible values of electromagnetic field strength [17]. The literature deals with selected aspects relating to the operation of multi-circuit, multi-voltage overhead lines. There are few publications available that deal with live work in such systems. The most common articles refer to the protection of the installer against the effects of electromagnetic fields [18]. As a result, a greater impact was identified in the case of work in a circuit with the lowest rated voltage, due to the additional impact of the electric field of circuits with higher voltages. However, it is observed that the operational risk is not significant at any location of a man on a pole [19]. The asymmetry of voltages and currents in the system introduced by multi-circuit, multi-voltage overhead lines is also analyzed [20,21].
For multi-circuit, multi-voltage lines, methods of live work have not been established due to the lack of much research on the technical requirements for safe operation. Hence, there are currently no specific guidelines for conducting work under voltage for multi-voltage HVAC lines, which is why in practice the recommendations and experiences dedicated to classic lines are used. This is another reason to take a closer look at the working conditions that the fitter encounters while performing live maintenance on such lines.
LLW is particularly important in systems that contain multi-circuit, multi-voltage lines. It was pointed out in previous work [22] that the lowest rated voltage circuits are routed in the lower parts of the supporting structure, so that access to them is simplified. In addition, in ref. [23], it was proven that these circuits are the most vulnerable to the effects of the interaction of individual circuits of the line by which touch voltages and touch currents can be expected to be significant and potentially dangerous to the lineman.
The above statement is confirmed by earlier publications [24,25,26]. However, each of them focuses on a selected case of lines, limiting the conclusions to a narrow group of classic double-circuit silhouettes. The impact of the diversity of multi-circuit, multi-voltage designs has not yet been described from a broader perspective. To date, there has been an extended analysis that examined the effect of the phase arrangement used on the values of touch currents. This article fills this gap by leading to universal conclusions for multi-circuit lines. The article determines the values of expected touch voltages and electrical shock currents in complex multi-circuit, multi-voltage lines. The research indicates the need for a deeper interest in the subject of ensuring the safe work of the installer on such lines. Furthermore, universal conclusions were drawn regarding the influence of line geometry parameters on the values of touch voltages and electrical shock currents.

2. Methodology

The main objective of this analysis is to determine the voltages and touch currents flowing through the body of a lineman performing work on the switched-off circuit of a multi-voltage line. For this purpose, a simulation model was built in the MATLAB environment (license no.: 40876907), which is described by an admittance matrix of the following form:
Y = Yline + Ysource + Yload + Yhuman,
where Y is the admittance matrix of the system of dimension 2 (3n × 3n), containing the beginnings and ends of the line, where n is the number of circuits of the overhead line. So, as an example, for a single-circuit line, a Y matrix of dimension 6 × 6 is obtained, which contains the three beginnings and three ends of the line, which correspond to the beginnings and ends of its three-phase conductors. Here, Yline is the admittance matrix of a multi-circuit overhead line; it is a fully symmetric matrix. The method of creating such a model is presented, among others, in refs. [22,27,28,29]. The line is energized on one side and loaded on the other to force the flow of currents in the individual current paths equal to the long-term permissible currents. Thus, Ysource is the source admittance matrix that maps the admittances of the sources that supply the individual current paths, and Yload is the load admittance matrix, which includes the load admittances resulting from the long-term permissible currents of the tested circuits. Moreover, Yhuman is a one-element admittance matrix whose parameter is the admittance of a human. It was assumed that a human has resistance Rhuman = 1000 Ω [30,31]. Also considered was the case in which the human is equipped with additional insulation protection clothing, Rhuman = 251 kΩ [32].
In ref. [23], it was proven that the effects of the interactions of multiple couplings between circuits in multi-voltage multi-circuit lines are most visible in the circuits with the lowest rated voltages. For this reason, further analysis focuses precisely on these circuits of the line. Four scenarios for the operation of n-circuit lines were considered, where the circuit studied is the circuit with the lowest rated voltage, i.e., i = n, where i is the selected circuit of the n-circuit line:
  • S1—supply of circuits I to n − 1, circuit n isolated at both ends (Figure 1),
  • S2—loading of circuits I to n − 1 times their long-term permissible currents, circuit n isolated at both ends (Figure 2),
  • S3—loading of circuits I to n − 1 times their long-term permissible currents, circuit n earthed at the beginning and insulated at the end (Figure 3),
  • S4—loading of circuits I to n − 1 times their long-term permissible currents, circuit n earthed at both ends (Figure 4 and Figure 5).
Figure 1, Figure 2, Figure 3, Figure 4 and Figure 5 schematically depict the tested scenarios of overhead line operation using a double-circuit 400 kV line as an example. The diagrams indicate the electrical parameters of the line, which, in a given scenario, significantly affect the values of the analyzed quantities, which are the voltages at the beginning and end of the tested circuit, as well as the touch current flowing through the lineman body It. The dashed red line indicates the path of current It flow.
Figure 1 shows a situation in which a lineman touches one of the phase conductors of an isolated section of circuit II of a double-circuit line, while circuit I is energized but not loaded. In such a case, significant potential values can be expected on the conductors of circuit II due to capacitive coupling with circuit I, as shown, among others, in ref. [33]. Thus, the potential values will be affected by the self- and mutual capacitances marked in yellow in Figure 1. The value of the touch current will also be affected by the self-impedances of circuit II (marked in dark blue in Figure 1) and the mutual impedances within this circuit (marked in light blue in Figure 1). Since the significance of the influence of impedances, which are due to electromagnetic couplings between line conductors, is small in this operating scenario, they are marked in the figure with a dashed line.
Figure 2 shows a system in which a lineman touches one of the phase conductors of an insulated section of circuit II of a double-circuit line, while circuit I is energized and loaded by the II current which flows through it. From the point of view of circuit II under study, such an operating arrangement is similar to that shown in Figure 1. Again, significant voltages can be expected on the conductors of circuit II. Here, the values of the It current will be affected by the self- and mutual impedances of the circuit II conductors. In addition, the value of It will be influenced by the mutual impedances from the currents flowing in circuit I. These impedances are colored green in Figure 2. Again, these impedances are marked with a dashed line to emphasize that capacitive couplings are dominant in this circuit of operation.
Such an arrangement can occur during transmission network development work for a single-circuit line with a second circuit. During installation work, a lineman may touch an unearthed phase conductor on the end pole of a section during normal operation of circuit I when, mistakenly, the phase conductors of the section where the incident occurs are not earthed, as well as not being metallically connected to the conductors of the adjacent section.
Figure 3 shows a circuit in which a lineman touches one of the phase conductors of circuit II, which was earthed at the beginning. Circuit I is energized and loaded with current II. In such a system, capacitive coupling plays a lesser role in the flow of its current. Unlike the previous two scenarios, in this case the electromagnetic couplings mapped by the self- and mutual impedances will be dominant for a value of the It current. To emphasize the lesser importance of capacitive couplings, these components are marked with a dashed yellow line in Figure 3.
The last of the operating systems analyzed is the one shown in Figure 4. This is a system in which the section of circuit II under study has been earthed at the beginning and the end. Circuit I is energized and loaded with current II. In this arrangement, a lineman on the supporting structure touches one of the phase conductors of circuit II, as shown in more detail in Figure 5.
Here, ZS II.L3 is the self-impedance of the L3 phase conductor of circuit II, ZM II.L1-II.L3 and ZM II.L2-II.L3 are the mutual impedances from electromagnetic couplings within circuit II, and Zm I.L1-II.L3, Zm I.L2-II.L3, and Zm I.L3-II.L3 are the mutual impedances due to electromagnetic couplings from circuit I conductors. Moreover, Rss is the resistance of the pole (supporting structure) through which the phase conductor is earthed; it is assumed to be equal to 10 Ω [31,34,35]. The current flowing through the phase conductor touched by a lineman is divided into the touch current It and the current flowing through the supporting structure to the ground Iss.
The object of this study is to determine the potentials or voltages at the beginning and end of the track n and the touch currents It flowing through the body of a lineman when it touches one of the three-phase conductors of the circuit n. The calculation algorithm consists of four main steps:
  • Determination of the admittance matrix of the system Y,
  • Determination of the impedance matrix of the system Z:
    Z = Y−1,
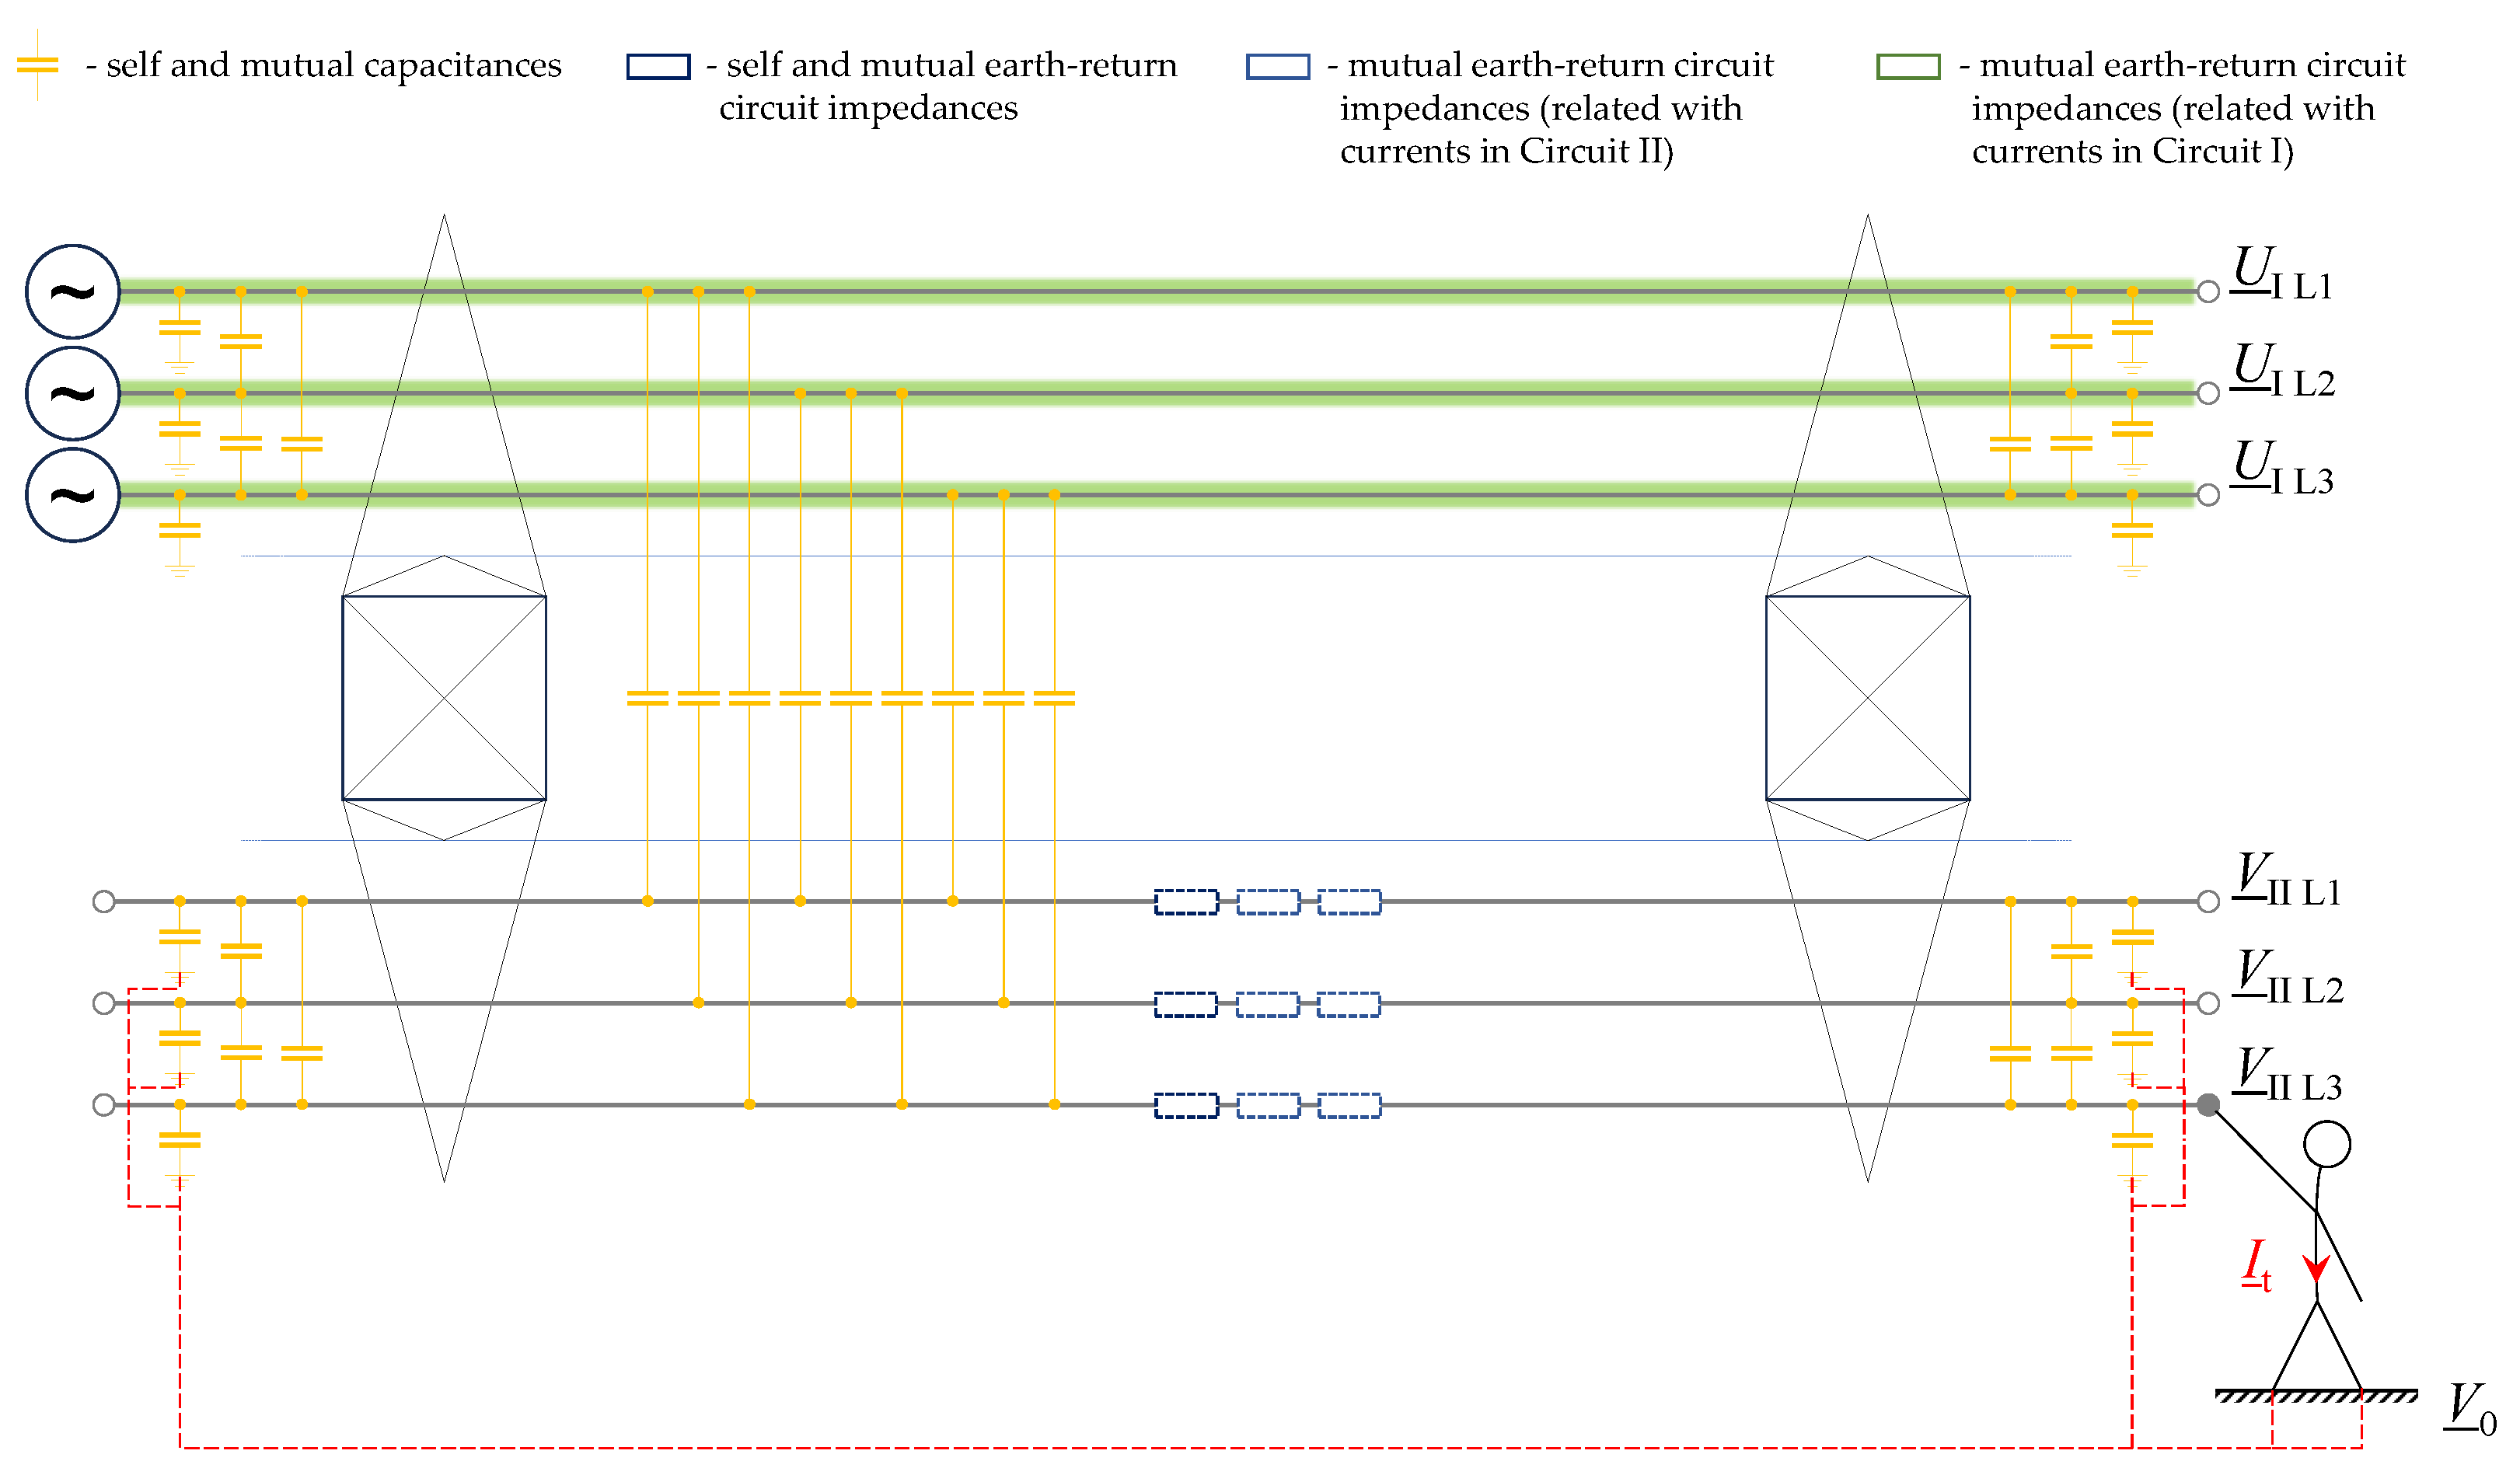
  • Determination of the voltage vector of system U:
    U = ZI,
    where I is the vector of currents flowing in the current paths of the n-circuit line,
  • Determination of the touch current It:
    It = UnLYhuman,
    where UnL is the voltage at the end of the L phase of the circuit n and L ∈ {L1, L2, L3}; Yhuman is the lineman admittance (Yhuman = 1/Rhuman).
Two main research threads are realized. First, the effect of the mode of operation of the ends of the circuits with the lowest rated voltage of the disconnected section of the double-circuit line on the values of induced voltages is analyzed according to the scenarios shown in Figure 1, Figure 2, Figure 3 and Figure 4. This analysis is carried out for a double-circuit line with the geometric parameters shown in Figure 6, in addition to a function of the length of the line section under study. Other analyzes are carried out for a set of three-circuit and four-circuit lines with varying degrees of geometric asymmetry (Figure 7). The results of this analysis are summarized in Section 3.1.
In the second research thread, the effect of the circuit mode of operation of the ends with the lowest rated voltage of the three- and four-circuit line sections on the values of the touch currents is determined. For these lines, the phase arrangements for which the touch currents are the smallest are identified. The results obtained are presented in Section 3.2.

3. Results

3.1. Influence of the Mode of Operation of the Ends of the Disconnected Circuit Section on the Values of Induced Voltages

In this section, the results obtained for the four scenarios defined in Section 2 for the operation of the disconnected circuit section of a double-circuit line are presented, as well as for the three- and four-circuit lines.
First, the focus is on the results obtained for the double-circuit line shown in Figure 6. The voltages are induced on the phase conductors of one of the circuits, which is de-energized while the other circuit is powered. The analysis is performed for various lengths of the test line section, from 1 km to 150 km. Lines longer than several kilometers for the scenarios analyzed may seem unlikely. The choice of such a range of line lengths resulted from the wish to observe in detail the behavior of voltages induced in the phase conductors of the disconnected circuit and to draw universal conclusions. Figure 8, Figure 9, Figure 10 and Figure 11 show the results obtained for this analysis.
The next step is to examine the voltages induced on the phase conductors of the section of the disconnected circuit with the lowest rated voltage in the three- and four-circuit lines. These lines have different circuit configurations (Figure 7). In ref. [23], the silhouette shown in Figure 7a is identified as a line with a low degree of geometric asymmetry and the silhouette presented in Figure 7b is identified as a line with a high degree of geometric asymmetry. A silhouette with a low degree of geometric asymmetry is one whose operation (electromagnetic and capacitive interactions of the working conductors) does not introduce significant asymmetries into the system, which manifest themselves in the form of, among others, significant values of voltage- and current-unbalance indicators, and over 10% difference in short-circuit current values when using a symmetrical model of the overhead line [23].
Table 1 summarizes the values of potentials at the beginning and end of the tested section of three-circuit lines for different scenarios of its operation S1–S4 (Section 2). The phase designations are shown in Figure 7a–f.
Similar to the previous analysis, Table 2 presents the results of the voltages at the beginning and end of the section of the disconnected circuit with the lowest rated voltage of the four-circuit lines, depending on the operation scenario of the ends of this circuit. Phase designations are shown in Figure 7g–i.

3.2. Influence of the Mode of Operation of the Ends of the Disconnected Circuit Section on the Values of Touch Currents

Knowing the voltage values at the end of the disconnected section of the current path with the lowest voltage rated, the values of shock currents are determined according to Equation (4). For a double-circuit line, the results are presented in Table 3, when Rhuman = 1 kΩ, and in Table 4, when Rhuman = 251 kΩ, for the two lengths of the considered line section, i.e., 1 km and 150 km.
Table 5 and Table 6 present the values of the expected smallest and largest values of touch currents in the circuits with the lowest rated voltages, respectively, in the three- and four-circuit lines. The tables graphically present the phase configuration for which such values were achieved. Each color corresponds to individual phases of a three-phase system, but it does not matter which phase is initially assigned a given color. So, ultimately, one graphic refers to six corresponding phase configurations.

4. Discussion

The analysis results presented in Figure 8, Figure 9, Figure 10 and Figure 11 allow us to notice a relationship between the voltages achieved on the phase conductors of the section of the disconnected circuit of the multi-circuit lines. These results coincide with the expectations described in Section 2 of this article. In the first considered scenario, S1, the same voltages/potentials are obtained at the beginning and end of the tested section—the solid and dashed lines corresponding to the appropriate phases coincide. Moreover, these potentials do not depend on the length of the analyzed section, which is consistent with the results and conclusions obtained, among others, in ref. [33]. This is due to the predominance of the capacitive effect in the line, which is associated with connecting the remaining circuits of the multi-circuit line to a voltage. Additionally, due to the insulated ends of the tested line section, only small currents flow in the disconnected circuit, closing through the earth capacitances of this circuit. For this reason, the series parameters of the line are not dominant here. The potential values are significant. For the tested double-circuit line under this operating condition, a maximum value of 21 kV was obtained for phase C (suspended at the highest point on the pole). For the middle phase B, 10 kV was obtained, and for the lowest suspended phase A, 7 kV. The differences in the values are related to the asymmetrical interaction of the second circuit of the line with the analyzed one and the impact of lightning conductors. Therefore, in such an operating condition, on the conductors of the disconnected circuit of a double-circuit 400 kV line, a potential value close to the level of the medium network voltage (here, 30 kV) can be expected.
Similar values are obtained for the second operating scenario, S2. However, in this case, the voltages at the beginning and end of the tested section are not the same (Figure 9). Nonetheless, the differences in these values are relatively small, especially for phases A and C. The largest difference occurs for the phase suspended in middle B and reaches approximately ± 15%. This behavior of potentials at both ends of the tested section is visible for longer line sections, over several kilometers. In Scenario S2, the capacitive interaction is again dominant, but the electromagnetic interaction also begins to become visible (through mutual impedances and currents flowing in the powered circuit I). Therefore, for sections longer than a few kilometers, visible effects of this impact should be expected.
Earthing one of the ends of the line, which takes place in Scenario S3, results in an earth potential at the earthed end and a voltage of 10 kV at the other end (for the considered double-circuit line, Figure 10). In this case, significant effects of electromagnetic coupling compared to capacitive coupling are already visible. For longer line sections (over several kilometers), medium voltage levels should be expected at the end of such a section.
The last of the scenarios considered, S4, is the most likely to occur in real network systems, as mentioned in the Introduction. Currents can freely close through both ends of the tested section that are earthed, and the influence of the electromagnetic interaction over the capacitive one is definitely dominant here. Of course, because of the earthing of both ends of the line, the voltages at these points of the tested section are the same. Similar to Scenario S3, the highest induced voltages appear in the middle circuit B (Figure 11) and amount to slightly more than 2 kV.
The above observations allow us to draw a conclusion about the importance of full modeling of the overhead line—taking into account its parameters, precisely. The choice of the testing method for such systems is correct, which is confirmed by the results obtained for the double-circuit line, which are consistent with the expectations regarding the quality and value of the obtained results. Earthing at least one of the ends of the line causes the series parameters of the line to play a dominant role in the formation of voltages induced on the wires of the disconnected circuit. Moreover, the voltages achieved at the ends of the line depend on the length of the line section being tested.
Analyzing the three- and four-circuit lines, similar dependences were obtained for the double-circuit line (Table 1 and Table 2). For Scenario S1, the voltages at the beginning and end of the tested section are the same. In Scenario S2, these voltages differ slightly. For both of these scenarios, the level of induced voltages is significant—the level of medium voltages is higher, the more circuits the multi-circuit line has. For Scenarios S3 and S4, the level of induced voltages is much lower and amounts to several hundred volts.
Table 3 and Table 4 present the values of expected touch currents for the tested section of the double-circuit line. The current values are determined for two lengths of the tested section and for two values of lineman resistance. In the case of Scenarios S1 and S2 for a length of 150 km, the values of expected touch currents are less than 1 mA. This is due to the blocking of the touch current by a lineman and the capacitance of the touched conductor. In this case, the current values are also influenced by the conductor’s own impedance, which is greater, the longer the tested section. In the discussed scenarios, the highest It values occur when a lineman touches the phase C conductors suspended highest on the supporting structure. For this circuit, the self-capacitance is the smallest and, therefore, the current is the highest. The current values for these scenarios are virtually identical, which is consistent with expectations and previous observations. The maximum expected It value (for l = 1 km and Rhuman = 1 kΩ) is 66.8 mA (Table 3). The magnitude and duration of the current conducted through a human body at 50 Hz should be less than the value that can cause ventricular fibrillation of the heart [36,37,38,39]. Various permissible values can be found in the literature (depending on, among others, body weight and current flow time): 100 mA [40], 50 mA [41], 500 mA [41]. For Scenarios S3 and S4, the situation is the opposite, i.e., the highest expected touch currents occur when touching the lower phase A, with a higher value of It being achieved for Scenario S3. The It value at Rhuman = 1 kΩ and l = 150 km exceeds 10 A, which constitutes a real threat to the installer. However, considering their additional protection (insulating clothing, etc.), its resistance value is approximately 251 kΩ. Then, the highest expected current It (at l = 1 km) is 41.6 mA (Table 4) or 52.2 mA for Scenarios S1 and S2. Such current values, despite the use of additional protection, still pose a threat to the lineman’s health.
Table 5 and Table 6 contain the values of the expected smallest and largest values of touch currents for three scenarios, i.e., S2–S4 (the three- and four-circuit lines), respectively. The analysis is limited to one length of the examined section, l = 1 km, because it occurs most often during assembly and operation works. The values of the smallest It currents are in the range of 13.0–70.1 mA for three-circuit lines (Table 5) and 13.0–45.4 mA for the tested four-circuit lines (Table 6). The highest It values are in the range of 43.6–293.8 mA for three-circuit lines (Table 5) and 135.9–405.7 mA for the four-circuit lines (Table 6). In the case of the lowest expected values of its currents, this range is more favorable for four-circuit lines, which results from the even impact of the three remaining circuits on the tested circuit. For the highest expected It values, the range for four-circuit lines is again more unfavorable, which in this case results from the asymmetry of the interaction of individual phases with each other. Not only do the number and configuration of the circuits influence the It value, but also the phase configurations of these paths. Hence, for four-circuit lines, this effect is more visible than for three- or double-circuit lines. It should be noted that, in order to achieve the smallest It possible by using a given phase system, this system must be characterized by symmetry. Most often, it is symmetrical with respect to the middle phase. This is also consistent with the results and conclusions published in ref. [14]. It should also be noted that the conductors of circuits I-III in four-circuit lines, which are located in the immediate vicinity of the tested circuit IV, form three phases, L1–L3 (Table 6). Due to this, in a sense, it obtains a certain symmetry in the immediate vicinity of the tested circuit. The highest It values are obtained when mirror reflections of phases are used in circuits I-II in three- and four-circuit lines. For four-circuit lines, it should also be noted that there are always the same phases in the vicinity of the tested circuit (from each circuit, in purple color, e.g., phase L1–Table 6).

5. Conclusions

This article determined the induced voltages and touch currents that a lineman may expect during live-line work on the circuit with the lowest rated voltage of a multi-circuit, multi-voltage line. Four possible work modes for the ends of sections of a circuit, where operational or construction works take place, were analyzed. So far, the literature has focused primarily on determining induced voltages or estimating touch currents in classic double-circuit or parallel lines. This article provided extended information for more complex lines that will increasingly appear in modern power systems. To ensure the safe operation of the system and to provide electrical energy of appropriate quality, live-line work techniques are increasingly being used. These two aspects of system development (both its infrastructure and its use) are closely related.
The obtained results confirmed the need to develop previously known methods of carrying out live-line work, due to the real health hazard of linemen performing necessary work on multi-circuit overhead lines. It was pointed out that, due to the construction of multi-circuit silhouettes (Figure 7), the most natural objects for carrying out such work are circuits with the lowest rated voltages, usually suspended at the lowest level on the pole (underneath the circuits with higher voltages). Thus, access to such circuits is easier. In addition, phase-conductor systems for which the expected touch currents were the lowest are indicated. It was confirmed that the key to obtaining such an effect is to use the symmetry of the middle phase or a system that resembles the transposition of conductors (Table 5a,c,d). Among the group of tested multi-circuit, multi-voltage overhead lines, the most visible effects of geometric asymmetry, manifested by significant values of touch voltages and electrical shock currents, were observed in the 110 kV circuit, especially when cooperating with 400 kV circuit(s).
The method of limiting the value of touch voltages and, consequently, also touch currents is, among others, the use of line transposition, which influences the effects of coupling between circuits in such lines. This action allows for the reduction of voltages induced on the conductors of the tested line section. It should be noted that transposition has an effect when it is performed in energized and loaded circuits. The transposition performed in the tested circuit only affects the voltages induced, due to the presence of series parameters. Another method is the use of line silhouettes characterized by a small degree of geometric asymmetry, including the use of phase arrangements characterized by central phase symmetry. The methods of limiting touch voltages and touch currents in the analyzed circuit have an advantage, in that at the level of construction of a new line they are not expensive and are technically easy to implement. Such an approach allows, even at the investment level, the avoidance of any negative effects of geometric asymmetry of multi-circuit, multi-voltage overhead lines.
The subject discussed in the article also occurs in systems where a multi-voltage line is divided into several single-voltage lines. The values of touch voltages and electrical shock currents are then dependent on the influence of couplings in the multi-circuit, multi-voltage, and single-voltage sections. Future studies are planned to consider the operation of such systems.

Funding

This research received no external funding.

Data Availability Statement

Data are contained within this article.

Conflicts of Interest

Author Agnieszka Dziendziel was employed by the company PSE Innowacje Sp. z o.o. The author declares no conflicts of interest.

References

  1. Eblen, M.L.; Ramirez-Bettoni, E.; Wallace, K. Analysis of accidents caused by inducted current and voltage on transmission lines and substations between 1985–2021. In Proceedings of the IEEE IAS Electrical Safety Workshop (ESW), Jacksonville, FL, USA, 7–11 March 2022. [Google Scholar]
  2. Joint Working Group B2/B3.27. In CIGRE Report 561 Live Work—A Management Perspective, 1st ed.; CIGRE: Paris, France, 2013; ISBN 978-85873-256-2.
  3. Sadurski, K.J.; Van Der Merwe, C.W.; Muftic, D. Live Line Maintenance of EHV and UHV Transmission Lines—Factors Influencing the Dielectric Strength at the Work Site. In Proceedings of the CIGRE Paris Session, Paris, France, 28 August–3 September 1994. [Google Scholar]
  4. Wallis, D.; Erga, B. Protecting workers from electromagnetic induction during line-stringing operations. In Proceedings of the IEEE IAS Electrical Safety Workshop (ESW), Tucson, AZ, USA, 7–12 March 2021. [Google Scholar]
  5. Dudek, B.; Loboda, M.; Kubica, P.; Nazimek, Ł. An outline of over 45 year period of live working technology development in Poland. In Proceedings of the 13th International Conference on Live Maintenance (ICOLIM), Turin, Italy, 15–17 June 2022. [Google Scholar]
  6. Chatzargyros, G.; Papakonstantinou, A.; Kotoula, V.; Stimoniaris, D.; Tsiamitros, D. UAV Inspections of Power Transmission Networks with AI Technology: A Case Study of Lesvos Island in Greece. Energies 2024, 17, 3518. [Google Scholar] [CrossRef]
  7. Zormpas, A.; Moirogiorgou, K.; Kalaitzakis, K.; Plokamakis, G.; Partsinevelos, P.; Giakos, G.; Zervakis, M. Power Transmission Lines Inspection using Properly Equipped Unmanned Aerial Vehicle (UAV). In Proceedings of the 2018 IEEE International Conference on Imaging Systems and Techniques (IST), Krakow, Poland, 16–18 October 2018; pp. 1–5. [Google Scholar]
  8. Xu, B.; Zhao, Y.; Wang, T.; Chen, Q. Development of power transmission line detection technology based on unmanned aerial vehicle image vision. SN Appl. Sci. 2023, 5, 72. [Google Scholar] [CrossRef]
  9. Yang, L.; Fan, J.; Liu, Y.; Li, E.; Peng, J.; Liang, Z. A Review on State-of-the-Art Power Line Inspection Techniques. IEEE Trans. Instrum. Meas. 2020, 69, 9350–9365. [Google Scholar] [CrossRef]
  10. Tao, X.; Zhang, D.; Wang, Z.; Liu, X.; Zhang, H.; Xu, D. Detection of Power Line Insulator Defects Using Aerial Images Analyzed With Convolutional Neural Networks. IEEE Trans. Syst. Man Cybern. Syst. 2020, 50, 1486–1498. [Google Scholar] [CrossRef]
  11. Phillips, A.J.; Ferraro, R.; Kuffel, J.; Engelbrecht, C.S. Development of an Overhead Transmission Line Portable Protective Arrester (PPA) for Live Work. In Proceedings of the CIGRE Paris Session, Paris, France, 24 August–3 September 2020. [Google Scholar]
  12. Liang, J.K.; Zhu, K.; Zhou, X.Y.; Cai, D.L.; Lei, X.L.; Lin, F.; Li, D.K. Research on Live Working Safety of 110 kV and 220 kV Mixed Lines Based on Vertical Lifting Method. In Proceedings of the 2022 IEEE International Conference on High Voltage Engineering and Applications (ICHVE), Chongqing, China, 25–29 September 2022. [Google Scholar]
  13. Chazot, J. Special Operating Modes for Live Working. In Proceedings of the 13th International Conference on Live Maintenance (ICOLIM), Turin, Italy, 15–17 June 2022. [Google Scholar]
  14. Göcsei, G.; Szabó, D.; Németh, B.; Faradzhev, V. Inducted Voltage: A Major Risk Not Only During Live Working. In Proceedings of the 2022 13th International Conference on Live Maintenance (ICOLIM), Turin, Italy, 15–17 June 2022; pp. 1–5. [Google Scholar]
  15. Lovrenčić, V.; Ribič, P.; Ogrizek, P.; Lušin, M.; Lovrenčič, A. Safe Work in The Vicinity of Live Parts on High Voltage Double-Circuit Overhead Lines. In Proceedings of the 2022 13th International Conference on Live Maintenance (ICOLIM), Turin, Italy, 15–17 June 2022; pp. 1–6. [Google Scholar]
  16. Su, Y.; Wang, X.; Li, Y.; Pan, Z.; Liu, Z. Analysis of the conductivity property of live working shielding clothing. J. Ind. Text. 2018, 48, 643–659. [Google Scholar] [CrossRef]
  17. Higuero-Torres, I.; Gil-Prieto, G.; Fuster-Roig, V. Compliance analysis of exposure limit values of power frequency electromagnetic fields during live-line working on HV overhead lines. In Proceedings of the CIGRE Paris Session, Paris, France, 28 August–2 September 2022. [Google Scholar]
  18. Shao, J.; Fu, H.; Jiang, K.; Meng, X. Electric Field Distribution and Protection of Live Working on EHV Transmission Lines with Arresters. In Proceedings of the 5th International Conference on Electrical Engineering and Control Technology (CEECT), Chengdu, China, 15–17 December 2023. [Google Scholar]
  19. Yang, Q.; Zou, D.; Tong, C.; Xia, Z.; Yan, Y.; Li, J. The Safety Analysis of LiveWorking on 500/220 kV Four-parallel Lines on the Same Tower. In Proceedings of the IEEE International Conference on Power System and Renewable Energy, Shanghai, China, 21–23 October 2016. [Google Scholar]
  20. Riberio, M.F.; Vasconcelos, J.A.; Teixeira, D.A. Optimization of Compact Overhead Lines of 138/230 kV: Optimal Selection and Arrangement of Cables and Definition of the Best Transmission Line Tower Topology. In Proceedings of the IEEE International Conference on Environment and Electrical Engineering and IEEE Industrial and Commercial Power Systems Europe, Milan, Italy, 6–9 June 2017. [Google Scholar]
  21. Wasilewski, J.; Kubek, P. Multi-Criteria Phase Sequence Optimization in Selected the Highest-Voltage Power Lines Using Evolutionary Algorithm. Acta Energetica 2019, 2, 73–79. Available online: https://actaenergetica.org/index.php/journal/article/view/60/58 (accessed on 18 August 2024).
  22. Dziendziel, A.; Kocot, H.; Kubek, P. Construction and Modeling of Multi-Circuit, Multi-Voltage HVAC Transmission Lines. Energies 2021, 14, 421. [Google Scholar] [CrossRef]
  23. Dziendziel, A.; Kocot, H. Methods to Minimize the Effects of Geometric Asymmetry of Multi-Circuit, Multi-Voltage Overhead Lines on Transmission Network Operation. Energies 2023, 16, 7611. [Google Scholar] [CrossRef]
  24. Nowak, W.; Tarko, R. Analysis of electrical shock hazard caused by electromagnetic coupling effects in parallel overhead high-voltage power lines. IET Gener. Transm. Distrib. 2018, 12, 3398–3404. [Google Scholar] [CrossRef]
  25. Li, J.; Wang, Z.; Xia, Z.; Wang, T.; Zeng, W.; Yan, Y.; Yang, Q.; Li, W.; Long, C.; Ren, H. Research for the Maintenance Way of Partial Outage on 500 kV/220 kV Four-circuit Mixed-voltage Transmission Lines on the Same Tower. In Proceedings of the 2016 IEEE International Conference on High Voltage Engineering and Application (ICHVE), Chengdu, China, 19–22 September 2016. [Google Scholar]
  26. Konotop, I.; Novitskiy, A.; Westermann, D. Constraints on the Use of Local Compensation for the Correction of Neutral Voltage Displacement Caused by the Influence of Nearby Power Lines. In Proceedings of the 2014 Electric Power Quality and Supply Reliability Conference (PQ), Rakvere, Estonia, 11–13 June 2014. [Google Scholar]
  27. Clarke, E. Circuit Analysis of A-C Power Systems; John Wiley & Sons Inc.: New York, NY, USA, 1943; Volume 1. [Google Scholar]
  28. Carson, J.R. Wave Propagation in Overhead Wires with Ground Return. Bell Syst. Tech. J. 1926, 5, 539–554. [Google Scholar] [CrossRef]
  29. Dommel, H.W. Electro-Magnetic Transients Program (EMTP) Theory Book, 2nd ed.; Microtran Power System Analysis Corporation: Portland, OR, USA, 1996. [Google Scholar]
  30. IEEE Std 80-2013 (Revision of IEEE Std 80-2000/Incorporates IEEE Std 80-2013/Cor 1-2015); IEEE Guide for Safety in AC Substation Grounding. IEEE: Piscataway, NJ, USA, 2015.
  31. IEEE Standard 81.2-1991; Guide for Measurement of Impedance and Safety Characteristics of Large, Extended or Interconnected Grounding Systems. IEEE: Piscataway, NJ, USA, 1992.
  32. PN-EN IEC 60895:2021-01; Live Work—Conductive Clothing. Polish Committee for Standardization: Konstancin-Jeziorna, Poland, 2021.
  33. Kocot, H.; Dziendziel, A. Chosen analyses for multi-circuit multi-voltage overhead lines capacitances. Prz. Elektrotech. 2020, 96, 71–74. [Google Scholar] [CrossRef]
  34. IEEE Standard 524-2016; Guide for the Installation of Overhead Line Conductors. IEEE: Piscataway, NJ, USA, 2016.
  35. PSE-TS.UZIEM.LN.PL/2019v1; Specification—Grounding of Overhead Lines. PSE: Konstancin-Jeziorna, Poland, 2019. (In Polish)
  36. Department of Health and Human Services. Electrical Safety and Health for Electrical Trades; NIOSH, Publication No. 2002-123; NIOSH: Washington, DC, USA, 2002; p. 6. [Google Scholar]
  37. IEC 60479-1; Effects of Current on Human Beings and Livestock—Part 1: General Aspects. International Electrotechnical Commission: Geneva, Switzerland, 2018.
  38. Ramirez-Bettoni, E.; Nemeth, B. AC Induction Conductive Suit—A New Way of Protecting Linemen in the Vicinity of Energized Parts. IEEE Trans. Ind. Appl. 2023, 59, 5169–5177. [Google Scholar] [CrossRef]
  39. Fernandez, E.; Patric, J. Safety Limit Calculations to IEEE and IEC Standards. Available online: https://elek.com/articles/safety-limit-calculations-to-ieee-and-iec-standards/ (accessed on 18 August 2024).
  40. Ferris, L.P.; King, B.G.; Spence, P.W.; Williams, H. Effect of the electric shock on the heart. AIEE Trans. Power Appar. Syst. 1936, 55, 498–515. [Google Scholar]
  41. Biegelmeier, U.G. Die Bedeatung der Z-Schwelle des Herzkammerfilim-merns fur die Festlegung von Beruhrunnggsspanungs greuzeu bei den Schutzma Bradhmer Gegen elektrische Unfate. E&M 1976, 93, 1–8. [Google Scholar]
Figure 1. Lineman touching of the L3 phase conductor of circuit n = II of the double-circuit line for Scenario S1.
Energies 17 04276 g001
Figure 2. Lineman touching the L3 phase conductor of circuit n = II of the double-circuit line for Scenario S2.
Energies 17 04276 g002
Figure 3. Lineman touching the L3 phase conductor of circuit n = II of the double-circuit line for Scenario S3.
Energies 17 04276 g003
Figure 4. Lineman touching the L3 phase conductor of circuit n = II of the double-circuit line for Scenario S4.
Energies 17 04276 g004
Figure 5. Close-up of a fragment displayed in Figure 4 showing the flow of a touch current through the body of the lineman for the Scenario S4.
Energies 17 04276 g005
Figure 6. Silhouette and geometric dimensions of the tested double-circuit line. Dimensions are given in meters. Letters A, B and C indicate the adopted arrangement of phase suspension points.
Energies 17 04276 g006
Figure 7. Silhouettes of the tested three- and four-circuit lines: (a) three-circuit line 2 × 400 kV + 220 kV in a flat arrangement; (b) three-circuit line—400 kV + 2 × 110 kV in a vertical arrangement; (c) three-circuit line—400 kV circuits in a triangular arrangement and 220 kV circuit in a flat arrangement; (d) three-circuit line—220 kV circuits in a triangular arrangement and 110 kV circuit in a flat arrangement; (e) three-circuit line—400 kV circuits in a vertical arrangement and 220 kV circuit in a triangular arrangement; (f) three-circuit line—400 kV circuits in a vertical arrangement and 220 kV circuit in a flat arrangement; (g) four-circuit line—400 kV circuits in a vertical-diagonal arrangement, 220 kV and 110 kV circuits in a triangular arrangement; (h) four-circuit line—400 kV circuits in a triangular arrangement and 220 kV and 110 kV circuits in a flat arrangement; (i) four-circuit line—400 kV circuits in a barrel arrangement and 110 kV circuits in a triangular arrangement. The red color indicates 400 kV circuits, the green color denotes 220 kV circuits, and the blue color signifies 110 kV circuits. Letters A, B and C indicate the adopted arrangement of phase suspension points in a given circuit.
Energies 17 04276 g007aEnergies 17 04276 g007b
Figure 8. Potentials at the beginning of Vb and the end of Ve on conductors A, B, and C of circuit II of the double-circuit line (Figure 6) for Scenario S1 as a function of the length of the tested line section.
Energies 17 04276 g008
Figure 9. Potentials at the beginning of Vb and the end of Ve on conductors A, B, and C of circuit II of the double-circuit line (Figure 6) for Scenario S2 as a function of the length of the tested line section.
Energies 17 04276 g009
Figure 10. Potentials at the beginning of Vb and the end of Ve on conductors A, B, and C of circuit II of the double-circuit line (Figure 6) for Scenario S3 as a function of the length of the tested line section.
Energies 17 04276 g010
Figure 11. Potentials at the beginning of Vb and the end of Ve on conductors A, B, and C of circuit II of the double-circuit line (Figure 6) for Scenario S4 as a function of the length of the tested line section.
Energies 17 04276 g011
Table 1. Potentials at the beginning and end of the 1 km-long line section depending on the operation of its ends for the analyzed three-circuit lines.
Analyzed Silhouette (Figure 7)ScenarioCircuits I and IIBeginning of the Section (C.III)End of the Section (C.III)Potential at the Beginning of the Section Vb, VPotential at the End of the Section Ve, V
Phase APhase BPhase CPhase APhase BPhase C
aS1No-loadInsulatedInsulated38,49015,80738,49038,49015,80738,490
S2On-load, Iz *InsulatedInsulated38,48815,80538,48338,45015,80338,519
S3On-load, IzInsulatedEarthed1.50.61.5186.881.8190.4
S4On-load, IzEarthedEarthed94.341.396.892.940.795.3
bS1No-loadInsulatedInsulated32,60327,01120,89532,60327,01120,895
S2On-load, IzInsulatedInsulated32,60026,99620,87532,57527,00920,916
S3On-load, IzInsulatedEarthed1.00.70.6229.9191.3143.1
S4On-load, IzEarthedEarthed114.695.571.9113.694.871.4
b **S1No-loadInsulatedInsulated30,11038,98539,48730,11038,98539,487
S2On-load, IzInsulatedInsulated30,10138,98239,48830,13938,99839,492
S3On-load, IzInsulatedEarthed0.81.01.167.991.0100.1
S4On-load, IzEarthedEarthed33.946.250.933.245.249.8
cS1No-loadInsulatedInsulated32,74232,82932,74232,74232,82932,742
S2On-load, IzInsulatedInsulated32,73132,83732,73132,78032,82232,780
S3On-load, IzInsulatedEarthed1.11.11.1196.7212.0196.7
S4On-load, IzEarthedEarthed99.0105.999.097.9104.897.9
dS1No-loadInsulatedInsulated17,43515,16712,18817,43515,16712,188
S2On-load, IzInsulatedInsulated17,44115,16812,17817,41015,15412,204
S3On-load, IzInsulatedEarthed0.60.40.4113.3108.793.3
S4On-load, IzEarthedEarthed56.454.246.955.953.846.5
eS1No-loadInsulatedInsulated27,23422,49832,89327,23422,49832,893
S2On-load, IzInsulatedInsulated27,24022,50532,89527,19522,46332,850
S3On-load, IzInsulatedEarthed0.70.50.9230.2210.5242.3
S4On-load, IzEarthedEarthed114.7104.7121.0114.1104.2120.1
fS1No-loadInsulatedInsulated46,72749,30346,72746,72749,30346,727
S2On-load, IzInsulatedInsulated46,73749,31146,73746,66349,23946,663
S3On-load, IzInsulatedEarthed1.61.51.4330.4343.8330.5
S4On-load, IzEarthedEarthed165.6172.2165.5164.0170.8164.1
* Iz signifies long-term permissible current: 2850 A for 400 kV circuits, 1220 A for 220 kV, and 735 A for 110 kV; **—analysis carried out for the lower 110 kV circuit.
Table 2. Potentials at the beginning and end of the tested 1 km-long line section depending on the operation of its ends for the analyzed four-circuit lines.
Analyzed Silhouette (Figure 7)ScenarioCircuits I, II and IIIBeginning of the Section (C.IV)End of the Section (C.IV)Potential at the Beginning of the Section Vb, VPotential at the End of the Section Ve, V
Phase APhase BPhase CPhase APhase BPhase C
gS1No-loadInsulatedInsulated43,26738,44066,82343,26738,44066,823
S2On-load, Iz *InsulatedInsulated43,27638,45066,82343,16938,36066,712
S3On-load, IzInsulatedEarthed1.10.92.1311.2288.9391.2
S4On-load, IzEarthedEarthed155.2143.9195.9154.2143.1193.9
hS1No-loadInsulatedInsulated56,71750,27031,84956,71750,27031,849
S2On-load, IzInsulatedInsulated56,70750,26331,84956,69350,23931,813
S3On-load, IzInsulatedEarthed1.81.40.7262.1240.7174.4
S4On-load, IzEarthedEarthed131.9120.686.6130.2119.385.9
iS1No-loadInsulatedInsulated31,69729,08855,14031,69729,08855,140
S2On-load, IzInsulatedInsulated31,71029,10055,14431,62629,03155,041
S3On-load, IzInsulatedEarthed0.70.61.8299.6281.0377.2
S4On-load, IzEarthedEarthed149.1139.9188.5148.4139.3186.9
* Iz signifies long-term permissible current: 2850 A for 400 kV circuits, 1220 A for 220 kV, and 735 A for 110 kV.
Table 3. Maximum values of the touch currents flowing through the lineman’s body when he touches one of the phase conductors of circuit II of a double-circuit line (Figure 6), when Rhuman = 1000 Ω and there are two section lengths of the tested line.
ScenarioCircuit IBeginning of the SectionEnd of the SectionSection’s Length L, kmElectrical Shock Current It, mA
Phase APhase BPhase C
S1No-loadInsulatedInsulated122.332.166.8
150<1<1<1
S2On-load, 0.5 Iz *InsulatedInsulated122.332.266.9
150<1<1<1
S3On-load, 0.5 IzInsulatedEarthed1108.351,329.7
15010,147.43815.26737.7
S4On-load, 0.5 IzEarthedEarthed154.325.815.3
1502357.0796.62046.9
* Iz is the long-term permissible current.
Table 4. Maximum values of the touch currents flowing through the lineman’s body when he touches one of the phase conductors of circuit II of a double-circuit line (Figure 6), when Rhuman = 1000 Ω + 250 kΩ and there are two section lengths of the tested line.
ScenarioCircuit IBeginning of the SectionEnd of the SectionSection’s Length l, kmElectrical Shock Current It, mA
Phase APhase BPhase C
S1No-loadInsulatedInsulated117.024.952.2
150<1<1<1
S2On-load, 0.5 Iz *InsulatedInsulated117.025.052.1
150<1<1<1
S3On-load, 0.5 IzInsulatedEarthed1<1<1<1
15041.615.627.6
S4On-load, 0.5 IzEarthedEarthed1<1<1<1
1509.53.28.3
* Iz is the long-term permissible current.
Table 5. Smallest and largest expected touch currents It at the end of a 1 km section of disconnected circuit with the lowest rated voltage of three-circuit lines, together with the corresponding phase configurations. The remaining circuits are loaded with long-term permissible currents Iz.
Analyzed Silhouette (Figure 7)ScenarioItmin, mAPhase Configuration Graphic for ItminItmax, mAFigure of Phase Configuration Graphic for Itmax
aS237.7Energies 17 04276 i00196.2Energies 17 04276 i002
S357.6187.6
S428.894.6
bS228.2Energies 17 04276 i00376.7Energies 17 04276 i004
S349.9226.4
S425.5113.4
b *S235.9Energies 17 04276 i00590.6Energies 17 04276 i006
S333.2114.5
S416.257.7
cS237.7Energies 17 04276 i007130.2Energies 17 04276 i008
S357.6293.8
S428.8146.9
dS222.5Energies 17 04276 i00943.6Energies 17 04276 i010
S325.7111.6
S413.055.5
eS215.5Energies 17 04276 i01177.9Energies 17 04276 i012
S327.7238.7
S413.9119.2
fS257.1Energies 17 04276 i013121.3Energies 17 04276 i014
S370.1338.7
S435.1169.5
* Analysis carried out with the outage of circuit II and circuit III loaded with Iz; Each color corresponds to individual phases of a three-phase system, but it does not matter which phase is initially assigned a given color.
Table 6. Smallest and largest expected touch currents It at the end of a 1 km section of disconnected circuit with the lowest rated voltage of four-circuit lines, together with the corresponding phase configurations. The remaining circuits are loaded with long-term permissible currents Iz.
Analyzed Silhouette (Figure 7)ScenarioItmin, mAPhase Configuration Graphic for ItminItmax, mAFigure of Phase Configuration Graphic for Itmax
gS219.3Energies 17 04276 i015163.5Energies 17 04276 i016
S325.6405.7
S413.0202.6
hS250.9Energies 17 04276 i017135.9Energies 17 04276 i018
S345.4311.4
S423.0155.3
iS237.7Energies 17 04276 i019136.6Energies 17 04276 i020
S338.2387.8
S419.0193.5
Each color corresponds to individual phases of a three-phase system, but it does not matter which phase is initially assigned a given color.
Disclaimer/Publisher’s Note: The statements, opinions and data contained in all publications are solely those of the individual author(s) and contributor(s) and not of MDPI and/or the editor(s). MDPI and/or the editor(s) disclaim responsibility for any injury to people or property resulting from any ideas, methods, instructions or products referred to in the content.

