1. Introduction
The requirements of modern electricity systems include minimalizing energy losses by increasing efficiency, especially in times of rising electricity prices and the associated
emission certificates. In transmission lines (cable or overhead lines), the flowing current causes power losses connected with various physical phenomena. The primary source of power loss in conductors is the conductor heating during current flow, and then the energy is released as Joule heat [
1,
2].
For this reason, the power value and load character supplied by the transmission line must be considered at the design stage. This helps avoid overloading the cables and subsequently damaging the insulation due to an excessive temperature rise. In particular, one should pay attention to non-linear loads that generate higher harmonics of the current in the mains. These loads have a negative effect on the transmission line because the higher harmonics have a significant impact on the power losses and cable temperature increase [
3,
4]. Long-term cable operation in these conditions can lead to insulation degradation and severe damage to power cables. In turn, grid failures affect economic losses in manufacturing companies due to unplanned downtime and shutdowns. It also generates additional costs associated with repairing the installation. The cost and repair time, especially for underground cable lines, is very high. The problem of the impacts of current harmonics on power loss and temperature distribution in power cables is mentioned in [
5,
6,
7,
8].
The method described in the IEC 60287-1-1:2006+A1:2014 standard [
9] is often used to calculate the approximate value of active power loss. This method operates on factors correlated with the skin effect. It allows obtaining active power losses using the resultant cross-resistance, considering the current penetration depth factor and assuming constant flow over the whole equivalent section for the calculated harmonic order. In the literature, we also find a description by the French researcher Levasseur. He analytically describes the phenomenon, based on observing the skin effect and using frequency changes in the Kelvin effect calculations [
10]. The next of the used methods is the method based on Bessel’s function. It allows for finding a solution to the equation in polar coordinate systems associated with wave propagation and spherical potentials. In calculations, the conductor resistance variation caused by the skin effect is considered a correction factor for
resistance. The method described by the authors in [
1] is based on calculating the equivalent
resistance by using the approximation function defined by a fourth-order polynomial (AM method).
The common element for calculating active power losses in power cable methods is determining the resultant resistance
for a given harmonic order of current
. In each mentioned method, both skin effect (
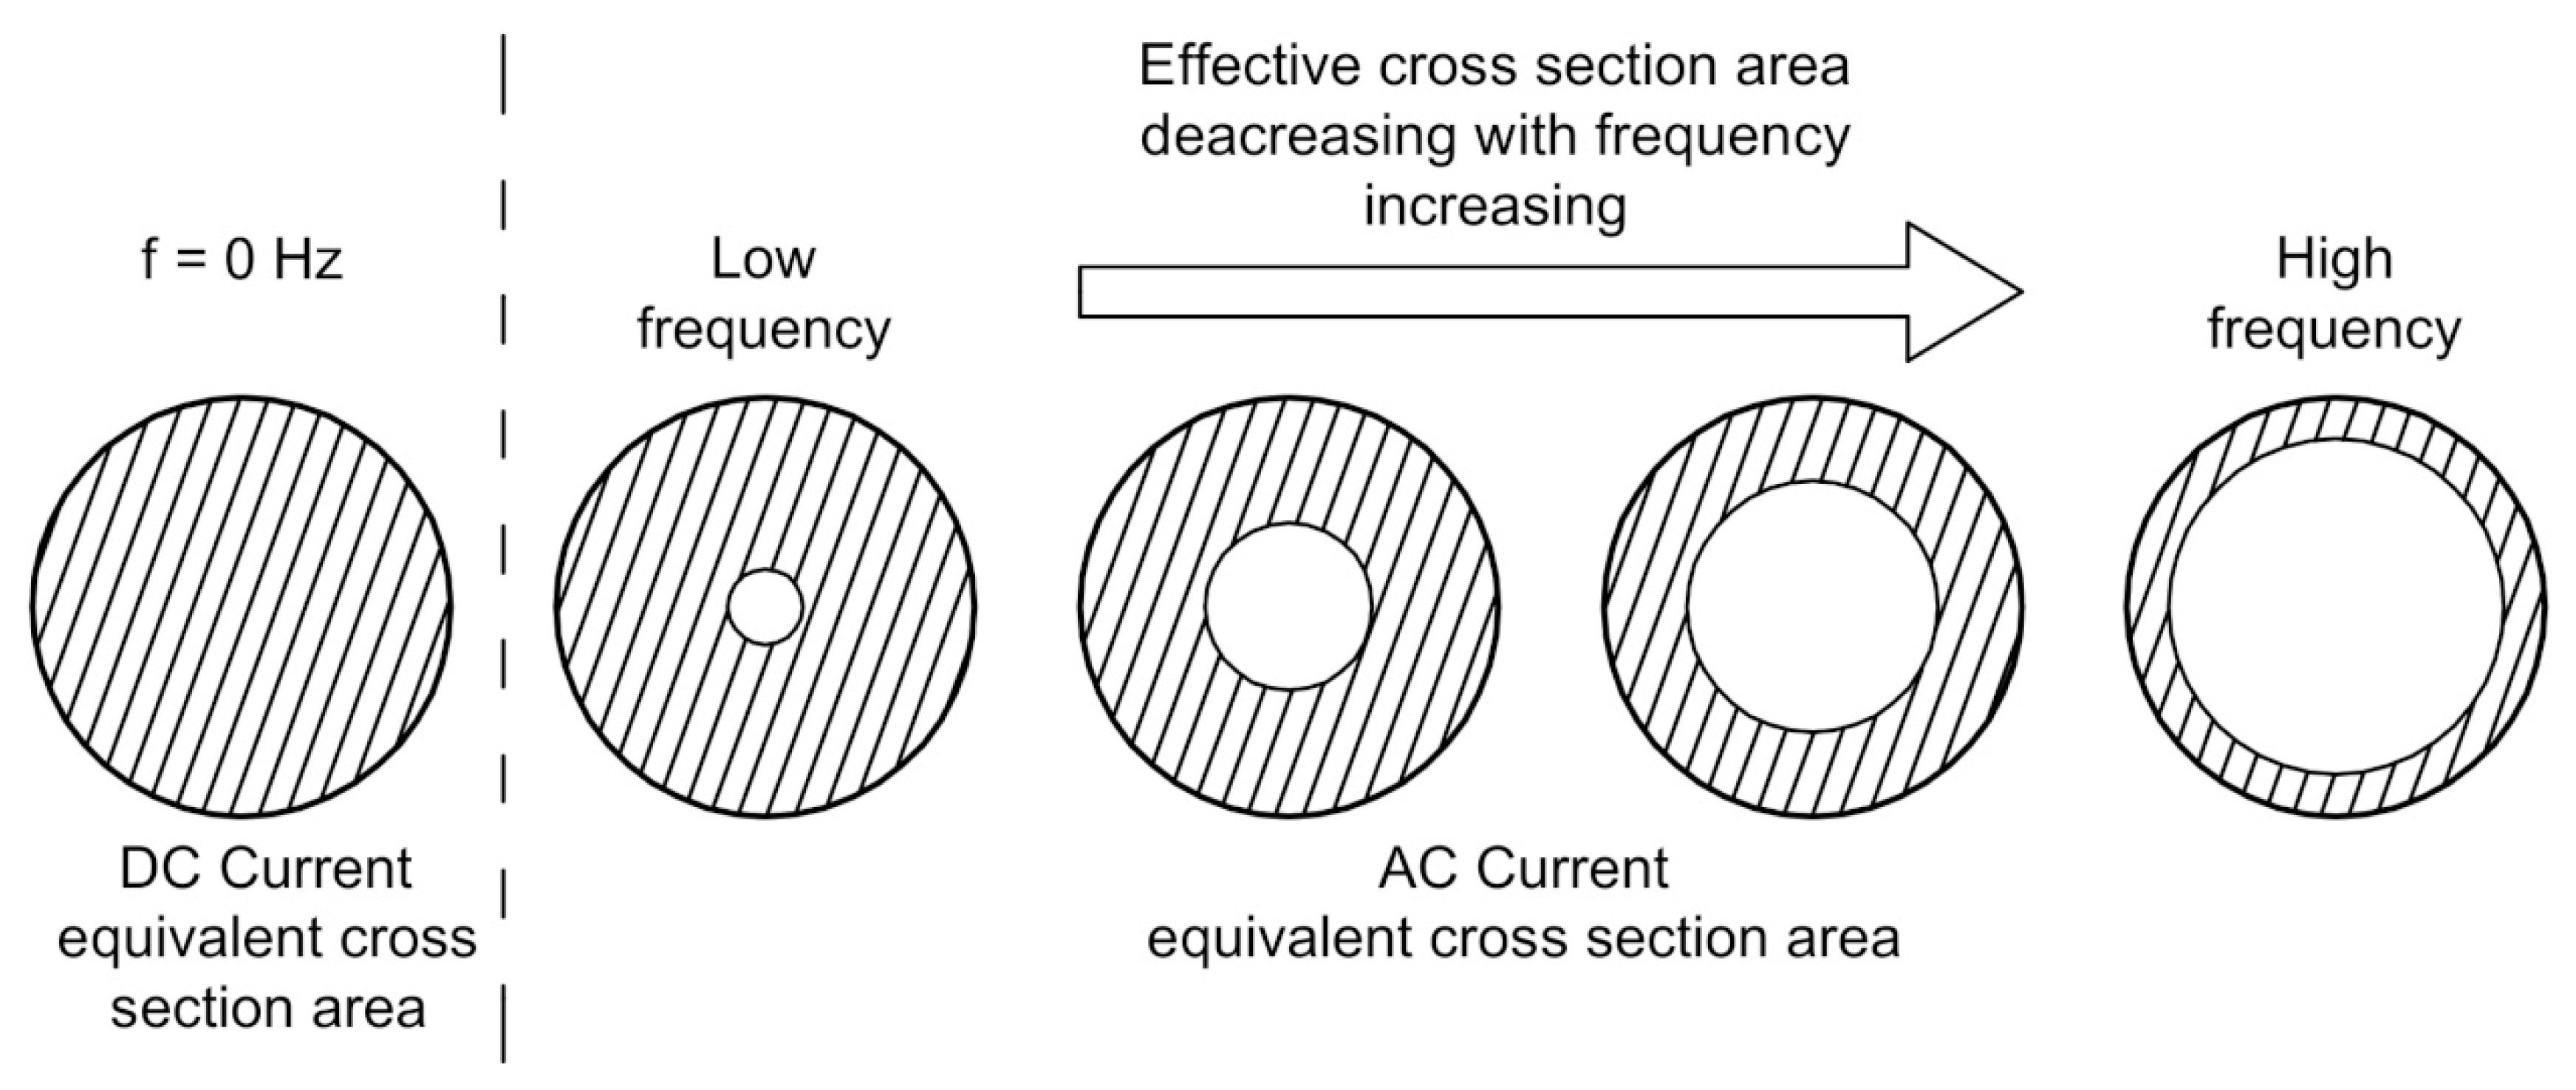
Figure 1) and conductor proximity can be considered. In addition, a temperature correction factor can be taken into account in order to calculate the new
for defined cable operating temperature.
In the methods from [
11,
12], the resistance increase for the fundamental frequency is taken into account regardless of the cross-sectional area. For small cross-sections (e.g., 25 mm
2), the current penetration depth—the skin effect caused—is greater than the radius of the low-voltage cable conductor. Thus, the conclusion is that the skin effect does not occur in this case, and the previously mentioned methods cause an error in the determination of active power losses. However, for the method described in [
4], the penetration depth factor is taken into account, including the value of the radius of the cable conductor under consideration (CPD).
The paper presents a comparison of the simplified method proposed by the authors [
4] with the standardized method IEC 60287-1-1:2006+A1:2014 [
9] for calculating active power losses in power supply lines. The obtained results can provide a starting point for calculating the temperature distribution for different power systems, including those using cable lines in different thermal backfills, e.g., sand–concrete mix (SCM) and geopolymer, for power transmission or for determining the optimal cable conductor diameter and insulation [
13,
14,
15,
16].
The main contribution of this work can be summarized as follows:
Comparison of the active power loss calculation method based on the current penetration depth coefficient (CPD) with results of the IEC and AM methods;
Comparison of values calculated with different methods;
Presentation of temperature distribution inside the cable through which the distorted current flows.
The following paper sections include the following:
Section 2: Methods used to determine equivalent cable resistance;
Section 3: Current distortion impact on the cable parameters;
Section 4: Calculation of the temperature distribution inside cable;
2. Methods Used for Calculating Conductor Resistance
Various methods are presented in the literature for calculating the resistance for selected current frequencies, that is, for the influence of skin effect on this parameter. A widely used method to determine the impact of higher harmonics on the conductor resistance is described in the IEC-60287-1-1:2006+A1:2014 standard [
9]. This method can be considered the skin effect and the proximity phenomenon (Equation (1)).
where
is the AC resistance of the conductor in ;
is the DC resistance of the conductor in ;
is a skin effect factor in
is a proximity effect factor in
is the coefficient depending on the number of cable cores (for single-core cable ), in ;
is the conductor diameter in [mm];
is the distance between conductor axis, [mm];
is the proximity coefficient depending on the geometrical shape and number of cable cores/sectors and the conductor material in .
The second method used to determine the resistance dependence of the skin effect is the method using Bessel functions (Equation (7)). The calculated resistance value as a frequency function is obtained as follows:
where
are Bessel functions of the first kind of the zeroth and first-order, respectively;
is the harmonic order number in ;
is the fundamental harmonic frequency in ;
is the vacuum permeability in ;
is the relative permeability in ;
is the conductivity of the material in .
Another case described in the literature allows for the determination of resistance changes based on the approximation method described in [
1].
where
According to the article [
1], the fourth-order equation allows for an average accuracy of less than 1% compared to solutions based on the method using Bessel functions [
1].
The power loss determination method proposed by the authors of this paper uses the current penetration factor (CPD) [
4]. The effective resistance
for selected current harmonics is determined according to the following formula:
where
is the wire length in ;
is the equivalent of cross-section area, including the skin depth effect, in .
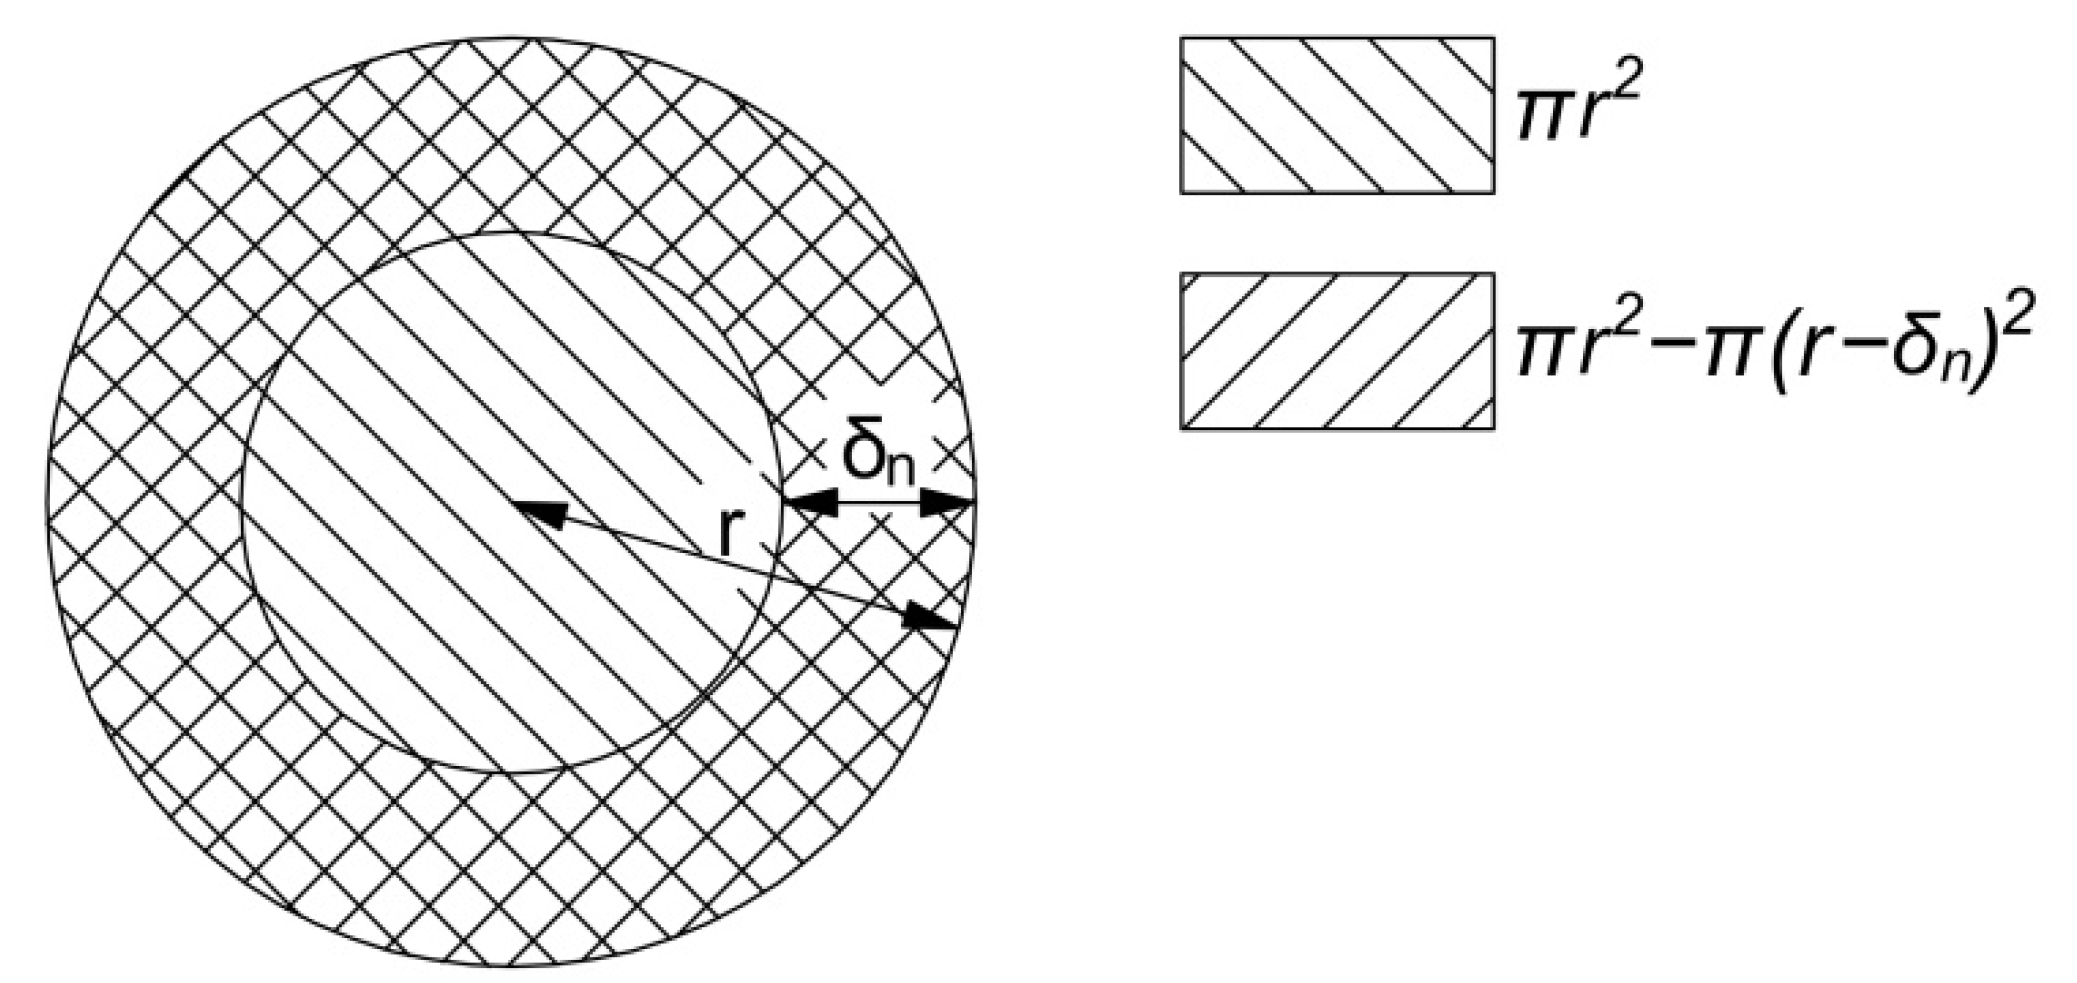
In cases wherein the part of the cross-section area of a conductor for the n-th current harmonic number is described as
the current penetration depth (expressed by Equation (13)) describes how far (counting from the external edge) flows the current [
11]. In this way, it is very easy to notice that a current of a given frequency flows through the effective conductor cross-area, whose dimensions are smaller than the geometric dimensions of the conductor (
Figure 2).
Based on the determined resistance values for each harmonic current, the active power losses are determined with the flow of distorted current:
where
Comparing IEC and CPD methods, one can see that CPD refers to each harmonic separately, and therefore, it allows for obtaining more accurate results, while the IEC method uses a kind of empirical equation prepared to verify how the conductor’s resistance changes. The IEC method is developed and applied to each cable type, such as stranded and solid round conductors and sector-shaped ones made from copper or aluminum material.
This paper presents the results of power loss calculations determined by AM, IEC, and CPD methods. The skin effect is considered in the analysis, while the proximity phenomenon
is neglected.
3. Current Distortion Impact on the Power Cables Parameters
An increasing current distortion is caused by an increase in non-linear loads connected to the power network. This leads to increased line voltage distortion, which in turn causes an increase in current distortion. The level of distortion is described by the
THDI (Current Total Harmonic Distortion) factor [
17].
where
The Fourier distribution can be used to write the current distribution into individual harmonics:
where
is the DC component of load current;
is the active current component;
is the reactive current component;
is the active current component of the higher harmonics;
is the reactive current component of the higher harmonics.
The authors considered requirements from the standard [
17] and conducted the power loss analysis according to these guidelines (current harmonics up to 40th order were included).
The impact of non-linear loads installed at individual electricity consumers on the losses resulting from the flow of distorted current is negligibly small. It is caused by the small values of the power transmitted in the LV distribution lines. However, a different approach should be used for the non-linear loads installed in the industrial sector. The power of the installed equipment generating the flow of higher harmonics is of the order from several hundred kW to several MW.
Power cables are widely used in power systems, especially in the industry sector. They have to fulfill many requirements in terms of electrical parameters (current carrying capacity, high insulation resistance, short-circuit durability) and mechanical (cable routing, environmental conditions, non-flammability, special working conditions). In the design stage, therefore, all of the above requirements should be taken into account.
Figure 3 shows the possible cable arrangement methods for three single-core cables. The highest working temperature for different types of insulation, according to IEC 60364-5-52:2009 standard [
18]:
Vulcanized natural rubber (VIR):
;
Polyvinyl chloride (PVC):
;
Polyethylene (PE):
;
Butyl rubber (IIK):
;
Cross-linked polyethylene (XLPE) and ethylene propylene rubber (EPR):
;
Ethylene–vinyl acetate (EVA):
;
Silicone rubber:
.
A significant influence on cable heating is the cable construction and the material from which it is made. The conductor material of the cable core determines its conductivity. In turn, the insulation material and its thickness determine the electrical and mechanical strength and heat distribution (cable heating). The proximity effect can be ignored in the single-conductor or multi-conductor shielded cables (when each conductor is shielded). The most commonly used low-voltage cables are non-shielded, so this effect cannot be ignored in these construction types. Increasing the accuracy of the calculations can help to reduce the cost of constructing cable lines.
The cable route routing and the backfilled material significantly impact the temperature distribution and the maximum load current value. The most common thermal backfill used for cables buried in the ground is dry sand, sand–bentonite mixtures (SCMs), sand, and Portland cement (in a 12:1 ratio) [
13,
14,
15].
There are also advantages of new materials, such as geopolymers with better thermal conductivity properties and improved safety for the environment [
17]. The better backfill thermal conductivity is important because it allows the conducting of heat efficiently during current flow through the cable. When the cable temperature increases, the electrical conductivity decreases, caused by a reduction in electron mobility in the metal conductor. The used backfill also reduces dry zones around the cables, which have negatively affected heat dissipation.
Cables with aluminum conductors, such as AsXSn, steel–aluminum (AFL), AlMgSi aluminum alloys (BLX-T), are commonly used in power systems. This has a direct effect on the lower conductivity value compared to copper conductors.
4. Calculation of the Temperature Distribution
In Equation (14), for the calculation value of active power losses, by including the temperature coefficient of resistance, the temperature effect on the value of the equivalent resistance is included in the calculation:
where
is the resistance of the conductor at t ;
is the resistance of the conductor at ;
is conductor temperature in ;
is references conductor temperature (default value ) in ;
is temperature coefficient of resistance of material at .
In Equation (14), the temperature impact on the equivalent resistance value described by Equation (17) was obtained as follows:
To calculate the temperature distribution inside a low-voltage power cable, the heat source can be represented as
Based on Equation (19), the temperature of the cable conductor (20), PVC insulation (21), backfill (22), and soil (23) should be determined as
where
x, y is a selected point in the calculation area on Cartesian coordinates;
is a thermal conductivity of the cable conductor in ;
is a thermal conductivity of the PVC insulation in ;
is a thermal conductivity of the backfill in ;
is a thermal conductivity of the soil in .
To solve Equations (20)–(23), have assumed boundary conditions as follows:
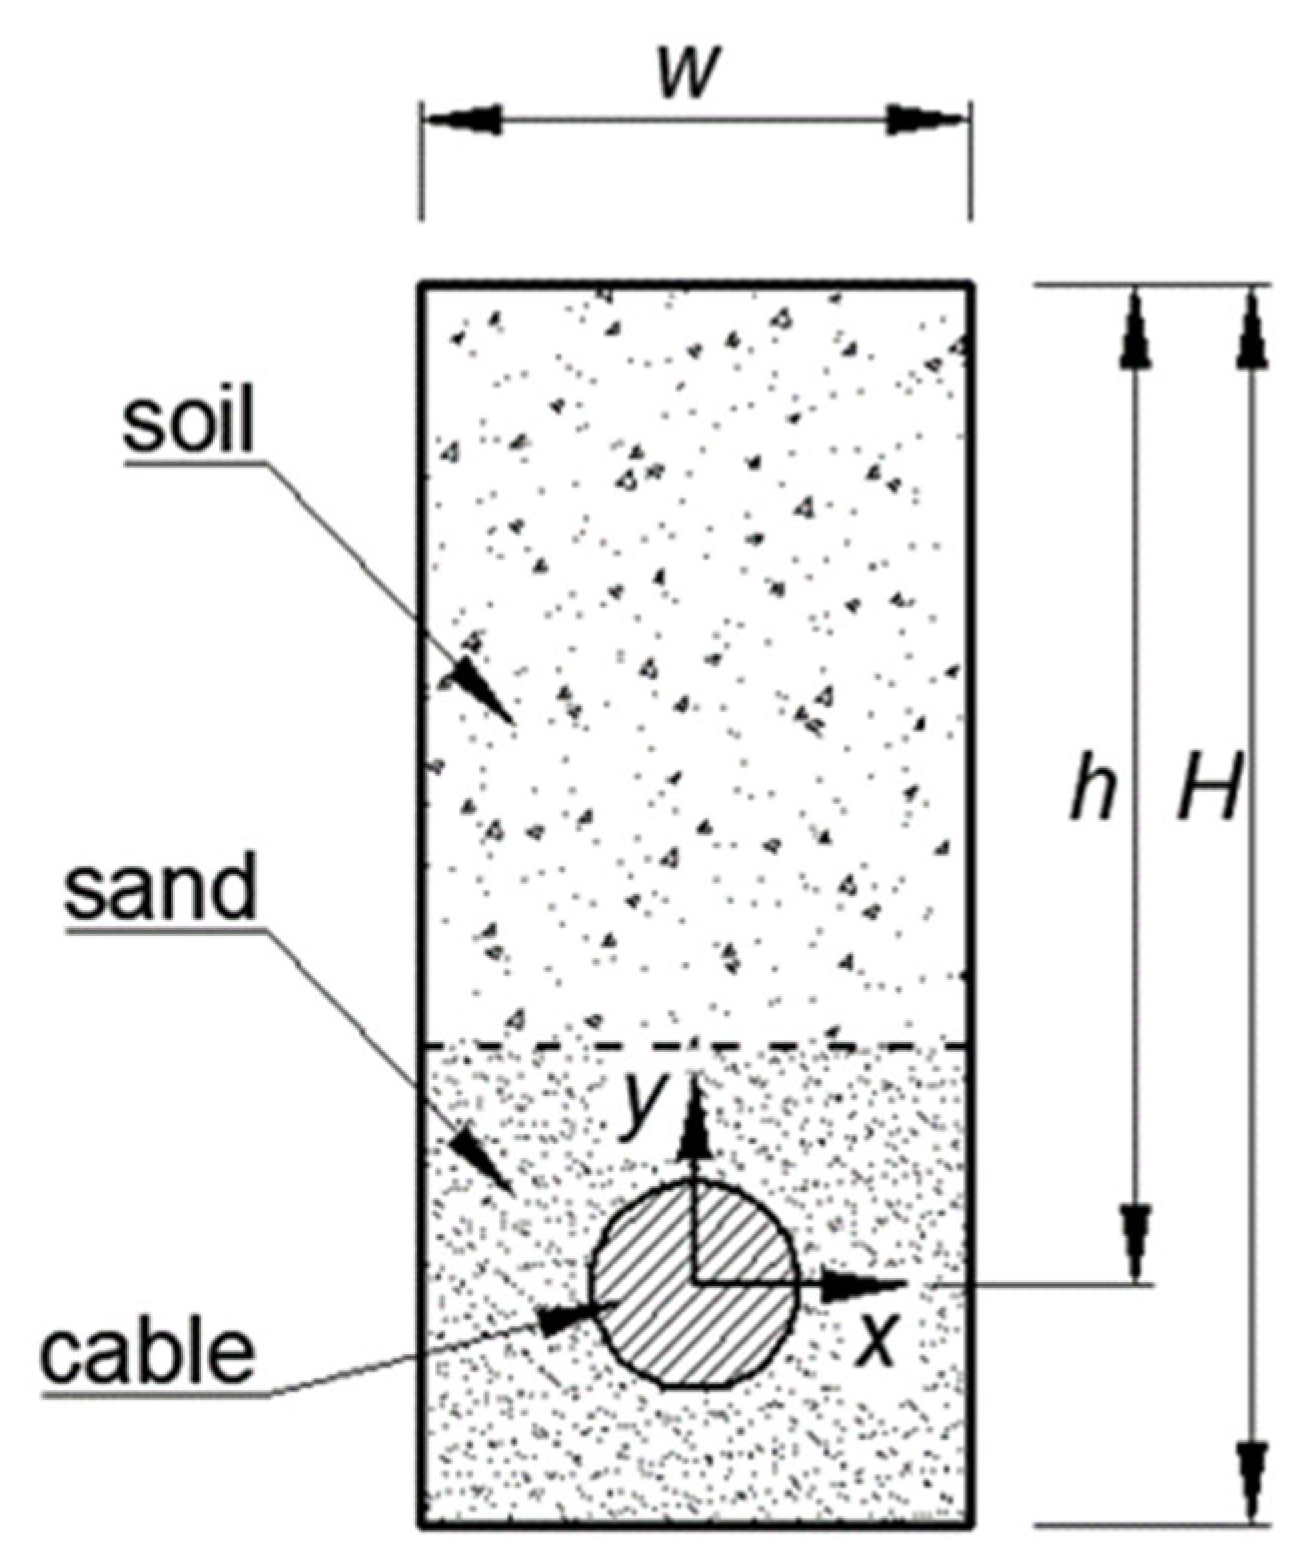
Figure 4 shows the excavation geometry for the low-voltage cable line used to calculate the temperature distribution.
Thermal conductivity values for different materials were taken as follows:
For cable conductor ;
For PVC insulation ;
For the outer layer of the cable ;
For backfill (sand) ;
For soil .
5. The Research Results
For selected methods used to calculate the impact of the skin effect on the values of equivalent resistance and, consequently, active power losses, calculations were made for a case where a distorted current flows through the conductor. For analysis, the following methods were selected: the method proposed by the authors (based on the current penetration coefficient CPD), the method described in the IEC standard, and the AM method.
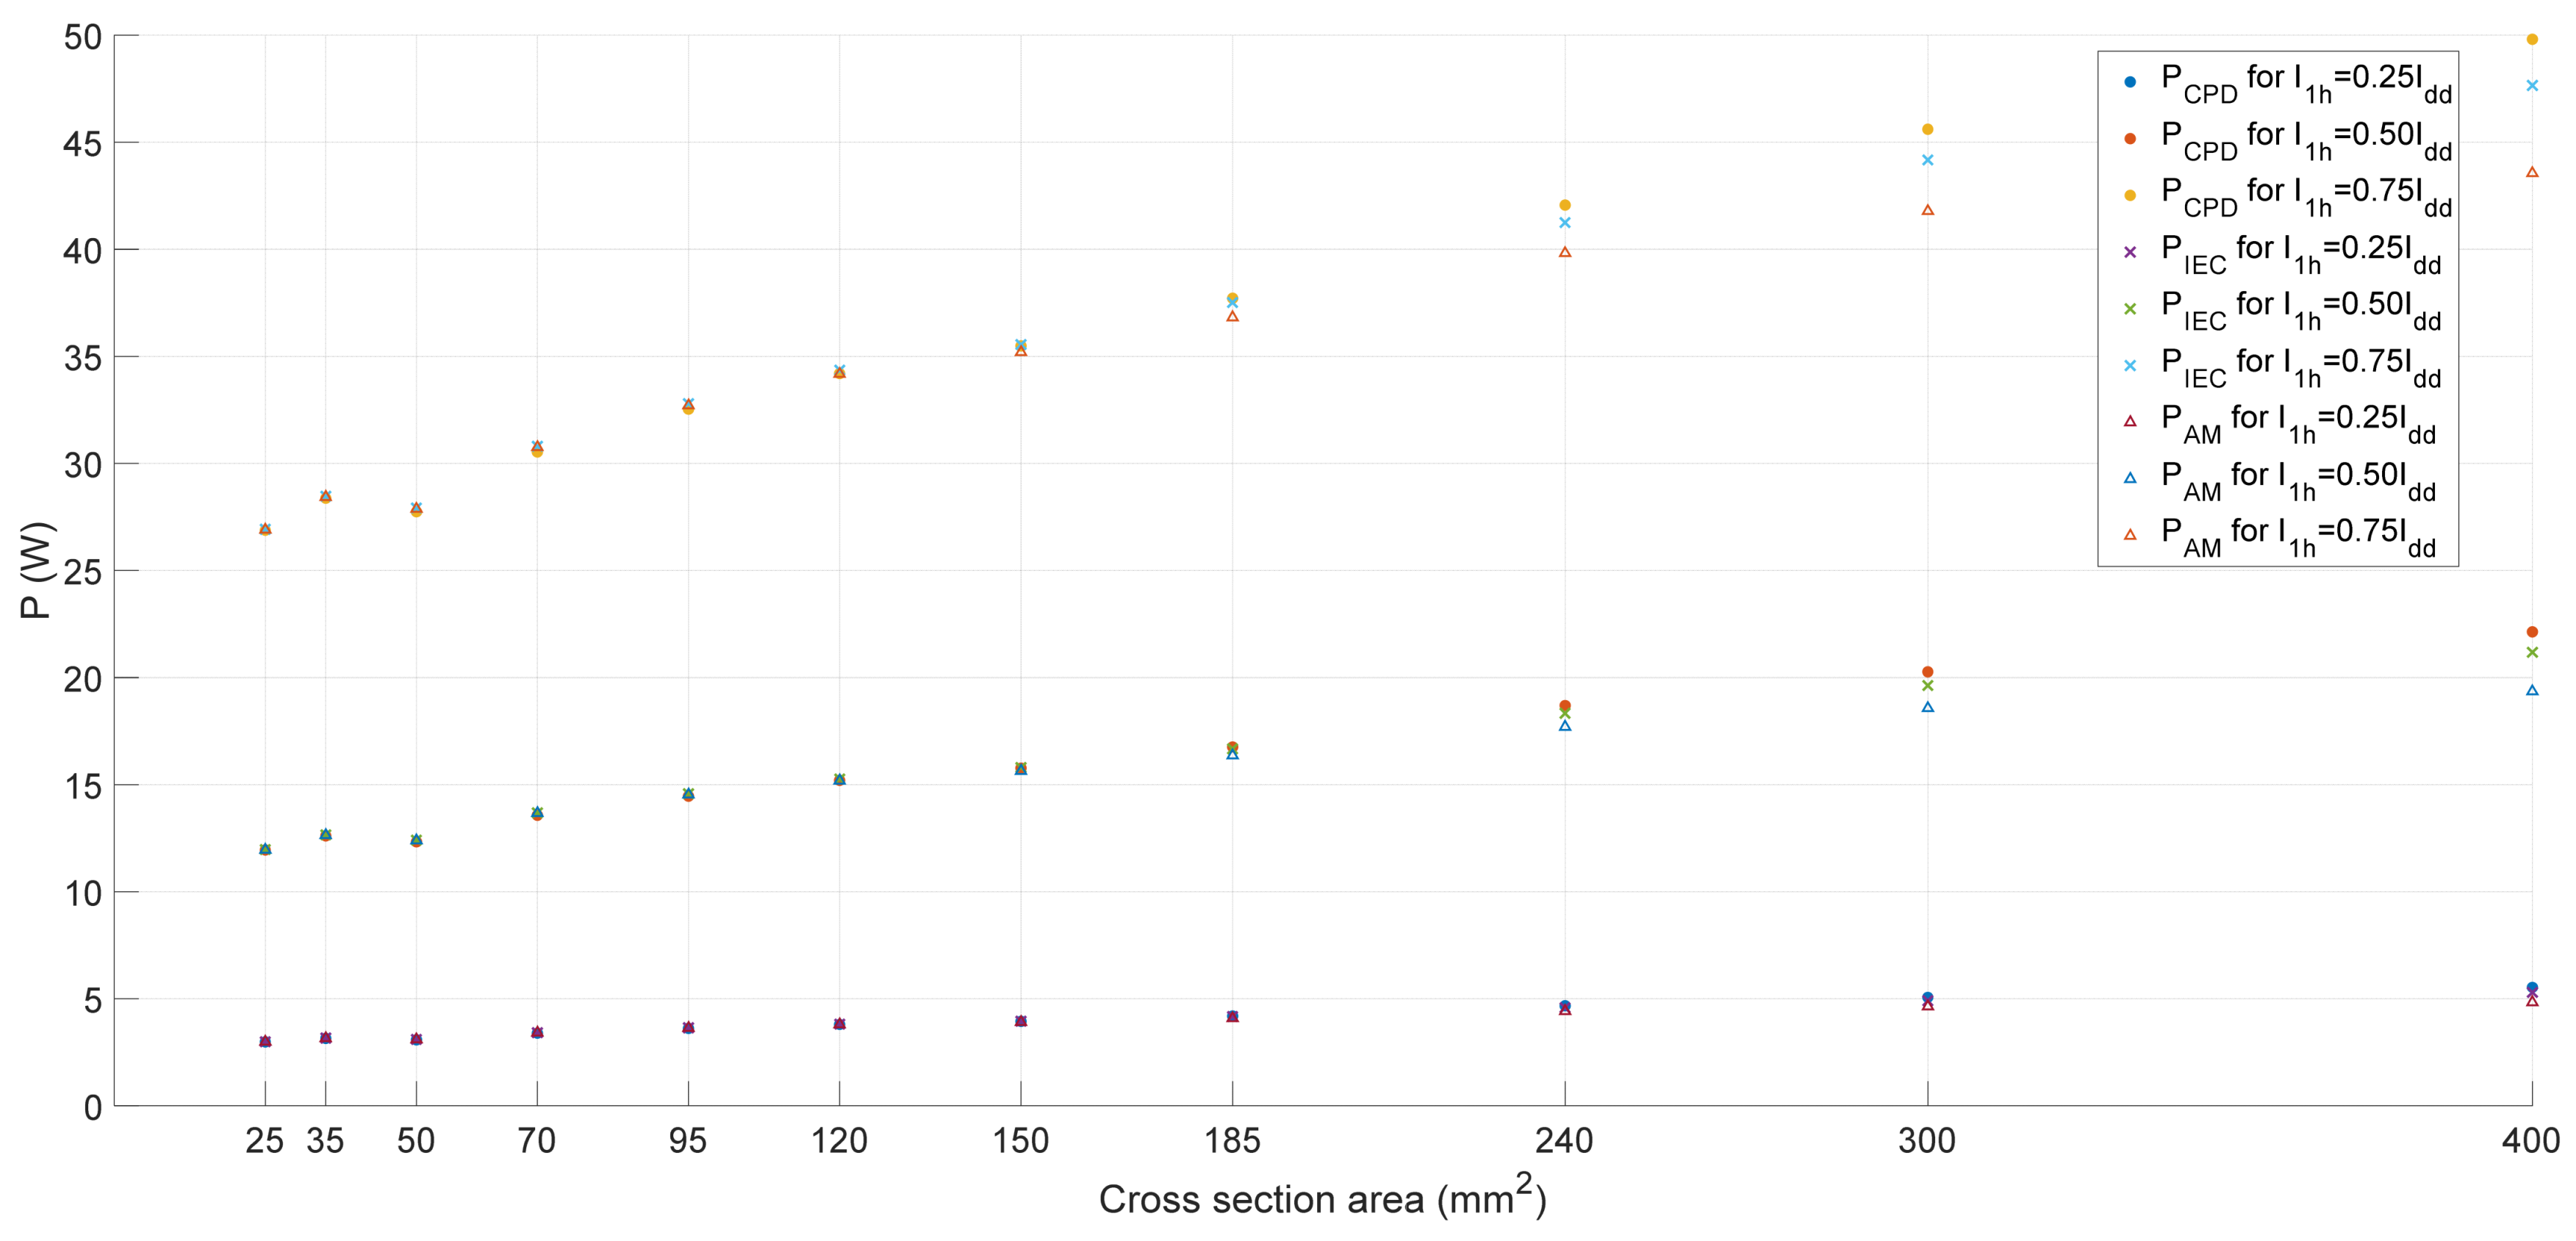
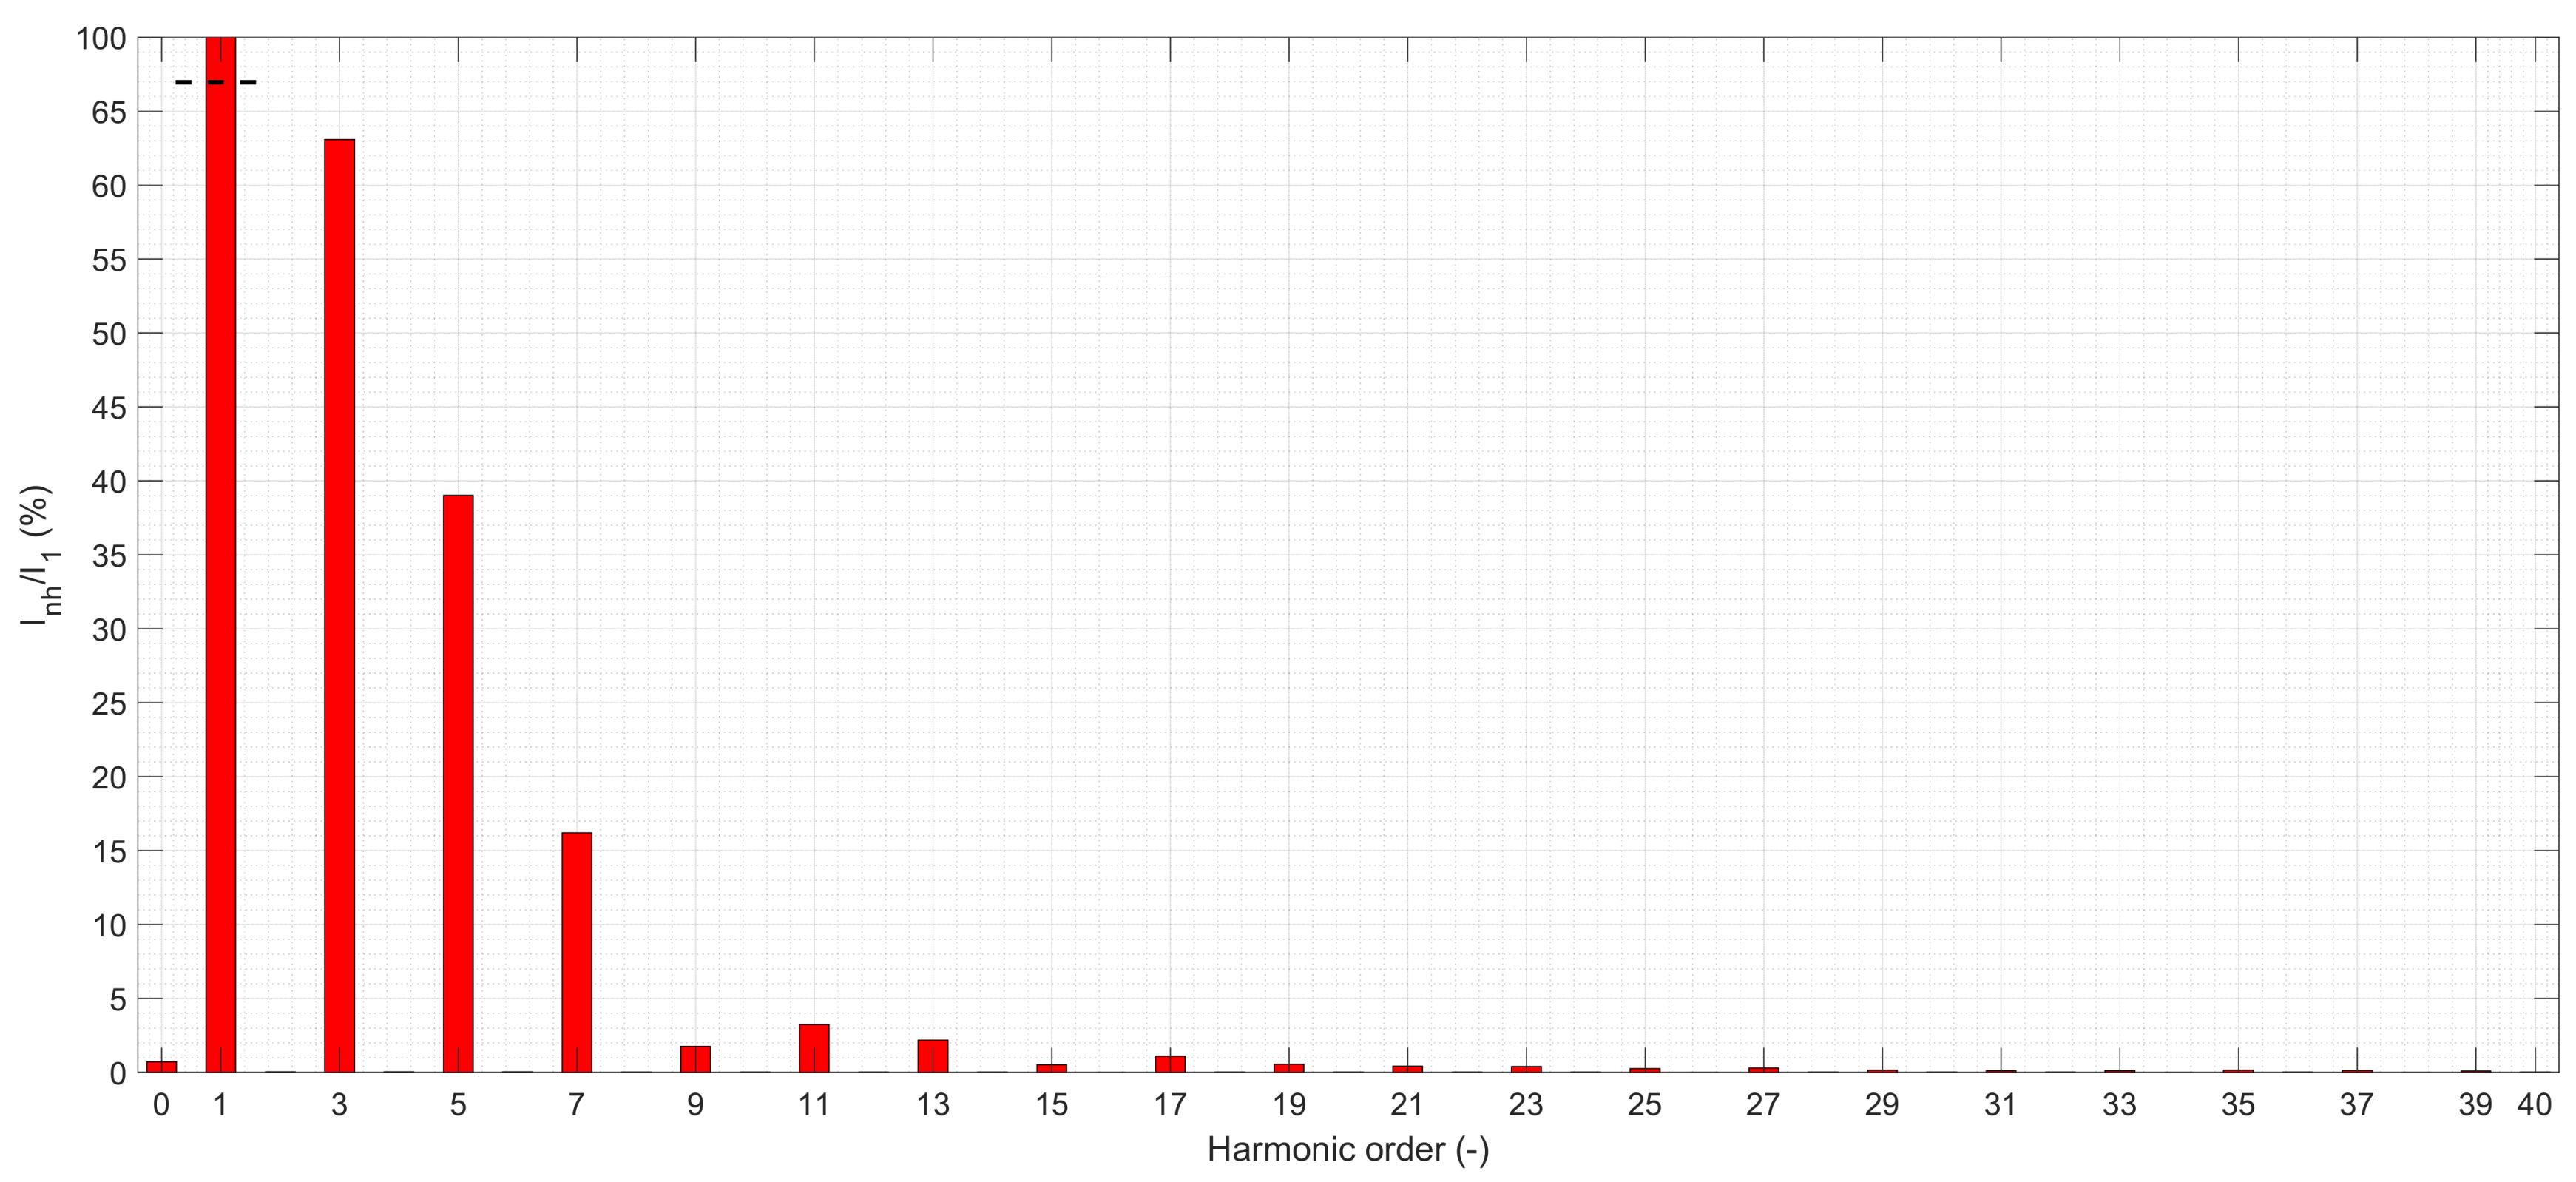
Figure 5 presents the active power losses for three different current loads of the first harmonic, equal to 25, 50, and 75% of the long-term current carrying capacity provided by the manufacturer for selected cross-sections of single-core YKY-type cables. The level of current distortion for which the calculations were conducted amounted to THDI = 76% (the current spectrum is presented in
Figure 6).
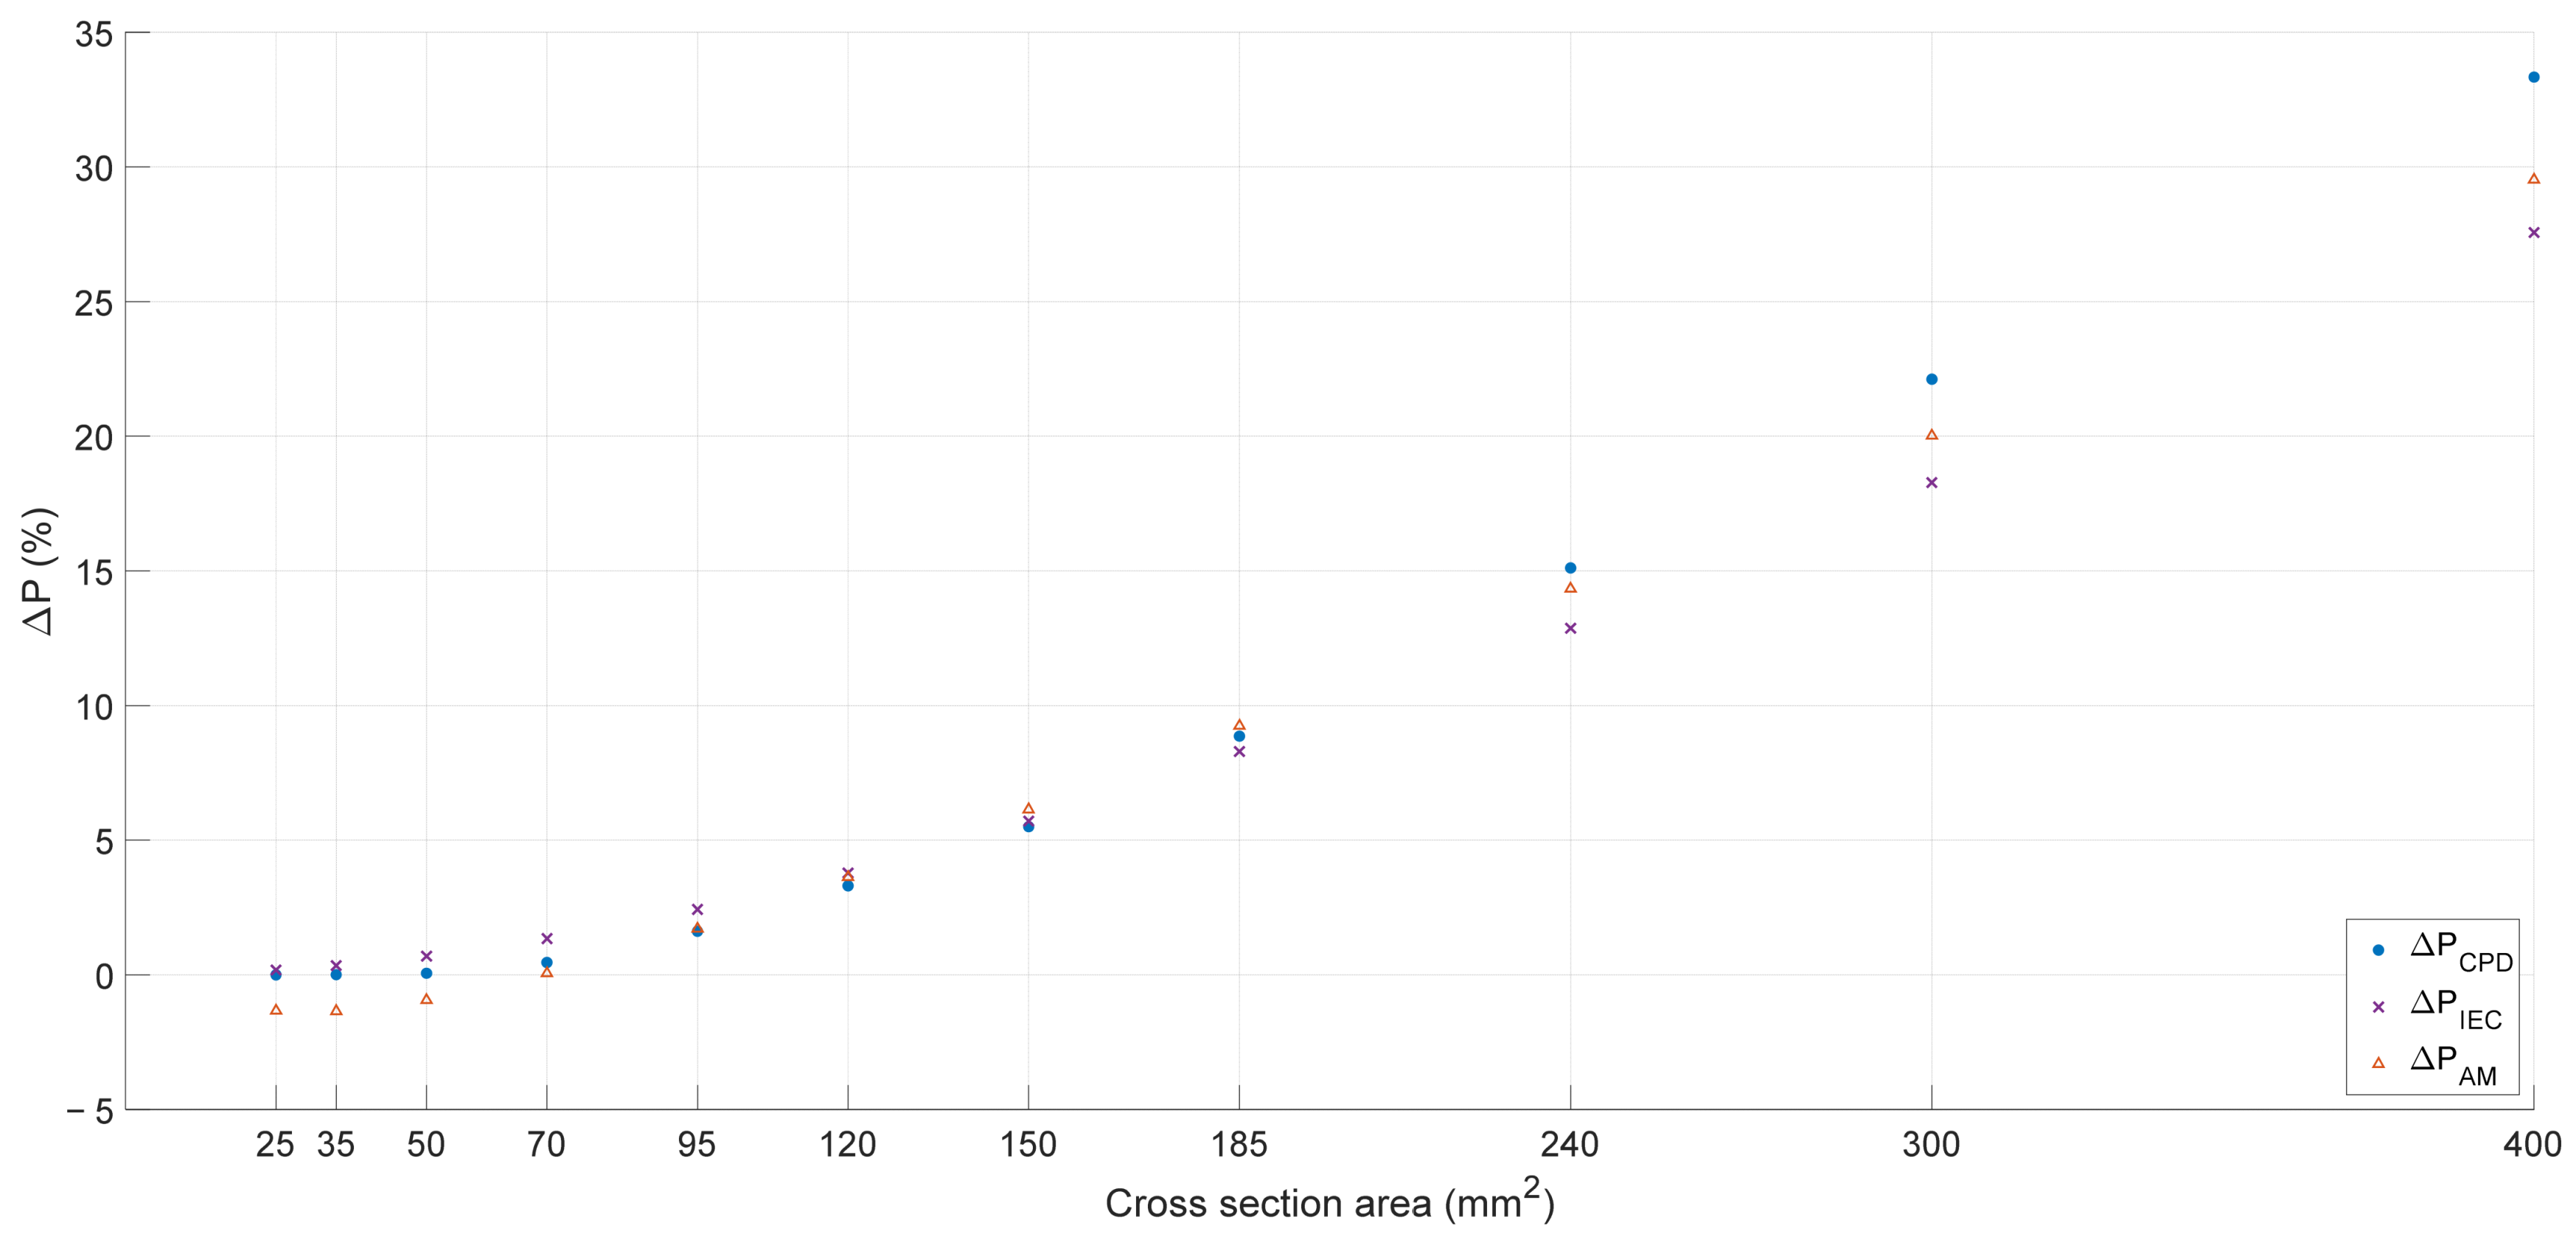
For relatively small cross-sections of 25–120 mm2, the impact of the skin effect is negligible, and the results for all computational methods are similar. With the increase in the conductor cross-section, the IEC method yields lower values compared to the other presented methods. For the largest cross-sections (300 mm2 and 400 mm2), the method presented by the authors results in the highest power loss values (the results are presented for a 1 m length of cable).
The unit active power losses for the analyzed cable cross-sections were compiled as a function of the relative change in reference to the ideal current waveform at a frequency of 50 Hz and an RMS value equal to the specified load-carrying capacity for the given case.
Figure 7 illustrates the values of relative power losses. For small cross-sections, both the authors’ method (CPD) and the IEC method yield positive values, meaning the calculated active power losses are higher than for the standard waveform. Conversely, for the AM method, negative values were obtained for cross-sections of 25–35–50–70 mm
2. This indicates that according to this method, power losses for a distorted waveform (THDI = 76%) in the given surface area ranges are lower than for the standard current waveform (undeformed 50 Hz sine wave). The highest increases in values occur for the AM method for cross-sections of 185–240 mm
2, and for analyzed cross-sections ≥ 300 mm
2, the results assume values smaller than those calculated by the CPD method and greater than those calculated by the AM method. The largest relative power loss values are obtained for cross-sections of 25–120 mm
2 using the IEC method, whereas for cross-sections ≥ 240 mm
2, the results assume the smallest values.
Both methods (AM and IEC) allow for the calculation of power losses, but as can be seen in
Figure 7, the obtained values are difficult to interpret. Results obtained by the AM method for small cross-sections take negative values, while the IEC method yields the highest values among all the analyzed methods. Beyond a cross-section of 120 mm
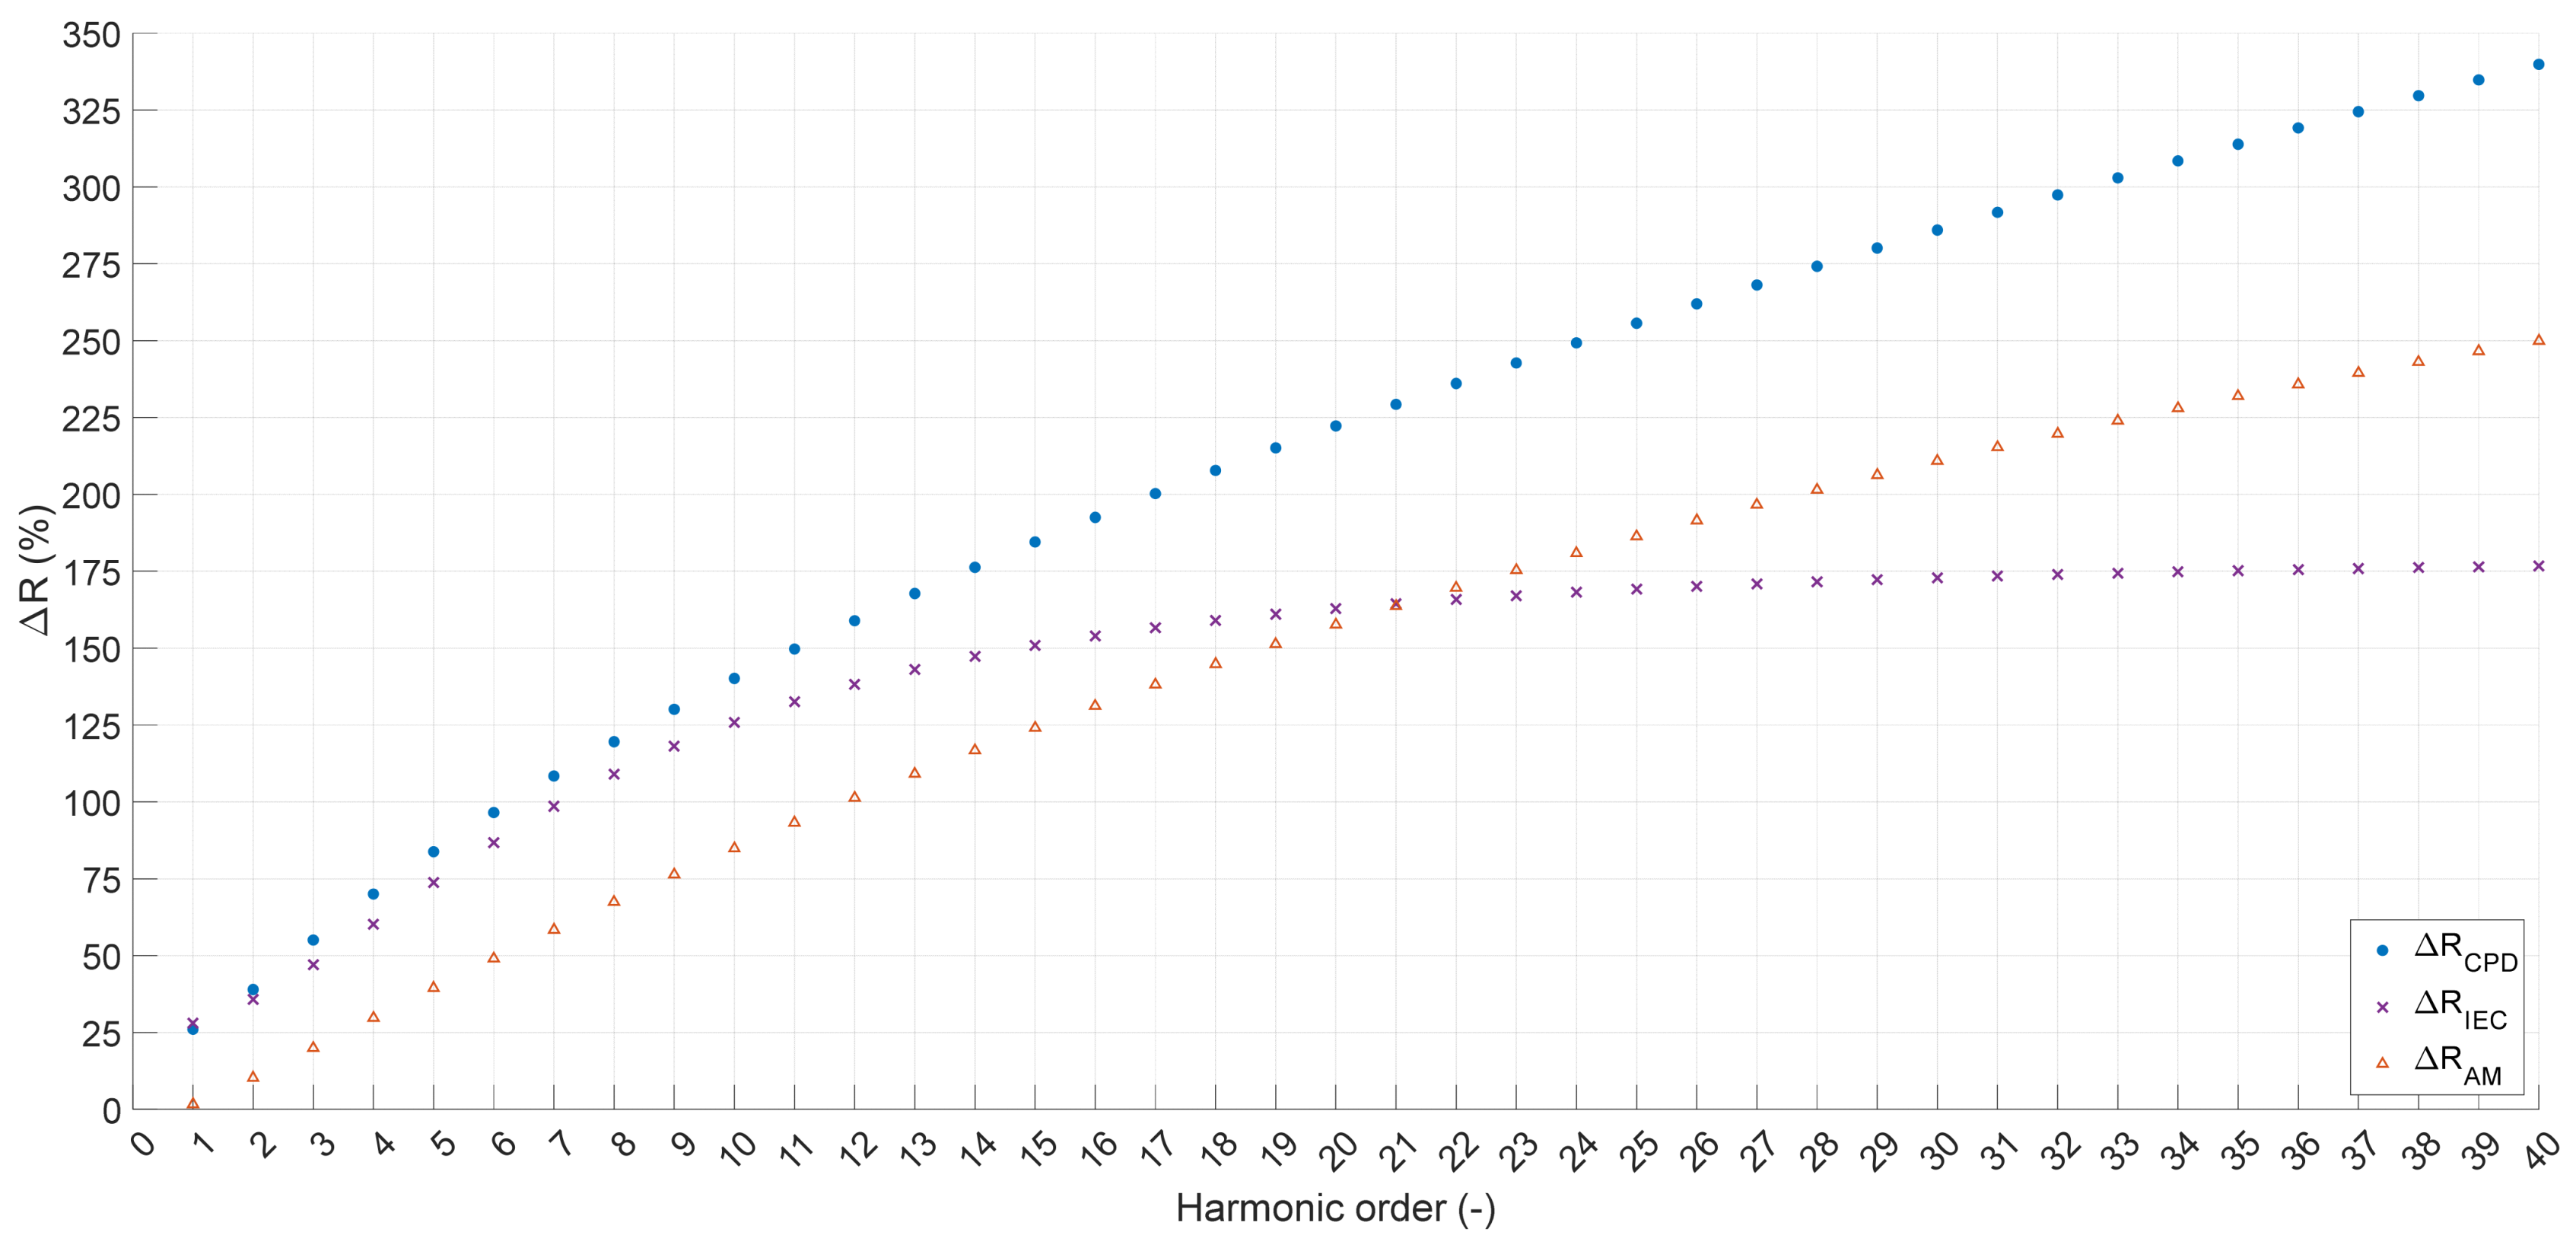
2, the values obtained by the AM method are higher than those calculated by the IEC method. Both methods use an approximating function when determining the equivalent resistance for higher harmonics. Comparing the results obtained by both methods reveals that for small cross-sections, the accuracy of the IEC method is higher, while for larger cross-sections, more accurate values are obtained based on the AM method. The method developed by the authors, which is based on an accurate calculation of penetration depth, returns results greater than 0 in every case, which, compared to the AM method, is a definite advantage. Another element indicating the inaccuracy of the AM method compared to the solution proposed by the authors is illustrated in
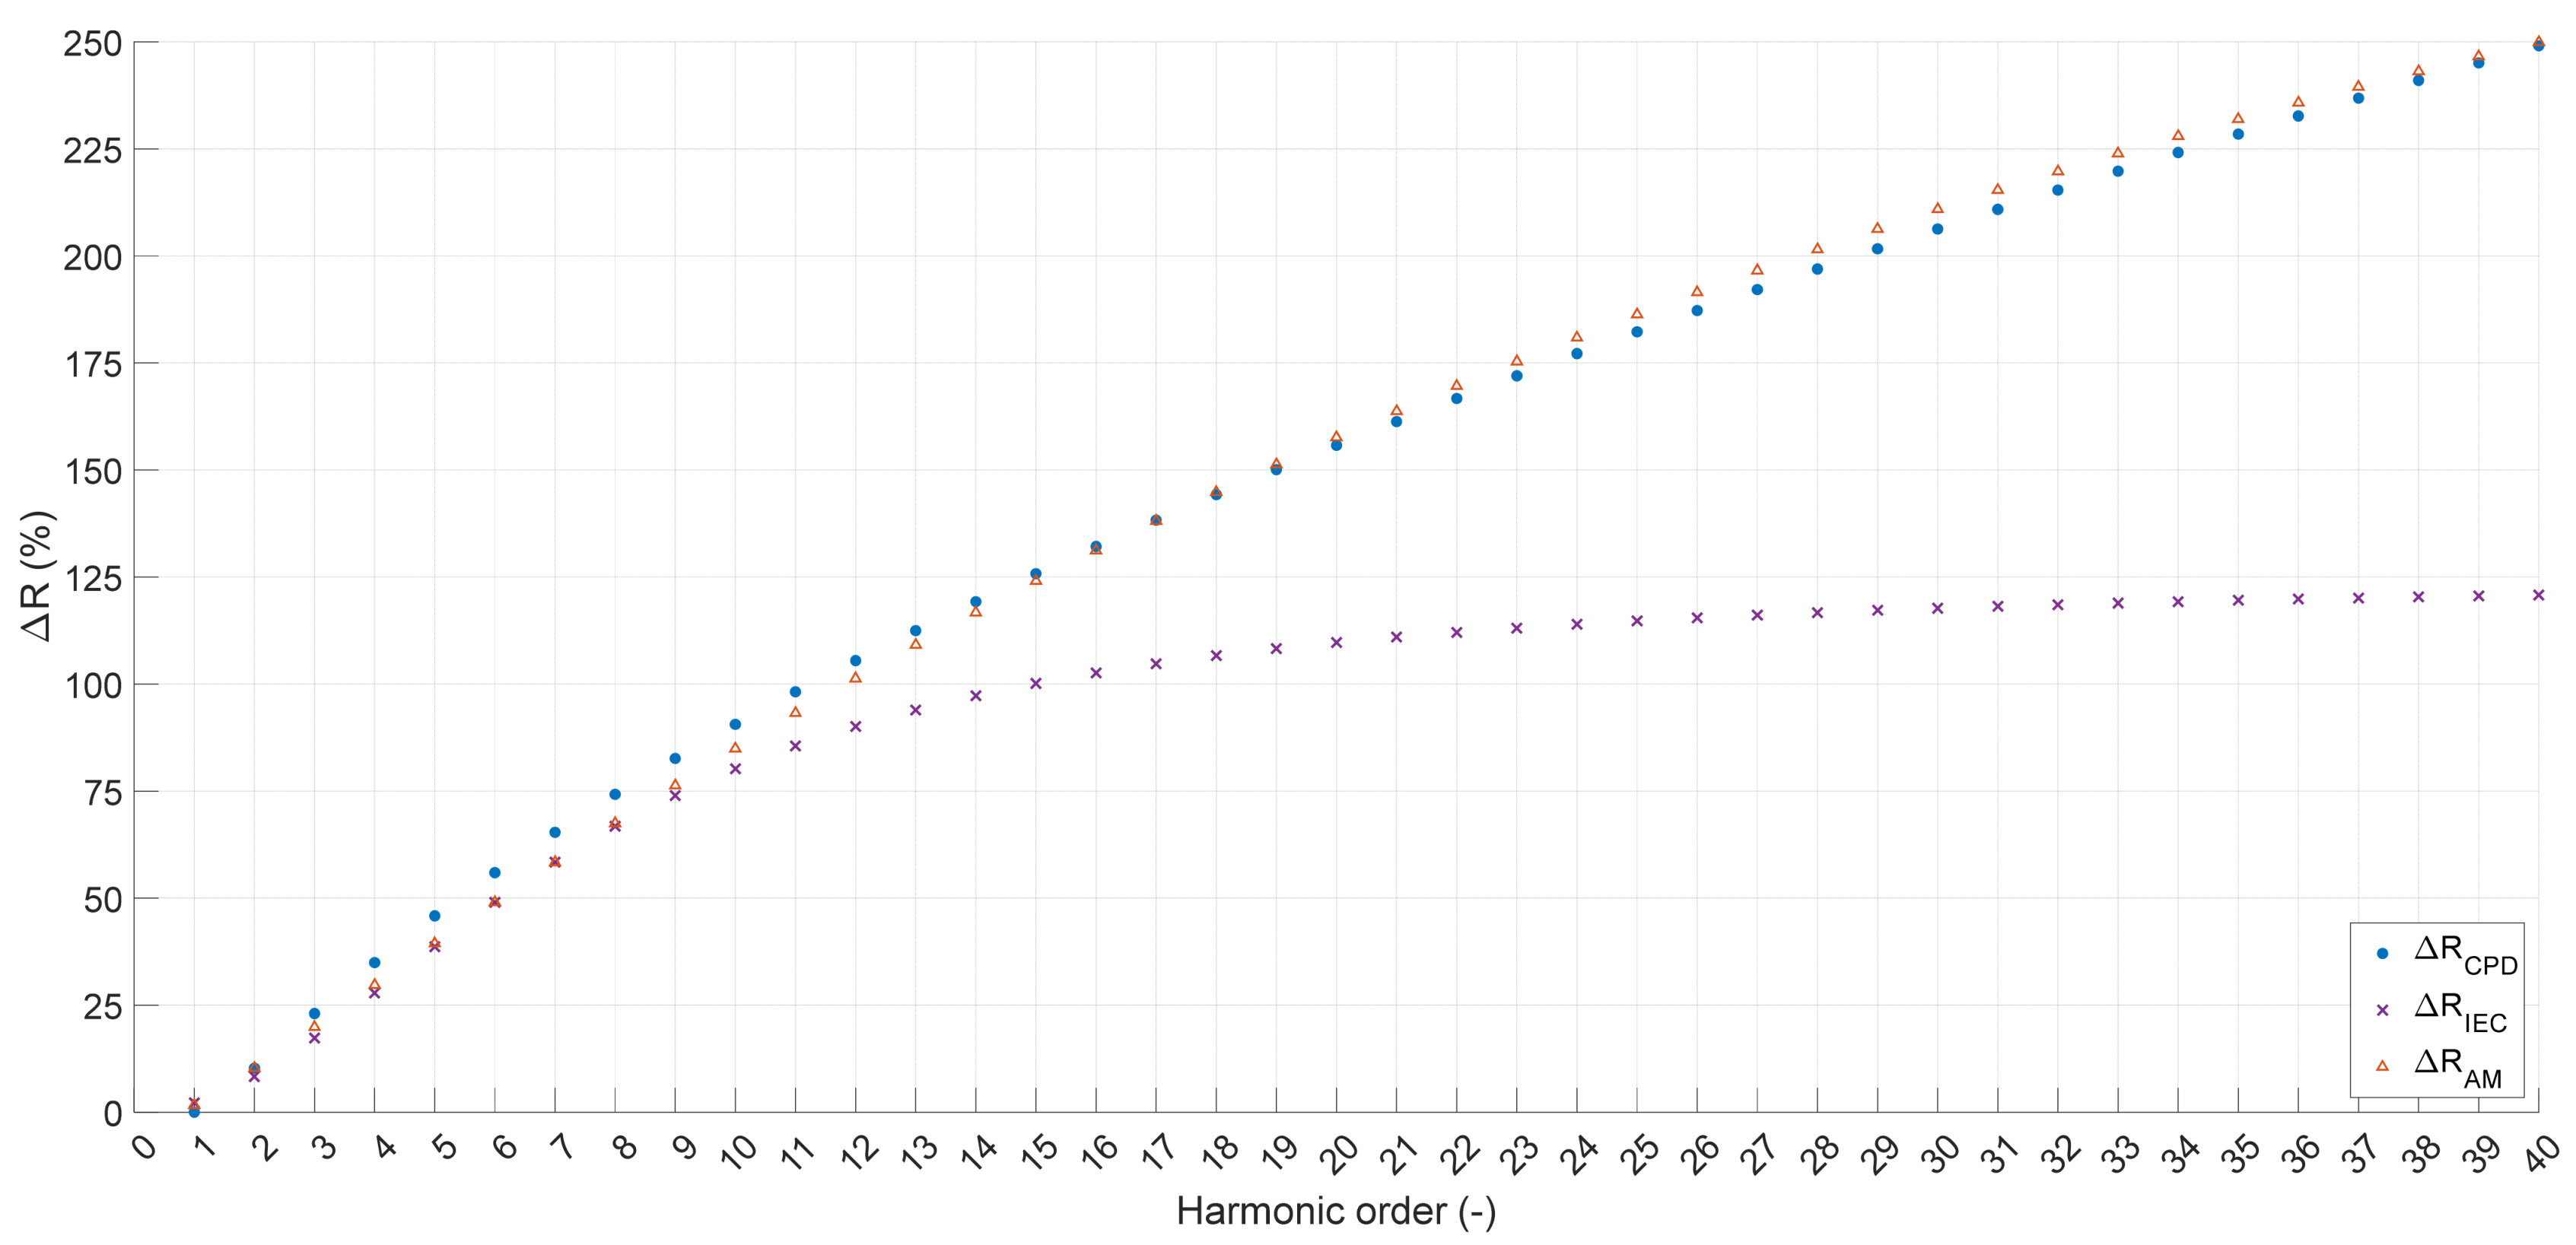
Figure 8 and
Figure 9 (20 °C) as well as
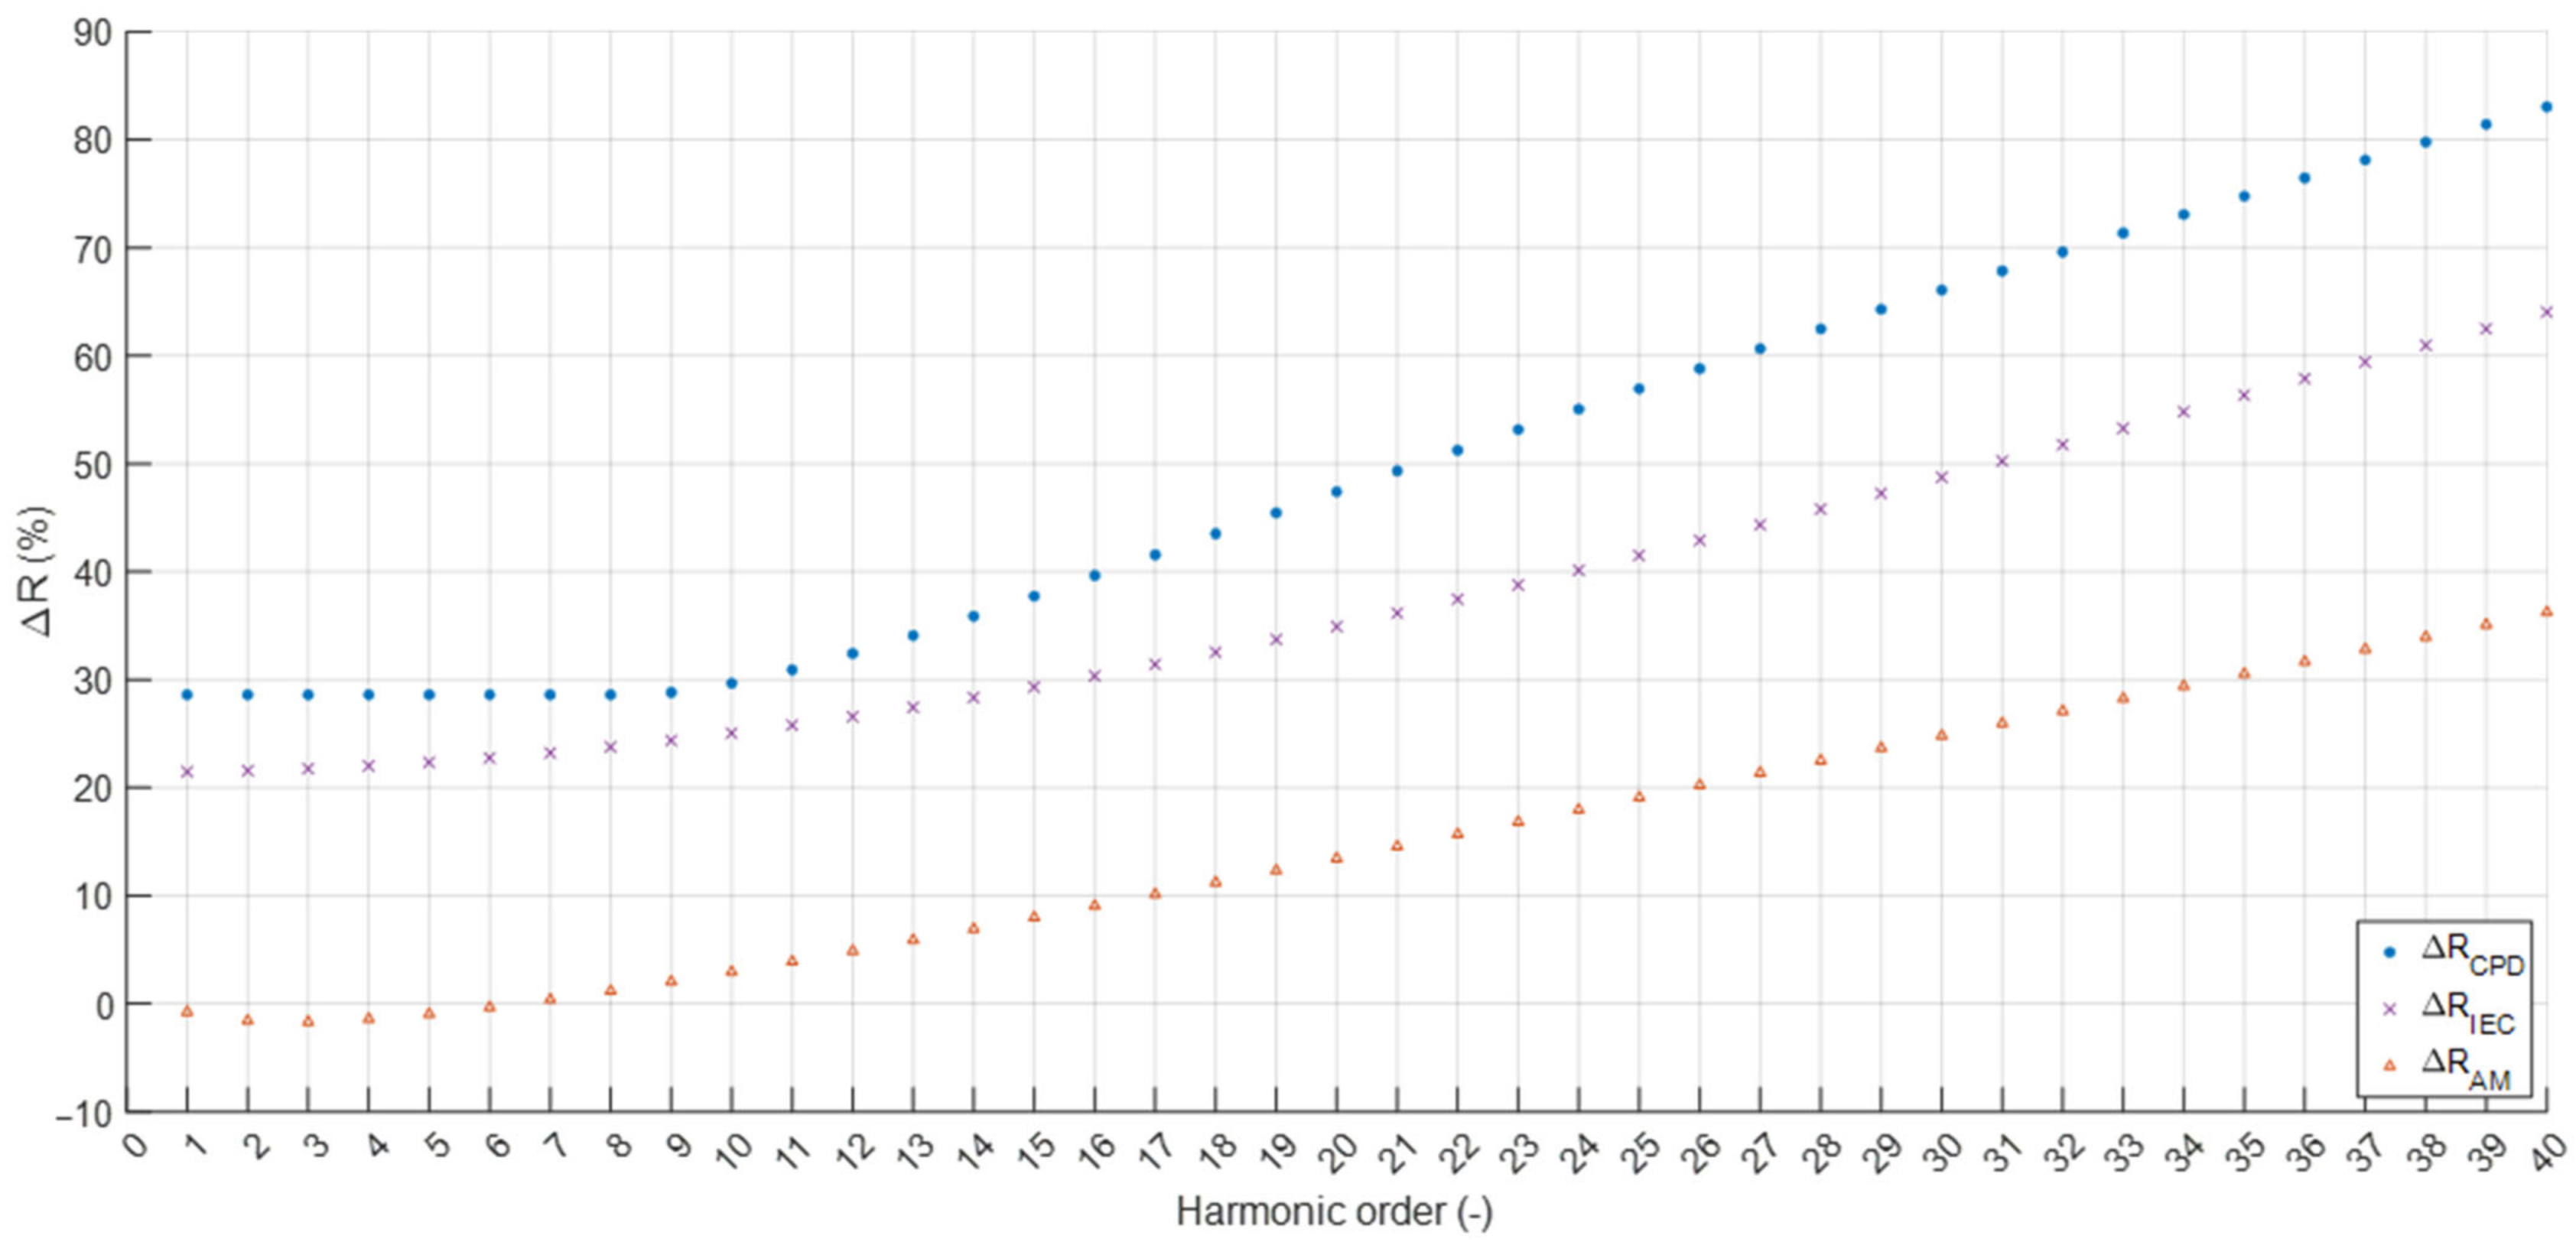
Figure 10 and
Figure 11 (~90 °C), where the relative values of resistance determined for each harmonic are compared in relation to the resistance for the fundamental harmonic. The results are presented for two cross-sections, 35 mm
2 and 300 mm
2. These values were chosen to show the results obtained for a cross-section where the skin effect is minimal (35 mm
2) and for one where the effect is already significant (300 mm
2).
For smaller cross-sections (
Figure 8 and
Figure 10), the resistance values calculated by the AM method are lower than the fundamental harmonic resistance. According to theory, this phenomenon is impossible to achieve. For cross-sections ≤ 25 mm
2, the current flows through the entire cross-sectional area of the conductor because the penetration depth for harmonics < 10 is greater than the radius of the conductor (δ
10h = 3.035 mm, while r
25mm2 = 2.82 mm). The obtained results would imply an increase in cross-section for these harmonics, which is impossible in the considered system. The CPD method (the authors’ method) assumes an increase in the resistance of a given harmonic relative to the fundamental in the case where a penetration depth is smaller than the radius of the conductor. As a result, for a large cross-section (300 mm
2—
Figure 9), values greater than the fundamental harmonic were obtained, while for a small cross-section (35 mm
2 Figure 8), for for harmonics less than 12, a constant resistance value equal to the fundamental resistance was obtained—the increase in calculated resistance amounted to 0.
An interesting relationship can be observed in the resistance change curve of a 300 mm2 cable for the IEC method. Starting from approximately the 20th harmonic, the resistance increase values are much smaller than for the other methods, i.e., AM and CPD. However, despite significant differences compared to other methods, these values do not have a significant impact on the final value. This is due to the fact that harmonics of the 12th order and higher take on small values. The major drawback of this method is the observed lack of an increase in losses for harmonics of order > 20. Despite the small amplitudes of harmonics of order > 20, the increase in resistance should not be close to zero. Such a tendency of the IEC method disqualifies it for applications aimed at precisely determining power losses in power cables in cases of distorted current waveforms, but only for cases where the current spectrum includes values > 20.
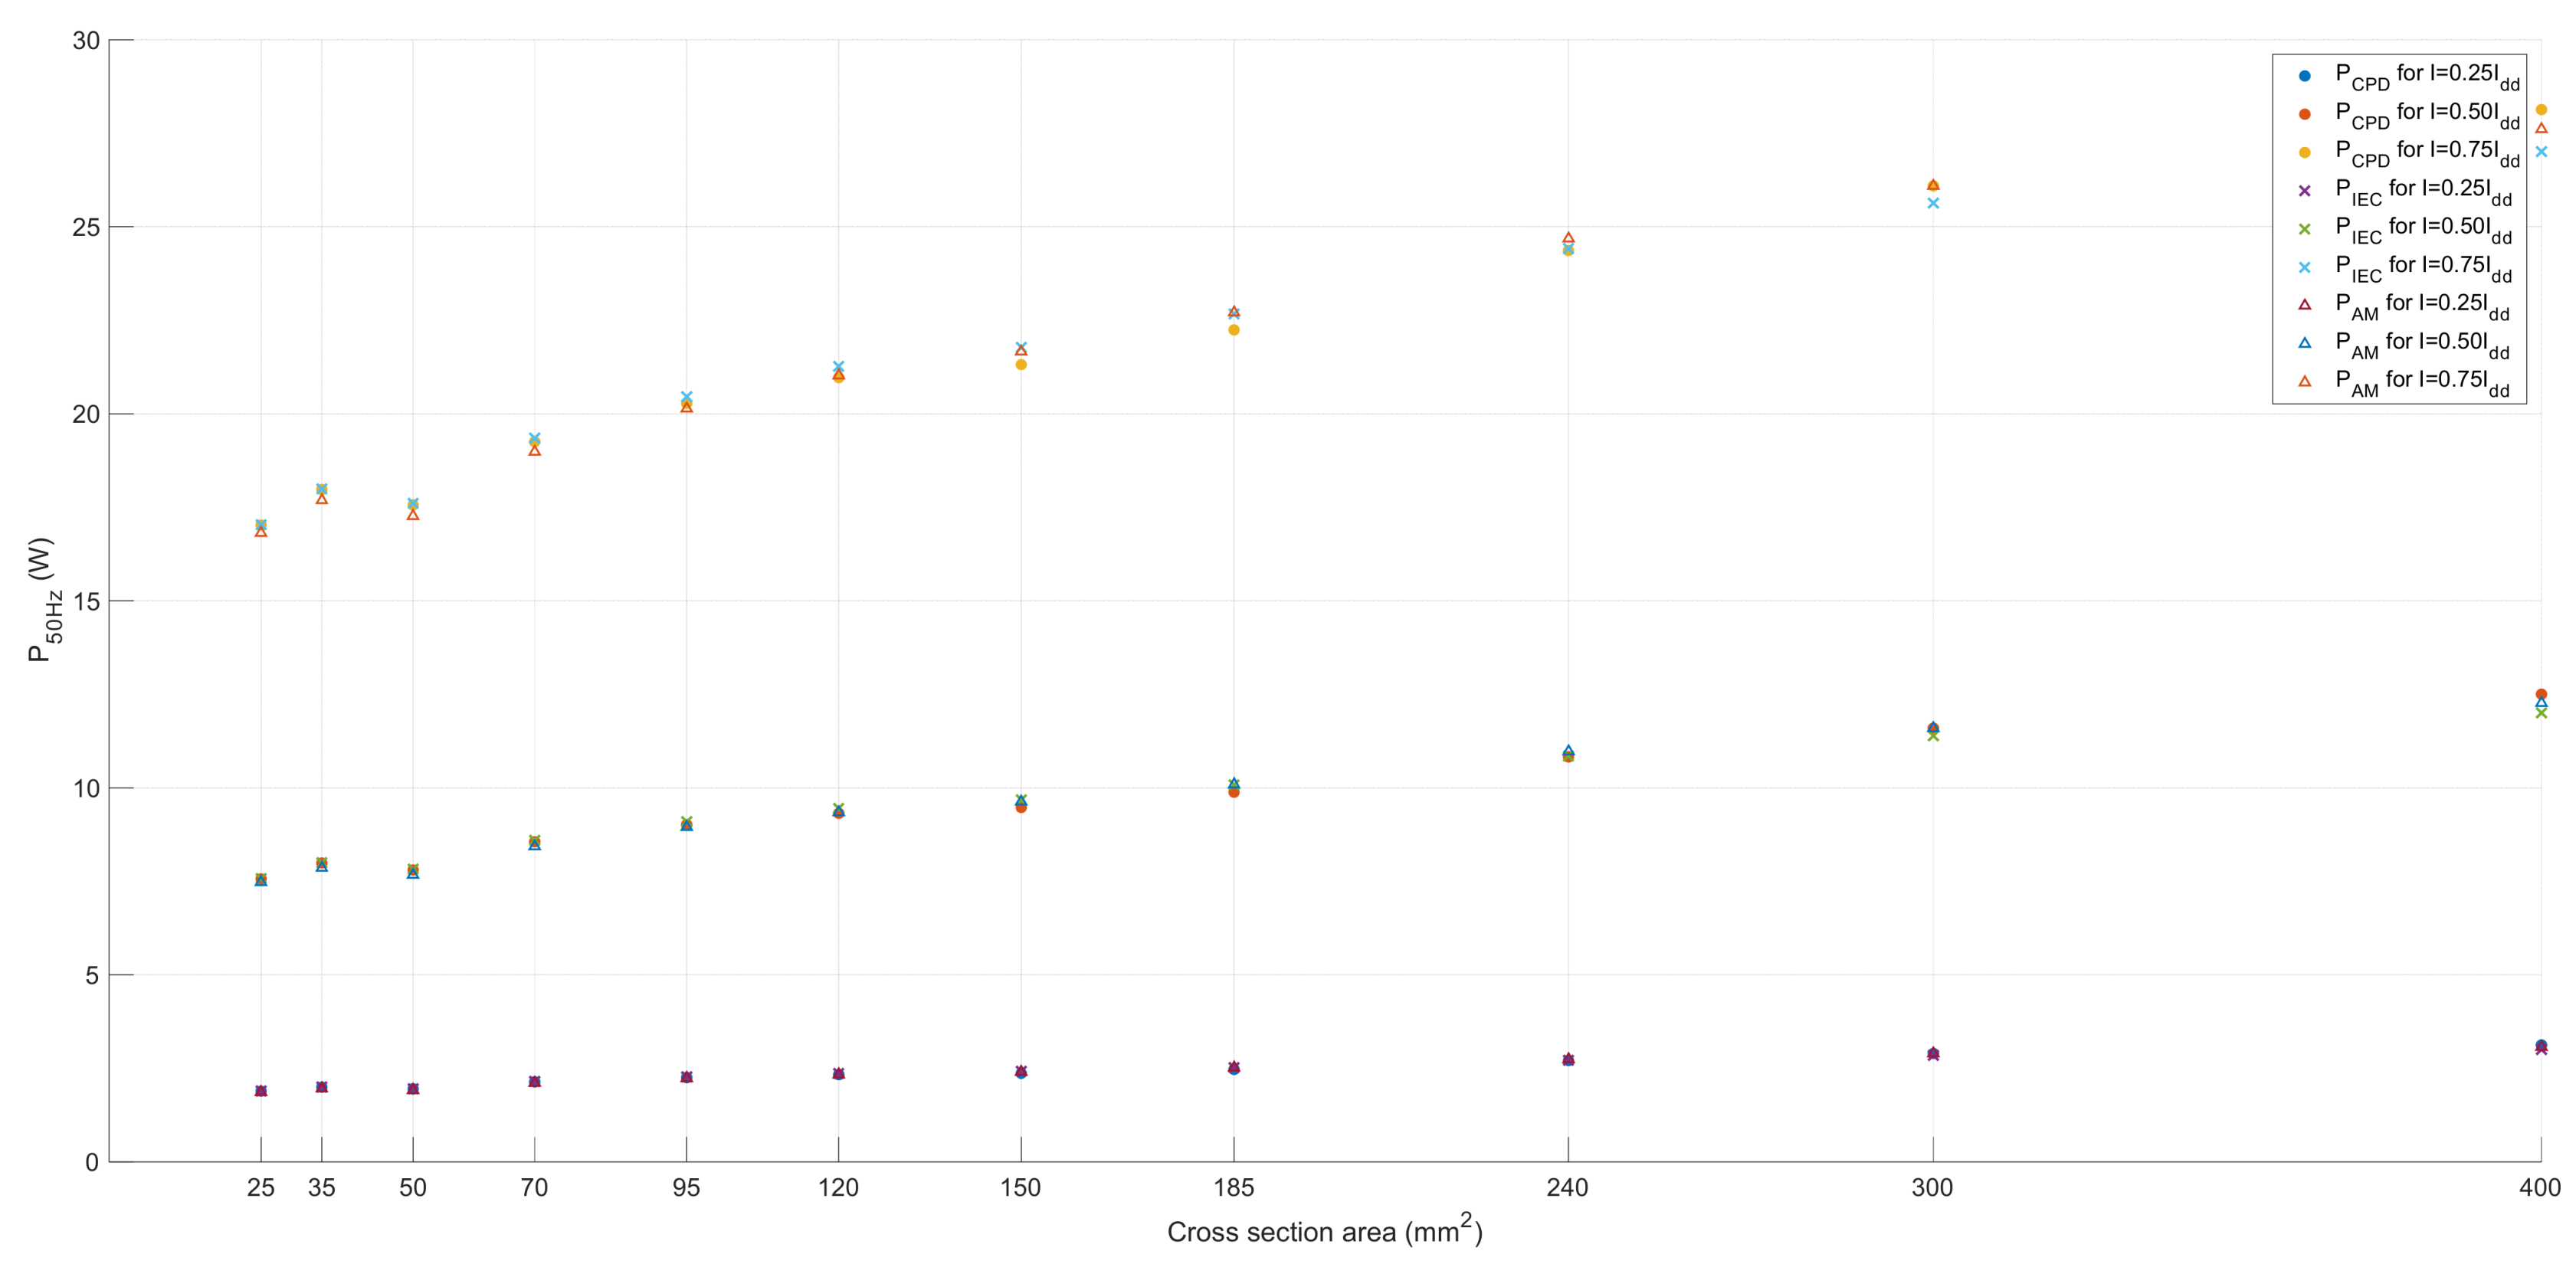
Figure 12 shows the value of active power losses calculated according to selected methods for a current frequency of 50 Hz. Even for this frequency value, discrepancies are visible, the trend of which is consistent with the analysis of the results of the methods described above.
6. FEM Analysis
The authors performed a comparative analysis of temperature distribution using FEM (Finite Element Method) calculations. Three cases of cable placement were analyzed: in air, in sand, and in two areas (air and sand to illustrate the temperature changes at the interface between the surroundings). Thermal analyses (transient) were carried out using the ASNSY Icepak environment, making it possible to determine the value of power losses.
The simulation time of 24 h was assumed, with the Time Step of 10 min and 20 Iterations per Time Step for each simulation.
The surrounding region had dimensions of 4 m × 4 m × 4 m in the case of a single medium. For the analysis, in which there was a combination of two materials, the sand region and the air region had dimensions of 8.5 m × 4 m × 4 m each. The temperature distribution was performed in the tested cable and surroundings based on pre-set power losses dependent on the conductive wire part temperature. For cases with one area material (air or sand), two cables were placed next to each other, but only one of them was supplied with power.
Table 1 and
Table 2 contain the maximum temperature and power losses for 1 m cable for sand and air surrounding.
The following
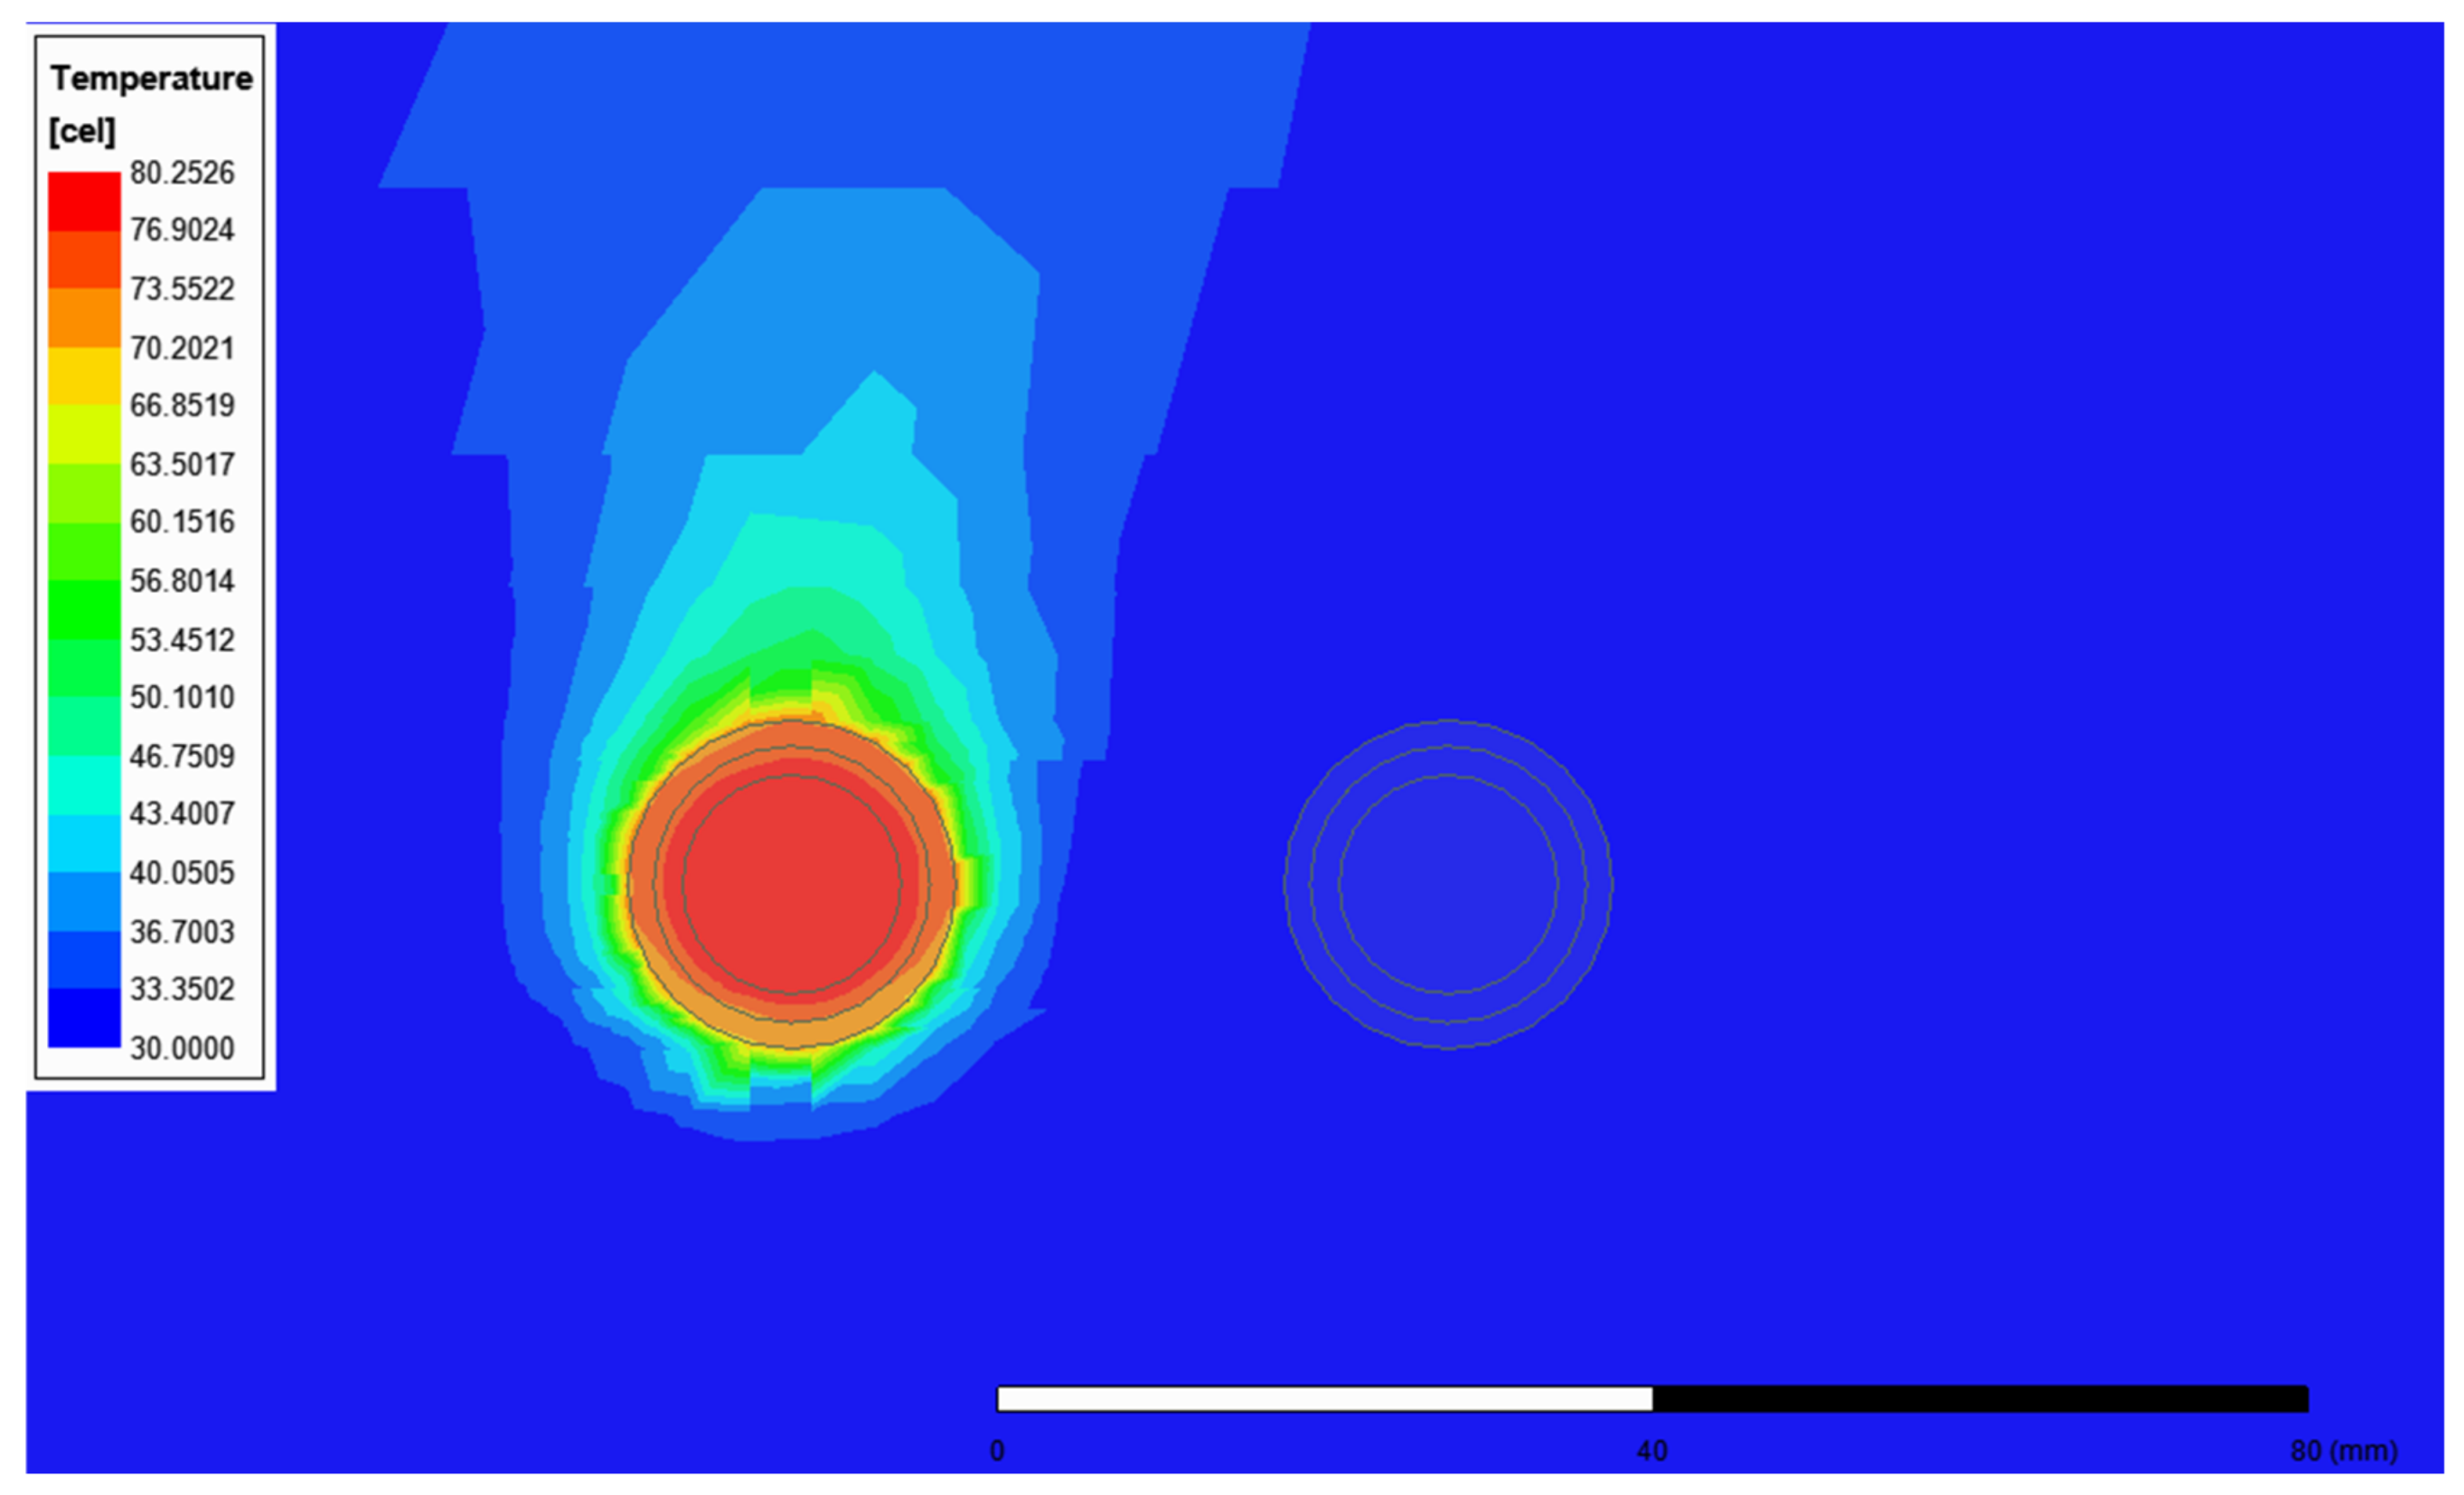
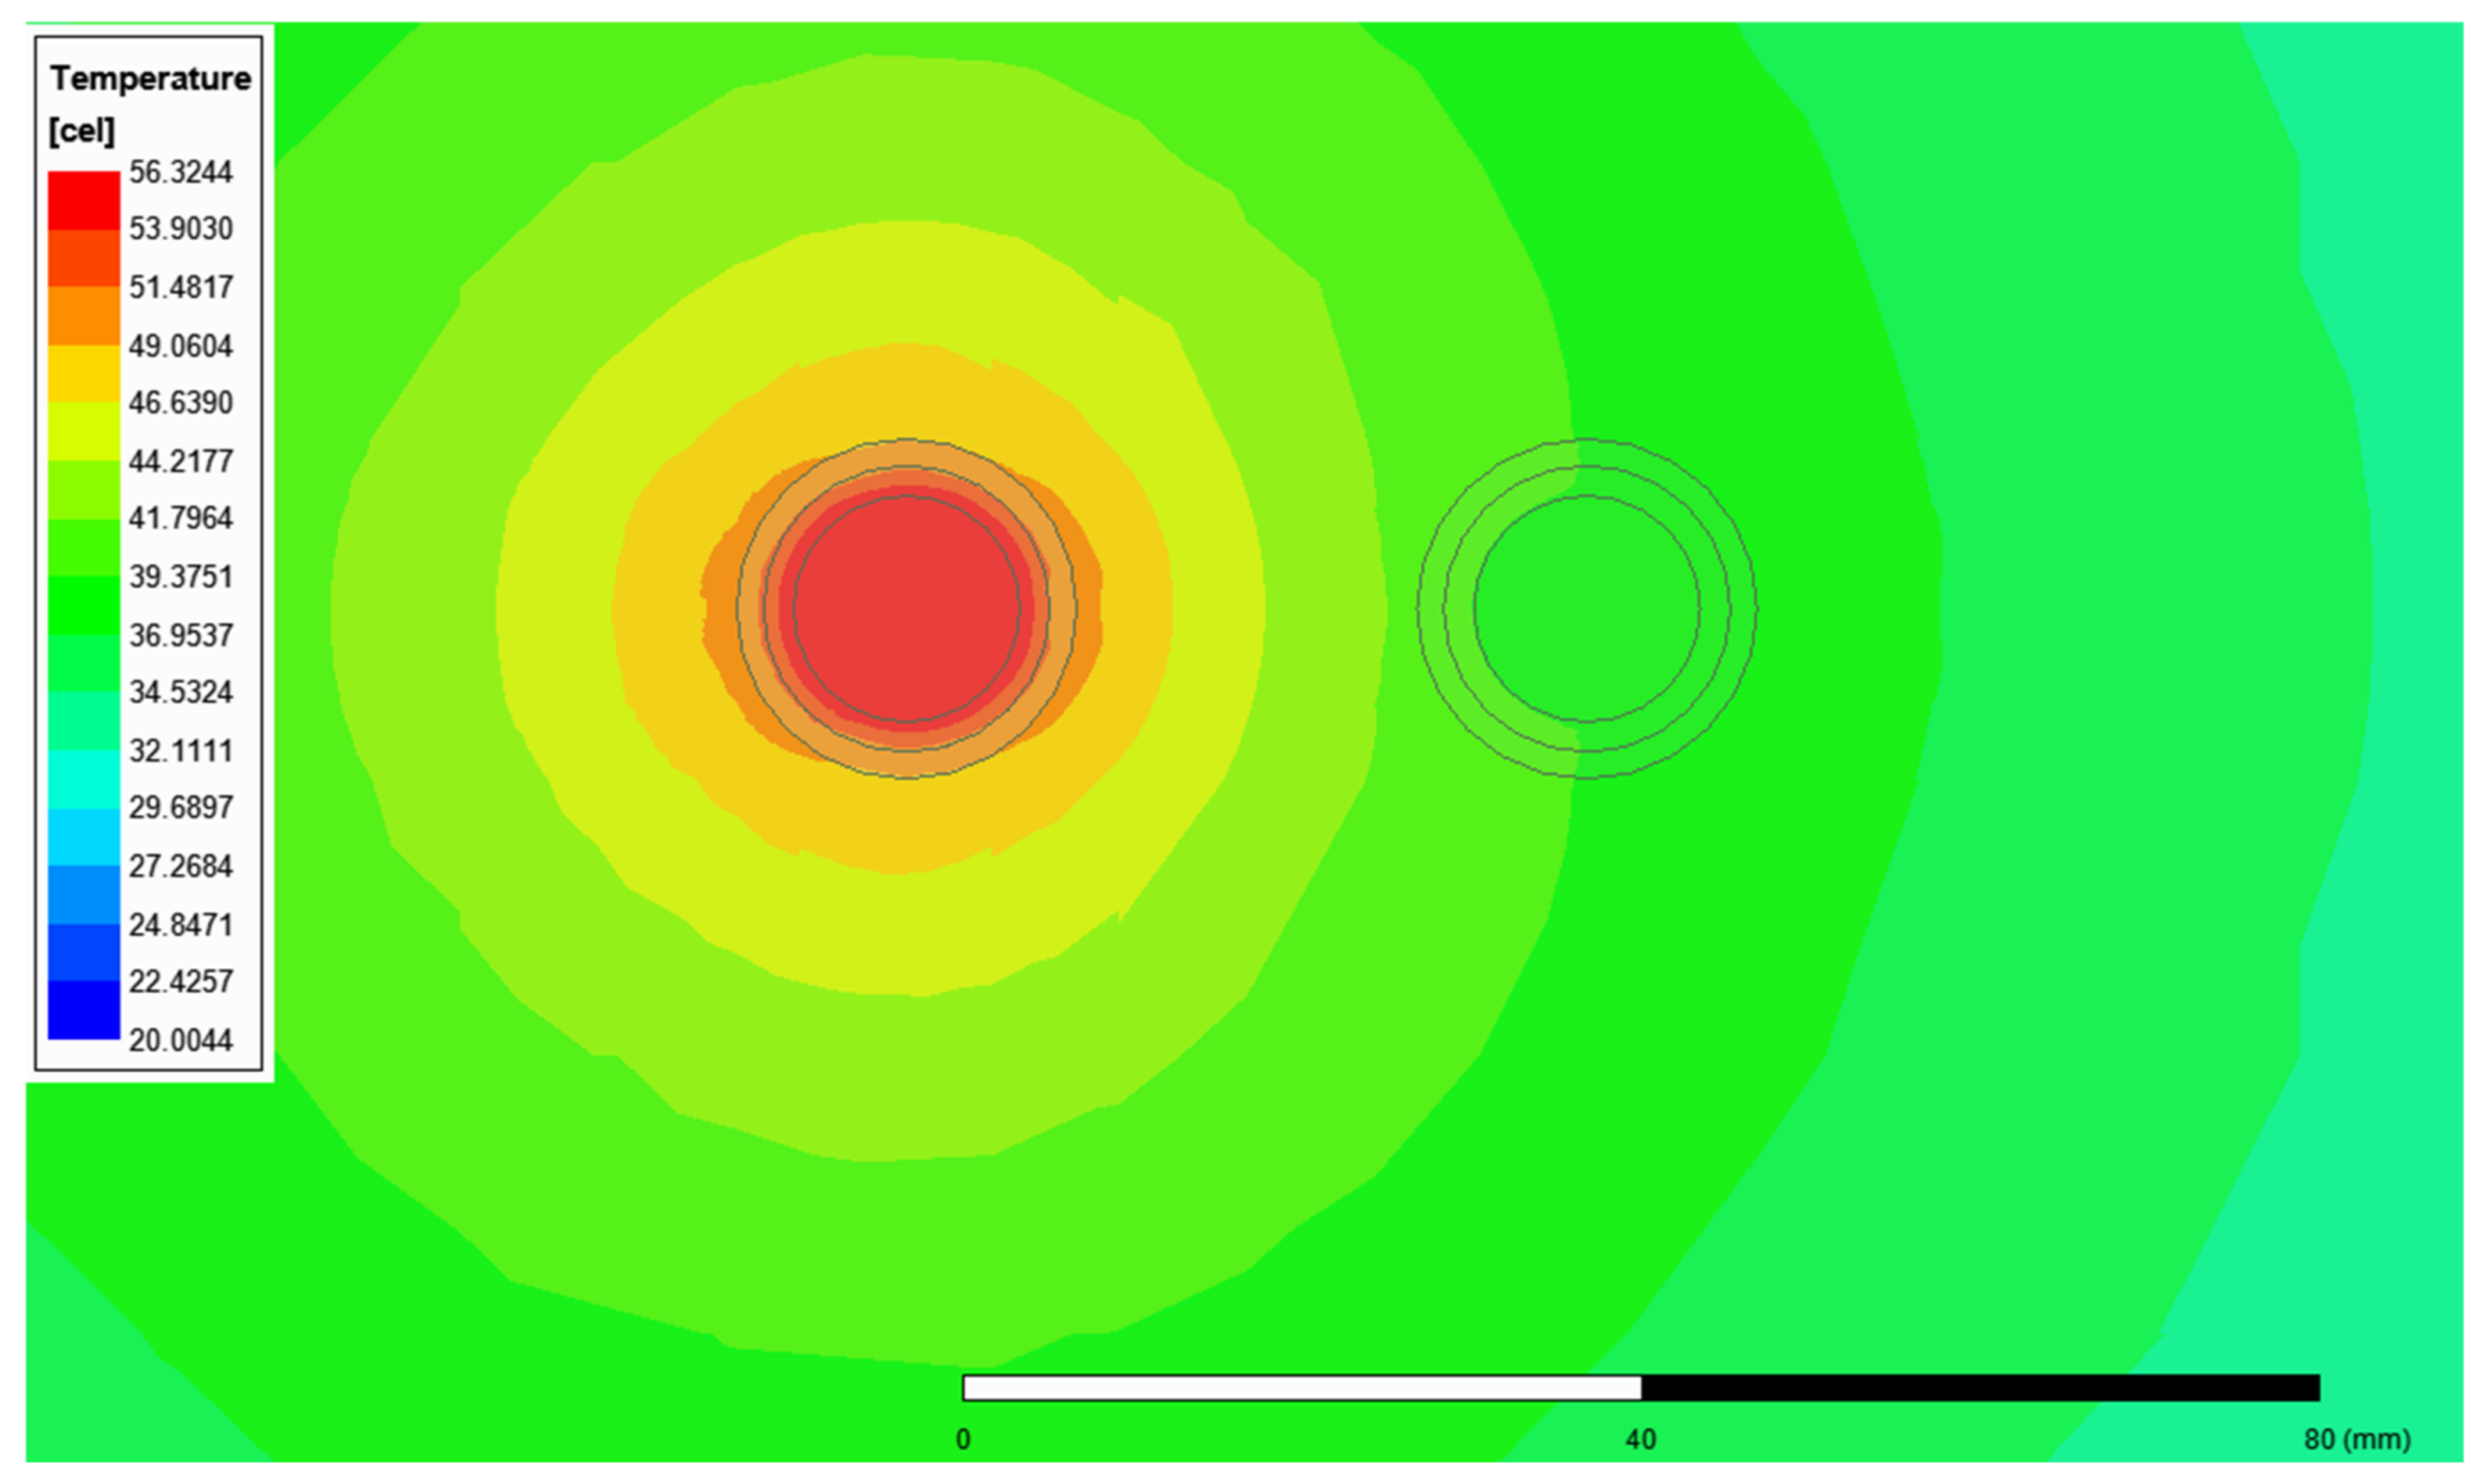
Figure 13 and
Figure 14 show the impact of surrounding for neighboring wire. The finite elements number was 553,571. In
Figure 13, one can see the temperature distribution for the cable YKY 1 × 150 mm
2 surrounded by air. For this case, an initial ambient temperature value of 30 °C was set. The effect of gravity, the radiation phenomenon, and the Opening Model condition with ambient pressure were taken into account. The THD coefficient was 76%, and the selected method was AM. The simulated cable length was 1 m.
Figure 14 shows the temperature distribution for the cable YKY 1 × 150 mm
2 surrounded by sand. The thermal analysis for the case of a cable laid in sand also assumed a simulation time of 24 h, with steps of 10 min. The initial value of the sand temperature was set at 20 °C. The effect of gravitational force was taken into account. The THD coefficient was 76%, and the selected method was AM. The simulated cable length was 1 m.
Figure 15 and
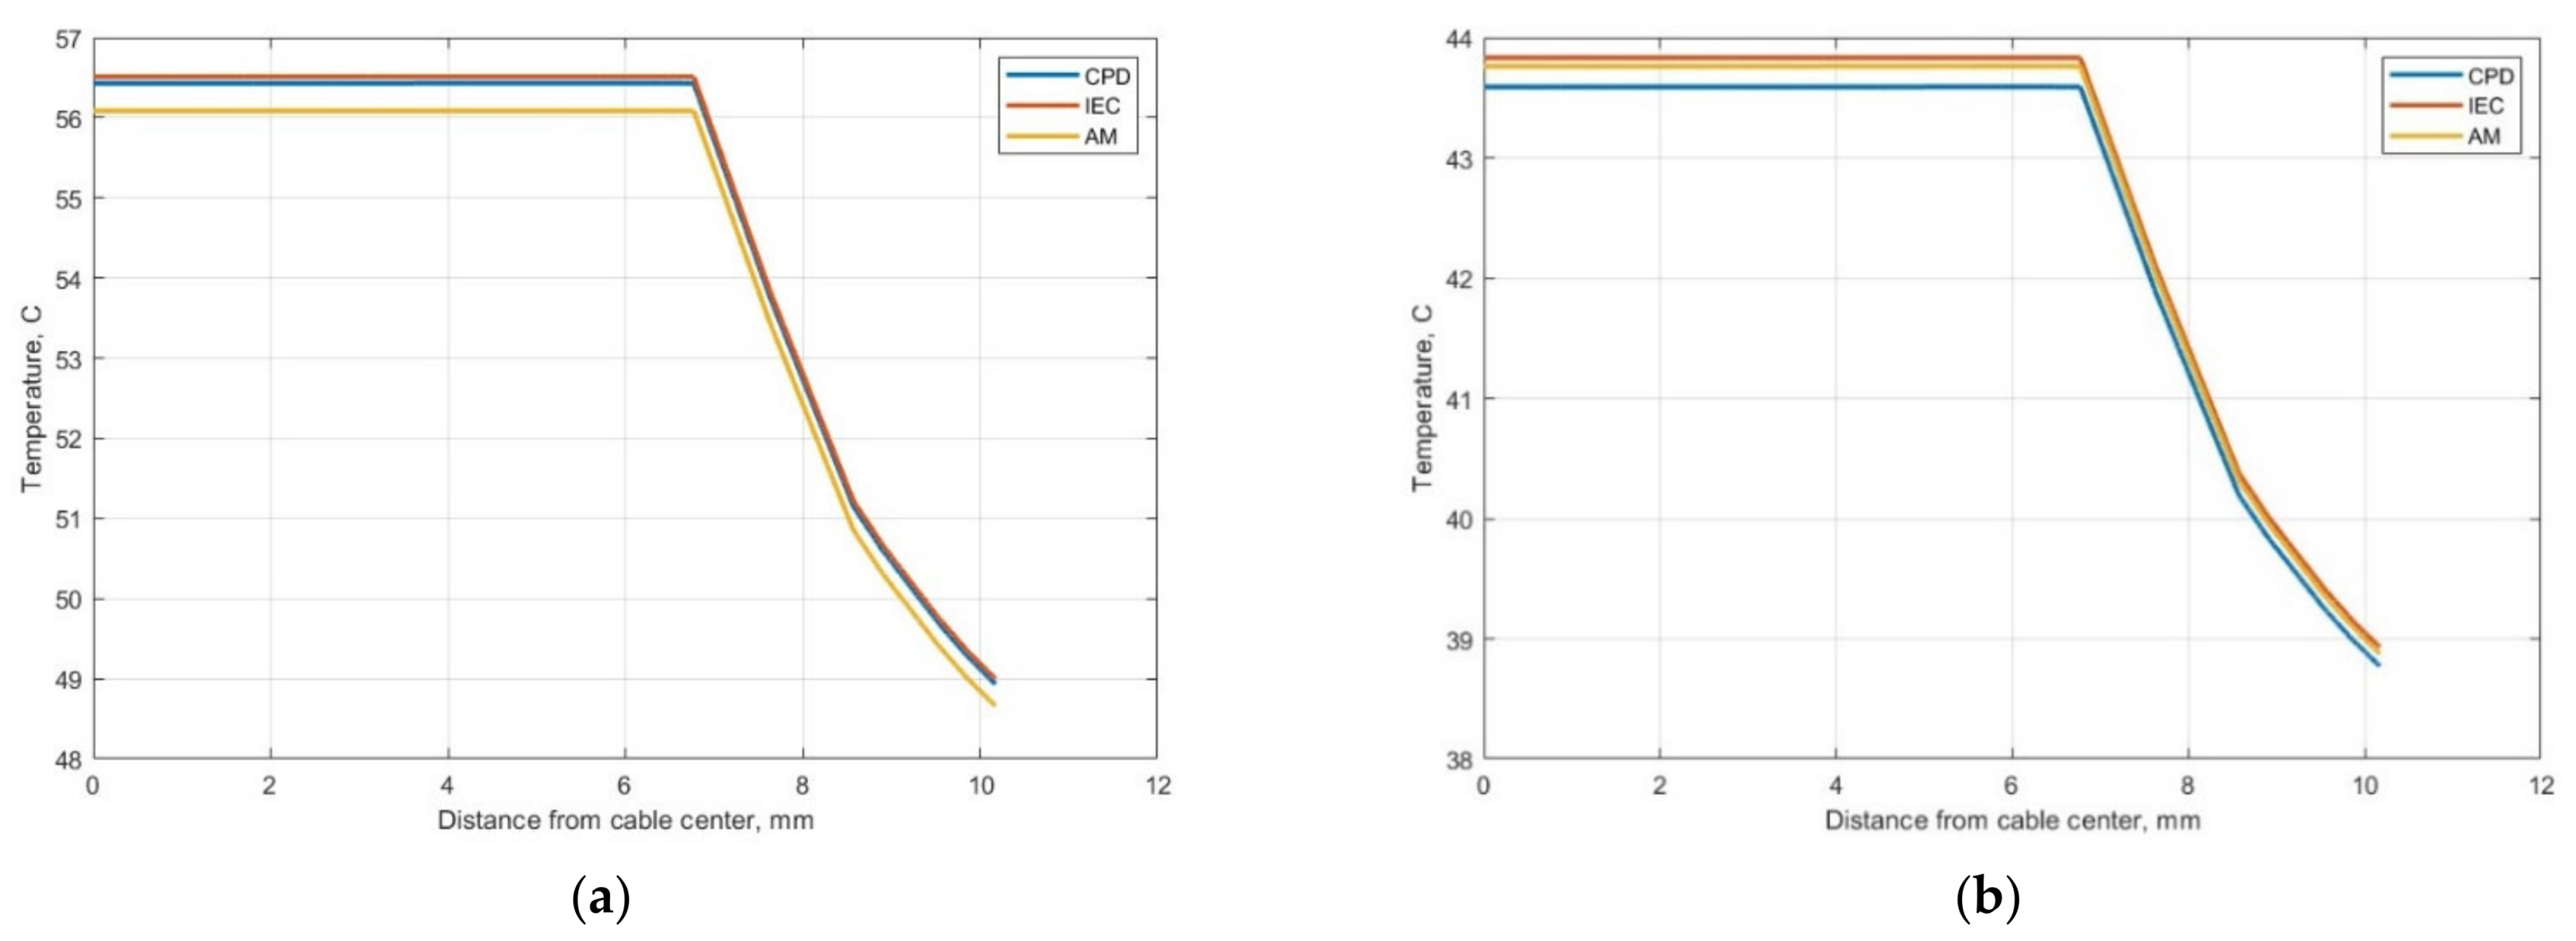
Figure 16 show the temperature changes according to distance from the cable center (along the radius) for the cable surrounded by sand (
Figure 15) and air (
Figure 16) for THD coefficients of 76% and 32%.
Figure 17 shows the temperature distribution at the boundary of two media air/sand for YKY 1 × 300 mm
2 cable. The surrounded region had dimensions of 17 m × 4 m × 4 m and was divided into two 8.5 m lengths each. The analyzed cable length was 13 m (6.5 m was placed in air and 6.5 m in sand). The finite element number was 6,780,323. The initial value of the sand temperature was set at 20 °C, and the air temperature was set at 30 °C. The effect of gravitational force was taken into account. The THD coefficient was 76%, and the selected method was AM.
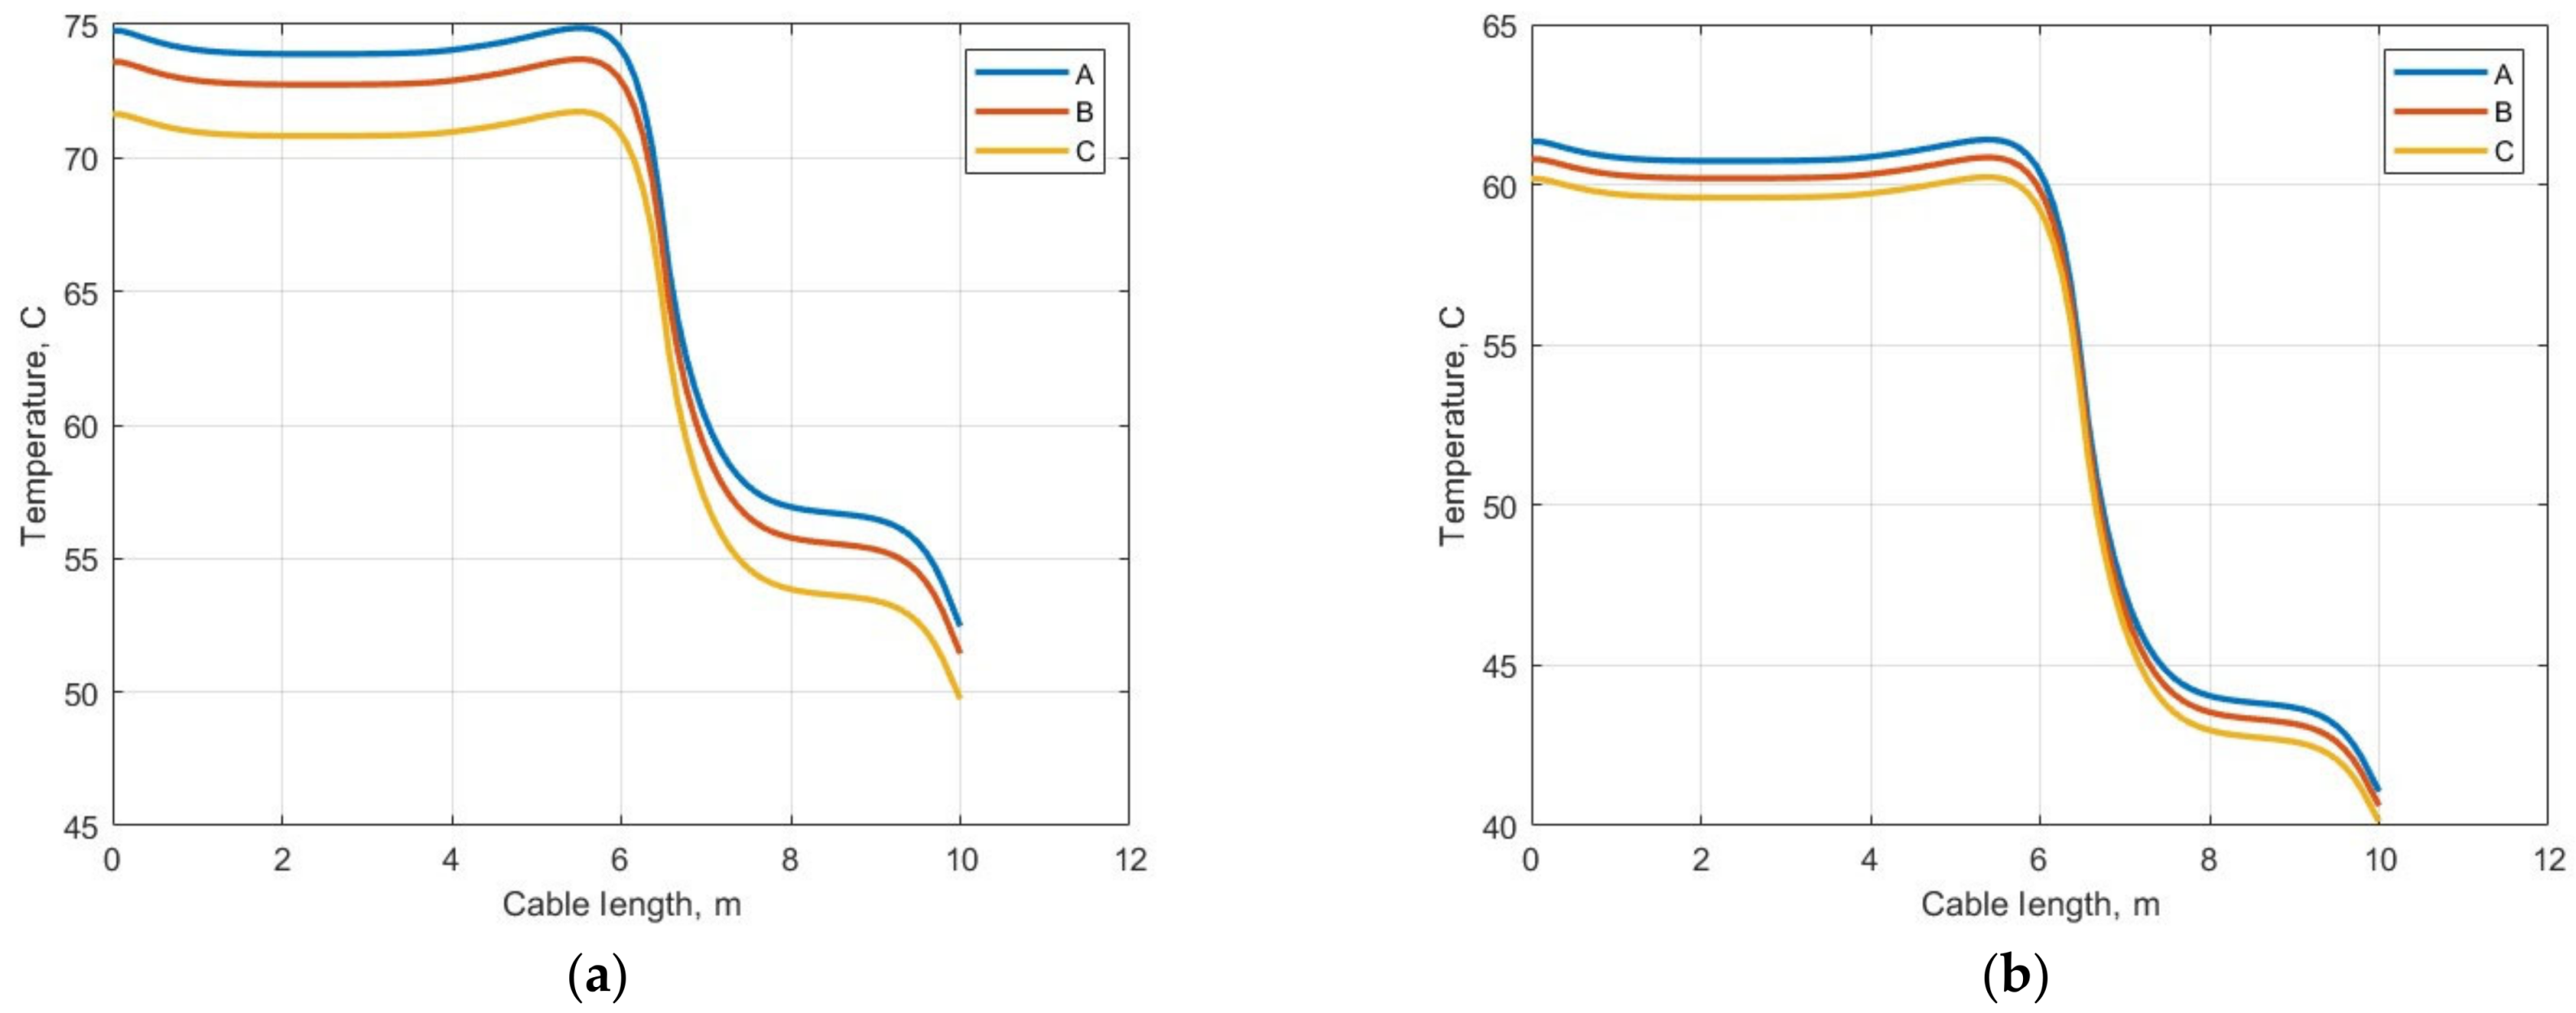
Figure 18 presents the comparative analysis of the effect of the selected method (CPD, IEC, and AM) on the maximum temperature value at the hot spot (at the contact of surrounding materials). The analyzed cable length was 10 m (6.5 m was placed in air and 3.5 m in sand). The THD 76% and 32% were taken into account.
7. Conclusions
This article presents an in-depth analysis of power loss in power cables due to current harmonics, specifically focusing on their effect on temperature distribution within the cables. The findings suggest that higher current harmonics significantly impact power losses and necessitate larger cable cross-sections, impacting economic feasibility.
The authors compared the active power loss calculation method based on the current penetration depth coefficient (CPD) with the results of the IEC and AM methods. This comparison highlights the effectiveness and accuracy of the CPD method in representing the losses caused by the flow of higher current harmonics and makes the comparison of the resistance values (RAC/RDC) calculated with different methods. This aspect of the research underscores the variance in the calculation results when different methodologies are applied, as well as the importance of choosing an appropriate method for accurate loss calculation. The CPD method proposed by the authors indicates an upward trend in the resistance of individual harmonics, reflecting the losses caused by the flow of higher-current harmonics most accurately. Regardless of the chosen method of verification (computational/experimental variant in which the compared computational methods were implemented), the computational method proposed by the authors maintained consistency. The results were logically coherent, repeatable, and showed the same trend and tendency.
The paper also presents the detailed temperature distribution inside the cable through which the distorted current flows. This part of the study was crucial to understanding how current harmonics influence the thermal behavior of power cables, which can have significant implications for cable design and safety. The results presented in the article for the cable laid in two different environments are a precursor to further studies aimed at illustrating the change in temperature at the boundary of contact between two different environments. In this location, a dangerous hot spot may occur, which could result in cable damage.
The performed tests, which took into account the presence of two environments, will form the basis for further analysis.
Author Contributions
Conceptualization, D.M., N.R.-P., P.A. and B.R.; methodology, D.M., N.R.-P., P.A. and B.R.; software, D.M. and N.R.-P.; validation, D.M., N.R.-P., P.A. and B.R.; formal analysis, D.M., N.R.-P., P.A. and B.R.; investigation, D.M., N.R.-P., P.A. and B.R.; resources, D.M. and N.R.-P.; data curation, D.M., N.R.-P., P.A. and B.R.; writing—original draft preparation, D.M., N.R.-P., P.A. and B.R.; writing—review and editing, D.M., N.R.-P., P.A. and B.R. All authors have read and agreed to the published version of the manuscript.
Funding
This research was funded by the Polish Ministry of Science and Higher Education and performed by the Cracow University of Technology.
Institutional Review Board Statement
Not applicable.
Informed Consent Statement
Not applicable.
Data Availability Statement
The data presented in this study are available upon request from the corresponding author.
Conflicts of Interest
The authors declare no conflicts of interest.
References
- Desmet, J.; Vanalme, G.; Belmans, R.; Van Dommelen, D. Simulation of Losses in LV Cables due to Nonlinear Loads. In Proceedings of the 2008 IEEE Power Electronics Specialists Conference, Rhodes, Greece, 15–19 June 2008; pp. 785–790. [Google Scholar] [CrossRef]
- Wu, W.N.; Zhu, S.J.; Luo, J.B.; Chen, X.; Song, C.P.; Qu, X.L.; Wang, Y. Measurement of the AC Resistance of Small Cross Section Power Cables. In Proceedings of the 9th International Conference on Insulated Power Cables, Versailles, France, 21–25 June 2015; pp. 1–5. [Google Scholar]
- Novak, B. Investigation of asymmetric power distribution in balanced three-phase systems in planar arrangement. Electr. Electron. Technol. Open Access J. 2018, 2, 335–340. [Google Scholar] [CrossRef]
- Rozegnał, B.; Albrechtowicz, P.; Mamcarz, D.; Rerak, M.; Skaza, M. The Power Losses in Cable Lines Supplying Non-linear Loads. Energies 2021, 14, 1374. [Google Scholar] [CrossRef]
- O’Connell, K.; Barrett, M.; Blackledge, J.; Sung, A. Cable Heating Effects due to Harmonic Distortion in Electrical Installations. In Proceedings of the World Congress on Engineering, London, UK, 4–6 July 2012. [Google Scholar]
- Patil, K.D.; Gandhare, W.Z. Effects of harmonics in distribution systems on temperature rise and life of XLPE power cables. In Proceedings of the Power and Energy Systems (ICPS), 2011 International Conference on Power and Energy Systems, Chennai, India, 22–24 December 2011; pp. 1–6. [Google Scholar] [CrossRef]
- Tofoli, F.L.; Sanhueza, S.M.R.; de Oliveira, A. On the study of losses in cables and transformers in nonsinusoidal conditions. IEEE Trans. Power Deliv. 2006, 21, 971–978. [Google Scholar] [CrossRef]
- Dong, Y.; Shi, Y. Analysis of Losses in Cables and Transformers with Unbalanced Load and Current Harmonics. J. Electr. Electron. Eng. 2021, 9, 78–86. [Google Scholar] [CrossRef]
- IEC 60287-1-1:2006+A1:2014; Electric Cables—Calculation of the Current Rating—Part 1-1: Current Rating Equations (100% Load Factor) and Calculation of Losses—General. International Electrotechnical Commission: Geneva, Switzerland, 2014.
- Lavasseur, A. Nouvelles formules, valables a toutes les frequences, pour le calcul rapide de l’effet Kelvin. J. Phys. Radium 1930, 1, 93–98. [Google Scholar] [CrossRef]
- Topolski, Ł.; Warecki, J.; Hanzelka, Z. Methods for determining power losses in cable lines with non-linear load. Przegląd Elektrotechniczny 2018, 94, 85–90. [Google Scholar] [CrossRef]
- IEC Standard 60287-2-1:1995; Electric Cables–Calculation of the Current Rating–Part 2: Thermal Resistance–Section 1: Calculation of the Thermal Resistance. International Electrotechnical Commission: Geneva, Switzerland, 1995.
- Ocłoń, P.; Taler, D.; Cisek, P. Fem-Based Thermal Analysis of Underground Power Cables Located in Backfills Made of Different Materials. Strength Mater. 2015, 47, 770–780. [Google Scholar] [CrossRef]
- Ocłoń, P.; Bittelli, M.; Cisek, P.; Kroener, E.; Pilarczyk, M.; Taler, D.; Rao, R.V.; Vallati, A. The performance analysis of a new thermal backfill material for underground power cable system. Appl. Therm. Eng. 2016, 108, 233–250. [Google Scholar] [CrossRef]
- Ocłoń, P.; Cisek, P.; Pilarczyk, M.; Taler, D. Numerical simulation of heat dissipation processes in underground power cable system situated in thermal backfill and buried in a multilayered soil. Energy Convers. Manag. 2015, 95, 352–370. [Google Scholar] [CrossRef]
- Ocłoń, P.; Cisek, P.; Matysiak, M. Analysis of an application possibility of geopolymer materials as thermal backfill for underground power cable system. Clean Technol. Environ. Policy 2021, 23, 869–878. [Google Scholar] [CrossRef]
- IEC 61000-4-7:2002+AMD1:2008; Electromagnetic Compatibility (EMC)—Part 4-7: Testing and Measurement Techniques—General Guide on Harmonics and Interharmonics Measurements and Instrumentation, for Power Supply Systems and Equipment Connected Thereto. International Electrotechnical Commission: Geneva, Switzerland, 2009.
- IEC 60364-5-52:2009; Low-Voltage Electrical Installations—Part 5-52: Selection and Erection of Electrical Equipment—Wiring Systems. International Electrotechnical Commission: Geneva, Switzerland, 2009.
Figure 1.
The skin effect illustration.
Figure 1.
The skin effect illustration.
Figure 2.
The frequency-dependent effective conductor cross-area.
Figure 2.
The frequency-dependent effective conductor cross-area.
Figure 3.
(a) Electrical cable construction; (b,c) cable arrangement: (b) flat formation; (c) trefoil formation.
Figure 3.
(a) Electrical cable construction; (b,c) cable arrangement: (b) flat formation; (c) trefoil formation.
Figure 4.
The excavation geometry.
Figure 4.
The excavation geometry.
Figure 5.
Unit active power losses for selected cross-sections of YKY-type cables.
Figure 5.
Unit active power losses for selected cross-sections of YKY-type cables.
Figure 6.
Current spectrum (THDI = 76%).
Figure 6.
Current spectrum (THDI = 76%).
Figure 7.
Increases in power losses in relation to the ideal current waveform (THD = 0%).
Figure 7.
Increases in power losses in relation to the ideal current waveform (THD = 0%).
Figure 8.
Increase in resistance, according to the fundamental harmonic resistance of a 35 mm2 cable, for the analyzed methods (conductor/cable core temperature of 20 °C).
Figure 8.
Increase in resistance, according to the fundamental harmonic resistance of a 35 mm2 cable, for the analyzed methods (conductor/cable core temperature of 20 °C).
Figure 9.
Increase in resistance, according to the fundamental harmonic resistance of a 300 mm2 cable, for the analyzed methods (conductor/cable core temperature of 20 °C).
Figure 9.
Increase in resistance, according to the fundamental harmonic resistance of a 300 mm2 cable, for the analyzed methods (conductor/cable core temperature of 20 °C).
Figure 10.
Increase in resistance, according to the fundamental harmonic resistance of a 35 mm2 cable, for the analyzed methods (conductor/cable core temperature of ~90 °C).
Figure 10.
Increase in resistance, according to the fundamental harmonic resistance of a 35 mm2 cable, for the analyzed methods (conductor/cable core temperature of ~90 °C).
Figure 11.
Increase in resistance, according to the fundamental harmonic resistance of a 300 mm2 cable, for the analyzed methods (conductor/cable core temperature of ~85 °C).
Figure 11.
Increase in resistance, according to the fundamental harmonic resistance of a 300 mm2 cable, for the analyzed methods (conductor/cable core temperature of ~85 °C).
Figure 12.
Active power losses for the fundamental frequency calculated using different methods.
Figure 12.
Active power losses for the fundamental frequency calculated using different methods.
Figure 13.
The temperature distribution for the cable YKY 1 × 150 mm2 surrounded by air.
Figure 13.
The temperature distribution for the cable YKY 1 × 150 mm2 surrounded by air.
Figure 14.
The temperature distribution for the cable YKY 1 × 150 mm2 surrounded by sand.
Figure 14.
The temperature distribution for the cable YKY 1 × 150 mm2 surrounded by sand.
Figure 15.
The temperature changes along the cable (1 × 150 mm2) radius and for surrounding sand: (a) THD 76%; (b) 32%.
Figure 15.
The temperature changes along the cable (1 × 150 mm2) radius and for surrounding sand: (a) THD 76%; (b) 32%.
Figure 16.
The temperature changes along the cable (1 × 150 mm2) radius and for surrounding air: (a) THD 76%; (b) 32%.
Figure 16.
The temperature changes along the cable (1 × 150 mm2) radius and for surrounding air: (a) THD 76%; (b) 32%.
Figure 17.
The temperature distribution at the boundary of two media air/sand for YKY 1 × 300 mm2 cable (the hot-spot temperature was 53.91 °C).
Figure 17.
The temperature distribution at the boundary of two media air/sand for YKY 1 × 300 mm2 cable (the hot-spot temperature was 53.91 °C).
Figure 18.
The temperature changes along the cable, taking into account two types of environment: A—CPD method, B—IEC method, C—AM method; (a) THD 76%; (b) 32%.
Figure 18.
The temperature changes along the cable, taking into account two types of environment: A—CPD method, B—IEC method, C—AM method; (a) THD 76%; (b) 32%.
Table 1.
Power losses and temperature for cable buried in sand.
Table 1.
Power losses and temperature for cable buried in sand.
| | | YKY 1 × 35 mm2 | YKY 1 × 150 mm2 | YKY 1 × 300 mm2 |
| Method | THD
[%] | Tmax
[°C] | P
[W/m] | Tmax
[°C] | P
[W/m] | Tmax
[°C] | P
[W/m] |
| CPD | 32 | 43.63 | 21.7210 | 43.41 | 26.0991 | 46.79 | 32.7767 |
| IEC | 43.67 | 21.7626 | 43.83 | 26.5677 | 46.15 | 32.0006 |
| AM | 43.64 | 21.7336 | 43.76 | 26.4891 | 45.46 | 31.1474 |
| CPD | 76 | 55.18 | 32.3683 | 56.43 | 40.6586 | 64.00 | 53.6327 |
| IEC | 55.31 | 32.4922 | 56.51 | 40.7490 | 62.13 | 51.6157 |
| AM | 55.26 | 32.4457 | 56.09 | 40.2737 | 59.50 | 48.3865 |
Table 2.
Power losses and temperature for cable surrounded by air.
Table 2.
Power losses and temperature for cable surrounded by air.
| | | YKY 1 × 35 mm2 | YKY 1 × 150 mm2 | YKY 1 × 300 mm2 |
| Method | THD
[%] | Tmax
[°C] | P
[W] | Tmax
[°C] | P
[W] | Tmax
[°C] | P
[W] |
| CPD | 32 | 73.54 | 24.0952 | 66.12 | 28.2669 | 66.55 | 35.1166 |
| IEC | 73.60 | 24.1427 | 66.66 | 28.7827 | 65.83 | 34.2812 |
| AM | 73.45 | 24.1013 | 66.57 | 28.6962 | 65.04 | 33.3614 |
| CPD | 76 | 91.53 | 36.4940 | 82.20 | 44.3166 | 85.01 | 57.4654 |
| IEC | 91.76 | 36.6433 | 82.30 | 44.4170 | 83.33 | 55.3615 |
| AM | 91.59 | 36.5779 | 81.79 | 43.8916 | 80.54 | 51.9031 |
| Disclaimer/Publisher’s Note: The statements, opinions and data contained in all publications are solely those of the individual author(s) and contributor(s) and not of MDPI and/or the editor(s). MDPI and/or the editor(s) disclaim responsibility for any injury to people or property resulting from any ideas, methods, instructions or products referred to in the content. |
© 2024 by the authors. Licensee MDPI, Basel, Switzerland. This article is an open access article distributed under the terms and conditions of the Creative Commons Attribution (CC BY) license (https://creativecommons.org/licenses/by/4.0/).
